
Effect of Gas Volume Fraction on the Energy Loss Characteristics of Multiphase Pumps at Each Cavitation Stage


Key Laboratory of Fluid and Power Machinery, Ministry of Education, Xihua University, Chengdu 610039, China
*
Authors to whom correspondence should be addressed.
Water 2021, 13(16), 2293; https://doi.org/10.3390/w13162293
Submission received: 2 July 2021
/
Revised: 18 August 2021
/
Accepted: 19 August 2021
/
Published: 21 August 2021
(This article belongs to the Section Hydraulics and Hydrodynamics)
Abstract
:In the process of conveying a medium, when the inlet pressure is low, the cavitation phenomenon easily occurs in the pump, especially in the gas–liquid two-phase working condition. The occurrence of the cavitation phenomenon has a great impact on the performance of the multiphase pump. In this paper, the SST (sheard stress transport) k-ω turbulence model and ZGB (Zwart–Gerber–Belamri) cavitation model were used to simulate the helical axial flow multiphase pump (hereinafter referred to as the multiphase pump), and the experimental verification was carried out. The effect of gas volume fraction (GVF) on the energy loss characteristics in each cavitation stage of the multiphase pump is analyzed in detail. The study shows that the critical cavitation coefficient of the multiphase pump gradually decreases with the increase in GVF, which depresses the evolution of cavitation, and the cavitation performance of the multiphase hump is improved. The ratio of total loss and friction loss to total flow loss in the impeller fluid domain gradually increases with the development of cavitation, and the pressurization performance of the multiphase pump gradually decreases with the development of cavitation. The results of the study can provide theoretical guidance for the improvement of the performance of the multiphase pump.
1. Introduction
In recent years, with the increasing global energy demand and the depletion of conventional energy sources, people began to strengthen the exploitation of oil fields in order to improve the production and efficiency of oil exploitation, the technology of multiphase mixed transmission emerges at the historic moment, in which the multiphase pump is one of the core components of the mixing system, with the advantages of having a high flow rate and small volume and being insensitive to solid particles. Many scientific research institutions, oil companies, and universities have performed research on this [1,2]. As the multiphase pump is used in the transport of multiphase medium, the interaction between the phases often makes the pump pressure distribution not uniform, and the flow passage or blade surface will produce low pressure area, resulting in a low inlet pressure, which easily produces a cavitation phenomenon inside the pump. This phenomenon will not only cause the deterioration of hydraulic mechanical properties, but also damage the wall materials and cause serious harm to the stable operation of the system [3,4,5]. Therefore, it is important to develop the influence of the energy loss characteristics of each cavitation stage in the multiphase under different GVF to improve the performance of the multiphase pump.
Since the early research methods on cavitation were relatively simple and the experimental equipment was relatively undeveloped, the understanding of cavitation phenomena was limited. With the development of computational fluid dynamics and the maturity of experimental technology, it is possible to perform an in-depth study of the cavitation phenomenon. Recently, several scholars have proposed different cavitation models and investigated the applicability of cavitation models by comparing numerical calculations with experiments, which play a key role in the accuracy of cavitation phenomenon prediction [6,7,8,9]. Cavitation flow is a complex multiphase flow involving phase change, multiphase turbulence, and unsteady flow [10,11,12], and the evolution of cavitation is usually divided into three stages, which are the growth stage of the attached cavitation, the cavitation fracture and shedding stage, and the stage at which the cavitation cluster moves downstream and breaks, as found by the study of hydrofoil [13,14]. The very large velocity gradient at the end of the attached cavitation leads to the formation of reverse jets and return vortices on the surface of the hydrofoil [15,16]. Some scholars think that when the velocity gradient of the reverse jet is large, the reverse jet will move along the bottom of the cavitation to the leading edge of the hydrofoil, causing the attached cavitation to shedding or break from the surface of the hydrofoil and then move downstream [17,18]. Chen, Y. [19] believed that the break and shedding of the attached cavitation are not “cut off” by the reverse jet. However, in the process of the reverse jet moving along the front edge of the hydrofoil surface, the turbulent pulsation keeps expanding, which eventually leads to the fracture and shedding of the cavitation. Zhao, G.S. [20] found, through a study on the cavitation inside the centrifugal pump, that the reverse jet caused by the adverse pressure gradient could not break, that shedding compared with the thickness of the cavitation, and believed that the shedding of the cavitation was mainly caused by the entrapping action of the main stream. The complexity of the cavitation phenomenon also lies in the influence of many factors. Hao, J. [21,22] studied the influence of different coatings as well as different surface roughness on the flow of hydrofoil cavitation, and found that the cavitation evolution period of surface coatings of different materials is different, while the roughness of the hydrofoil surface can make the cavitation number of the transition from attached cavitation to cloud cavitation smaller, thus playing a suppressive role in the evolution of cavitation. Mousmoulis, G. [23] studied the cavitation flow of centrifugal pumps with three different blade profiles by measuring noise and vibration and found that the blade profile has a great influence on the inception and development of the cavitation. Yan, H. et al. [24,25,26] studied the cavitation evolution in the pump at different flow rates and found that when the inlet flow angle was smaller than the blade inlet placement angle, cavitation would appear on the blade suction surface. Otherwise, it would occur on the blade pressure surface. Kang, J.J. et al. [27] studied the effect of impeller geometric parameters on the cavitation performance of centrifugal pumps, and the results showed that increasing the inlet placement angle of the blades within a certain range can improve the cavitation performance of the pump. Tao, et al. [28] studied the effect of blade inlet edge shape on the cavitation performance of centrifugal pumps and found that circular and elliptical inlet edges had smaller flow separation regions, larger pressure reductions, and higher cavitation coefficients, but the cavitation evolution process was slower. Shi, W.D. et al. [29] investigated the cavitation performance of axial flow pumps with different numbers of blades. The results showed that, when the cavitation coefficients are the same, the evolution of cavitation becomes faster as the number of blades increases. Shojaeefard, M.H. [30] found that the inlet and outlet placement angle of the inducer and the hub ratio of the impeller had a great influence on the cavitation performance of the centrifugal pump through the parametric optimization of the inducer of the centrifugal pump. Azad, S. [31] studied the effect of different concentrations of polymer on the cavitation performance of centrifugal pumps, and found that with the increase in polymer concentration, the initial cavitation coefficient of the pump decreased, and the cavitation performance of the pump increased. Li, D. [32] et al. investigated the mechanism of the effect of cavitation on the turbine hump characteristics of a pump by numerical simulation, and the results show that the occurrence of cavitation leads to the blockage of the flow passage, reduces the conveying capacity of the flow passage, and induces large vortices in the adjacent flow passage.
It can be seen that, although cavitation phenomena have been extensively studied by many scholars, there are fewer studies on cavitation under gas–liquid two-phase conditions, and even fewer studies on cavitation inside multiphase pumps under gas–liquid two-phase conditions. Therefore, this paper develops the study of the effect of GVF on the evolution of cavitation on energy loss inside multiphase pumps under different GVF, aiming to improve the cavitation performance of multiphase pumps.
2. Computational Models and Methods
2.1. Turbulence Model
The multiphase pump blade curvature is larger, the speed is higher, and the flow separation phenomenon is easy to occur within when transporting the multiphase medium, so the SST k-ω model is selected for the turbulence numerical calculation model in this paper. This model can better handle the viscous flow in the near-wall region and the turbulent flow in the far field. The specific expression of the SST k-ω model is as follows:
where ω denotes the turbulent kinetic energy dissipation ratio; β denotes the thermal expansion coefficient; ρ denotes the medium density; μ denotes the viscosity; Pk denotes turbulent kinetic energy; σω denotes the turbulent Prandtl number with the specific dissipation rate.
2.2. Cavitation Model
In this paper, the Zwart–Gerber–Belamri cavitation model is used to calculate the cavitation flow in a multiphase pump, which can simulate the quasi-periodicity and evolution of the cavitation phenomenon more accurately. Assuming the same size of the bubbles, the total interphase mass transfer rate in the cell is calculated by the density of the number of vapor bubbles, and the interphase transfer rate for this model is shown below:
when :
when :
In the above equation, RB denotes the bubble diameter, 10−6 m; αnuc denotes the volume fraction of the bubble nucleus position, 5 × 10⁻⁴; and Fvap and Fcond denote the evaporation and condensation coefficients, 50 and 0.01, respectively.
3. Numerical Model Calculation
3.1. Numerical Model of Multiphase Pump
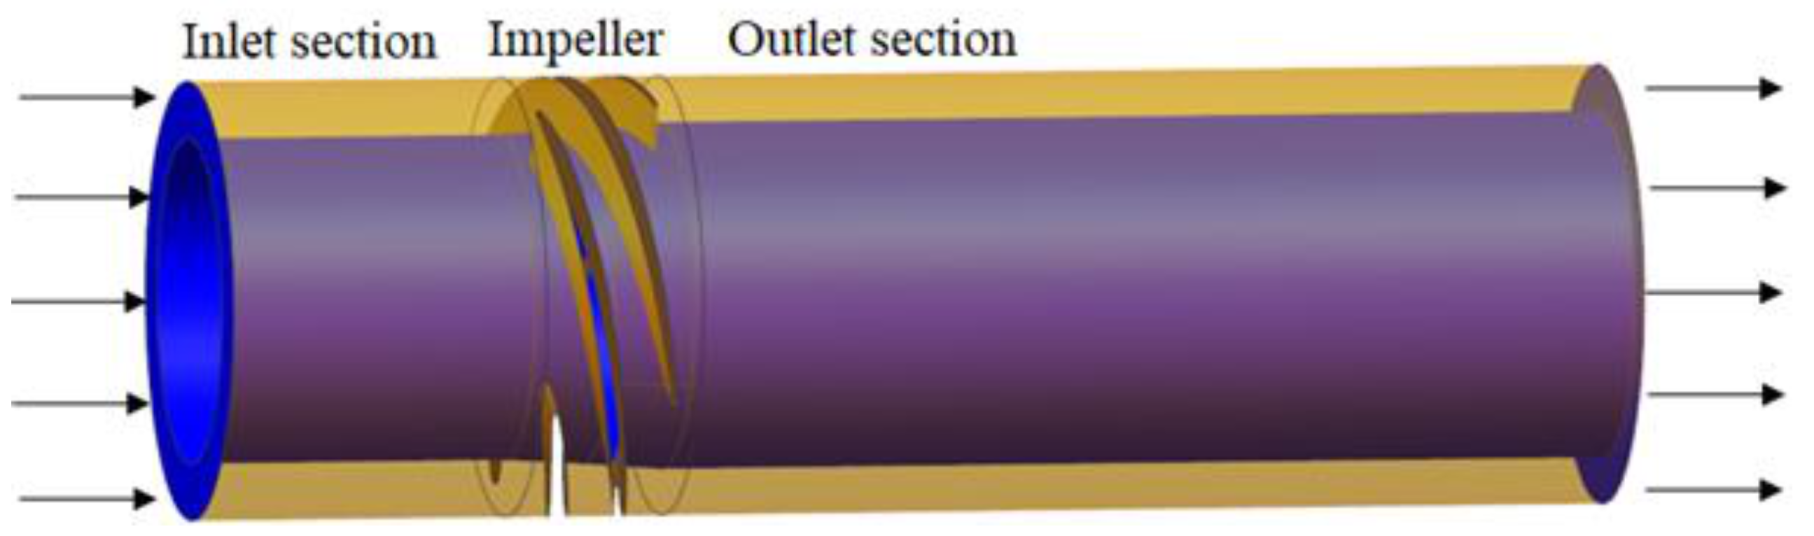
In the multiphase system, the impeller is the main energy conversion component of the multiphase pump, so the cavitation flow phenomenon in the impeller of the multiphase pump is only analyzed and studied in this paper. The calculation model consists of inlet section, impeller, and outlet section. In order to make the inlet and outlet of the impeller flow fully, the inlet section and the outlet section are, respectively, extended to two times and six times the axial length of the impeller [33], and the fluid domain of the computational model is shown in Figure 1. The design parameters of the model are: flow rate Q = 100 m3/h, rotational speed n = 3000 r/min, number of blades Z = 4, blade wrap angle 179.6°, inlet hub ratio 0.79, outlet hub ratio 0.74, and shroud diameter 230.5 mm.
3.2. Mesh Division and Independent Verification
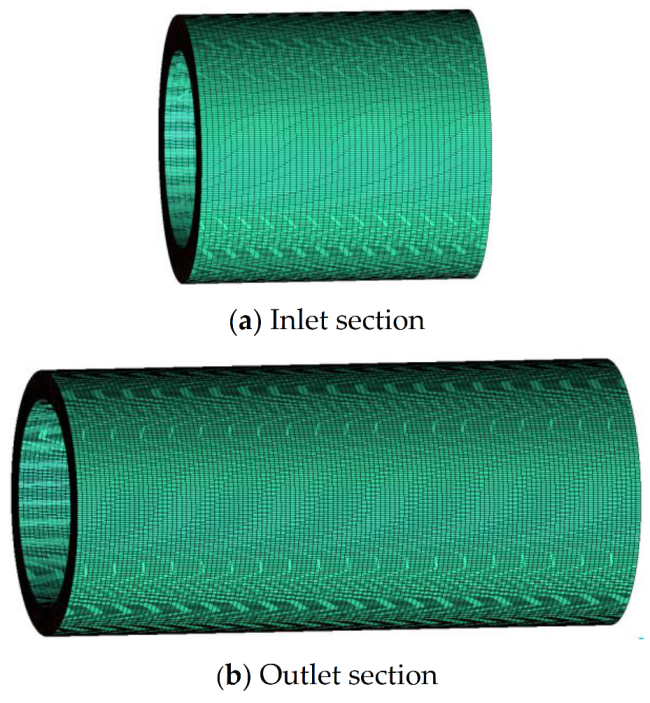
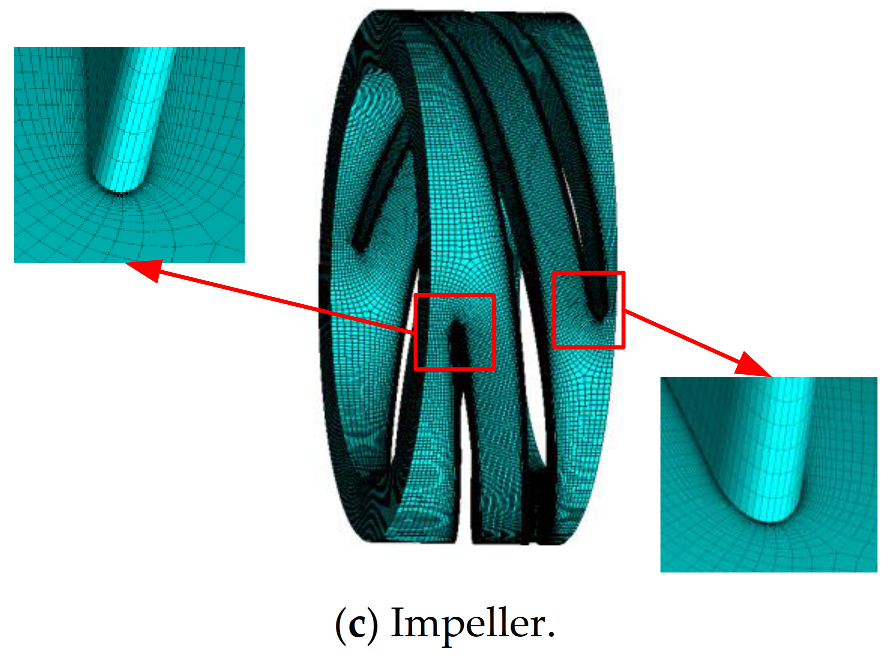
Due to the large curvature of the blades of the multiphase pump, the single flow passage of the multiphase pump impeller is divided into a structural hexahedral grid first, and then the single flow grid is rotated and copied to the full flow passage through ICEM software. The ICEM software is used to divide the structural hexahedral mesh of the section of the inlet and outlet. The advantage of structural hexahedral meshing is that the mesh nodes can be adjusted to achieve the purpose of refining the local position mesh, so that the flow situation in a specific area can be displayed more clearly. The meshing of the section of the inlet and outlet and the fluid domain of the impeller is shown in Figure 2.
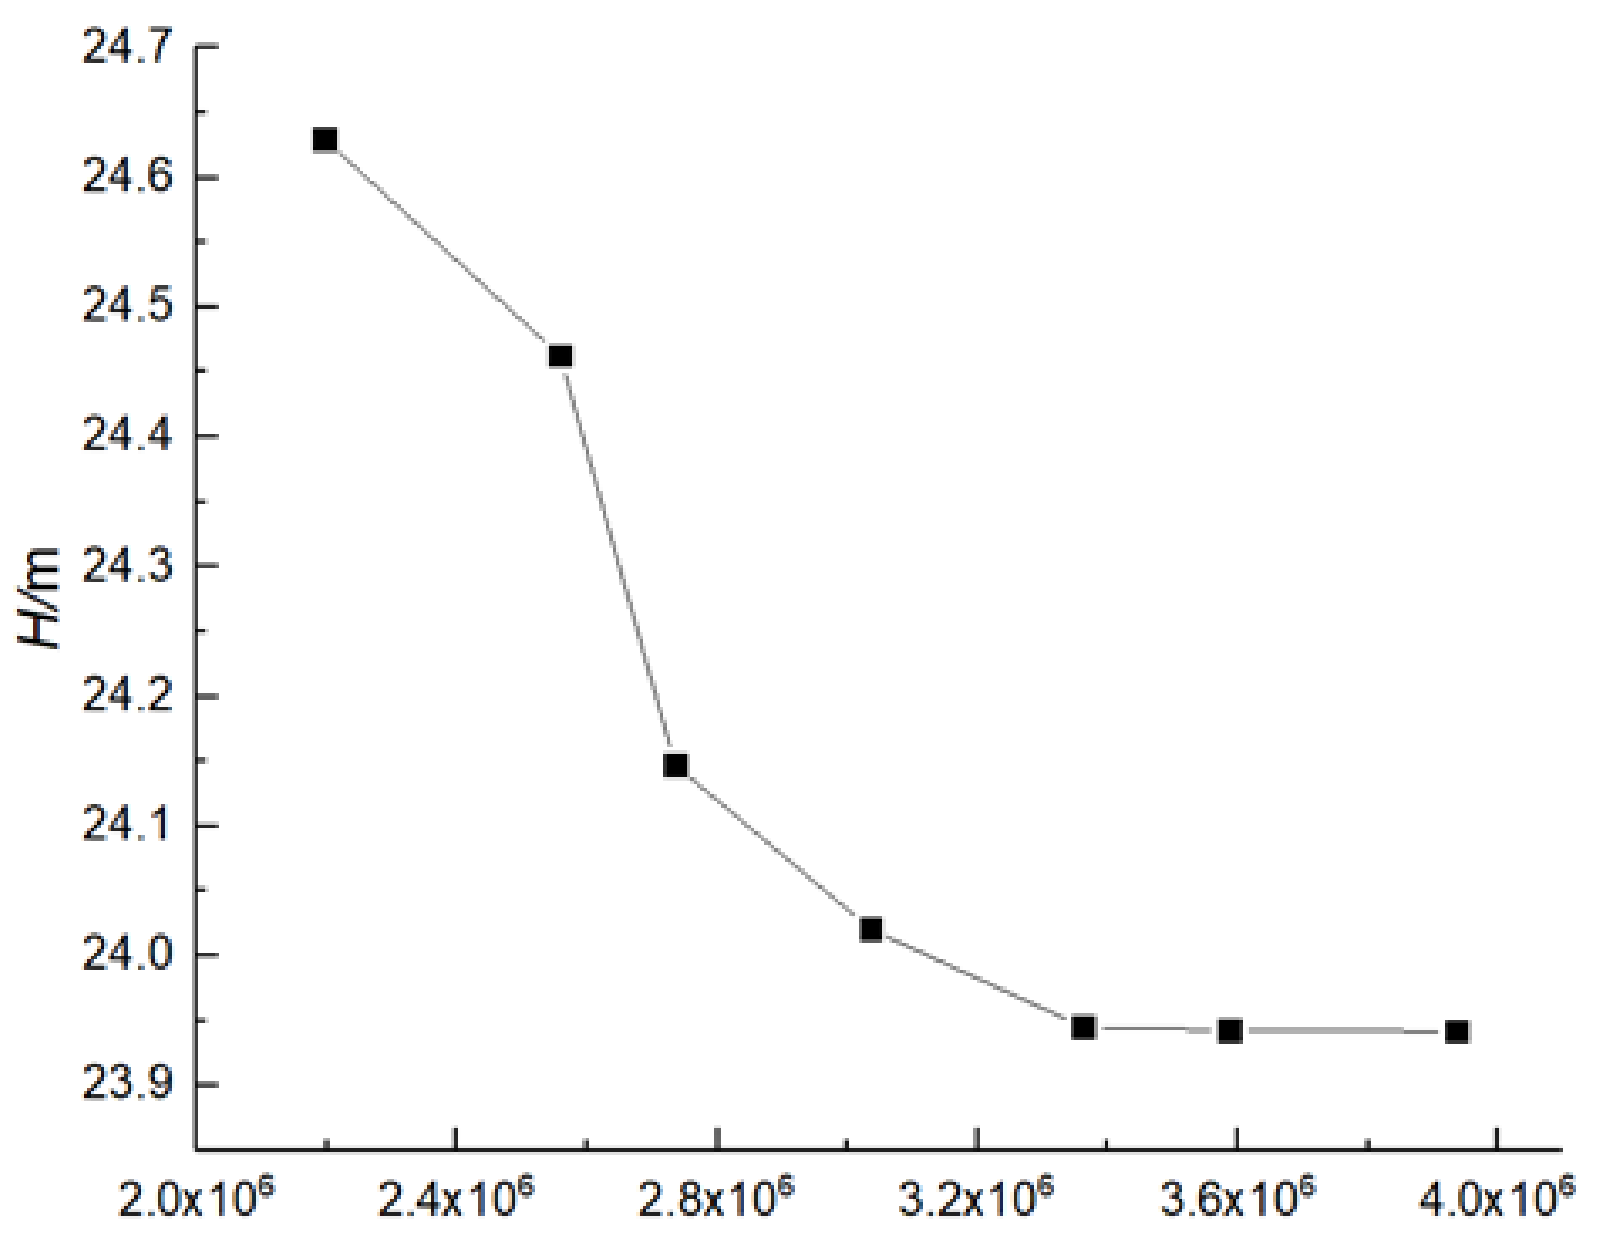
In order to improve the accuracy and computational efficiency of numerical analysis, grid independence was verified. The fluid domain of the multiphase pump is divided into seven sets of grids. Under the water design conditions, the fluid domains with different grid numbers are numerically calculated. It can be seen from Figure 3 that, as the number of grids increases, the head gradually decreases and gradually stabilizes. When the number of grids in the computational domain is greater than 3.38 million, the head change is only 0.31% and less than 0.5%. It can be seen that it is more appropriate to choose a grid number greater than 3.38 million, so the grid number of this calculation model is approximately 3.6 million, in which the grid number of the inlet extension is approximately 500,000, the grid number of the outlet extension is approximately 900,000, and the grid number of the impeller fluid domain is approximately 2.17 million, and the Y + values on the blade surface of the final selected grids are distributed between 1 and 80.
3.3. Boundary Condition Setting
In this paper, the SST k-ω turbulence model, Zwart–Gerber–Belamri cavitation model, and ANSYS software are used to numerically calculate the constant cavitation flow of multiphase pumps under design conditions, “transient rotor–stator” is used for the dynamic and static intersection of the impeller fluid domain and the inlet and outlet section. Among them, the inlet boundary condition is set to pressure inlet, the volume fraction of vapor phase is set to 0, and the pressure at the inlet side of the multiphase pump is gradually reduced to achieve the purpose of gradual cavitation in the pump, the outlet boundary condition is set to mass outflow. In addition, the SIMPLE algorithm with strong convergence and fast speed is adopted for the coupling between speed and pressure in the whole calculation process, the impeller hub, blade, and shroud are set to a relative no-slip wall surface, and the rest of the wall surface is selected as an absolute no-slip wall surface. The rest of the wall surface is selected as an absolute no-slip wall surface, the saturation steam pressure of water at 25 °C is set to 3170 pa, and the convergence accuracy is set to 10−5.
3.4. Numerical Method Verification
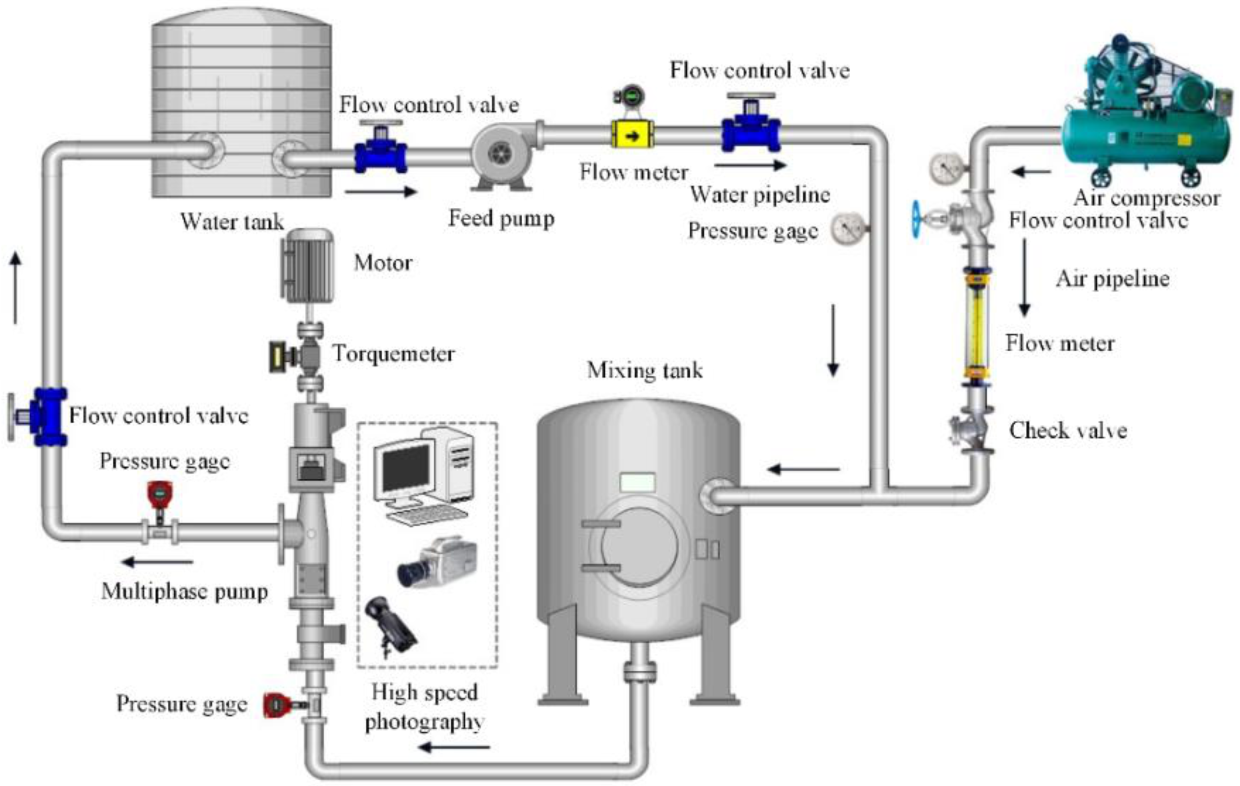
The multiphase pump test system is provided in Figure 4.
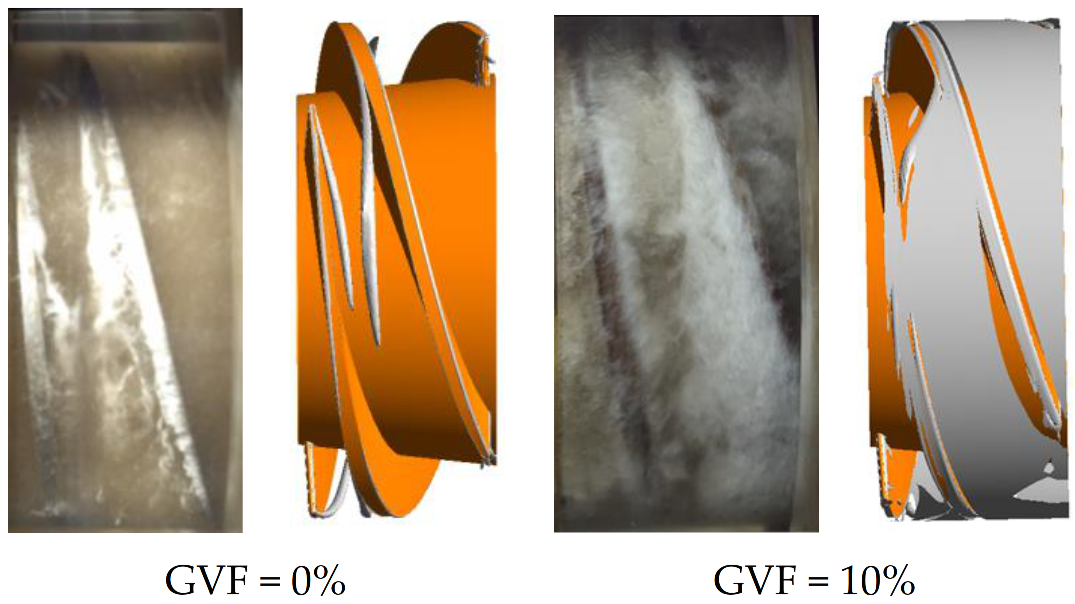
Figure 5 shows the experimental and CFD flow fields when GVFs were 0 and 10%. It can be seen that the experimental flow field near the blade tip was in good agreement with the CFD flow field, especially in the water test, which shows that the numerical method was reliable.
4. Calculation and Analysis of Results
4.1. Cavitation Characteristic Curve Prediction
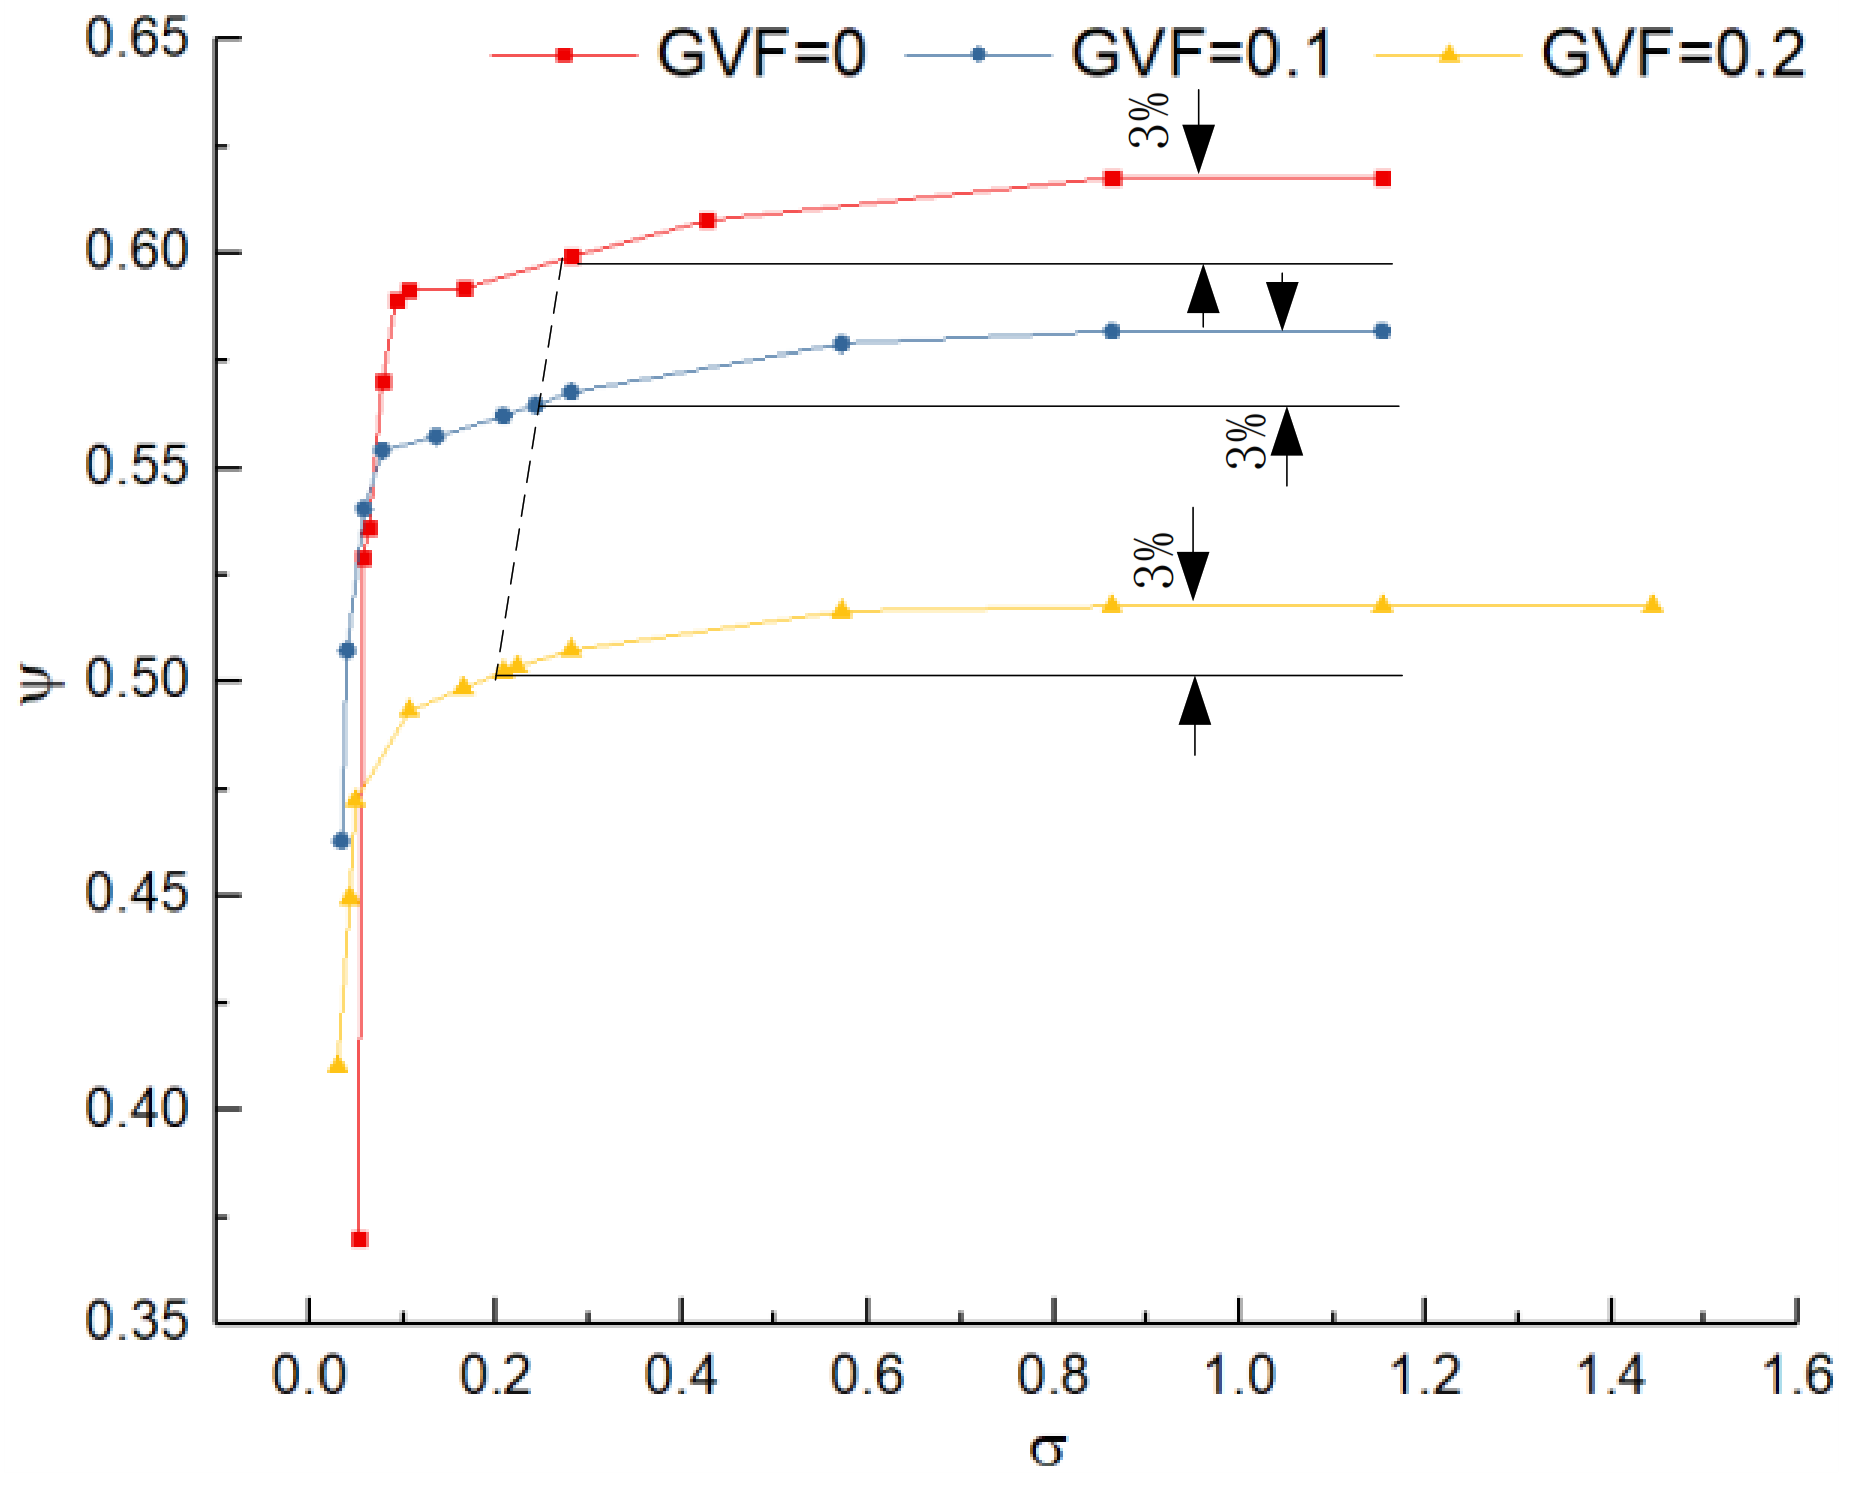
Figure 6 shows the variation of head coefficient ψ with cavitation coefficient σ for the multiphase pump, and the head coefficient ψ and cavitation coefficient σ are shown in Equations (5) and (6).
In Equation (5): Pin and Pout are the inlet and outlet pressures of the multiphase pump respectively. U is the circumferential velocity of the impeller hub, and the expression is U = πDn/60.
In Equation (6): Pv is the saturated vapor pressure of water at 25 °C, and is 3170 Pa.
From Figure 6, it can be seen that, under the working condition of GVF = 0, when the cavitation coefficient σ is 0.28, the head coefficient ψ decreases by 3% compared with that without cavitation, i.e., the critical cavitation point is reached. When the cavitation coefficient σ decreases to 0.077, the corresponding head coefficient ψ decreases by 7.68%, reaching the stage of severe cavitation. At the cavitation coefficient σ of 0.051, the head is reduced by more than 20%, and the fracture cavitation stage is reached. In the case of GVF = 0.1, when the cavitation coefficient σ is 0.24, the head coefficient ψ is reduced by 3% compared with that without cavitation, i.e., the critical cavitation point is reached. When the cavitation coefficient σ is reduced to 0.057, the corresponding head coefficient ψ is reduced by 7.3%, reaching the severe cavitation stage. When the cavitation coefficient σ is 0.033, the reduction in the head exceeds 20%, reaching the stage of fracture cavitation. Under the working condition of GVF = 0.2, when the cavitation coefficient σ is 0.208, the head coefficient ψ is reduced by 3%, compared with that without cavitation, i.e., the critical cavitation point is reached. When the cavitation coefficient σ is reduced to 0.048, the corresponding head coefficient ψ is reduced by 7.4%, reaching the severe cavitation stage; when the cavitation coefficient σ is 0.029, the head reduction ψ is more than 20%, reaching the fractured cavitation stage.
4.2. Effect of GVF on Turbulent Dissipation Losses in Each Cavitation Stage
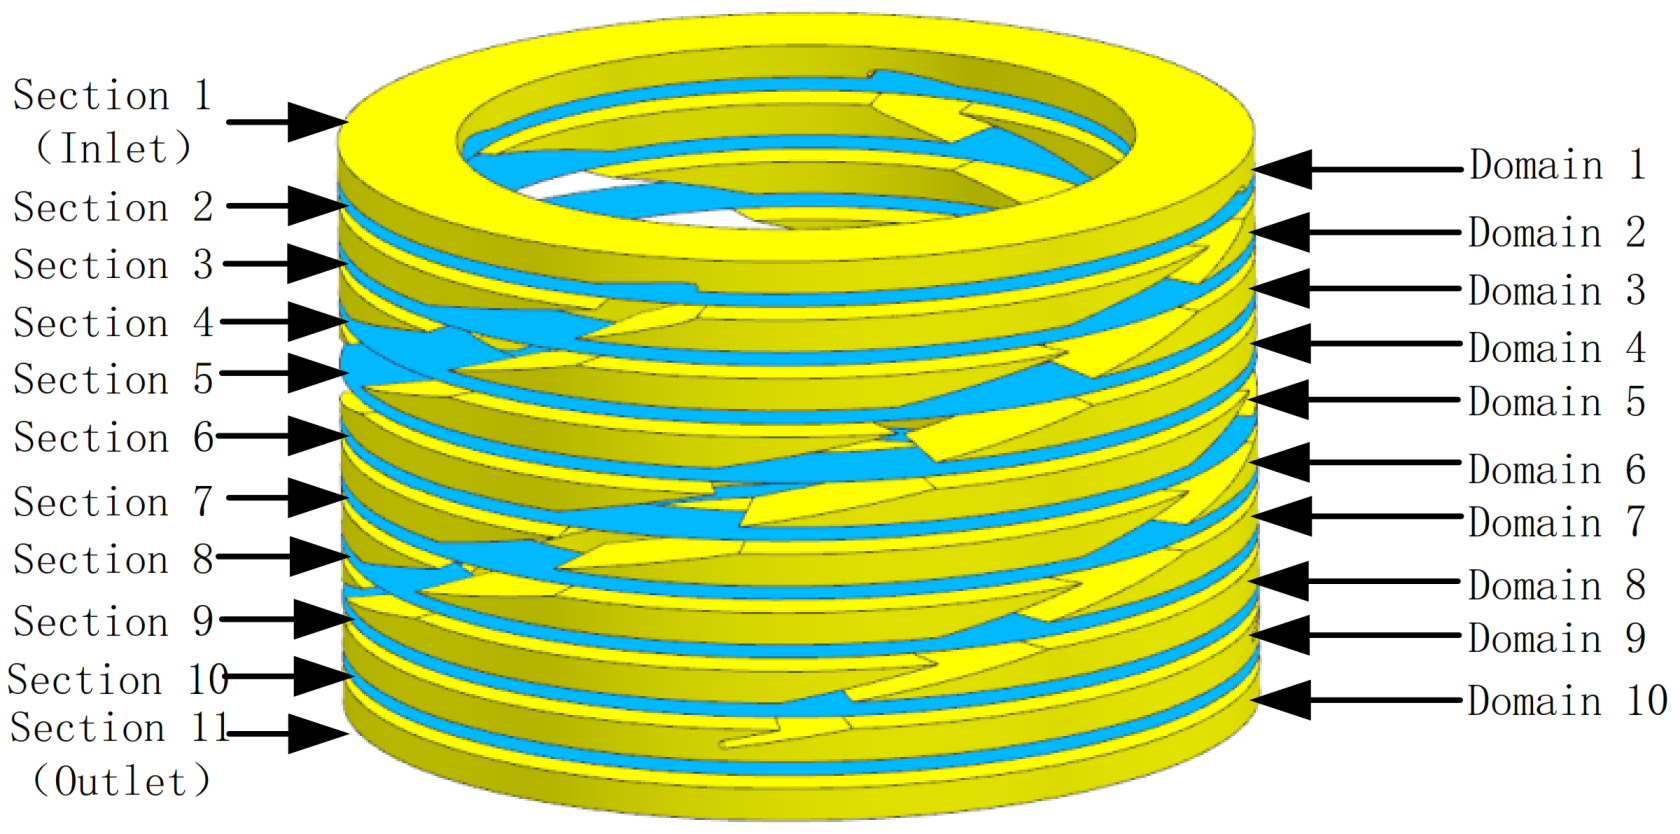
In order to analyze in detail the effect of GVF on the energy loss of each cavitation phase in the multiphase pump, 11 equally spaced cross sections, including the inlet and outlet surfaces, were used to divide the multiphase pump impeller fluid domain into 10 small areas, as shown in Figure 7.
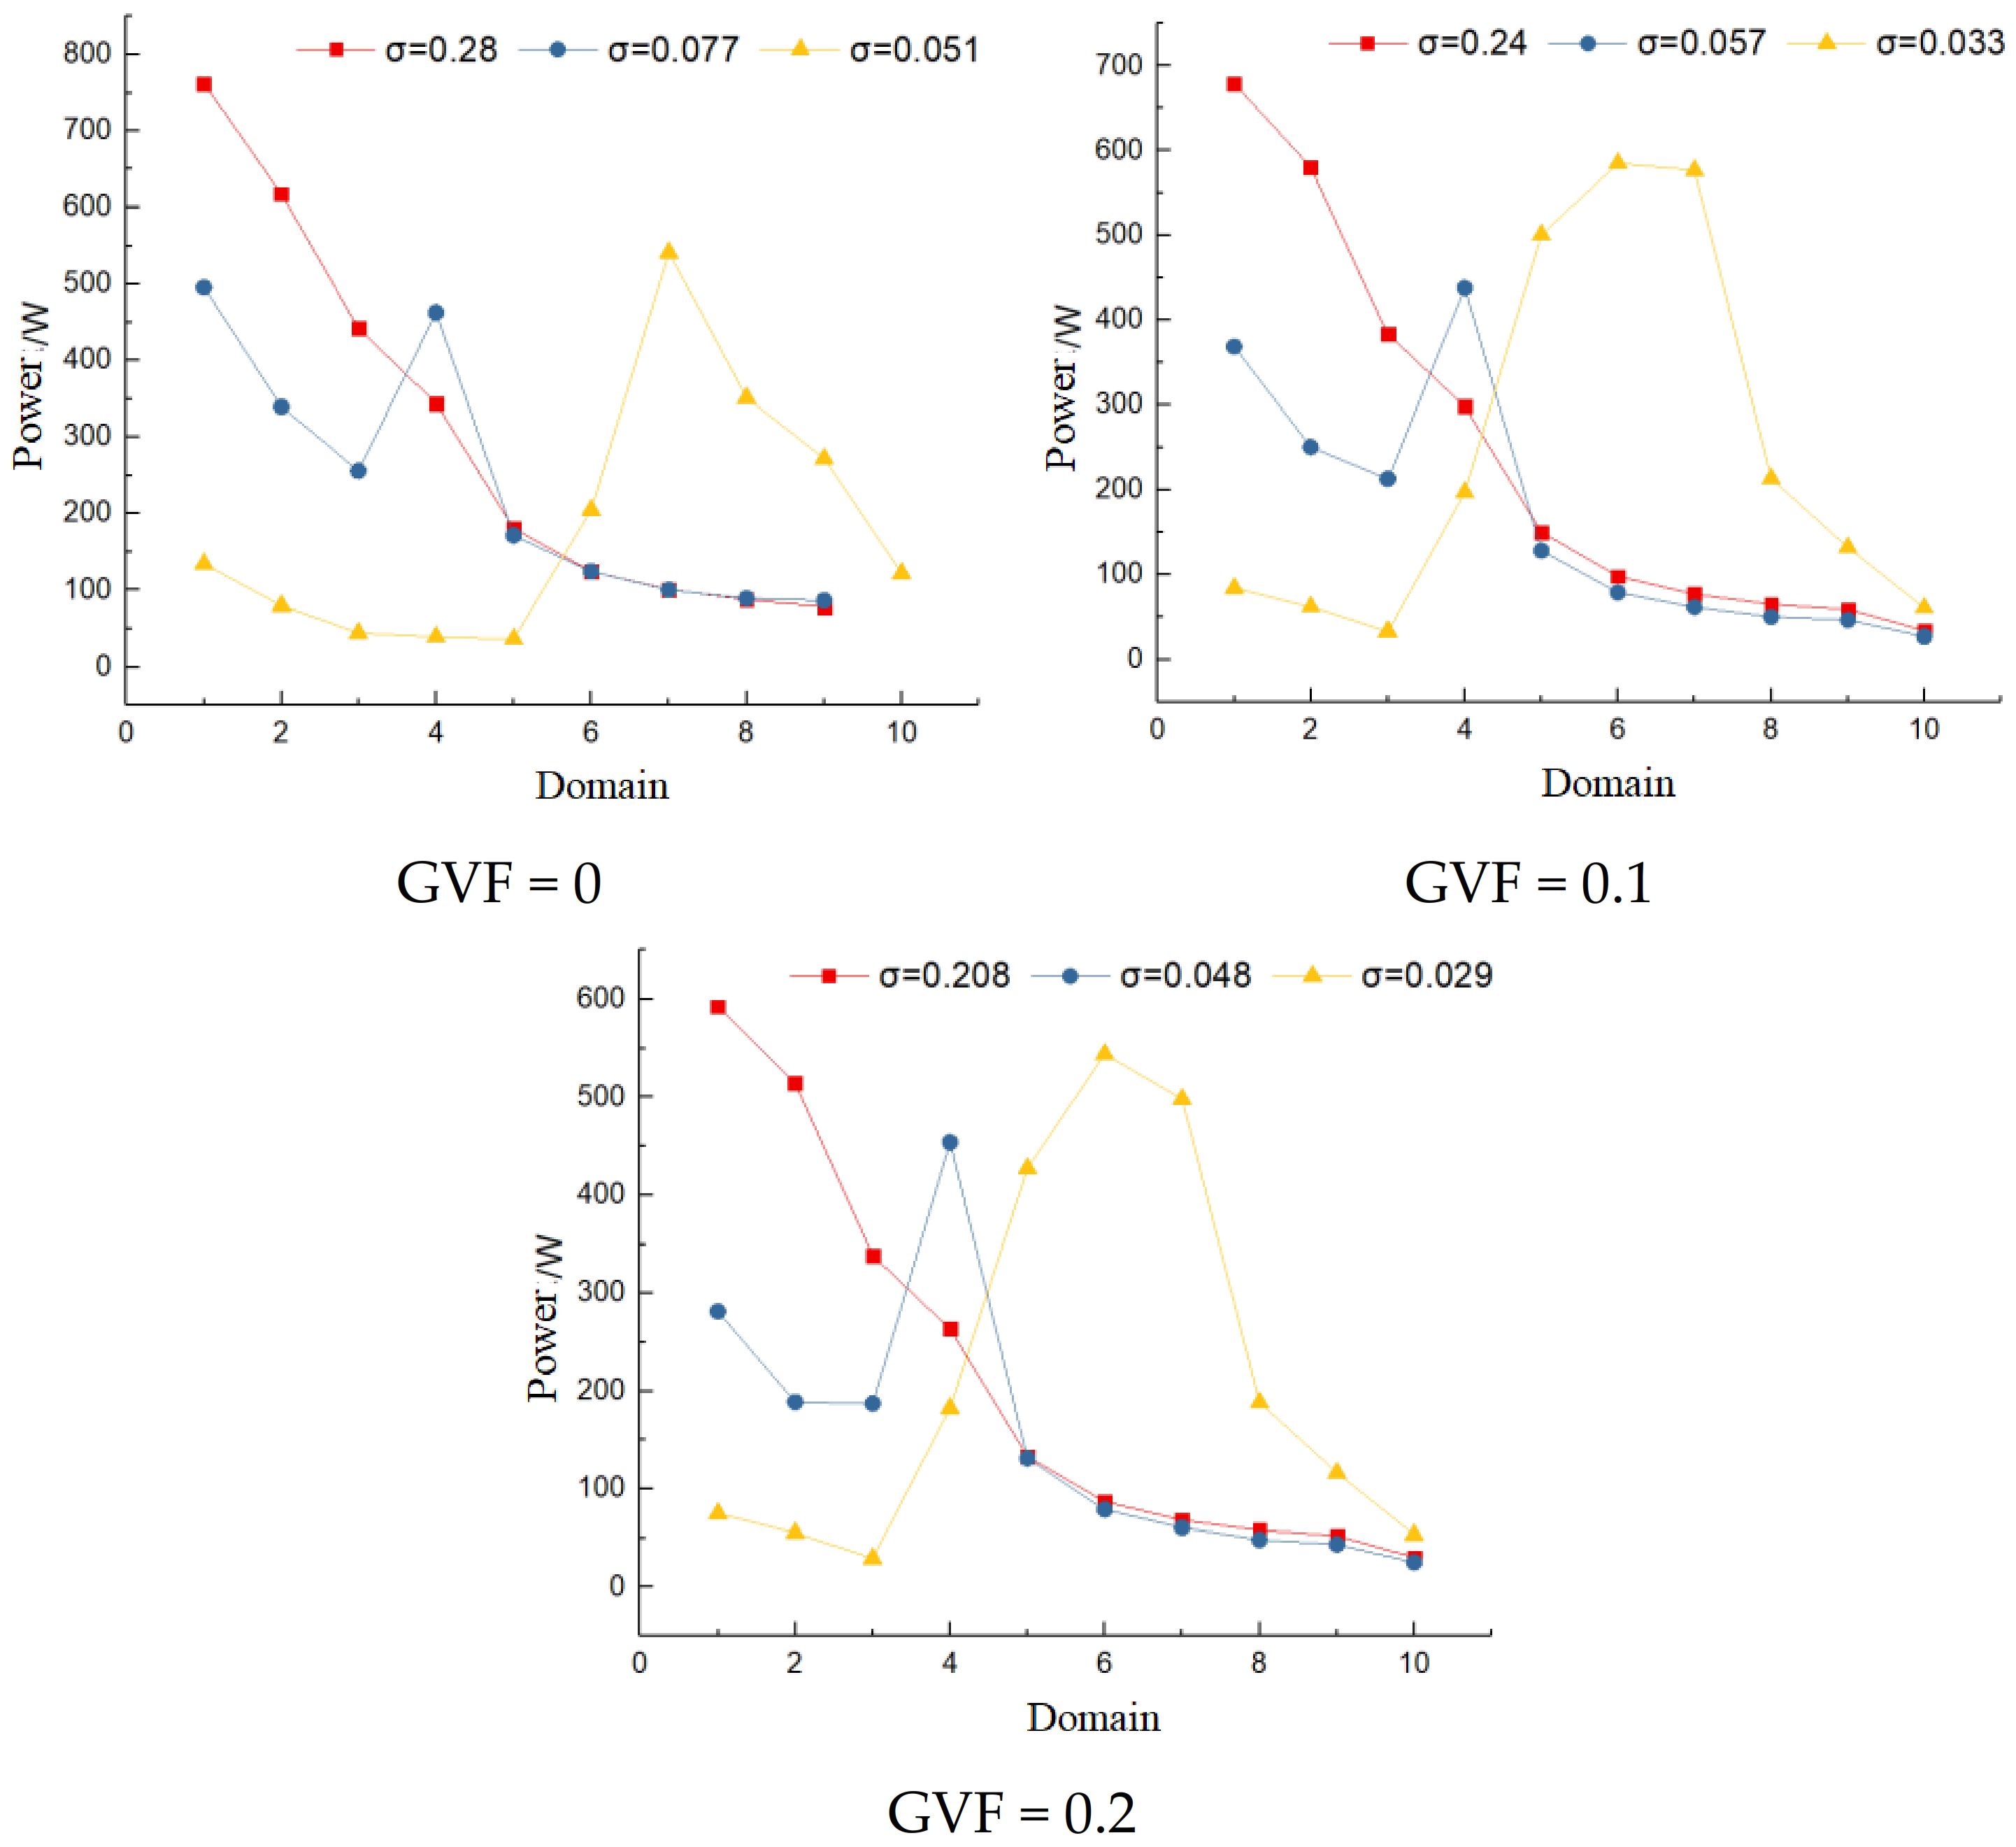
The turbulent dissipation loss of each fluid domain of the impeller is calculated and analyzed as follows. Figure 8 shows the distribution law of turbulent dissipation loss of each fluid domain of the impeller at different cavitation stages with GVF of 0, 0.1, and 0.2, respectively, where the calculation formula of turbulent dissipation loss Ptur is shown in (7).
where ρm is the density of the mixed phase and ε is the turbulent dissipation rate.
As can be seen from Figure 8, under the critical cavitation state corresponding to each GVF, the turbulent dissipation loss curve from the inlet to the outlet of the impeller fluid domain shows a trend of first sharply decreasing and then gradually decreasing, which is mainly because, near the inlet of the impeller fluid domain, the flow is more turbulent and the impact of the fluid on the blade is larger, which is consistent with the distribution of turbulent kinetic energy in the impeller flow passage. It can also be seen that, with the increase in GVF, the turbulence dissipation loss in the same fluid domain gradually decreases. As can be seen in Equation (7), this is mainly because the mixing density decreases with the increase in GVF, and the turbulence dissipation loss decreases. When cavitation develops to the second stage, the turbulent dissipation loss in the first three fluid domains of the impeller at each GVF decreases more compared to the critical cavitation, while the turbulent dissipation loss in domain four suddenly increases, and domain four corresponds to the end domain of the cavitation, where the return vortex is formed by a larger inverse pressure gradient, which intensifies the energy dissipation and makes the turbulent dissipation loss in this domain increase. When the cavitation develops to the third stage, the turbulent dissipation loss is smaller in domains one–five when the GVF is 0. The region with the largest turbulent dissipation loss is shifted to domain seven, while the domains with larger turbulent dissipation loss are shifted to domain six when the GVF are 0.1 and 0.2, and the range of the domain with larger turbulent dissipation loss becomes larger compared with the GVF of 0. In the above analysis, it can be seen that the reduction in the cavitation coefficient reduces the turbulent dissipation loss in the corresponding domain, while the presence of backflow vortices in the end domain of the cavitation leads to the increase in turbulent dissipation loss.
4.3. Effect of GVF on Friction Loss at Each Cavitation Stage
The output power of the impeller can be deconstructed into two parts. One part is the energy obtained by the fluid, namely pressure energy and kinetic energy. The second part is the energy lost, namely the energy lost by turbulence dissipation and the energy lost by friction caused by the viscosity of the fluid medium. The specific calculation formula is shown in (8) [34,35,36].
In Equation (8), Pout is the power output by the impeller, ∇Pt is the energy obtained by the fluid medium, Ptur is the energy lost by turbulence dissipation, and Pf is the energy lost by friction.
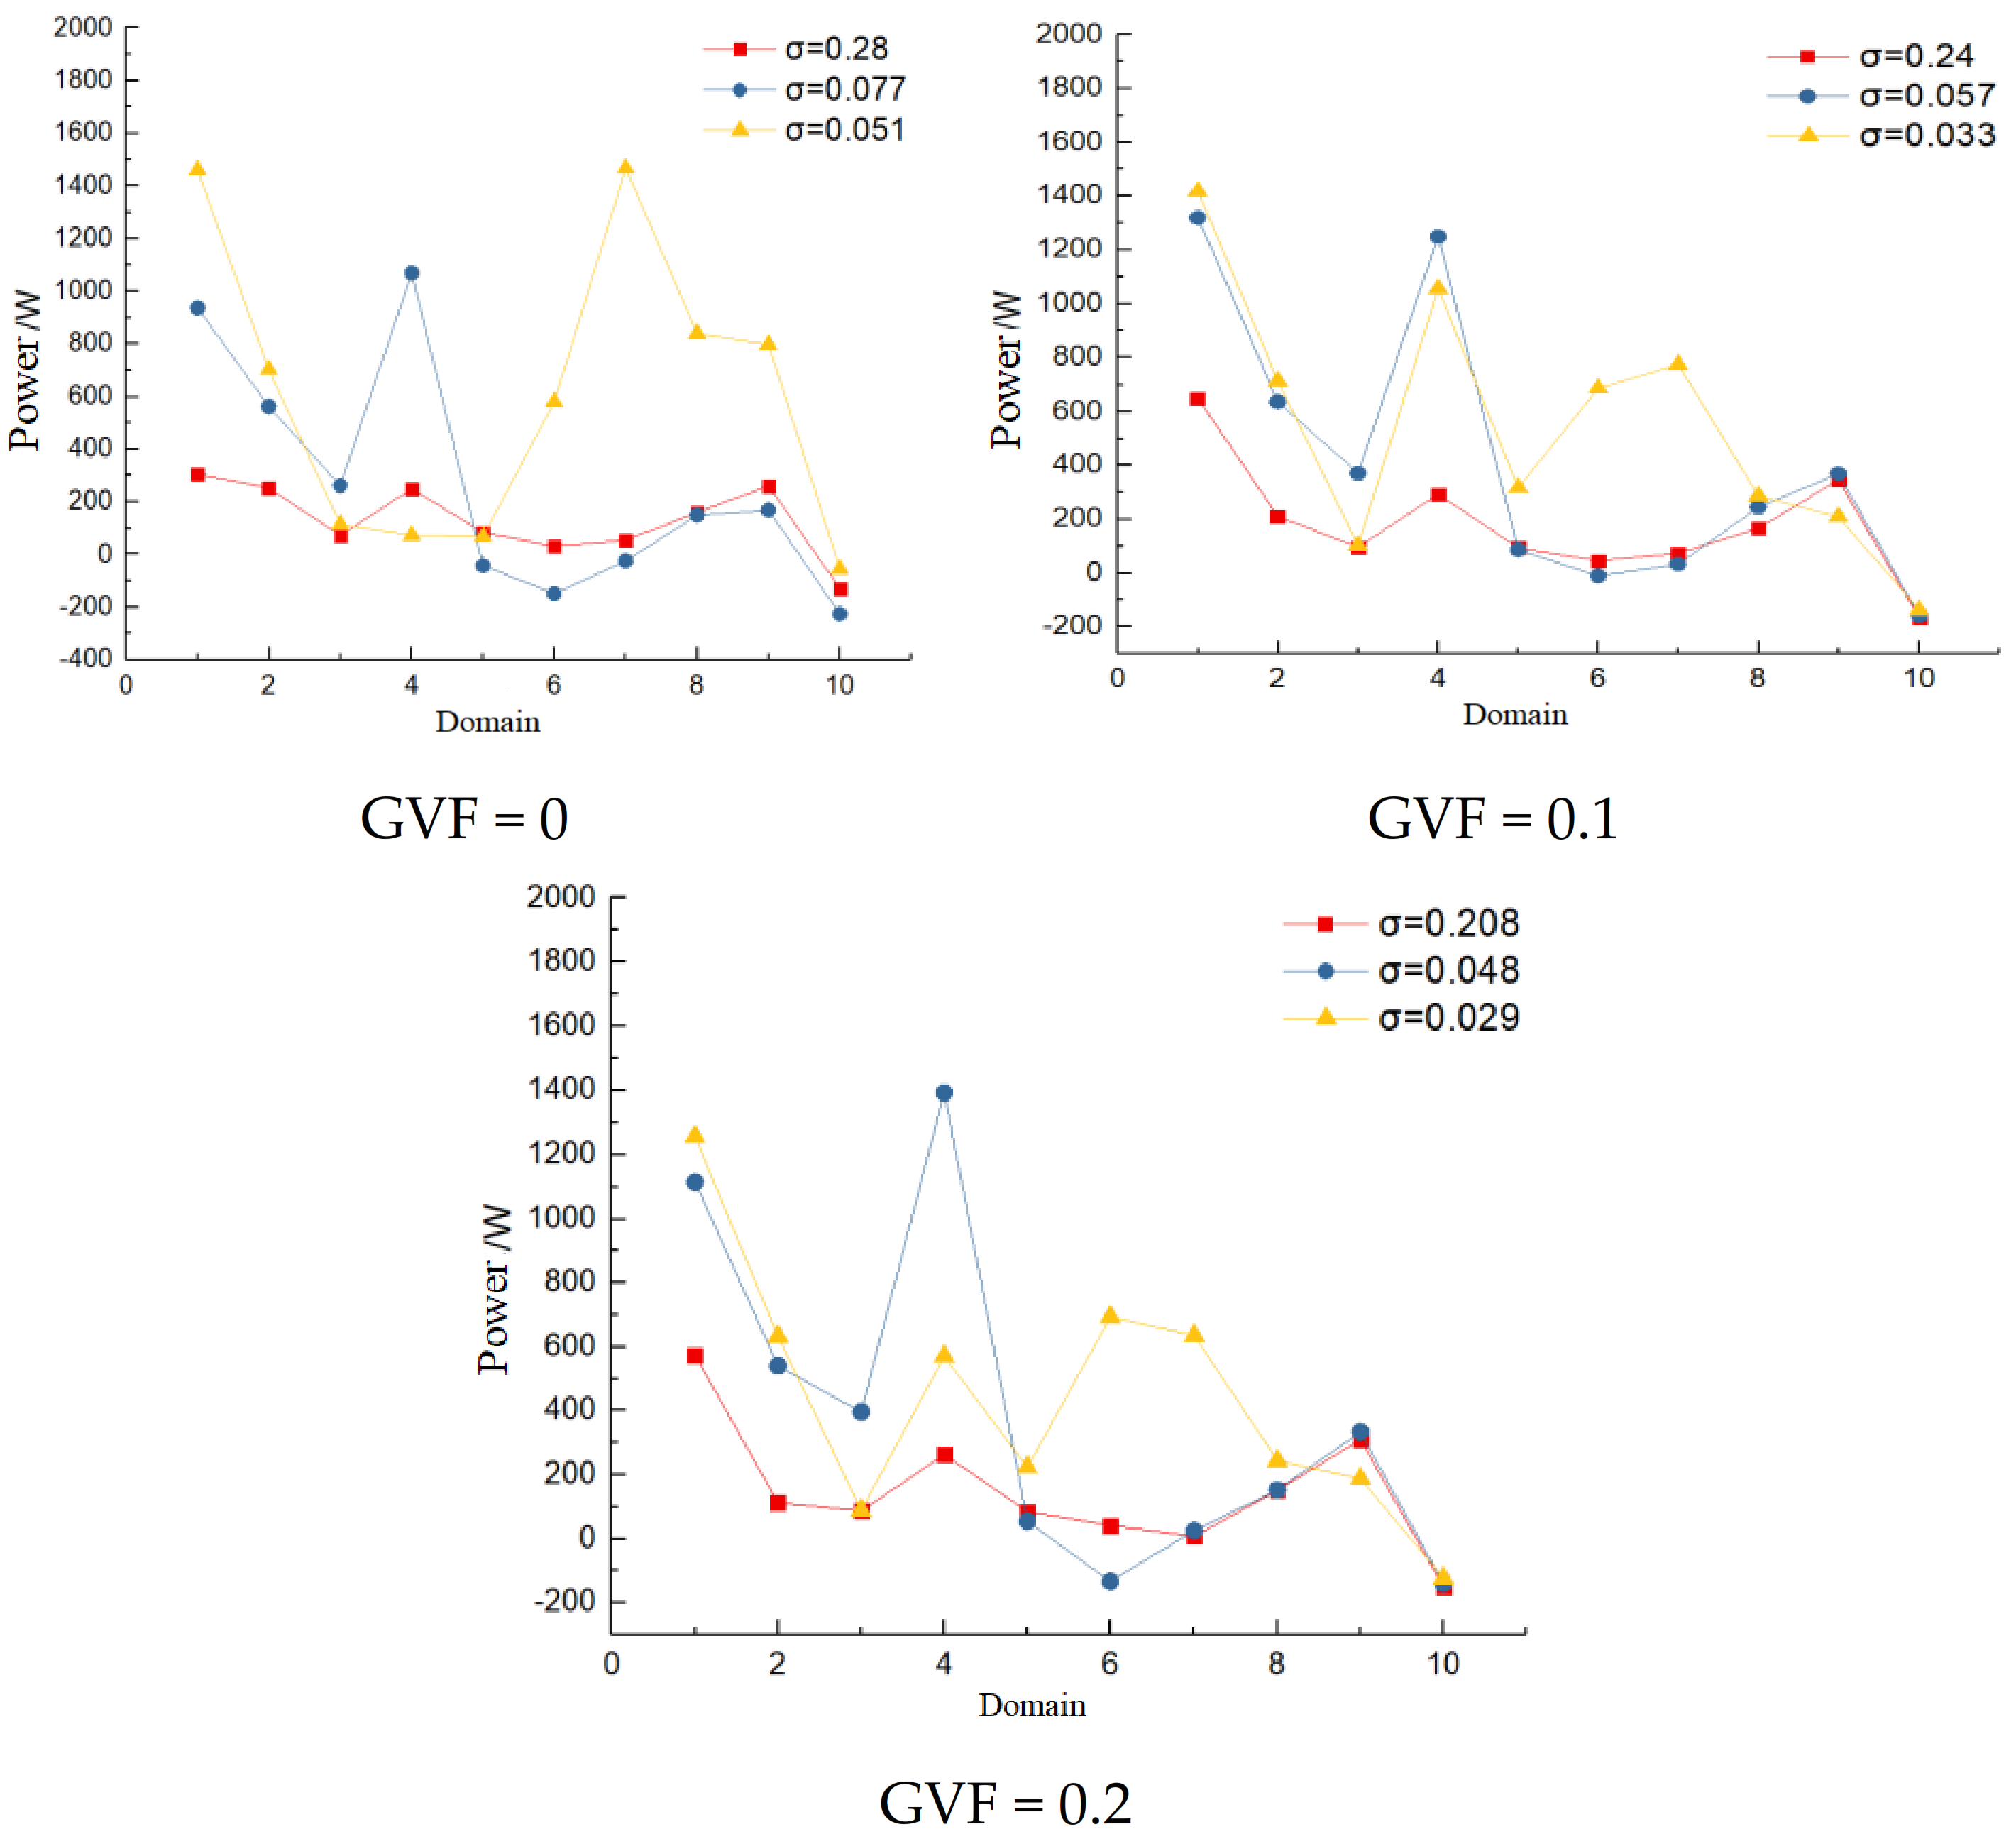
In order to study the effect of cavitation flow on the friction loss inside the multiphase pump, the following analysis of the friction loss in each fluid domain of the impeller is carried out, and the equation for the friction loss is obtained by the transformation of (8), as shown in (9).
In Equation (9), Ffri is the frictional force on the wall and v is the relative velocity in the near-wall region.
Figure 9 shows the friction losses in each domain of the impeller at different GVFs. In Figure 9, it can be seen that, in the critical cavitation stage, the friction losses in the same domain at each GVF have the same trend, except for the friction losses in fluid domain one, corresponding to GVFs of 0.1 and 0.2, which are larger than those of GVF of 0. When the cavitation develops to the second stage, the friction loss in each GVF corresponding to domains one–four becomes larger compared to the critical cavitation, and the friction loss increases more in domain four. When the cavitation develops to the third stage, because the dynamic pressure power in Section 1, Section 2 and Section 3 corresponds to the domain one–two increases compared with the critical cavitation state, the friction loss in domains one–two corresponding to GVF increases, and the large velocity gradient caused by the backflow vortex at the end of the cavitation increases the friction loss in the six–nine domain corresponding to the GVF of 0 and domains four–seven corresponding to GVFs of 0.1 and 0.2. The above analysis shows that, as the cavitation coefficient decreases, the return vortex formed by the larger inverse pressure gradient in the end region of the cavitation makes the friction loss in the corresponding domain increase.
4.4. Impeller Domain Flow Loss Comparison Analysis
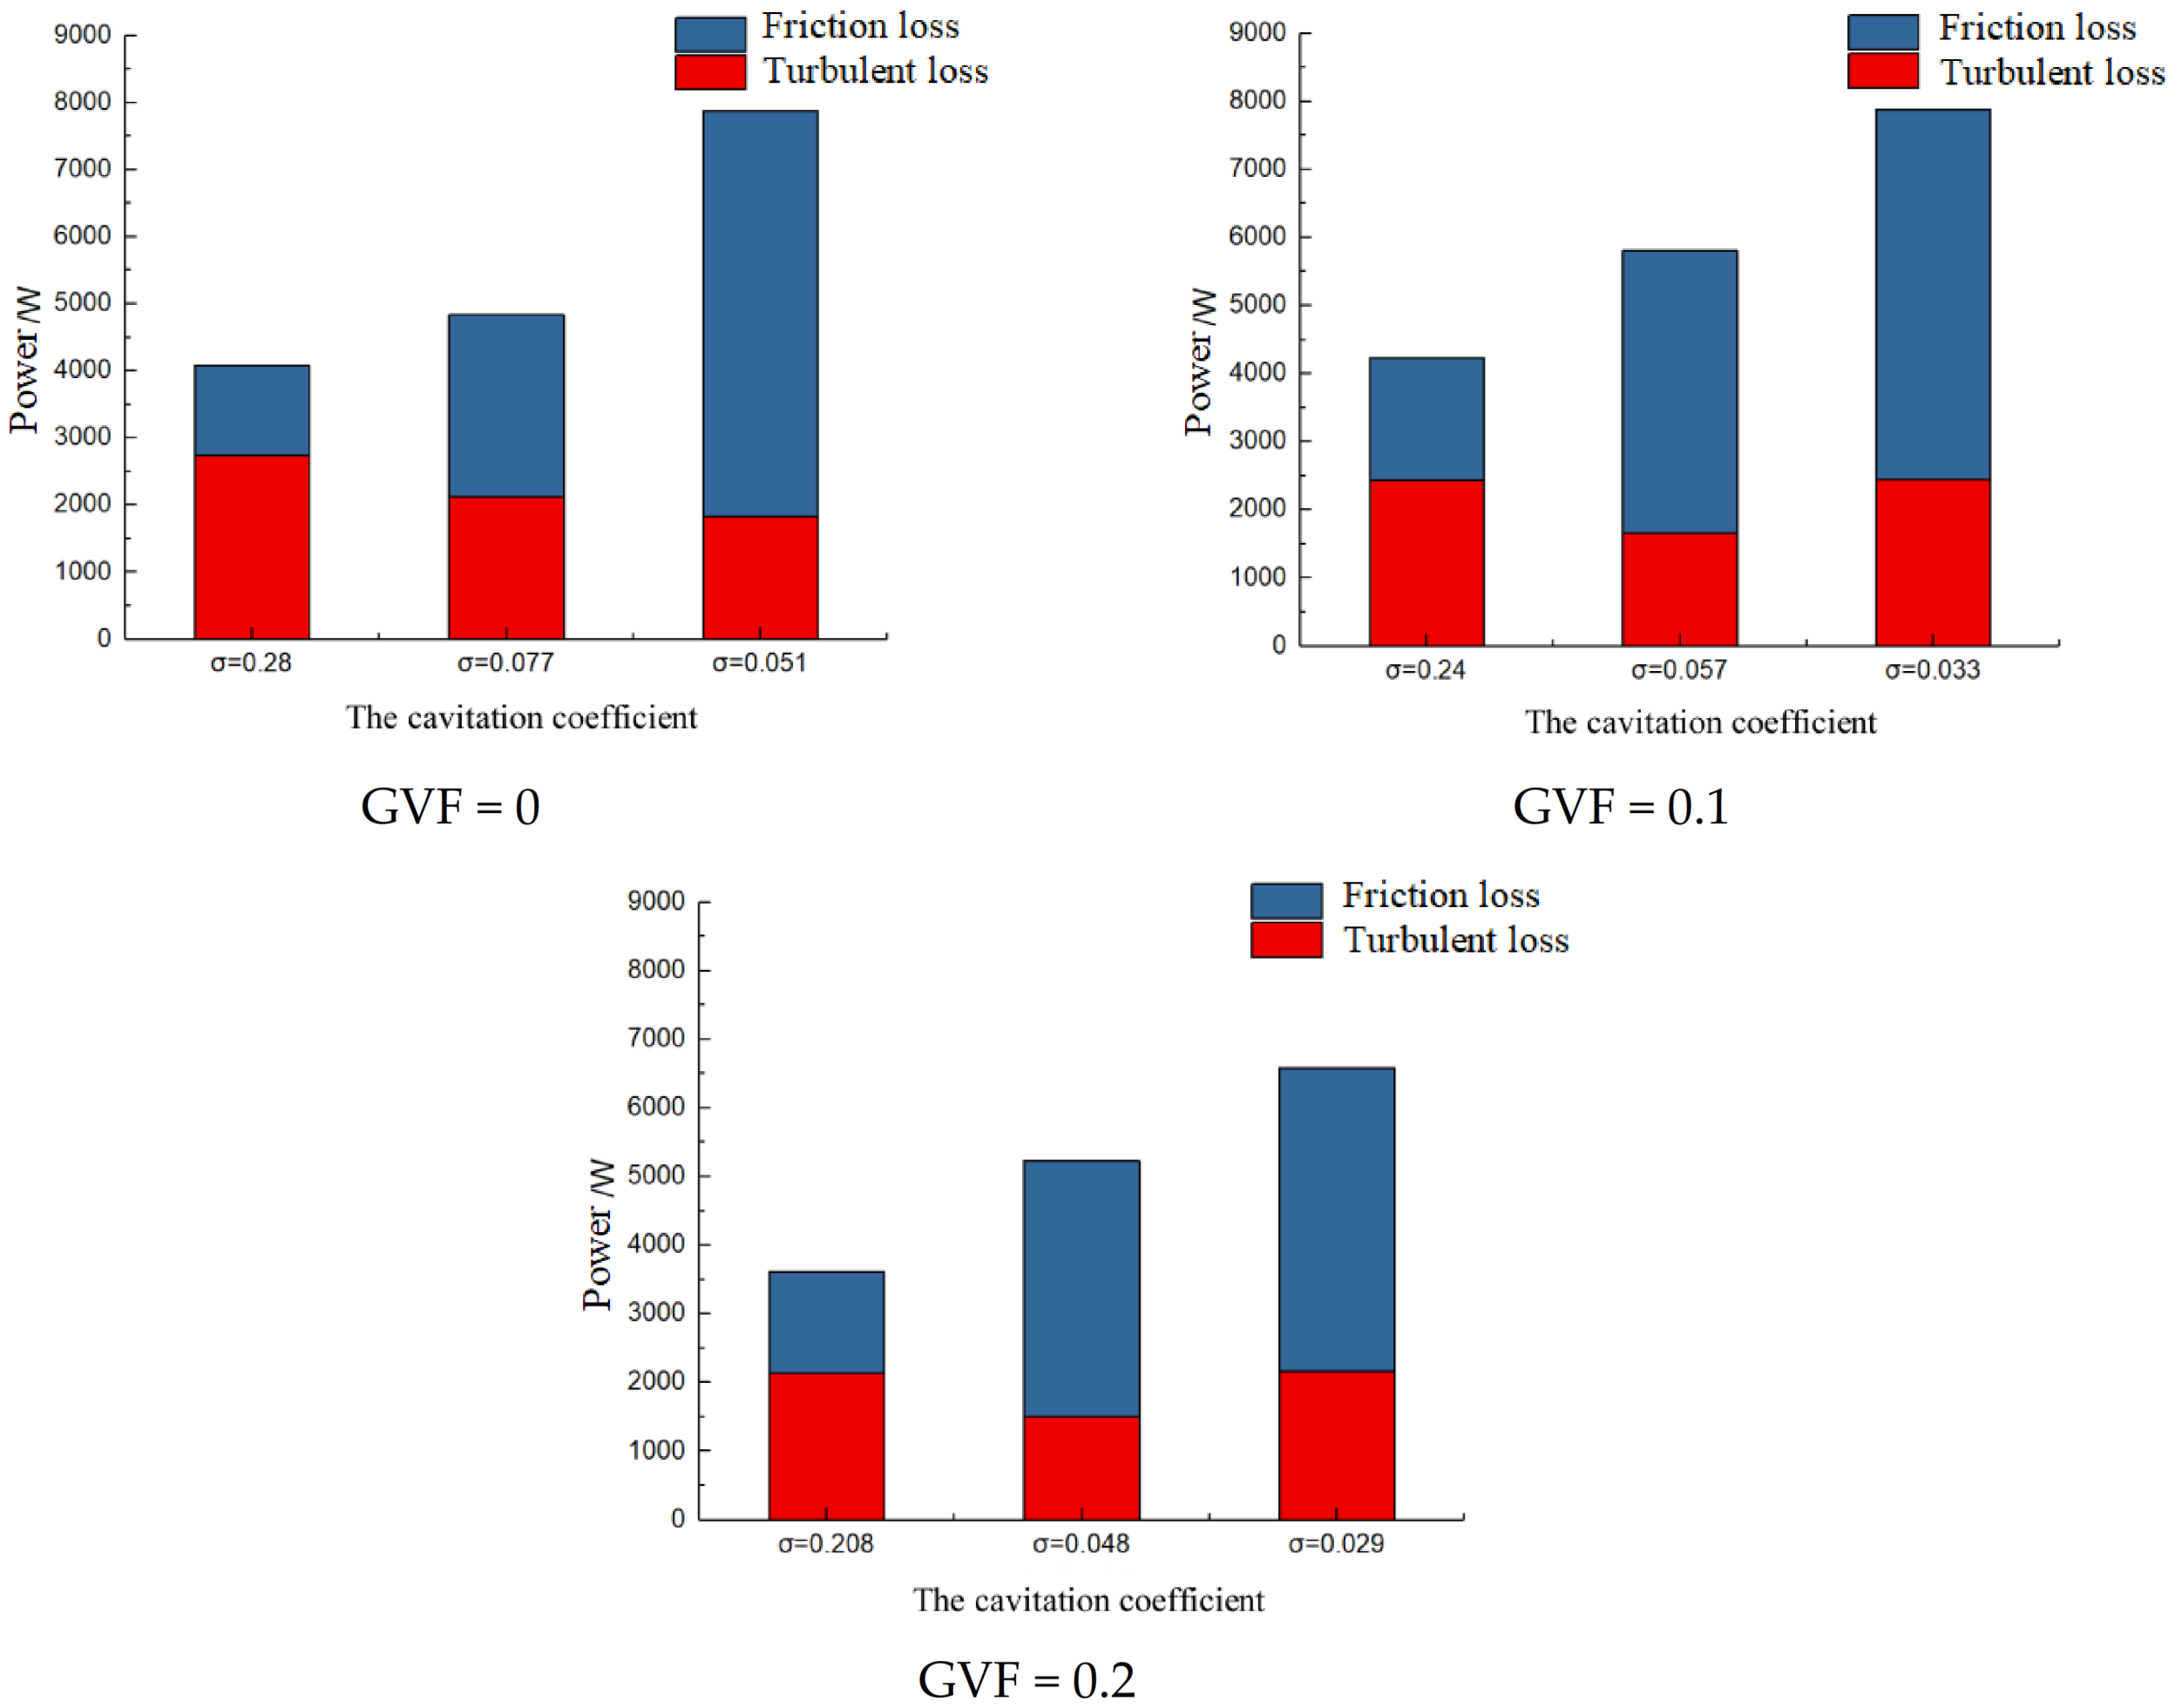
Figure 10 shows the energy loss distribution law of the impeller fluid domain at different GVFs. As can be seen from Figure 10 that, with the development of cavitation, the friction loss inside the impeller of the multiphase pump gradually increases, and the turbulent dissipation loss shows a trend of gradually decreasing when the GVF is 0, while the turbulent dissipation loss corresponding to the GVFs of 0.1 and 0.2 shows a trend of first decreasing and then increasing.This is because in the corresponding third stage of cavitation in the case of gas, when the suction surface of the blade does not reach supercavitation, the cavitation has extended to the pressure surface of the blade, resulting in the formation of two backflow vortices near the suction surface and the pressure surface, which intensifies the turbulence dissipation. In the critical cavitation stage, the loss in the impeller fluid domain is mainly caused by turbulent dissipation. When cavitation developed to the second stage, with the increase in GVF, the friction loss accounted for 56, 71, and 72% of the total loss, while in the third stage cavitation, the proportion was 76.8, 67, and 67%, respectively. Through the above analysis, it can be seen that, when cavitation does not occur inside the multiphase pump or the cavitation state is weak, the flow loss is mainly turbulent dissipation loss. With the development of cavitation, the total loss inside the multiphase pump increases, in which the proportion of turbulent dissipation loss to the total loss gradually decreases, while the friction loss and its proportion to the total loss gradually increases, and when cavitation develops to a certain degree, the internal flow loss of the multiphase pump is mainly friction loss.
5. Conclusions
(1) The continuous increase in GVF can not only make the critical cavitation coefficient of multiphase pump gradually reduce, but also inhibit the growth rate of cavitation, which has a certain inhibitory effect on the evolution of cavitation and can improve the cavitation performance of multiphase pump.
(2) The reduction in the cavitation coefficient leads to a reduction in the turbulent dissipation losses in this range domain, while the backflow vortices are formed at the end domain of the cavitation by the inverse pressure gradient, which increases the turbulent dissipation loss in the domain corresponding to the end of the cavitation. Moreover, the backflow vortices formed at the end domain of the cavitation will also increase the friction loss, which eventually leads to the total loss in the impeller fluid domain and the proportion of the friction loss to the total flow loss gradually increasing with the development of cavitation.
(3) As the power output of the impeller domain gradually decreases with the development of cavitation, and the internal flow loss gradually increases with the development of cavitation, the net energy obtained by the fluid gradually decreases, leading to a decrease in the pressurization performance of the multiphase pump with the development of cavitation.
Author Contributions
Conceptualization, methodology, software, writing—original draft, writing—review and editing, J.S.; investigation, software, writing—original draft, S.T.; writing—review and editing; investigation, software, conceptualization, G.S.; supervision, validation, W.S. All authors have read and agreed to the published version of the manuscript.
Funding
This work was supported by Open Research Fund Program of State key Laboratory of Hydroscience and Engineering (sklhse-2021-E-03), the Key scientific research fund of Xihua University of China (Grant No. Z1510417), Open Research Subject of Key Laboratory of Fluid and Power Machinery, Ministry of Education (Grant No. LTDL2020-008), the National Natural Science Foundation of China (Grant No. 51479093).
Institutional Review Board Statement
Not applicable.
Informed Consent Statement
Not applicable.
Data Availability Statement
Not applicable.
Conflicts of Interest
The authors declare no conflict of interest.
References
- Stuart, S. Multiphase pumping addressed a wide range of operating problems. Oil Gas J. 2009, 101, 59–71. [Google Scholar]
- Kim, J.H.; Lee, H.C.; Kim, J.H.; Choi, Y.S.; Yoon, J.Y.; Yoo, I.S.; Choi, W.C. Improvement of hydrodynamic performance of a multiphase pump using design of experiment techniques. J. Fluids Eng. 2015, 137, 081301. [Google Scholar] [CrossRef]
- Zhang, N.; Gao, B.; Zhong, L.; Jiang, Q.F. Cavitating flow-induced unsteady pressure pulsations in a low specific speed centrifugal pump. R. Soc. Open Sci. 2018, 5, 180408. [Google Scholar] [CrossRef] [Green Version]
- Tao, R.; Zhou, X.Z.; Xu, B.; Wang, Z. Numerical investigation of the flow regime and cavitation in the vanes of reversible pump-turbine during pump mode’s starting up. Renew. Energy 2019, 141, 9–19. [Google Scholar] [CrossRef]
- Ylönen, M.; Franc, J.P.; Miettinen, J.; Saarenrinne, P.; Fivel, M. Shedding Frequency in Cavitation Erosion Evolution Tracking. Int. J. Multiph. Flow 2019, 118, 141–149. [Google Scholar] [CrossRef]
- Huang, B.; Wang, G.Y.; Zhang, B.; Shi, S.G. Application evaluation and analysis of cavitation model in unsteady cavitation flow calculation. J. Ship Mech. 2011, 11, 3–10. [Google Scholar]
- Senocak, I.; Shyy, W. A pressure-based method for turbulent cavitating flow computations. J. Comput. Phys. 2002, 176, 363–383. [Google Scholar] [CrossRef]
- Liu, H.L.; Liu, D.X.; Wang, Y.; Wu, X.F.; Zhuang, S.G. Application evaluation of three cavitation models in cavitation flow calculation of centrifugal pump. Trans. Chin. Soc. Agric. Eng. 2012, 28, 54–59. [Google Scholar]
- Yu, A.; Tang, Q.; Zhou, D. Cavitation Evolution around a NACA0015 Hydrofoil with Different Cavitation Models Based on Level Set Method. Appl. Sci. 2019, 9, 758. [Google Scholar] [CrossRef] [Green Version]
- De Giorgi, M.G.; Fontanarosa, D.; Ficarella, A. CFD data of unsteady cavitation around a hydrofoil, based on an extended Schnerr-Sauer model coupled with a nucleation model. Data Brief 2019, 25, 104226. [Google Scholar] [CrossRef] [PubMed]
- Hidalgo, V.; Escaler, X.; Valencia, E.; Peng, X.; Erazo, J.; Puga, D.; Luo, X. Scale-Adaptive Simulation of Unsteady Cavitation Around a Naca66 Hydrofoil. Appl. Sci. 2019, 9, 3696. [Google Scholar] [CrossRef] [Green Version]
- Kalateh, F.; Koosheh, A. Simulation of cavitating fluid-Structure interaction using SPH-FE method. Math. Comput. Simul. 2020, 173, 51–70. [Google Scholar] [CrossRef]
- Chen, G.H.; Wang, G.Y.; Hu, C.L.; Huang, B.; Zhang, M. Observations and measurements on unsteady cavitating flows using a simultaneous sampling approach. Exp. Fluids 2015, 56, 32. [Google Scholar] [CrossRef]
- Arabnejad, M.H.; Amini, A.; Farhat, M.; Bensow, R. Numerical and experimental investigation of shedding mechanisms from leading-edge cavitation. Int. J. Multiph. Flow 2019, 119, 123–143. [Google Scholar] [CrossRef]
- Limbach, P.; Kowalski, K.; Hussong, J.; Romuald, S. Numerical Simulation of Cloud Cavitation in Hydrofoil and Orifice Flows With Analysis of Viscous and Nonviscous Separation. J. Fluids Eng. 2018, 140, 111102. [Google Scholar] [CrossRef]
- Liu, M.; Tan, L.; Liu, Y.; Xu, Y.; Cao, S. Large eddy simulation of cavitation vortex interaction and pressure fluctuation around hydrofoil ALE 15. Ocean. Eng. 2018, 163, 264–274. [Google Scholar] [CrossRef]
- Chen, Y.; Chen, X.; Li, J.; Gong, Z.; Lu, C. Large Eddy Simulation and investigation on the flow structure of the cascading cavitation shedding regime around 3D twisted hydrofoil. Ocean. Eng. 2017, 129, 1–19. [Google Scholar] [CrossRef]
- Sun, T.; Wei, Y.; Zou, L.; Jiang, Y.; Xu, C.; Zong, Z. Numerical investigation on the unsteady cavitation shedding dynamics over a hydrofoil in thermo-sensitive fluid. Int. J. Multiph. Flow 2019, 111, 82–100. [Google Scholar] [CrossRef]
- Chen, Y.; Li, J.; Gong, Z.; Chen, X.; Lu, C. Large eddy simulation and investigation on the laminar-turbulent transition and turbulence-cavitation interaction in the cavitating flow around hydrofoil. Int. J. Multiph. Flow 2019, 112, 300–322. [Google Scholar] [CrossRef]
- Zhao, G.S. Research on the Instability and Control Ofcavitation Flow in Centrifugal Pump; Lanzhou University of Technology: Lanzhou, China, 2018. [Google Scholar]
- Hao, J.; Zhang, M.; Huang, X. Experimental Study on Influences of Surface Materials on Cavitation Flow Around Hydrofoils. Chin. J. Mech. Eng. 2019, 32, 45. [Google Scholar] [CrossRef] [Green Version]
- Hao, J.F.; Zhang, M.D.; Fu, X.N. Experimental study on the influence of coating on the kinematic and dynamic characteristics of cloud-like cavitation around hydrofoil. J. Mech. Eng. 2018, 54, 170–179. [Google Scholar] [CrossRef]
- Mousmoulis, G.; Karlsen-Davies, N.; Aggidis, G.; Anagnostopoulos, I.; Papantonis, D. Experimental analysis of cavitation in a centrifugal pump using acoustic emission, vibration measurements and flow visualization. Eur. J. Mech. B/Fluids 2019, 75, 300–311. [Google Scholar] [CrossRef] [Green Version]
- Yan, H.; Liu, M.Q.; Liang, X.; Lin, P. Numerical simulation of cavitation characteristics of large axial flow pump. J. Xi’an Jiaotong Univ. 2014, 48, 44–50. [Google Scholar]
- Tao, R.; Xiao, R.; Wang, F.; Liu, W. Cavitation Behavior Study in the Pump Mode of a Reversible Pump-Turbine. Renew. Energy 2018, 125, 655–667. [Google Scholar] [CrossRef]
- Fu, X.L.; Zuo, Z.G.; Chang, H.; Li, D.; Wang, H.; Wei, X. Mechanism of low frequency high amplitude pressure fluctuation in a pump-turbine during the load rejection process. J. Hydraul. Res. 2021, 59, 280–297. [Google Scholar] [CrossRef]
- Kang, J.J.; Zhu, R.S.; Wang, X.L.; Liu, Y.; Zhong, W.Y.; Zhang, B.Y.; Qi, L.X. Influence of impeller geometry parameters on fracture cavitation performance of centrifugal pump. J. Drain. Irrig. Mach. Eng. 2018, 36, 111–117. [Google Scholar]
- Tao, R.; Xiao, R.F.; Wang, Z.W. Influence of Blade Leading-Edge Shape on Cavitation in a Centrifugal Pump Impeller. Energies 2018, 11, 2588. [Google Scholar] [CrossRef]
- Shi, W.D.; Wu, S.Q.; Zhang, D.S.; Yao, J.; Zhang, G.J. Influence of blade number on cavitation characteristics of axial flow pump with high specific ratio. Trans. Chin. Soc. Agric. Mach. 2013, 44, 72–77. [Google Scholar]
- Shojaeefard, M.H.; Hosseini, S.E.; Zare, J. CFD simulation and Pareto-based multi-objective shape optimization of the centrifugal pump inducer applying GMDH neural network, modified NSGA-II, and TOPSIS. Struct. Multidiscip. Optim. 2019, 60, 1509–1525. [Google Scholar] [CrossRef]
- Azad, S.; Lotfi, H.; Riasi, A. The effects of viscoelastic fluid on the cavitation inception and development within a centrifugal pump: An experimental study. Int. Commun. Heat Mass Transf. 2019, 107, 106–113. [Google Scholar] [CrossRef]
- Li, D.; Song, Y.; Lin, S.; Wang, H.; Qin, Y.; Wei, X. Effect mechanism of cavitation on the hump characteristic of a pump-turbine. Renew. Energy 2021, 167, 369–383. [Google Scholar] [CrossRef]
- Zhang, J.Y.; Cai, S.J.; Zhu, H.W.; Yang, K.; Qiang, R. Numerical simulation of compressible flow field in three-stage spiral axial flow mixed pump. Trans. Chin. Soc. Agric. Mach. 2014, 45, 89–95. [Google Scholar]
- Zhang, X. Energy Conversioncharacteristics and Design Method of Stainless Steel Stamping Welding Centrifugal Pump; Jiangsu University: Zhenjiang, China, 2011. [Google Scholar]
- Zhang, X.; Wang, Y.; Xu, X.M.; Wang, H.Y. Energy conversion characteristics in impeller of low specific speed centrifugal pump. Trans. Chin. Soc. Agric. Mach. 2011, 42, 75–81. [Google Scholar]
- Cheng, X.R. Research on Energy Conversion Characteristics and Design Method in Spiral Centrifugal Pump; Lanzhou University of Technology: Lanzhou, China, 2014. [Google Scholar]
Figure 1.
The three-dimension model of multiphase pump.

Figure 2.
The grid division of calculated domains. (a) Inlet section; (b) Outlet section; (c) Impeller.
Figure 2.
The grid division of calculated domains. (a) Inlet section; (b) Outlet section; (c) Impeller.


Figure 3.
The validation of grid independence.

Figure 4.
The multiphase pump test system.

Figure 5.
The experimental and CFD flow fields.

Figure 6.
The cavitation characteristic curve.

Figure 7.
The division of impeller domain.

Figure 8.
Turbulent dissipation losses in each domain of the impeller.

Figure 9.
Friction loss within each domain.

Figure 10.
The distribution of loss within impeller.

Publisher’s Note: MDPI stays neutral with regard to jurisdictional claims in published maps and institutional affiliations. |
© 2021 by the authors. Licensee MDPI, Basel, Switzerland. This article is an open access article distributed under the terms and conditions of the Creative Commons Attribution (CC BY) license (https://creativecommons.org/licenses/by/4.0/).
Share and Cite
MDPI and ACS Style
Shi, J.; Tao, S.; Shi, G.; Song, W. Effect of Gas Volume Fraction on the Energy Loss Characteristics of Multiphase Pumps at Each Cavitation Stage. Water 2021, 13, 2293. https://doi.org/10.3390/w13162293
AMA Style
Shi J, Tao S, Shi G, Song W. Effect of Gas Volume Fraction on the Energy Loss Characteristics of Multiphase Pumps at Each Cavitation Stage. Water. 2021; 13(16):2293. https://doi.org/10.3390/w13162293
Chicago/Turabian StyleShi, Jianwei, Sijia Tao, Guangtai Shi, and Wenwu Song. 2021. "Effect of Gas Volume Fraction on the Energy Loss Characteristics of Multiphase Pumps at Each Cavitation Stage" Water 13, no. 16: 2293. https://doi.org/10.3390/w13162293
Note that from the first issue of 2016, this journal uses article numbers instead of page numbers. See further details here.