
Evaluation of By-Pass Fishway Operation for Attraction Efficiency Based on GPS Drifter Field Experiments


1
Department of Civil and Environmental Engineering, Hankyong National University, 327 Chungang-ro, Anseong 17579, Korea
2
Department of Environmental Engineering, Inje University, 197 Inje-ro, Gimhae 50834, Korea
3
Urban & Environment Research Division, 248 Yongji-ro, Changwon 51430, Korea
4
Department of Civil & Environmental Engineering, Myongji University, 116 Myongji-ro, Yongin-si 17058, Korea
*
Author to whom correspondence should be addressed.
Water 2021, 13(16), 2302; https://doi.org/10.3390/w13162302
Submission received: 14 July 2021
/
Revised: 18 August 2021
/
Accepted: 19 August 2021
/
Published: 22 August 2021
(This article belongs to the Section Hydraulics and Hydrodynamics)
Abstract
:The attraction efficiency of a by-pass fishway installed at Gangjeong-Goryeong Weir on the Nakdong River in South Korea was evaluated according to flow rate variation of the main channel. Optimal flow rate that achieved the maximum value of attraction efficiency at the fishway entrance was also determined. The weir can adjust the flow rate of the main channel and the fishway by operating sluice gates. The weighted usable area (WUA) calculated on the basis of habitat suitability criteria (HSC) for target species using River2D (a two-dimensional physical habitat model) was regarded as an indicator of attraction efficiency. The simulated velocity field by River2D was validated by virtue of measured data acquired from GPS drifter field experiments. Additionally, monthly fish monitoring data obtained with a fish trap served as supporting data to confirm the validity of the estimated attraction efficiency. The monitoring results revealed that the fishway attraction efficiency was the highest during the spawning season (from April to June). The target fish used the fishway most frequently in April. However, many other fish species used the fishway in June. Simulation results revealed that the flow rate of the main channel at the weir should be maintained at 190 m3/s in order to most effectively attract the target fish species into the fishway entrance. Managing the optimal flow rate by operating the sluice gate is especially important during the spawning season of the target fish to facilitate upstream and downstream migration.
1. Introduction
Riverine characteristics undergo drastic changes due to increasing number of multifunctional dams and weirs built for the purpose of managing water resources more efficiently. In particular, hydraulic structures can cause serious changes to the ecosystems around them [1,2,3,4,5]. In South Korea, 16 large-scale multi-functional weirs have been built as part of the Four Major Rivers Restoration Project. Such structures built across a river can cause diverse problems, including migration and population changes of fish species dwelling in the river, genetic fragmentation, and habitat condition alterations [6]. Such changes especially have adverse effects on local fishes migrating upstream or downstream during their spawning periods. Fishways are installed in the river-crossing structures to solve this problem.
Fishway is a generic term for fish passage structures or measures, such as by-pass channels or fish ladders. Fishways are constructed to enable the upstream migration of fish species and other aquatic animals. One of the most important factors to consider when installing a fishway is its efficiency in attracting upstream migrating fishes to its entrance. Fishway design and installation parameter are important because a fishway usually occupies less than 10% of the river width. Fish species dwelling in the remaining parts should be attracted to the fishway. The ability of a fishway to attract fish species of the river to its entrance is referred to as “attraction efficiency” [7]. The attraction efficiency can be enhanced by finding the optimal position for the fishway entrance. Ref. [8] have presented four criteria for selecting the optimal point for installing a fishway in a small or medium-size river: (1) farthest point toward upstream, (2) point near the thalweg, (3) point near the filament of primary velocity, (4) point with less erosion and deposition. They performed a two-dimensional numerical simulation to determine the points corresponding to the 3rd and 4th criteria. When evaluating attraction efficiency, focus should be on the hydraulic analysis of the areas near the fishway entrance rather than in the interior of the fishway. However, most existing hydraulic analyses performed regarding fishway research have been focused on the interior of fishway. Only a small number of studies such as [8,9] have analyzed the areas near the fishway.
The objective of this study was to examine the attraction efficiency of a by-pass fishway installed in Gangjeong-Goryeong Weir on the Nakdong River in South Korea according to flow rate variation. Another objective of the study was to determine the most advantageous flow rate that could enable the target fish species to find the fishway entrance. The Gangjeong-Goryeong Weir is a hybrid structure combining fixed and movable weirs with adjustable movable-weir flow, thus enabling an efficient management of the amount of water flowing into the by-pass fishway. As an indicator of the attraction efficiency, we selected weighted usable area (WUA) which was calculated based on habitat suitability criteria (HSC) for the target fish species using River2D, a two-dimensional physical habitat model. It was assumed that the higher the WUA value in the fishway entrance area, the higher the attraction efficiency. River2D was developed to calculate the ecological flow regime of a regulated river [10,11]. It was used by [9,12] to evaluate fishway’s attraction efficiency. Velocity field simulated by River2D was then validated by observational data obtained from GPS drifters. Additionally, monthly fish monitoring data obtained using a fish trap installed at the upstream end of the fishway were used as supporting data to confirm the validity of the estimated attraction efficiency.
2. Application of River2D Model
2.1. Outline of River2D
The hydrodynamic module of River2D is based on a two-dimensional depth-averaged finite element (FE) model [13]. This model can implement detailed spatial hydraulic analyses at microscopic level of habitat using the principles of conservation of water mass and the momentum along the x- and y-axes expressed by Equations (1)–(3), respectively, as governing equations.
Continuity Equation:
x-directional momentum equation:
y-directional momentum equation:
where , , H was the average water depth, and were average velocities in the x and y directions, respectively, g was gravitational acceleration, was water density, and were riverbed slopes in the and directions, respectively, and were friction slopes in the and directions, respectively, and , , , and were horizontal stress factors [14]. The parameters of River2D are coefficients of roughness (or roughness height) and viscosity.
River2D consists of three modules: River2D_Bed, River2D_Mesh, and River2D_Habitat. River2D_Bed module is a program for entering data from text-edited topographic files necessary for running River2D. Data in topographic files are entered so that FE mesh could be created in the River2D_Mesh module wherein information about nodes and elements created in the River2D_Bed model can be read. FE mesh consists of nodes and elements (triangular or rectangular). It can be regarded as the surface of study site.
The suitability of the fish habitat, computed by River2D simulation, is estimated on the basis of WUA employed in the PHABSIM. WUA serves as an index of net suitability for the given sections according to the life stage and habitat characteristics of the target fish species. Likewise, the larger the WUA, the larger the habitat and activity area of the target fish species. WUA is obtained using the composite suitability index (CSI, ), which is calculated by combining the habitat suitability indices (HSIs) for velocity, depth, and channel. Of the applicable calculation methods using multiplication, geometric mean, or minimum value, the multiplicative method means that it exists only in the optimal state (index = 1.0). In this study, the CSI was obtained with the multiplicative method as per the following equation.
Here, , , and denote velocity, depth, and channel indices, respectively. River2D model computes the WUA for each cell by calculating one depth and two velocity values and converting them into values matching the input CSI. That is, the WUA is obtained by multiplying the cell area () by the CSI () as per the following equation.
Here, denotes the area of cell and denotes the CSI of cell [14].
In this equation, the CSI () is the product of the HSIs of the variables for instream conditions (water depth, flow velocity, and channel substrate).
2.2. Study Area
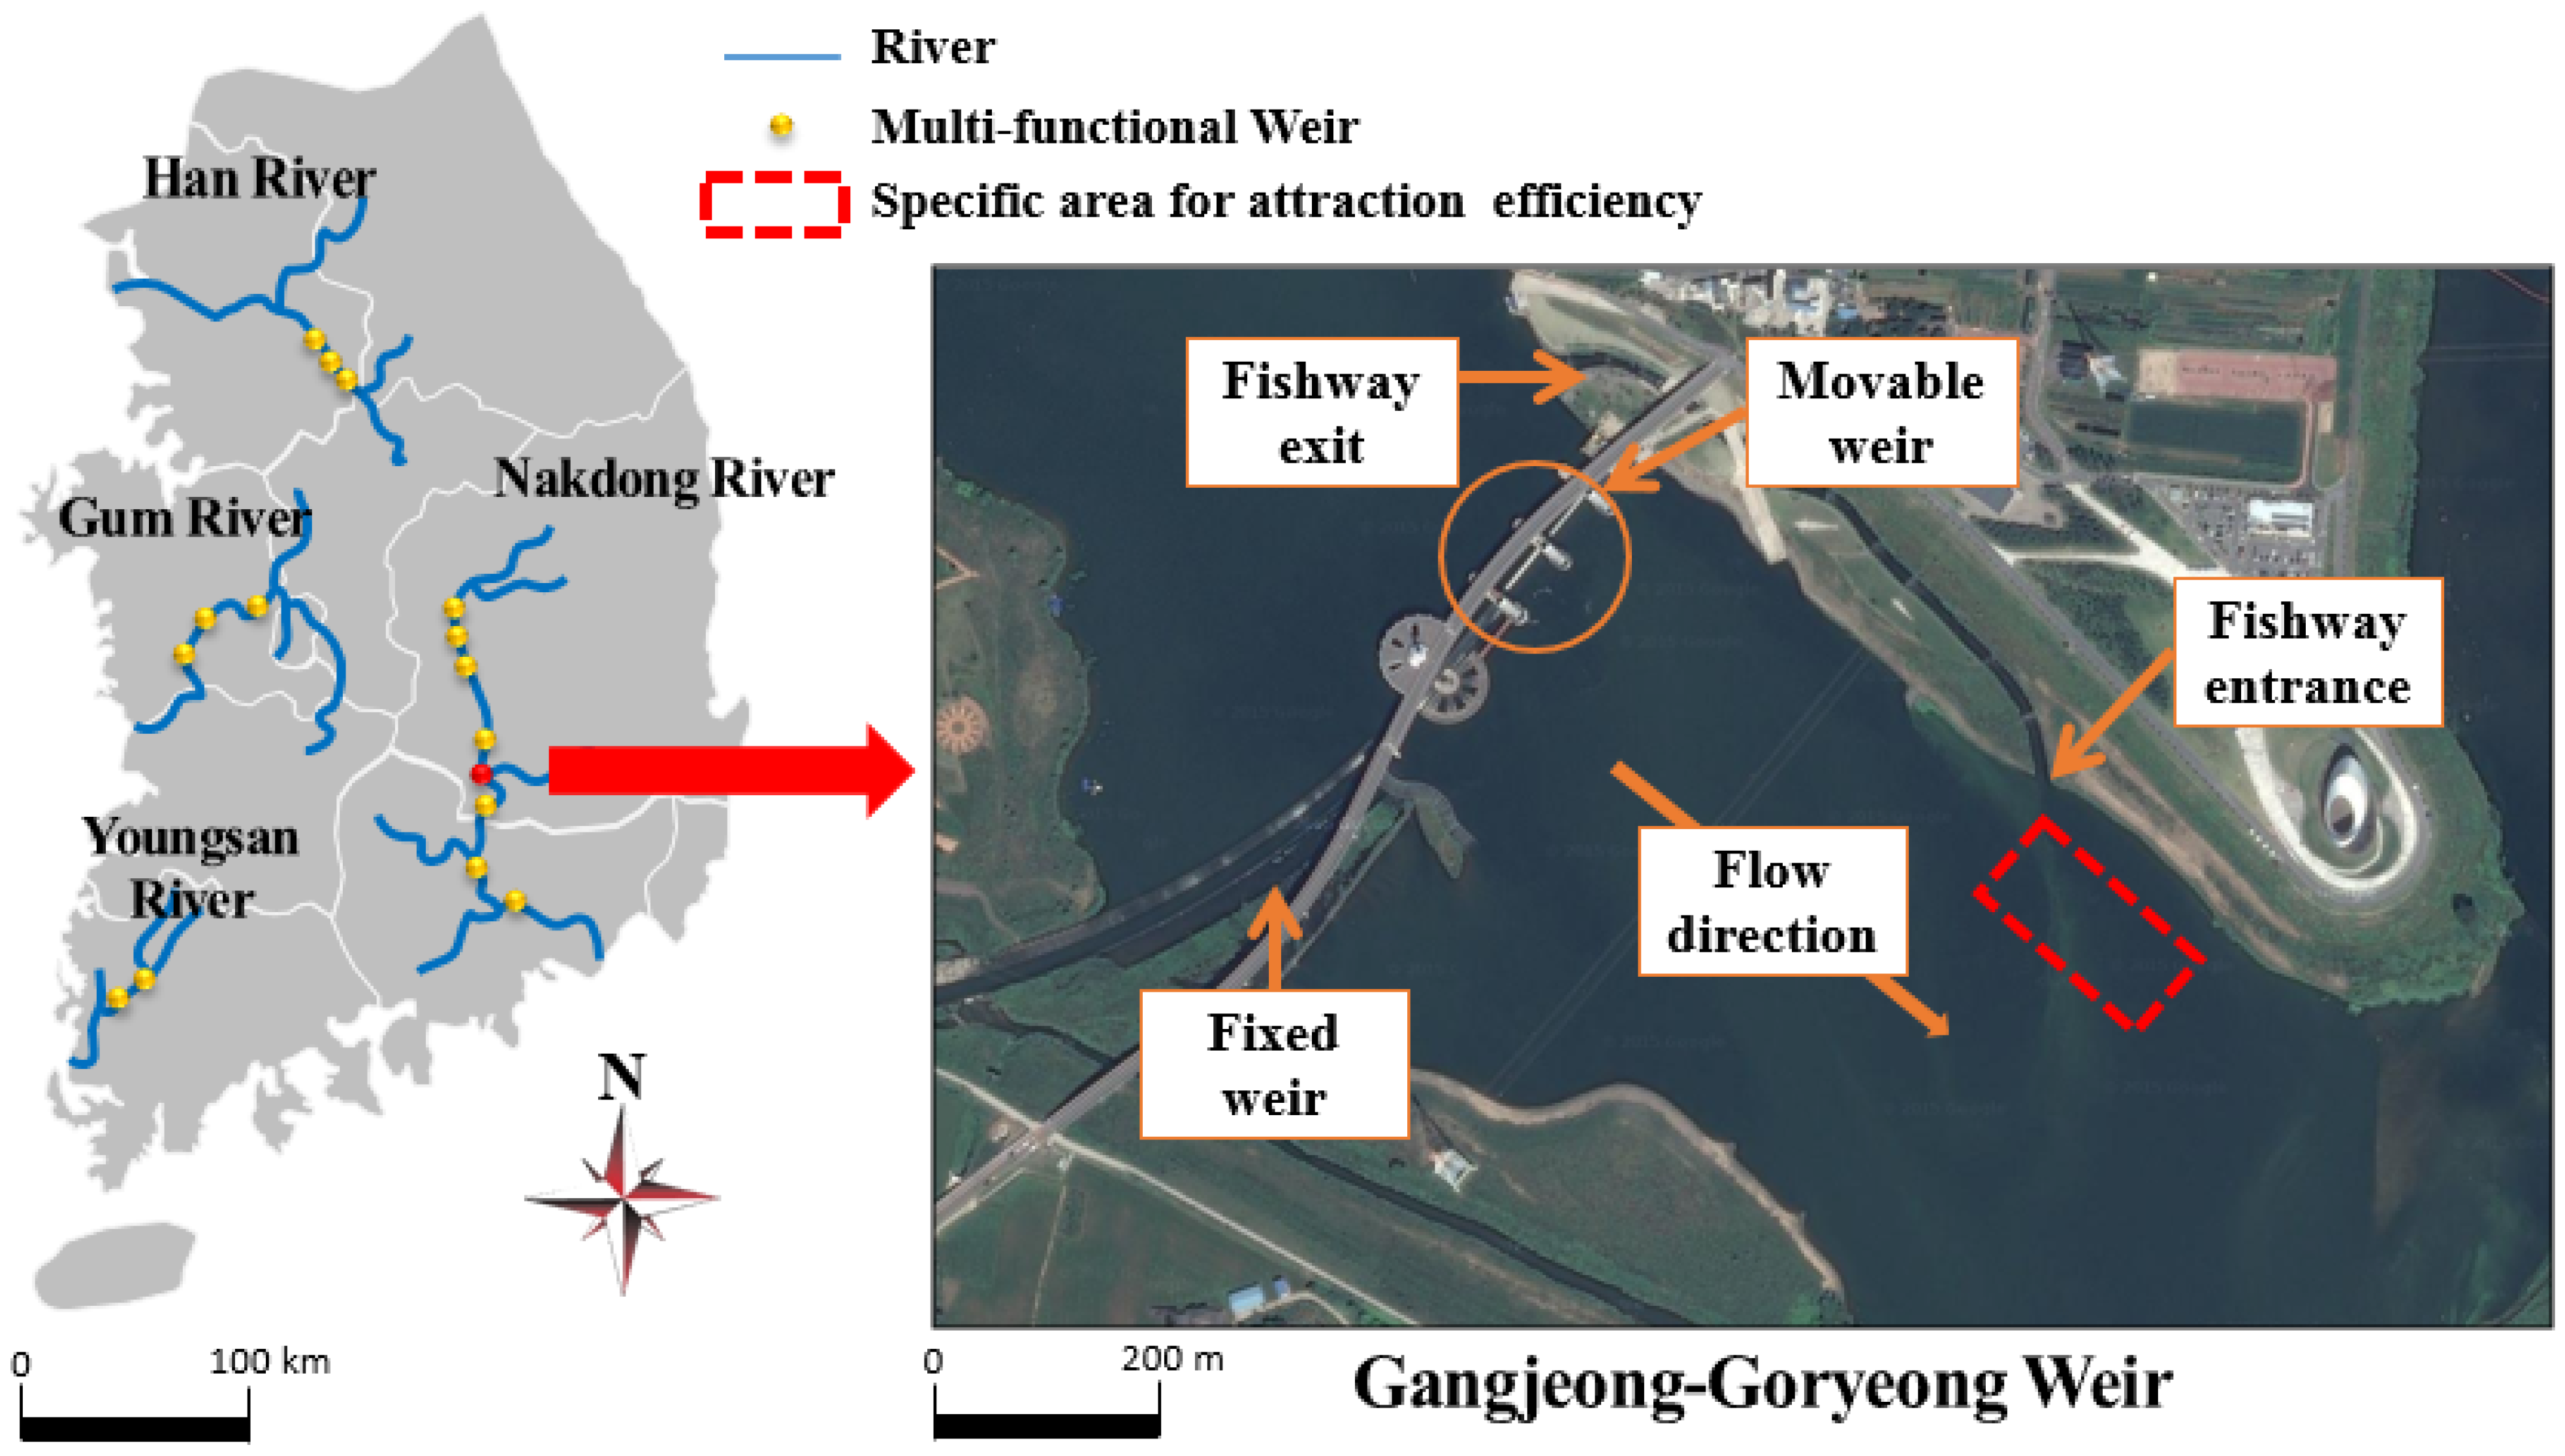
The Gangjeong-Goryeong Weir selected as the study site is located on the Nakdong River in South Korea. As seen in Figure 1, it has two fishways: an ice harbor fishway and a by-pass fishway on the right and left banks, respectively. The Gangjeong-Goryeong Weir has a hybrid structure comprising a fixed weir (833.5 m) and a movable weir (120 m) with a total length of 953.5 m. The by-pass fishway is 520 m long and 12 m wide. The gradient of upstream and downstream slope is 1:100. The flow rates of both the main channel and the fishway were adjusted by sluice gates of movable weir at the Gangjeong-Goryeong Weir.
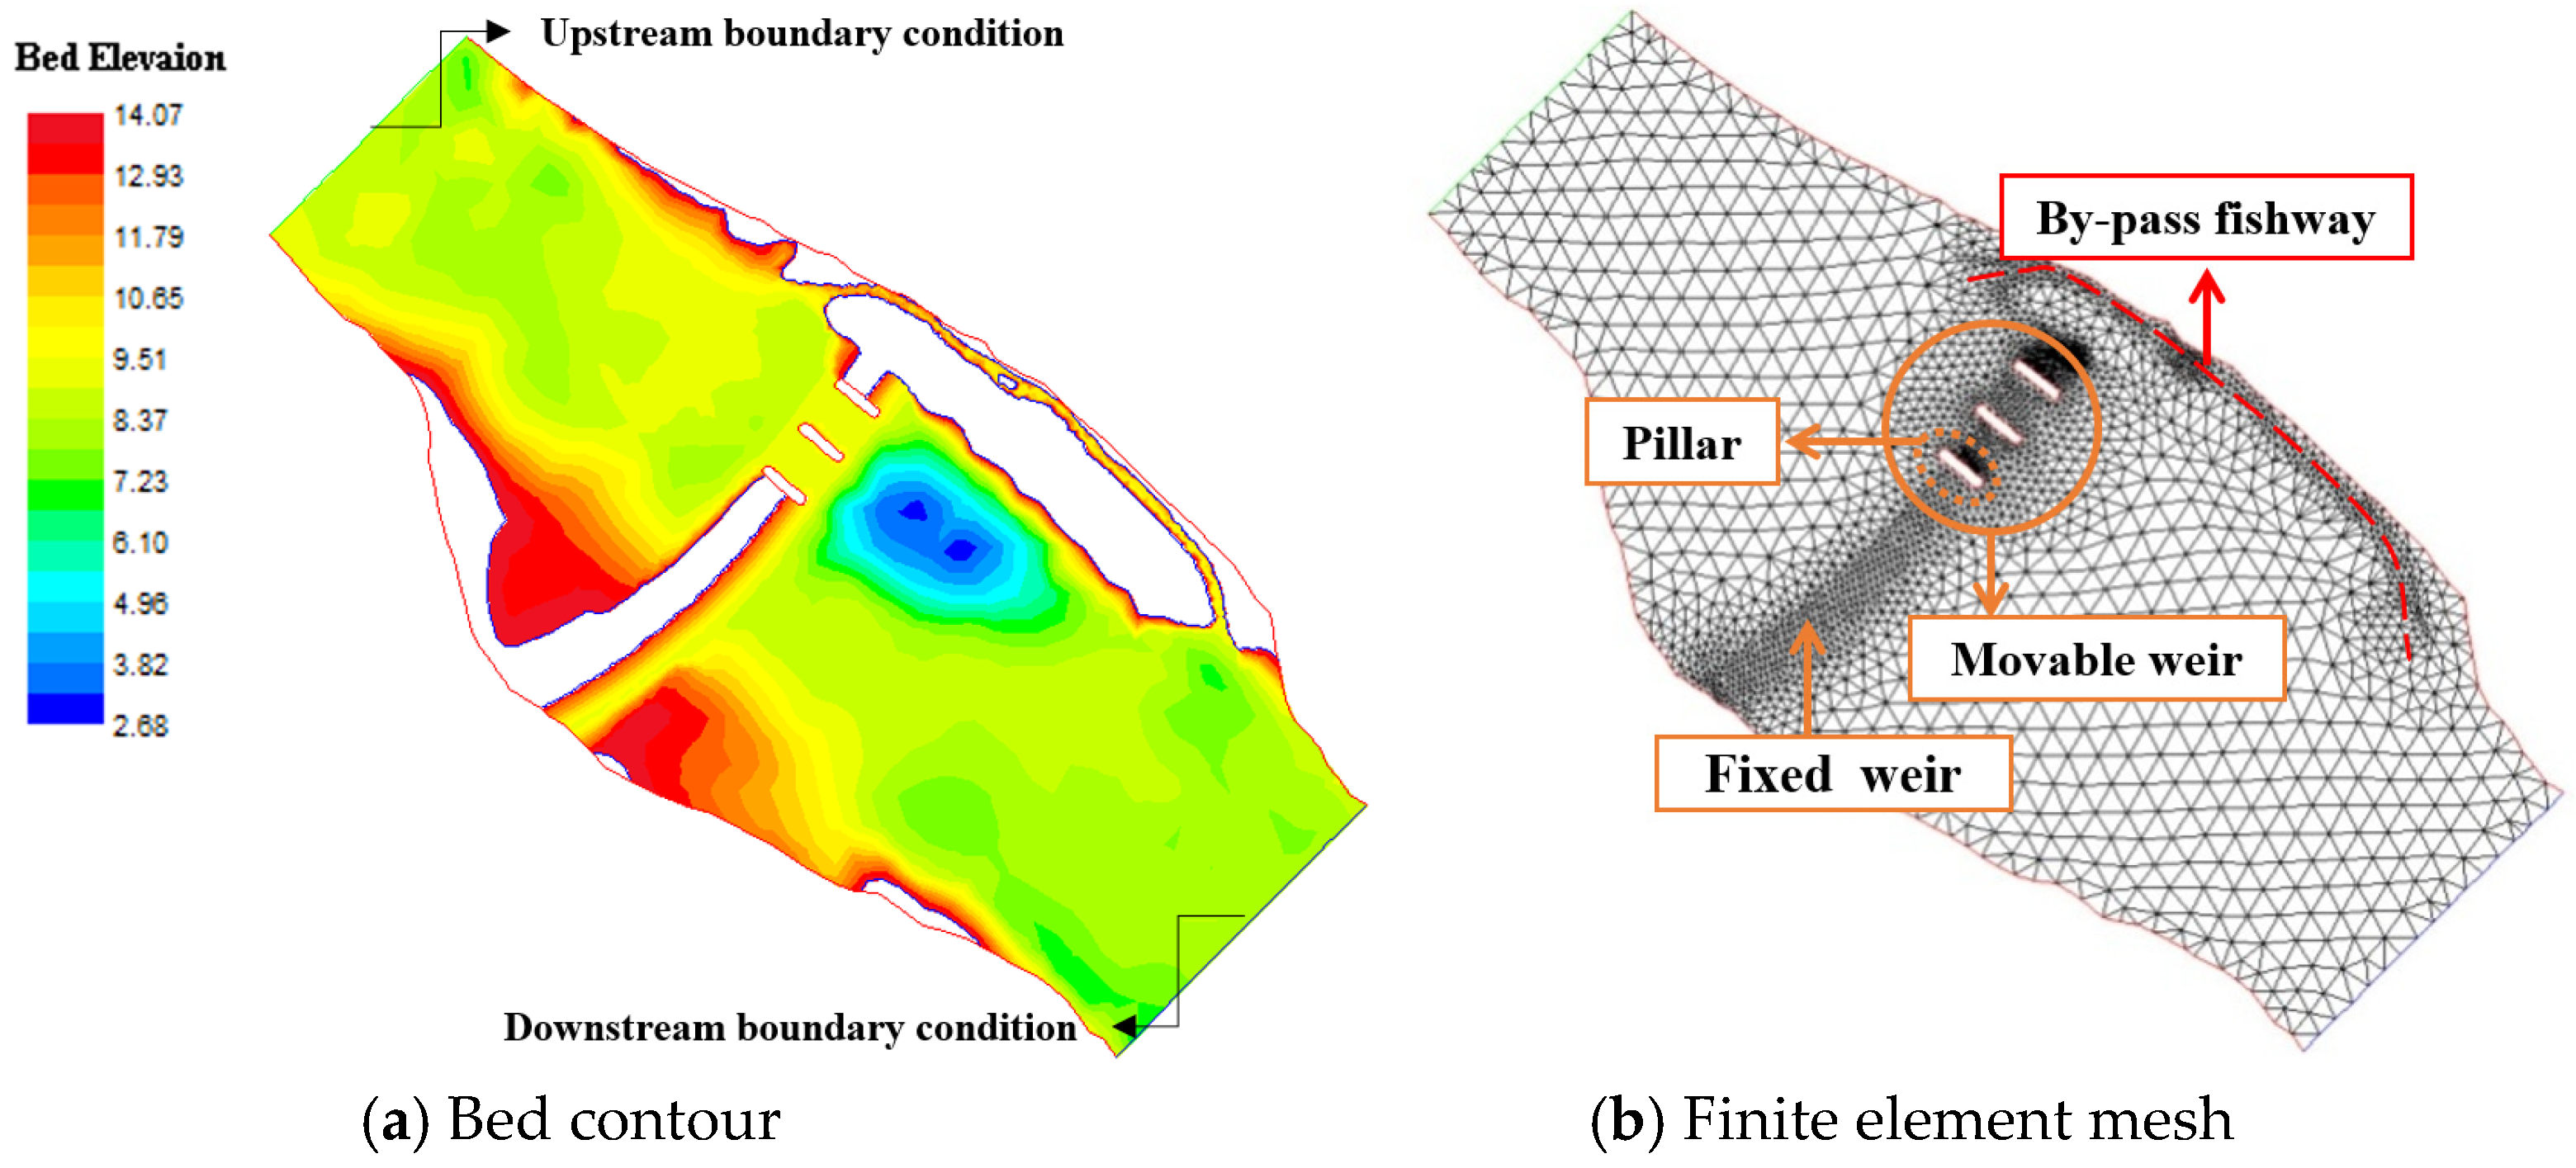
The in situ observational data obtained in 2013 were used to constitute the flow rate conditions for simulation to allow attraction efficiency analysis. Specifically, the flow rate and water level of the Gangjeong-Goryeong Weir were monitored on an hourly basis in 2013 and used for calculating the mode of each month which served as the representative value for that month. The boundary conditions (flow rate at the upstream and water level of the downstream section) of each month used for the simulation are outlined in Table 1. The reason that the downstream boundary condition is the same at 14.1 m is because the water gate of the entire multi-function weir of the Nakdong River is adjusted to keep the management water level constant. For the parameters of the River2D module, a roughness coefficient of 0.023 was used based on the study of [9]. According to the values in the table, the upstream and downstream sections of the Gangjeong-Goryeong Weir and the by-pass fishway were set as domains for River2D application. Topography files comprising nodes and elements were created using topographic and numerical maps of the surrounding areas. FE mesh consisting of 2897 nodes and 5526 elements was set up in the River2D_Bed module from these topography files. The topographic data and FE mesh of the study site of the Gangjeong-Goryeong Weir are shown in Figure 2.
3. Field Survey
3.1. GPS Drifter Experiments
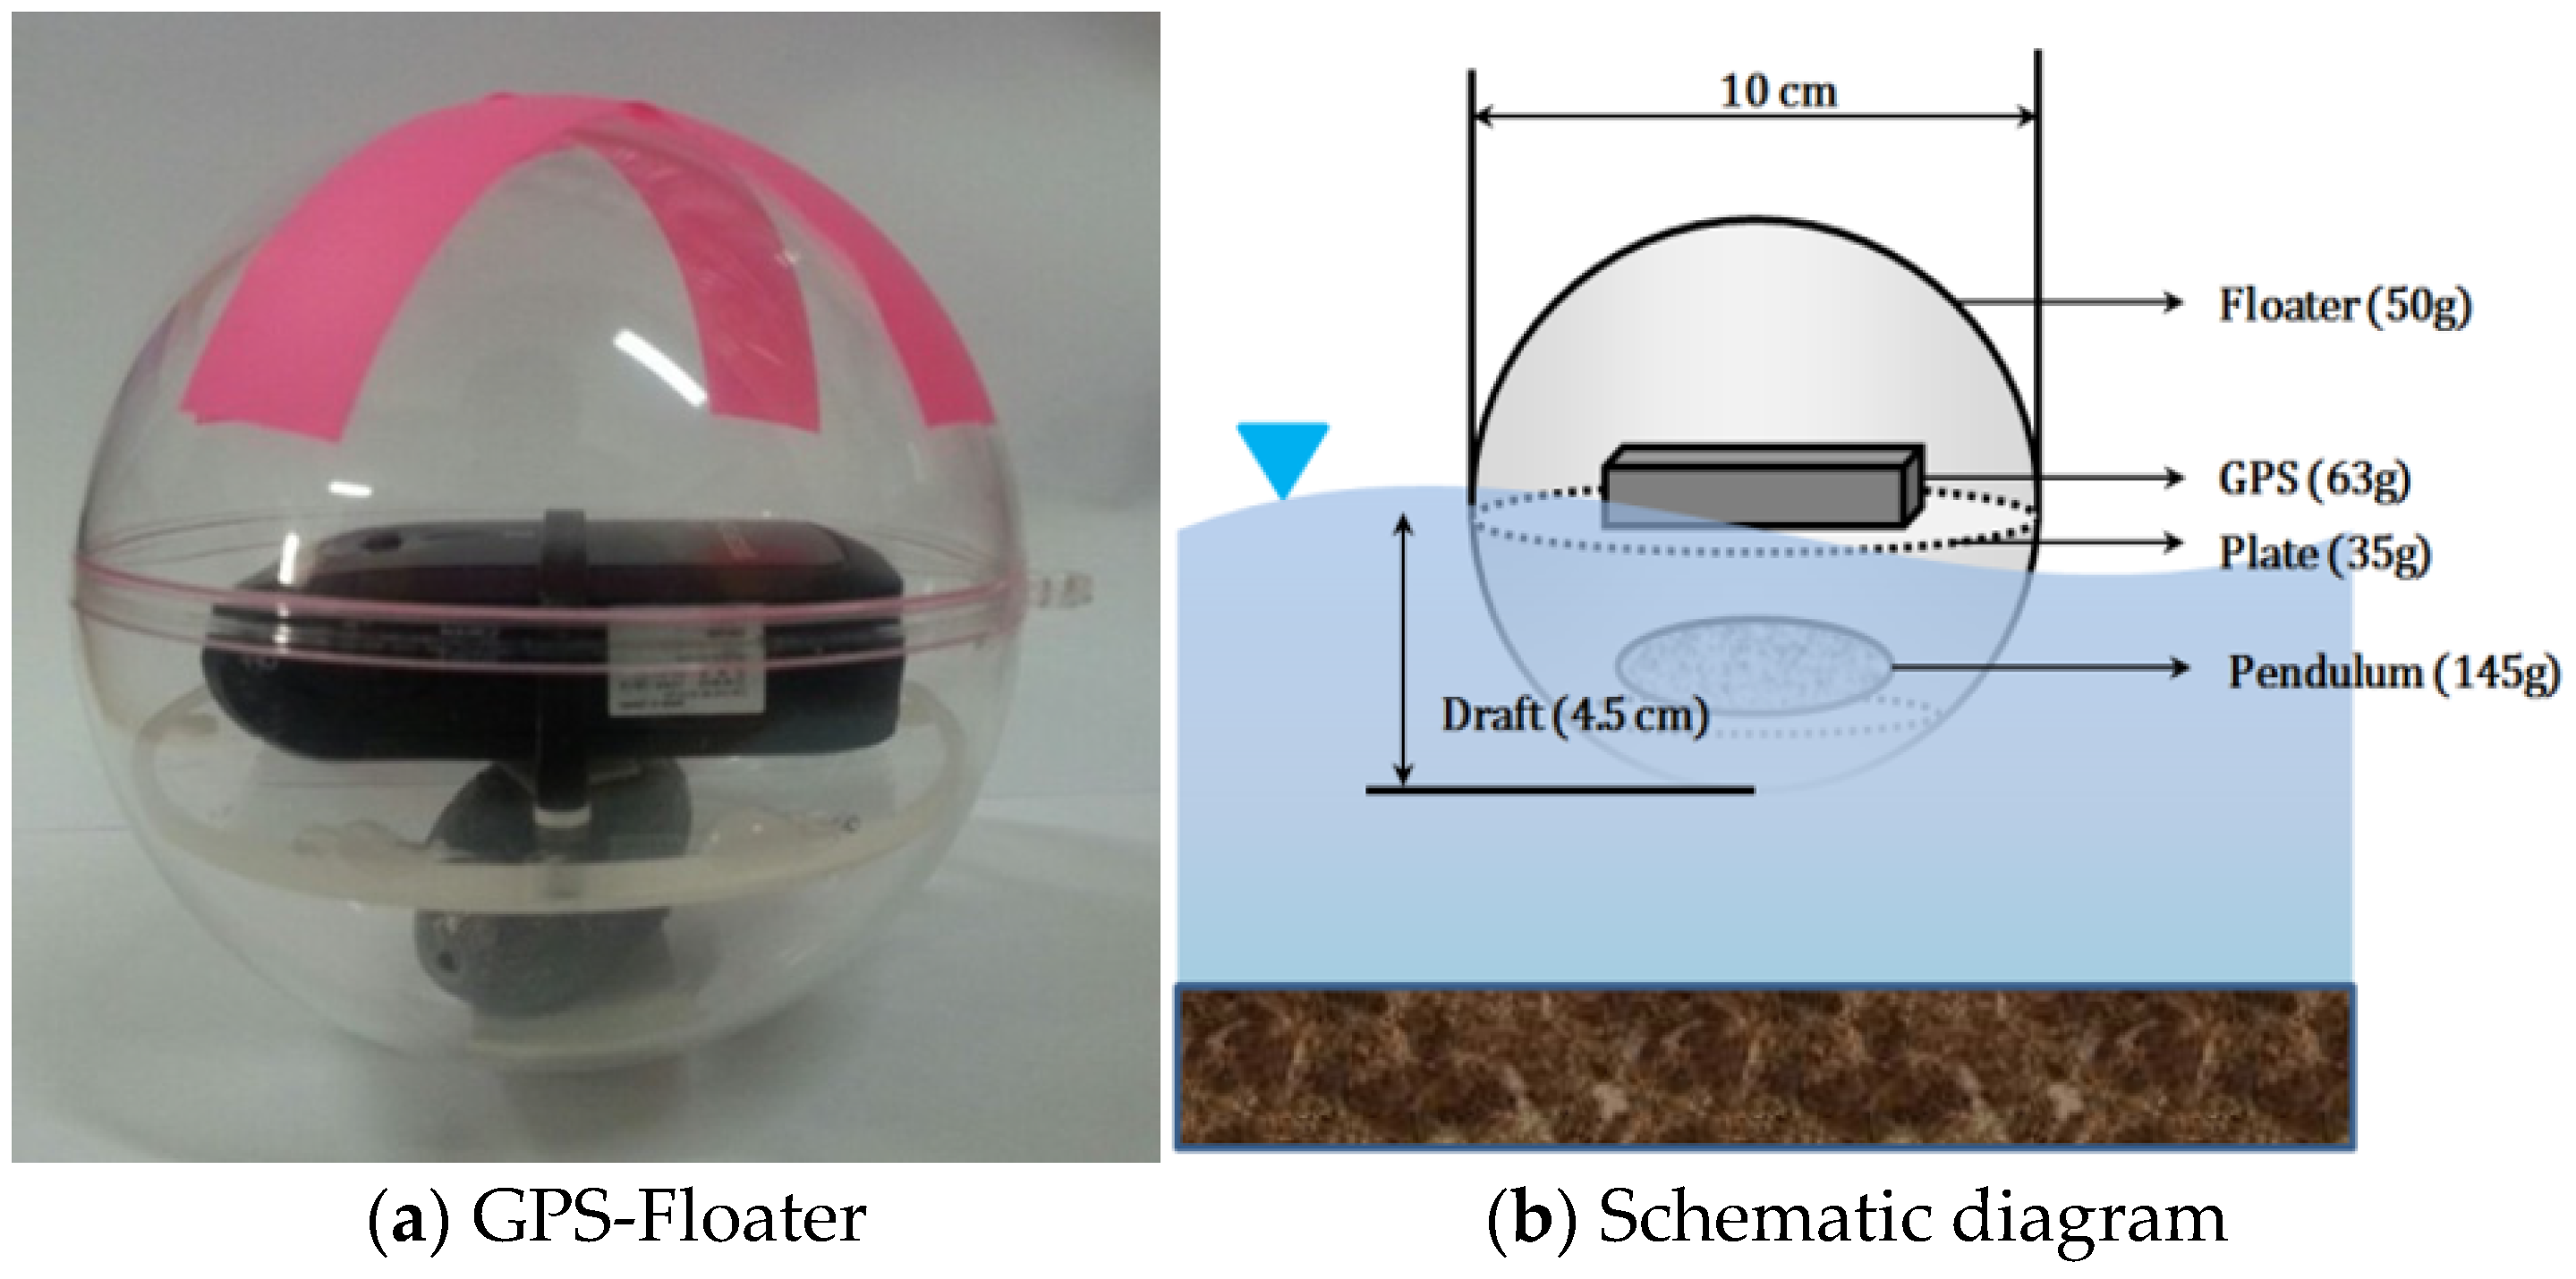
In this study, the velocity field in the area around the by-pass fishway entrance was estimated using GPS drifter tracking instead of velocity meter for precise measurement because it was difficult to access the fishway entrance area (shown in Figure 1). Moreover, it was necessary to find out the extent of the section to which fish were attracted by the attraction flow with slower stream current compared to the velocity within the fishway. The Eulerian type measurement method using ADCP or ADV has limitations. The buoyancy method that measures the flow velocity using a GPS drifter is capable of long-term measurement of the Lagrangian type. In studies of Lagrangian type measurement using GPS drifter, there were measurement and analysis studies on the transport and diffusion of pollutants [15,16,17,18,19]. This required a Lagrangian view which was implemented by studying the dispersion of the GPS drifters injected from the upstream point of the fishway entrance. The GPS drifter was designed and manufactured taking account of draft, convenience, portability, and streamline as shown in Figure 3.
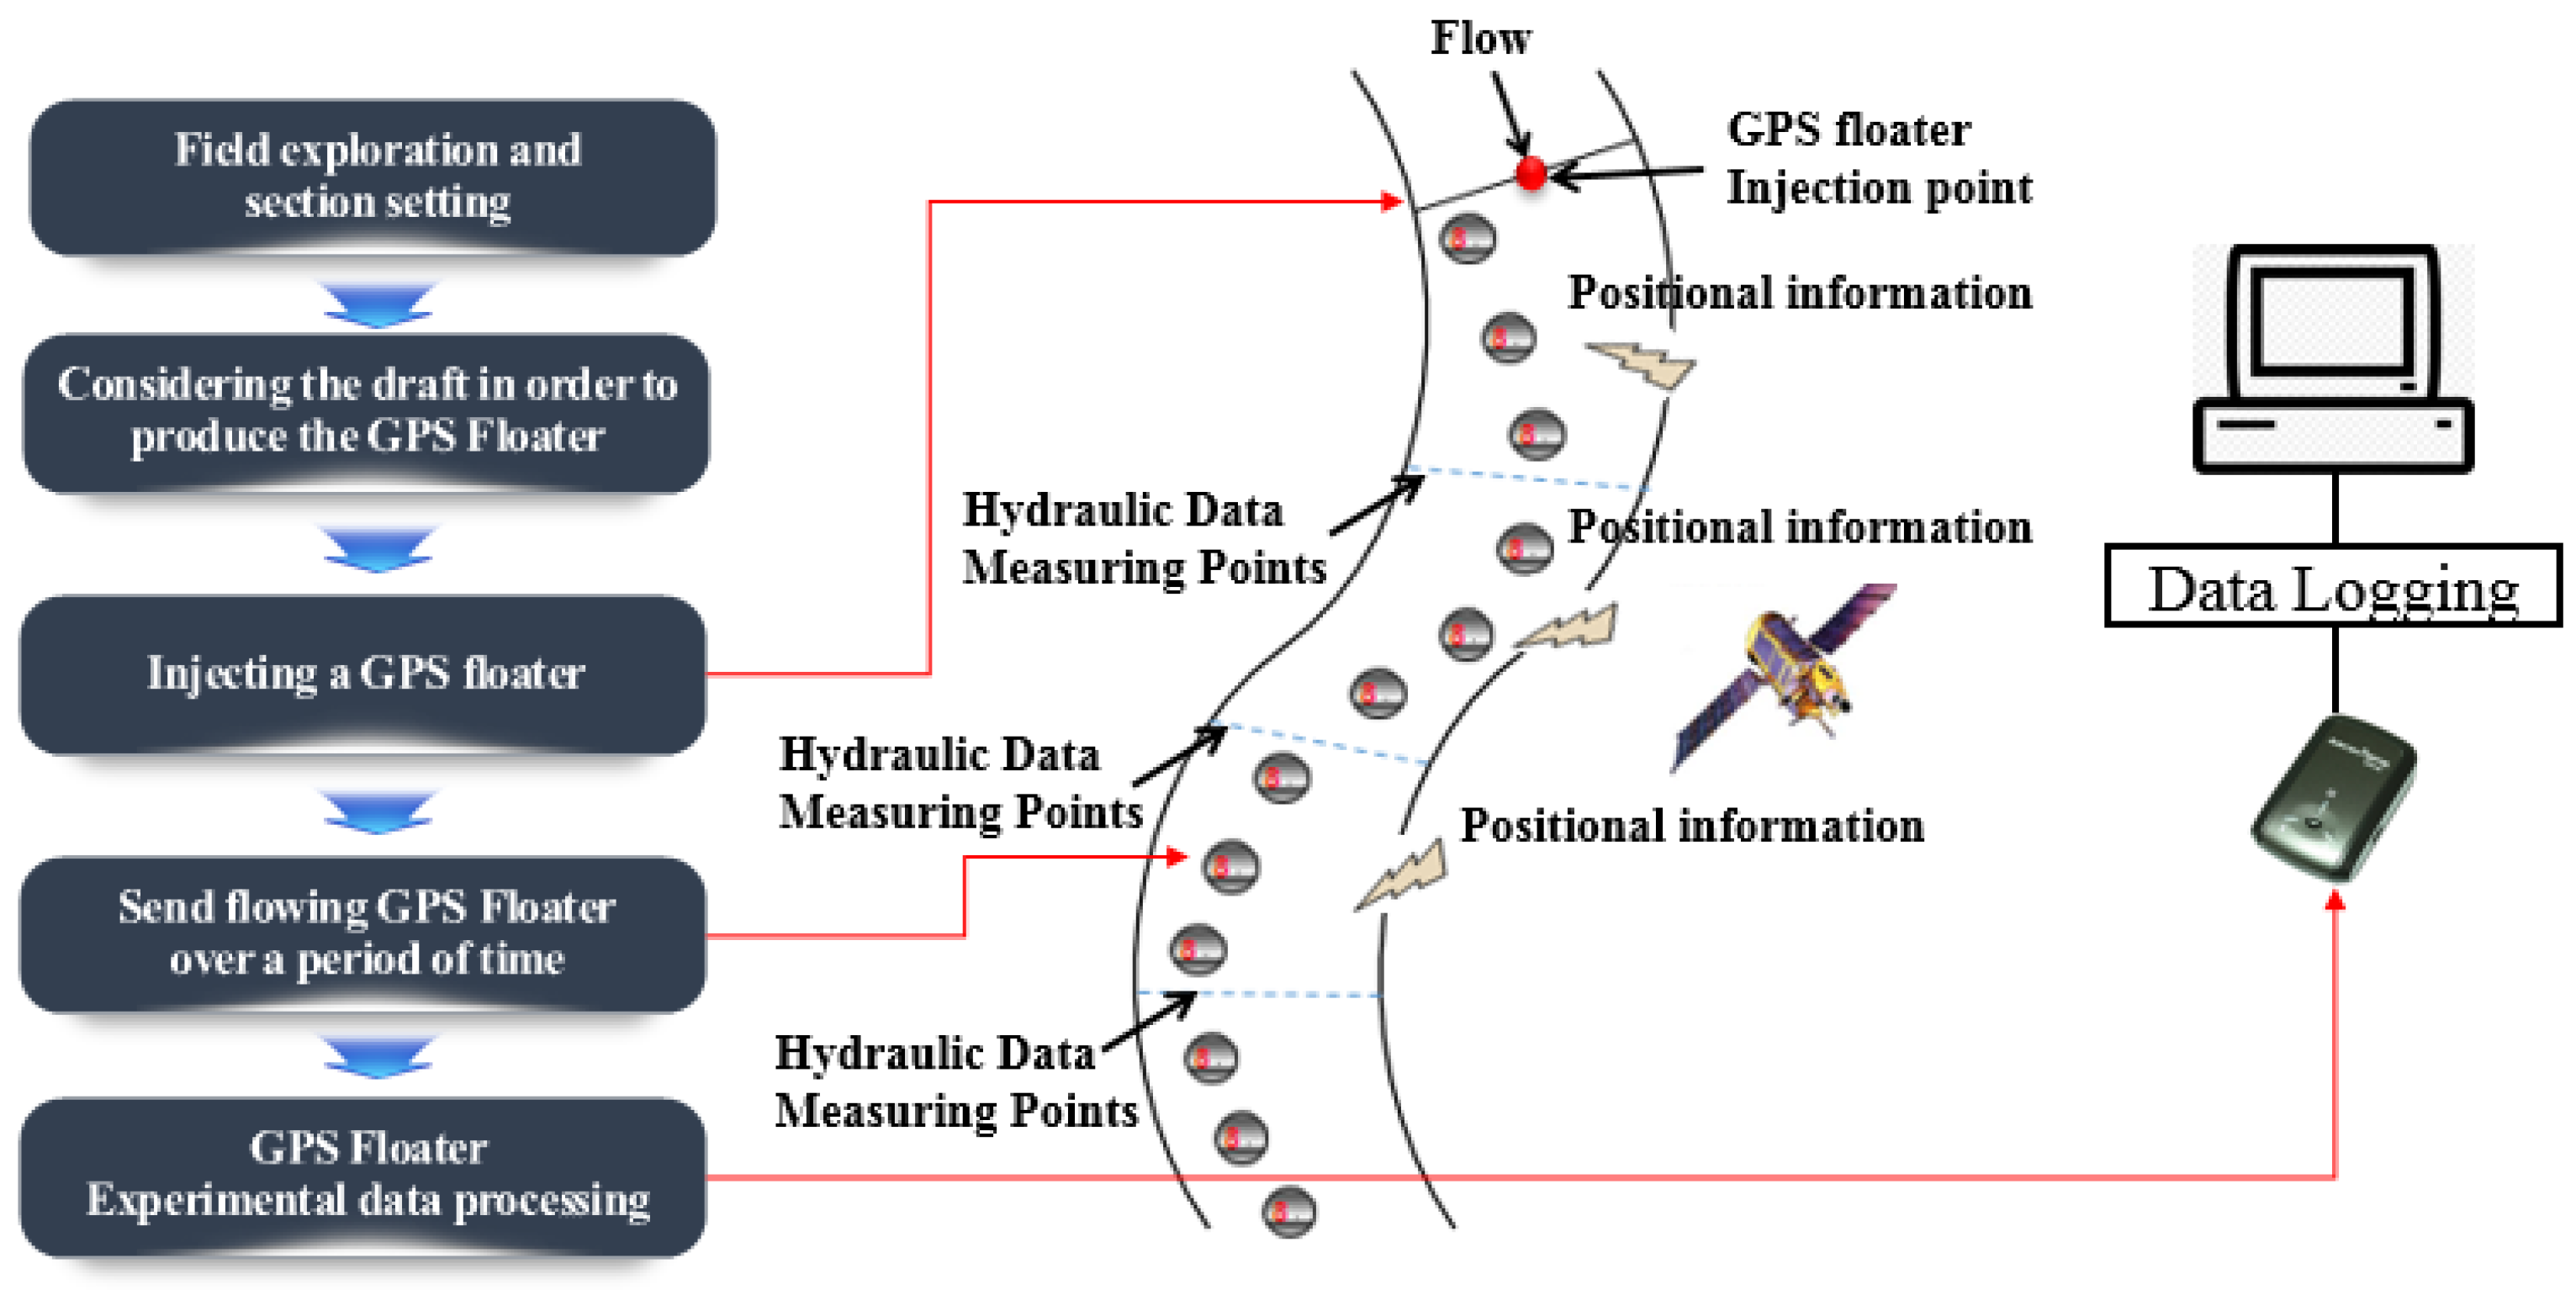
The flow velocity in the by-pass fishway entrance area was estimated by checking the records from 10 GPS drifters injected at the upstream point of the fishway entrance and collected in its downstream area as shown in Figure 4.
3.2. Verification of Flow Velocity
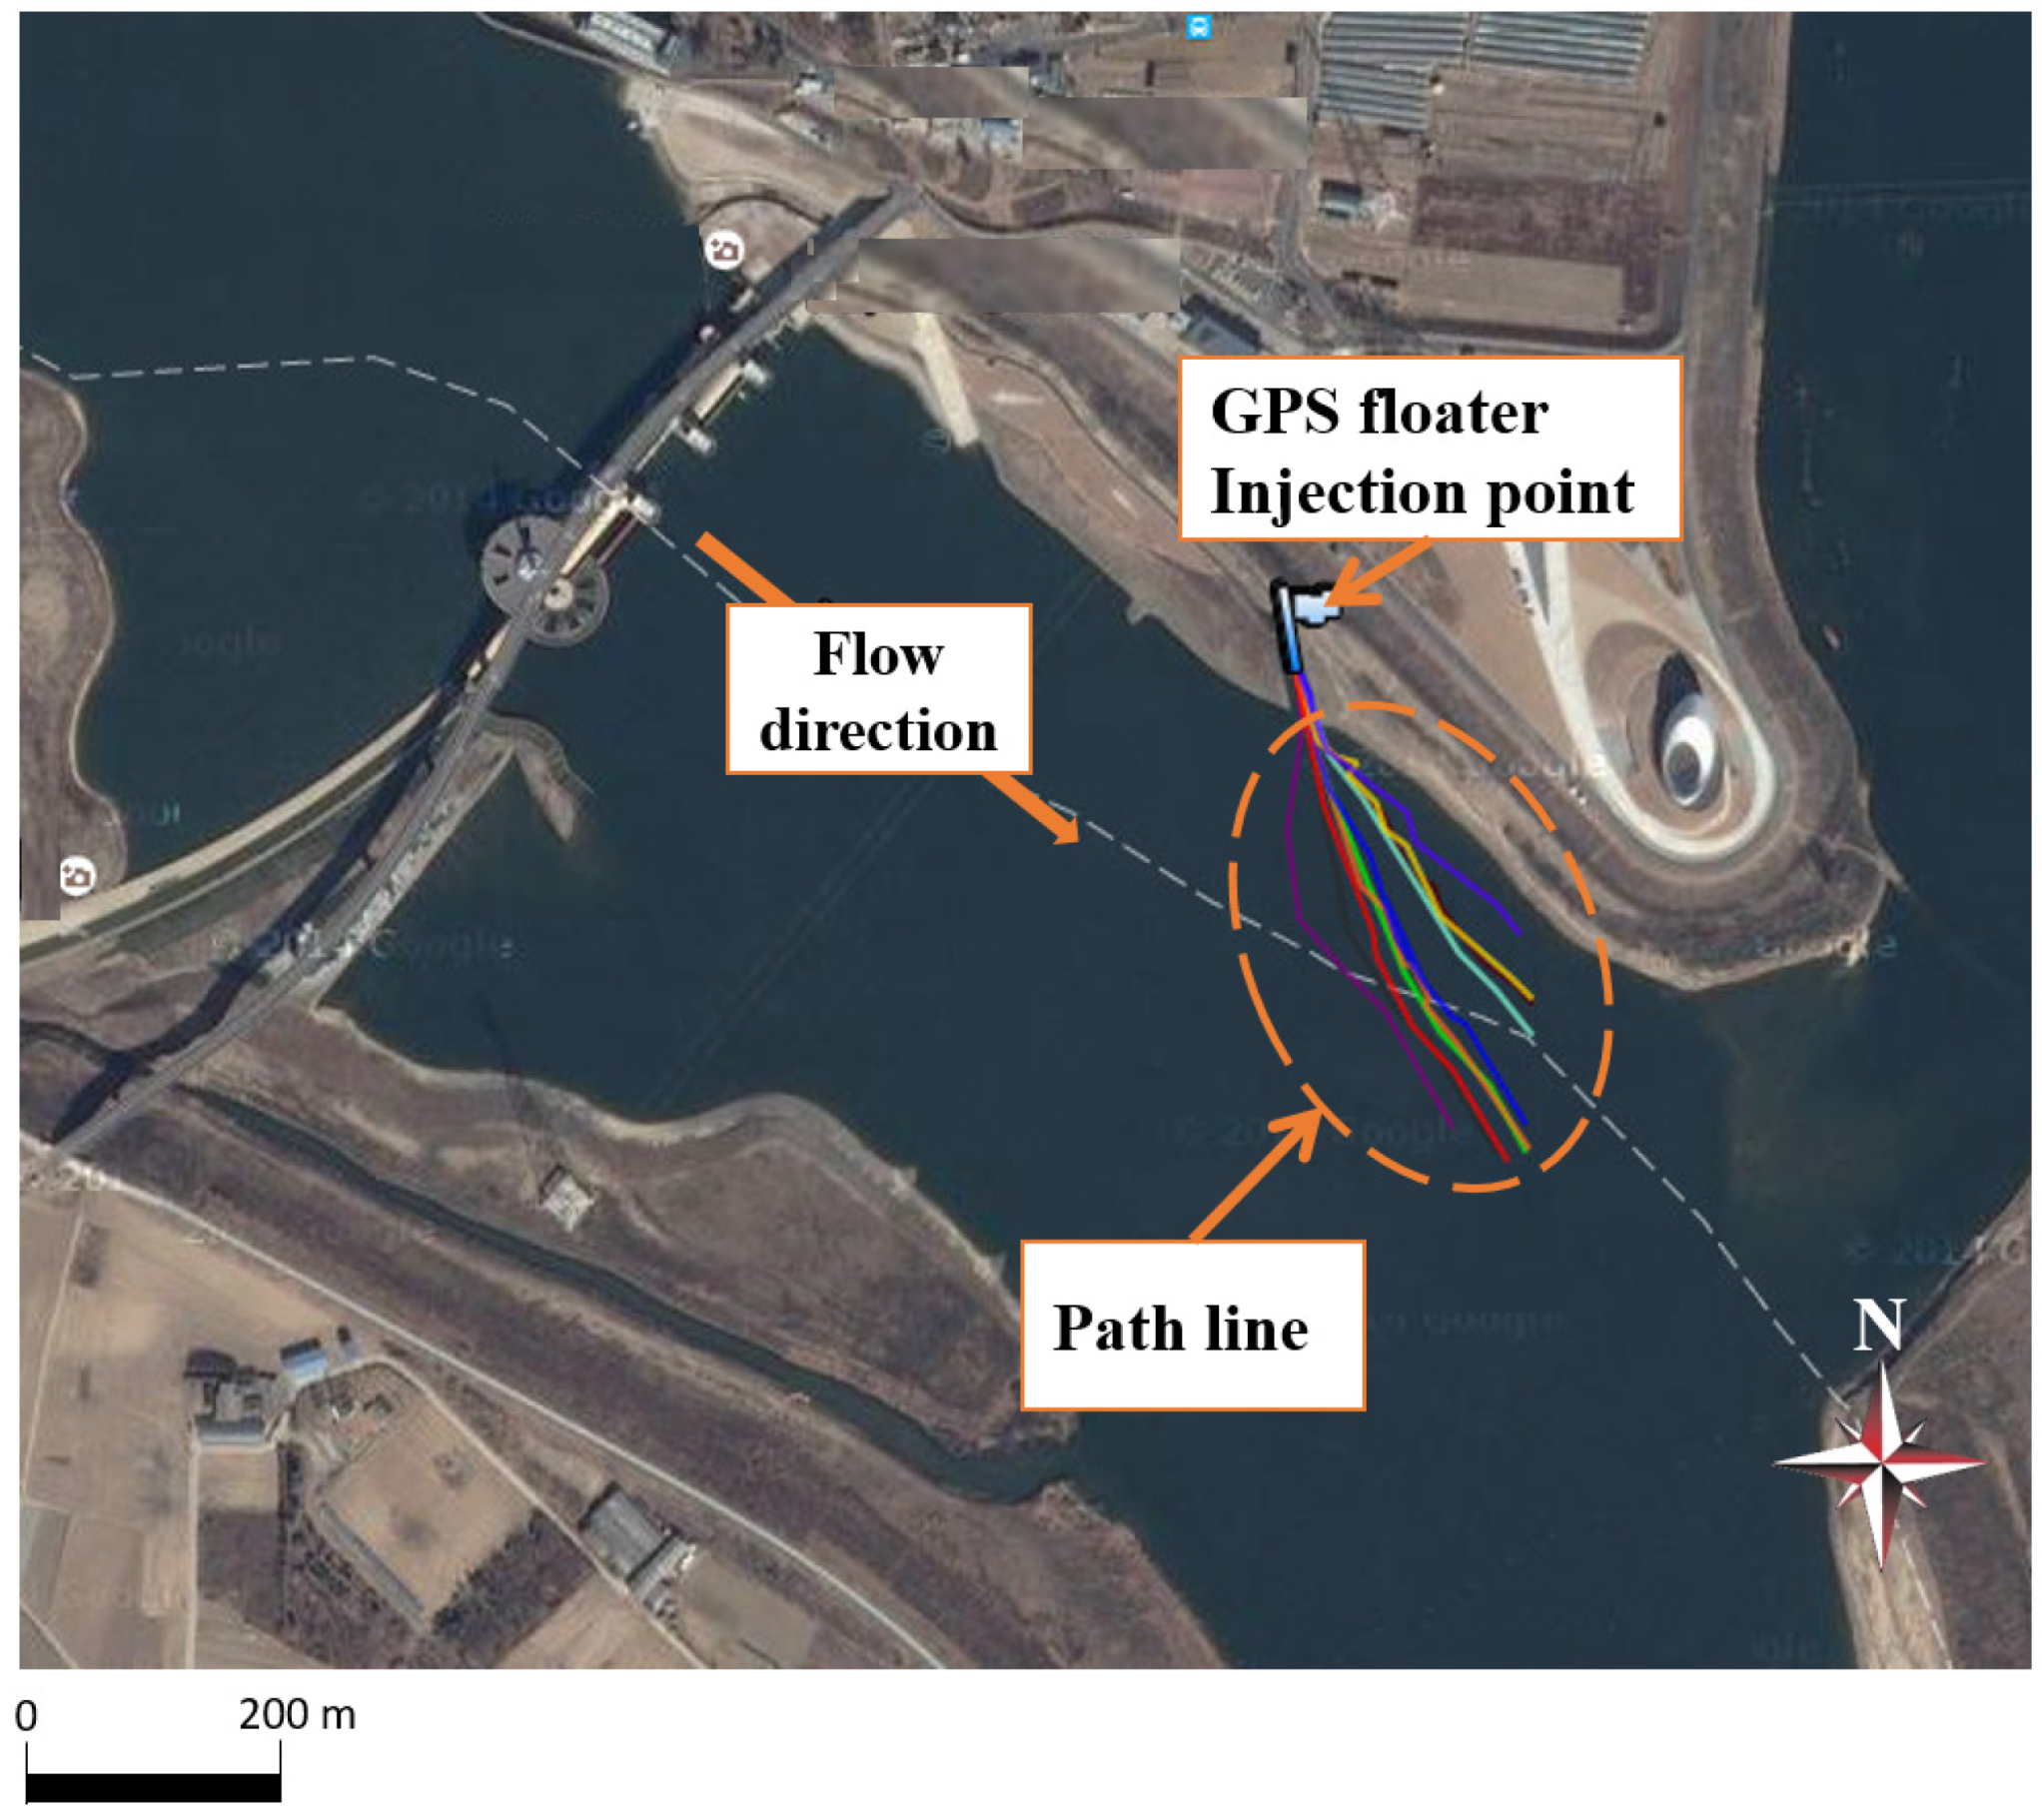
The simulated velocity field was validated by comparing the in situ observational results using the GPS drifters to the River2D output. The in situ experiment with GPS drifters was conducted in September. At that time, the water level was low due to low precipitation. Therefore, the movable weir of the Gangjeong-Goryeong Weir was closed and water was discharged only to the by-pass fishway. A graphic representation of the path lines of the GPS drifters descending from the upstream point of the fishway entrance is shown in Figure 5.
Excluding two GPS drifters with overlapping path lines, the average flow velocity of the remaining 8 GPS drifters in the pre-determined section (Track 1–Track 8; velocity range: 0.0563–0.0870 m/s) was calculated. Results are shown in Table 2. River2D simulation was run under the same conditions as those in the field experiment, i.e., water discharged into the by-pass fishway only without operating the movable wire. Results of comparison between the in situ experiment data and numerical simulation data under the same boundary conditions are shown in Figure 6. The coefficient of determination (R2) and the root-mean-square error (RMSE) were 0.9221 and 0.000026, respectively. Thus, results of River2D simulation demonstrated high reliability.
3.3. Fish Monitoring
A regular monitoring of fish species and individuals was conducted from March to October of 2013 at the by-pass fishway of the Gangjeong-Goryeong Weir. Regarding the experimental conditions, the monitoring interval was bi-weekly during the months from March to June and monthly from June to October. To monitor fish species, those migrating upstream were captured in a trap with a net spread over a stainless steel pipe placed at the fishway exit for 4 h.
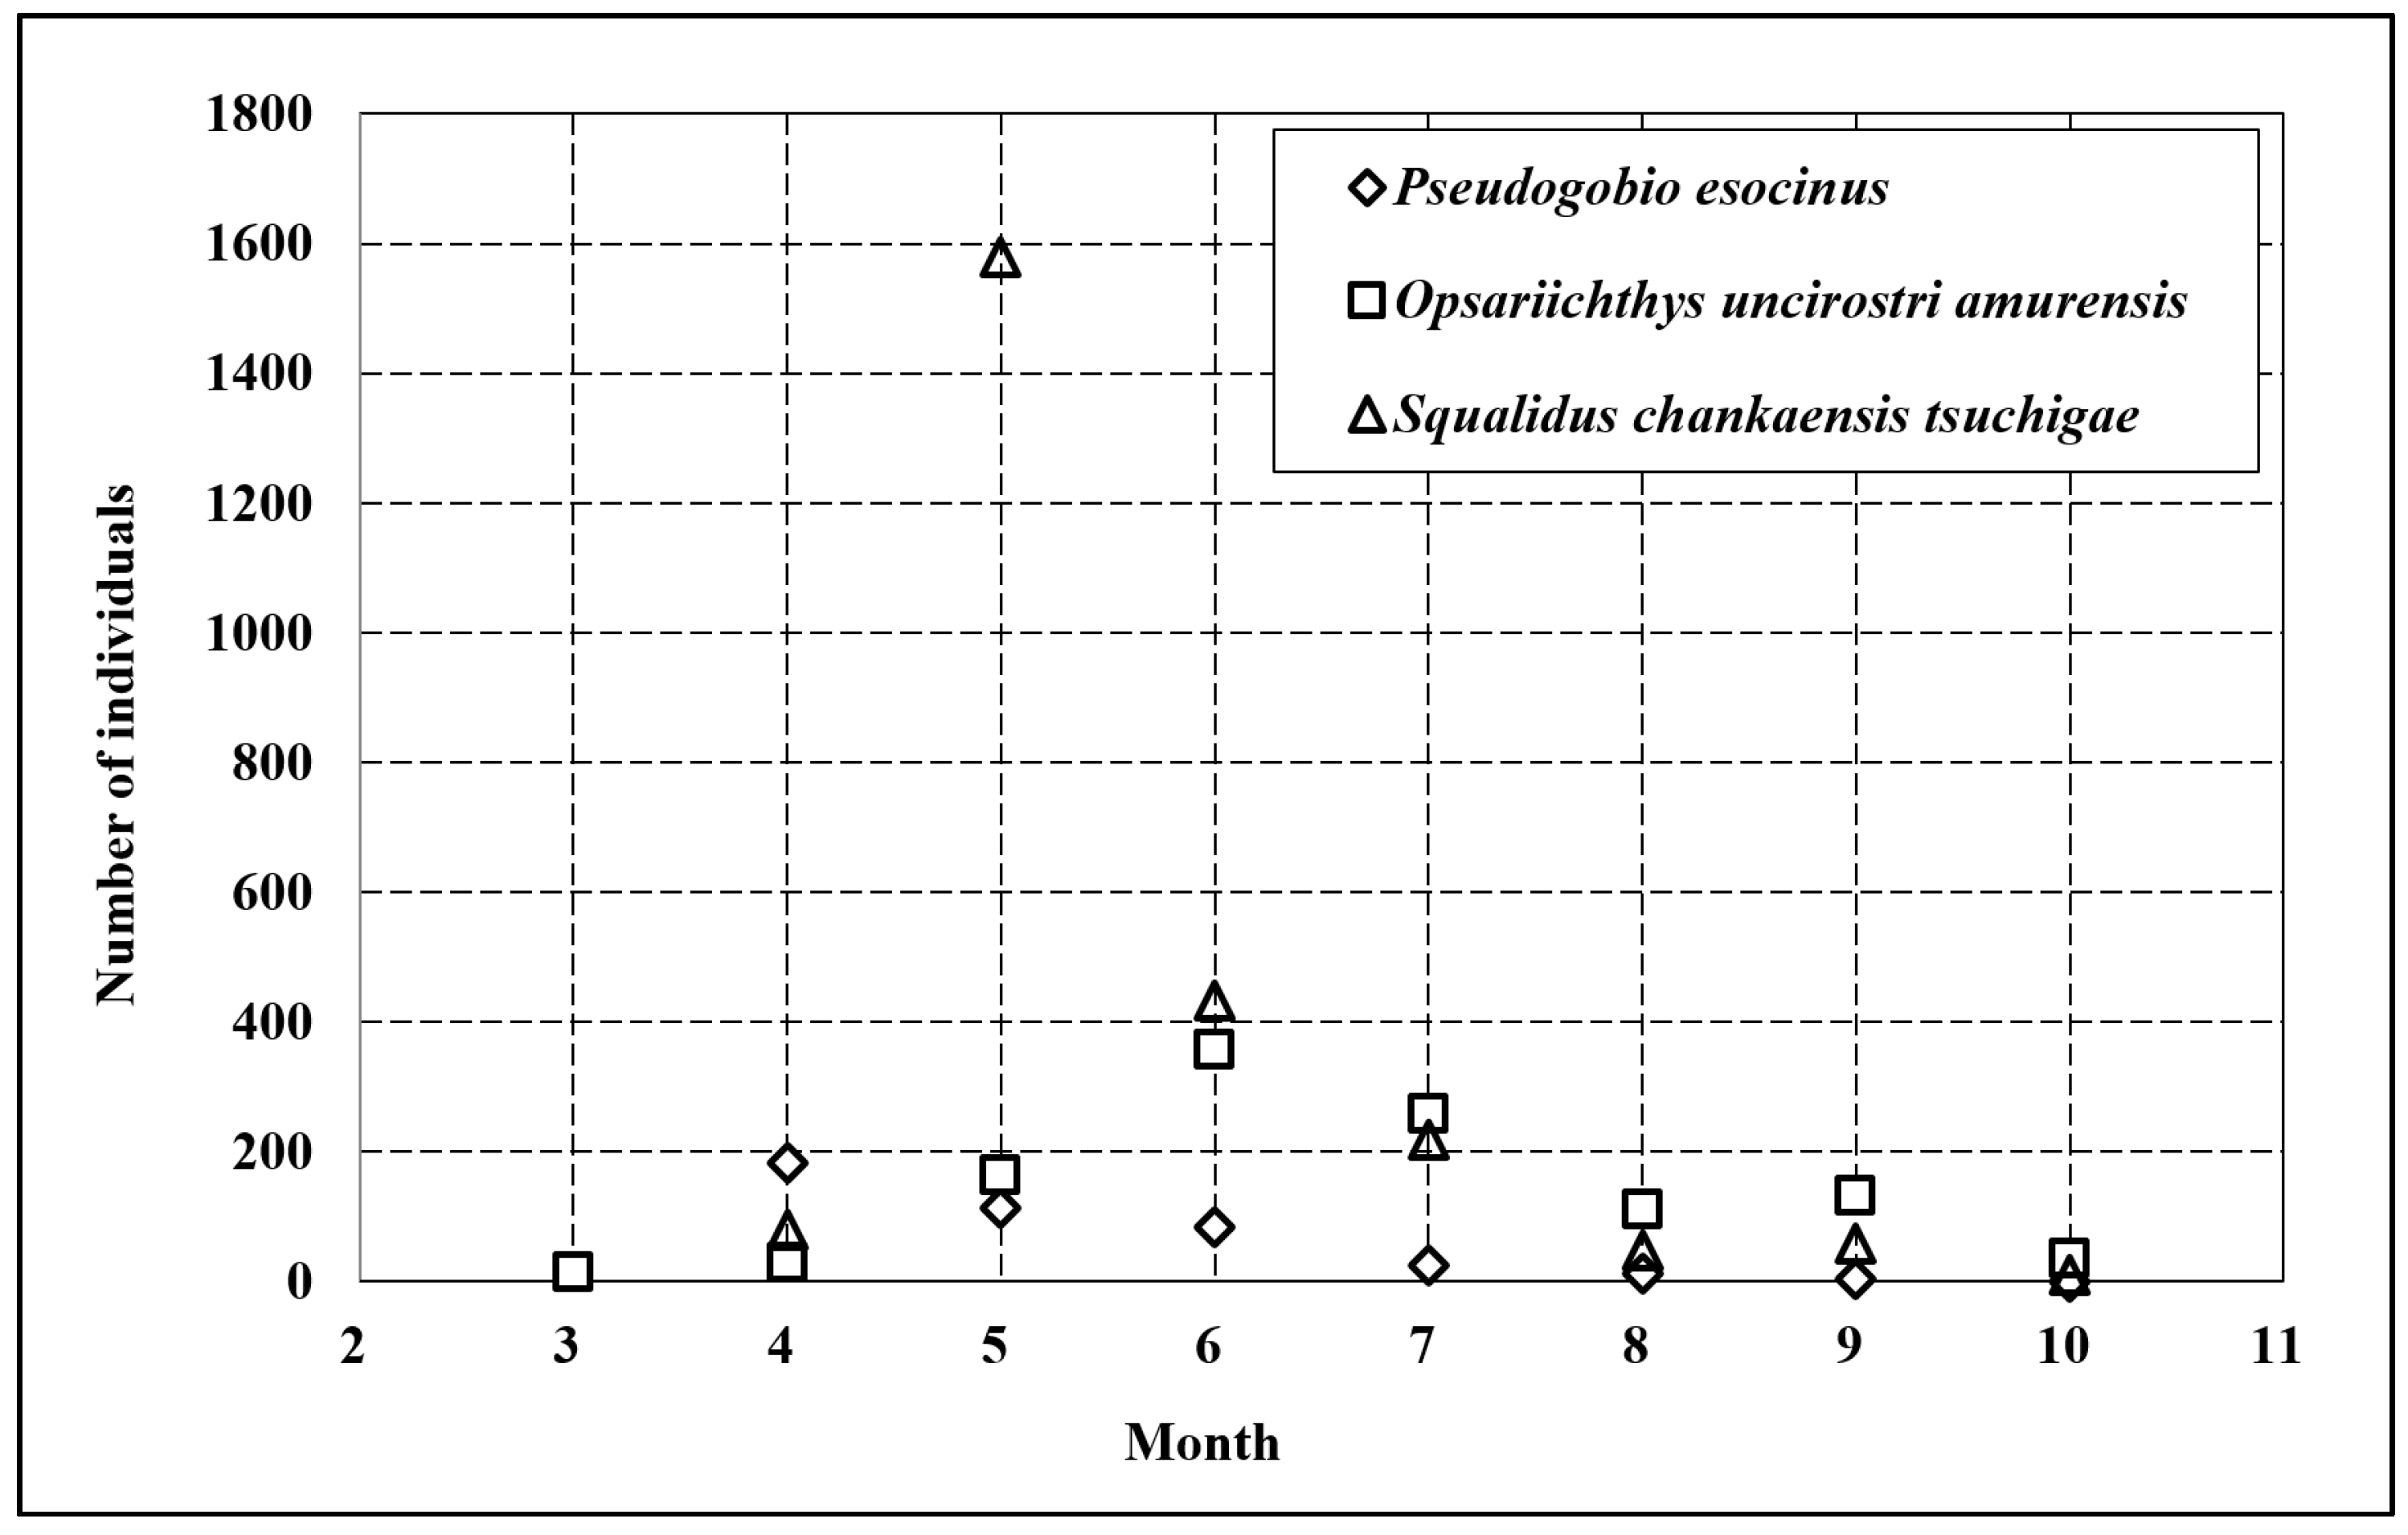
Table 3 presents the fish species from the monitoring. A total of 5099 individuals of 12 species belonging to 3 genera used the fishway. The number started to increase from April when the spawning season began. The fishway was used most frequently by Squaliduschankaensistsuchigae (Korean gudgeon), followed by Opsariichthysuncirostrisamurensis (Korean piscivorous chub) and Pseudogobioesocinus (goby minnow). Before the construction of the Gangjeong-Goryeong Weir, Zacco platypus (pale chub) was the predominant species [9]. Figure 7 shows graphs displaying data at monthly intervals for the three major fish species using the fishway. Figure 7 shows that P. esocinus, S. chankaensis tsuchigae, and O. uncirostri amurensis used the fishway most frequently during the spawning period (April, May, and June, respectively).
3.4. Target Fish
Based on the above-described fishway monitoring data, P. esocinus was selected as the target fish, although the dominant species was S. chankaensistsuchigae. Given that the latter could thrive in low-quality water (≤grade 3) and adapt well to changed environment after weir construction and that it outnumbered all other species, its use of fishway was considered as of minor importance. O. uncirostri amurensis was excluded as a primarily fish-eating (piscivorous) species. It was classified as a biologically harmful species. In contrast, P. esocinus is very sensitive to water contamination. It cannot dwell in a high flow velocity field. It is necessary to provide improved habitat conditions for it through a by-pass fishway.
P. esocinus is endemic in Korean rivers. It belongs to the family of Cyprinidae. Its spawning season is May and June. As the water temperature begins to rise in April, spawning individuals begin to align themselves to commence upstream migration to spawning grounds. The maintenance speed of P. esocinus is known to range from 0.05 to 0.25 m/s. Its maintenance depth from the riverbed ranges from 0.35 to 0.55 m [20].
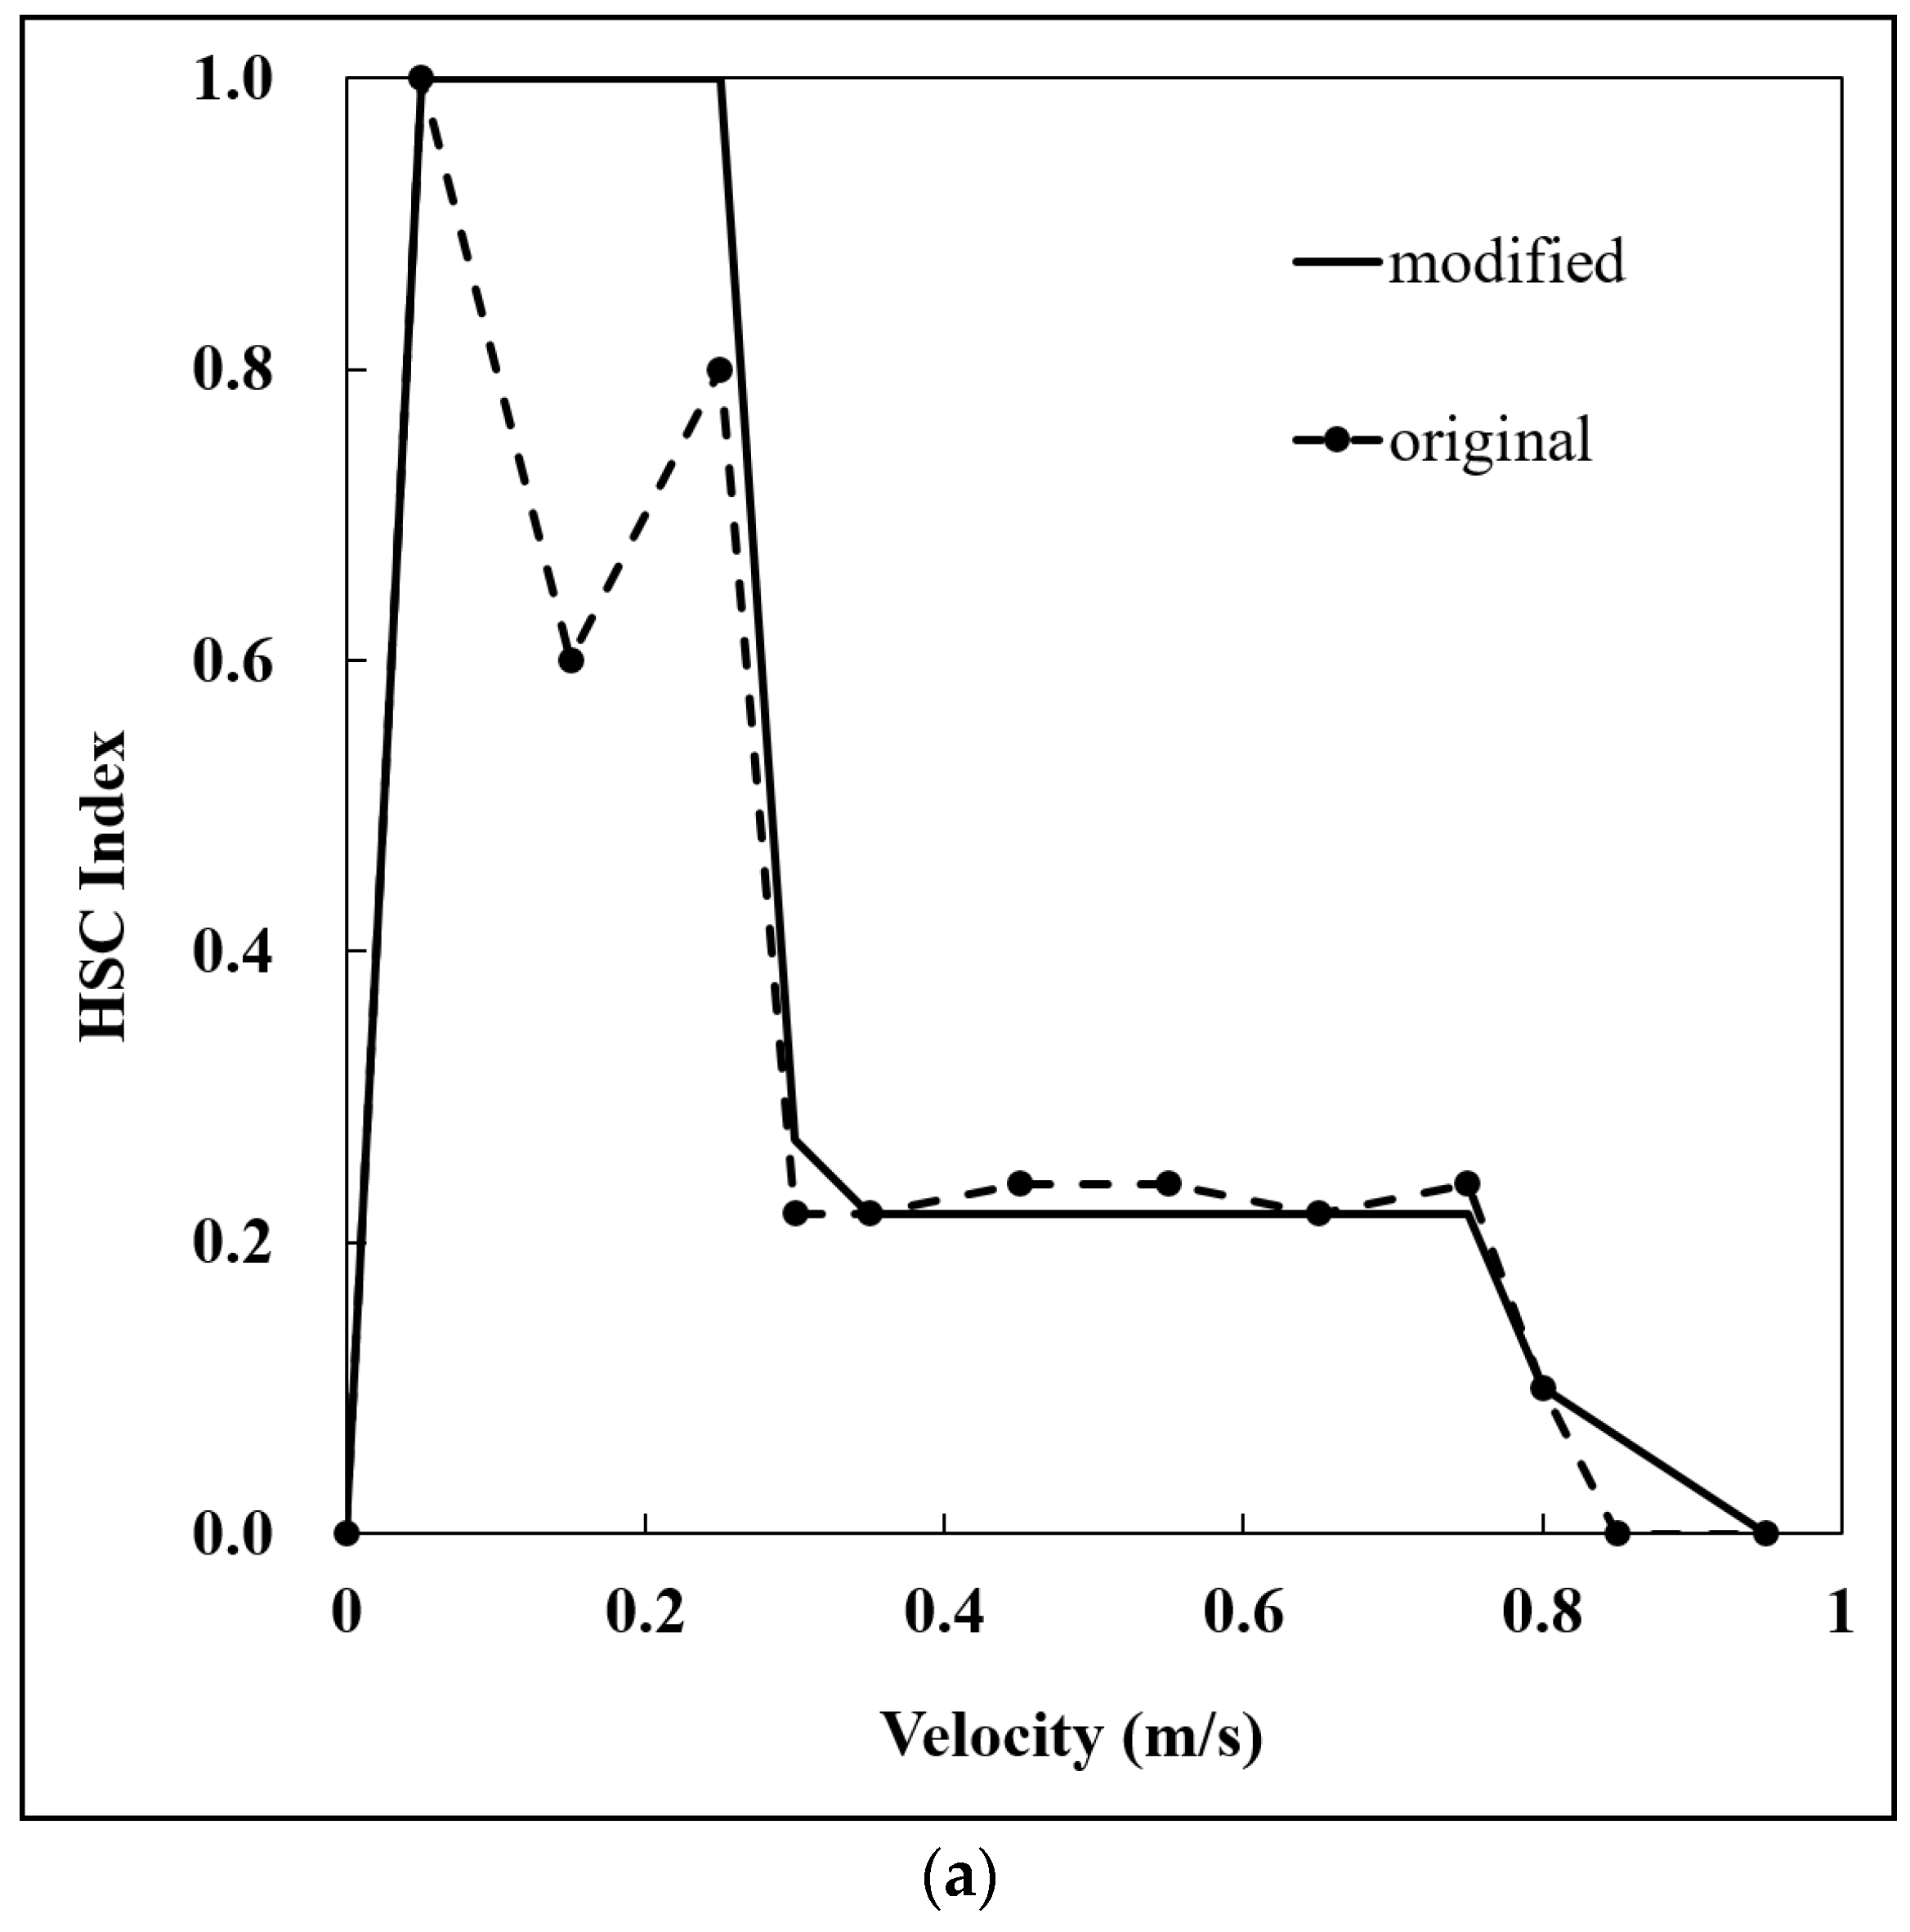
Habitat Suitability Criteria (HSC) versus each of the flow velocity, water depth, and channel substrate indices for P. esocinus used in this study are shown in Figure 8. The peak HSC value for flow velocity was set in excess of usual HSC in consideration of burst swimming speed of P. esocinusas shown in Figure 8a. The HSC for the water depth was also set at the maximum possible value because P. esocinus could swim at a considerable water depth (Figure 8b). P. esocinus is calculated by applying the HSC for the channel index of 1.0 as it mainly inhabits the gravel layer.
The CSI calculated by multiplying adjusted HSCs in this study and the WUA calculated by applying the CSI to each cell not only indicated habitat suitability for P. esocinus, but also indicated the area allowing migrating schools of P. esocinus to swim. Therefore, the area with a large WUA value can be considered as having a large number of P. esocinus individuals. In other words, a high WUA value near the fishway entrance is assumed to be indicative of a high attraction efficiency of the fishway. For this apparent reason, WUA was selected as the indicator of attraction efficiency of the fishway investigated in this study.
4. Results and Discussion
4.1. Analysis of Attraction Efficiency at Fishway Entrance
As described above, River2D was used for the analysis of attraction efficiency of the entrance of the by-pass fishway installed in the Gangjeong-Goryeong Weir. WUA was obtained by simulating the velocity field and CSI on the basis of monthly flow rate represented by the mode of the Gangjeong-Goryeong Weir in 2013. Since the target species P. esocinus used the fishway only during the spawning season (April–June) as shown in Table 3 and Figure 7, the values of the velocity field and WUA in this period were calculated (Figure 9). Velocity field is an important factor for fish schools migrating upstream, especially along the primary velocity [8,21]. However, the filament of the primary velocity is at a considerable distance from the fishway entrance as shown in Figure 9. The main current passing through the movable weir flows towards the right bank, rather than towards the left bank where the fishway entrance is located. Due to structural defect inherent to this by-pass fishway, it is unsuitable for attracting a large number of fish species.
Nevertheless, attraction efficiency can be improved to a certain degree by adjusting the flow rate. The values of WUA, the indicator of attraction efficiency used in this study, are not clearly distinguishable by month or flow rate as shown in Figure 9. Therefore, a specific area near the fishway entrance was set (the area highlighted with a red line in Figure 2 and Figure 9). Monthly box plots including the average and peak values of WUAs of the nodes within this area are displayed in Figure 10. As a result, July was revealed to be the month having the highest average WUA (20.27), followed by April (19.57) and June (19.33). The peak WUA value was 43.23 in April and June. These findings indicated that the fishway attraction efficiency was the highest in April followed by June. The target species P. esocinus used the fishway most frequently in April. However, many other species used it frequently in June (Table 3). A good agreement was obtained between species monitoring data from the in situ experiment and the WUA values obtained by numerical simulation, proving that WUA is an appropriate indicator of fishway attraction efficiency.
4.2. Optimal Flow Rate to Achieve Maximum Attraction Efficiency
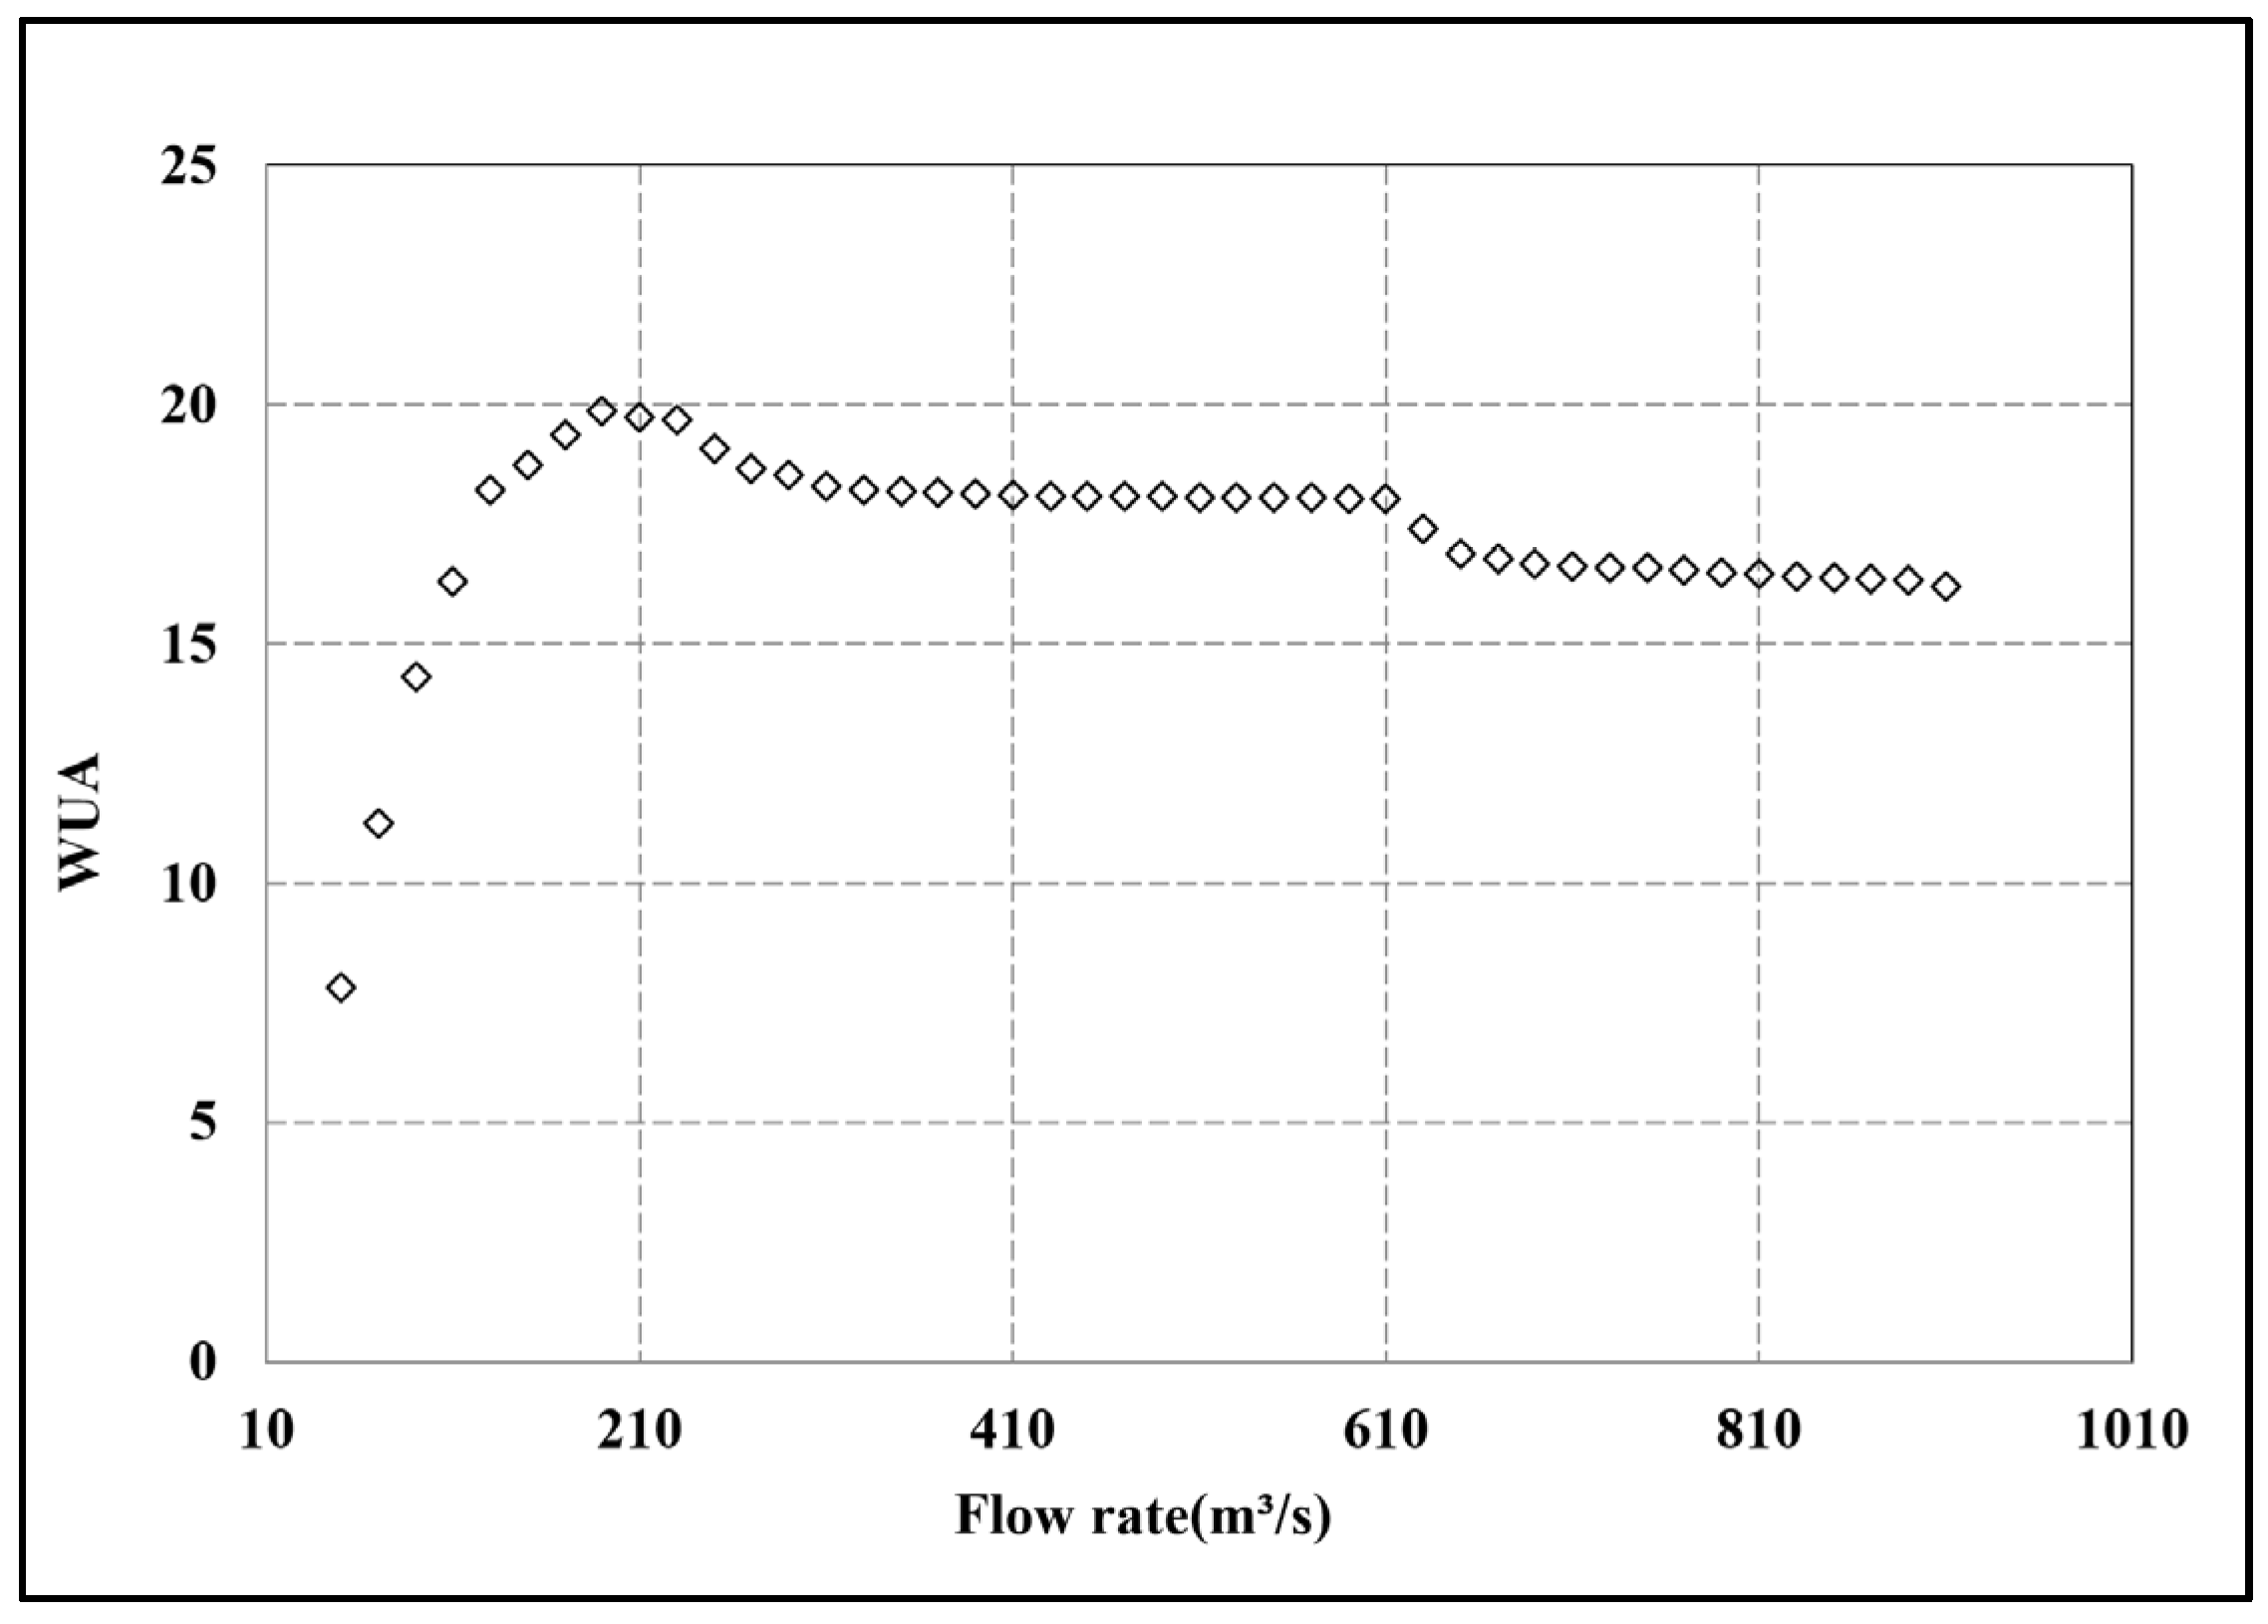
It was confirmed that the WUA value as the indicator of attraction efficiency changed according to monthly variation of flow rate. In addition, WUA value tended to increase as the flow rate was increased. However, there are some exceptions. For example, the representative flow rate in October of 2013 was 236 m3/s (Table 1). However, the corresponding average WUA value was lower than that in April (representative flow rate was 183 m3/s). This suggests the necessity of deriving an optimal flow rate to achieve the maximum attraction efficiency, i.e., the highest WUA value, by numerical simulation. By operating the sluice gate of the movable weir at the Gangjeong-Goryeong Weir, the flow rate of the main channel was adjusted between 50 and 910 m3/s at intervals of 20 m3/s to simulate the average WUA values in the predetermined area (red box in Figure 2 and Figure 9) as represented in Figure 11. Simulation results revealed that WUA was the highest (19.87) at the flow rate of 190 m3/s. It began to gradually decrease from 210 m3/s onwards. This finding indicated that the flow rate of the main channel at the Gangjeong-Goryeong Weir should be maintained at 190 m3/s in order to attract the target fish species into the entrance of the fishway efficiently. The flow rate management through an adequate operation of sluice gates to maintain this optimal level is especially important to facilitate upstream and downstream migration to and from the spawning grounds during the spawning season (April–June) of the target fish species P. esocinus.
5. Conclusions
We analyzed the attraction efficiency of the by-pass fishway located on the left bank of the Gangjeong-Goryeong Weir using River2D model based on monthly weir operation records in 2013. To validate River2D simulation results, we performed in situ experiment using GPS drifters. The in situ flow rate measurements and the simulated values were compared. They were found to be in good agreement with each other. Additionally, fish species and individuals using the fishway were monitored monthly. Among fish species frequently using the by-pass fishway, P. esocinus was selected as the target species of this study. HSI-based WUA value was used as the indicator of attraction efficiency. Analysis of the spawning period of P. esocinus by month revealed that April and June had higher WUA values than May. On the basis of these findings, a simulation was conducted to determine the optimal flow rate to enhance the attraction efficiency for P. esocinus by adjusting the flow rate (between 50 and 910 m3/s with intervals of 20 m3/s). Results of 44 simulation runs revealed that the highest WUA value was at a flow rate of 190 m3/s. Given that water resource management restrictions, the weir operation does not allow continuous discharge. However, if the weir could be operated to maintain a discharge rate at 190 m3/s during the spawning season, a high attraction efficiency of the by-pass fishway for P. esocinus might be expected. The findings of this study may be extended to other fish species. However, further studies are needed to enhance the attraction efficiency of various types of fishways installed in the 16 multi-functional weirs in South Korea.
Author Contributions
Conceptualization, K.O.B. and Y.D.K.; methodology, K.O.B. and J.M.L.; model simulation, J.M.L. and T.G.K.; validation, J.M.L.; formal analysis, J.M.L. and T.G.K.; investigation, J.M.L.; writing-review and editing, K.O.B. and Y.D.K. All authors have read and agreed to the published version of the manuscript.
Funding
This research was funded by Korea Agency for Infrastructure Technology Advancement (KAIA), grant number 1615012318.
Institutional Review Board Statement
Not applicable.
Data Availability Statement
Not applicable.
Acknowledgments
This work is supported by the Korea Agency for Infrastructure Technology Advancement (KAIA) grant funded by the Ministry of Land, Infrastructure and Transport (Grant 1615012318).
Conflicts of Interest
The authors declare no conflict of interest.
References
- Allan, J.D.; Flecker, A.S. Biodiversity conservation in running waters. Bio-Science 1993, 43, 32–43. [Google Scholar] [CrossRef]
- Kinsolvbing, A.D.; Bain, M.B. Fish assemblage recovery along a riverine disturbance gradient. Ecol. Appl. 1993, 3, 531–544. [Google Scholar] [CrossRef] [PubMed]
- Thomas, D.H.L. Dam construction and ecological change in the riparian forest of the Hadejia-jama are floodplain, Nigeria. Land Degrad. Dev. 1996, 7, 279–295. [Google Scholar] [CrossRef]
- Lemly, A.D.; Kingsford, R.; Thompson, J.R. Irrigated Agriculture and Wildlife Conservation: Conflict on a Global Scale. Environ. Manag. 2000, 25, 485–512. [Google Scholar] [CrossRef] [PubMed]
- Yoon, J.D.; Kim, J.H.; Joo, G.J.; Seo, J.; Hubert, P.; Jang, M.H. Freshwater fish utilization of fishway installed in the Jangheung Dam. J. Korean Soc. Limnol. KSL 2011, 44, 264–271. [Google Scholar]
- Moyle, P.B.; Cech, J.J., Jr. Fishes: An Introduction to Ichthyology, 3rd ed.; Prentice-Hall: Upper Saddle River, NJ, USA, 1996; p. 590, 4th ed., 2000. [Google Scholar]
- Lucas, M.C.; Bras, E. Migration of Freshwater Fishes; Blackwell Science Ltd.: Oxford, UK, 2001. [Google Scholar]
- Baek, K.O.; Kim, Y.D. A case study for optimal position of fishway at low-head obstructions in tributaries of Han River in Korea. Ecol. Eng. 2014, 64, 222–230. [Google Scholar] [CrossRef]
- Baek, K.O.; Ku, Y.H.; Kim, Y.D. Attraction efficiency in natural-like fishways according to weir operation and bed change in Nakdong River, Korea. Ecol. Eng. 2015, 84, 569–578. [Google Scholar] [CrossRef]
- Ghanem, A.; Steffler, P.; Hicks, F. Two-Dimensional hydraulic simulation of physical habitat conditions in flowing streams. Regul. Rivers Res. Manag. 1996, 12, 185–200. [Google Scholar] [CrossRef]
- Katopodis, C.; Ghamry, H.K. Hydrodynamic and physical assessment of ice-free and ice-covered conditions for three reaches of the Athabasca River, Alberta, Canada. Can. J. Civ. Eng. 2007, 34, 717–730. [Google Scholar] [CrossRef]
- Baek, K.O. Evaluation technique for efficiency of fishway based on hydraulic analysis. J. Korea Water Resour. Assoc. 2019, 52, 855–863. [Google Scholar]
- Steffler, P.; Blackburn, J. Introduction to Depth Averaged Modeling and User’s Manual; University of Alberta: Edmonton, AB, Canada, 2002. [Google Scholar]
- Lee, S.-H.; Oh, K.-R.; Cheong, T.-S.; Jeong, S.-M. An Assessment of Fish Habitat of Natural Fishway by Hydraulic Model Experiments and Numerical Analysis. J. Korea Water Resour. Assoc. 2012, 45, 317–329. [Google Scholar] [CrossRef] [Green Version]
- Seo, I.W.; Park, I.; Kim, Y.D.; Han, E.J.; Choo, M.H.; Mun, H.S. Mixing Analysis of Floating Pollutant Using Lagrangian Particle Tracking Model. J. Korean Soc. Water Environ. 2013, 29, 383–392. [Google Scholar]
- Jang, J.; Jong, J.; Mun, H.; Kim, K.; Seo, I. Mixing Analysis of Oil Spilled into the River by GPS-equipped Drifter Experiment and Numerical Modeling. J. Korean Soc. Water Environ. 2016, 32, 243–252. [Google Scholar] [CrossRef]
- Han, E.J.; Park, I.; Kim, Y.D.; Seo, I.W. A study of surface mixing in a meandering channel using GPS floaters. Environ. Earth Sci. 2016, 75, 901. [Google Scholar] [CrossRef]
- Park, I.; Seo, I.W.; Kim, Y.D.; Han, E.J. Turbulent Mixing of Floating Pollutants at the Surface of the River. J. Hydraul. Eng. 2017, 143, 04017019. [Google Scholar] [CrossRef]
- Lee, H.S.; Lee, J.M.; Han, E.J.; Kim, Y.D. A study on the validation of hydraulic model using Lagrangian GPS Floater. J. Korea Water Resour. Assoc. 2019, 52, 1047–1055. [Google Scholar]
- Kang, H.; Im, D.; Hur, J.W.; Kim, K.H. Estimation of Habitat Suitability Index of Fish Species in the Geum River Watershed. J. Korean Soc. Civ. Eng. 2011, 31, 193–203. [Google Scholar]
- Clay, C.H. Design of Fishways and Other Fish Facilities; Lewis Publishers: Boca Raton, FL, USA, 1995. [Google Scholar]
Figure 1.
Aerial view of Gangjeong-Goryeong Weir on Nakdong River.

Figure 2.
River bed contour and finite element mesh for study area.

Figure 3.
Schematic diagram of GPS drifter for velocity measurements.

Figure 4.
Standard procedure of GPS drifter field experiments.

Figure 5.
Path lines acquired from GPS drifter field experiments.

Figure 6.
Water velocities (m/s) in fishway of Gangjeong-Goryeong Weir determined by GPS drifter field experiments compared to those calculated by River2D-model for the same eight situations (Track 1 to Track 8): (a) presentation of the results—ordinate, velocity (m/s); (b) correlation analysis of observed and calculated velocities—abscissa, observed velocity (m/s).

Figure 7.
Number of individuals of three fish species that monthly passed by the fishway of Gangjeong-Goryeong Weir from March to October.
Figure 7.
Number of individuals of three fish species that monthly passed by the fishway of Gangjeong-Goryeong Weir from March to October.

Figure 8.
HSC indices for (a) velocity; (b) depth; (c) Channel Index.


Figure 9.
Presentation of the calculated values of velocities (m/s) and the weighted Usable Areas in the region of Gangjeong-Goryeong Weir in (a) April; (b) May; (c) June.
Figure 9.
Presentation of the calculated values of velocities (m/s) and the weighted Usable Areas in the region of Gangjeong-Goryeong Weir in (a) April; (b) May; (c) June.


Figure 10.
Box plot of WUA at squared area.

Figure 11.
Averaged values of WUA according to flow rate variations.


Table 1.
Simulation condition of River2D model.
| Month | Upstream Boundary Conditions: Discharge Flow (m3/s) | Downstream Boundary Conditions: Water Surface Elevation (m) |
|---|---|---|
| Jan. | 78 | 14.1 |
| Feb. | 110 | |
| Mar. | 119 | |
| Apr. | 183 | |
| May. | 66 | |
| Jun. | 136 | |
| Jul. | 199 | |
| Aug. | 75 | |
| Sep. | 76 | |
| Oct. | 236 | |
| Nov. | 37 | |
| Dec. | 56 |
Table 2.
The average velocity calculated from GPS drifter experiments.
| Track | Travel Distance (m) | Travel Time (min) | Average Velocity (m/s) |
|---|---|---|---|
| 1 | 115 | 29 | 0.0661 |
| 2 | 110 | 22 | 0.0833 |
| 3 | 86 | 26 | 0.0551 |
| 4 | 77 | 20 | 0.0642 |
| 5 | 121 | 27 | 0.0747 |
| 6 | 71 | 21 | 0.0563 |
| 7 | 98 | 33 | 0.0495 |
| 8 | 120 | 23 | 0.0870 |
Table 3.
Fish monitoring results at the exit of the fishway.
| Fish Species | Field Measurements Result | ||||||||||
|---|---|---|---|---|---|---|---|---|---|---|---|
| Mar. | Apr. | May | Jun. | Jul. | Aug. | Sep. | Oct. | Total | (%) | ||
| Cyprinidae | Cyprinuscarpoio | 3 | 5 | 2 | 1 | 2 | 13 | 0.25 | |||
| Hemibarbuslabeo | 28 | 42 | 9 | 23 | 68 | 32 | 1 | 203 | 3.98 | ||
| Pseudogobioesocinus | 183 | 114 | 84 | 24 | 13 | 4 | 422 | 8.28 | |||
| Squalidus chankaensistsuchigae | 79 | 1580 | 432 | 218 | 48 | 58 | 10 | 2425 | 47.56 | ||
| Zacco platypus | 1 | 22 | 52 | 123 | 35 | 11 | 5 | 9 | 258 | 5.06 | |
| Opsariichithysunci rostriamurensis | 14 | 30 | 163 | 357 | 258 | 111 | 132 | 35 | 1100 | 21.57 | |
| Erythrocultereryth ropterus | 7 | 8 | 47 | 22 | 4 | 1 | 89 | 1.75 | |||
| Hemicultereigenmanni | 30 | 37 | 5 | 3 | 8 | 83 | 1.63 | ||||
| Centrarchidae | Lepomismacrochirus | 2 | 1 | 3 | 0.06 | ||||||
| Micropterussalmoides | 31 | 21 | 5 | 5 | 8 | 70 | 1.37 | ||||
| Gobiidae | Rhinogobiusbrunneus | 13 | 74 | 27 | 13 | 51 | 41 | 219 | 4.29 | ||
| Tridemtigerbrevispinis | 72 | 142 | 214 | 4.20 | |||||||
| Total individuals | 15 | 345 | 2032 | 1145 | 647 | 293 | 372 | 250 | 5099 | 100 | |
| Total species observed | 2 | 6 | 9 | 9 | 10 | 9 | 12 | 10 | 12 | ||
Publisher’s Note: MDPI stays neutral with regard to jurisdictional claims in published maps and institutional affiliations. |
© 2021 by the authors. Licensee MDPI, Basel, Switzerland. This article is an open access article distributed under the terms and conditions of the Creative Commons Attribution (CC BY) license (https://creativecommons.org/licenses/by/4.0/).
Share and Cite
MDPI and ACS Style
Baek, K.O.; Lee, J.M.; Ku, T.G.; Kim, Y.D. Evaluation of By-Pass Fishway Operation for Attraction Efficiency Based on GPS Drifter Field Experiments. Water 2021, 13, 2302. https://doi.org/10.3390/w13162302
AMA Style
Baek KO, Lee JM, Ku TG, Kim YD. Evaluation of By-Pass Fishway Operation for Attraction Efficiency Based on GPS Drifter Field Experiments. Water. 2021; 13(16):2302. https://doi.org/10.3390/w13162302
Chicago/Turabian StyleBaek, Kyong Oh, Jeong Min Lee, Tae Geom Ku, and Young Do Kim. 2021. "Evaluation of By-Pass Fishway Operation for Attraction Efficiency Based on GPS Drifter Field Experiments" Water 13, no. 16: 2302. https://doi.org/10.3390/w13162302
Note that from the first issue of 2016, this journal uses article numbers instead of page numbers. See further details here.