
Event Based Post-Fire Hydrological Modeling of the Upper Arroyo Seco Watershed in Southern California

Coastal and Hydraulics Laboratory, U.S. Army Engineer Research and Development Center, 3909 Halls Ferry Road, Vicksburg, MS 39180-6199, USA
*
Author to whom correspondence should be addressed.
Water 2021, 13(16), 2303; https://doi.org/10.3390/w13162303
Submission received: 8 July 2021
/
Revised: 17 August 2021
/
Accepted: 18 August 2021
/
Published: 22 August 2021
(This article belongs to the Special Issue Extreme Hydrology: Induced Impacts and Vulnerability of Water Resources)
Abstract
:Understanding, development and integration of pre-fire and post-fire watershed hydrological processes into a watershed hydrological model in a wild-fire repeating region similar to parts of California is critical for emergency assessments. 95% of the upper Arroyo Seco watershed located in Los Angeles County in southern California was burned by the Station fire that occurred in August 2009, significantly increasing the watershed observed runoff. This watershed was employed to develop the January 2008 rainfall runoff model as a pre-fire event-based watershed hydrological model. This pre-fire watershed model was subsequently employed in the rainfall events of 18 January 2010 and 27 February 2010, a few months after the fire event of August 2009. The pre-fire watershed model when employed in the post-fire rainfall events without considering the fire effects vastly underestimated the simulated discharge. For this reason, in this study of the post-fire catchment runoff modeling the following points are taken into consideration: (a) a realistic distributed initial soil moisture condition; (b) a formulation that includes a reduction factor and a burn severity factor, as multiplying factors to soil hydraulic conductivity in the soil characteristic curve; and (c) runoff routing parameterization under burned conditions. Developing the post-fire Arroyo Seco watershed model by using the above-mentioned points enhanced the Nash–Sutcliffe Efficiency from −24% to 82% for the 18 January 2010 rainfall event and from −47% to 96% for the 27 February 2010 rainfall event.
1. Introduction
The atmospheric oxygen and the carbon-rich vegetation makes Earth an intrinsically flammable planet [1]. Wildfires are regarded one of the main cause of global tree and vegetation mortality [2,3,4]. Wildfires are common in climates where vegetation growth takes place in a relatively short span of wet periods followed by extended dry periods [5]. Studies suggests that a reason for the increase in fire risk in different parts of the world is attributable to changes in climate extremes due to human induced changes [6,7].
Wildfires alter a watershed’s normal hydrologic function thereby increasing runoff for a post-rainfall event of the burned watershed. Watershed hydrological changes in a post-fire condition primarily arise from decreases in infiltration due to increases in soil water repellency [8,9,10,11]. Changes to hydrodynamic and geophysical processes and associated parameter behavior in a post-fire condition is the result of the loss of vegetation and soil organic matter [12]. These changes elevate the runoff magnitude and shortens the lag time of the peak flows resulting in an increased stream power, erosion potential, and pollutant delivery [13,14,15,16,17,18]. Therefore, it is critical to integrate post-fire hydrological process understanding into a physics-based distributed hydrologic model to facilitate improved predictions for post-fire land and water management decisions [19].
Soil water repellency due to burned conditions depends on the burned severity [20]. This soil water repellency effect decreases with increasing soil moisture content [20]. There are not many observations to suggest a soil moisture threshold to transition from hydrophobic to hydrophilic conditions. With few site study observations at this time, the literature suggests a wide range for this soil moisture threshold [21,22,23]. Under this present soil moisture threshold uncertainty, a realistic initial soil moisture condition would demonstrate a significance in deriving an effective parameterization of reduced infiltration in event-based watershed post-fire hydrological modeling. For these reasons, in this study of the post-fire catchment runoff modeling of a rainfall event, the following points are taken into consideration: (a) a realistic distributed initial soil moisture condition; (b) a formulation that includes hydraulic conductivity reduction factor and burn severity factor as multiplying factors for soil hydraulic conductivity in the soil characteristic curve during the infiltration/runoff generation process; and (c) runoff routing parameterization under burned conditions. Unlike earlier post-fire modeling studies, including all of the above-mentioned relevant studies, this study takes account of realistic fine-resolution distributed initial soil moisture condition with an infiltration reduction formulation and routing parameters alteration according to severity of burned condition at a spatial location. The post-fire modeling study is conducted for upper Arroyo Seco watershed, 41.7 km2 in Los Angeles County, CA, USA. This study watershed was approximately 95% burned in the August 2009 fire event called Station Fire.
2. Study Area
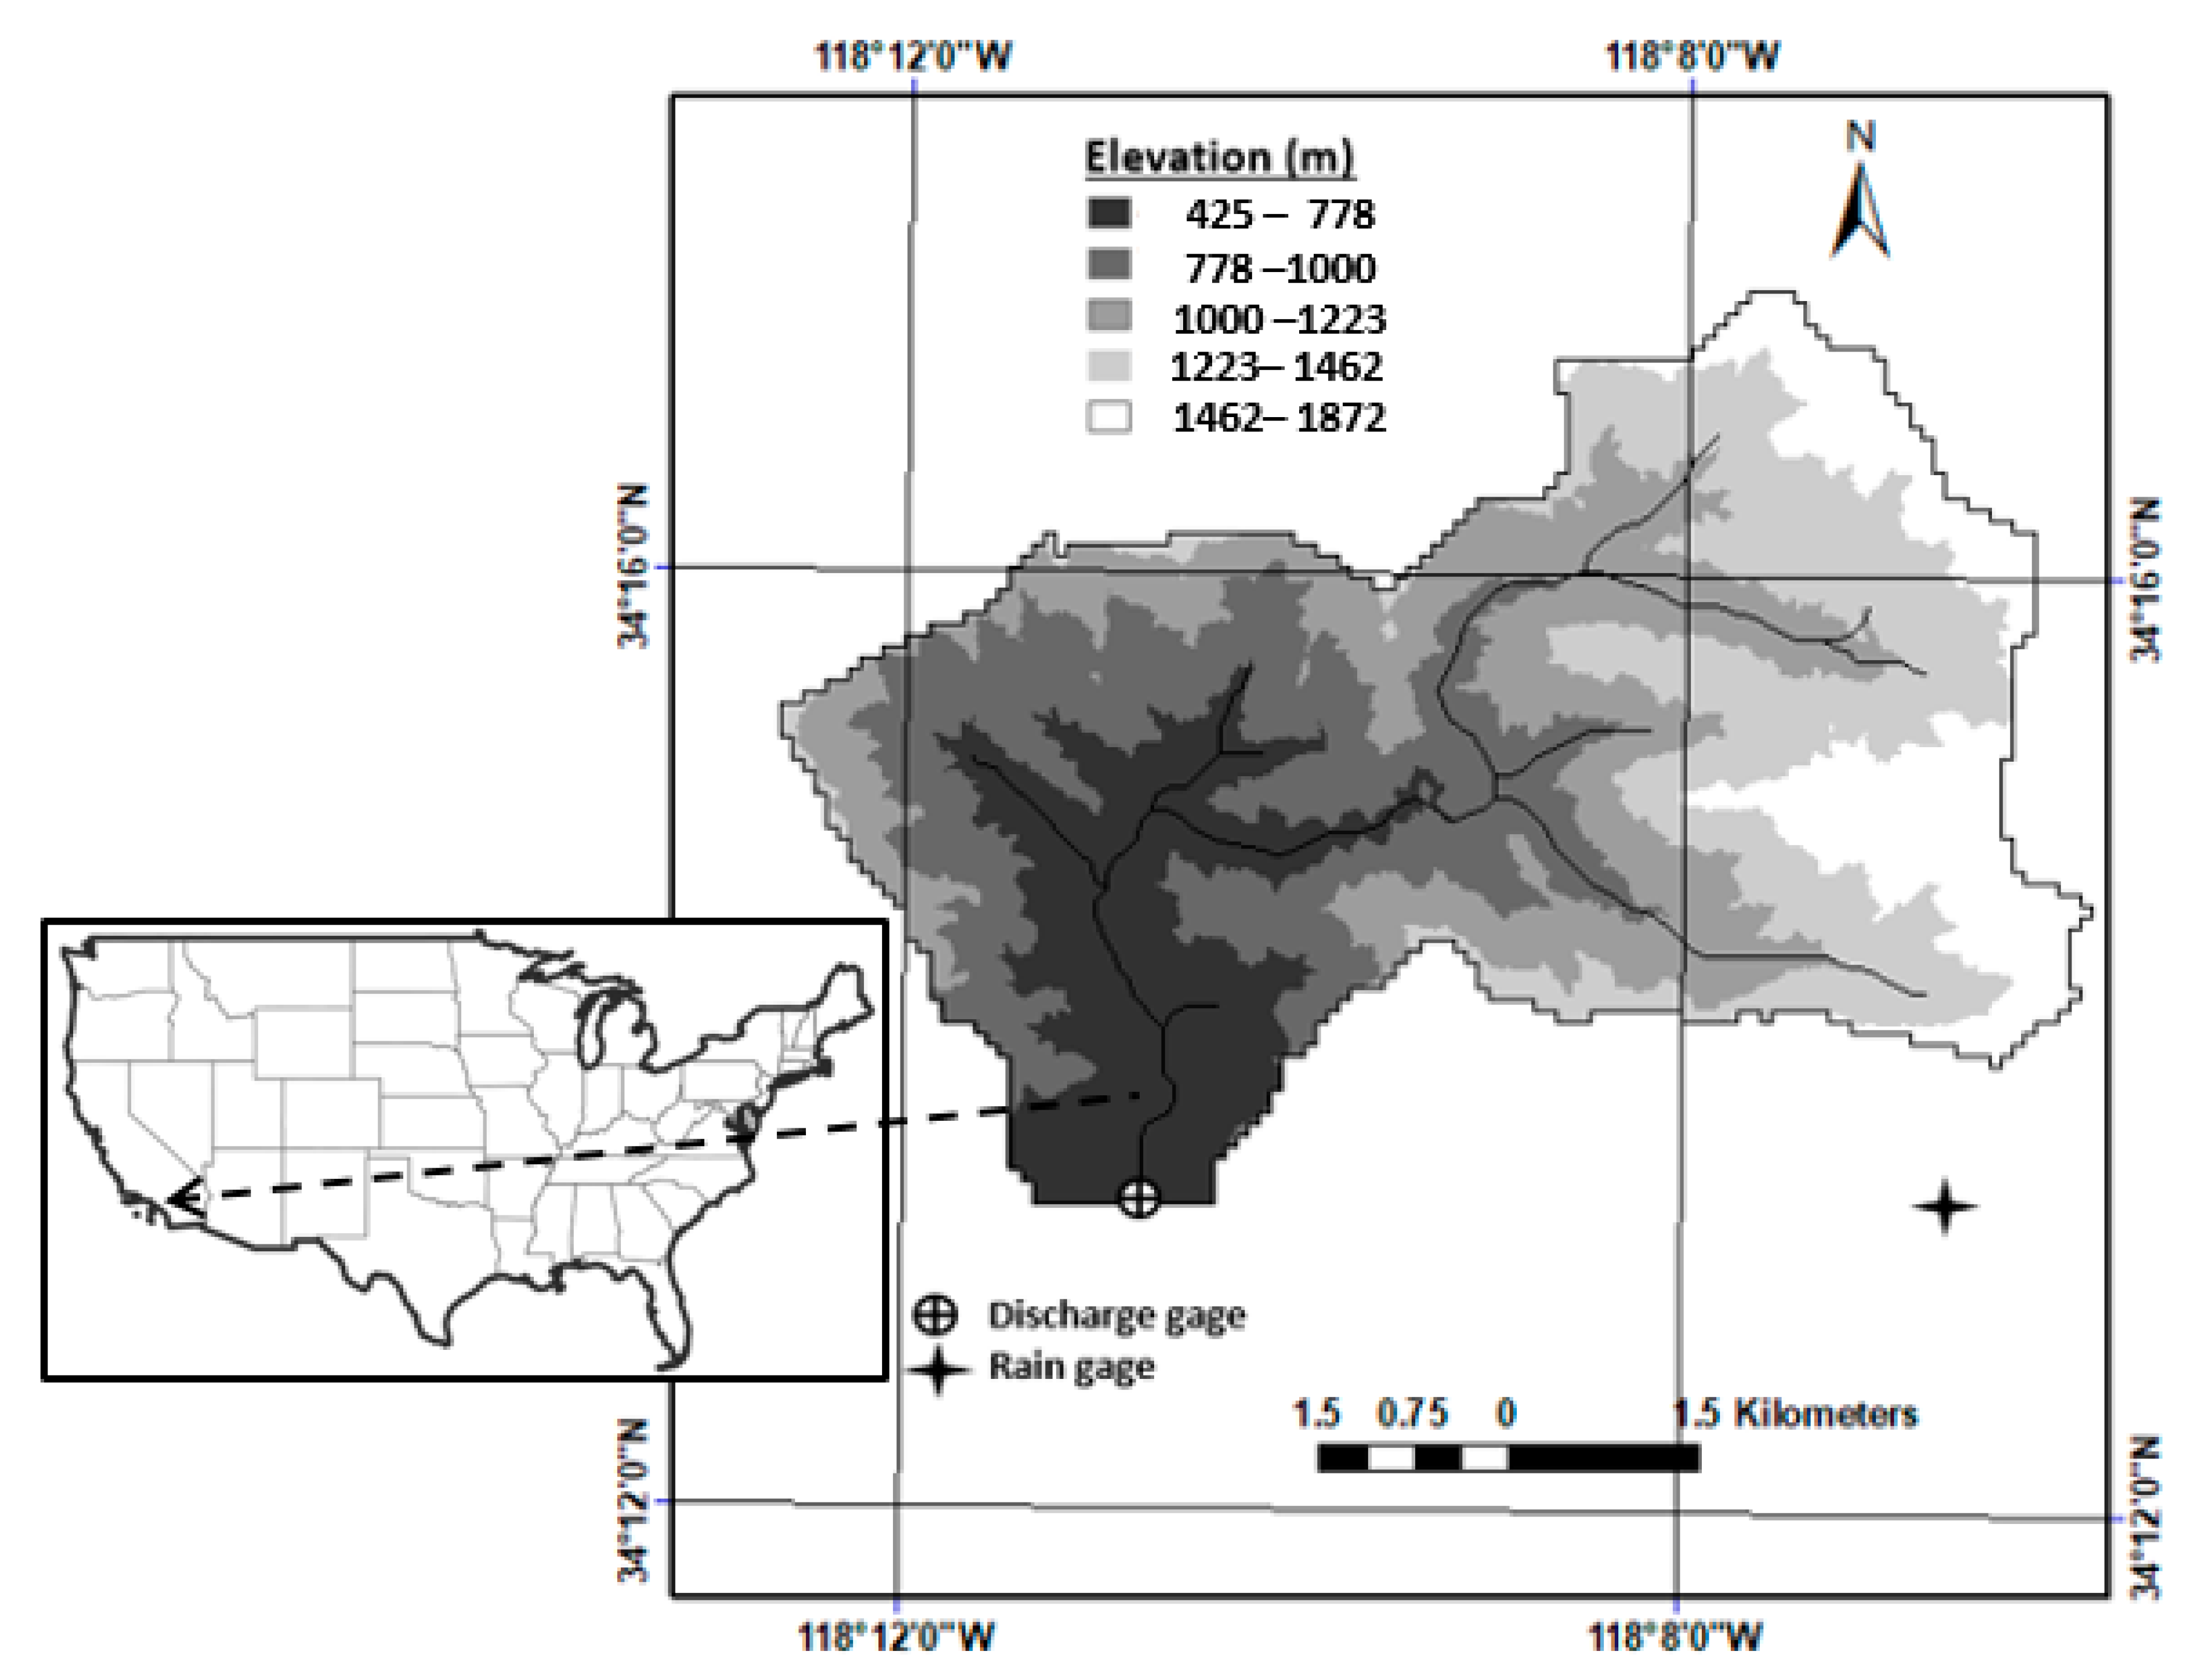
The Arroyo Seco Watershed is a sub-watershed of the Los Angeles National Forest and is located in northeast Los Angeles County, between the San Gabriel Mountains and the Los Angeles River. The outlet of the watershed in this study, as shown in Figure 1, is at 34°13′20″ north and 118°10′36″ west and makes a watershed drainage area of approximately 41.7 km2. The streams in this upper Arroyo Seco watershed are dry most of the year. A threshold of 1 km2 upslope contributing area was used to generate the stream network, as shown in Figure 1.
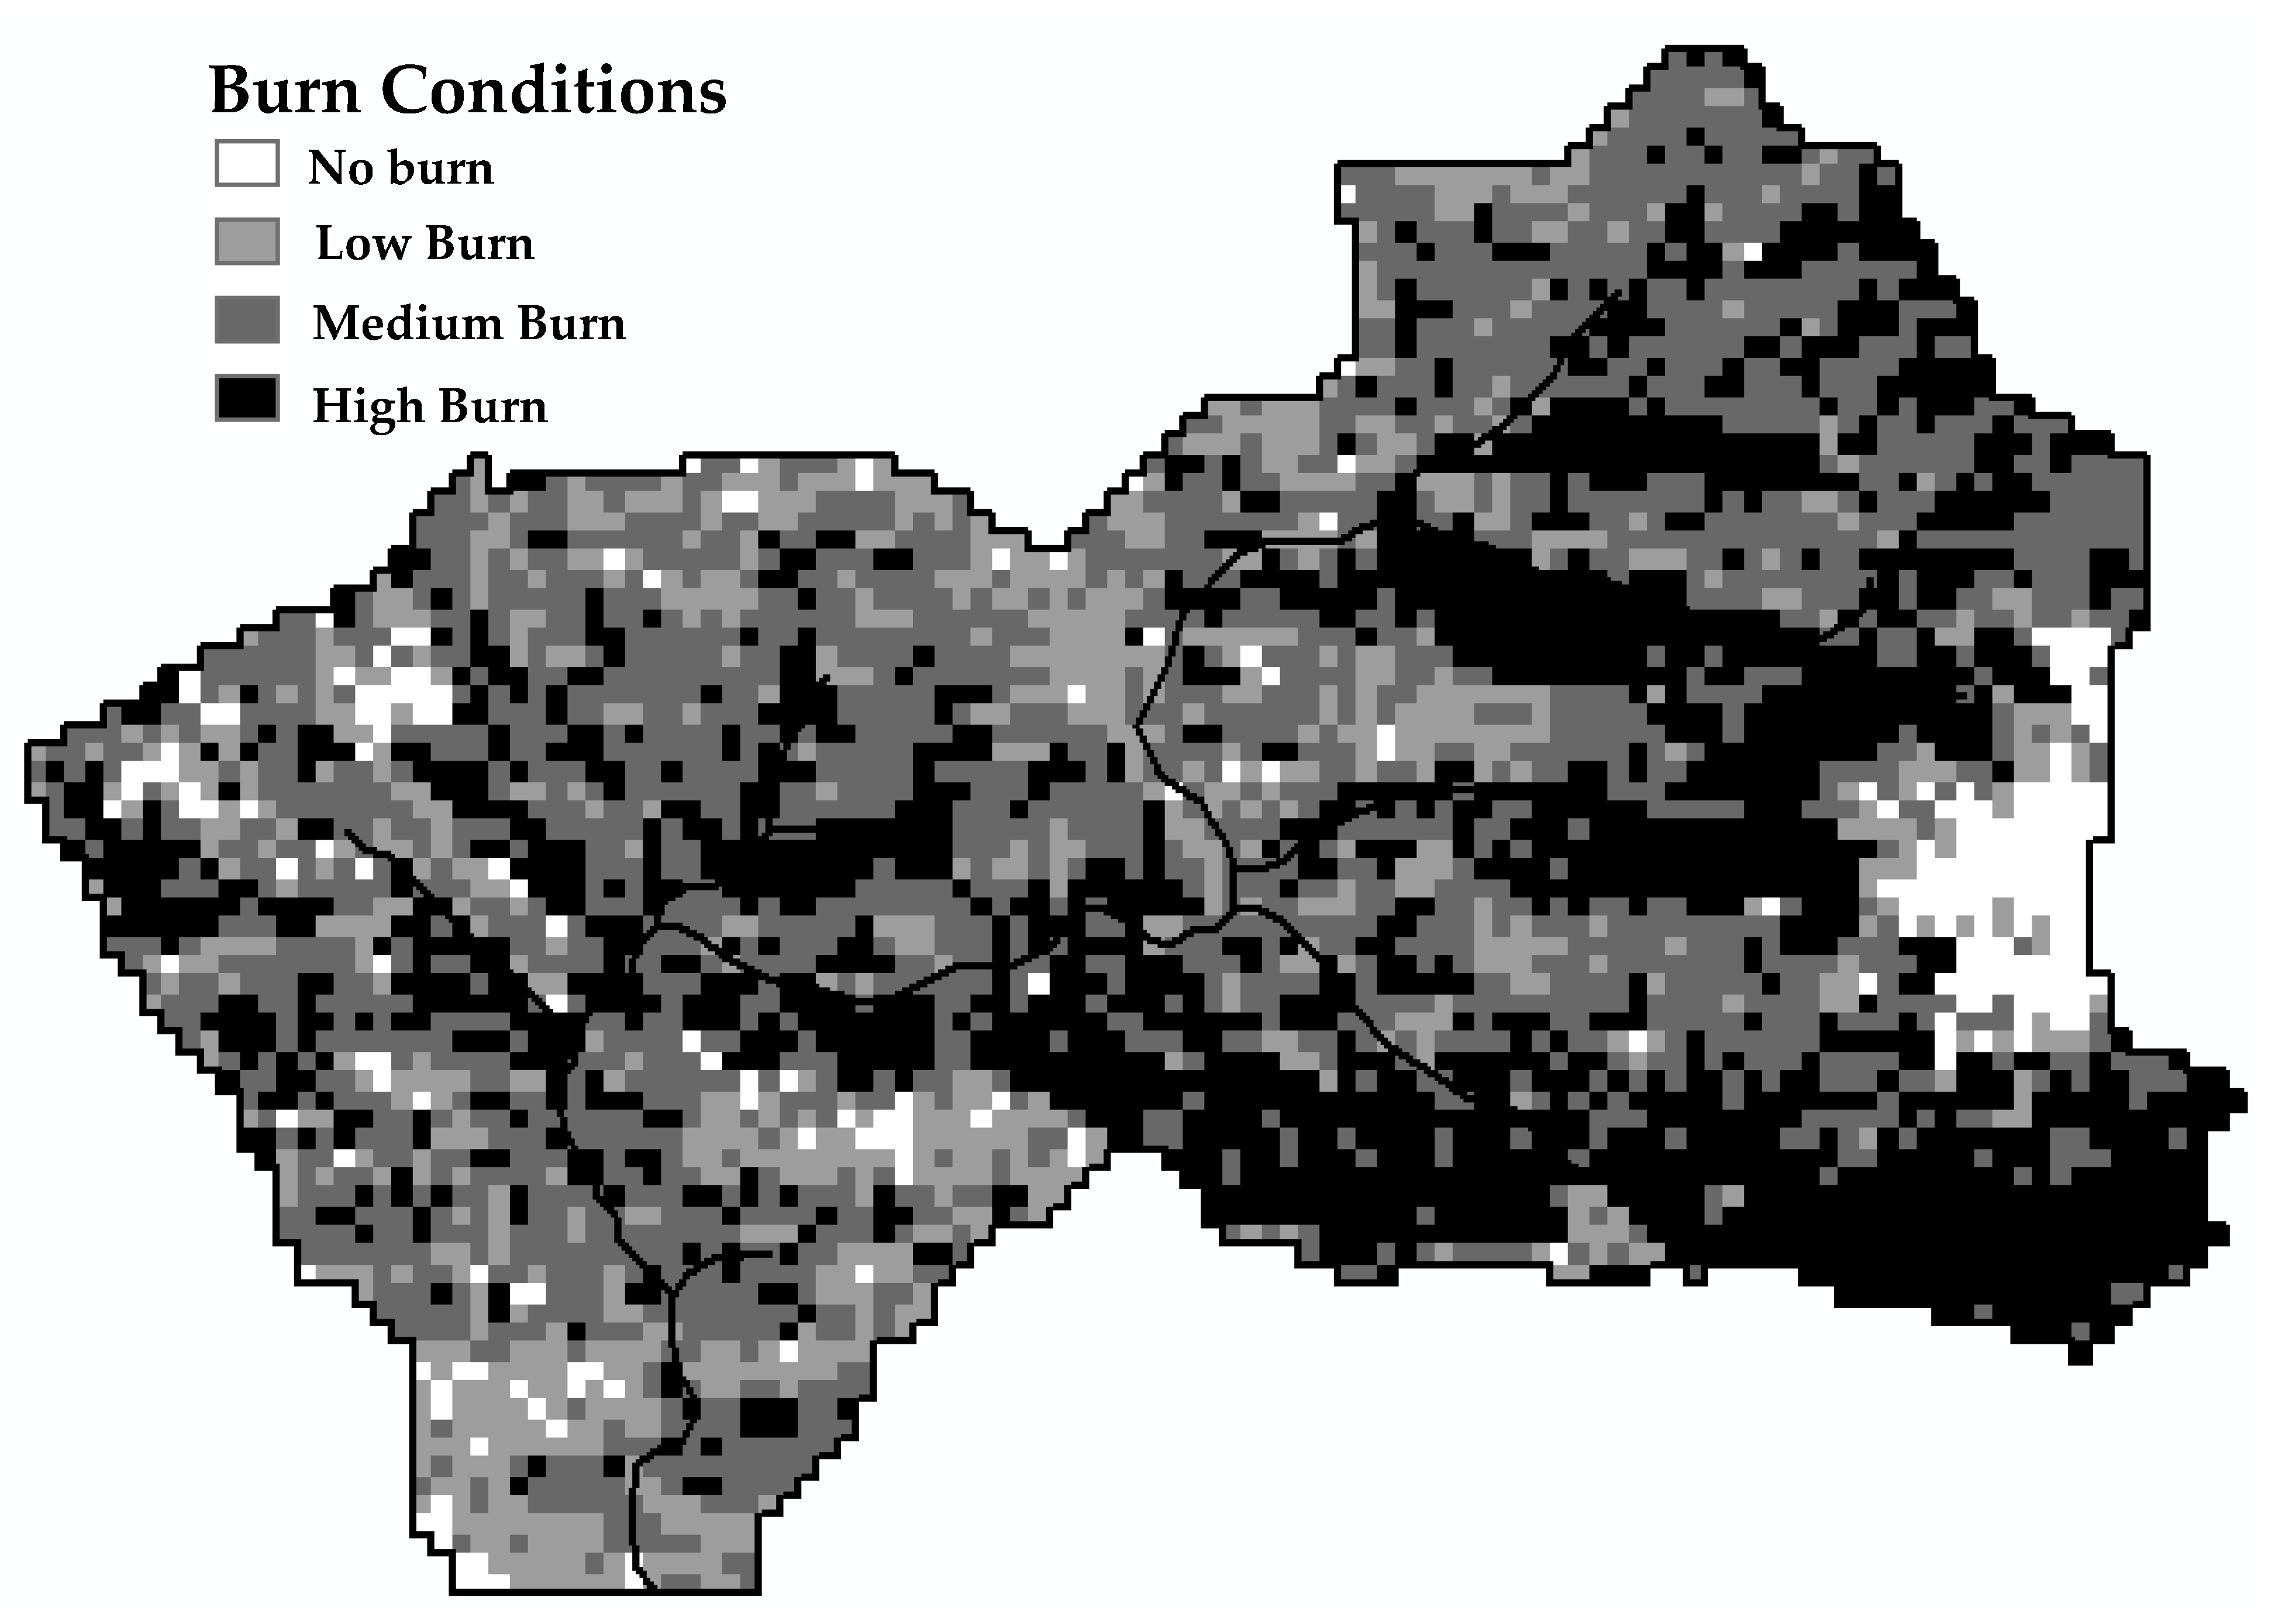
In August 2009, the ‘Station Fire’ started in the Angeles National Forest. The fire moved into the Arroyo Seco area overnight engulfing most of the watershed, 95%, in this study as shown in Figure 2. The burned severity map in Figure 2 was obtained from https://www.mtbs.gov/viewer/index.html?region=all (accessed 1 January 2021).
The United States Geological Survey (USGS) has a runoff gaging station at the outlet of this study area which is referenced as USGS gaging station number 11098000 near Pasadena (https://waterdata.usgs.gov/nwis/inventory/?site_no=11098000&agency_cd=USGS (accessed 15 December 2020)). This study area is mainly steep mountainous terrain located within the Angeles National Forest [24].
In general, the climate of the region where the Arroyo Seco is located can be described as being of Mediterranean type with long, hot, dry summers and cooler, wet winter with 95% of the precipitation occurring from November to April, with 75% occurring from December to March. The average annual precipitation is approximately 500 mm in the lower elevations and up to approximately 760 mm in the higher elevations [25].
The observed hourly discharge from the USGS gaging station number 11098000 near Pasadena (retrieved from https://waterdata.usgs.gov/nwis/inventory/?site_no=11098000&agency_cd=USGS (accessed on 1 January 2021)) was used for calibration, parameter identification and verification of the post-fire watershed hydrological model. The hourly precipitation employed in this study was obtained from Department of Public Works, Los Angeles County. The information for this rain gage station, ‘Inspiration Pnt Precip’ gaging station at 34°13′18″ north and 118°06′34″ west and at an elevation of 1366.7-m above sea level, was obtained at https://www.ladpw.org/wrd/precip/index.cfm?Product=alertlist accessed on 1 January 2021. The US Geological Survey [26] Earth Resources Observation and Science (EROS) Center Science Processing Architecture (ESPA) (https://espa.cr.usgs.gov/ (accessed 1 January 2021)) on-demand interface provides 30-m Landsat Surface Reflectance, with atmospheric corrections applied, Level-2 science products that include the spectral indices products for Landsat 4–5 Thematic Mapper (TM), Landsat 7 Enhanced Thematic Mapper Plus (ETM+), and Landsat 8 Operational Land Imager (OLI)/Thermal Infrared Sensor (TIRS). The Normalized Difference Vegetation Index (NDVI), one of the on-demand spectral indices products, was used in the soil moisture estimation model carried out in this study.
The wilting point (θwp) and field capacity (θfc), used in the soil moisture estimation model and hydrological models in this study, were derived from the Natural Resources Conservation Service (NRCS) Soil Survey Geographic Database (SSURGO) http://websoilsurvey.sc.egov.usda.gov/App/WebSoilSurvey.aspx (accessed 1 January 2021), using established pedotransfer functions that yield θwp and θfc as functions of soil texture [27]. The land-cover maps for the study area were derived from the National Land Cover Database (NLCD), http://www.mrlc.gov/ (accessed 1 January 2021).
3. Methodology
In this study of the post-fire catchment runoff modeling, the following three points, related to initialization condition, runoff generation process and runoff transport process, are taken into consideration: (a) a realistic distributed initial soil moisture condition; (b) a formulation that includes reduction factor and burn severity factor as multiplying factors to soil hydraulic conductivity in the soil characteristic curve of the infiltration/runoff-generation process; and (c) runoff routing parameterization under burned condition.
3.1. Realistic Distributed Initial Soil Moisture Condition
Soil infiltration capacity reduction and water repellency effects due to burned conditions decrease with increasing soil moisture [20]. Recent studies have shown advances in the remote-sensing techniques for the estimation of subsurface hydrological state [28,29,30]. SERVES (Soil moisture Estimation of Root zone through Vegetation index-based Evapotranspiration fraction and Soil properties), Pradhan [28], was deployed to estimate a realistic distributed soil moisture. SERVES estimates distributed soil moisture via vegetation index-based evapotranspiration fraction and soil properties globally at a scale of 30-m grid resolution. The phenology of vegetation and soil physical properties are directly affected under burned condition. Therefore, SERVES soil moisture estimating method directly accounts for the burned condition. The SERVES method is computationally straightforward and employs widely available web-based digital data (i.e., vegetation indexes from the joint NASA and United States Geological Survey (USGS) Landsat program (https://espa.cr.usgs.gov/index/ (accessed 1 January 2021)) and soil properties from the SSURGO database. The SERVES method/model demonstrated its successful estimation of effective root zone soil moisture at several locations in the arid, semi-arid region of United States, in the states of Idaho, Montana and Wyoming [28]. Arroyo Seco is also considered a semi-arid climate with long, hot and dry summers.
In the SERVES method, the relationship between reference evapotranspiration fraction, ETrf, with soil moisture is defined as [28]:
where θ = soil moisture content; θfc = field capacity soil moisture content; θwp = wilting point soil moisture content; i = any spatial location or grid/tin address for a numerical model.
From the parametric uncertainty analysis of the linear deterministic relationships between ETrf and the normalized difference vegetation index, NDVI, the likelihood function of evapotranspiration fraction inversion through NDVI is defined as [28]:
From Equations (1) and (2), spatially distributed soil moisture content is derived as:
3.2. Multiplying Factors Formulation for Burned Hydraulic Conductivity
A formulation that includes multiplying factors, soil hydraulic conductivity reduction factor, and burned severity factor is included for vadose zone soil hydraulic conductivity in the unburned condition soil characteristic curve.
where Kburned = the hydraulic conductivity of the soil at burned condition; Kunburned = the soil hydraulic conductivity at normal unburned condition; Kburned <= Kunburned. BDF = the burned degree factor; RFk = the reduction factor of hydraulic conductivity under burned condition (highly burned locations).
Then, unsaturated soil hydraulic conductivity Kunsaturated is defined as [32]:
where θ = water content of the soil; θs = saturated water content of the soil; θr = residual water content of the soil; and λ = is soil distribution index.
Watershed soil map and the watershed burn severity map is combined to show the spatial location of burned soil. Equation (4) is used as per this combined soil and burn severity map.
3.3. Adjustment of the Land Cover Roughness Condition
Numerical models of hydrology and hydraulics implement the Manning equation to relate surface roughness to flow rate [33,34,35,36] as:
where Q is the flow rate; n is the Manning roughness coefficient; A is the flow area; R is the hydraulic radius; and Sf is the friction slope.
The surface roughness is represented by the Manning roughness coefficient, n. Surface roughness is dependent on the surface irregularity, vegetation density, and other obstructions [37,38,39,40]. Therefore, the roughness value is directly linked to the land cover and land-cover changes, such as in a post-fire scenario.
The current state of the practice for hydrologic modeling (especially distributed hydrologic modeling) is to acquire a digital land use/land cover (LULC) dataset and to assign Manning roughness values in a GIS using a look-up table based on Manning roughness values available in the literature [39,41]. A post-fire burned map overlay with the pre-fire LULC datasets from the National Land Cover Dataset (NLCD) by the US Geologic Survey (USGS) provides new sets of roughness values under changed vegetation conditions.
4. Results and Discussion
4.1. Visual Analysis
Visualization of the reality provides vital information for a realistic model development and simulation results. Figure 3 shows the composite natural-color satellite image obtained from the MODIS Surface Reflectance (MOD09GA) bands 1 (red), 4 (green) and 3 (blue) on 30 August 2009. The MODIS/Terra daily Land Surface Temperature was used to identify the spreading ‘Station Fire’ burning areas on 30 August 2009. In Figure 3, the actively burning areas detected by MODIS’s thermal bands are outlined in red. An image like that shown in Figure 3 is helpful for determining the extent of a fire in an emergency assessment.
Figure 4 was obtained from the public domain site: https://www.usgs.gov/media/images/post-wildfire-arroyo-seco (accessed 1 March 2021). Figure 4 shows the burn severity impact on the vegetation and land cover. Figure 4 gives a clear hint that most of the vegetation in the upper Arroyo Seco was wiped out due to the ‘Station Fire’. Figure 4 shows the significance to the adjustment of the land cover roughness condition as defined in Section 3.3.
4.2. Pre-Fire and Post-Fire Soil Moisture Condition
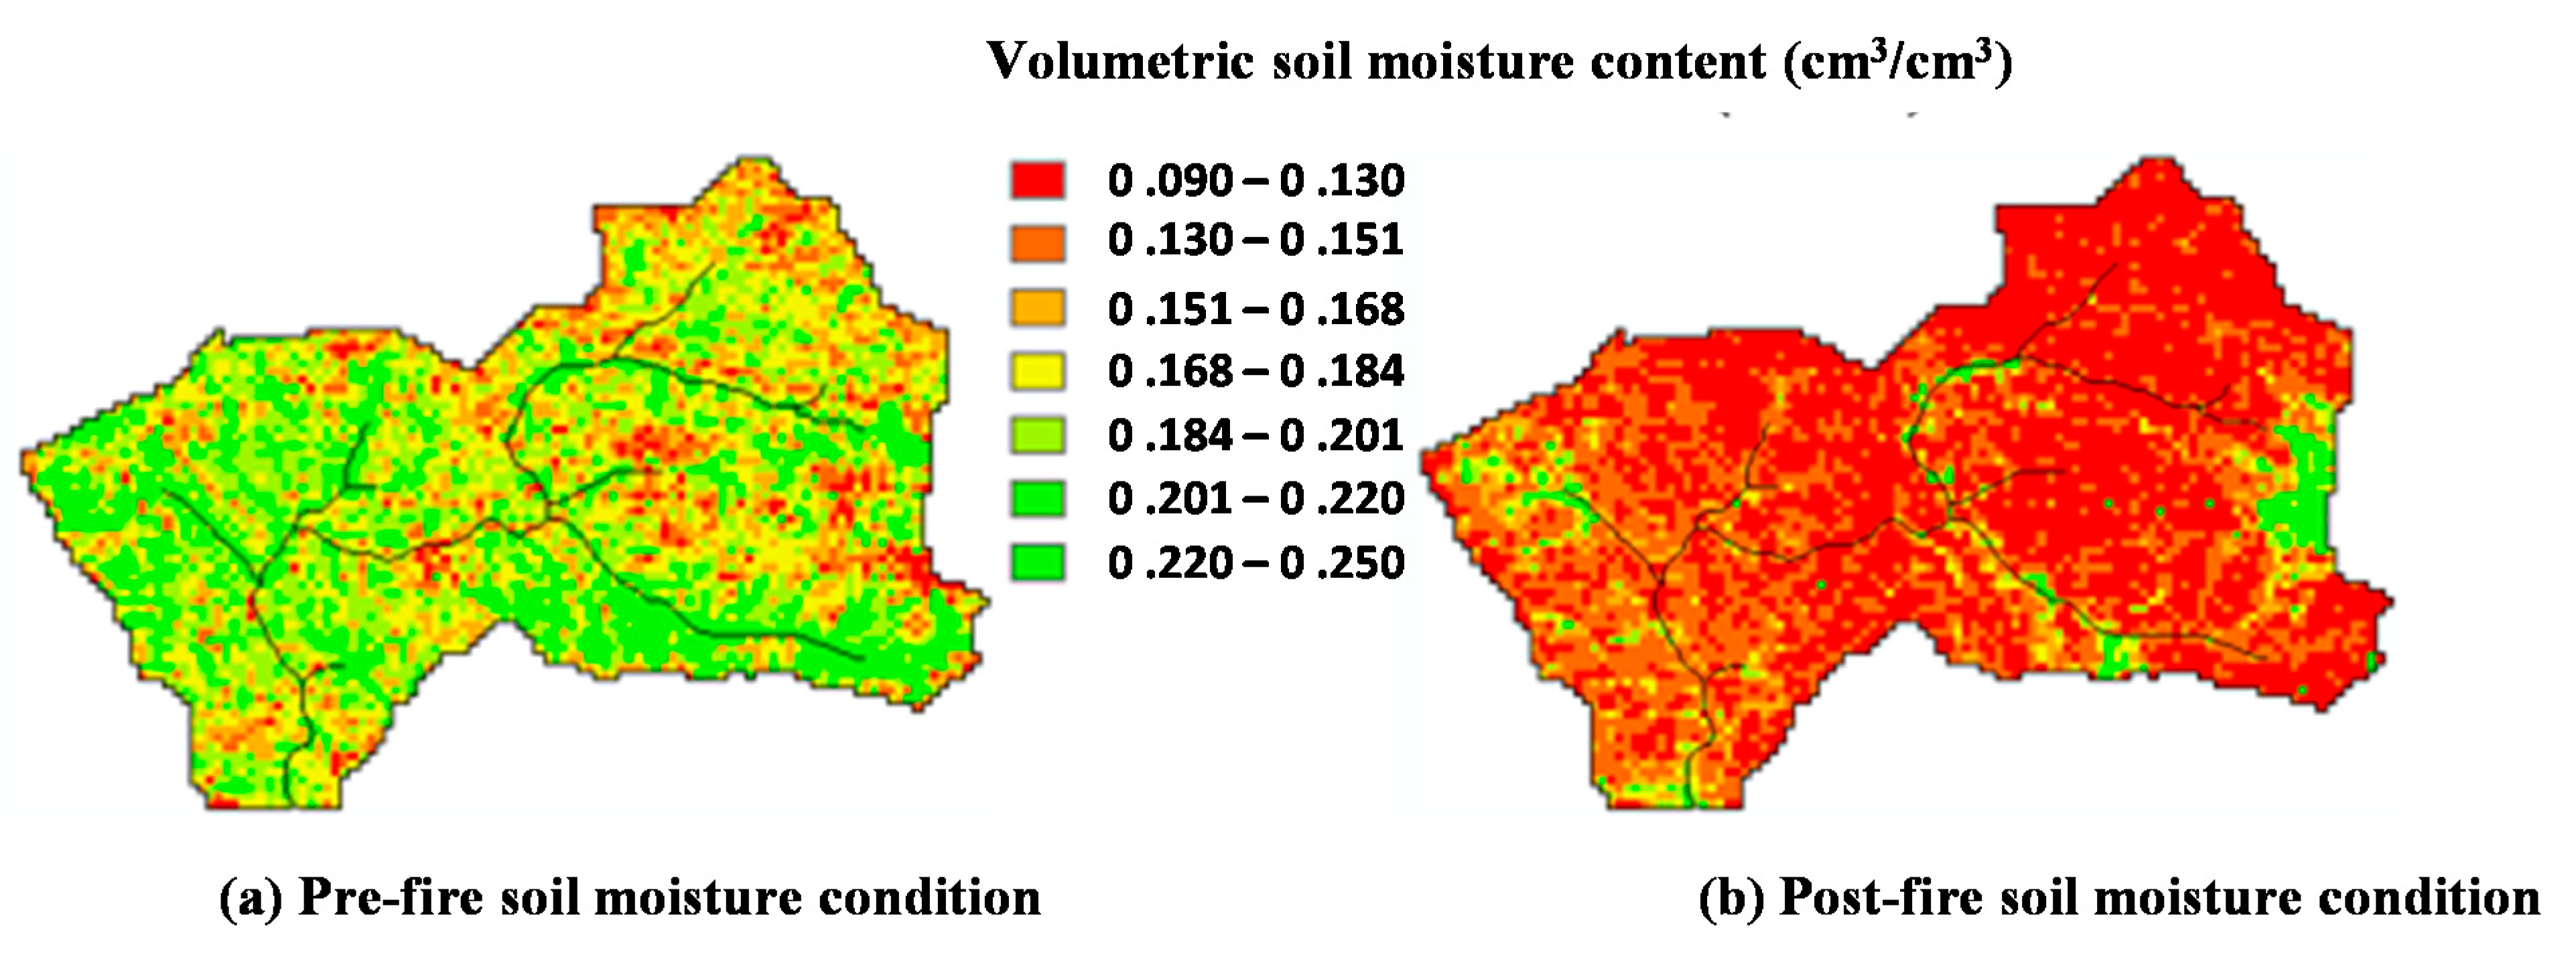
Figure 5 illustrates the SERVES estimated soil moisture in the pre-fire condition and the post-fire condition. The soil moisture is originally estimated at 30-m resolution and then resampled to 90-m resolution to match the topographic and computational GSSHA model grid resolution that was fixed at 90-m. Both soil moisture estimated in Figure 5a,b are the representative soil moisture of January. The pre-fire soil moisture in Figure 5a is significantly higher than the estimated soil moisture in the post-fire condition in Figure 5b.
If this difference in distributed soil moisture is not included in the hydrological model, the simulation results lead to:
- (a)
- misleading parameter value identification in the process of matching the simulated discharge with the observed discharge.
- (b)
- misleading concepts of post-fire burn effect in the runoff generation process.
The second point is directly related to this study, as the reduction of infiltration and the water repellent soil property in a post-fire scenario is diminished at higher initial soil moisture content.
4.3. Pre-Fire Hydrologic Model Development
The hydrological model was developed with the infiltration [42] and soil moisture accounting processes [29]. Pedotransfer functions estimated the soil water properties, of the soil texture identified as sandy loam, as defined by Table 1. In Table 1, except for soil hydraulic conductivity, the source for soil physical parameter value assignments was based on Rawls et al. [27]. Although the calibrated saturated soil hydraulic conductivity is at the lower limit for sandy loam soil, according to USDA [43], the soil in this steep terrain can be categorized as Hydrologic Soil Group B.
Diffusive wave approach was deployed to route the generated overland runoff. The Manning roughness parameter values for the two-dimensional hillslope/overland routing model as shown in Table 2 were employed from the literature [38,44]. With Arroyo Seco being a seasonal river, the channel sections are often covered with grass and shrub with underlain cobble and boulder. Therefore, the Manning roughness in the one-dimensional channel routing was fixed at 0.05 s/m1/3 [45].
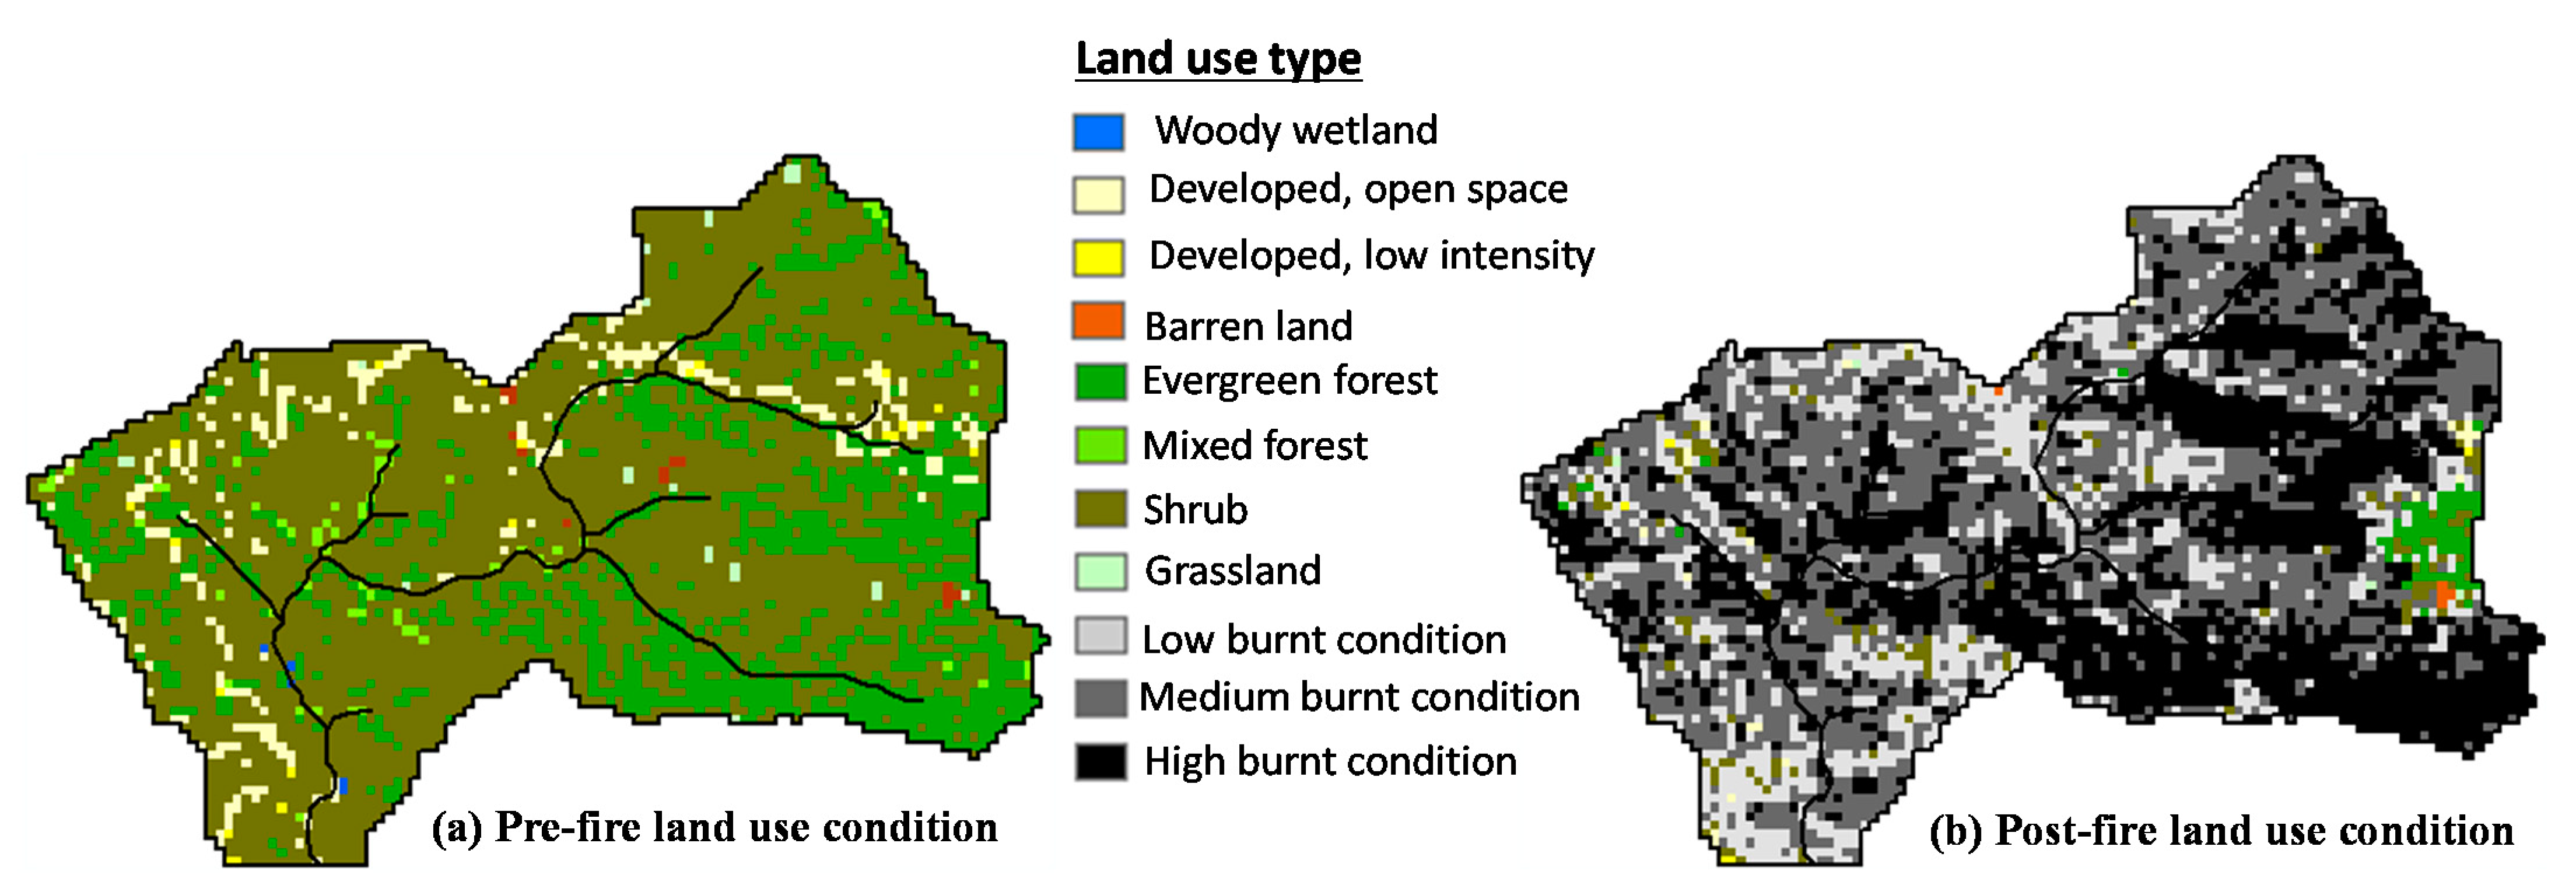
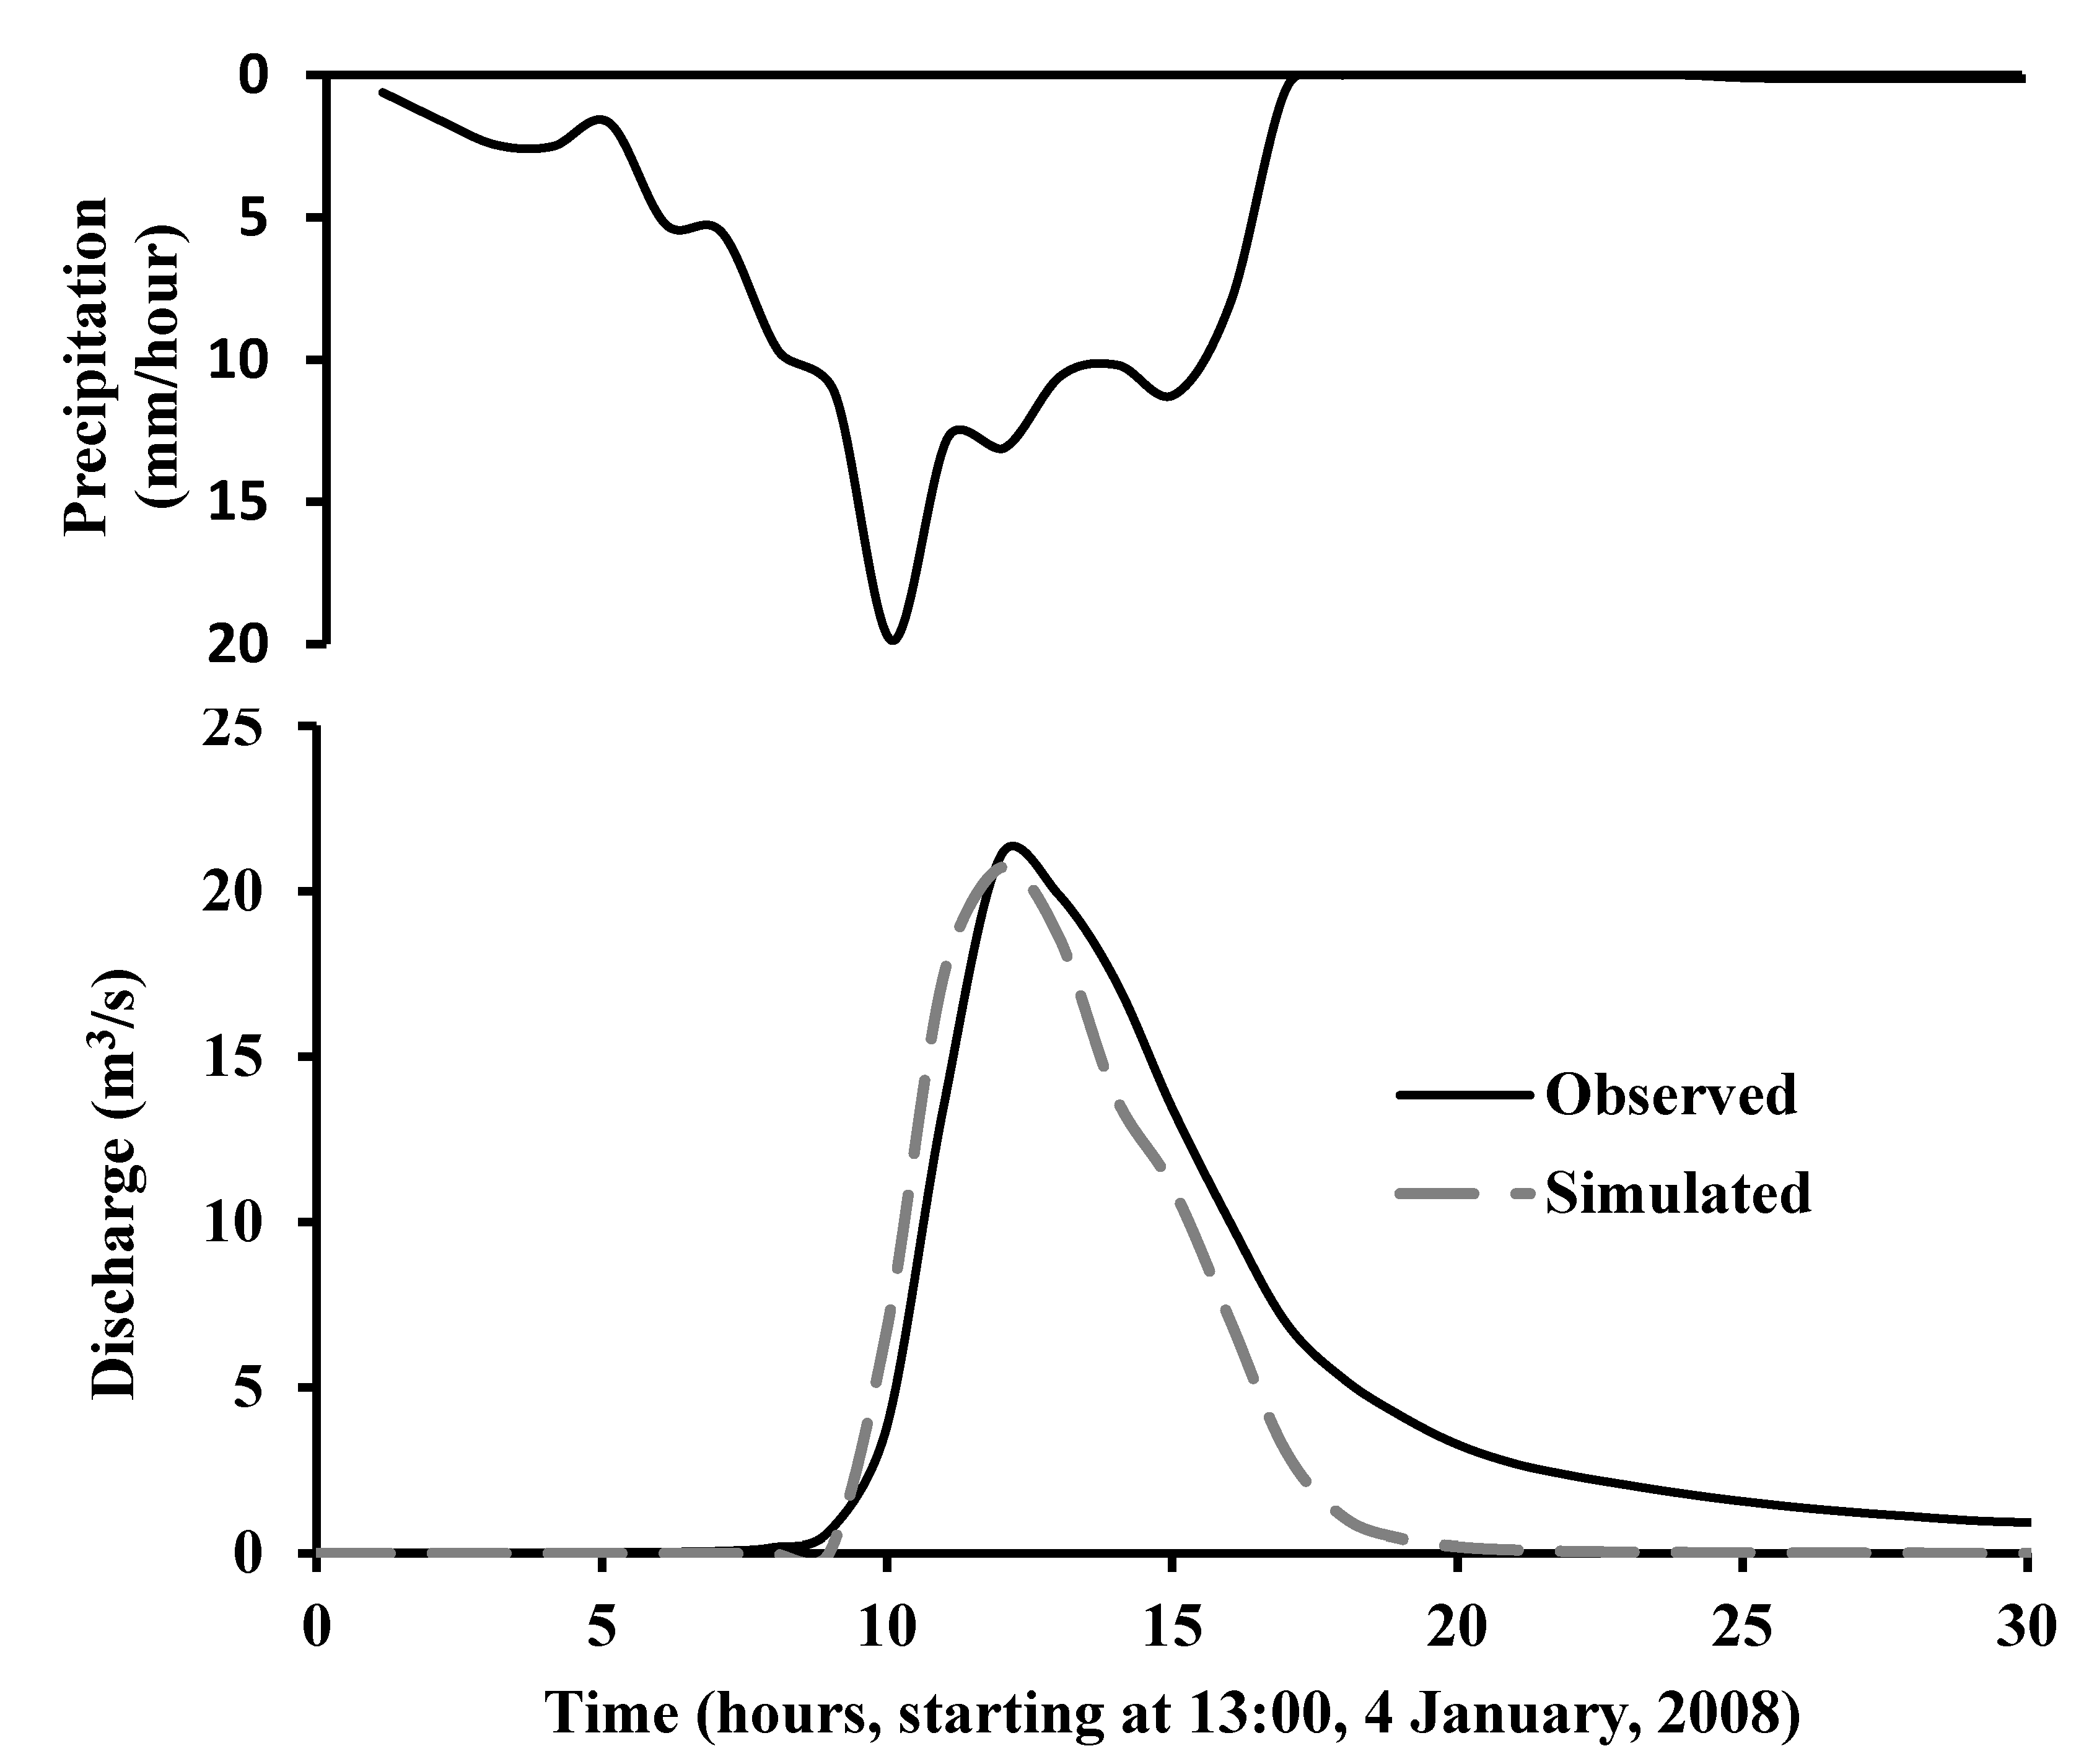
The land-use types defined in Table 2 are from the NLCD land cover data set prior to the 2009 wild-fire, as presented in Figure 6a. The state of the initial soil moisture distribution and its application resolution directly affects a physics-based distributed hydrological model’s parameter values and the model’s results [29]. The soil moisture condition in 2008 January shown in Figure 5a is employed as the soil moisture initial condition for the hydrological model. In previous GSSHA model calibrations [29,46,47,48], parameter values were adjusted manually by bounding the parameter values within the physical limits obtained through theoretical understanding and the experience with the model. This study undertook a similar manual calibration approach for the event of 4 January 2008. The rainfall event of 4 January 2008 was taken as a pre-fire rainfall event for pre-fire Arroyo Seco model calibration. The Nash–Sutcliffe efficiency maximization was the objective function in the model performance optimization. The Nash–Sutcliffe efficiency obtained in Figure 7 is 88%.
4.4. Post-Fire Hydrologic Model Development
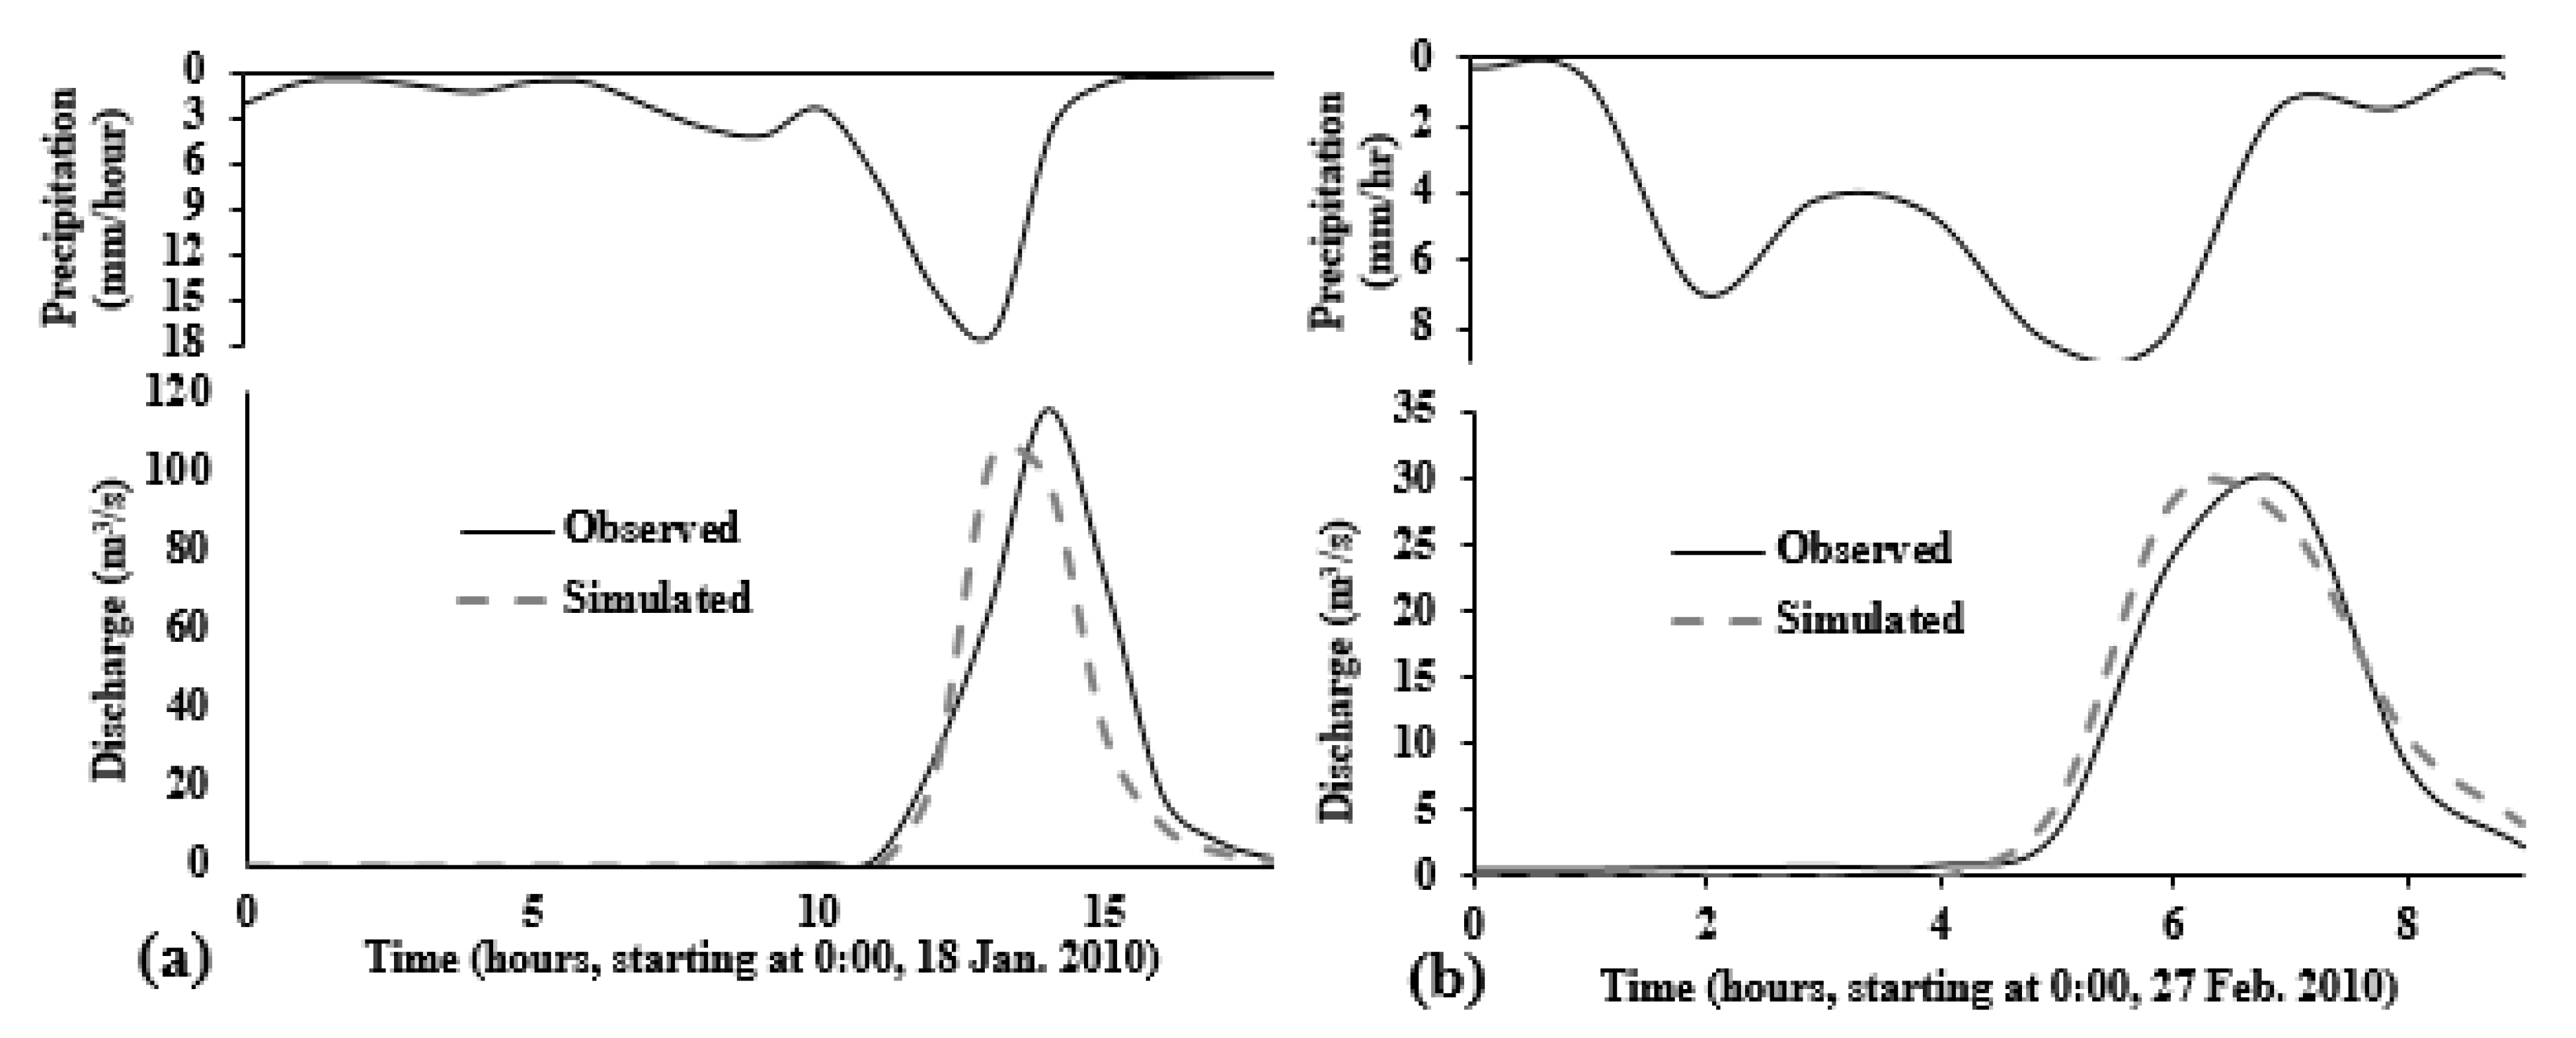
The pre-fire calibrated Arroyo Seco model was deployed for the post-fire rainfall events of 18 January 2010 and the simulated result is shown in Figure 8a. The simulation result in Figure 8a is significantly underestimated as compared to the observed results, with a Nash–Sutcliffe Efficiency of −24%. Similarly, the calibrated model was also deployed for the post-fire rainfall events of 27 February 2010 and the simulation result is shown in Figure 8b, showing there was no discharge.
This underestimation of the runoff when applying the pre-fire calibrated model to the post-fire events clearly shows that in a post-fire scenario, the actual runoff, even from a relatively small magnitude of rainfall, is significantly enhanced, as shown by the rainfall runoff events in Figure 7 and Figure 8. The burned event occurred in the fall of 2009. The post-fire rainfall events of January and February of 2010 were just a few months away from that fire event.
Figure 2 shows the burned condition due to the ‘Station Fire’ of August 2009. A total of 95% of this study area in Figure 2 was burned, of which 18% was low burned, 42% was medium burned and 35% was high burned. This increased runoff magnitude in a post-fire rainfall event was due to watershed hydro-physical changes in a post-fire scenario that included enhanced soil water repellency and decreased infiltration [8,9,10,11]. The loss of vegetation and soil organic matter in a post-fire condition also results in the significant changes to geophysical and hydro-dynamic parameters [12].
Considering these post-fire hydrological changes, the first item of consideration is the initial soil moisture condition. SERVES estimated distributed initial soil moisture condition, shown in Figure 5b was employed as the initial soil moisture for the 18 January 2010 rainfall-runoff simulation and February 2010 rainfall-runoff simulation. As described in the methodology section, above, Equation (4) was used to reduce the hydraulic conductivity that conceptually takes into account of the soil water repellency and decreased infiltration due to burned condition.
A soil burn severity factor was introduced in Equation (4) to vary the influence of the hydraulic conductivity reduction factor as per the burn severity at a location. A burn severity factor adjustment for a location was made as per the burn severity map, as shown in Figure 2, overlaid with the uniform sandy loam soil map. Table 3 shows the final adjusted/calibrated values of the ‘hydraulic conductivity reduction factor’ and ‘soil burned degree factor’ for different burned conditions.
Figure 6b shows the land cover map overlaid with the burn condition map. To take account of the changed vegetation density after the fire, as shown by Figure 6b and Figure 4, the Manning roughness parameter value was readjusted. Figure 4 shows that the headwater region of Arroyo Seco watershed vegetation was significantly wiped-out after the fire. Therefore, the Manning roughness parameter value for high burned area is considered that of a bare land and is taken as 0.15 as per Engman [38]. Likewise, the Manning roughness for medium burned and low burned condition is taken as 0.18 and 0.2, respectively, to represent an increased unburned vegetation. Table 4 shows the Manning roughness parameter values for burnt section for the post-fire hillslope/overland runoff modeling. To account for cobble and boulder in the Arroyo Seco channels, the Manning roughness was fixed at 0.05 s/m1/3 [45].
Figure 9 shows the post-fire model simulated discharge that is compared to the observed discharge. With the development of the post-fire Arroyo Seco watershed model, the Nash–Sutcliffe Efficiency for 18 January 2010 enhanced from −24% in Figure 8a to 82% in Figure 9a. This post-fire model was employed also for the rainfall events of 27 February 2010 and the Nash–Sutcliffe Efficiency enhanced from −47% in Figure 8b to 96% in Figure 9b. Equation 4 played the most dominant role in enhancing the simulated runoff and Nash–Sutcliffe Efficiency in the post-fire simulated results shown in Figure 9.
5. Summary and Conclusions
Wildfires are among the most common forms of natural disasters in regions with arid, semi-arid and Mediterranean climates found in locations like California, U.S.A. The frequency of the wild-fire disaster has increased over the years is attributed to extended dry periods due to climate change. Floods and erosion are a serious problem in a post-fire rainfall event. Therefore, understanding and development of pre-fire and post-fire hydrological processes and integrating those processes into a physics-based distributed hydrological modeling of a watershed in a wild-fire repeating reason is critical for emergency assessments. The 2009 Station fire in the Los Angeles County burned 95% of the upper Arroyo Seco watershed. The watershed was employed in this study to develop the hydrological model of January 2008 rainfall event as a pre-fire event-based watershed hydrological model.
This pre-fire watershed model was then employed in the rainfall events of 18 January 2010 and 27 February 2010 after the fire event of August–September 2009 in the watershed. The pre-fire watershed model, when employed in the post-fire rainfall events without considering the fire effects, vastly underestimated the simulated discharge. For this reason, in this study of the post-fire catchment runoff modeling the following points are taken into consideration: (a) a realistic distributed initial soil moisture condition; (b) a formulation with reduction factor and burn severity factor to reduce the soil hydraulic conductivity due to fire effects in the soil characteristics in the process of infiltration; and (c) runoff routing parameterization under burned conditions. Developing the post-fire Arroyo Seco watershed model by taking into account the three points mentioned above improved the Nash–Sutcliffe Efficiency from −24% to 82% for 18 January 2010 rainfall event and from −47% to 96% for the 27 February 2010 rainfall event.
This event-based post-fire modeling method can be used in an event-based post-fire flooding emergency assessment. With the advancement of various geospatial data and machine learning techniques the forest fire susceptible regions can be demarcated [49,50]. Running this event-based post-fire modeling method with return-period rainfall scenarios in such forest fire susceptible regions can help identify critical flooding zones. Identifying critical flooding zones helps to plan mitigation measures. Increased runoff with higher concentration of sediment-laden post-fire flow condition leads to transitioning from Newtonian to Non-Newtonian fluid-flow condition [51,52]. The post-fire hydrologic model developed in this study will be used in the analysis of this Newtonian to Non-Newtonian fluid flow transition.
In this study, the post-fire hydrological analysis is limited to rainfall events within few months after the wild-fire disaster. Hydrological modeling for a long-term effect of a wild-fire in a watershed requires understanding and a method to represent the wild-fire affected watershed-hydrology recovery process. Hydrological modeling to analyze such long-term effect of the wild-fire is a future research work.
Author Contributions
Methodology and software development: N.R.P.; Conceptualization, analysis, writing, reviewing and editing: N.R.P. and I.F. All authors have read and agreed to the published version of the manuscript.
Funding
This research was supported by the US Army Corps of Engineers Post-Wildfire Flood Risk Management Research and Development Program.
Acknowledgments
Constructive comments from four anonymous reviewers are greatly appreciated.
Conflicts of Interest
The authors declare no conflict of interest.
References
- Bowman, D.M.J.S.; Balch, J.K.; Artaxo, P.; Bond, W.J.; Carlson, J.M.; Mark, A.C.; D’ Antonio, C.M.; DeFries, R.S.; Doyle, J.C. Fire in the Earth System. Science 2009, 324, 481–488. [Google Scholar] [CrossRef]
- González, N.C.; Kröger, M. The potential of Amazon indigenous agroforestry practices and ontologies for rethinking global forest governance. For. Policy Econ. 2020, 118, 102257. [Google Scholar] [CrossRef]
- Lierop, P.V.; Lindquist, E.; Sathyapala, S.; Franceschini, G. Global forest area disturbance from fire, insect pests, diseases and severe weather events. For. Ecol. Manag. 2015, 352, 78–88. [Google Scholar] [CrossRef] [Green Version]
- Pugh, T.A.M.; Rademacher, T.; Shafer, S.L.; Steinkamp, J.; Barichivich, J.; Beckage, B.; Haverd, V.; Harper, A.; Heinke, J.; Nishina, K.; et al. Understanding the uncertainty in global forest carbon turnover. Biogeosciences 2020, 17, 3961–3989. [Google Scholar] [CrossRef]
- Westerling, A.L.; Hidalgo, H.G.; Cayan, D.R.; Swetnam, T.W. Warming and Earlier Spring Increase Western, U.S. Forest Wildfire Activity. Science 2006, 313, 940–943. [Google Scholar] [CrossRef] [Green Version]
- Halofsky, J.E.; Peterson, D.L.; Harvey, B.J. Changing wildfire, changing forests: The effects of climate change on fire regimes and vegetation in the Pacific Northwest, USA. Fire Ecol. 2020, 16, 4. [Google Scholar] [CrossRef] [Green Version]
- Williams, A.; Abatzoglou, J.; Gershunov, A.; Guzman-Morales, J.; Bishop, D.; Balch, J.; Lettenmaier, D. Observed Impacts of Anthropogenic Climate Change on Wildfire in California. Earth’ s Future 2019, 7, 892–910. [Google Scholar] [CrossRef] [Green Version]
- DeBano, L.F. The role of fire and soil heating on water repellency in wildland environments: A review. J. Hydrol. 2000, 231–232, 195–206. [Google Scholar] [CrossRef]
- Robichaud, P.R. Fire effects on infiltration rates after prescribed fire in Northern Rocky Mountain forests, USA. J. Hydrol. 2000, 231–232, 220–229. [Google Scholar] [CrossRef]
- Letey, J. Causes and consequences of fire-induced soil water repellency. Hydrol. Process. 2001, 15, 2867–2875. [Google Scholar] [CrossRef]
- Jung, H.Y.; Hogue, T.S.; Rademacher, L.K.; Meixner, T. Impact of wildfire on source water contributions in Devil Creek, CA: Evidence from end-member mixing analysis. Hydrol. Process. 2009, 23, 183–200. [Google Scholar] [CrossRef]
- Kinoshita, A.M.; Hogue, T.S. Spatial and temporal controls on post-fire hydrologic recovery in Southern California watersheds. Catena 2011, 87, 240–252. [Google Scholar] [CrossRef]
- Pierson, F.B.; Robichaud, P.R.; Spaeth, K.E. Spatial and temporal effects of wildfire on the hydrology of a steep rangeland watershed. Hydrol. Process. 2001, 15, 2905–2916. [Google Scholar] [CrossRef]
- Rulli, M.C.; Rosso, R. Hydrologic response of upland catchments to wildfires. Adv. Water Resour. 2007, 30, 2072–2086. [Google Scholar] [CrossRef]
- Moody, J.A.; Martin, D.A.; Haire, S.L.; Kinner, D.A. Linking runoff response to burn severity after a wildfire. Hydrol. Process. 2008, 22, 2063–2074. [Google Scholar] [CrossRef]
- Moody, J.A.; Martin, D.A. Synthesis of sediment yields after wildland fire in different rainfall regimes in the Western United States. Int. J. Wildland Fire 2009, 18, 96–115. [Google Scholar] [CrossRef]
- Neary, D.G. Post-Wildland fire Desertification: Can Rehabilitation Treatments Make a Difference? Fire Ecol. Spec. Issue 2009, 5, 129–144. [Google Scholar] [CrossRef]
- Lucas-Borja, M.E.; Bombino, G.; Carra, B.; D’Agostino, D.; Denisi, P.; Labate, A.; Plaza-Álvarez, P.A.; Zema, D. Modeling the Soil Response to Rainstorms after Wildfire and Prescribed Fire in Mediterranean Forests. Climate 2020, 8, 150. [Google Scholar] [CrossRef]
- Niemeyer, R.J.; Bladon, K.D.; Woodsmith, R.D. Long-term hydrologic recovery after wildfire and post-fire forest management in the interior Pacific Northwest. Hydrol. Process. 2000, 34, 1182–1197. [Google Scholar] [CrossRef]
- MacDonald, L.H.; Huffman, E.L. Post-fire Soil Water Repellency: Persistence and Soil Moisture Thresholds. Soil Sci. Soc. Am. J. 2004, 68, 1729–1734. [Google Scholar] [CrossRef]
- De Jonge, L.W.; Jacobsen, O.H.; Moldrup, P. Soil water repellency: Effects of water content, temperature, and particlesize. Soil Sci. Soc. Am. J. 1999, 63, 437–442. [Google Scholar] [CrossRef]
- Dekker, L.W.; Ritsema, C.J. Variation in water content and wetting patterns in Dutch water repellent peaty clay and clayey peat soils. Catena 1996, 28, 89–105. [Google Scholar] [CrossRef]
- Doerr, S.H.; Thomas, A.D. The role of soil moisture in controlling water repellency: New evidence from forest soils in Portugal. J. Hydrol. 2000, 231–232, 134–147. [Google Scholar] [CrossRef]
- Arroyo Seco Watershed Reconnaissance Study; US Army Corps of Engineers: Los Angeles, CA, USA, 2002; p. 25.
- Arroyo Seco Foundation: Arroyo Seco Watershed Restoration Feasibility Study; North East Trees: Pasadena, CA, USA, 2002.
- US Geological Survey (USGS). Product Guide, Landsat Surface Reflectance Derived Spectral Indices; Version 3.6; Department of the Interior: Washington, DC, USA, 2017.
- Rawls, W.J.; Brakensiek, D.L.; Miller, N. Green-Ampt infiltration parameters from soils data. J. Hydraul. Eng. 1983, 109, 62–70. [Google Scholar] [CrossRef] [Green Version]
- Pradhan, N.R. Estimating growing-season root zone soil moisture from vegetation index-based evapotranspiration fraction and soil properties in the Northwest Mountain region, USA. Hydrol. Sci. J. 2019, 64, 771–788. [Google Scholar] [CrossRef] [Green Version]
- Pradhan, N.R.; Floyd, I.; Brown, S. Satellite Imagery-Based SERVES Soil Moisture for the Analysis of Soil Moisture Initialization Input Scale Effects on Physics-Based Distributed Watershed Hydrologic Modelling. Remote Sens. 2020, 12, 2108. [Google Scholar] [CrossRef]
- Samani, A.N.; Farzin, M.; Rahmati, O.; Feiznia, S.; Kazemi, G.A.; Foody, G.; Melesse, A.M. Scrutinizing Relationships between Submarine Groundwater Discharge and Upstream Areas Using Thermal Remote Sensing: A Case Study in the Northern Persian Gulf. Remote Sens. 2010, 13, 358. [Google Scholar] [CrossRef]
- Downer, C.W.; Ogden, F.L. Appropriate vertical discretization of Richard’s equation for two-dimensional watershed-scale modelling. Hydrol. Process. 2004, 18, 1–22. [Google Scholar] [CrossRef]
- Brooks, R.H.; Corey, A.T. Hydraulic Properties of Porous Media, Hydrology Paper 3; Colorado State University: Fort Collins, CO, USA, 1964. [Google Scholar]
- Abbott, M.B.; Bathurst, J.C.; Cunge, J.A.; O’Connell, P.E.; Rasmussen, J. An introduction to the European Hydrological System–Systeme Hydrologique Europeen, ‘SHE,’ 2: Structure of a physically-based, distributed modeling system. J. Hydrol. 1986, 87, 61–77. [Google Scholar] [CrossRef]
- Julien, P.Y.; Saghafian, B.; Ogden, F.L. Raster-based hydrologic modeling of spatially-varied surface runoff. Water Resour. Bull. 1995, 31, 523–536. [Google Scholar] [CrossRef]
- Hydrologic Engineering Center (HEC). Hydrologic Modeling System HEC-HMS User’s Manual; Version 2; United States Army Corps of Engineers: Davis, CA, USA, 2000.
- Metcalf and Eddy, Inc.; University of Florida; Water Resources Engineers Inc. Storm Water Management Model; Version I; EPA-1102DOC07/71; Environmental Protection Agency: Washington, DC, USA, 1971. [Google Scholar]
- Arcement, G.; Schneider, V. Guide for Selecting Maning’ s Roughness Coefficients for Natural Channels and Flood Plains; Water-Supply Paper 2339; U.S. Geological Survey: Reston, VA, USA, 1990.
- Engman, E.T. Roughness coefficients for routing surface runoff. J. Irrig. Drain. Eng. 1986, 112, 39–53. [Google Scholar] [CrossRef]
- Vieux, B.E. Distributed Hydrologic Modeling Using GIS; Kluwer Academic Publishers: Dordrecht, The Netherlands, 2001. [Google Scholar]
- Jain, M.K.; Kothyari, U.C.; Raju, K.G.R. A GIS based distributed rainfall-runoff model. J. Hydrol. 2004, 299, 107–135. [Google Scholar] [CrossRef]
- Burian, S.J.; Brown, M.J.; McPherson, T.N. Evaluation of land use/land cover datasets for urban watershed modeling. Water Sci. Technol. 2002, 45, 269–276. [Google Scholar] [CrossRef] [PubMed]
- Green, W.H.; Ampt, G.A. Studies of soil physics: 1. Flow of air and water through soils. J. Agric. Sci. 1911, 4, 1–24. [Google Scholar]
- United States Department of Agriculture (USDA). Chapter 7 Hydrologic Soil Groups. In Part 630 Hydrology National Engineering Handbook; USDA: Washington, DC, USA, 2007. [Google Scholar]
- Senarath, S.U.S.; Ogden, F.L.; Downer, C.W.; Sharif, H.O. On the calibration and verification of two-dimensional, distributed, Hortonian, continuous watershed models. Water Resour. Res. 2000, 36, 1495–1510. [Google Scholar] [CrossRef]
- Chow, V.T. Open-Channel Hydraulics; McGraw-Hill: New York, NY, USA, 1959; p. 680. [Google Scholar]
- Pradhan, N.R.; Downer, C.W.; Johnson, B.E. A Physics Based Hydrologic Modeling Approach to Simulate Non-point Source Pollution for the Purposes of Calculating TMDLs and Designing Abatement Measures, In Practical Aspects of Computational Chemistry III; Springer: Berlin, Germany, 2014; Volume 32, pp. 249–282. [Google Scholar]
- Pradhan, N.R.; Loney, D. An analysis of the unit hydrograph peaking factor: A case study in Goose Creek Watershed, Virginia. J. Hydrol. Reg. Stud. 2018, 15, 31–48. [Google Scholar] [CrossRef]
- Pradhan, N.R.; Downer, C.; Marchinko, S. Catchment Hydrological Modeling with Soil Thermal Dynamics during Seasonal Freeze-Thaw Cycles. Water 2019, 11, 116. [Google Scholar] [CrossRef] [Green Version]
- Achu, A.L.; Thomas, J.; Aju, C.D.; Gopinath, G.; Kumar, S.; Reghunath, R. Machine-learning modelling of fire susceptibility in a forest-agriculture mosaic landscape of southern India. Ecol. Inform. 2021, 64, 101348. [Google Scholar] [CrossRef]
- Tonini, M.; D’ Andrea, M.; Biondi, G.; Esposti, S.D.; Trucchia, A.; Fiorucci, P. A Machine Learning-Based Approach for Wildfire Susceptibility Mapping. The Case Study of the Liguria Region in Italy. Geosciences 2020, 10, 105. [Google Scholar] [CrossRef] [Green Version]
- Floyd, I.; Gibson, S.; Heath, R.; Ramos-Villanueva, M.; Pradhan, N.R. Development of ‘Debris Library‘ and 1D HEC-RAS and 2D Adaptive Hydraulics Linkage-Architecture for Predicting Post-Wildfire non-Newtonian Flows. In Proceedings of the Federal Interagency SEDHYD, Reno, NV, USA, 24–28 June 2019. [Google Scholar]
- Pradhan, N.R.; Floyd, I.; Downer, C.; Gibson, S.; Heath, R. Newtonian and Non-Newtonian sediment fluid flow hydrodynamic runoff model. In Proceedings of the Federal Interagency SEDHYD, Reno, NV, USA, 24–28 June 2019. [Google Scholar]
Figure 1.
The study watershed, Upper Arroyo Seco watershed in southern California, USA.

Figure 2.
Upper Arroyo Seco burned severity map after the ‘Station Fire’ of August 2009.

Figure 3.
Composite natural-color satellite image obtained from MODIS Surface Reflectance bands 1 (red), 4 (green) and 3 (blue) on 30 August 2009, during ‘Station Fire’.
Figure 3.
Composite natural-color satellite image obtained from MODIS Surface Reflectance bands 1 (red), 4 (green) and 3 (blue) on 30 August 2009, during ‘Station Fire’.

Figure 4.
Burned hillslopes at the Arroyo Seco watershed in the 2009 Station Fire, CA.

Figure 5.
SERVES estimated upper Arroyo Seco soil moisture in the pre-fire condition and the post-fire condition.
Figure 5.
SERVES estimated upper Arroyo Seco soil moisture in the pre-fire condition and the post-fire condition.

Figure 6.
Pre- and post-fire land cover condition in the upper Arroyo Seco watershed.

Figure 7.
Upper Arroyo Seco calibrated runoff comparison to the observed runoff for the rainfall event of 4 January 2008.
Figure 7.
Upper Arroyo Seco calibrated runoff comparison to the observed runoff for the rainfall event of 4 January 2008.

Figure 8.
Upper Arroyo Seco pre-fire event calibrated model applied to post-fire events of (a) 18 January 2010 and (b) 27 February 2010.
Figure 8.
Upper Arroyo Seco pre-fire event calibrated model applied to post-fire events of (a) 18 January 2010 and (b) 27 February 2010.

Figure 9.
Comparison of simulated runoff with observed runoff, in the post-fire events of (a) 18 January 2010 and (b) 27 February 2010, after the development of the Upper Arroyo Seco post-fire model.
Figure 9.
Comparison of simulated runoff with observed runoff, in the post-fire events of (a) 18 January 2010 and (b) 27 February 2010, after the development of the Upper Arroyo Seco post-fire model.


Table 1.
Soil infiltration parameter values based on soil texture.
| Soil Infiltration Parameter | Value |
|---|---|
| Saturated hydraulic conductivity (cm/h) | 0.81 |
| Capillary head (cm) | 11.0 |
| Porosity (m3/m3) | 0.41 |
| Pore distribution index (cm/cm) | 0.37 |
| Residual point (m3/m3) | 0.04 |
| Field capacity (m3/m3) | 0.2 |
| Wilting point (m3/m) | 0.09 |
Table 2.
The Manning roughness parameter values for the routing model.
| Land Cover Type/Condition | Manning Roughness Value (s/m1/3) |
|---|---|
| Woody wetland | 0.14 |
| Developed. open space | 0.15 |
| Developed. low intensity | 0.15 |
| Barren land | 0.20 |
| Evergreen forest | 0.45 |
| Mixed forest | 0.45 |
| Shrub | 0.44 |
| Grassland | 0.43 |
Table 3.
Values of the hydraulic Conductivity Reduction Factor and the Burnt Degree Factor of Equation (4) for different burned conditions.
Table 3.
Values of the hydraulic Conductivity Reduction Factor and the Burnt Degree Factor of Equation (4) for different burned conditions.
| Burned Condition | Hydraulic Conductivity Reduction Factor (RFk) | Burned Degree Factor (BDF) |
|---|---|---|
| High | 0.1 | 1 |
| Medium | 0.1 | 2 |
| Low | 0.1 | 3 |
Table 4.
Manning roughness value for different burned conditions.
| Burned Condition | Manning Roughness Value (s/m1/3) |
|---|---|
| No burned condition | As per Table 2 |
| Low burned condition | 0.2 |
| Medium burned condition | 0.18 |
| High burned condition | 0.15 |
Publisher’s Note: MDPI stays neutral with regard to jurisdictional claims in published maps and institutional affiliations. |
© 2021 by the authors. Licensee MDPI, Basel, Switzerland. This article is an open access article distributed under the terms and conditions of the Creative Commons Attribution (CC BY) license (https://creativecommons.org/licenses/by/4.0/).
Share and Cite
MDPI and ACS Style
Pradhan, N.R.; Floyd, I. Event Based Post-Fire Hydrological Modeling of the Upper Arroyo Seco Watershed in Southern California. Water 2021, 13, 2303. https://doi.org/10.3390/w13162303
AMA Style
Pradhan NR, Floyd I. Event Based Post-Fire Hydrological Modeling of the Upper Arroyo Seco Watershed in Southern California. Water. 2021; 13(16):2303. https://doi.org/10.3390/w13162303
Chicago/Turabian StylePradhan, Nawa Raj, and Ian Floyd. 2021. "Event Based Post-Fire Hydrological Modeling of the Upper Arroyo Seco Watershed in Southern California" Water 13, no. 16: 2303. https://doi.org/10.3390/w13162303
Note that from the first issue of 2016, this journal uses article numbers instead of page numbers. See further details here.