
Storage-Discharge Relationships under Forest Cover Change in Ethiopian Highlands


1
Ethiopian Institute of Water Resources, Addis Ababa University, Addis Ababa 150461, Ethiopia
2
Water and Land Resources Center (WLRC), Addis Ababa University, Addis Ababa 3880, Ethiopia
3
Research Centre for BioSystems, Land Use and Nutrition (iFZ), Institute for Landscape Ecology and Resources Management (ILR), Justus Liebig University Giessen, Heinrich-Buff-Ring 26, 35392 Giessen, Germany
4
Centre for International Development and Environmental Research (ZEU), Justus Liebig University Giessen, Senckenbergstrasse 3, 35390 Giessen, Germany
5
College of Food, Agricultural and Environmental Resources, School of Environment and Natural Resources, OARDC—133 Williams Hall, Ohio State University, 1680 Madison Avenue, Wooster, OH 44691, USA
*
Author to whom correspondence should be addressed.
Water 2021, 13(16), 2310; https://doi.org/10.3390/w13162310
Submission received: 18 June 2021
/
Revised: 6 August 2021
/
Accepted: 20 August 2021
/
Published: 23 August 2021
(This article belongs to the Section Hydrology)
Abstract
:Detecting the impacts of forest cover changes on hydrology is challenging given uncertainties in how changes will manifest in observed streamflow. Considering changes in the rate of change of observed streamflow (e.g., recession characteristics) may offer insights to hydrological shifts driven by forest cover change that are not seen when considering absolute changes of streamflow itself. This study assesses the impacts of forest cover changes on the storage–discharge relationships in three meso-scale watersheds in the highlands of Ethiopia based on a 30-year hydro-climatic and land cover change dataset. We analyze streamflow recessions and fitted parameters of a linear reservoir model to depict fundamental shifts in the storage–discharge relation for these watersheds. Our analysis shows that recession slopes and the total storages increase as natural forest covers decrease in the 273 km2 Woshi-Dimbira and 1980 km2 Upper-Didesa watersheds. The linear reservoir model storage coefficient parameter shows an increasing trend with time for the 41 km2 Sokoru watershed which is afforested, indicating faster drainage and reduction in storage. Our work highlights that considering storage–discharge relationships may be useful for assessing the impacts of forest cover change on water resources in regions where land use change is active and rapid.
1. Introduction
Detecting direct contribution of forest cover change to hydrological responses remains elusive. Often, the outcome of hydrological change due to forest cover change is unpredictable. According to observational analysis, afforestation is assumed to result in a reduction of streamflow while deforestation leads to an increase in streamflow with both changes being mainly related to changes in transpiration rates [1]. However, streamflow and other hydrological responses in watersheds typically depend on combinations of environmental factors like soils and geology or climatic boundary conditions. For example, there is a potential increase in dry season flow after afforestation in dry regions [2,3,4].
Moreover, when land cover changes are complex, e.g., not simple clear cutting nor full afforestation, the impact on streamflow and water resources are often confounding. Lyon et al., for example needed to decouple land cover changes from climatic trends and then apply a model-derived screening method to assess deviations from typical flow values to detect changes in hydrological behavior potential connected with land cover changes across the Lower Mekong region [5]. Clearly, changes in forest cover affect different parts of the hydrological regime (i.e., surface runoff, groundwater recharge, and storage change) of a watershed. This is because forest change can influence evapotranspiration and recharge processes more than other parts of the water cycle [6,7]. Forest changes are believed to influence streamflow mainly derived from watershed storage (e.g., dry season hydrology) more so than the total annual or the wet season hydrology [3,8]. Therefore, it may be useful to look to techniques that isolate parts of the hydrograph or consider rate changes of streamflow to assess alterations under changes in forest cover.
While groundwater recharge and streamflow generation can be altered through forest cover changes, especially when the alteration of vegetation or agricultural expansion occurs over large areas respective to the watershed size [3,9,10], the magnitude and seasonality of hydrological impacts are highly variable depending on regional conditions. As such, there is still a challenge to observe changes in hydrological behaviour and its potential relationship with forest cover—which can have implications for regions targeted for development through exploitation of natural resources [5]. Recently, there has been a resurgence around using storage–discharge relationship changes to assess changes in watershed storage such as those we might expect from land cover changes [11,12].
Recession analysis is a powerful tool to assess dynamics of storage–discharge relationships with temporal and spatial differences [13,14]. Under the assumptions of a unique relationship between storage and streamflow and a closed water balance, recession curves quantify the storage–discharge relationship [12,15]. Recession curves are determined by fitting a nonlinear storage–discharge relationship to falling limbs of hydrographs during periods with no precipitation. These are periods when changes in streamflow are assumed to predominantly reflect changes in catchment water storage [12,16,17]. Relatively new developments with storage–discharge analysis are therefore to interpret changes in recession parameters in terms of potential changes in the underlying controls or drivers [18]. For example, Brutsaert, used time series of annual low-flow discharge for catchments in the eastern USA to detect increasing trends in groundwater storage [19]. Changes in recessions have been analyzed by using a flow record from a single catchment with different conditions in time [20] or by using flow records from multiple catchments with different characteristics and similar forcing [18,21]. Recession analysis has thus proven insightful in addressing differences in natural-induced and human-induced landscape changes [18] and the variability in recession parameters can possibly reveal information about the complexities in watershed response [22].
Watershed storage–discharge analysis viewed through streamflow recession is thus an attractive approach to help understand the effect of land use change, like forest cover change, on hydrological regime [11]. Watershed storage can be considered an active reserve of water stored in the subsurface which is part of the aquifer in the watershed. Watershed storage represents a dynamic volume of water that is intimately coupled to ecosystem functioning and hydrological response. For example, during the absence of rain, watershed storage is the source of the flowing water in rivers—the baseflow. The dry season hydrology is thus governed by storage via the capacity of the soil infiltration and sub-surface flow and depth of the aquifer [23]. Watershed storage serves as an essential source of water governing agricultural production and ecosystem services in many parts of the world [24].
Watershed storage parameters are highly linked to land use changes, especially to forest restoration and deforestation when storage dynamics instead of storage amounts are considered [18]. During the time of river flow originating from watershed storage, there is less supply of water and low level of reservoir water [25]. The struggle to secure water and food accessibility requires understanding of characteristics of water availability, and specifically the storage dynamics especially throughout seasonal rainfall regions of the world. Minor amounts of changes in water storage, for example through climatic changes in rainfall patterns or land cover changes impacting evapotranspiration, could end up bringing huge impact on agricultural production and rural livelihood.
This threat is very real in countries like Ethiopia, where water availability varies seasonally and there is typically less technology to manage water resources. The Ethiopian highlands are feeding the lowlands which covers half of the country’s land mass, as well as the headwaters for transboundary rivers of East Africa. Most parts of the low lands in Ethiopia or neighbouring countries are frequently facing water security problems and at times severe drought. Water insecurity and severe droughts are obviously directly related to the availability and accessibility of water during dry season of the year. In many cases, how much the source of the dry season flow (which originates from the watershed storage) is being affected by the concurrent environmental change is unknown in Ethiopian highlands.
Ethiopian highlands are one of the hot spot regions of the world where higher extent of deforestation as well as afforestation are taking place. All over the country, 21% (31 × 103 km2) of the natural forest was lost between 1990 and 2015, whereas plantations increased by 97% (4.8 × 10³ km2) between the same period of time [26,27]. Because of the optimism of carbon trade and other economic incentives, new plantations are being promoted in the highlands. In addition, because of the need for more agricultural land, natural forests are continuing to be deforested.
Decades of work relating forest cover change to runoff has not shown clear relations between forest cover change and hydrology in Ethiopian highlands [2,28]. Further, relationships between forest cover change and runoff fall victim to masking effects of uncertainties in the measurements [29]. Studies have shown that much of the impacts of forest cover change on hydrology is highly dependent on scale and locations of watersheds, and remain inconsistent between different watersheds. Aggregation of effects of land use change and other watershed characteristics obscure detection of impacts of forest cover change on hydrology from analysis of observed or simulated streamflow [30]. Therefore, the analysis of watershed storage dynamics comes into picture as a possible way to diagnose the impacts of active forest cover changes.
The objective of this work is to analyze changes in storage–discharge relationships and streamflow recession over time as they relate to forest cover changes in three meso-scale watersheds in the highlands of Ethiopia. Storage–discharge relationships were assessed using recession flow and a linear reservoir analysis method. How the dynamics of watershed storage in the headwaters are being affected because of changes in land cover has not been addressed by previous hydrological studies in the region and could offer valuable insights to coupled land-water impacts due to shifts in forest land cover [31].
2. Methods
2.1. Study Area
The south-western region of Ethiopian is an area of active and fast forest cover change. We study three watersheds with different land cover dynamics but similar topography (Table 1, Figure 1) between 35.9° to 37.5° E and 7.3° to 8.3° N. Streamflow from the Sokoru and Woshi-Dimbira watersheds feed the transboundary Omo-Gibe River flowing towards Kenya and the Upper-Didesa contributes more than 65% of runoff [32,33] to the Blue Nile River. The geology of the region is dominantly volcanic with basaltic rocks.
The region of the three watersheds represented by mono-modal rainfall pattern where the peak rain exhibited between May–September. Rivers of the three study watersheds are flowing from the highlands of South-western Ethiopia. This region dominantly early tertiary volcanic which has multi-layer interbedded soils and gravel [34]. Average hydro-climatic information of the three watersheds is presented in Table 1. These watersheds are considered not only for their regional importance but also for having what can be considered relatively high accessibility and good data quality for the region (see Section 2.2).
2.2. Hydro-Climatic Data
Daily precipitation, streamflow and air temperature data are obtained from the Ministry of Water, Energy and Irrigation (MoWEI), Ethiopia. Data span from 1983 to 2014 for Sokoru, from 1984 to 2014 for Woshi-Dimbira, and from 1986 to 2013 for Upper-Didesa.
Data quality is a concern in this region. In this study data quality is assessed using a double-mass balance curve (cumulative precipitation against cumulative runoff) to check for data consistency. In addition, annual water balances are plotted to identify missing data. When more than 10% of data per year was missing, the whole year is excluded from further analysis. For a given specific recession time of the year, 5% missing data is considered as a limit to exclude the year from analysis. In total, six years are excluded from further analysis due to missing data. These are 1988, 1992 and 2002 for Sokoru, 1989 for Woshi-Dimbira, as well as 1989 and 1995 for Upper-Didesa.
We analyze the dry season streamflow in this study as it best describes the water storage of a watershed. The dry season is defined here as non-rain season between November to February. The first 30 days of the period are considered for analysis of storage dynamics as water during this period mainly derives from storage and is influenced by land use characteristics [14]. The starting date for each 30-day period coincides with the last date of rain, which is at the end of the rainy season. The 30-day period is selected to control the relative larger uncertainty that is reported in Gebrehiwot et al. for longer 90-day recession periods [29]. The shorter duration excludes the impact of rare intermittent rainfall in the course of the dry season. The 30-day recession is computed for each year of the whole 30-year time series for each watershed meaning there is one 30-day recession period for every year. The 30-year time series for each watershed is then divided into three periods that are selected to align with the periods of forest cover changes in each watershed. As such, three period classes are made for each watershed: 1983–1992, 1993–2003 and 2004–2014 for Sokoru; 1984–1993, 1994–2003 and 2004–2014 for Woshi-Dimbira; 1986–1994, 1995–2003 and 2004–2013 for Upper-Didesa.
2.3. Remote Sensing and Forest Cover Change
Landsat imageries from 1985 (TM), 2001 (ETM+) and 2015 (ETM+) are used for classification. The imageries were obtained from USGS Earth Resources Observation and Science (EROS) data centre for the clear sky season of the area, which is January. Red, green and blue bands are used in all cases. Image analyst tool of ArcGIS 10.3 was used for land cover classifications and change analyses. Images were clipped to boundaries of each watershed. Then, pixel-based supervised classification system was used for classifying land cover. Landcover signatures (training points) were collected during 2006 field visit; 28 points for Sokoru, 67 points for Woshi-Dimbira and 104 points for Upper-Didesa. These training points were assigned to the 2001 image spectral features and classification was done using maximum likelihood rule. Then, the match between training points and spectral feature of the 2001 image was further used to classify landcover in the previous images. To check the accuracy of the procedures, the confusion matrix table was viewed for each landcover classification period; accordingly, it was found that the U_Accuracy (user’s accuracy) and P_Accuracy (procedural accuracy), both, found to be in the range of 0.77 to 0.89. Finally, the extent of each land cover for each period was calculated using the Raster Calculator tool.
Land cover change with an emphasis on forest cover types is analyzed across the three different periods. Active land cover change is meant for ongoing deforestation and afforestation activities which are concentrated in south-western parts of Ethiopia, where the case watersheds are located. Clearance of natural forests escalated since two to three decades ago mainly because of government based national resettlement campaigns and large-scale farming. Re-settlement campaigns started since 1990s, where land tenure policy and large-scale mechanized farming are related with the country’s land lease investment programmes. Such programs are more amplified since the beginning of 2000s. On the other hand, forest development activities are apparent in parts of south-western Ethiopia [29].
In general, natural forest, swamp vegetation, riverine forest, plantation, cultivated land and grazing land are identified as typical land cover types in the three watersheds. Natural forest is deciduous and evergreen, and high montane forest which exist in the area naturally. Swamp is an intermittent or permanent wetland where the water body is covered with marshy succulent vegetation. Riverine forests are trees along the riverbank. Plantation is a land covered with planted trees mostly with exotic species around houses as woodlot or in agricultural lands as commercial plantation. Cultivated lands are lands under seasonal crop cultivation. Grazing land is a land maintained for open cattle grazing.
2.4. Watershed Storage–Discharge Analysis
We explore the watershed storage–discharge relationship using a recession curve analysis and linear reservoir method. Recession analysis is a well-established method to examine storage–discharge relationships of catchments offering the advantage of being relatively insensitive to meteorological forcing during selected periods [14]. Recession analysis relates the rate of decline of streamflow to the absolute streamflow. Specifically, here we consider both a more general recession curve analysis without restrictions or assumptions around the linearity of the groundwater reservoir for our systems and a linear reservoir model approach. These two approaches allow us to explore the potential for shifting linearity of recession response over time, which can reflect shifts in the storage–discharge relationships and shifts in the characteristic timescale of the catchment drainage process, namely the storage coefficient [15].
In this study, we are primarily concerned with changes in the storage–discharge relationships over the broad time periods corresponding to land cover changes in our target watersheds. Further, as recession analysis can be challenging to connect directly to processes [18], and is potentially sensitive to data quality when it comes to fitting equations [22,35], our analysis can be considered a first-order estimate of the change in the storage–discharge relationship over time. For our target watersheds, we retain only streamflow data from the dry seasons when the input from precipitation is negligible and streamflow has a more direct relationship with the amount of water stored in a watershed.
2.4.1. Recession Curve Analysis
The recession curve analysis was performed for the selected dry season months of the year when there is no rainfall. Traditionally, the rate of outflow decline during the recession, namely −dQ/dt, is defined as:
where Q is outflow (mm d − 1), t is time (d) and S is the stored amount of water. The coefficient α relates to aquifer properties and the coefficient β relates to the linearity (or more appropriately, the non-linearity) of the reservoir drainage [36]. Thus, dQ/dS is then the sensitivity of outflow to a change in storage S, which is parameterized by α and β [12].
Graphic approaches are often considered to solve for the coefficients α and β. Specifically, if streamflow data for a recession period are plotted as log(−dQ/dt) against log(Q), then α represents the intercept and β represents the slope of a straight line fitted to the data. The recession curve analysis technique has been applied to many regions to help develop understanding around the relationship between groundwater and streamflow [20,37,38] and as such, can also be used to better understand the response of the storage–discharge relationship to shifts in climate or land cover [16,21,39].
The relationship expressed in Equation (1) is fitted as a simple linear regression with least square estimates [40,41]. This method of fitting to all data points avoids issues associated with defining a lower envelope to the cloud data points resulting from a recession flow analysis [42]. However, as discussed by [35], the spread in −dQ/dt at any value of Q may be due to stochastic variability and measurement noise, both of which can be problematic for streamflow data with uncertainties [43] complicating our ability to fit Equation (1) using any method. To control such variability, the average outflow of successive two days was plotted against the change in outflow for the two successive days.
2.4.2. Linear Reservoir Concept
Here we follow from Buytaert et al. building the linear reservoir concept as a function of watershed storage [40]:
where Q is the outflow (mm d − 1), S is the stored amount of water (mm d − 1), t is time (d) and k is a rate constant. Letting k = 1/T, we can combine and linearize Equation (2) and Equation (3):
With Qo being outflow (mm d − 1) at t = 0 when the recession begins. Taking only the non-rainy time (the 30-day time window) of the recession [44], such that Δt is the time lag interval between the outflow at the start of the recession (Qo) and streamflow as a function of time since the onset of the recession (Qt), we can solve the discrete form of Equation (4) for k as:
This rate constant k is then an index of the speed at which a reservoir drains [40], such that larger k values indicate faster draining systems relative to smaller k values.
For these types of fixed recession analysis techniques (akin to the fitting of master recession curves) selection of Δt is a challenge [45]. For this current study, Δt was assumed to be 30 days based on visual inspection of data available and exploration of the impacts of assuming other lag time intervals. Taking shorter lag times may not allow for the full recession to be achieved for the watersheds and taking longer periods did not significantly improve or change resulting estimations of k [29]. We thus obtained a k value for each year for each watershed by fitting Equation (5) to observed streamflow data covering the 30-day period following the beginning of the dry season.
3. Results
3.1. Hydroclimatic Data and Forest Cover Change
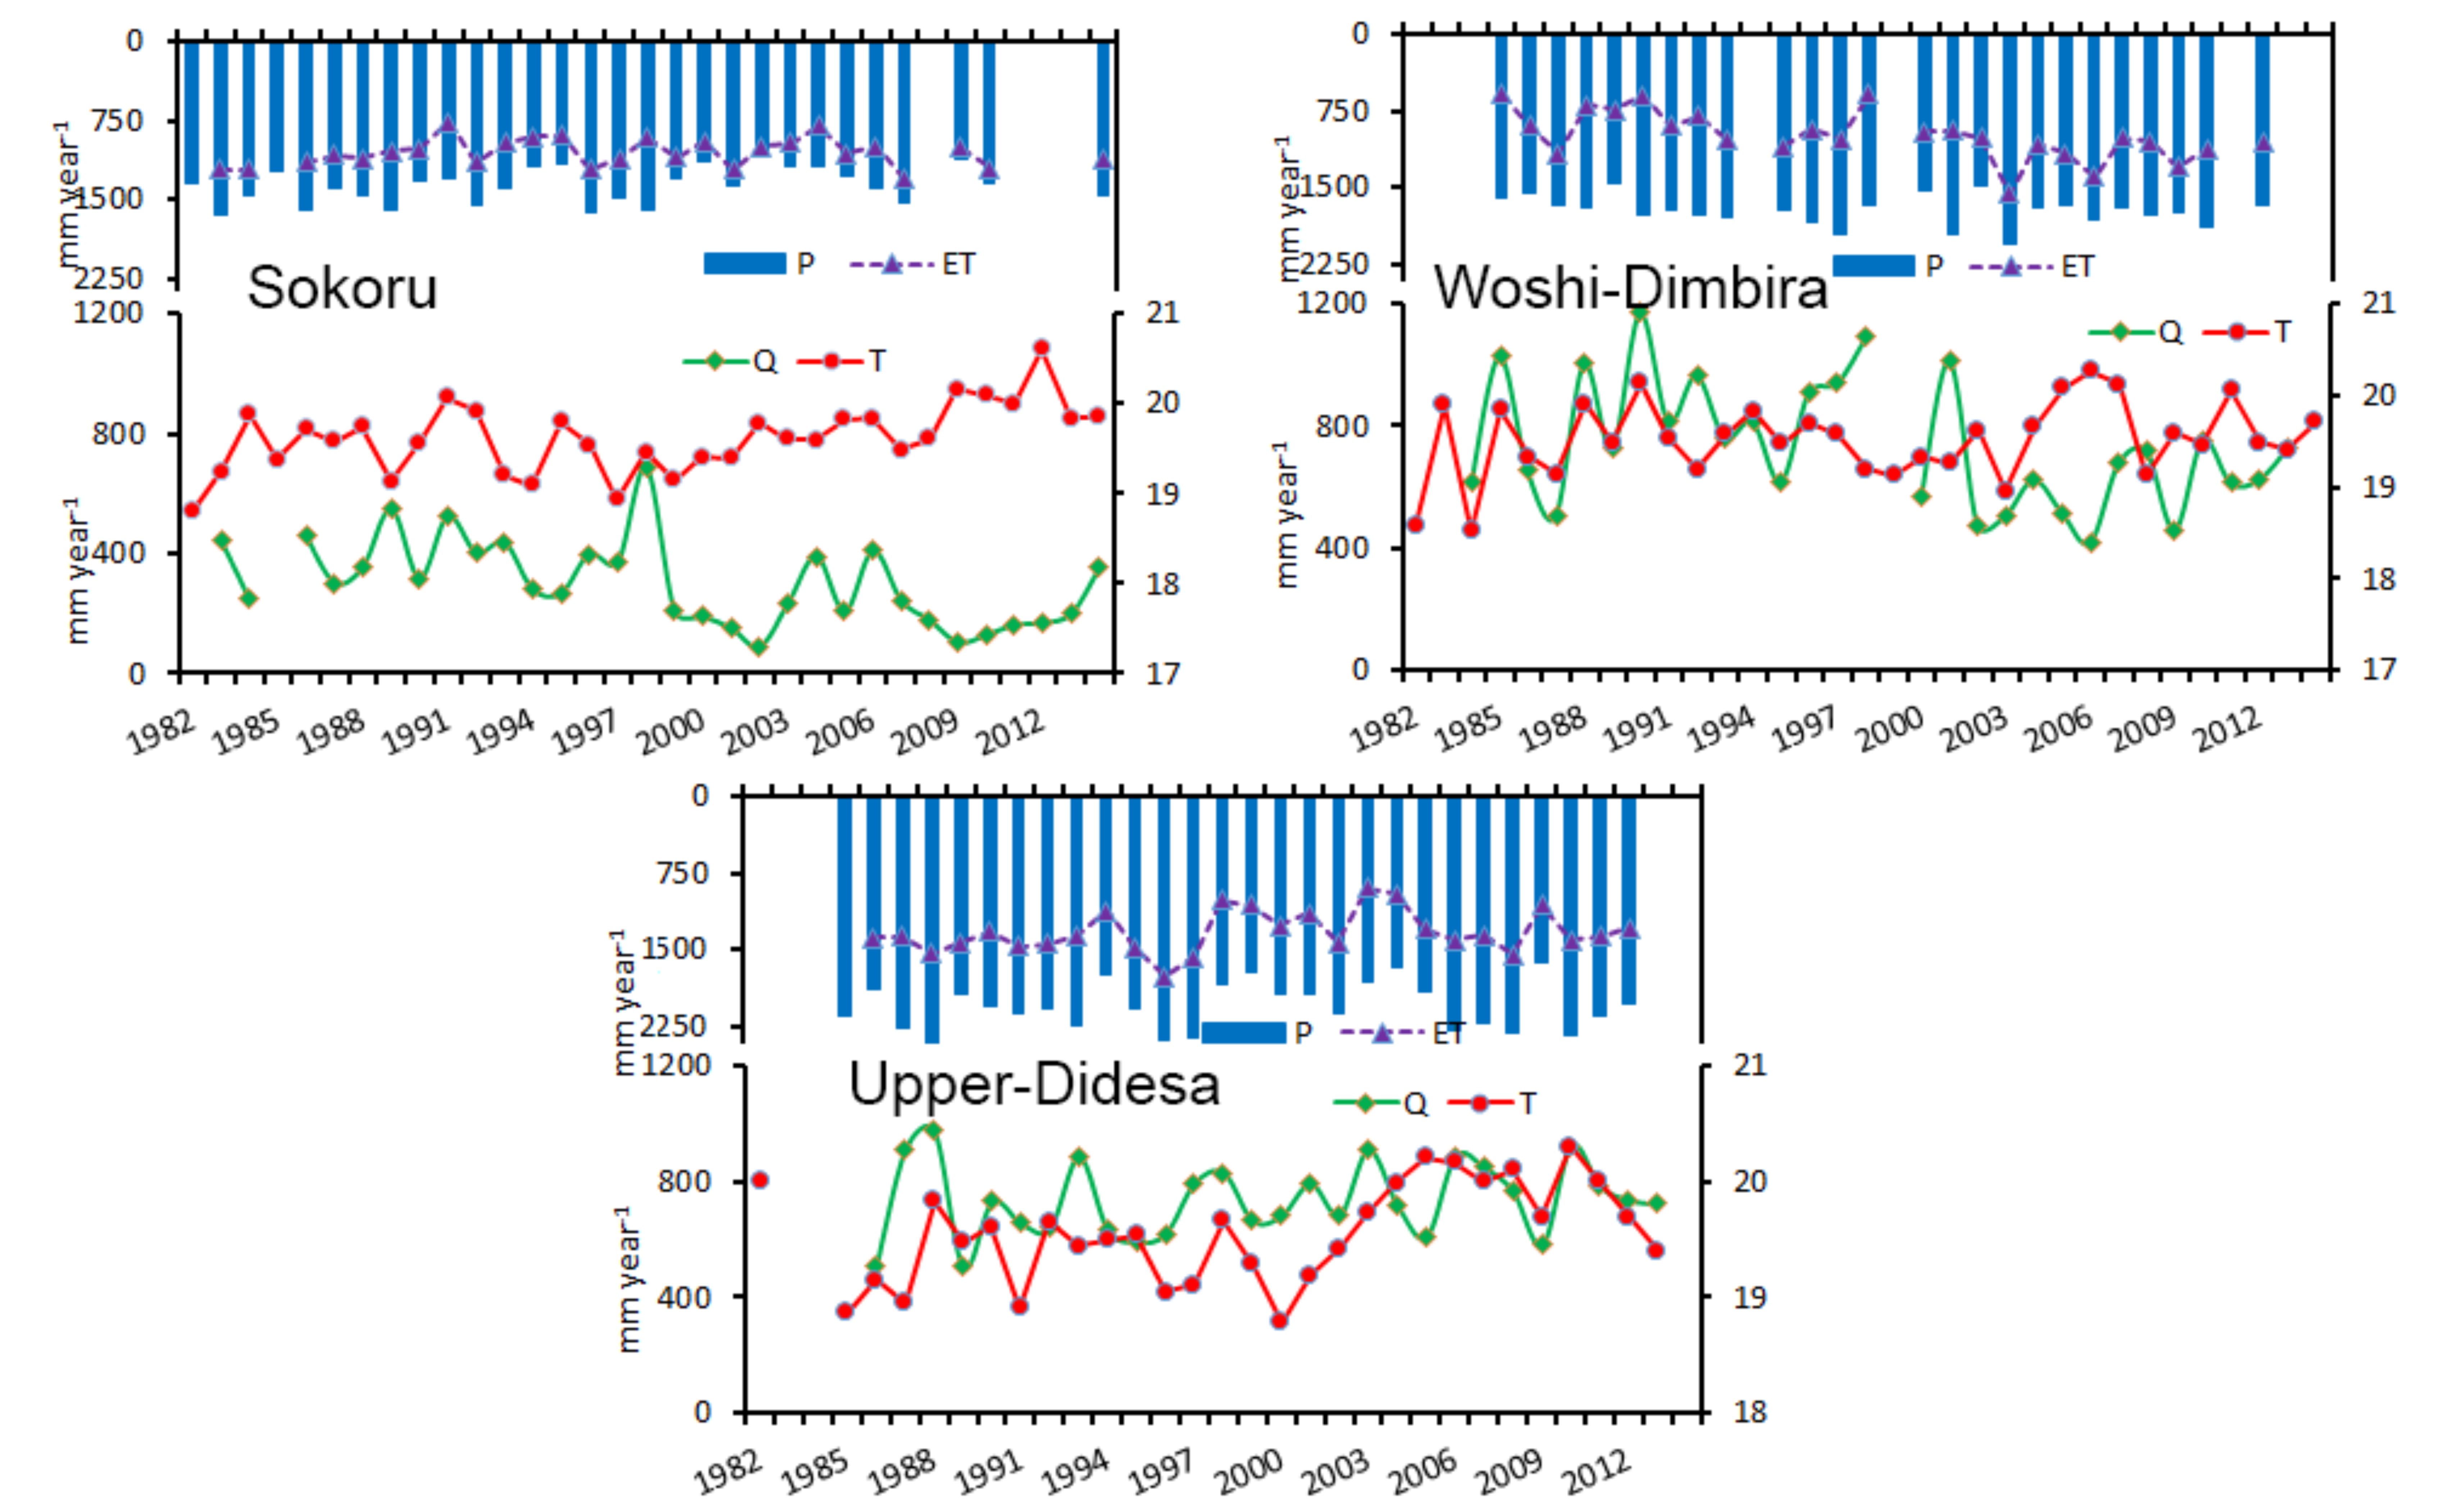
The annual rainfall for Sokoru ranges from 1090 mm in 2002 to 1657 mm in 1983 (Figure 2). Woshi-Dimbira has an annual rainfall ranging from 1471 mm in 1989 to 2068 mm in 2003. Upper-Didesa has an annual rainfall ranging from 1640 mm in 2009 to 2614 mm in 1988. Considering the time-series of rainfall for the three watersheds, the annual rainfall observations do not show any obvious patterns or trends over the period of record.
The annual runoff also depicts no apparent trends or patterns considering the time series of streamflow across all three watersheds (Figure 2). The annual runoff ranges from 104 mm in 2009 to 684 mm in 1998 for Sokoru; from 416 mm in 2006 to 1172 mm in 1990 for Woshi-Dimbira; and from 435 mm in 2002 to 976 mm in 1987 for Upper-Didesa. The annual actual evapotranspiration (ET) in Figure 2 is determined using a simple water balance equation as the difference between annual rainfall and runoff.
The actual evapotranspiration similarly follows no detectable trend (Figure 2). Evapotranspiration ranges from 773 mm year−1 in 1991 to 1301 mm year−1 in 2007 for Sokoru; from 584 mm year−1 in 1985 to 1561 mm year−1 in 2003 for Woshi-Dimbira; from 900 mm year−1 in 2003 to 1761 mm year−1 in 1996 for Upper-Didesa.
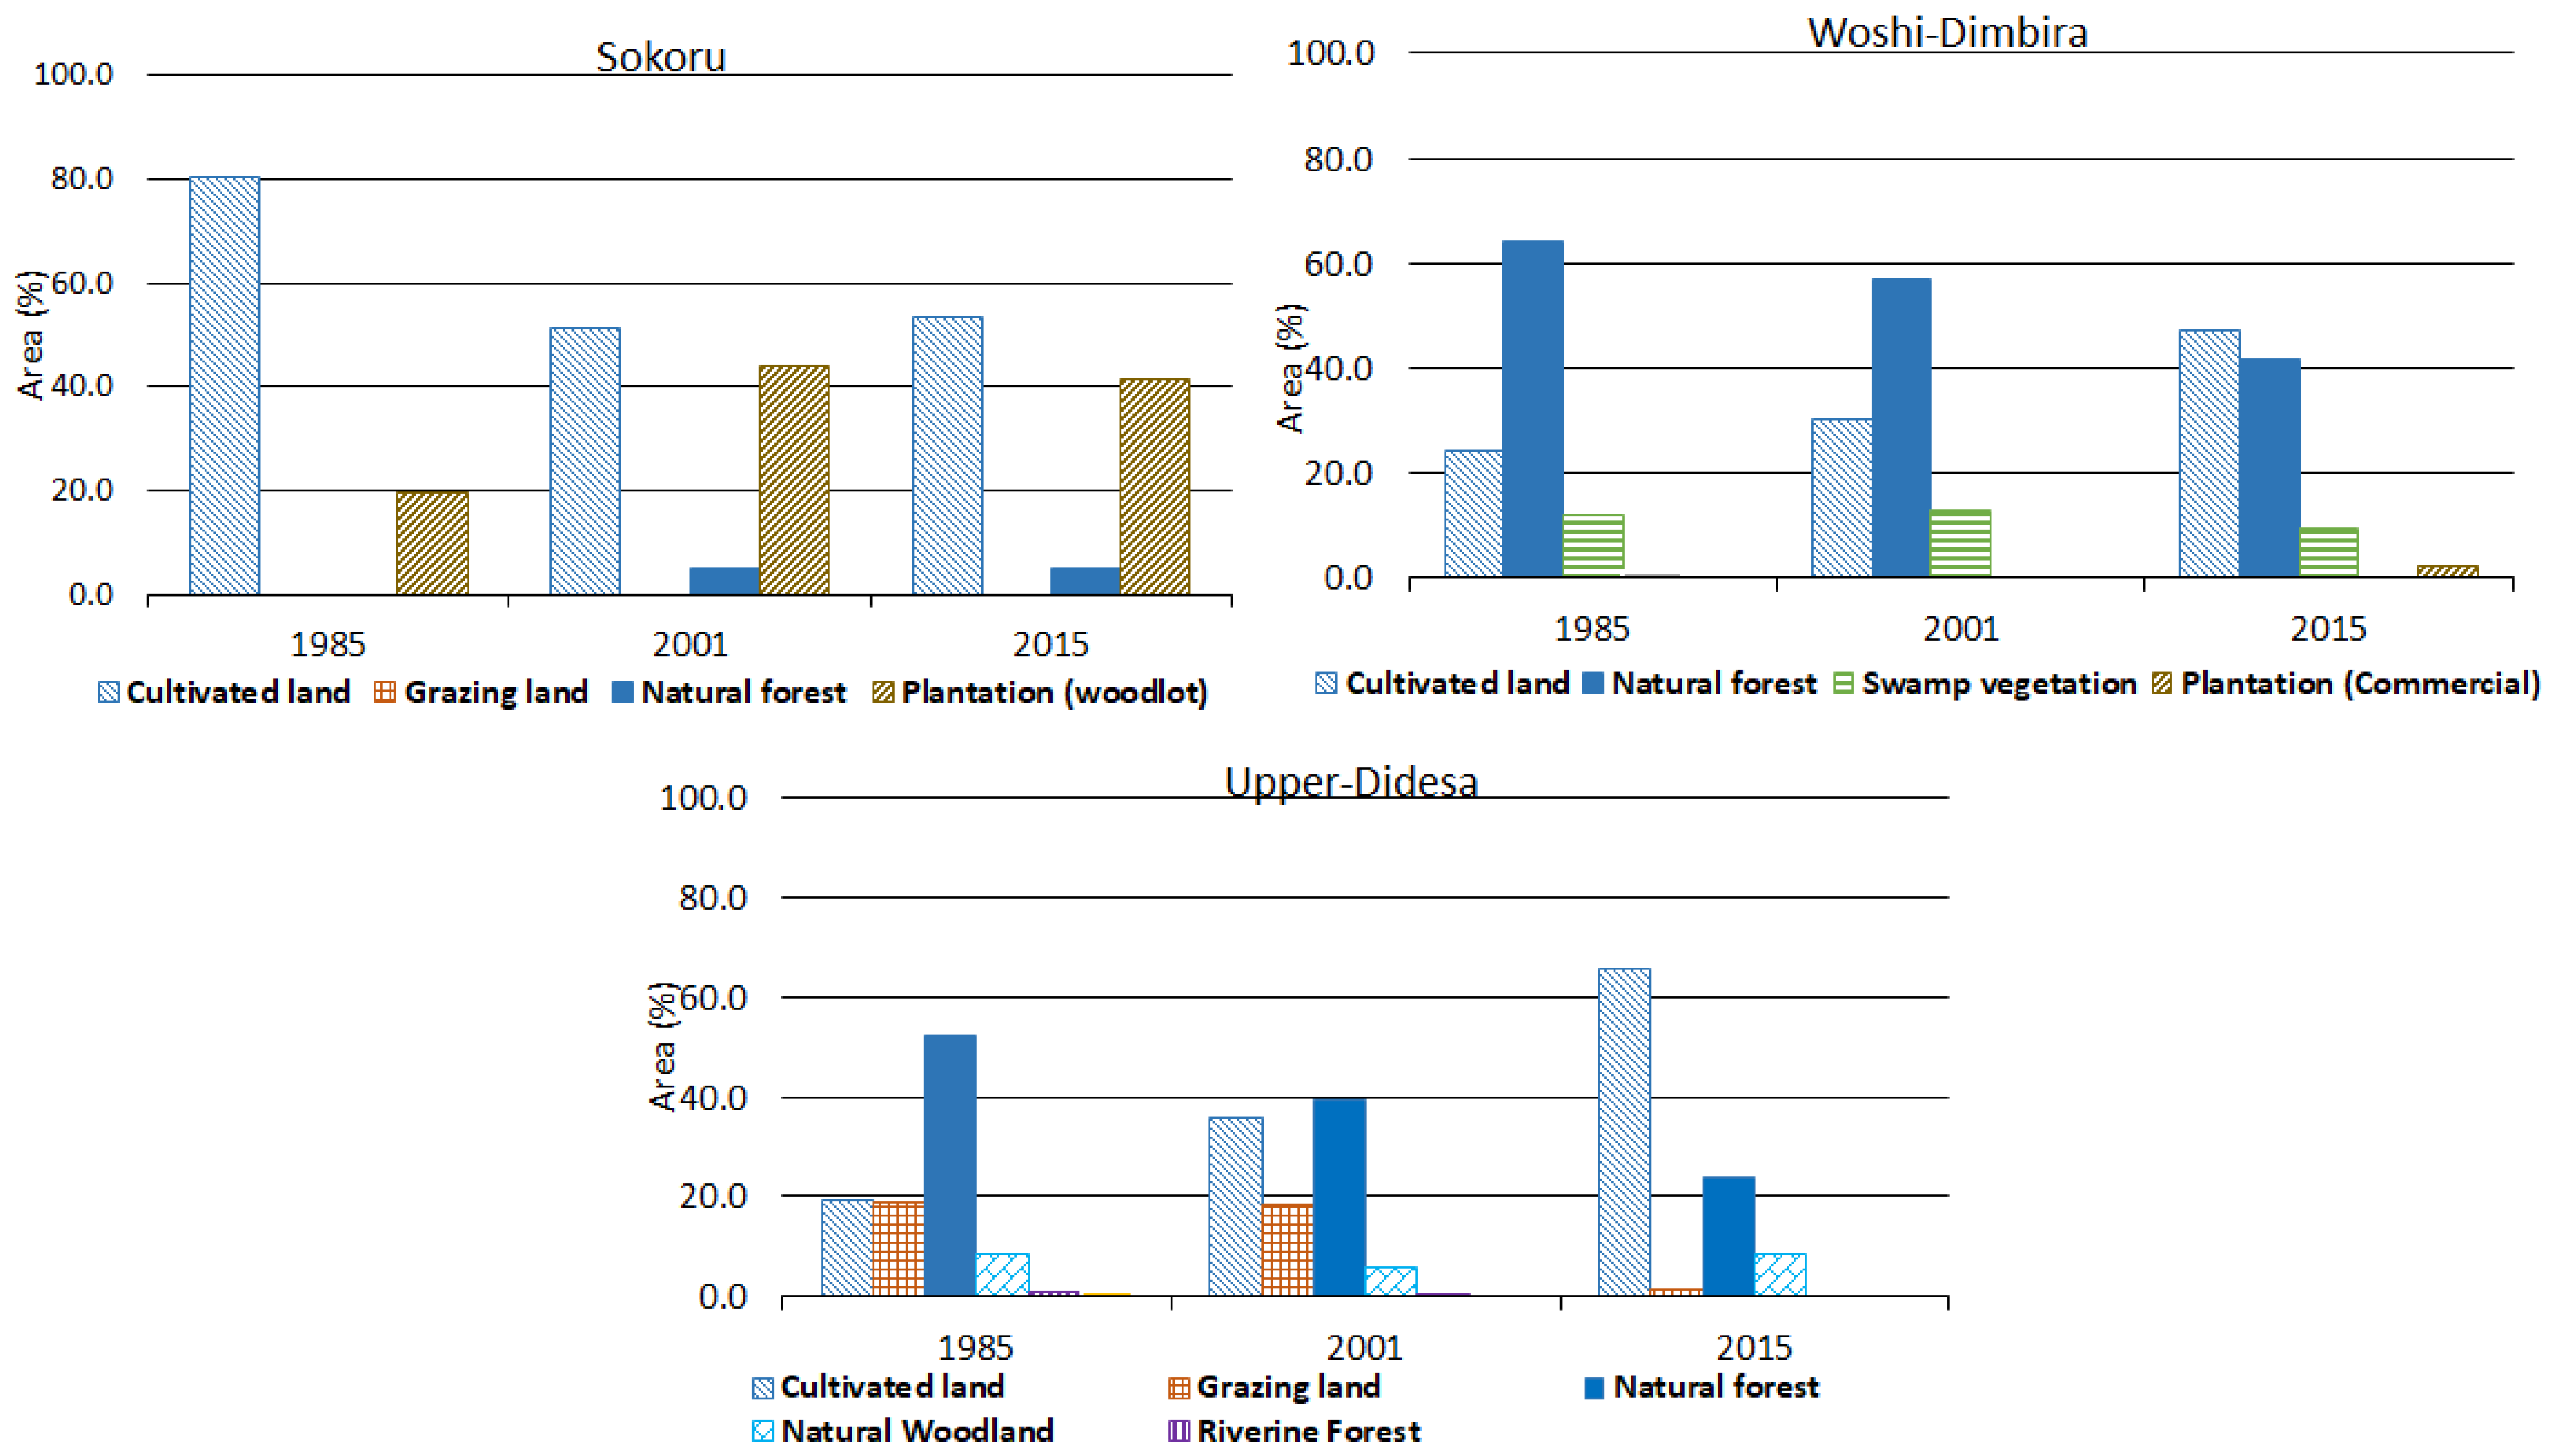
Figure 3 depicts the forest and land cover classes in the three study watersheds in comparison to the three time periods. Sokoru is characterized by mainly seasonal farming land use from 1980s to 2010s. However, woodlot tree plantation has been becoming on par with the cultivated land recently (Figure 2). The main species for woodlot plantation consists of Eucalyptus spp., Grevilia spp., and fruit trees. The little increase in natural forest cover change follows the introduction of conservation programmes in the region, specifically an area-closure approach where a piece of an area is closed off from human and cattle encroachment.
Woshi-Dimbira is dominantly covered with natural montane forest and marshy vegetation (succulent grass vegetation) along the time series of the study period (Figure 3). However, 65% of the natural forest cover seen 30 years ago is now reduced to about 40%. Cultivated land is expanding in areas where natural forest is dwindling. This watershed has an expanding commercial proportion of tea plantations; although, only 2% of the watershed area is covered by tea planation in 2015.
In the Upper-Didesa, the dominant land cover was historically natural forest, which covered about 90% of the watershed area in the early 1970s. Nowadays, natural forests only cover about 25% as land was converted to settlements and cultivated land (Figure 3).
3.2. Recession Curve Analysis
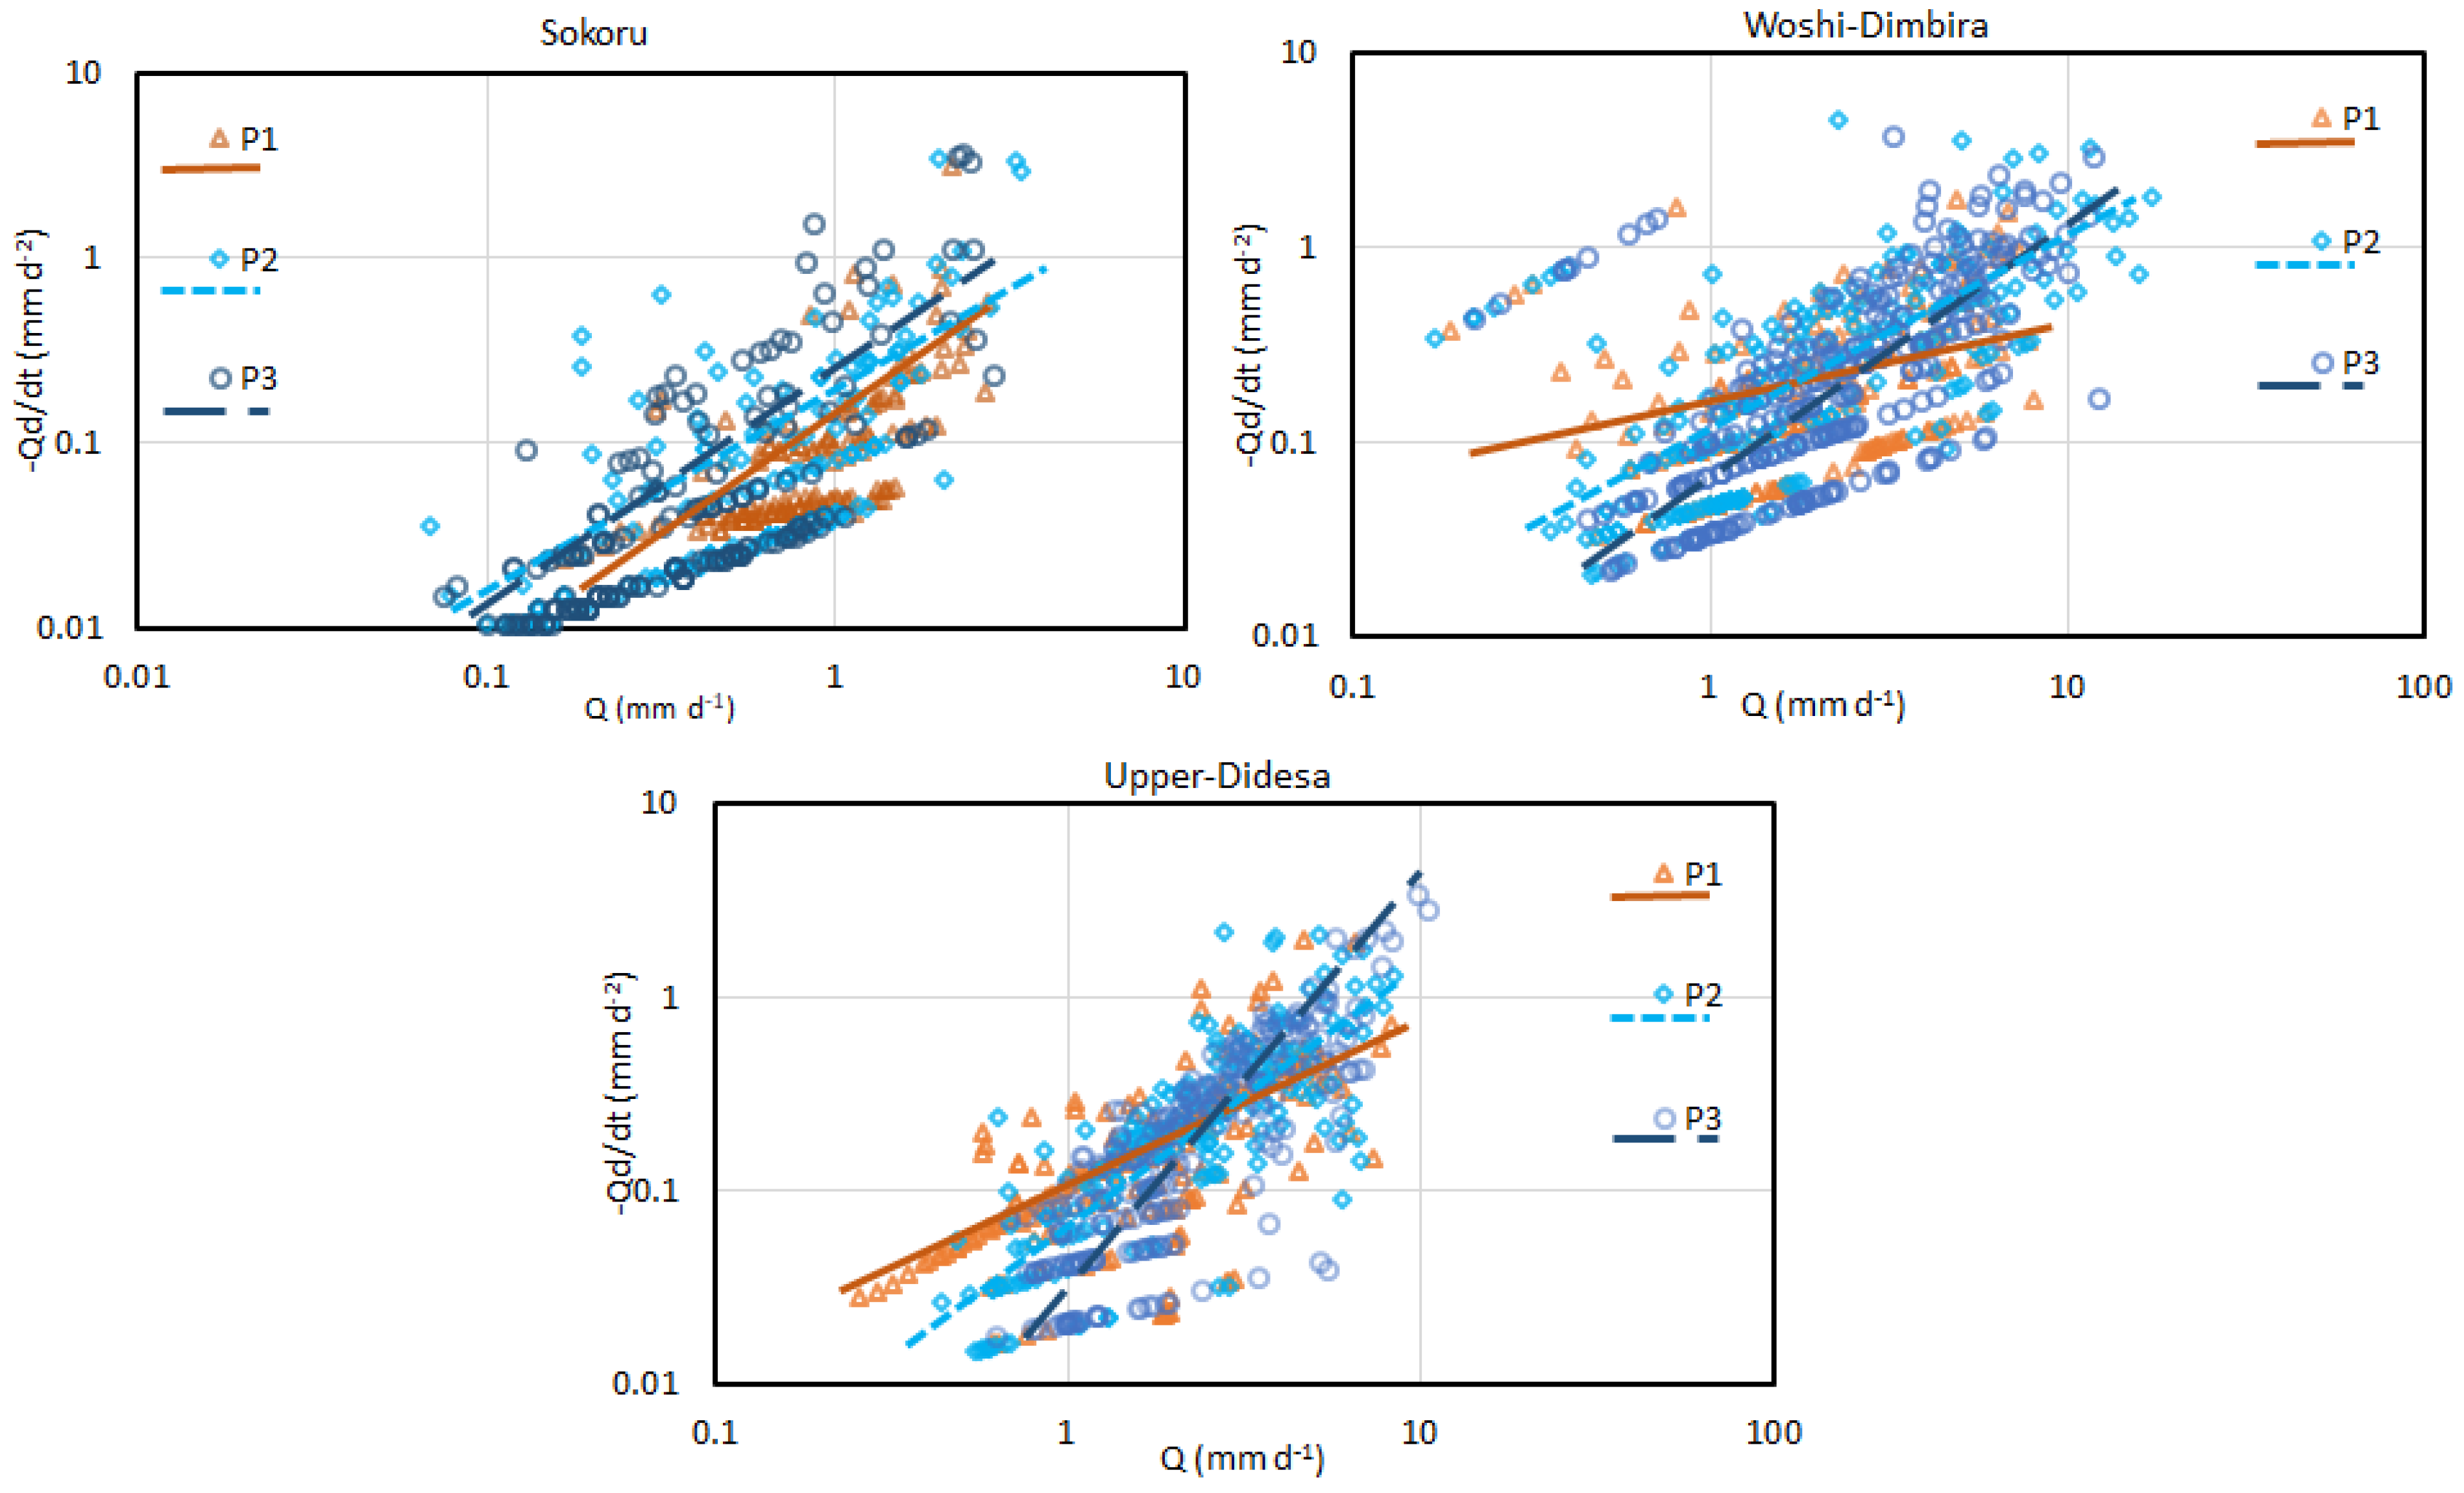
We fit Equation (1) to the data to assess the parameters α representing the recession intercept and β representing the recession slope (Table 2). Relating recession parameters directly to the physical characteristics of the watershed aquifers might be difficult (i.e., Lyon et al., 2015). We note noise in the data when fitting the recession curves (Figure 4), which could indicate that the resolution of observations (and thus the differences in observations) impact our results. However, we can assess relative changes between the periods considered and between the watersheds, assuming any observational errors or limitations in resolution are at the very least consistent in time and across the region.
Comparing across the three watersheds, we see that Woshi-Dimbira and Upper-Didesa exhibit similar patterns over the three periods considered. The overall storages increase from the first period to the third. Specifically, the recession slopes β rise from being less than 1.0 during the first period to >1.0 during the last period (Table 2). These increases in recession slopes β correspond to a decrease in natural forest cover estimated with our land cover change assessment (Figure 3). Sokoru, which has had no discernible natural forest cover change since 1985, exhibit a relatively constant recession slope β that is consistently greater than 1.0 over all three periods. Sokoru also has recession flow magnitudes that are consistently an order of magnitude lower than those observed for either Woshi-Dimbira or Upper-Didesa. This is consistent with Sokoru being the smallest of all the watersheds considered.
3.3. Linear Reservoir Concept
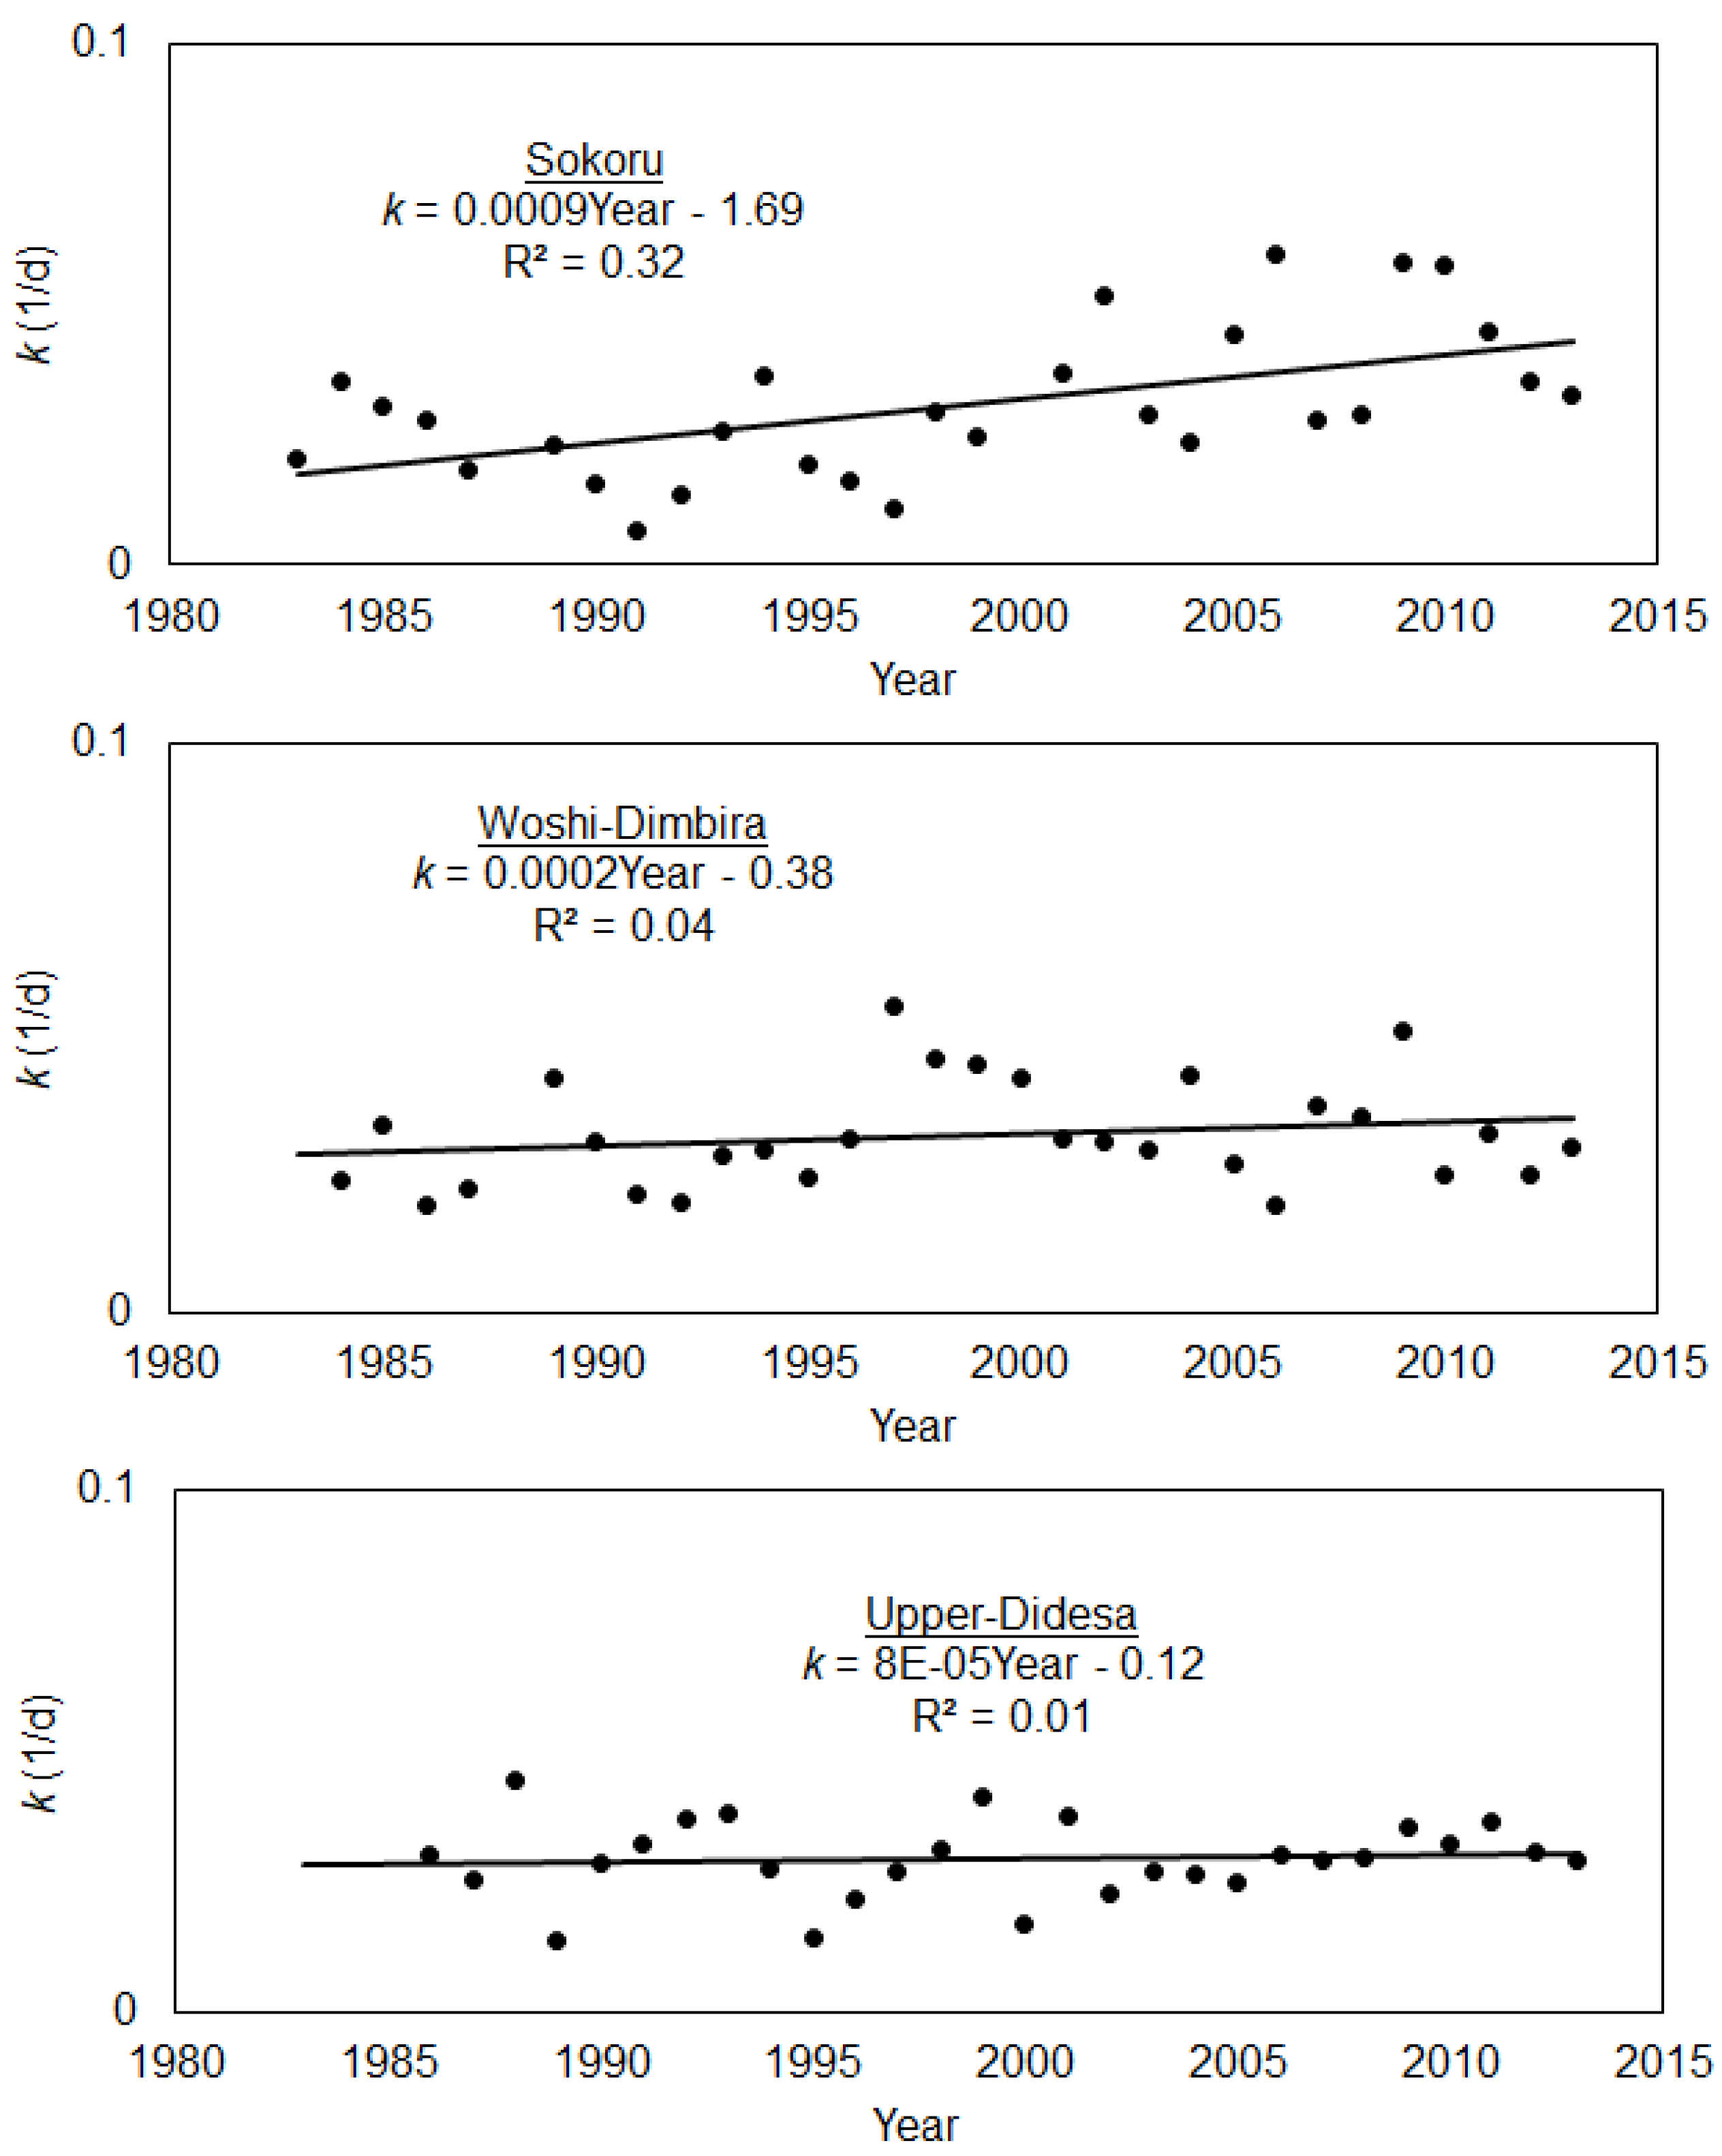
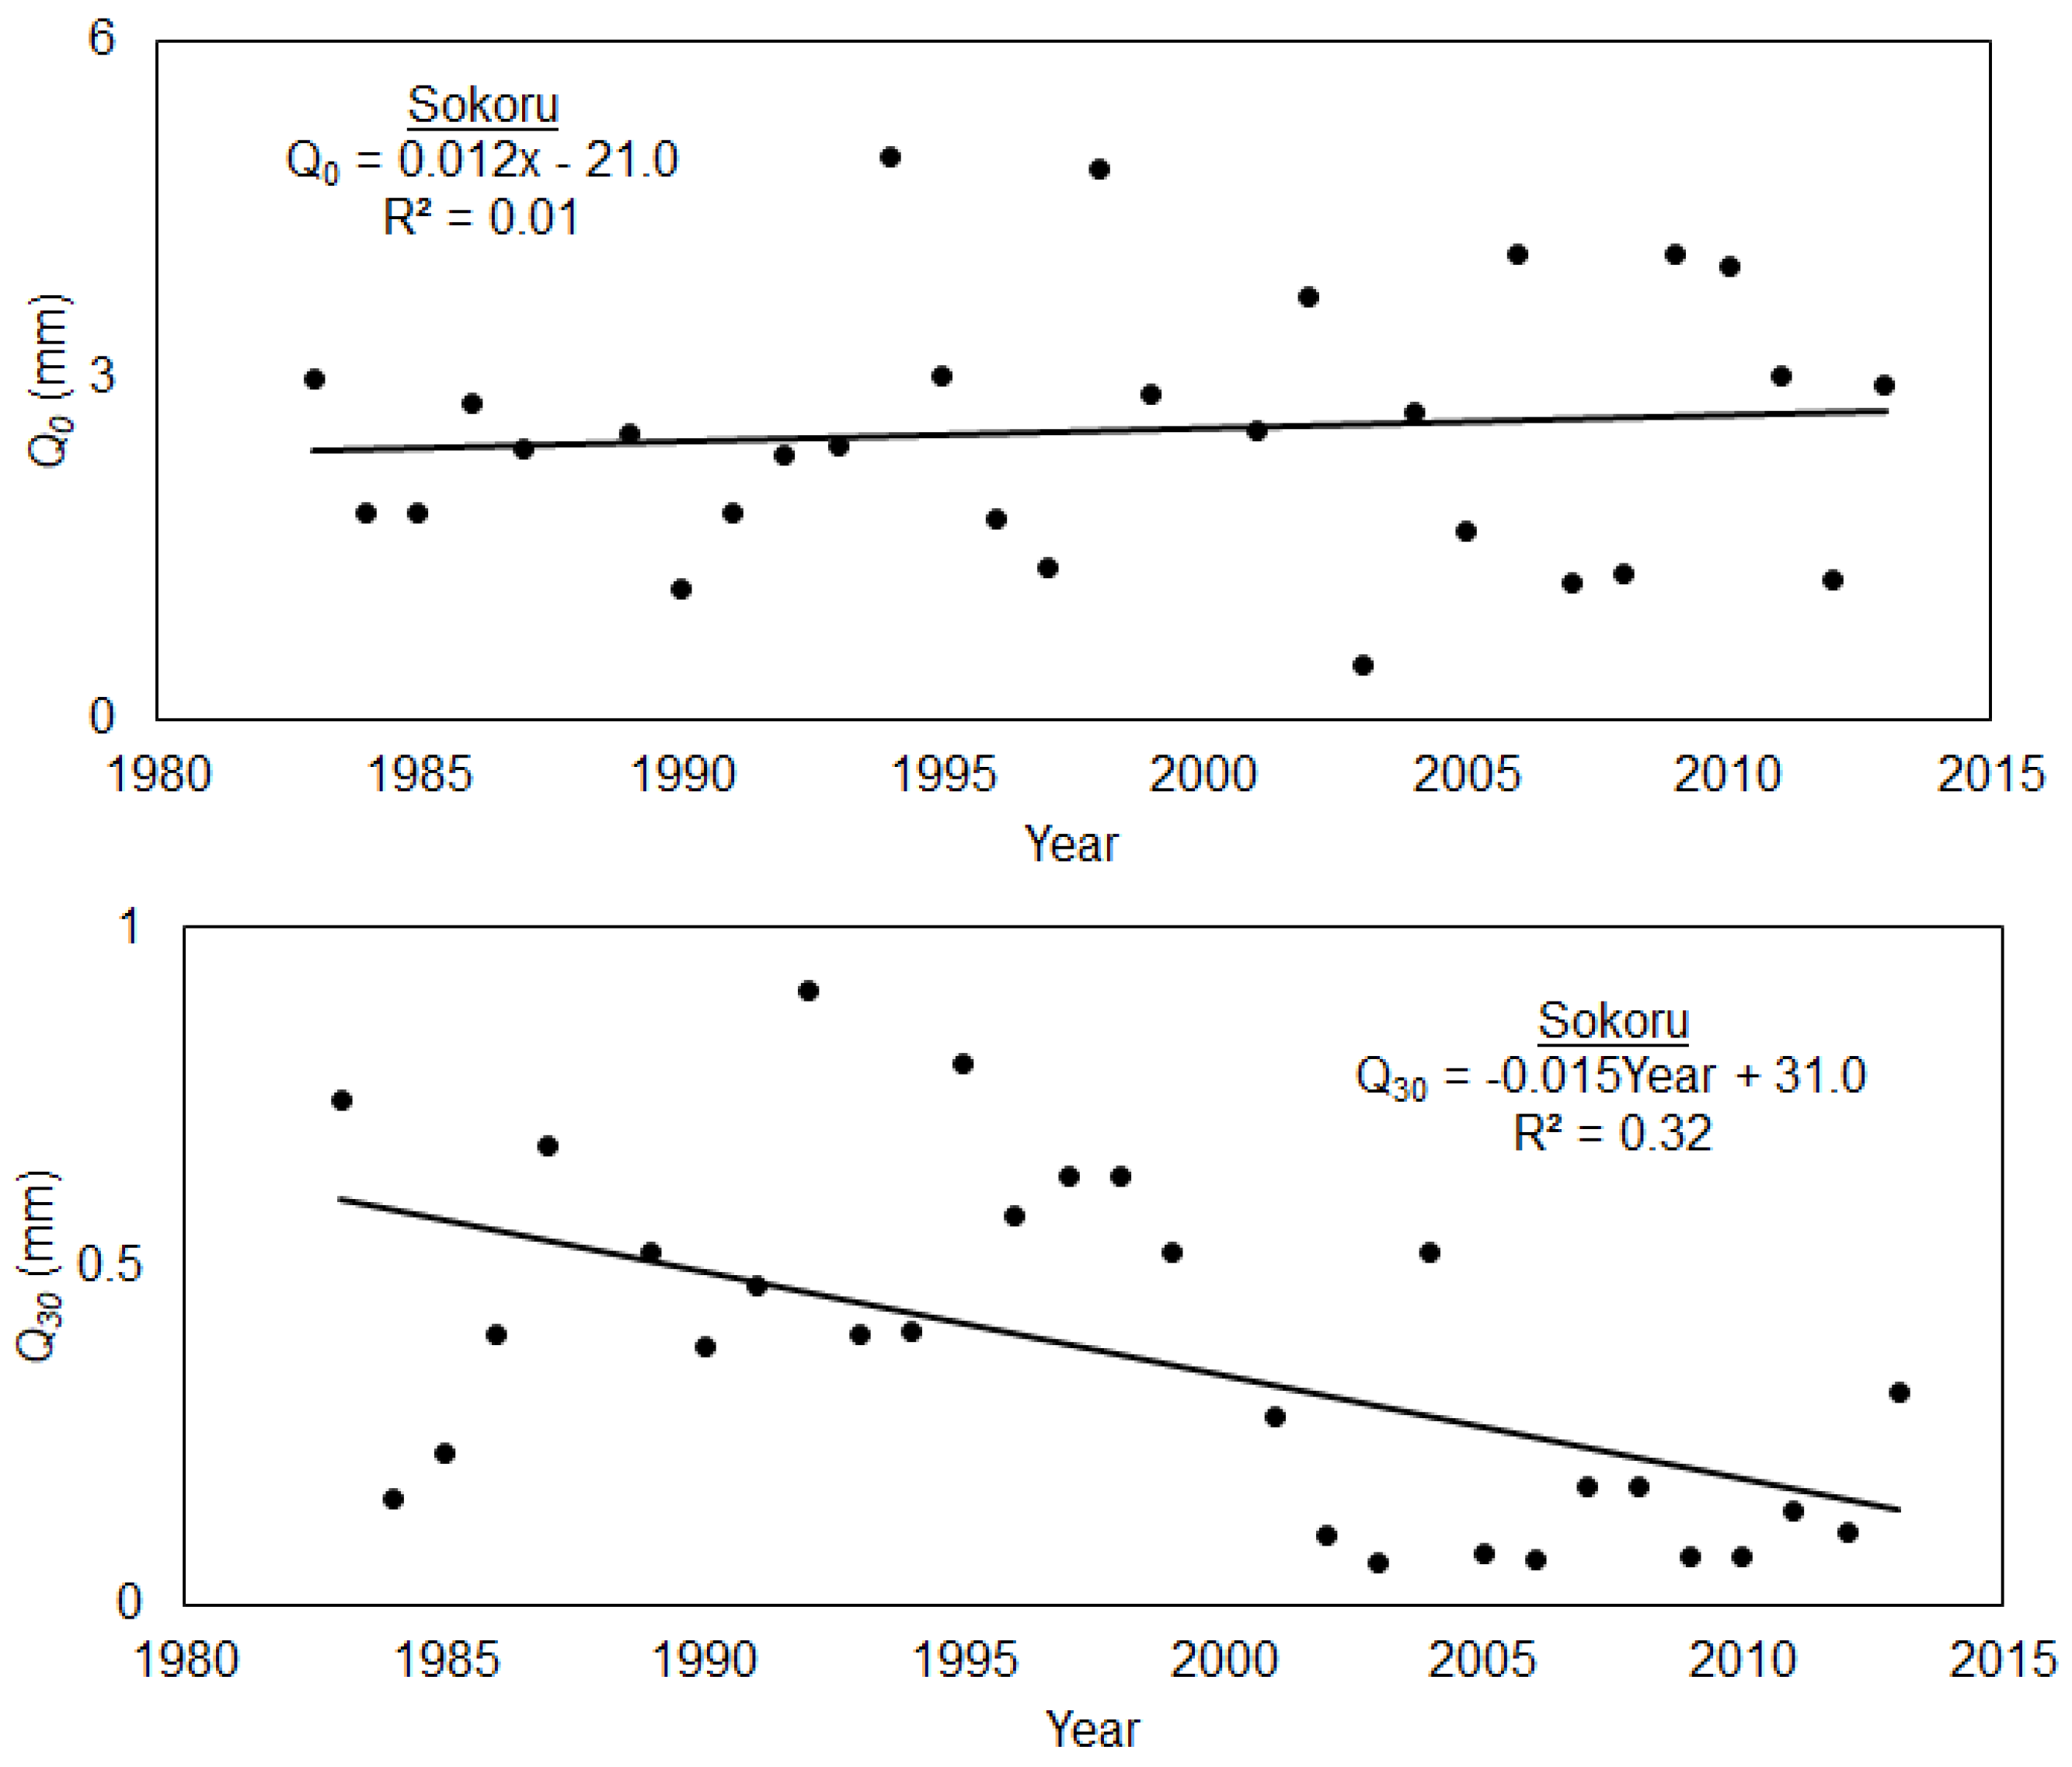
By fitting Equation (4) to the observed streamflow data covering the 30-day period following the beginning of the dry season, we can estimate a rate constant k for every year (Figure 5). Looking across the three watersheds, there is consistency in the average k (Table 3). However, we depict a significant increasing trend (p < 0.01) for Sokoru (Figure 5). If the linear assumption can be hold for this watershed, an increasing trend in k would indicate a generally faster drainage associated with the aquifer or a quicker depletion of its storage. The increasing trend in k can be explained by a significant (p < 0.01) decreasing trend in the Q30 for Sokoru (Figure 6). Thus, the streamflow observed 30 days after the onset of the dry season is getting lower with time over the period of record. Further, this decreasing trend Q30 and corresponding increasing trend in k coincides with the shift from cultivated land to plantation woodlot for Sokoru. Again, Sokoru exhibits consistently lower flows, here for the beginning and ending flow of the recession period considered (Table 3), than either the Upper-Didesa or Woshi-Dimbira watersheds.
4. Discussion
4.1. Implications of Forest Cover Change on Storage–Discharge Relationship
The acceleration of land use change has been an apparent phenomenon in many tropical countries [27]. Many researchers have tried to relate forest changes with alterations of hydrological regimes, mainly observed as an outflow of a given watershed [46]. Our results highlight that there appears to be a connection between a watershed’s recession and its storage change during the dry periods of the year in cases where deforestation persisted for a long period of time (Figure 4 and Figure 5). Further, the general patterns of rainfall in our watersheds show neither a specific trend along the time series (1982–2014), nor is rainfall connected with the storage outflow trends [47]. Consistent with other studies, these results confirm that dry season flows are more influenced by watershed characteristics like land use than climatic patterns.
Both Woshi-Dimbira and Upper-Didesa have gone through dramatic changes of land use between the 1980s and 2014. The main land use changes are high rates of natural forest cover losses in the Woshi-Dimbira watershed of 1.6 km2 year−1, and 2 km2 year−1 in the Upper-Didesa watershed. Further, the strong increase in cultivated land of around 1.6 km2 year−1 in Woshi-Dimbira could have contributed to the observed change of the watershed storage. Meanwhile, it is worth noticing the higher annual variability of the recession in Sokoru (Figure 4, Table 2) despite no clear deforestation change. This could be linked to the larger number of unique land use types in Sokoru, i.e., plantation, natural forest, cultivated land and grazing land. In addition, a lower capacity of storage and a higher variability in Sokoru could also be related to local shallow soil depths seen in the watershed. This later aspect is supported by other studies where shallower soil depths and lower water holding capacities are dominant in areas of cultivated land [48,49].
An increase of storage in both Woshi-Dimbira and Upper-Didesa as indicated in our analysis is likely related to forest loss as has been seen in other studies in tropical areas [11]. As the aquifers in these two watersheds have a larger storage capacity (Table 1), there could be a subsequent higher rate of streamflow during drier seasons. Soils could play a controlling role for storage shifts in response to forest cover in the short term [6]. However, soils could also be eroded on the long term under changes in forest cover and there is evidence that forest loss in montane areas leads to subsequent soil erosion, as was also reported for the highlands of Ethiopia [48]. As such, the increase in aquifer storage realized following deforestation may not be sustained for long periods of time—which is important to recognize from a management perspective, as we do not want to base decisions for our long-term perspectives of water resource on short-term “bumps” in storage.
Land management for future water security in times of dry season will be key in regions where watersheds experience tremendous forest cover changes like in the Woshi-Dimbira and Upper-Didesa watersheds. For instance, some meso-scale watersheds from the northern part of Ethiopia showed reduction of dry season flow exhibited 60–70 years after an event of huge loss of natural forest [32]. Such an influence provides motivation for improving land-water management strategies (i.e., good land management can illicit positive hydrological change) and highlights the promise of water security issues being linked to land management options, specifically with regard to forest management in tropical regions [50].
4.2. On the Utility of Storage–Discharge Relationships to Assess Forest Cover Change Impacts on Water Resources
Considering storage–discharge relationships have utility for assessing the impacts of forest cover change on water resources. Our results show that recession analysis (Figure 4) reflects impacts of change in forest cover that could not be detected when considering the absolute magnitude of runoff alone (Figure 2). These findings are consistent with previous studies where such approaches have been used to isolated small shifts in storage–discharge relationships driven by anthropogenic and climatic shifts with time [18]. However, because of the complexity of natural watersheds, there are challenges to directly relate shifts in storage–discharge relationships to changes occurring on the landscapes. Shaw and Riha, saw a strong control of evaporation on the shift in storage–discharge relationships when considering seasonal patterns [21]. As flow regimes alternate between high and low flow conditions, there can be strong variability in recession slopes and much deviation away from a linear response [16], however, variability in recessions can still illuminate the complexities in a watershed response. Jachens et al. for example were able to interpret resiliency to drought associated with river flow regimes across various catchments through recession analysis [22]. Such an understanding translates to a useful metric when it comes to characterizing a watershed’s sensitivity to changes in land management, thereby, creating a tool for managers to help gauge potential impacts of decisions.
Of course, it goes without saying that the quality of the data being considered impacts our ability to both identify change in storage–discharge relationship and to relate changes to landscape-level alterations. Noisy streamflow data (Figure 4) bring about uncertainty in our ability to identify drivers of changes in storage–discharge relationships. When data are homogenised across a large region of consistent observational record [18], we can make more meaningful conclusions about how landcover or climatic patterns impact streamflow as we control for potential changes in observation techniques or quality. For the study watersheds considered in this study, we performed a quality control to remove any largely erroneous data but there are still residual resolution effects seen in our analysis (e.g., banding in Figure 4). Further, these data we are working with were selected as the watersheds offer some of the best data in the region such that any observational errors are at least consistent in time. Moving towards approaches that leverage stream heights (stage) as in Jachens et al. or that can use remote sensing products like those derived from the surface water and ocean topography (SWOT) mission could help avoid some of the issues associated with streamflow data quality [22]. In addition, new techniques for rapid and accurate gauging of streams could offer a manner to secure high quality data quickly in new regions. As the landcover change across Ethiopia and much of sub-Saharan Africa is active and rapid, novel approaches for collecting high quality streamflow data quickly will help increase our ability to assess and interpret changes in storage–discharge relationships.
5. Conclusions
Recession slopes tended to increase as natural forest covers decreased in Woshi-Dimbira and Upper-Didesa while the storage coefficient tended to increase in Sokoru. Given the rapid change in land cover (and forest cover in particular) for the region, our work highlights that considering storage–discharge relationships may be useful for assessing the impacts of forest cover change on water resources in regions where land use change is active. The utility of the methods considered for characterizing the impact of forest cover changes on water resources is of course connected to the quality of the data being considered. Therefore, care must be taken before applying or interpreting recession analysis techniques across large regions where hydrologic forcing and data quality can be different. However, as longer and higher quality streamflow data records come available, techniques that look at the rate changes of streamflow rather than the absolute magnitude of streamflow can potentially help managers track early impacts of decisions on the land as they translate through to water resources. In addition, the watersheds considered here are typical for the highlands of Ethiopia where millions of smallholder farmers are dependent on the natural availability of water.
Our results indicate the changes in forest cover can alter the water storage conditions in a watershed thereby potentially impacting both water availability and variability. In addition, it is implied that soils play key role for watershed storage as landcover changes are happening. There are several policies and implementation programs going on with in Ethiopia and similar tropical areas on land management, specifically, forest restoration. The existing afforestation legacy in Ethiopia and other landscape restoration programs, in similar conditions, need to take in to account the general hydro-climate feature of a watershed and the possible effects on soils for betterment and sustainability of watershed storage. This is so that land management policies can augment water security programs and the overall goals to secure food and livelihoods in the time to come.
Author Contributions
Conceptualization, S.G.G. and L.B.; methodology, S.G.G. and S.W.L.; software, S.G.G.; validation, S.G.G., L.B. and S.W.L.; formal analysis, S.G.G. and S.W.L.; investigation, S.G.G. and L.B.; resources, S.G.G. and L.B.; data curation, S.G.G.; writing—original draft preparation, S.G.G.; writing—review and editing, L.B. and S.W.L.; visualization, S.G.G.; supervision, L.B.; project administration, L.B.; funding acquisition, S.G.G. All authors have read and agreed to the published version of the manuscript.
Funding
This study was funded by the Alexander von Humboldt Foundation Fellowship (Funding ID—1186888) at the Justus Liebig University Giessen, Germany.
Informed Consent Statement
Not applicable.
Data Availability Statement
Restrictions apply to the availability of these data. Data was obtained from Ministry of Water, Irrigation and Energy, Ethiopia and are available from the authors with the permission of the Ministry.
Conflicts of Interest
The authors declare no conflict of interest.
References
- Zhang, L.; Dawes, W.R.; Walker, G.R. Response of mean annual evapotranspiration to vegetation changes at catchment scale. Water Resour. Res. 2001, 37, 701–708. [Google Scholar] [CrossRef]
- Gebrehiwot, S.G. Forests, water and food security in the Nothwestern Highlands of Ethiopia: Knowledge synthesis. Environ. Sci. Policy 2015, 48, 128–136. [Google Scholar] [CrossRef]
- Bruijnzeel, L.A. Hydrological functions of tropical forests: Not seeing the soil for the trees? Agricult. Ecosyst. Environ. 2004, 104, 185–228. [Google Scholar] [CrossRef]
- Scott, D.F.; Lesch, W. Streamflow responses to afforestation with eucalyptus grandis and pinus patula and to felling in the mokobulaan experimental catchments, South Africa. J. Hydrol. 1997, 199, 360–377. [Google Scholar] [CrossRef]
- Lyon, S.W.; King, K.; Polpanich, O.; Lacombe, G. Assessing hydrologic changes across the lower mekong basin. J. Hydrol. Reg. Stud. 2017, 12, 303–314. [Google Scholar] [CrossRef]
- Wang, C.; Zhao, C.; Xu, Z.; Wang, Y.; Peng, H. Effect of vegetation on soil water retention and storage in a semi-arid alpine forest catchment. J. Arid Land 2013, 5, 207–219. [Google Scholar] [CrossRef]
- Jaramillo, F.; Cory, N.; Arheimer, B.; Laudon, H.; van der Velde, Y.; Hasper, T.B.; Teutschbein, C.; Uddling, J. Dominant effect of increasing forest biomass on evapotranspiration: Interpretations of movement in budyko space. Hydrol. Earth Syst. Sci. 2018, 22, 567–580. [Google Scholar] [CrossRef] [Green Version]
- Birkel, C.; Soulsby, C.; Tetzlaff, D. Modelling the impacts of land-cover change on streamflow dynamics of a tropical rainforest headwater catchment. Hydrol. Sci. J. 2012, 57, 1543–1561. [Google Scholar] [CrossRef] [Green Version]
- Brown, A.E.; Zhang, L.; McMahon, T.A.; Western, A.W.; Vertessy, R.A. A review of paired catchment studies for determining changes in water yield resulting from alterations in vegetation. J. Hydrol. 2005, 310, 28–61. [Google Scholar] [CrossRef]
- Andreassian, V.; Parent, E.; Michel, C. A distribution-free test to detect gradual changes in watershed behavior. Water Resour. Res. 2003, 39. [Google Scholar] [CrossRef] [Green Version]
- Cheng, L.; Zhang, L.; Chiew, F.H.S.; Canadell, J.G.; Zhao, F.; Wang, Y.-P.; Hu, X.; Lin, K. Quantifying the impacts of vegetation changes on catchment storage-discharge dynamics using paired-catchment data. Water Resour. Res. 2017, 53, 5963–5979. [Google Scholar] [CrossRef]
- Kirchner, J.W. Catchments as simple dynamical systems: Catchment characterization, rainfall-runoff modeling, and doing hydrology backward. Water Resour. Res. 2009, 45. [Google Scholar] [CrossRef] [Green Version]
- Jehn, F.U.; Breuer, L.; Kraft, P.; Bestian, K.; Houska, T. Simple catchments and where to find them: The storage-discharge relationship as a proxy for catchment complexity. Front. Water 2021, 3, 631651. [Google Scholar] [CrossRef]
- Tallaksen, L.M. A review of baseflow recession analysis. J. Hydrol. 1995, 165, 349–370. [Google Scholar] [CrossRef]
- Brutsaert, W. Long-term groundwater storage trends estimated from streamflow records: Climatic perspective. Water Resour. Res. 2008, 44. [Google Scholar] [CrossRef]
- Ploum, S.W.; Lyon, S.W.; Teuling, A.J.; Laudon, H.; van der Velde, Y. Soil frost effects on streamflow recessions in a subarctic catchment. Hydrol. Process. 2019, 33, 1304–1316. [Google Scholar] [CrossRef] [Green Version]
- Brutsaert, W.; Nieber, J.L. Regionalized drought flow hydrographs from a mature glaciated plateau. Water Resour. Res. 1977, 13, 637–643. [Google Scholar] [CrossRef]
- Bogaart, P.W.; van der Velde, Y.; Lyon, S.W.; Dekker, S.C. Streamflow recession patterns can help unravel the role of climate and humans in landscape co-evolution. Hydrol. Earth Syst. Sci. 2016, 20, 1413–1432. [Google Scholar] [CrossRef] [Green Version]
- Brutsaert, W. Annual drought flow and groundwater storage trends in the eastern half of the United States during the past two-third century. Theor. Appl. Climatol. 2010, 100, 93–103. [Google Scholar] [CrossRef]
- Brauer, C.C.; Teuling, A.J.; Torfs, P.J.J.F.; Uijlenhoet, R. Investigating storage-discharge relations in a lowland catchment using hydrograph fitting, recession analysis, and soil moisture data. Water Resour. Res. 2013, 49, 4257–4264. [Google Scholar] [CrossRef]
- Shaw, S.B.; Riha, S.J. Examining individual recession events instead of a data cloud: Using a modified interpretation of DQ/Dt–Q streamflow recession in glaciated watersheds to better inform models of low flow. J. Hydrol. 2012, 434, 46–54. [Google Scholar] [CrossRef]
- Jachens, E.R.; Roques, C.; Rupp, D.E.; Selker, J.S. Streamflow recession analysis using water height. Water Resour. Res. 2020, 56. [Google Scholar] [CrossRef]
- Smakhtin, V.U. Low flow hydrology: A review. J. Hydrol. 2001, 240, 147–186. [Google Scholar] [CrossRef]
- Dralle, D.N.; Karst, N.J.; Thompson, S.E. Dry season streamflow persistence in seasonal climates. Water Resour. Res. 2016, 52, 90–107. [Google Scholar] [CrossRef] [Green Version]
- Sikka, A.K.; Samra, J.S.; Sharda, V.N.; Samraj, P.; Lakshmanan, V. Low flow and high flow responses to converting natural grassland into Bluegum (Eucalyptus globulus) in Nilgiris Watersheds of South India. J. Hydrol. 2003, 270, 12–26. [Google Scholar] [CrossRef]
- Regasa, M.S.; Nones, M.; Adeba, D. A review on land use and land cover change in Ethiopian basins. Land 2021, 10, 585. [Google Scholar] [CrossRef]
- FAO. Global Forest Resources Assessment 2015; Food and Agriculture Organization (FAO) of the United Nations: Rome, Italy, 2015. [Google Scholar]
- Gebrehiwot, S.G.; Bewket, W.; Gardenas, A.I.; Bishop, K. Forest cover change over four decades in the Blue Nile Basin, Ethiopia: Comparison of three watersheds. Reg. Environ. Change 2014, 14, 253–266. [Google Scholar] [CrossRef]
- Gebrehiwot, S.G.; Di Baldassarre, G.; Bishop, K.; Halldin, S.; Breuer, L. Is observation uncertainty masking the signal of land use change impacts on hydrology? J. Hydrol. 2019, 570, 393–400. [Google Scholar] [CrossRef]
- Gebrehiwot, S.G.; Seibert, J.; Gärdenäs, A.I.; Mellander, P.-E.; Bishop, K. Hydrological change detection using modeling: Half a century of runoff from four rivers in the Blue Nile Basin. Water Resour. Res. 2013, 49, 3842–3851. [Google Scholar] [CrossRef] [Green Version]
- Dile, Y.T.; Tekleab, S.; Ayana, E.K.; Gebrehiwot, S.G.; Worqlul, A.W.; Bayabil, H.K.; Yimam, Y.T.; Tilahun, S.A.; Daggupati, P.; Karlberg, L.; et al. Advances in water resources research in the upper Blue Nile Basin and the way forward: A review. J. Hydrol. 2018, 560, 407–423. [Google Scholar] [CrossRef]
- Gebrehiwot, S.G.; Gardenas, A.I.; Bewket, W.; Seibert, J.; Ilstedt, U.; Bishop, K. The long-term hydrology of East Africa’s water tower: Statistical change detection in the watersheds of the Abbay Basin. Reg. Environ. Change 2014, 14, 321–331. [Google Scholar] [CrossRef]
- Sutcliffe, J.V.; Parks, Y.P. The Hydrology of the Nile; IAHS Special Publication; International Association of Hydrological Sciences: Oxford, UK, 1999. [Google Scholar]
- Ayenew, T.; Demlie, M.; Wohnlich, S. Hydrogeological framework and occurrence of groundwater in the Ethiopian aquifers. J. Afr. Earth Sci. 2008, 52, 97–113. [Google Scholar] [CrossRef]
- Rupp, D.E.; Selker, J.S. On the use of the boussinesq equation for interpreting recession hydrographs from sloping aquifers. Water Resour. Res. 2006, 42. [Google Scholar] [CrossRef] [Green Version]
- Troch, P.A.; Berne, A.; Bogaart, P.; Harman, C.; Hilberts, A.G.J.; Lyon, S.W.; Paniconi, C.; Pauwels, V.R.N.; Rupp, D.E.; Selker, J.S.; et al. The importance of hydraulic groundwater theory in catchment hydrology: The legacy of wilfried brutsaert and Jean-Yves Parlange. Water Resour. Res. 2013, 49, 5099–5116. [Google Scholar] [CrossRef] [Green Version]
- Lyon, S.W.; Koutsouris, A.; Scheibler, F.; Jarsjö, J.; Mbanguka, R.; Tumbo, M.; Robert, K.K.; Sharma, A.N.; van der Velde, Y. Interpreting characteristic drainage timescale variability across Kilombero Valley, Tanzania. Hydrol. Process. 2015, 29, 1912–1924. [Google Scholar] [CrossRef]
- Dralle, D.N.; Karst, N.J.; Charalampous, K.; Veenstra, A.; Thompson, S.E. Event-scale power law recession analysis: Quantifying methodological uncertainty. Hydrol. Earth Syst. Sci. 2017, 21, 65–81. [Google Scholar] [CrossRef] [Green Version]
- Wrona, F.J.; Johansson, M.; Culp, J.M.; Jenkins, A.; Mård, J.; Myers-Smith, I.H.; Prowse, T.D.; Vincent, W.F.; Wookey, P.A. Transitions in Arctic ecosystems: Ecological implications of a changing hydrological regime. J. Geophys. Res. Biogeosci. 2016, 121, 650–674. [Google Scholar] [CrossRef] [Green Version]
- Buytaert, W.; De Bievre, B.; Wyseure, G.; Deckers, J. The use of the linear reservoir concept to quantify the impact of changes in land use on the hydrology of catchments in the Andes. Hydrol. Earth Syst. Sci. 2004, 8, 108–114. [Google Scholar] [CrossRef] [Green Version]
- Krakauer, N.Y.; Temimi, M. Stream recession curves and storage variability in Small WATERSHEDS. Hydrol. Earth Syst. Sci. 2011, 15, 2377–2389. [Google Scholar] [CrossRef] [Green Version]
- Lyon, S.W.; Destouni, G.; Giesler, R.; Humborg, C.; Mörth, M.; Seibert, J.; Karlsson, J.; Troch, P.A. Estimation of permafrost thawing rates in a Sub-Arctic catchment using recession flow analysis. Hydrol. Earth Syst. Sci. 2009, 13, 595–604. [Google Scholar] [CrossRef] [Green Version]
- Koutsouris, A.J.; Lyon, S.W. Advancing understanding in data-limited conditions: Estimating contributions to streamflow across Tanzania’s rapidly developing Kilombero Valley. Hydrol. Sci. J. 2018, 63, 197–209. [Google Scholar] [CrossRef]
- Rivera-Ramirez, H.D.; Warner, G.S.; Scatena, F.N. Prediction of master recession curves and baseflow recessions in the Luquillo Mountains of Puerto Rico1. JAWRA J. Am. Water Resour. Assoc. 2002, 38, 693–704. [Google Scholar] [CrossRef]
- Lamb, R.; Beven, K. Using interactive recession curve analysis to specify a general catchment storage model. Hydrol. Earth Syst. Sci. 1997, 1, 101–113. [Google Scholar] [CrossRef]
- Winkler, K.; Fuchs, R.; Rounsevell, M.; Herold, M. Global land use changes are four times greater than previously estimated. Nat. Commun. 2021, 12, 2501. [Google Scholar] [CrossRef] [PubMed]
- Ogden, F.L.; Crouch, T.D.; Stallard, R.F.; Hall, J.S. Effect of land cover and use on dry season river runoff, runoff efficiency, and peak storm runoff in the seasonal tropics of Central Panama. Water Resour. Res. 2013, 49, 8443–8462. [Google Scholar] [CrossRef] [Green Version]
- Nyssen, J.; Poesen, J.; Lanckriet, S.; Jacob, M.; Moeyersons, J.; Haile, M.; Haregeweyn, N.; Munro, R.N.; Descheemaeker, K.; Adgo, E.; et al. Land degradation in the Ethiopian highlands. In Landscapes and Landforms of Ethiopia; Billi, P., Ed.; World Geomorphological Landscapes; Springer: Dordrecht, The Netherlands, 2015; pp. 369–385. [Google Scholar] [CrossRef] [Green Version]
- Fritz, S.; See, L.; Carlson, T.; Haklay, M.; Oliver, J.L.; Fraisl, D.; Mondardini, R.; Brocklehurst, M.; Shanley, L.A.; Schade, S.; et al. Citizen science and the United Nations sustainable development goals. Nat. Sustain. 2019, 2, 922–930. [Google Scholar] [CrossRef]
- Cosgrove, W.J.; Loucks, P. Water management: Current and future challenges and research directions. Water Resour. Res. 2015, 51, 4823–4839. [Google Scholar] [CrossRef] [Green Version]
Figure 1.
Location of the three study watersheds in the highlands of Ethiopia. The background topographic base map accessed; http://www.arcgis.com/home/item.html (accessed date 1 August 2021).
Figure 1.
Location of the three study watersheds in the highlands of Ethiopia. The background topographic base map accessed; http://www.arcgis.com/home/item.html (accessed date 1 August 2021).

Figure 2.
Annual rainfall [mm], annual evapotranspiration [mm], annual runoff [mm], and average daily temperatures (follows secondary axis) [°C] for the three study watersheds.
Figure 2.
Annual rainfall [mm], annual evapotranspiration [mm], annual runoff [mm], and average daily temperatures (follows secondary axis) [°C] for the three study watersheds.

Figure 3.
Land and forest cover in the three watersheds from 1985 to 2015.

Figure 4.
Recession curve analysis for the three watersheds and three time periods considered in this study. Fitted parameters α and b for the lines shown are given in Table 3.
Figure 4.
Recession curve analysis for the three watersheds and three time periods considered in this study. Fitted parameters α and b for the lines shown are given in Table 3.

Figure 5.
Storage coefficients (k) estimated for each year of the observation periods across the three watersheds considered in this study with fitted linear trend shown (only significant (p < 0.01) for Sokoru).
Figure 5.
Storage coefficients (k) estimated for each year of the observation periods across the three watersheds considered in this study with fitted linear trend shown (only significant (p < 0.01) for Sokoru).

Figure 6.
Trends in Q0 and Q30 for the Sokoru watershed over the period of observation. The decreasing trend in Q30 is significant (p < 0.01).
Figure 6.
Trends in Q0 and Q30 for the Sokoru watershed over the period of observation. The decreasing trend in Q30 is significant (p < 0.01).


Table 1.
Watershed characteristic of the study areas.
| Watershed | Area (km2) | Elevation (m a.s.l.) | Average Annual Rainfall (mm) | Average Annual Runoff (mm) | Average Annual Temperature (°C) |
|---|---|---|---|---|---|
| Sokoru | 41 | 1810–2535 | 1372 | 305 | 19.6 |
| Woshi-Dimbira | 273 | 1780–2350 | 1732 | 734 | 19.5 |
| Upper-Didesa | 1890 | 1515–2930 | 2066 | 736 | 19.5 |
Table 2.
Fitted parameters α and β for recession curve analysis shown in Figure 4 for the three watersheds and three time periods considered in this study.
Table 2.
Fitted parameters α and β for recession curve analysis shown in Figure 4 for the three watersheds and three time periods considered in this study.
| Watershed | Period | α | β |
|---|---|---|---|
| Sokoru | 1983–1992 | 0.16 | 1.31 |
| 1993–2003 | 0.20 | 1.11 | |
| 2004–2014 | 0.27 | 1.30 | |
| Woshi-Dimbira | 1984–1993 | 0.20 | 0.36 |
| 1994–2003 | 0.14 | 1.01 | |
| 2004–2014 | 0.08 | 1.27 | |
| Upper-Didesa | 1986–1994 | 0.10 | 0.86 |
| 1995–2003 | 0.06 | 1.40 | |
| 2004–2013 | 0.03 | 2.21 |
Table 3.
Average (standard deviation) for the fitted k values and corresponding Q0 when recession begins and Q30 assuming Δt is 30 days after the beginning of the dry season for the three watersheds considered in this study.
Table 3.
Average (standard deviation) for the fitted k values and corresponding Q0 when recession begins and Q30 assuming Δt is 30 days after the beginning of the dry season for the three watersheds considered in this study.
| Watershed | Q0 (mm) | Q30 (mm) | k (1/d) |
|---|---|---|---|
| Sokoru | 2.55 (1.14) | 0.37 (0.25) | 0.03 (0.01) |
| Woshi-Dimbira | 7.91 (3.48) | 0.88 (0.42) | 0.03 (0.01) |
| Upper-Didesa | 6.91 (2.19) | 0.85 (0.39) | 0.03 (0.01) |
Publisher’s Note: MDPI stays neutral with regard to jurisdictional claims in published maps and institutional affiliations. |
© 2021 by the authors. Licensee MDPI, Basel, Switzerland. This article is an open access article distributed under the terms and conditions of the Creative Commons Attribution (CC BY) license (https://creativecommons.org/licenses/by/4.0/).
Share and Cite
MDPI and ACS Style
Gebrehiwot, S.G.; Breuer, L.; Lyon, S.W. Storage-Discharge Relationships under Forest Cover Change in Ethiopian Highlands. Water 2021, 13, 2310. https://doi.org/10.3390/w13162310
AMA Style
Gebrehiwot SG, Breuer L, Lyon SW. Storage-Discharge Relationships under Forest Cover Change in Ethiopian Highlands. Water. 2021; 13(16):2310. https://doi.org/10.3390/w13162310
Chicago/Turabian StyleGebrehiwot, Solomon Gebreyohannis, Lutz Breuer, and Steve W. Lyon. 2021. "Storage-Discharge Relationships under Forest Cover Change in Ethiopian Highlands" Water 13, no. 16: 2310. https://doi.org/10.3390/w13162310
Note that from the first issue of 2016, this journal uses article numbers instead of page numbers. See further details here.