
Droplet Evaporation in a Gas-Droplet Mist Dilute Turbulent Flow behind a Backward-Facing Step

Laboratory of Thermal and Gas Dynamics, Kutateladze Institute of Thermophysics, Siberian Branch of Russian Academy of Sciences, Academician Lavrent’ev Avenue 1, 630090 Novosibirsk, Russia
*
Author to whom correspondence should be addressed.
Water 2021, 13(17), 2333; https://doi.org/10.3390/w13172333
Submission received: 27 July 2021
/
Revised: 18 August 2021
/
Accepted: 23 August 2021
/
Published: 26 August 2021
(This article belongs to the Special Issue Gas-Liquid Two-Phase Flow in the Pipe or Channel)
Abstract
:The mean and fluctuation flow patterns and heat transfer in a turbulent droplet-laden dilute flow behind a two-dimensional single-side backward-facing step are numerically studied. Numerical simulations are performed for water droplets, with the inlet droplet diameters d1 = 1–100 μm; they have a mass fraction of ML1 = 0–0.1. There is almost no influence of a small number of droplets on the mean gas flow and coefficient of wall friction. A substantial heat transfer augmentation in a droplet-laden mist-separated flow is shown. Heat transfer increases both in the recirculating flow and flow relaxation zones for fine, dispersed droplets, and the largest droplets augment heat transfer after the reattachment point. The largest heat transfer enhancement in a droplet-laden flow is obtained for small particles.
1. Introduction
Gas-droplet confined backward-facing step (BFS) flows are usually inhomogeneous and anisotropic. The multiscale interactions between tiny particles (droplets) and the separated turbulent carrier flow represent a complicated process with numerous insufficiently investigated crucial points [1]. The dispersion of liquid droplets, their heating up and their evaporation can complicate the study of the mean and fluctuation flow structure and the dispersed phase distribution in such flows. Turbulent droplet-laden flows behind a BFS are observed in many applications, such as cyclonic separation, heat transfer, flame stabilization in combustors, pneumatic transport, etc. They represent a typical shear flow with a few zones: the core main flow, shear-layer, recirculation, reattachment and flow relaxation regions [2,3,4,5]. Each region has its typical length and time macro- and microscales. Our current idea of the flow structure and heat transfer is far from being completed, even for single-phase flows [1,2,3,4]. Particle-laden turbulent BFS isothermal flows were experimentally studied in [6,7]. A particle-laden separated isothermal flow was simulated numerically studied in [8,9,10,11,12,13]. The Lagrangian [8] and Eulerian [9,10,11,12,13] approaches were used to simulate the dispersed phase. The gas-phase turbulence was predicted by the two-equation isotropic turbulence model [8,9,10,11,13] and the algebraic Reynolds stress model [12].
The addition of droplets to a single-phase turbulent flow and their evaporation causes significant heat transfer augmentation [14]. Evaporation of droplets and combustion of various liquids under different conditions were experimentally, theoretically and numerically investigated. The droplet diameter and mass fraction mainly determine the rate of their evaporation. The knowledge of complicated and related processes of droplet evaporation in turbulent recirculating flows allows for a more effective control of the flow structure, wall friction and heat transfer in energy equipment. This is essential for successful design, determining optimal operating conditions and reducing pollutant emissions in various industrial applications. Other methods for controlling the mean flow patterns, turbulence level, pressure drop, friction and heat transfer rate are presented by surface modifications (a corrugated wall surface) [15].
The average Stokes number Stk = τ/τf is a non-dimensional parameter defining how the particle or droplet interacts with the mean carrier-phase flow [7,16,17]. Here, is the particle relaxation time, taking the deviation from the Stokes power law, , where is the Reynolds number based on the dispersed phase diameter and τf = 5H/U1 is the time macroscale (characteristic time of fluid motion) [7,16,17]. ρL is the dispersed phase density, d1 is the droplet diameter at the inlet, US and UL are the fluid (gas) velocity seen by the droplet and mean droplet velocity, respectively, and μ and ν are the dynamic and kinematic viscosities of the gas phase, respectively. The tiny particles or droplets (Stk < 1) cause an attenuation of the level of turbulent kinetic energy (TKE) of the gas phase, and they interact well with the motion of the carrier flow [6,7]. The large particles (Stk > 1) cause additional turbulence generation due to the formation of vortices caused by the flow around large particles. The Stokes number StkK = τ/τK, based on the Kolmogorov time scale τK, is another important dimensionless parameter for describing the behavior of the dispersed phase in a two-phase flow [7,17,18].
Only a few papers have investigated a non-isothermal droplet-laden backward-facing step flow, as well as performed experimental [16,19] and numerical [16] studies. The streamwise velocities, turbulent kinetic energy of phases, dispersed phase mass flux and heat transfer were measured and predicted in [16]. The measurements were performed using the phase Doppler anemometer for water droplets with a mean initial size d1 = 60 μm, mass concentration ML1 = 0.04 and Reynolds numbers ReH = UmH/ν = (0.5 and 1.1) × 104. The study was performed at two heights of the step, H = 10 and 20 mm, and the expansion ratios were ER = (H + h1)/h1 = 1.14 and 1.29, respectively. Numerical simulations were performed using the RANS model with a standard k − ε model. The droplets’ motion was simulated using the Lagrangian stochastic approach. A considerable increase in heat transfer (more than twofold in comparison with a single-phase separated flow) was obtained. It was found in Reference [19] that the heat transfer coefficient increases significantly (almost doubling) when the gas-droplet mist is added at ReH = (1.25 and 2.5) × 104. The mean size of droplets at the inlet was d1 = 10 μm, and the mass fraction was ML1 = 0.015. The study was performed for two heights of the step, H = 10 and 40 mm, and in two ducts with h = 10 and 60 mm before expansion. The expansion ratios were ER = (H + h1)/h1 = 2 and 1.67.
The large-eddy simulation (LES) is one of the modern methods for predicting turbulent flows, and it has been used for the modeling of two-phase separated flows [20]. Lagrangian or Eulerian approaches can be used to predict the dispersed phase. However, the use of LES requires high-performance supercomputers, and this restricts the use of large-eddy simulations for engineering purposes. One of the methods allowing for the partial consideration of the anisotropy of the carrier phase in two-phase backward-facing step flows is the use of second-moment closure (SMC) [21].
The main purpose of this work is the numerical prediction of the mean and turbulent flow structure and heat transfer in a gas-droplet flow behind a backward-facing step. This study is a continuation of previous works [22,23]. The numerical model developed in [22] employed a two-fluid Eulerian model and in-house code to simulate droplet-laden separated flow in a pipe with sudden expansion. The governing equations were written and numerically solved of the axisymmetric droplet-laden mist flow in a pipe with sudden expansion. In this paper, we are carried out the numerical investigation of the flow and heat transfer behind a single-side backward-facing step. This is the main difference between this paper and our previous works [22,23]. The RANS and second-moment closure, taking into account the effect of the dispersed phase addition, were used in the numerical model. The influence of droplet mass fraction, inlet Reynolds numbers and particle diameters at the duct inlet on characteristics of the gas-droplet separated flow were investigated in previous works [22,23].
2. Mathematical Model and Method of Numerical Realization
Turbulent gas-droplet mist flow is simulated using a set of steady-state, incompressible two-dimensional RANS equations. The mean gas flow is described by the continuity, which is two momentum in the streamwise and transverse directions, as well as energy equations and the equation of steam diffusion. The Eulerian approach [24,25] is used for the simulation of the motion and heat transfer of droplets. The sets of mean and fluctuating equations for both phases are described in detail [22]. The elliptic-blending second-moment closure [20] is used for the predictions of the gas-phase turbulence, taking into account the effect of the dispersed phase on the carrier turbulence [26,27]. The droplet-laden flow occurs in a dilute regime (Φ1 < 10−4), and the droplets are fine (d1 < 100 μm). The effect of inter-particle collisions is neglected in the two-phase flow [18]. The droplet–droplet collisions are ignored in such a case, but the effect of the dispersed phase on the gas turbulent flow cannot be ignored [18,28]. The regime of turbulence modification has been identified for Φ = 10−6−10−3, and it is called “two-way coupling” [28,29]. The r.m.s. velocities and temperature pulsations and the turbulent heat flux of the dispersed phase are simulated using the model of [26,27].
Droplet breakup takes place when ≥ Wecr = 7 [30], but for all droplet diameters at the inlet studied in the present paper, We << 1. Here and UL are the fluid (gas) velocity seen by the droplet [12,18] and mean droplet velocity, where U is mean gas velocity (derived from RANS) and is the drift velocity between the fluid and the particles [18]. Breakup and droplet deformation were not observed in the turbulent gas-droplet flow. Droplet fragmentation at its contact with a duct wall was not considered. The predictions are carried out for the water droplets and air (gas-phase) flow at the inlet cross-section at a uniform wall temperature (TW = 373 K). The temperature inside the droplet radius stays constant since the Biot number is Bi = αLd1/λL<< 1 [22] and the Fourier number is Fo = τeq/τevap << 1 [31], and a droplet evaporates at the saturation temperature. Here, τeq is the period of existence of an internal temperature gradient inside a droplet and τevap is the droplet lifetime (the time until complete droplet evaporation). The boundary condition on the heated wall for the droplets correlates to the so-called “absorbing surface” [32]. According to this condition, droplets do not return to the flow after making contact with the solid wall. The wall surface is always dry, and droplets deposited from the droplet-laden flow momentarily evaporate and do not form a liquid film or spots on the wall [22,23]. This assumption is valid for the heated surface when the temperature difference between the wall and the droplet is large enough () [31]. The effect of growth of steam bubbles on the wall surfaces was not taken into account. The same assumptions were used in our previous recent numerical simulations [22,23] for droplet-laden mist flow in the pipe with sudden expansion. It may be is important in other thermal boundary conditions on the wall [33].
3. Numerical Procedures and Validation
The second-order upwind finite control volumes approach on a staggered grid is used for the numerical solution of all of the governing equations for the gas and dispersed phases. The convective terms are discretized using the third-order QUICK algorithm, and the diffusion terms are numerically solved by employing the second-order central difference scheme. The SIMPLEC scheme is used for the coupling of velocity and pressure.
The first computational cell is set at a coordinate y+ = yU*/ν = 0.3–0.5, where y is the distance from the wall, and U* is the friction velocity of the single-phase flow. A minimum of 10 control volumes were located to resolve the large gradients in the near-wall region, subjected to viscosity (y+ < 10). Grid sensitivity was studied to obtain the optimum grid resolution that provides the grid-independent solution. For all numerical investigations, we used a basic grid with 400 × 100 control volumes along the streamwise and transverse directions. The grid convergence was verified for three grid sizes: “coarse” 200 × 50, “basic” 300 × 150 and “fine” 500 × 150 control volumes. The Reynolds stress components are obtained using the method of [34].
A more refined grid is applied in the recirculation region and in the zones of flow detachment and reattachment and in the inlet region of the duct. The coordinate transformation is suitable for such a two-dimensional problem:
where Δψj and Δψj−1 are the current and previous steps of the grid in the axial or radial directions, respectively, and a = 1.08 (longitudinal direction) and a = 1.05 (transverse direction). At least 10 CVs were generated to ensure the resolution of the mean velocity field and turbulence quantities in the viscosity-affected near-wall region (y+ < 10).
Δψj = a × Δψj−1,
At the first stage, the model was tested with measurements of the longitudinal mean and pulsation velocities [35], the wall friction coefficient and the heat transfer distributions along the duct length [36] in a single-phase separated flow behind a backward-facing step. A reasonable agreement was obtained between the computed and measured results (the difference is up to 15%), which served as the basis for simulations of the gas-droplet separated flow.
4. The Numerical Results and Discussion
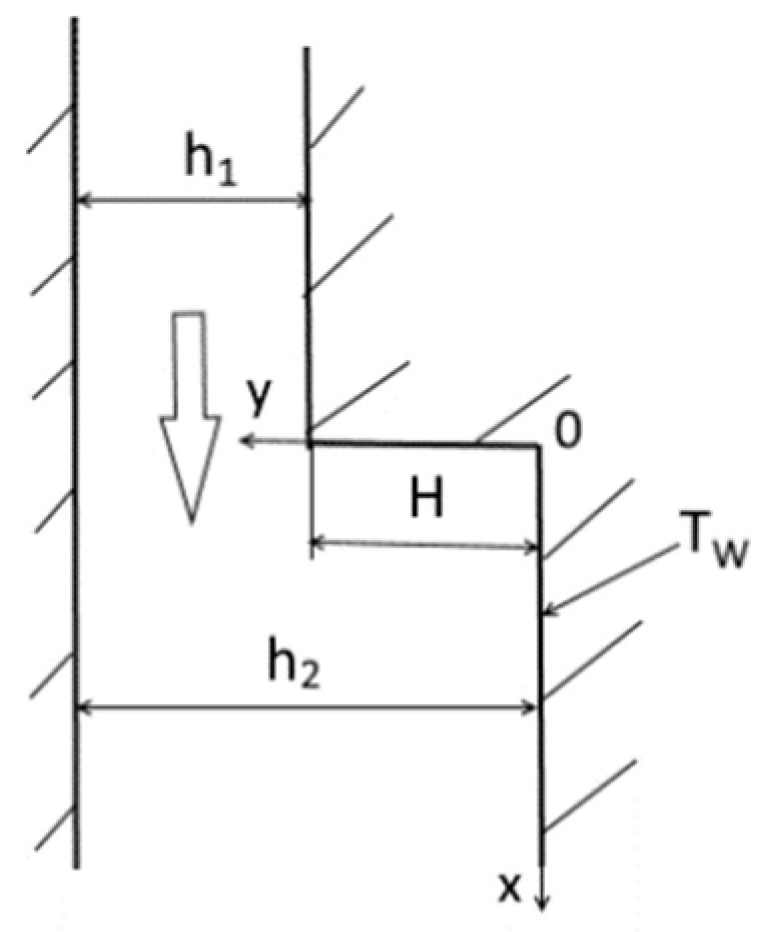
The simulations are performed for the droplet-laden flow at atmospheric pressure. The duct height before sudden expansion is h1 = 20 mm; after expansion, h2 = 40 mm, the step height H = 20 mm and the expansion ratio ER = (h2/h1) = 2 (see Figure 1). The mean-mass gas velocity at the inlet is Um1 = 10 m/s, and the Reynolds number ReH= HUm1/ν ≈ 1.33 × 10⁴. We add the droplets to the hydrodynamically fully developed single-phase air flow in the inlet cross-section (the section of sudden expansion) and keep the initial droplet velocity constant across the duct height: UL1 = 0.8Um1. The initial size of droplets in our studies is d1 = 1–100 μm, and the mass concentration of droplets is ML1 = 0–0.1. The vapor mass fraction at the inlet is MV1 = 0.005. The temperature of the air and droplets at the inlet is T1 = TL1 = 293 K, and the wall temperature is TW = const = 373 K. The mean Stokes number is Stk = τ/τf = 0.03–2.9, τf = 5H/U1 = 0.01 s, and the Stokes number is = 0.2–19.
4.1. Flow Structure, Wall Friction and Turbulence Quantities
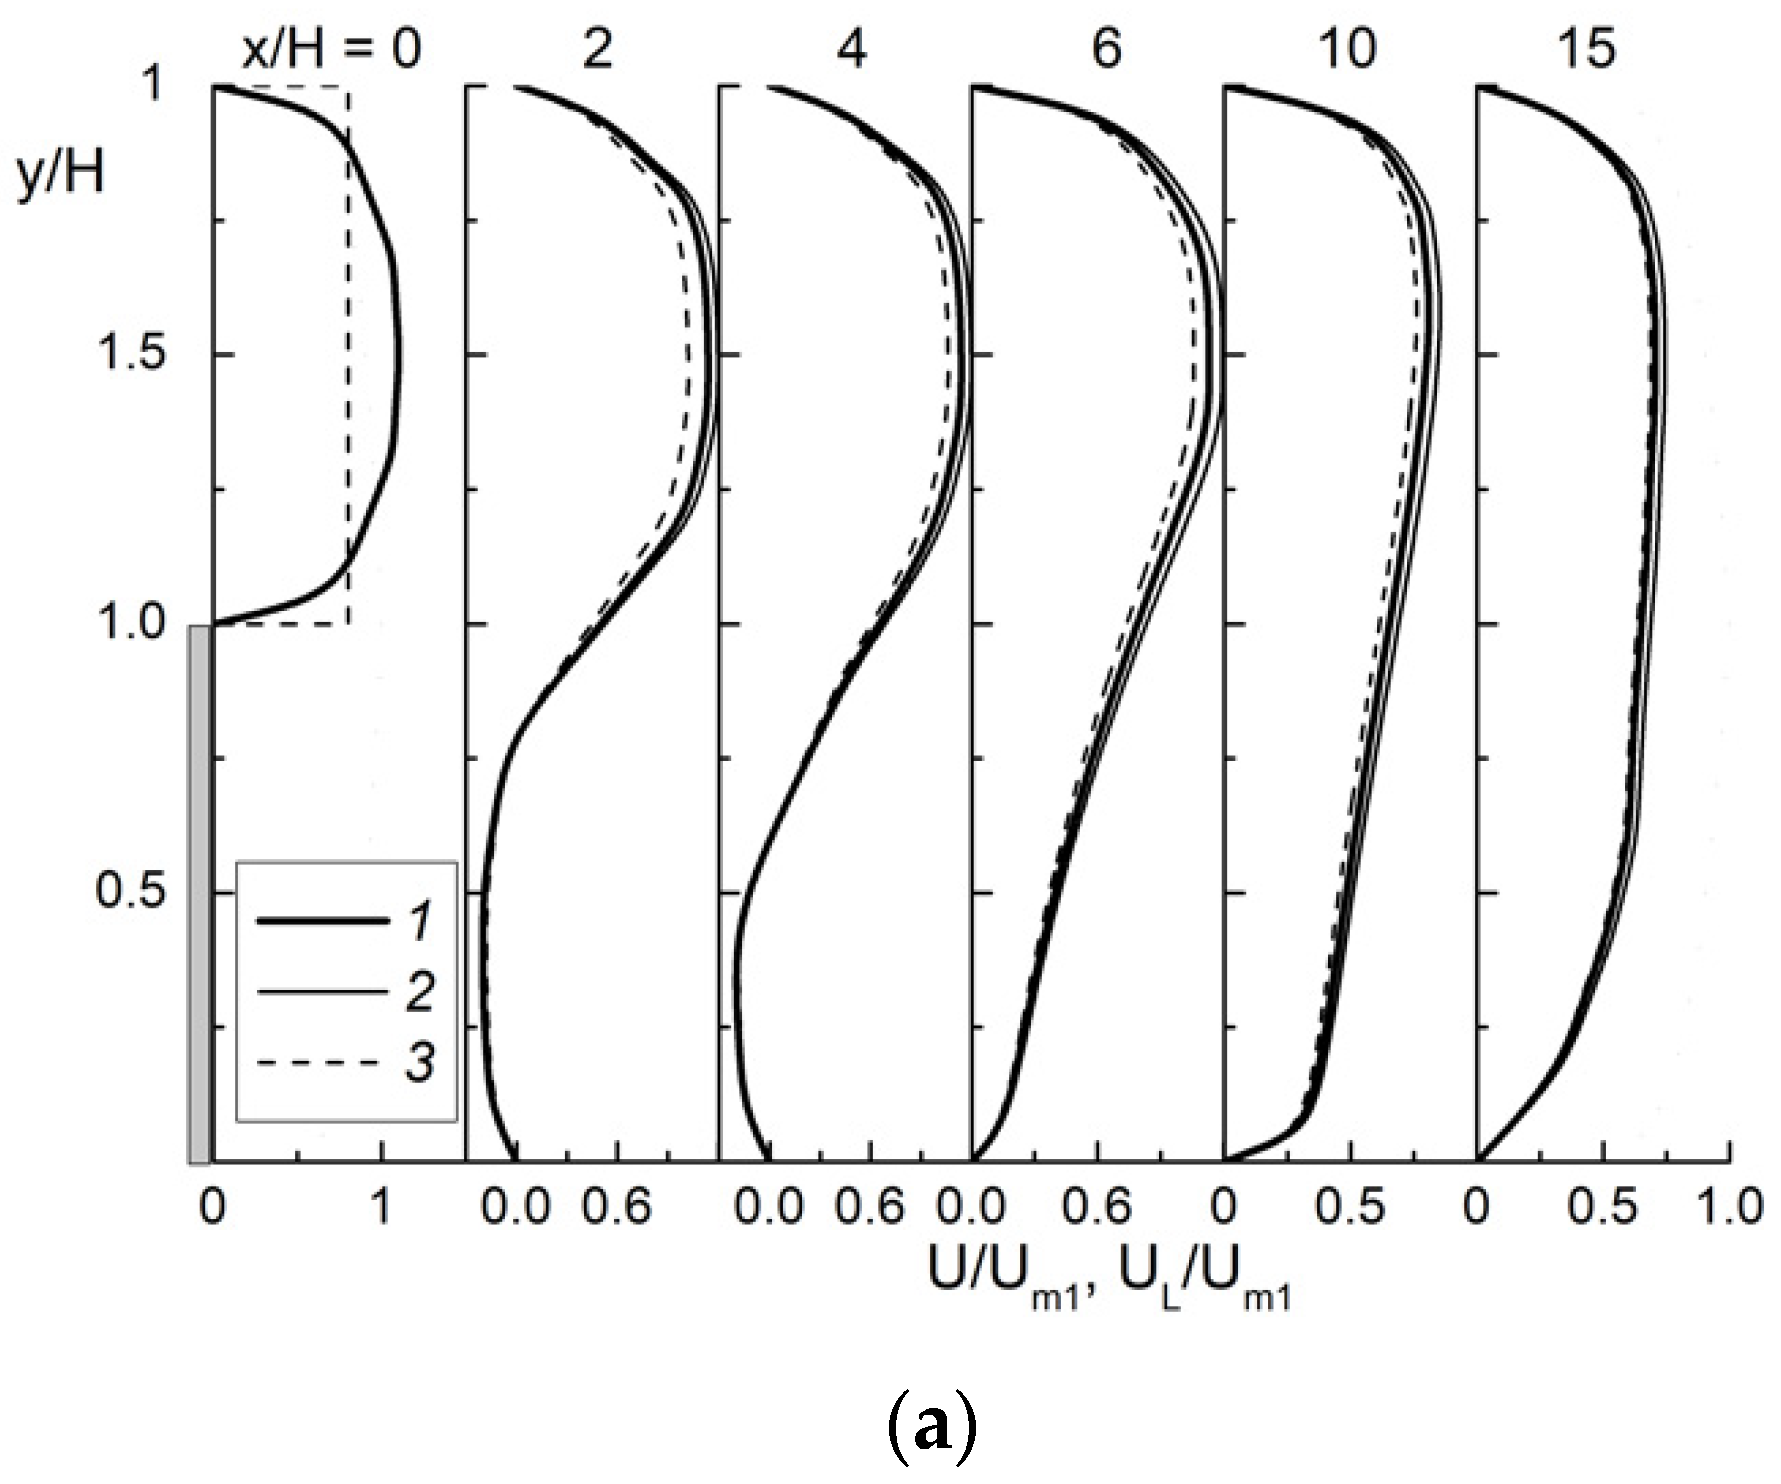
The transverse profiles of the mean longitudinal velocities of gas and dispersed phases at different distances from the flow separation point are shown in Figure 2a. The flow reattachment point is located at xR/H ≈ 5.8 for a single-phase air flow and xR/H ≈ 5.83 at ML1 = 0.05, where xR is the length of the recirculating region. The first three cross-sections are located in the recirculation zone, the fourth cross-section corresponds to the flow reattachment area and the last two correspond to the droplet-laden flow relaxation area. A sharp change in the flow structure is observed downstream of the separation cross-section. The profiles of the streamwise velocities of phases in a two-phase flow correspond to those for a single-phase flow. The modification of the mean flow velocity with such a small addition of the dispersed phase is not observed. This qualitatively agrees with other conclusions for both gas-droplet [17,22] and gas-dispersed [6,7,9,10,11,12] turbulent separated flows. At a large distance from the point of flow reattachment, the two-phase flow takes the form of a fully developed flow in the duct. In the first cross-sections, the gas velocity is higher than the corresponding value for the dispersed phase; this is explained by the initial conditions for the addition of the droplets to the gas phase and their acceleration in the downward direction. Further, the droplet velocity is almost identical to the gas velocity.
The wall friction coefficient () distributions along the streamwise coordinate are presented in Figure 2b, where τW is the shear wall friction and xR is the recirculation length. The line 1 represents the simulations for the single-phase flow without droplets and with other identical conditions. The addition of a dispersed phase to the turbulent separated single-phase flow has no significant effect on the value of Cf in the flow separation and relaxation (after the reattachment point) regions (see Figure 2b). We can see a slight increase in the wall friction coefficient in a droplet-laden flow.
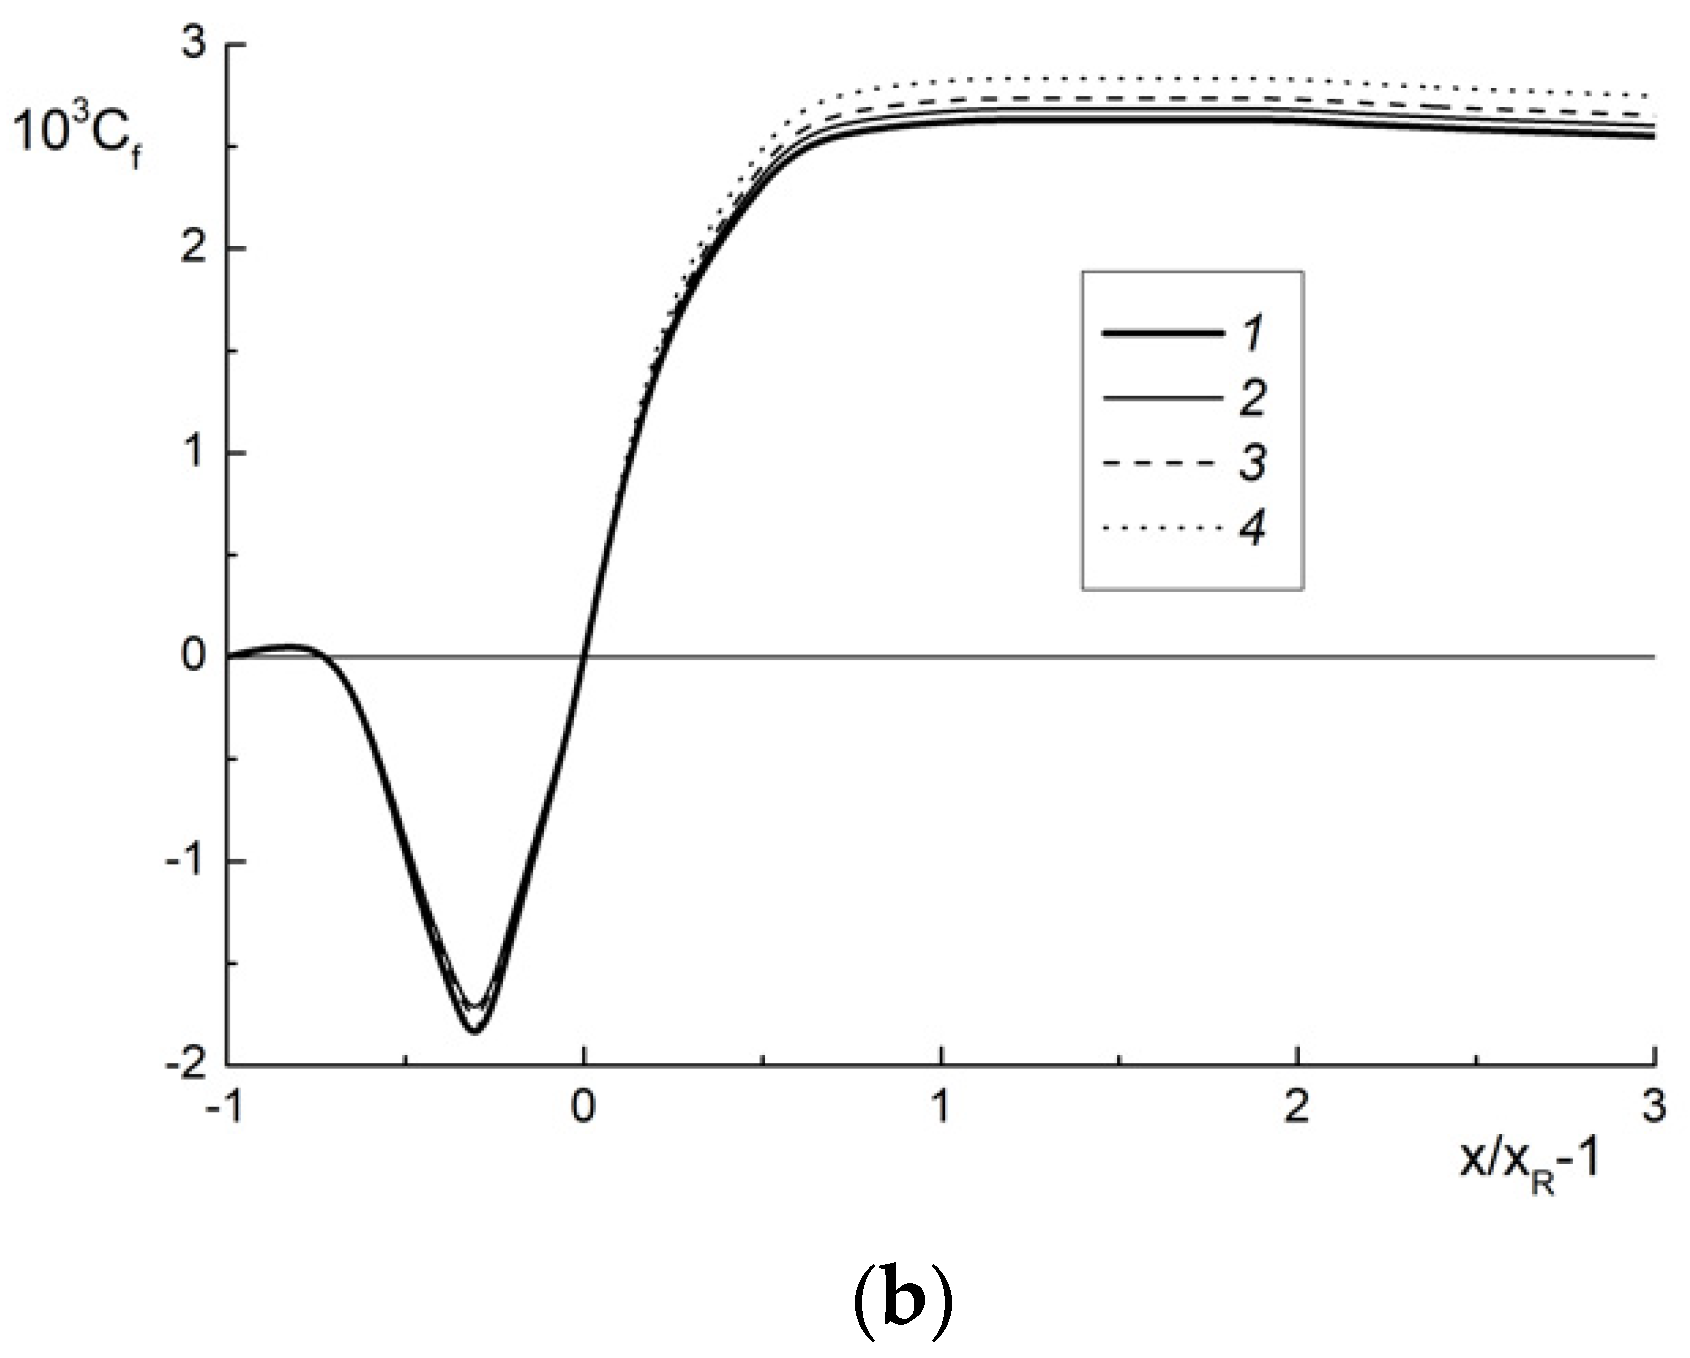
The distribution of the minimum value of the wall friction coefficient in the separation region for single-phase (2) and gas-droplet flows at ML1 = 0.05 (3) vs. the Reynolds number ReH is given in Figure 3. Line 1 is the semiempirical correlation [37] for calculating the wall friction
Points (2 and 3) represent the author’s predictions. The effect of droplets on the wall friction in the studied range of the mass fraction is small, up to 5%.
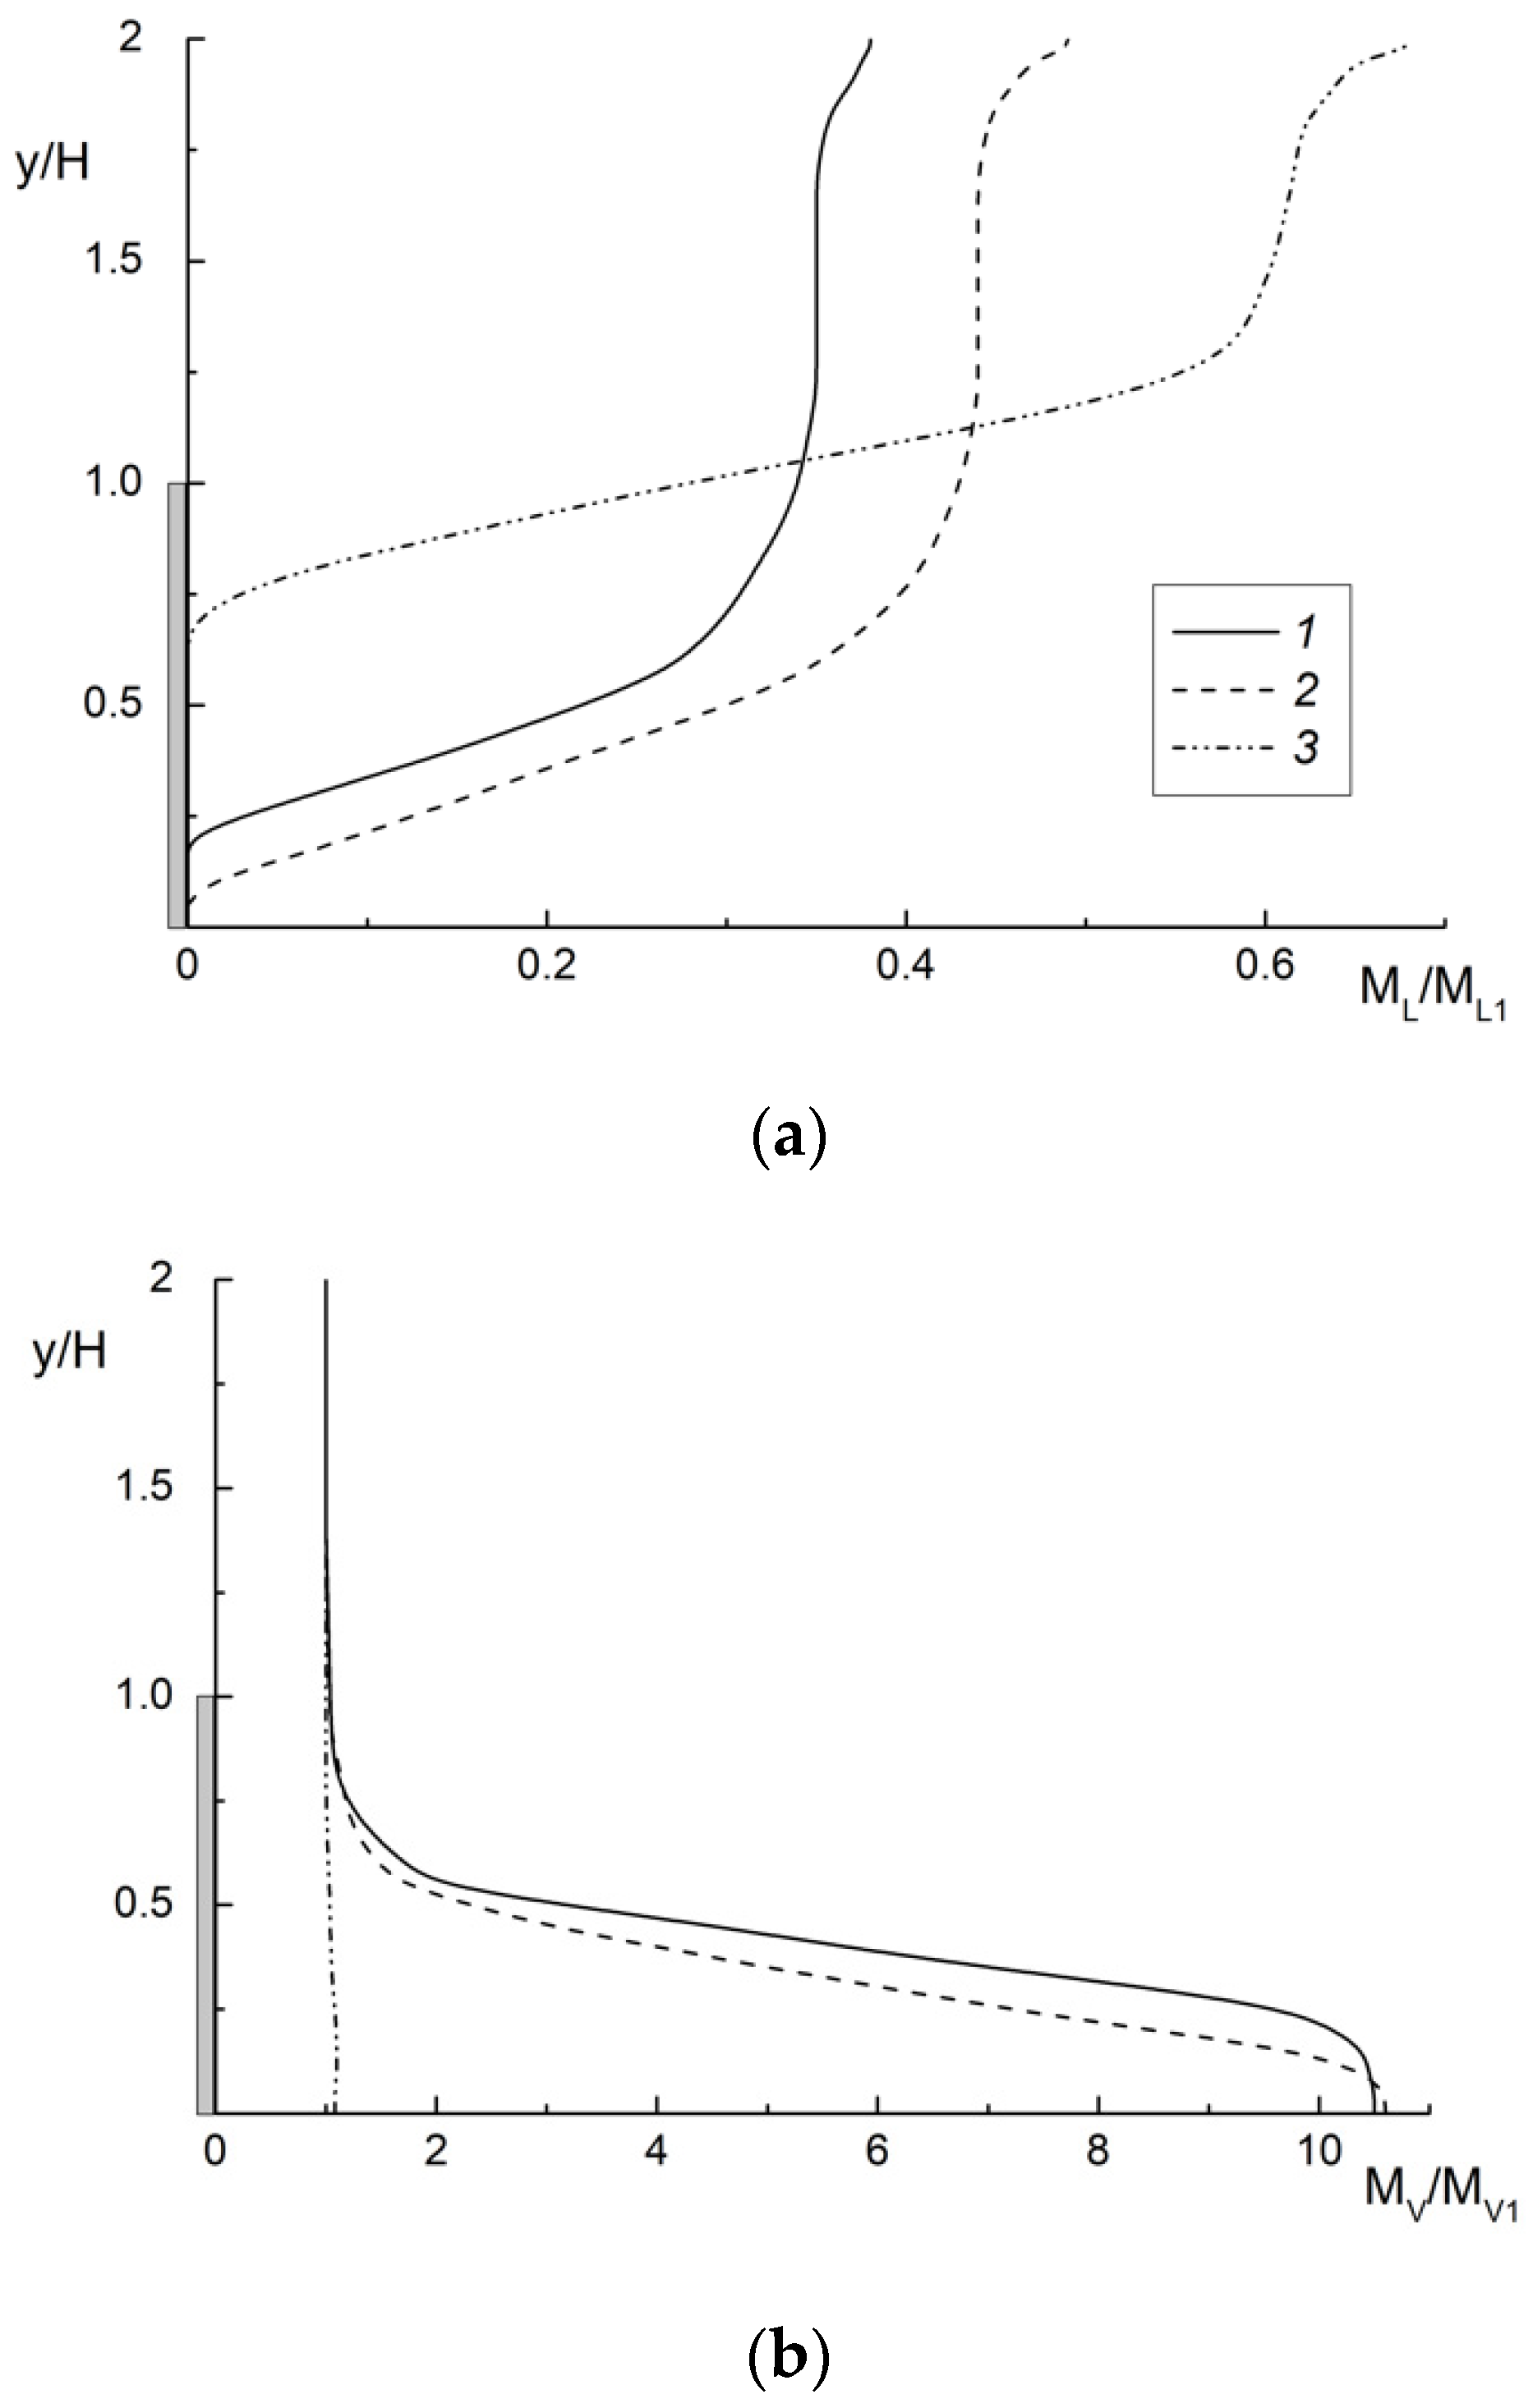
Figure 4a presents the transverse distributions of the droplet mass fraction at x/H = 2. The predictions are performed for three different mean Stokes numbers, Stk = 0.03, 0.28 and 2.9. The first two values of mean Stokes numbers (1 and 2) correspond to the flow regime with droplet entrainment into the mean turbulent motion, and they are observed in the whole cross-section of the duct (flow core, shear layer and recirculation region). The third Stokes number (3) represents the flow regime, when the droplets are not involved into the mean motion, and they almost do not penetrate into the recirculation zone [6]. These conclusions are confirmed by our numerical simulations. The thin layer close to the duct wall for the small particles is free from droplets due to their evaporation. The height of this zone depends on the droplet diameter, and this height is largest for the smallest particles studied (1). The evaporation of droplets in the flow core is insignificant, and the predicted profiles of mass concentrations for all droplet diameters have almost constant values. The slight increase in the profiles of the droplet mass fraction toward the “upper” duct wall is computed. This explains the process of droplet accumulation in the near-wall region and their deposition on the vertical wall surface. The same tendency was numerically obtained in [12] for the gas-dispersed flow behind a BFS.
The droplet mass concentration decreases drastically toward the duct wall. The transverse profiles of vapor mass fractions show the opposite tendency for the initial droplet diameter studied (see Figure 4b). Here, , where is the additional mass of steam from the droplet surface created by vaporization. The values of the steam mass concentration are varied from unity (without evaporation) up to 11 at ML1 = 0.05 (the maximal possible steam magnitude and ). The maximum values of the steam mass fraction are found close to the wall of the duct, and the smallest values occur in the duct flow core.
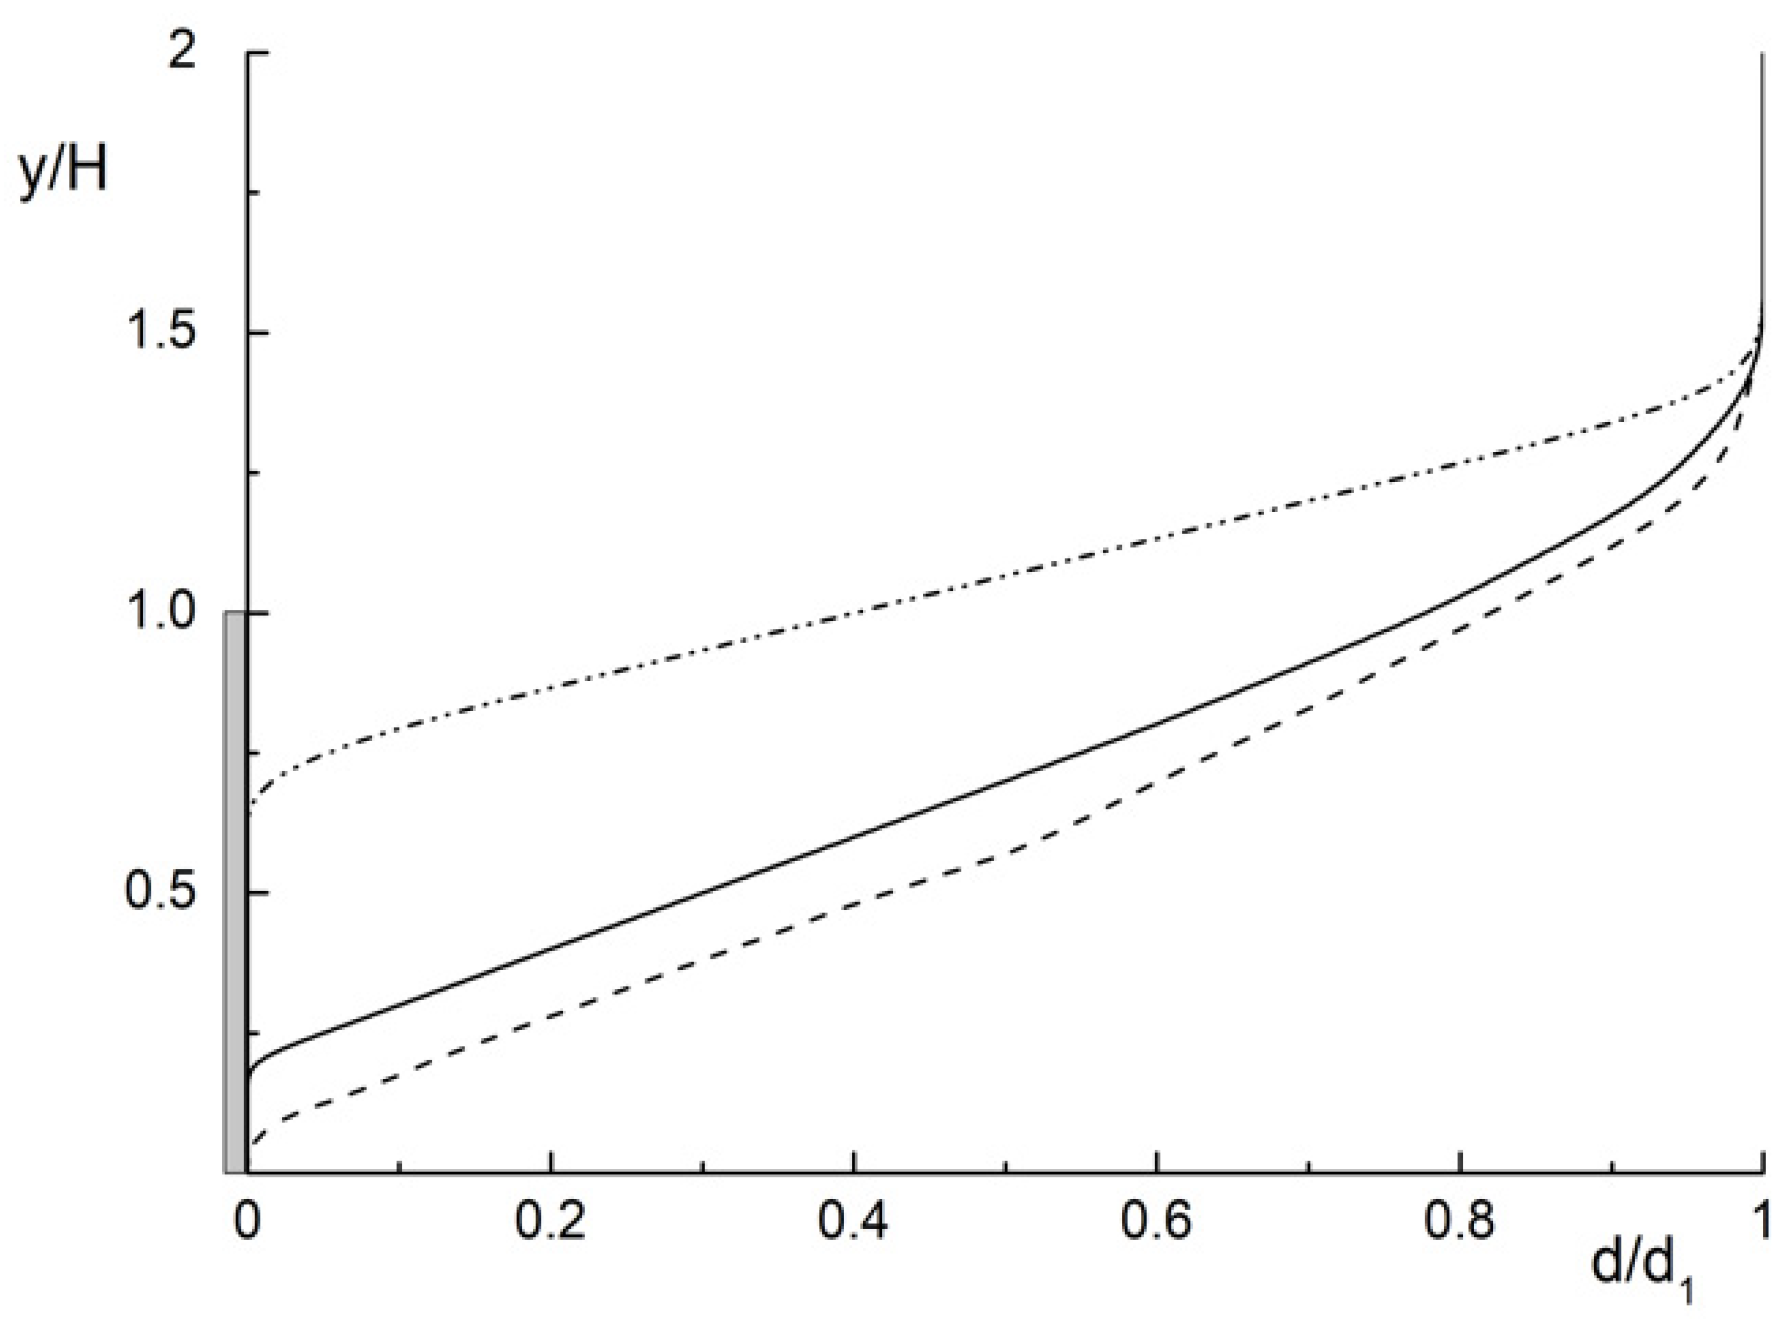
The distributions of the dimensionless diameter of the droplets with a change in their initial size are shown in Figure 5 at a distance x/H = 2 downward from the cross-section of the sudden expansion of the flow. A region free of both the smallest (1) and the largest (3) particles can be seen close to the wall. In the first case, the reason for their absence close to the wall of the duct is the process of their evaporation. For the second case, this is explained by their absence in the entire flow recirculation region due to the large mean Stokes number; such particles are observed only in the shear layer and in the central and “upper” parts of the duct. Droplets of intermediate diameter (2) are observed throughout almost the whole cross-section of the duct. Obviously, in this zone, the droplets’ diameters have the smallest values due to the process of their evaporation, whereas in the flow core, their size almost does not differ from the initial value. This confirms the conclusions in Figure 4a.
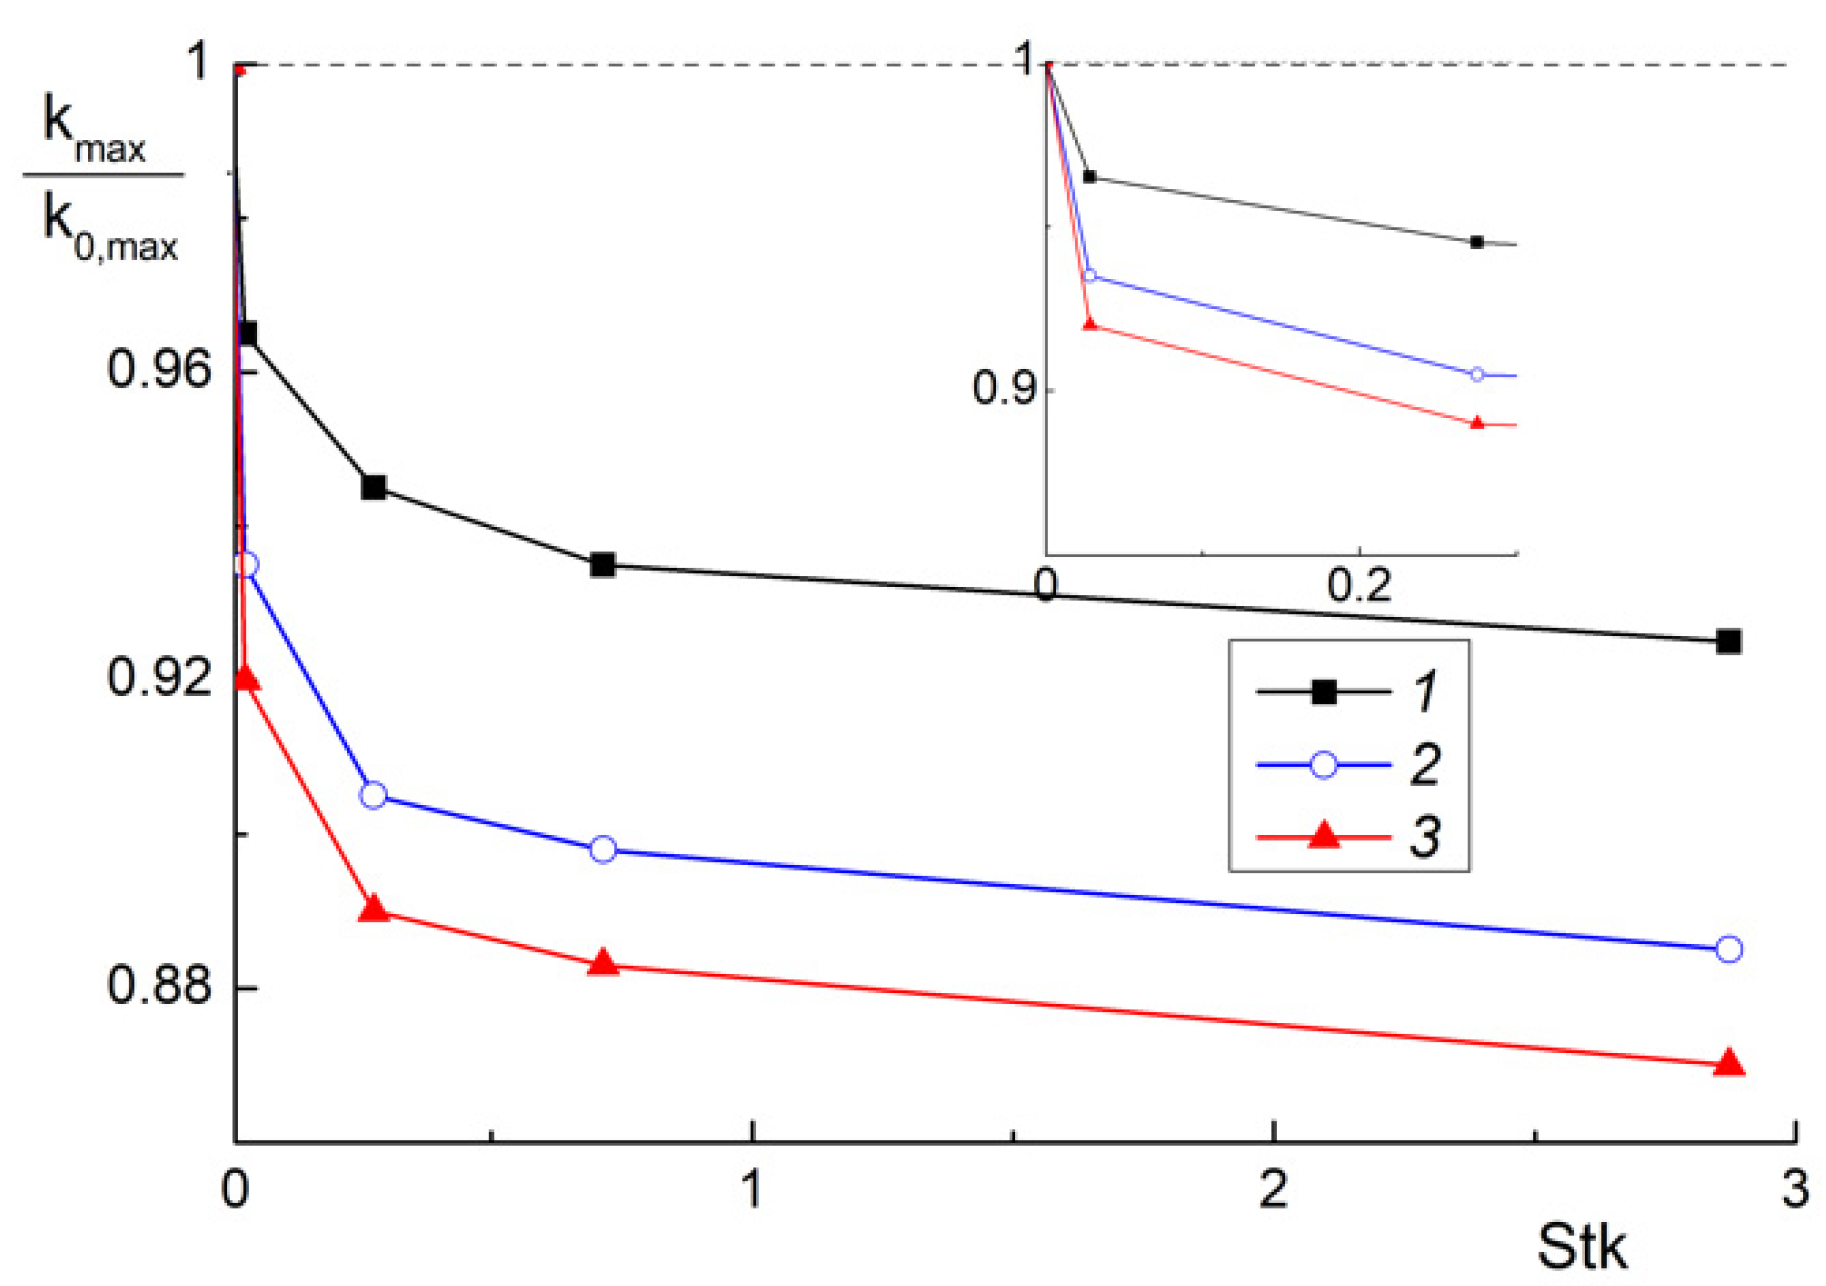
A modification of the gas-phase TKE vs. the mean Stokes numbers at distance x/H = 2 is presented in Figure 6. Here, k0,max is the maximum level of turbulence of the gas phase in a single-phase air flow. The level of gas turbulence in a two-dimensional flow is estimated using the following expression:
The maximum value of the turbulent kinetic energy is predicted in the shear mixing layer in both single- and two-phase flows behind the backward-facing step. The level of turbulence in a two-phase flow attenuates due to addition of tiny droplets in comparison with the single-phase flow. An increase in the droplet mass concentration leads to a significant decrease in the level of the carrier-phase turbulence. This correlates with the previously mentioned experimental [7] and numerical [9,22,23] works for separated flows with solid particles and liquid droplets.
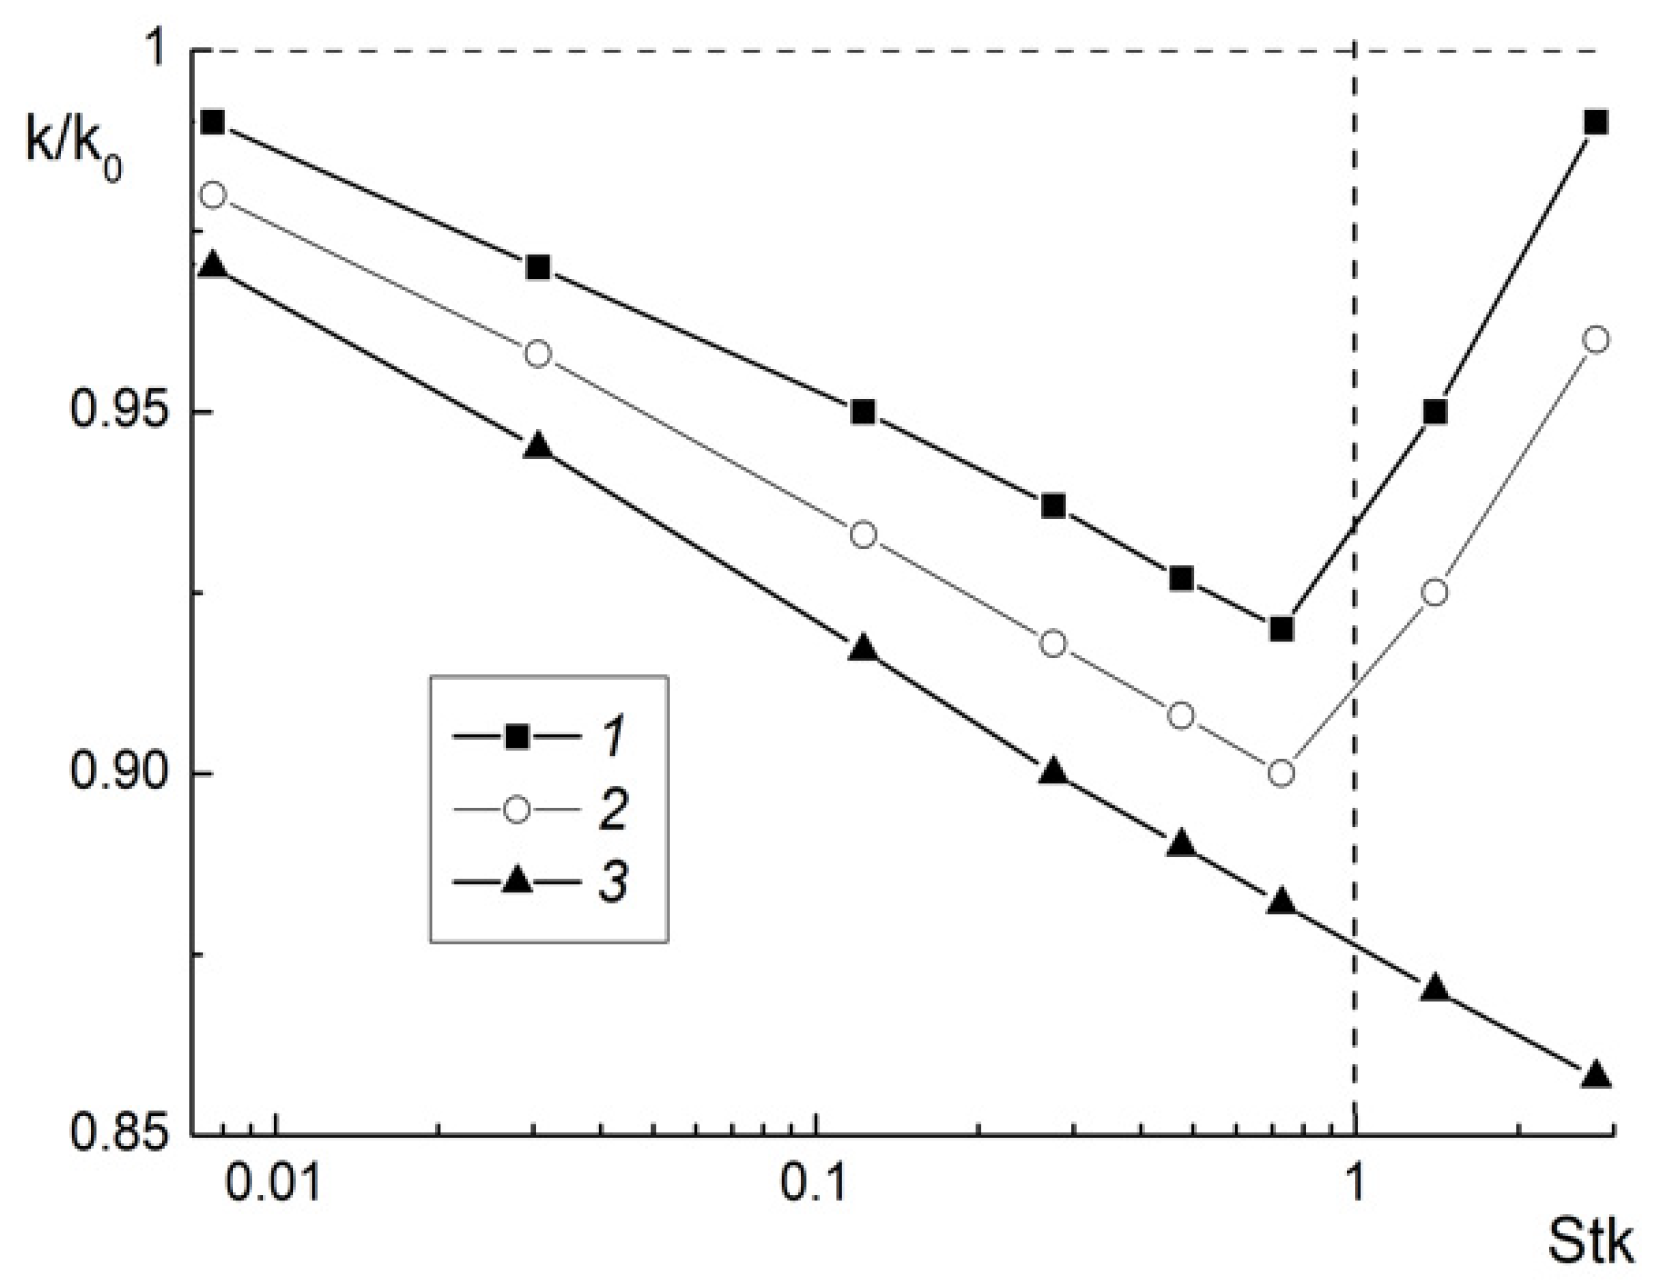
The distributions of the turbulence modification ratio (TMR) k/k0 depending on the average Stokes number are shown in Figure 7, where k0 is the turbulence level in the single-phase flow. The carrier-phase turbulence is calculated using relation (11). It is shown that the smallest suppression of gas turbulence is obtained near the wall at the distance y/H = 0.1 (1), where the diameters of droplets are the smallest due to their evaporation (see Figure 4a and Figure 5). The largest value is predicted at the distance y/H = 1 (3). There is almost no evaporation in this region, and the diameters of droplets are maximal. They are roughly equal to their initial size. The different mechanisms of the influence of the average Stokes number on turbulence modification for the cross-sections operate in the recirculation zone (1 and 2) and after flow reattachment (3). There is a sharp bend in the TMR distribution at Stk ≈ 1 for lines (1 and 2). This is caused by the fact that particles at Stk > 1 scarcely penetrate into the separation region, and they are found only in the shear layer and the duct core. Without a dispersed phase, an increase in turbulence was obtained in these two cross-sections for the level k/k0 → 1 in a single-phase flow. In the cross-section y/H = 1 (3), a decrease in the turbulence level of the gas phase is obtained with growth in the mean Stokes number (initial droplet diameter). For the investigated range of the initial droplet diameters, this cross-section is characterized only by turbulence level suppression, while for more inertial particles, an additional generation of the TKE level can also be obtained.
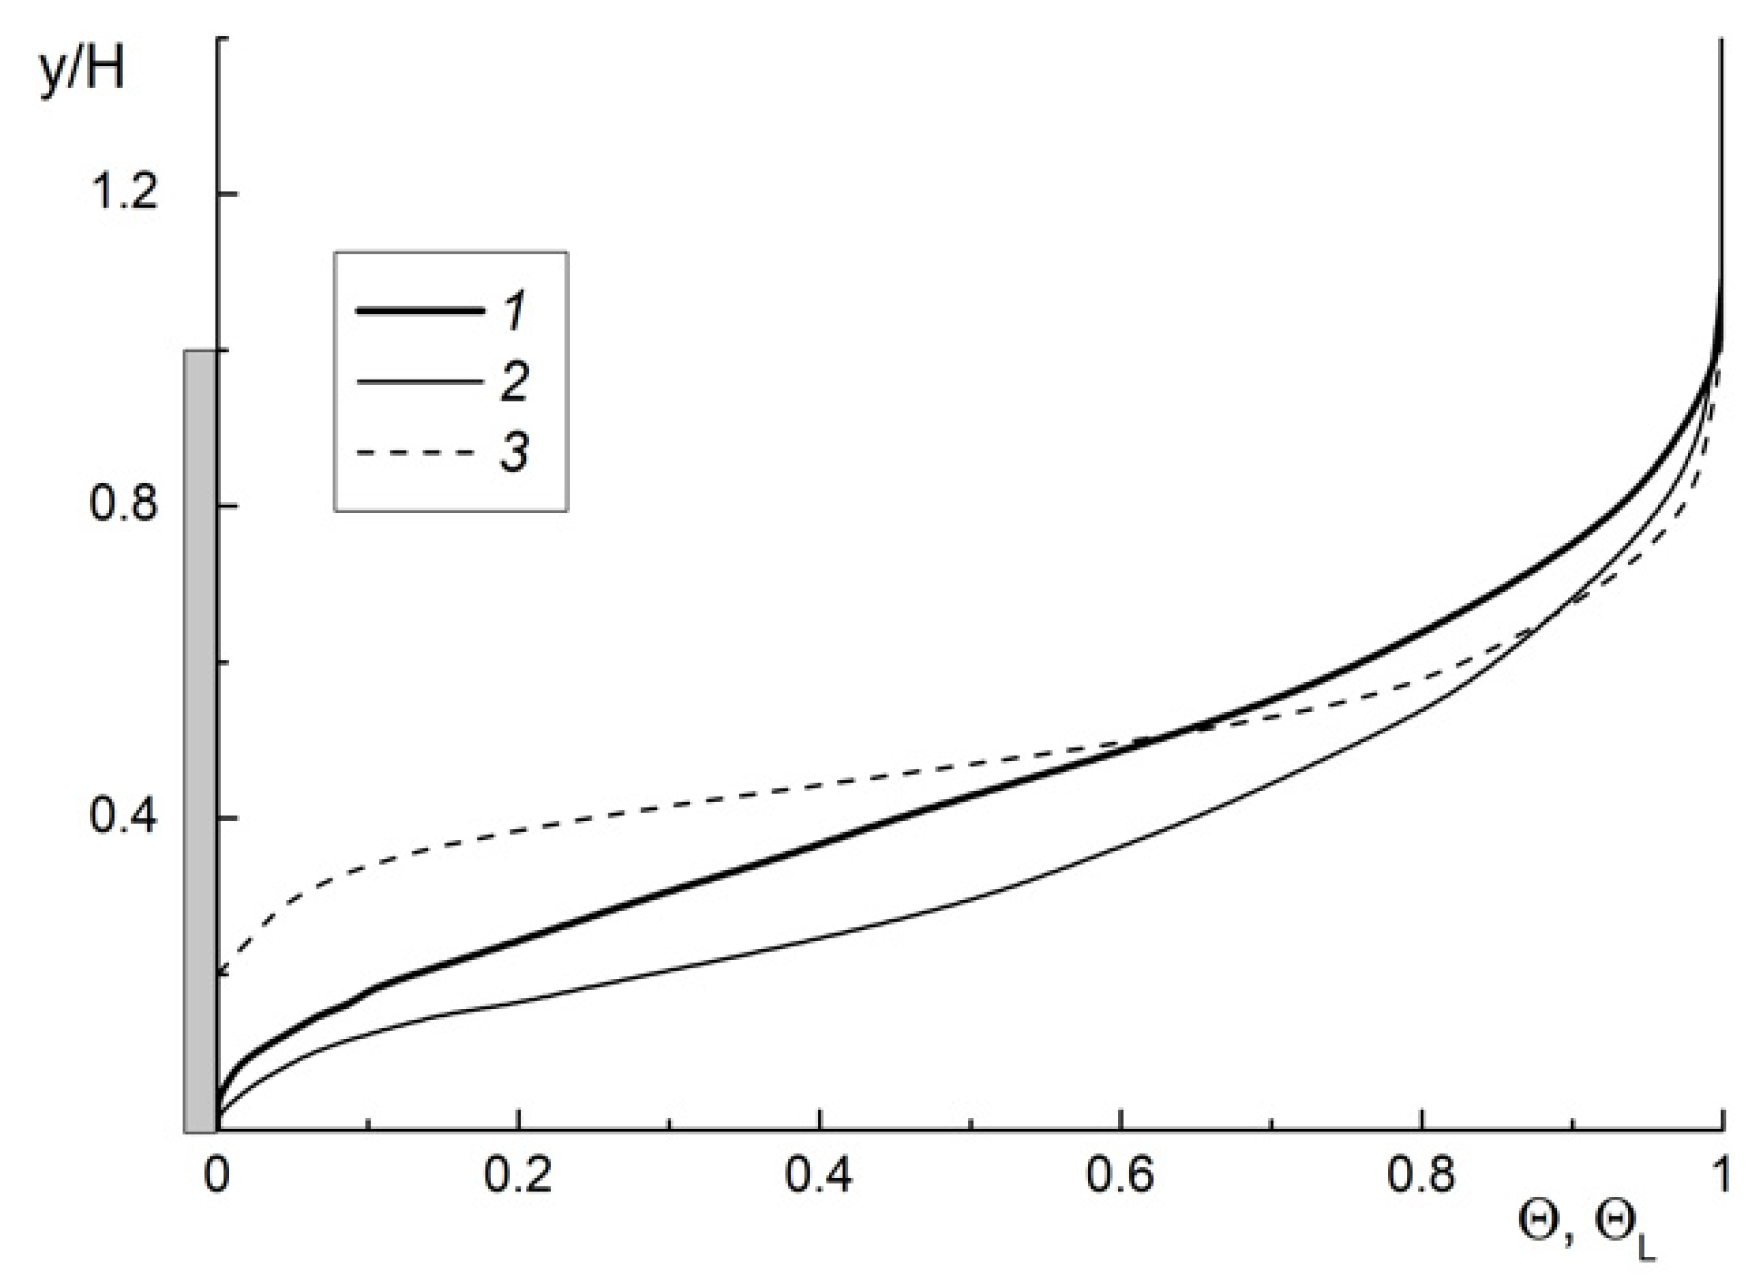
The transverse distributions of the temperatures of the gas, (lines 1 and 2), and droplets, (line 3), are presented in Figure 8. Here, T is the temperature and TL, max is the maximal temperature of the droplets in the corresponding cross-section. The subscripts “W”, “m” and “L” correspond to the wall, mean and droplets terms, respectively, and Tm and are the mean-mass gas and droplet temperatures in the corresponding cross-section, respectively. The normalized temperature ΘL is based on the maximal value of the droplet temperature TL,max. It is obvious that the minimal value of the droplet temperature is predicted in the turbulent flow core, and the maximal value of the droplet temperature is determined close to the wall. The gas temperature in the mist flow (2) is lower than that in the single-phase flow (1) due to the vaporization of droplets. The droplet temperature in the flow core is slightly lower than at the inlet due to droplet cooling.
4.2. Heat Transfer
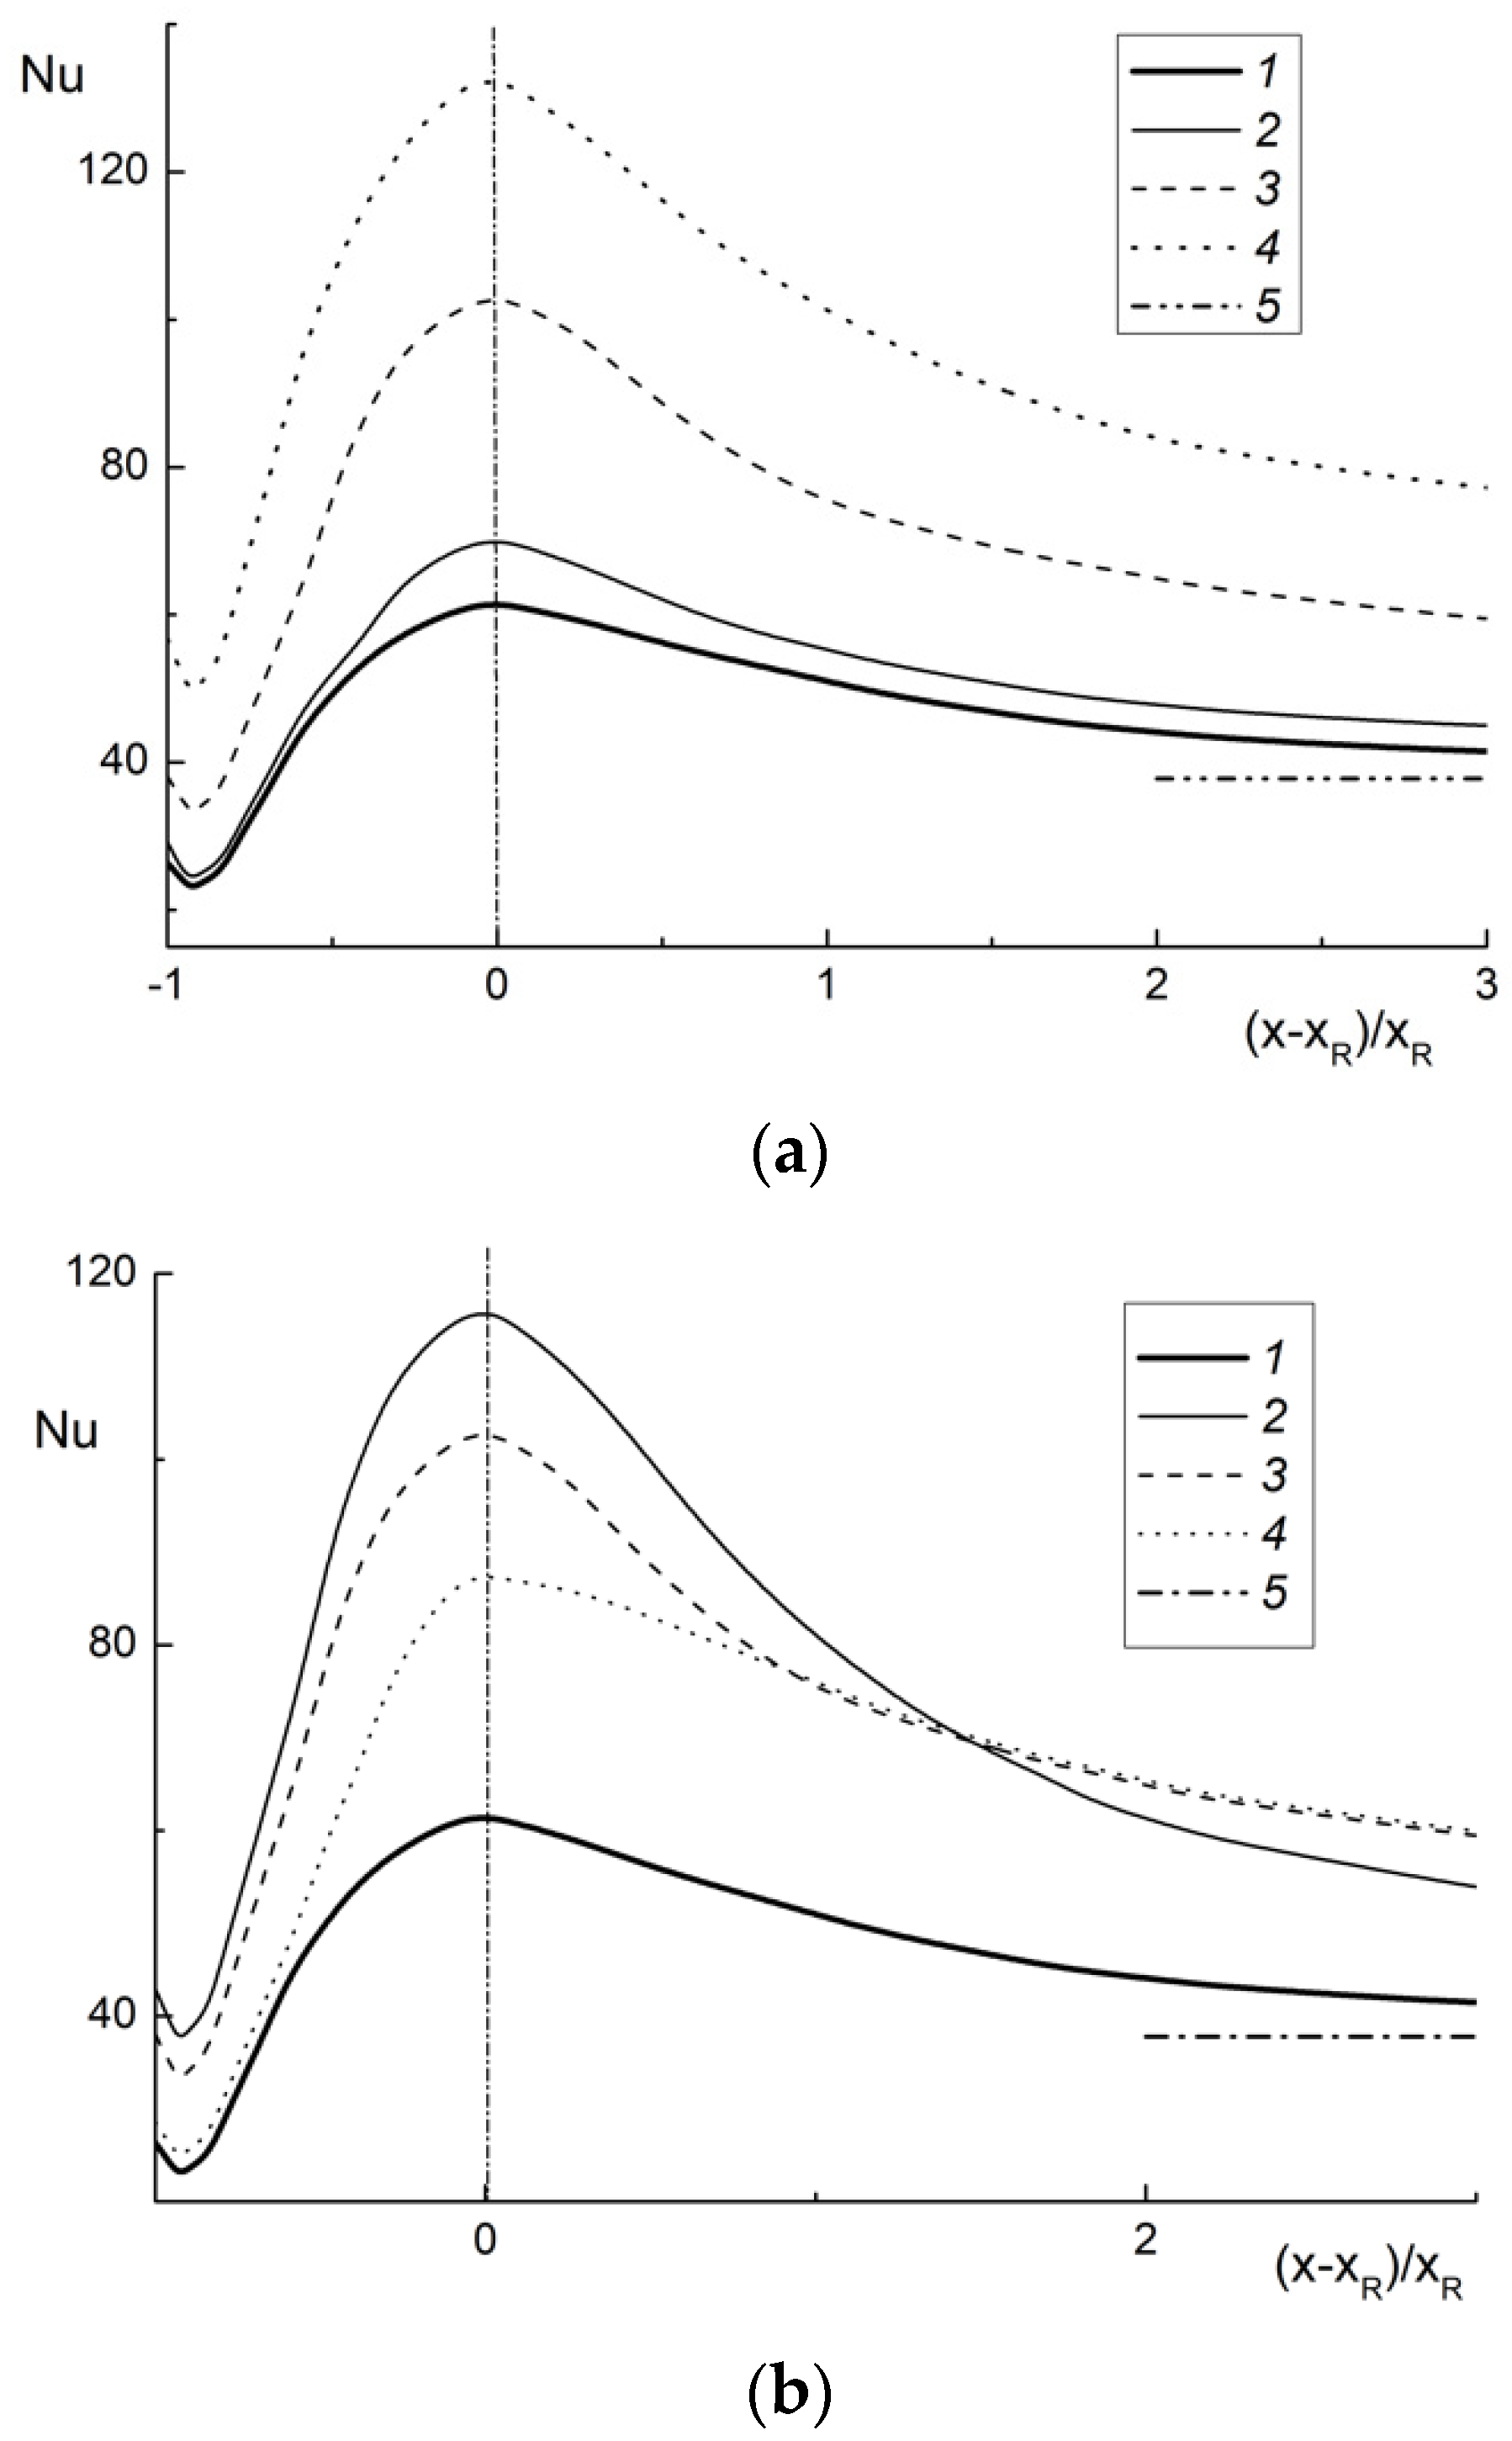
The distributions of local Nusselt numbers along the streamwise coordinate are shown in Figure 9. The Nusselt number at TW = const is obtained by the following formula:
where is the mean-mass gas temperature. The considerable heat transfer augmentation (more than twofold) in the two-phase mist flow as compared to the single-phase separated flow is obtained. Heat transfer augmentation is predicted in the flow recirculation and relaxation zones as well for Stk ≤ 1. The heat transfer coefficient is maximal in the flow reattachment zone. The coordinate of the maximal value of heat transfer in a gas-droplet flow corresponds approximately to the flow reattachment point. It should be noted that a similar conclusion is also typical of a single-phase flow [3,4]. The heat transfer reduction is similar to that occurring in a single-phase flow due to the growth in thickness of the dynamic and thermal boundary layers at > 1, where xR is the length of flow recirculation. The value Nufd = h2Um2/ν ≈ 38 (5) is the magnitude of the heat transfer in a fully developed single-phase air flow.
An increase in the inlet size of droplets has a complicated effect on the heat transfer. The finest droplets (d1 = 10 μm, Stk = 0.03, 2) evaporate faster and closer to the flow detachment section (see Figure 9b). The latter conclusion confirms the results in Figure 7 showing that droplets are entrained into the separated motion of the gas flow, and they scatter across the recirculating region. The largest droplets at d1 = 100 μm and Stk = 2.9 (4) are badly entrained into the mean motion of the gas phase. The heat transfer enhancement is revealed mainly after the reattachment point due to droplet evaporation. In the recirculation zone, the values of heat transfer are similar to those in the single-phase separated flow. It should be noted that the maximal value of the Nusselt number in the two-phase flow (d1 = 100 μm, Stk = 2.9) is smaller than that determined for finer drops (d1 = 30 μm, Stk = 0.28).
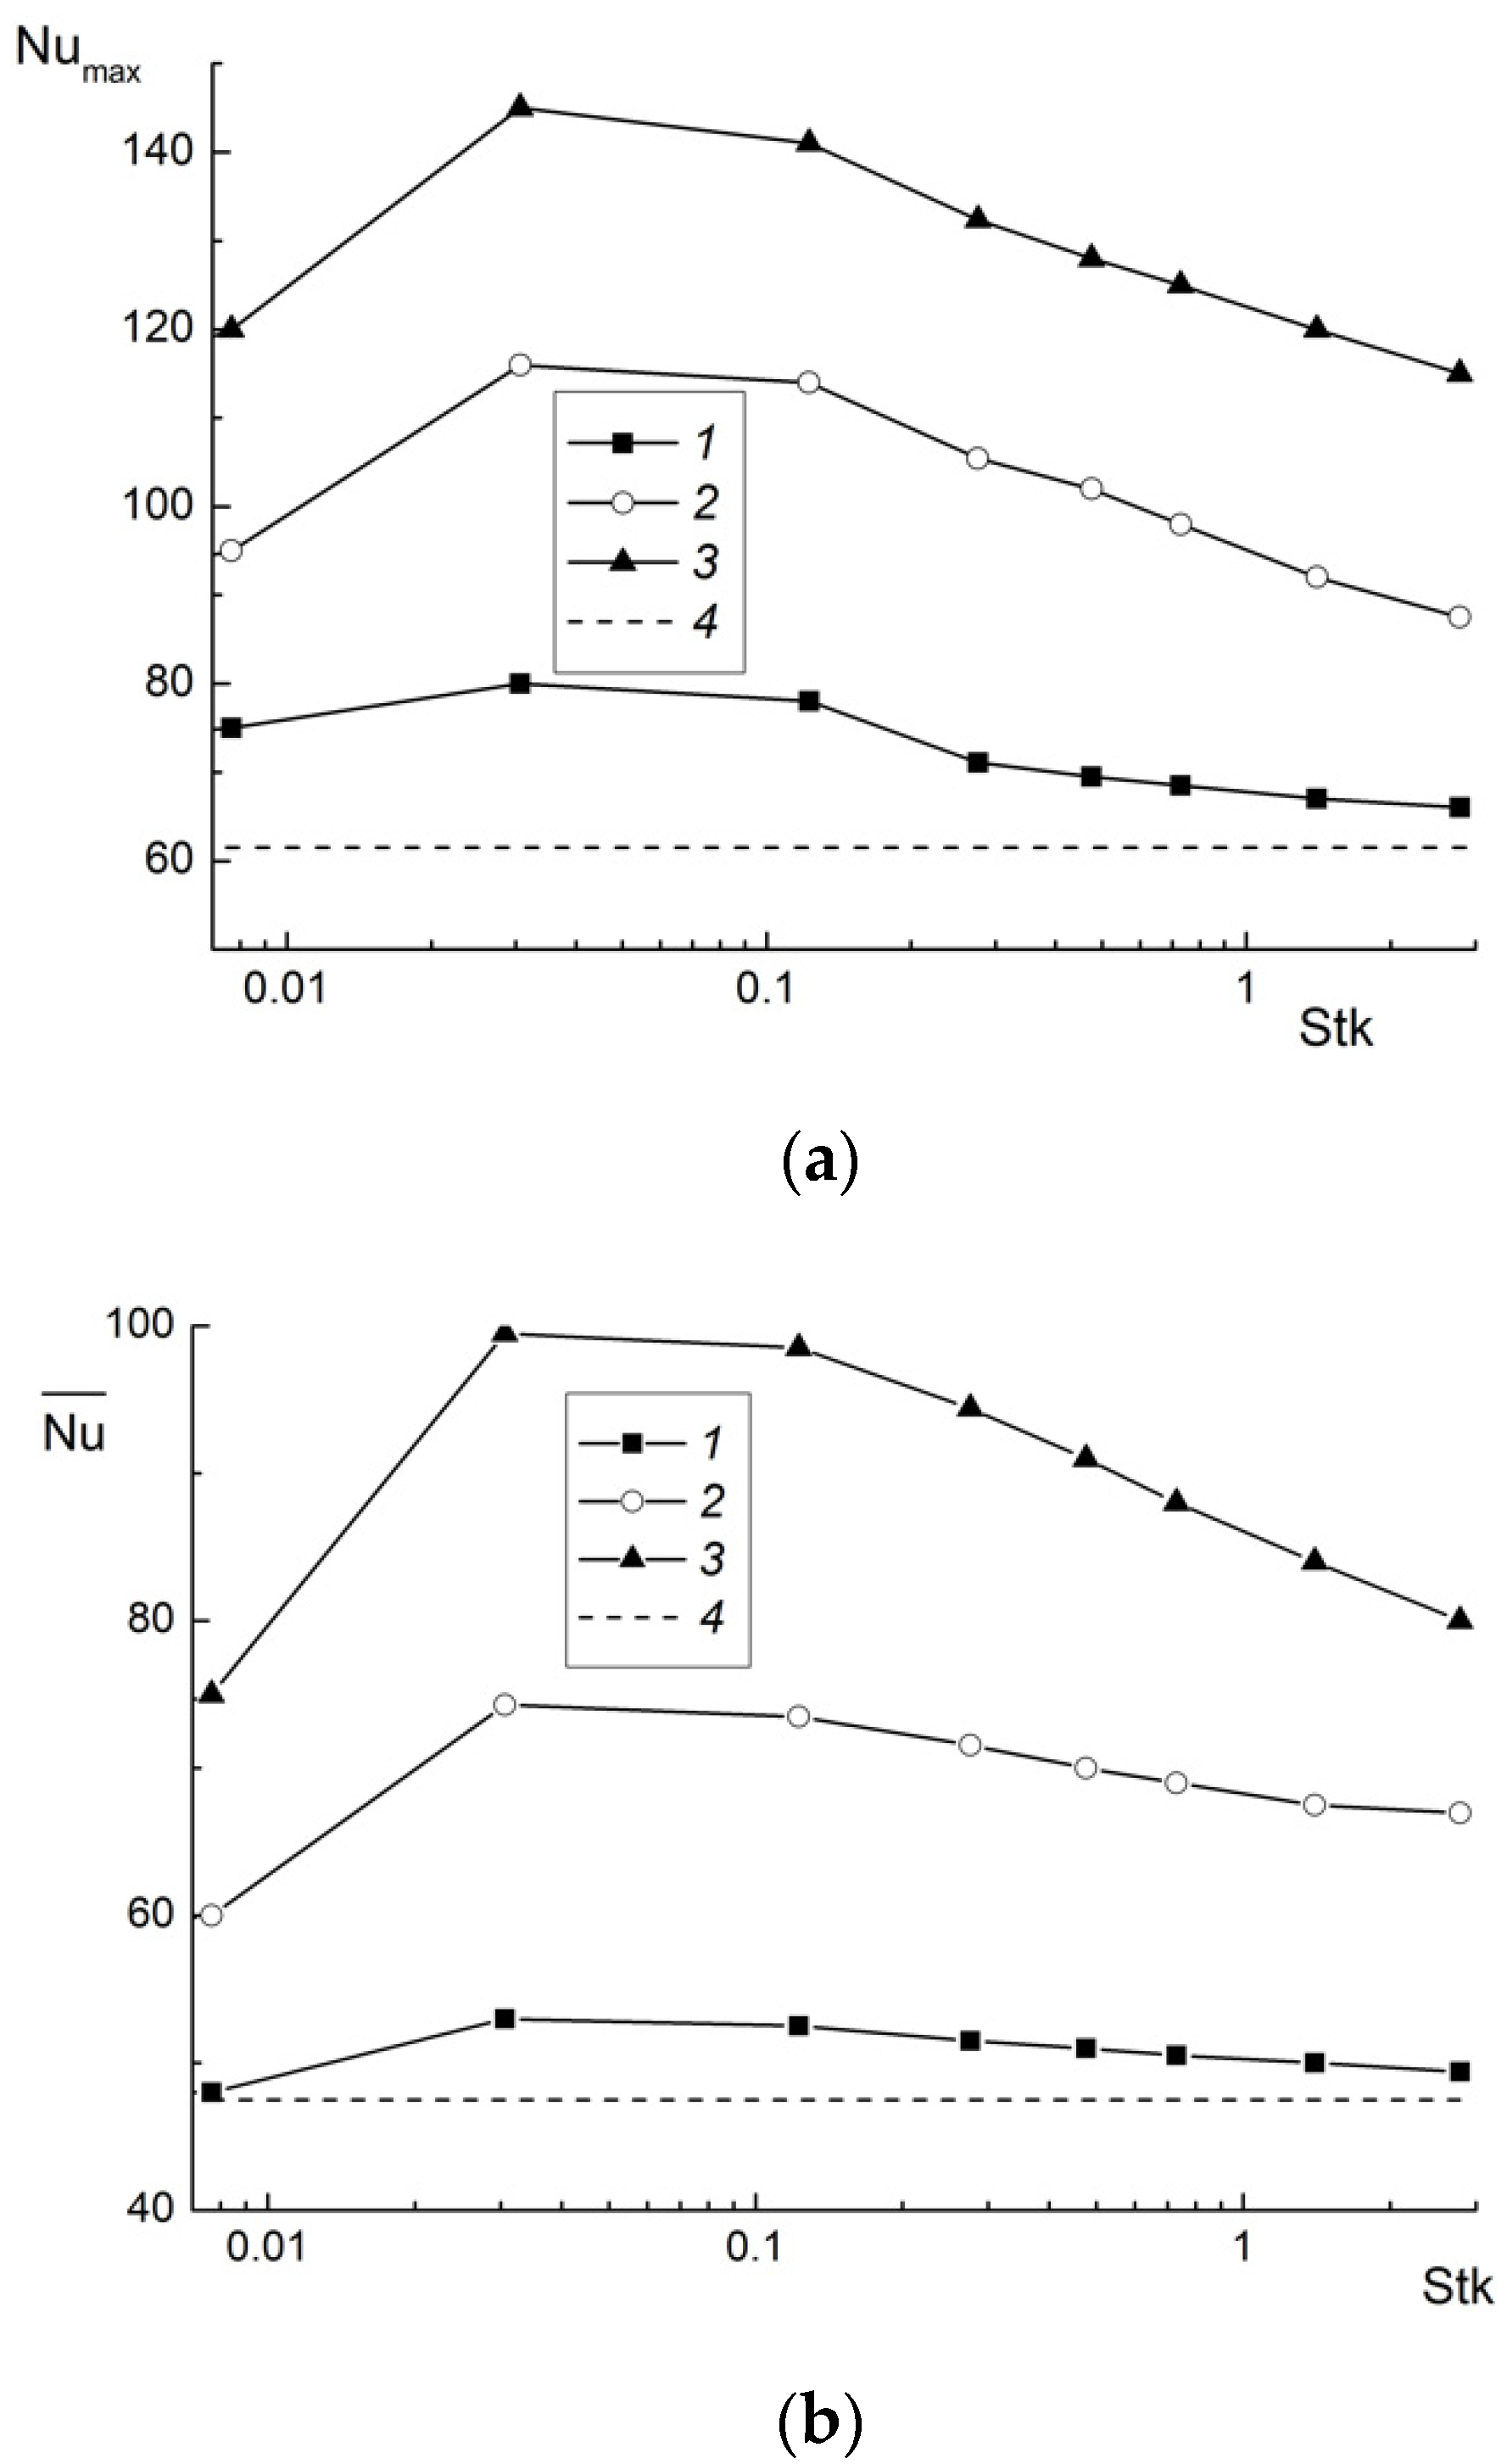
The influence of the average Stokes number on the maximum local value (Figure 10a) and average (Figure 10b) heat transfer is shown in Figure 10. There are two distinctive regions in the Numax distribution within the whole range of changes in the mass fraction of droplets studied in this work. In the region of small droplet diameters at the inlet (Stk ≈ 0.2, d1 ≈ 20 μm), a slight increase in heat transfer is observed, and for large droplets, a sharp reduction is observed. An intensive evaporation of small droplets leads to a decrease in the rate of their deposition. The large droplets almost are not present in the recirculation region. The increase in the droplet mass fraction at the inlet leads to a significant heat transfer enhancement in the two-phase mist flow as compared to a single-phase flow. The largest augmentation of heat transfer in the gas-droplet flow is observed for small droplets.
The influence of the inlet droplet diameter on the average Nusselt number is presented in Figure 10b. The average Nusselt number is calculated as , where X = 25H is the length of the averaging zone, and Nu is the local Nusselt number. The magnitude of the average heat transfer for the single-phase flow is ≈ 47. The increase in the droplet mass fraction causes the substantial augmentation of the average Nusselt number (it more than twofold for ML1 = 0.1 as compared to the single-phase air flow).
5. Comparison with the Results Obtained for Gas-Dispersed and Droplet-Laden Flows in a Backward-Facing Step
The solid particle-laden turbulent flow behind the backward-facing step was experimentally studied using the laser Doppler anemometer in [7]. The single-side backward-facing step height is H = 26.7 mm, and the duct height before sudden expansion is h1 = 40 mm. The expansion ratio is ER = 1.67. The Reynolds number based on the maximal centerline velocity U1 is ReH = HU1/ν = 1.84 × 10⁴. The flow is the single-side backward-facing step oriented vertically downward. The transverse profiles of the gas-phase mean streamwise velocities in particle-laden and single-phase air flows in a few stations were presented in [22], and they are not shown here. Symbols are the experimental results of [7] for glass particles; lines represent simulations of the authors.
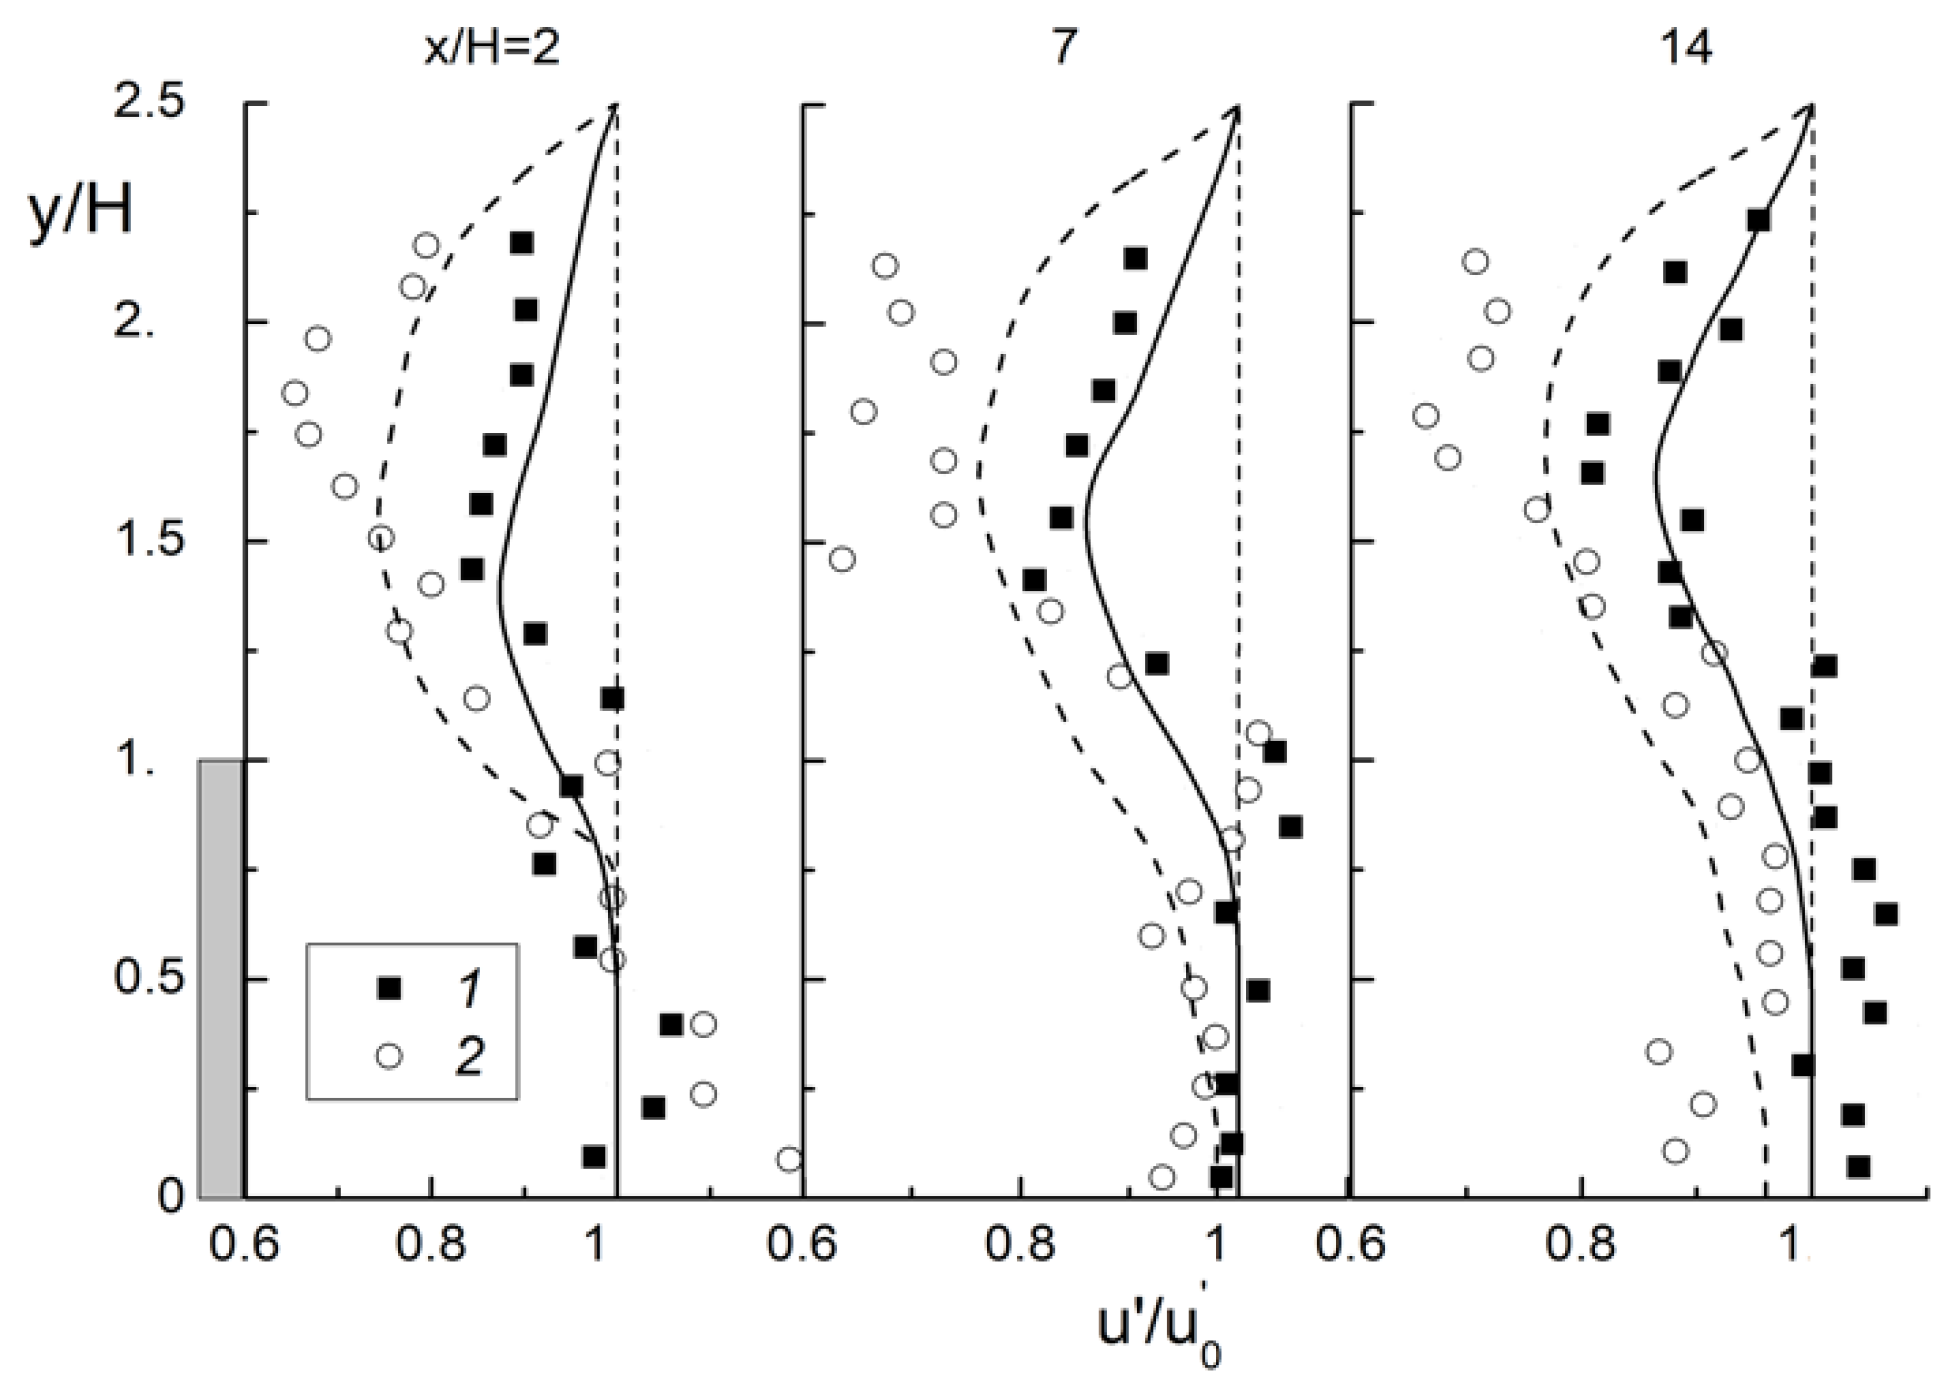
Transverse distributions of the ratio of the two-phase to the single-phase longitudinal pulsation velocities of the single-phase air flow are shown in Figure 11 at three cross-sections (x/H = 2, 7 and 14). The predicted suppression of the gas-phase turbulence is noticeable (up to 20% at the coordinate y/H > 0.5 for all stations). The gas-phase turbulence modification ratio in the recirculation zone (x/H = 2), in the zone around the reattachment point (x/H = 7) and in the flow relaxation region (x/H = 14) is unchanged for y/H < 1. This can be explained by the fact that the mean Stokes number is considerably larger than unity (Stk = 7.3). The magnitude of the particles’ mass fraction increases towards the wall due to the effect of turbulent transport (the so-called turbophoresis force) [26,27,32]. The involvement of solid particles in the fluctuation motion and attenuation level of the gas-phase TKE near the duct wall are much smaller as compared to the duct core region.
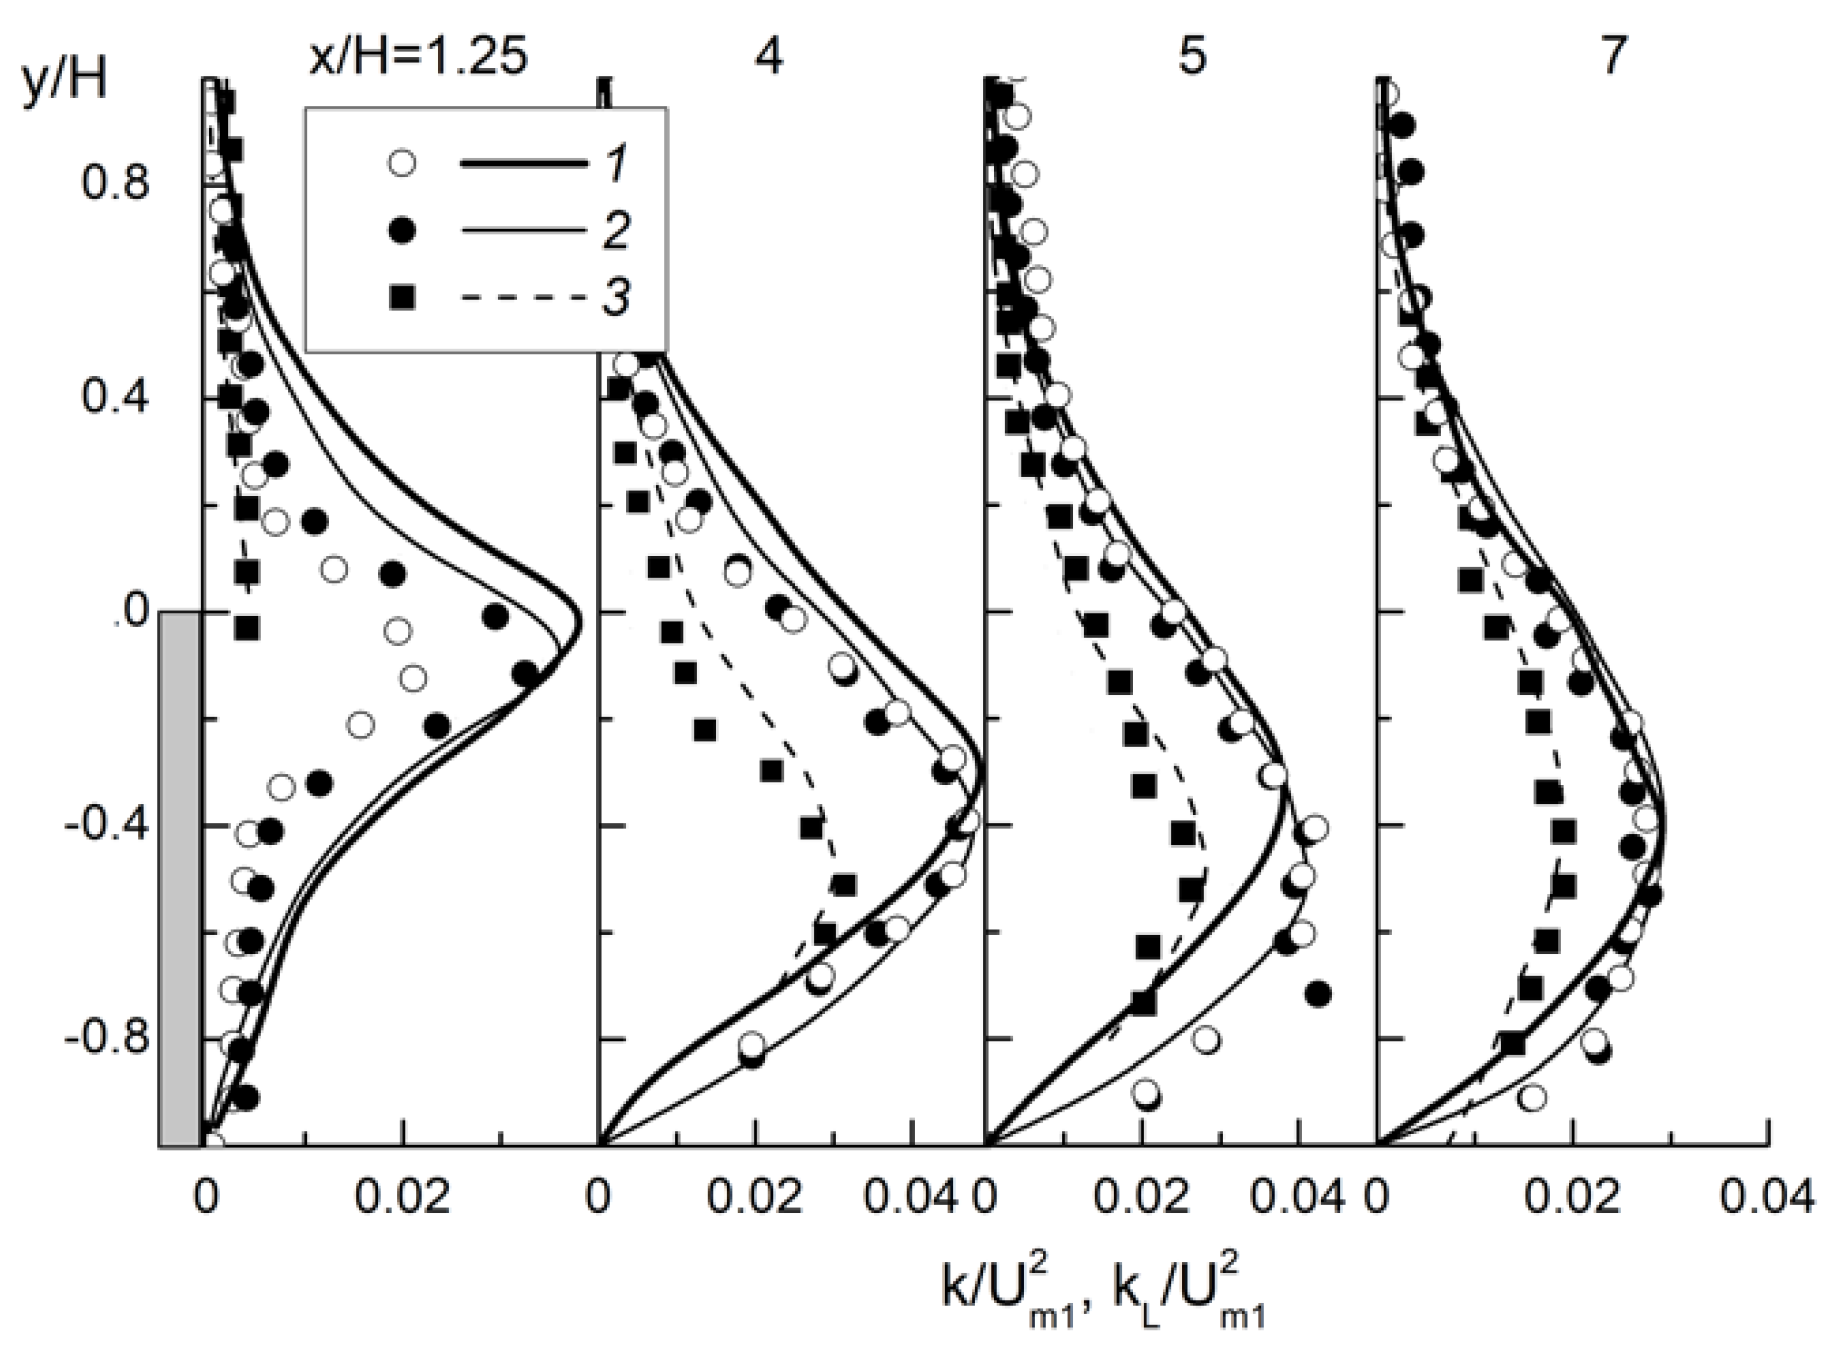
The transverse distributions of the turbulent kinetic energy of the carrier gas and dispersed phases, measured in [16], and the author simulations in several cross-sections behind the BFS are presented in Figure 12. Solid and open symbols are the experimental results of [16]; lines represent author simulations. The turbulent kinetic energy for the gas (air) k and dispersed (water droplets) kL phases is calculated according to the following approach [16]: and . The distributions of turbulence energy for a single-phase flow (1) and the gas (2) and dispersed (3) phases are qualitatively similar. The level of turbulence in a single-phase flow is close to the TKE level in the gas phase of a two-phase gas-dispersed flow. The turbulent energy of droplets is less than the corresponding value for gas (1 and 2). There is a maximum in the turbulence level of the gas and dispersed phases, and it is located in the shear layer. This is characteristic of both the experiments of [16] and our numerical results. The largest values of the turbulent kinetic energy for both phases are observed at the distance x/H = 4–5. In the region of the reattachment point (xR/H ≈ 6.2), the value of the gas turbulence decreases significantly. The results predicted by the authors and experiments of [16] are in quantitative agreement, and the largest difference is up to 15%.
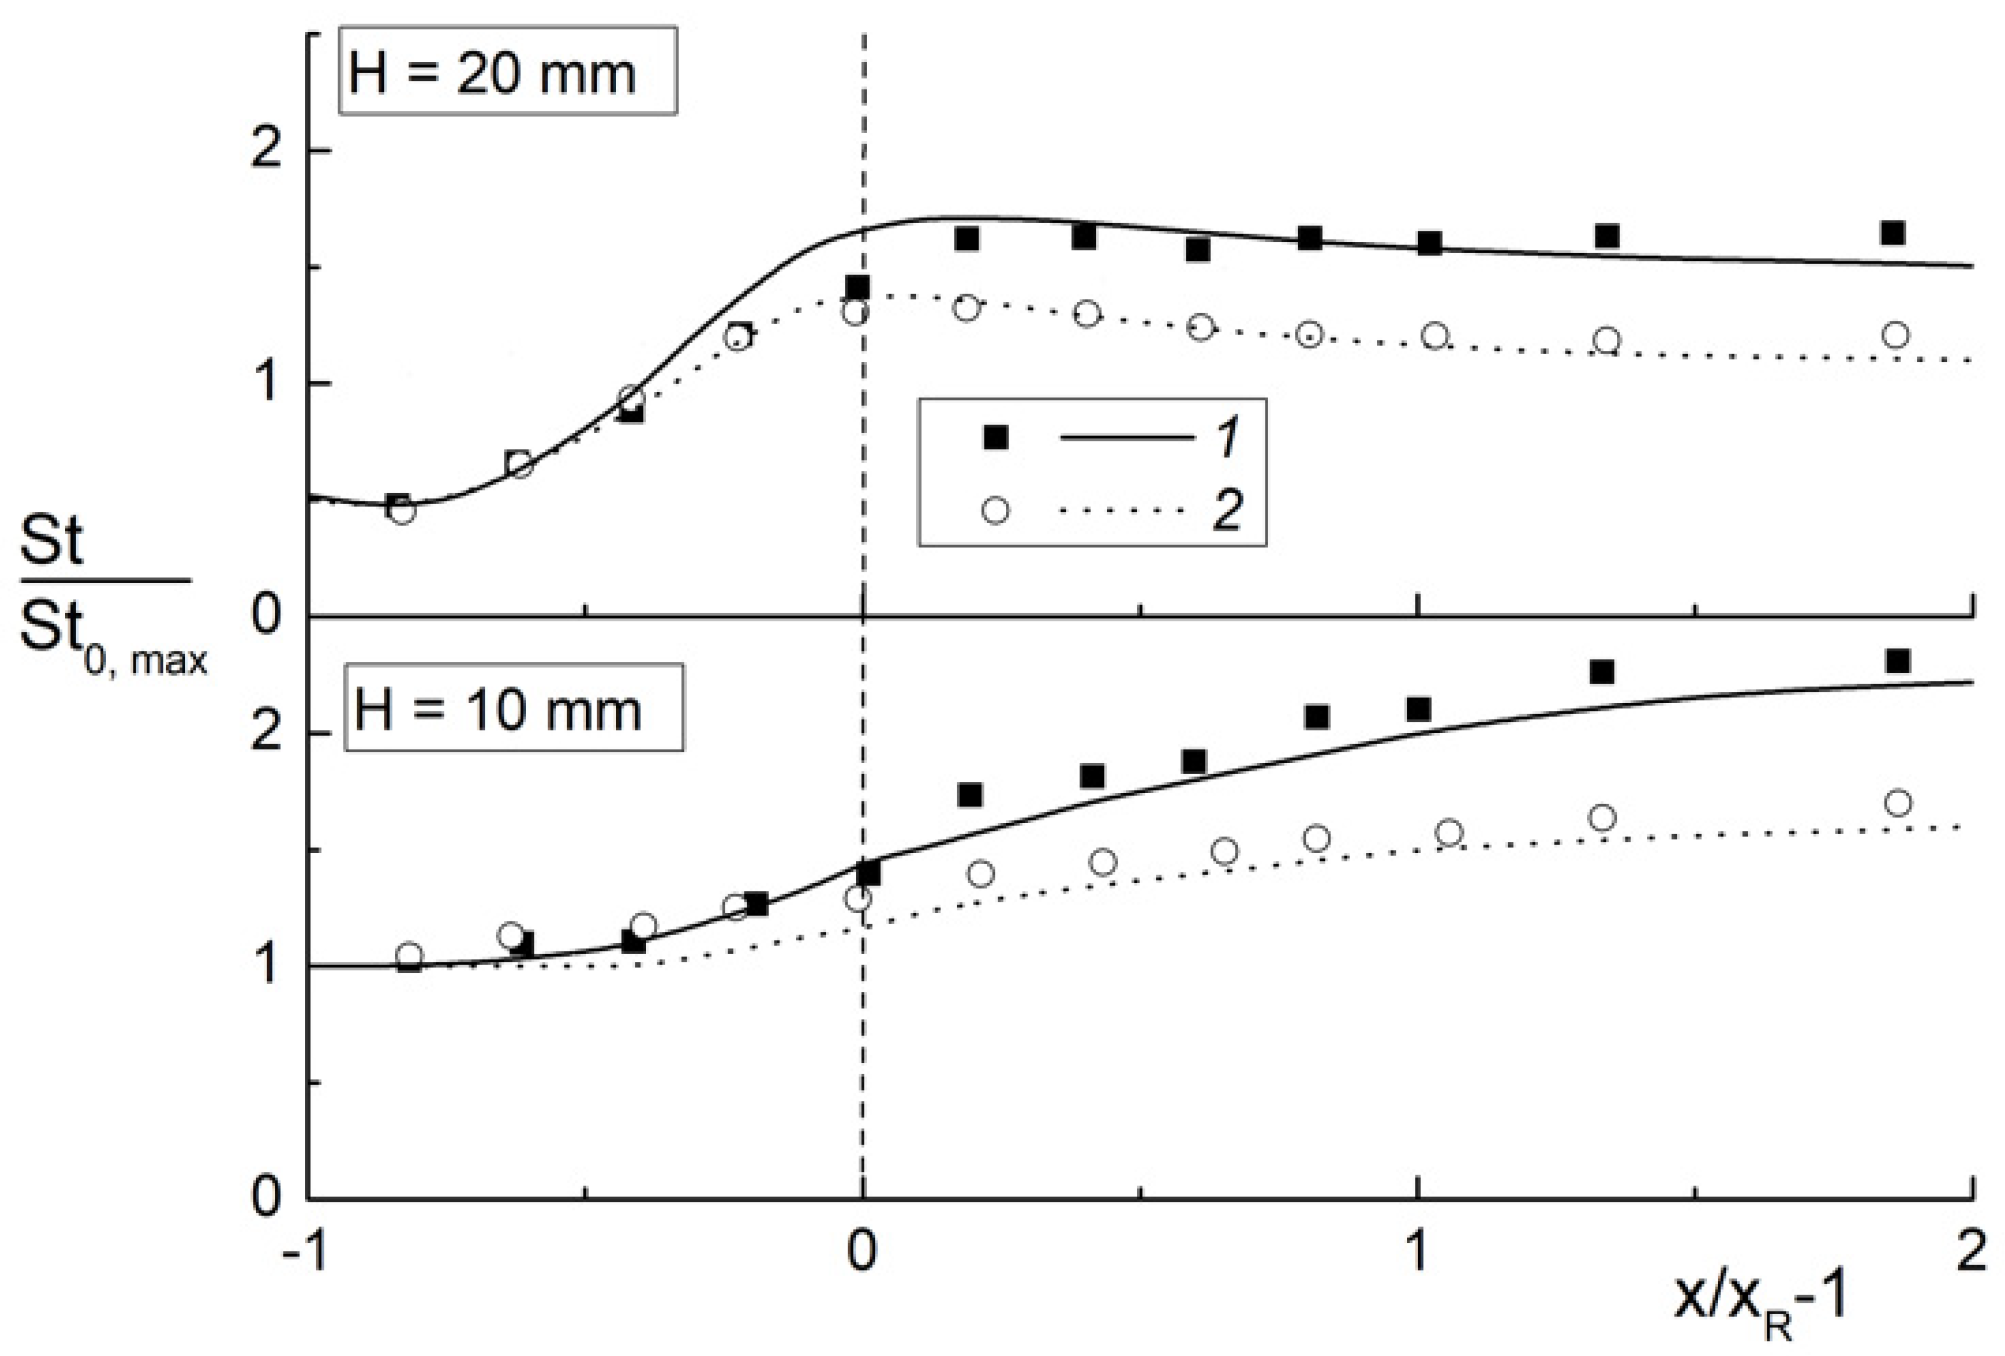
The results of authors’ predictions and experiments of [16] concerning distribution of the heat transfer enhancement ratio (HTER) St/St0,max ratios in the mist flow behind a backward-facing step are shown in Figure 13. Here, St = α/(ρCPU1) is the heat transfer rate in a two-phase flow, and St0,max = α0,max/(ρ0CP0U1) is the maximum Stanton number for a single-phase flow behind the BFS, all other parameters being equal. The heat transfer increases by more than 1.5 times in the gas-droplet flow as compared to a single-phase flow, both at the reattachment point and in the flow relaxation zones. Heat transfer enhancement is obtained after the reattachment point at mean Stokes number Stk = 2.2. The value of HTER at Stk = 2.2 (H = 10 mm) in the region of flow relaxation is greater than in the case of a step with Stk = 1.1 (H = 20 mm). The heat transfer enhancement in the recirculation region at Stk = 1.1 is much higher than that at Stk = 2.2. The droplets are well entrained into the recirculation region at a low Stokes number [16]. The local maximum of heat transfer at Stk = 2.2 is significantly below the reattachment point > 2, while at Stk = 1.1, the position of the heat transfer maximum almost coincides with the position of the reattachment point of flow.
6. Conclusions
The effect of water droplet vaporization on turbulence, flow and heat transfer in the region of the backward-facing step is numerically investigated. The Eulerian two-fluid model is used to simulate the turbulent droplet-laden mist flow. The second-moment closure is modified to take into account the presence of droplets and is predicted to model the turbulent kinetic energy of the carrier gas phase.
The profiles of the longitudinal mean velocities of phases correspond to those for the single-phase flow. The small addition of dispersed phase has almost no effect on the mean flow velocity of the carrier gas flow and the value of the wall friction coefficient. The fine droplets (Stk < 1) are observed in the whole duct cross-section (flow core, shear layer and recirculation region). There are no large droplets with Stk > 1 in the recirculation zone; they are observed in the shear and flow core areas. The suppression of the carrier-phase turbulence (up to 15%) by the addition of fine dispersed droplets is predicted.
Heat transfer in the mist separated flow is significantly increased. The largest increase in heat transfer is predicted for the small droplets. In this case, the heat transfer enhancement is obtained in both the recirculation region and flow relaxation region for the case of fine dispersed particles (Stk < 1). For the large droplets (Stk > 1), heat transfer remains roughly unchanged in the recirculating zone. Heat transfer enhancement is observed only in the reattachment zone.
Author Contributions
Conceptualization, M.A.P. and V.I.T.; methodology, M.A.P. and V.I.T.; Investigation, M.A.P.; data curation, M.A.P. and V.I.T.; formal analysis, M.A.P. and V.I.T.; writing—original draft preparation, M.A.P. and V.I.T.; writing—review and editing, M.A.P. and V.I.T.; resources, M.A.P. and V.I.T.; project administration, V.I.T.; All authors have read and agreed to the published version of the manuscript.
Funding
This work was partially supported by the Ministry of Science and Higher Education of the Russian Federation (mega-grant 075-15-2021-575). The RANS and turbulence model for the single-phase turbulent flow were developed under the state contract with IT SB RAS (121031800217-8).
Institutional Review Board Statement
Not applicable.
Informed Consent Statement
Not applicable.
Conflicts of Interest
The authors declare no conflict of interest.
Nomenclature
| wall friction coefficient | |
| CP | heat capacity |
| d | droplet diameter |
| ER = (H + h1)/h1 | expansion ratio |
| h1 | height of the duct before the sudden expansion |
| h2 | height of the duct after the sudden expansion |
| H | step height |
| turbulent kinetic energy | |
| L | duct length |
| ML | mass fraction |
| Nusslet number | |
| ReH = Um1H/ν | the Reynolds number, based on the step height |
| Stk = τ/τf | the mean Stokes number |
| T | temperature |
| UL | the mean droplet velocity |
| Um1 | mean-mass flow velocity |
| US | the fluid (gas) velocity seen by the droplet |
| U* | friction velocity |
| the Weber number | |
| x | streamwise coordinate |
| xR | position of the flow reattachment point |
| xNu_max | position of the peak of heat transfer rate |
| y | distance normal from the wall |
| Subscripts | |
| 0 | single-phase fluid (air) flow |
| 1 | initial condition |
| W | wall |
| L | liquid |
| m | mean-mass |
| Greek | |
| Φ | volume fraction |
| ε | dissipation of the turbulent kinetic energy |
| λ | thermal conductivity |
| ρ | density |
| μ | the dynamic viscosity |
| ν | kinematic viscosity |
| τ | the particle relaxation time |
| τW | wall shear stress |
| Acronym | |
| BFS | backward-facing step |
| CV | control volume |
| RANS | Reynolds-averaged Navier-Stokes |
| SMC | second moment closure |
| TKE | turbulent kinetic energy |
References
- Eaton, J.K.; Johnston, J.P. A review of research on subsonic turbulent flow reattachment. AIAA J. 1981, 19, 1093–1100. [Google Scholar] [CrossRef]
- Simpson, R.L. Aspects of turbulent boundary-layer separation. Prog. Aerosp. Sci. 1996, 32, 457–521. [Google Scholar] [CrossRef]
- Ota, T. A survey of heat transfer in separated and reattached flows. Appl. Mech. Rev. 2000, 53, 219–235. [Google Scholar] [CrossRef]
- Terekhov, V.I.; Bogatko, T.V.; Dyachenko, A.Y.; Smulsky, Y.I.; Yarygina, N.I. Heat Transfer in Subsonic Separated Flows; Novosibirsk State Technical University Publishing House: Novosibirsk, Russia, 2016. (In Russian) [Google Scholar]
- Chen, L.; Asai, K.; Nonomura, T.; Xi, G.N.; Liu, T.S. A review of backward-facing step (BFS) flow mechanisms, heat transfer and control. Therm. Sci. Eng. Prog. 2018, 6, 194–216. [Google Scholar] [CrossRef]
- Ruck, B.; Makiola, B. Particle dispersion in a single-sided backward-facing step flow. Int. J. Multiph. Flow 1988, 14, 787–800. [Google Scholar] [CrossRef]
- Fessler, J.R.; Eaton, J.K. Turbulence modification by particles in a backward-facing step flow. J. Fluid Mech. 1999, 314, 97–117. [Google Scholar] [CrossRef]
- Chan, C.K.; Zhang, H.Q.; Lau, K.S. Numerical simulation of gas-particle flows behind a backward-facing step using an improved stochastic separated flow model. J. Comp. Mech. 2001, 27, 412–417. [Google Scholar] [CrossRef]
- Zaichik, L.I.; Kozelev, M.V.; Pershukov, V.A. Prediction of turbulent gas-dispersed channel flow with recirculation zones. Fluid Dyn. 1994, 29, 65–75. [Google Scholar] [CrossRef]
- Mohanarangam, K.; Tu, J.Y. Two-fluid model for particle-turbulence interaction in a backward-facing step. AIChE J. 2007, 53, 2254–2264. [Google Scholar] [CrossRef]
- Benavides, A.; Van Vachem, B. Eulerian–Eulerian prediction of dilute turbulent gas-particle flow in a backward-facing step. Int. J. Heat Fluid Flow 2009, 30, 452–461. [Google Scholar] [CrossRef]
- Mukin, R.V.; Zaichik, L.I. Nonlinear algebraic Reynolds stress model for two-phase turbulent flows laden with small heavy particles. Int. J. Heat Fluid Flow 2012, 33, 81–91. [Google Scholar] [CrossRef]
- Riella, M.; Kahraman, R.; Tabor, G.R. Reynolds-averaged two-fluid model prediction of moderately dilute fluid-particle flow over a backward-facing step. Int. J. Multiph. Flow 2018, 106, 95–108. [Google Scholar] [CrossRef] [Green Version]
- Sazhin, S.S. Modelling of fuel droplet heating and evaporation: Recent results and unsolved problems. Fuel 2017, 196, 69–101. [Google Scholar] [CrossRef]
- Abu Talib, A.R.; Hilo, A.K. Fluid flow and heat transfer over corrugated backward facing step channel. Case Stud. Therm. Eng. 2021, 24, 100862. [Google Scholar] [CrossRef]
- Hishida, K.; Nagayasu, T.; Maeda, M. Augmentation of convective heat transfer by an effective utilization of droplet inertia. Int. J. Heat Mass Transfer 1995, 38, 1773–1785. [Google Scholar] [CrossRef]
- Elgobashi, S. On predicting particle-laden turbulent flows. Appl. Scient. Res. 1994, 52, 309–329. [Google Scholar] [CrossRef]
- Zaichik, L.I.; Alipchenkov, V.M. A statistical model for predicting the fluid displaced/added mass and displaced heat capacity effects on transport and heat transfer of arbitrary density particles in turbulent flows. Int. J. Heat Mass Transf. 2011, 54, 4247–4265. [Google Scholar] [CrossRef]
- Miyafuji, Y.; Senaha, I.; Oyakawa, K.; Hiwada, M. Enhancement of Heat Transfer at Downstream of a Backward-Facing Step by Mist Flow. In Proceedings of the 2nd International Conference on Jets, Wakes and Separated Flows ICJWSF-2008, Berlin, Germany, 16–18 September 2008. [Google Scholar]
- Wang, B.; Zhang, H.Q.; Wang, X.L. Large eddy simulation of particle response to turbulence along its trajectory in a backward-facing step turbulent flow. Int. J. Heat Mass Transf. 2006, 49, 415–420. [Google Scholar] [CrossRef]
- Fadai-Ghotbi, A.; Manceau, R.; Boree, J. Revisiting URANS computations of the backward-facing step flow using second moment closures. Influence of the numerics. Flow Turbul. Combust. 2008, 81, 395–410. [Google Scholar] [CrossRef]
- Pakhomov, M.A.; Terekhov, V.I. Second moment closure modelling of flow, turbulence and heat transfer in droplet-laden mist flow in a vertical pipe with sudden expansion. Int. J. Heat Mass Transf. 2013, 66, 210–222. [Google Scholar] [CrossRef]
- Pakhomov, M.A.; Terekhov, V.I. The effect of droplets evaporation on turbulence modification and heat transfer enhancement in a two-phase mist flow downstream of a pipe sudden expansion. Flow Turbul. Combust. 2017, 98, 341–354. [Google Scholar] [CrossRef]
- Drew, D.A. Mathematical modeling of two-phase flow. Ann. Rev. Fluid Mech. 1983, 15, 261–291. [Google Scholar] [CrossRef]
- Reeks, M.W. On a kinetic equation for the transport of particles in turbulent flows. Phys. Fluids A 1991, 3, 446–456. [Google Scholar] [CrossRef]
- Derevich, I.V.; Zaichik, L.I. Particle deposition from a turbulent flow. Fluid Dyn. 1988, 23, 722–729. [Google Scholar] [CrossRef]
- Zaichik, L.I. A statistical model of particle transport and heat transfer in turbulent shear flows. Phys. Fluids 1999, 11, 1521–1534. [Google Scholar] [CrossRef]
- Elgobashi, S. An Updated Classification Map of Particle-Laden Turbulent Flows. In Proceedings of the IUTAM Symposium on Computational Approaches to Multiphase Flow, Fluid Mechanics and Its Applications, Argonne National Laboratory, Lemont, IL, USA, 4–7 October 2004; Volume 81, pp. 3–10. [Google Scholar]
- Gore, R.A.; Crowe, C.T. The effect of particle size on modulating turbulent intensity. Int. J. Multiph. Flow 1989, 15, 279–285. [Google Scholar] [CrossRef]
- Lin, S.P.; Reitz, R.D. Drop and spray formation from a liquid jet. Ann. Rev. Fluid Mech. 1998, 30, 85–105. [Google Scholar] [CrossRef]
- Snegirev, A.Y. Transient temperature gradient in a single-component vaporizing droplet. Int. J. Heat Mass Transf. 2013, 65, 80–94. [Google Scholar] [CrossRef]
- Derevich, I.V. Statistical modelling of mass transfer in turbulent two-phase dispersed flows. 1. Model development. Int. J. Heat Mass Transf. 2000, 43, 3709–3723. [Google Scholar] [CrossRef]
- Wang, H.G.; Zhang, C.G.; Xiong, H.B. Growth and collapse dynamics of a vapor bubble near or at a wall. Water 2021, 13, 12. [Google Scholar] [CrossRef]
- Hanjalic, K.; Jakirlic, S. Contribution towards the second-moment closure modelling of separating turbulent flows. Comput. Fluids 1998, 27, 137–156. [Google Scholar] [CrossRef]
- Kasagi, N.; Matsunaga, A. Three-dimensional particle-tracking velocimetry measurement of turbulence statistics and energy budget in a backward-facing step flow. Int. J. Heat Fluid Flow 1995, 16, 477–485. [Google Scholar] [CrossRef]
- Vogel, J.C.; Eaton, J.K. Combined heat transfer and fluid dynamics measurements downstream of a backward facing step. ASME J. Heat Transf. 1985, 107, 922–929. [Google Scholar] [CrossRef]
- Tihon, J.; Legrand, J.; Legentilhomme, P. Near-wall investigation of backward-facing step flows. Exp. Fluids 2001, 31, 484–493. [Google Scholar] [CrossRef]
Figure 1.
The scheme of the droplet-laden flow in the backward-facing step.

Figure 2.
The transverse profiles of (a) the mean streamwise phase velocities and distributions of wall friction coefficient along the longitudinal coordinate. d1 = 30 μm. (a): 1 and 2 are single-phase (ML1 = 0) and gas-droplet (ML1 = 0.05) flows, respectively; 3 is droplets. (b): 1: ML1 = 0 (single-phase flow); 2: 0.02; 3: 0.05; 4: 0.1.


Figure 3.
The value of the wall friction coefficient in the recirculation region as a function of the Reynolds number. 1: semi-empirical correlation of for the single-phase flow [37]; 2: ML1 = 0 (single-phase flow); 3: 0.05.
Figure 3.
The value of the wall friction coefficient in the recirculation region as a function of the Reynolds number. 1: semi-empirical correlation of for the single-phase flow [37]; 2: ML1 = 0 (single-phase flow); 3: 0.05.

Figure 4.
The transverse dictributions of (a) droplets and (b) steam mass fractions in the droplet-laden separated flow. x/H = 2, ML1 = 0.05. 1: d1 = 10 μm, Stk = 0.03; 2: 30, 0.28; 3: 100, 2.9.
Figure 4.
The transverse dictributions of (a) droplets and (b) steam mass fractions in the droplet-laden separated flow. x/H = 2, ML1 = 0.05. 1: d1 = 10 μm, Stk = 0.03; 2: 30, 0.28; 3: 100, 2.9.

Figure 5.
The transverse profiles of normalized droplets diameter in the mist backward-facing step flow. x/H = 2, ML1 = 0.05. Legends to the figure are the same as in Figure 4.
Figure 5.
The transverse profiles of normalized droplets diameter in the mist backward-facing step flow. x/H = 2, ML1 = 0.05. Legends to the figure are the same as in Figure 4.

Figure 6.
The effect of Stokes numbers on the maximal turbulence kinetic energy modification ratio of the gas-droplet kmax to the single-phase k0,max phases. x/H = 2, d1 = 0–100 μm. 1: ML1 = 0; 2: 0.05; 3: 0.1.
Figure 6.
The effect of Stokes numbers on the maximal turbulence kinetic energy modification ratio of the gas-droplet kmax to the single-phase k0,max phases. x/H = 2, d1 = 0–100 μm. 1: ML1 = 0; 2: 0.05; 3: 0.1.

Figure 7.
The TKE modification ratio vs. Stokes numbers at a few stations from the wall surface. x/H = 2, ML1 = 0.05. 1: y/H = 0.1; 2: 0.5; 3: 1.
Figure 7.
The TKE modification ratio vs. Stokes numbers at a few stations from the wall surface. x/H = 2, ML1 = 0.05. 1: y/H = 0.1; 2: 0.5; 3: 1.

Figure 8.
The transverse profiles of gas and droplet ΘL temperatures in the droplet-laden mist flow in a backward-facing step. d1 = 30 mm, Stk = 0.28, x/H = 2. 1: single-phase flow (ML1 = 0); 2: gas phase (ML1 = 0.05): 3: water droplets.
Figure 8.
The transverse profiles of gas and droplet ΘL temperatures in the droplet-laden mist flow in a backward-facing step. d1 = 30 mm, Stk = 0.28, x/H = 2. 1: single-phase flow (ML1 = 0); 2: gas phase (ML1 = 0.05): 3: water droplets.

Figure 9.
The longitudinal distributions of local Nisselt number for various droplets’ inlet mass fraction (a) and their diameter. (a): d1 = 30 μm, Stk = 0.28. 1: ML1 = 0 (single-phase flow); 2: 0.02; 3: 0.05; 4: 0.1; 5: the correlation for a fully developed single-phase flow; (b): ML1 = 0.05. 1: d1 = 0 (single-phase flow); 2: d1 = 10 µm, Stk = 0.03; 3: 30, 0.28; 4: 100, 2.89; 5: the correlation for a fully developed single-phase flow.

Figure 10.
The effect of mean Stokes numbers (inlet droplets diameter) on (a) the maximal value of heat transfer and (b) averaged heat transfer. 1: ML1 = 0.02; 2: 0.05; 3: 0.1; 4: single-phase flow.
Figure 10.
The effect of mean Stokes numbers (inlet droplets diameter) on (a) the maximal value of heat transfer and (b) averaged heat transfer. 1: ML1 = 0.02; 2: 0.05; 3: 0.1; 4: single-phase flow.

Figure 11.
Turbulence modification ratio of the two-phase solid particle-laden flow to the single-phase flow longitudinal fluctuating gas-phase velocities. Symbols are the results of experiments of [7] for glass particles, lines are the author’s simulations. dP = 150 μm, ER = 1.67. 1: MP = 0.2; 2: 0.4.

Figure 12.
The profiles of turbulent kinetic energies of gas and dispersed phases. Symbols are the results of experiments of [16], lines are the author’s simulations. ER = 1.3. 1: single-phase air flow ; 2: gas phase of droplet-laden mist flow ; 3: dispersed phase . d1 = 60 μm, ML1 = 0.04, H = 20 mm.

Figure 13.
Heat transfer enhancement ratio St/St0,max in the gas-droplets flow behind the backward-facing step for H = 10 and 20 mm. Symbols are the results of experiments of [16], lines are the author’s simulations. Um1 = 10 m/s, ReH = Um1H/ν = (0.53 and 1.10) × 104, d1 = 60 μm, ML1 = 0.04. 1: TW = 308 K; 2: 338 K.

Publisher’s Note: MDPI stays neutral with regard to jurisdictional claims in published maps and institutional affiliations. |
© 2021 by the authors. Licensee MDPI, Basel, Switzerland. This article is an open access article distributed under the terms and conditions of the Creative Commons Attribution (CC BY) license (https://creativecommons.org/licenses/by/4.0/).
Share and Cite
MDPI and ACS Style
Pakhomov, M.A.; Terekhov, V.I. Droplet Evaporation in a Gas-Droplet Mist Dilute Turbulent Flow behind a Backward-Facing Step. Water 2021, 13, 2333. https://doi.org/10.3390/w13172333
AMA Style
Pakhomov MA, Terekhov VI. Droplet Evaporation in a Gas-Droplet Mist Dilute Turbulent Flow behind a Backward-Facing Step. Water. 2021; 13(17):2333. https://doi.org/10.3390/w13172333
Chicago/Turabian StylePakhomov, Maksim A., and Viktor I. Terekhov. 2021. "Droplet Evaporation in a Gas-Droplet Mist Dilute Turbulent Flow behind a Backward-Facing Step" Water 13, no. 17: 2333. https://doi.org/10.3390/w13172333
Note that from the first issue of 2016, this journal uses article numbers instead of page numbers. See further details here.