The Effect of Soil Conservation Measures on Runoff, Soil Erosion, TN, and TP Losses Based on Experimental Runoff Plots in Northern China

1
Key Laboratory of Water Cycle and Related Land Surface Processes, Institute of Geographic Sciences and Natural Resources Research, Chinese Academy of Sciences, Beijing 100101, China
2
College of Resources and Environment, University of Chinese Academy of Sciences, Beijing 100049, China
Water 2021, 13(17), 2334; https://doi.org/10.3390/w13172334
Submission received: 24 June 2021
/
Revised: 20 August 2021
/
Accepted: 24 August 2021
/
Published: 26 August 2021
(This article belongs to the Section Water Erosion and Sediment Transport)
Abstract
:Total nitrogen (TN) and total phosphorous (TP) are the main pollutants affecting the water quality of the Miyun Reservoir, Beijing. However, few studies have been conducted on their responses to implemented soil conservation measures at a slope scale in northern China. To explore the impact of soil conservation measures on TN and TP losses, field monitored data from 18 runoff plots under natural rainfalls were used to analyze the changing characteristics of runoff, soil loss, and nutrient losses during 2014–2019. The results indicated that runoff, soil erosion, as well a TN and TP losses from the plots varied significantly, depending on land use and soil conservation measures. Bare plots suffered the highest soil, TN, and TP losses, followed by cultivated plots without soil conservation measures, cultivated plots with contour tillage, and other plots. Event-averaged runoff and soil loss rates ranged from 0 to 7.9 mm and from 0 to 444.4 t km−2 yr−1, and event-averaged TN and TP losses from cultivated plots were the highest, with values of 39.8 and 3.0 kg km−2, respectively. Bare and cultivated plots were the main sediment and nutrient sources. Among the cultivated plots, the terraced plot had the lowest soil and nutrient losses. The vegetated plots had insignificantly lower soil and nutrient losses. Most TN and TP were lost in particulate status from the plots, especially from the plots with soil conservation measures. Soil conservation measures can effectively prevent TN and TP losses. To guarantee water resource use, contour tillage is preferred for the bare and cultivated lands in the study region.
1. Introduction
Soil conservation measures are widely used in the world to control soil loss and to protect water quality and water resource use because they can reduce both on-site land degradation and off-site sediment siltation [1,2,3]. Thus, soil erosion can cause serious consequences for agricultural lands with low nutrient concentration as well as downstream water resource use and aquatic ecosystems [4,5,6,7].
In northern China, water shortage and water pollution are the two main problems [8]. The Miyun Reservoir is the largest reservoir in northern China which provides around 73% of the total drinking water for Beijing [9]. In recent years, both runoff and sediment discharge have significantly decreased, and sediment discharge into the Miyun Reservoir has declined from around 100 tons per year in 1954–1959 to nearly zero since 2005, due to human activities and decreased precipitation [10,11,12]. Water quality protection is also needed to ensure a drinking water supply and sustainable development for Beijing. Nonpoint source (NPS) pollution, especially nitrogen and phosphorous pollution, greatly affect the water quality of the Miyun Reservoir.
With respect to water quantity and quality problems of the Miyun Reservoir, a number of studies have been conducted. For example, Qiu et al. coupled SWAT model with a Markov chain based on a multi-objective optimization program to evaluate the effect of best management practices on water resources [8]. Yan et al. predicted future climate change impacts on streamflow and nitrogen exports based on CMIP5 projection and SWAT (soil and water assessment tools) models [12]. Qiu et al. evaluated the performance of soil conservation practices for reducing water pollution under climate change scenarios [6]. Zhang et al. also integrated land-use modelling with SWAT models to evaluate land use impacts on nonpoint pollution control in this catchment [13]. According to a statistical analysis, wavelet neural network, and other methods, variations in streamflow and nutrients and their supply to the Miyun Reservoir catchment have also been reported by studies in the literature [14,15,16]. However, most of the studies were done in the Miyiun Reservoir catchment at a catchment scale, and the variations of nutrient loss as well as their interactions with runoff and soil erosion have rarely been identified at a plot scale.
Using observed data from runoff plots to study changes of runoff and soil loss has been effectively used throughout the world [17,18,19]. Regrettably, current studies have mainly focused on runoff and sediment losses and their responses to soil conservation measures, and less consideration has been given to soil erosion induced nutrient loss. The Miyun Reservoir catchment is the major drinking water area of Beijing city, and therefore water resource protection is vitally important. Total nitrogen (TN) and total phosphorous (TP) are the major pollutants of the Miyun Reservoir catchment [15,20]. As mentioned above, although many studies have been conducted in the Miyun Reservoir catchment, almost all the studies were at a catchment scale; the impact of soil conservation measures on TN and TP at a plot scale have been rarely studied. There is an urgent need to identify soil and nutrient loss characteristics on the slopes of the Miyun Reservoir catchment.
Therefore, the specific aims of this study were (1) to identify the changing characteristics of runoff, soil erosion, as well as TN and TP losses; (2) to understand their interactions; (3) and to study their responses to land use and soil conservation measures. This study helps to further control soil loss and protect water resource for the Miyun Reservoir catchment, Beijing.
2. Materials and Methods
2.1. Study Area
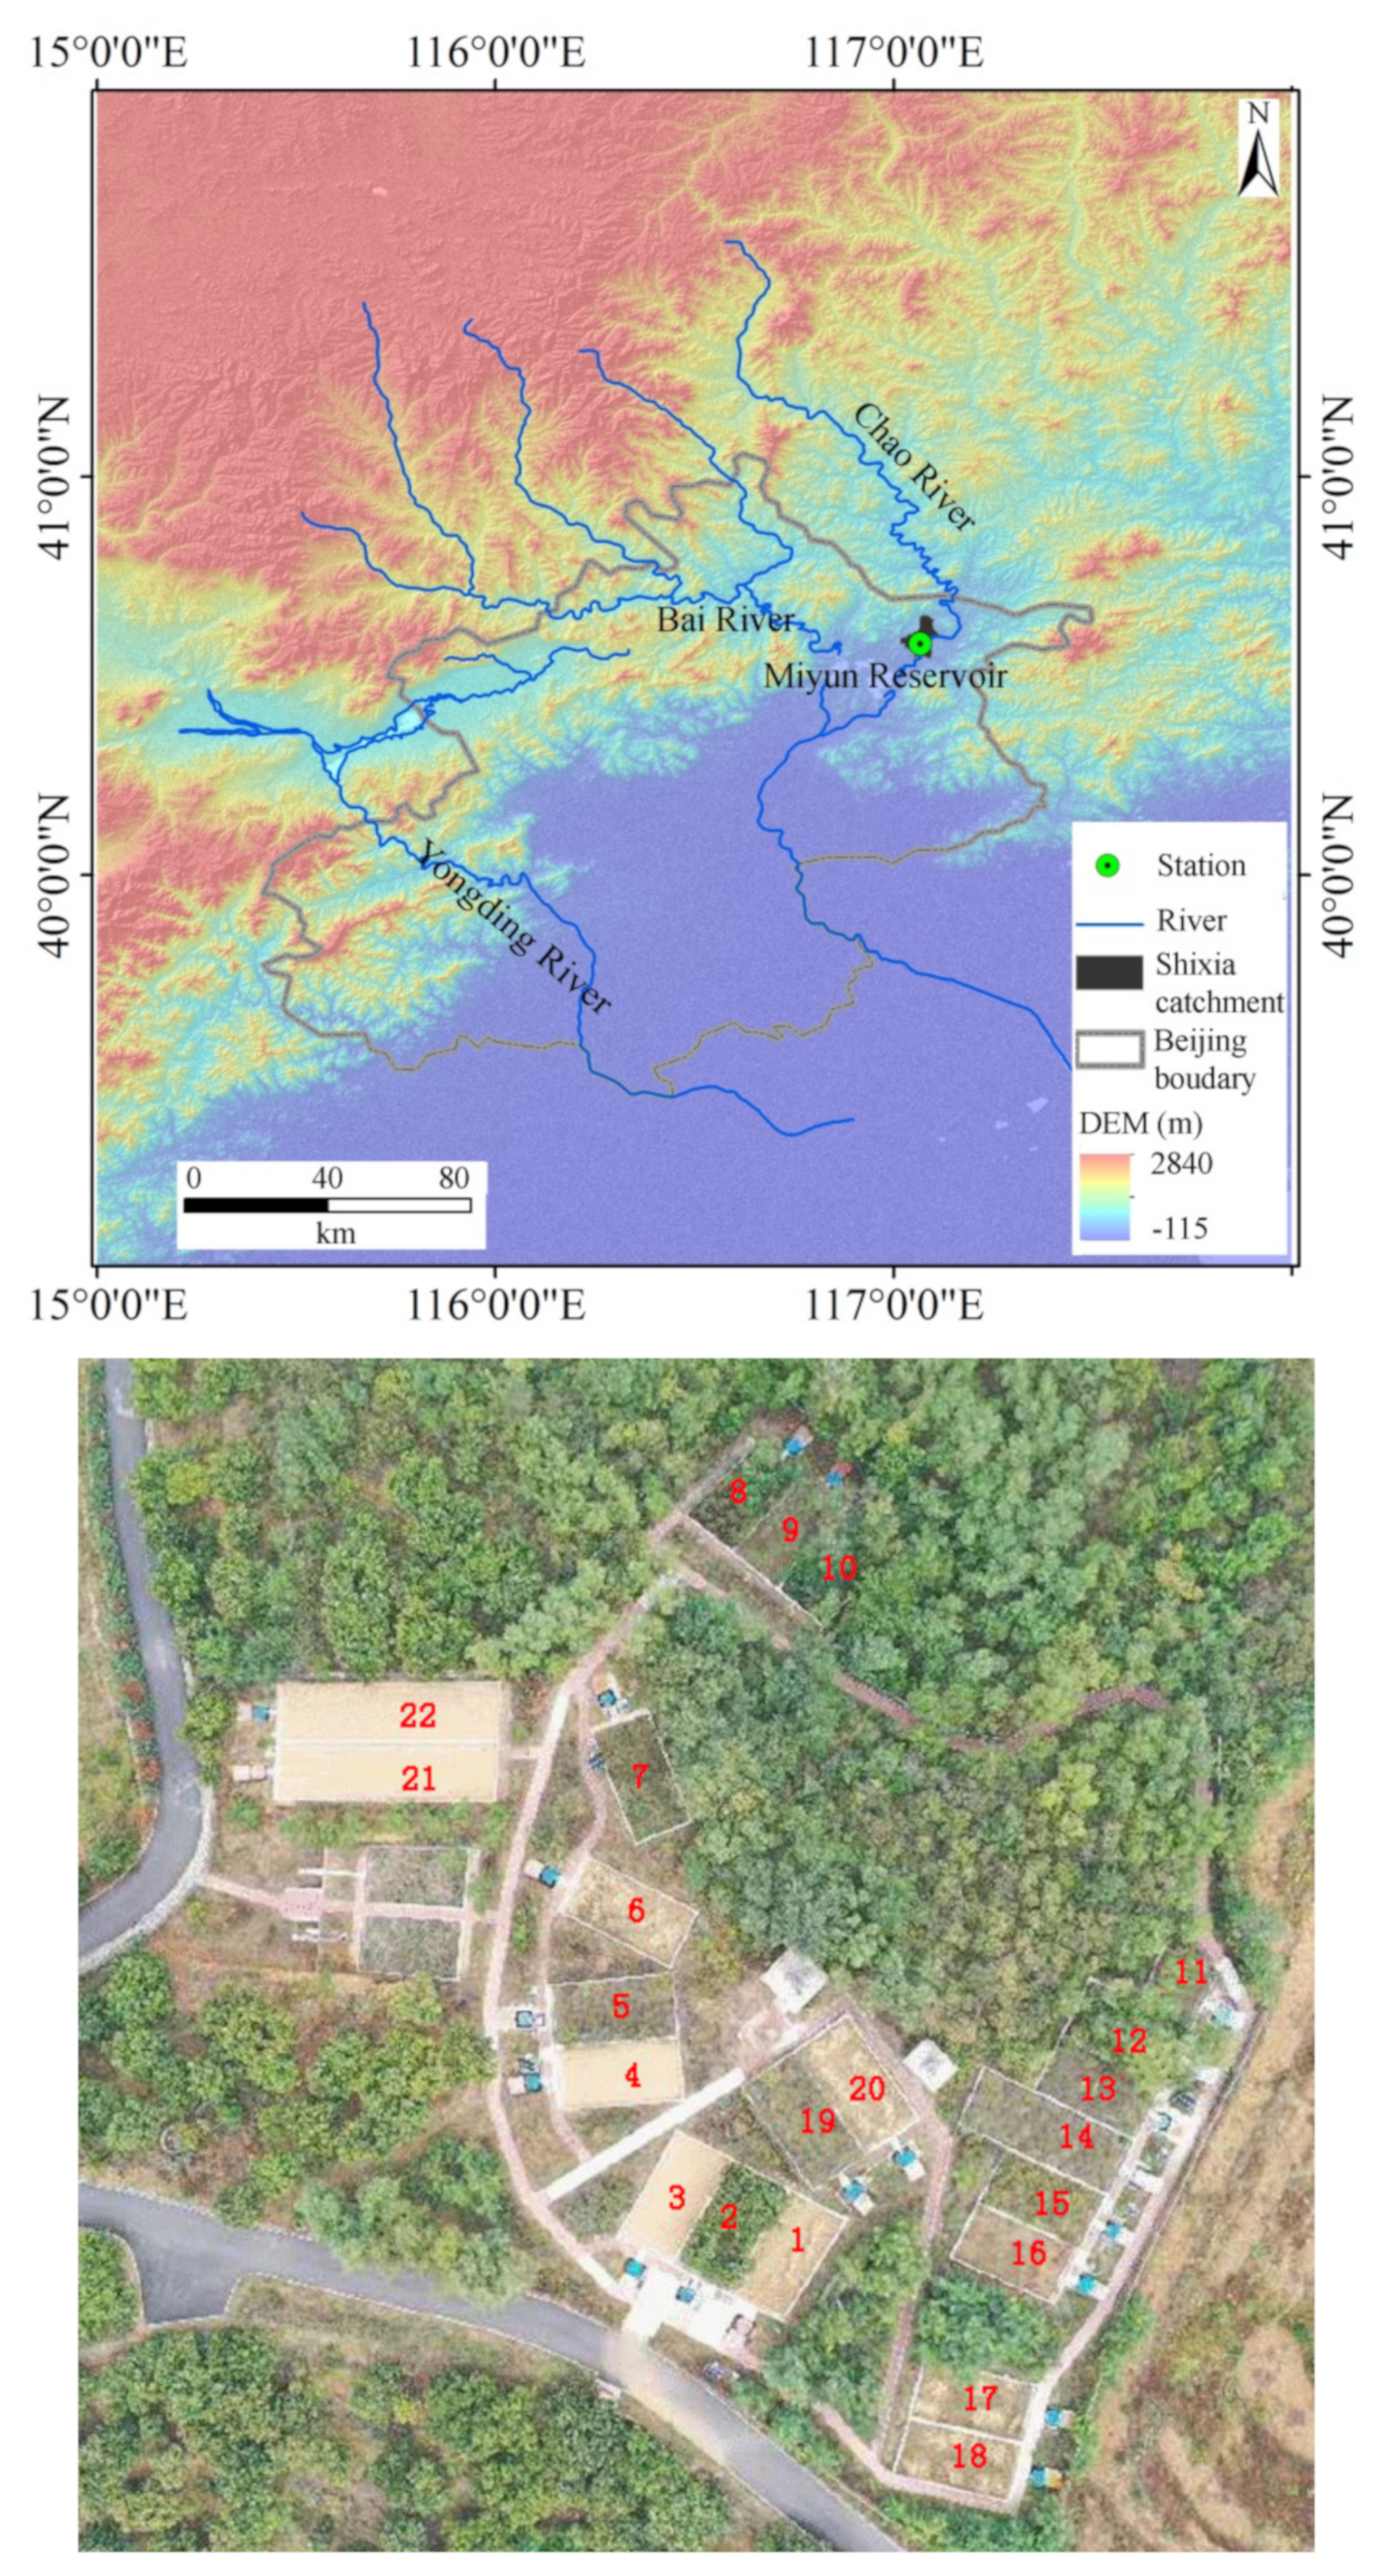
This study was conducted at an experimental station in the Shixia catchment (117°4′30″ E and 40°34′40″ N) which is located in the upstream of the Miyun Reservoir, Beijing (Figure 1). The catchment covers an area of 33 km2. It has a temperate territorial monsoon climate with annual precipitation ranging from 300 mm to 700 mm, 70% of which falls from June to August [21].
The catchment has elevations ranging from 130 to 390 m above sea level. The soil type belongs to eluvial cinnamon soil, with around 30 cm depth. The sandy loam soil contains around 60.9% particles that are larger than 0.05 mm in diameter, 18.22% particles that are 0.05–0.005 mm in diameter, 9.22% particles that are 0.005–0.001 mm in diameter, and 14.88% particles that are less than 0.001 mm in diameter [22], leading to a higher soil saturated hydraulic conductivity of around 77 cm/day. The dominant lithology is gneiss, scattered with granite and limestone [21]. The main land use types are forest, including economic forest orchard, followed by grass and cultivated land. The predominant crops are corn and wheat.
2.2. Runoff Plots
Experimental measurements from runoff plots were conducted in the present study. There are 22 runoff plots in the catchment (Figure 1). Bricks and cement were used to build boundaries to prevent runoff from leaving or entering the plots. The plots are bare, cultivated, or covered with different soil conservation measures. In the present study, 18 plots were selected. Each plot was 50 m2 in area and 10 m in length. The slope degrees of the plots ranged from 3.5° to 27°. The detailed information of the plots is given in Table 1.
2.3. Data Collection
During the study period, there were 270 rainfall events with rainfall amounts that ranged from 0.4 to 108.1 mm. However, only 57 rainfall events generated runoff on the plots. Therefore, only the rainfall events that induced runoff on any of the plots (named erosive rainfall) were used in the present study. After each erosive rainfall event, in 2014–2019, surface runoff mixed with sediment was collected with a container at the end of each runoff plot. The runoff amount from each plot was obtained by measuring the water in the container. Evenly mixed water and sediment samples were also collected with 1000 mL flasks after each rainfall to determine sediment concentration. The concentrations of TN and TP in runoff were determined with the potassium persulfate oxidation-ultraviolet spectrometry method [22]. Then, soil and nutrient losses from each plot were calculated by multiplying their concentrations and runoff amounts. The runoff depth (mm) on a runoff plot after each rainfall event was calculated by using the total runoff amount and the plot area. The loss rates of soil and the dissolved TN (kg km−2) and TP (kg km−2) were obtained by using their total losses and plot area. The annual runoff depth and annual soil loss rate from each plot were obtained by summing the event-derived runoff and soil loss.
In the present study, the concentrations of TN and TP in sediments (i.e., particulate TN or TP) from different runoff plots were obtained from Wang et al. [22]. The particulate TN and TP contents in sediment were first digested by sulfuric acid and perchloric acid, and then were determined by the distillation spectrophotometry method. The specific particulate TN and TP contents are given in Table 2.
Rainfall data were recorded by a rain gauge near the runoff plots. The gauge automatically recorded rainfall amount with 5 min resolution. For the erosive rainfall events, five rainfall properties, including rainfall duration (RD), rainfall amount (P), mean rainfall intensity (Im), maximum rainfall intensities at 30 min (I30), and at 60 min (I60) were obtained. The annual erosive rainfall amount (AP) was obtained by summing event P.
2.4. Data Treatment and Statistical Analysis
According to Table 2 and Table 3, the annual particulate TN and TP losses were calculated by multiplying particulate TN and TP contents and annual SLRs:
where LRTX represents TN or TP loss rate (t km−2 yr−1), ConTX represents TN or TP contents on sediment (g kg−1), and ASLR represents annual SLR (t km−2 yr−1).
According to the dissolved TN and TP loss rates (kg km−2) and the particulate counterparts, the total TN and TP loss rates as well as their respective percentages were calculated. The mean annual reduction efficiencies of TN and TP were also calculated based on the annual mean TN and TP losses from the bare plots.
The Pearson correlation coefficient r is commonly used correlation to reflect correlations between and/or among variables. The r values range from −1 to 1, the larger the absolute r, the higher the correlation exists. In the present study, a Pearson correlation analysis was performed to assess the relationships among runoff depth, SLR (soil loss rate), TP, and TN, and their influencing factors. The Fisher’s protected least significant difference (LSD) test that belongs to a one-way analysis of variance (ANOVA) was used to compare the means of runoff depth, SLR, TN, and TP from the plots. The treatments were considered to be significant if p < 0.05. All the statistics were conducted using SPSS version 14.0 for Windows.
3. Results
3.1. Rainfall Characteristics
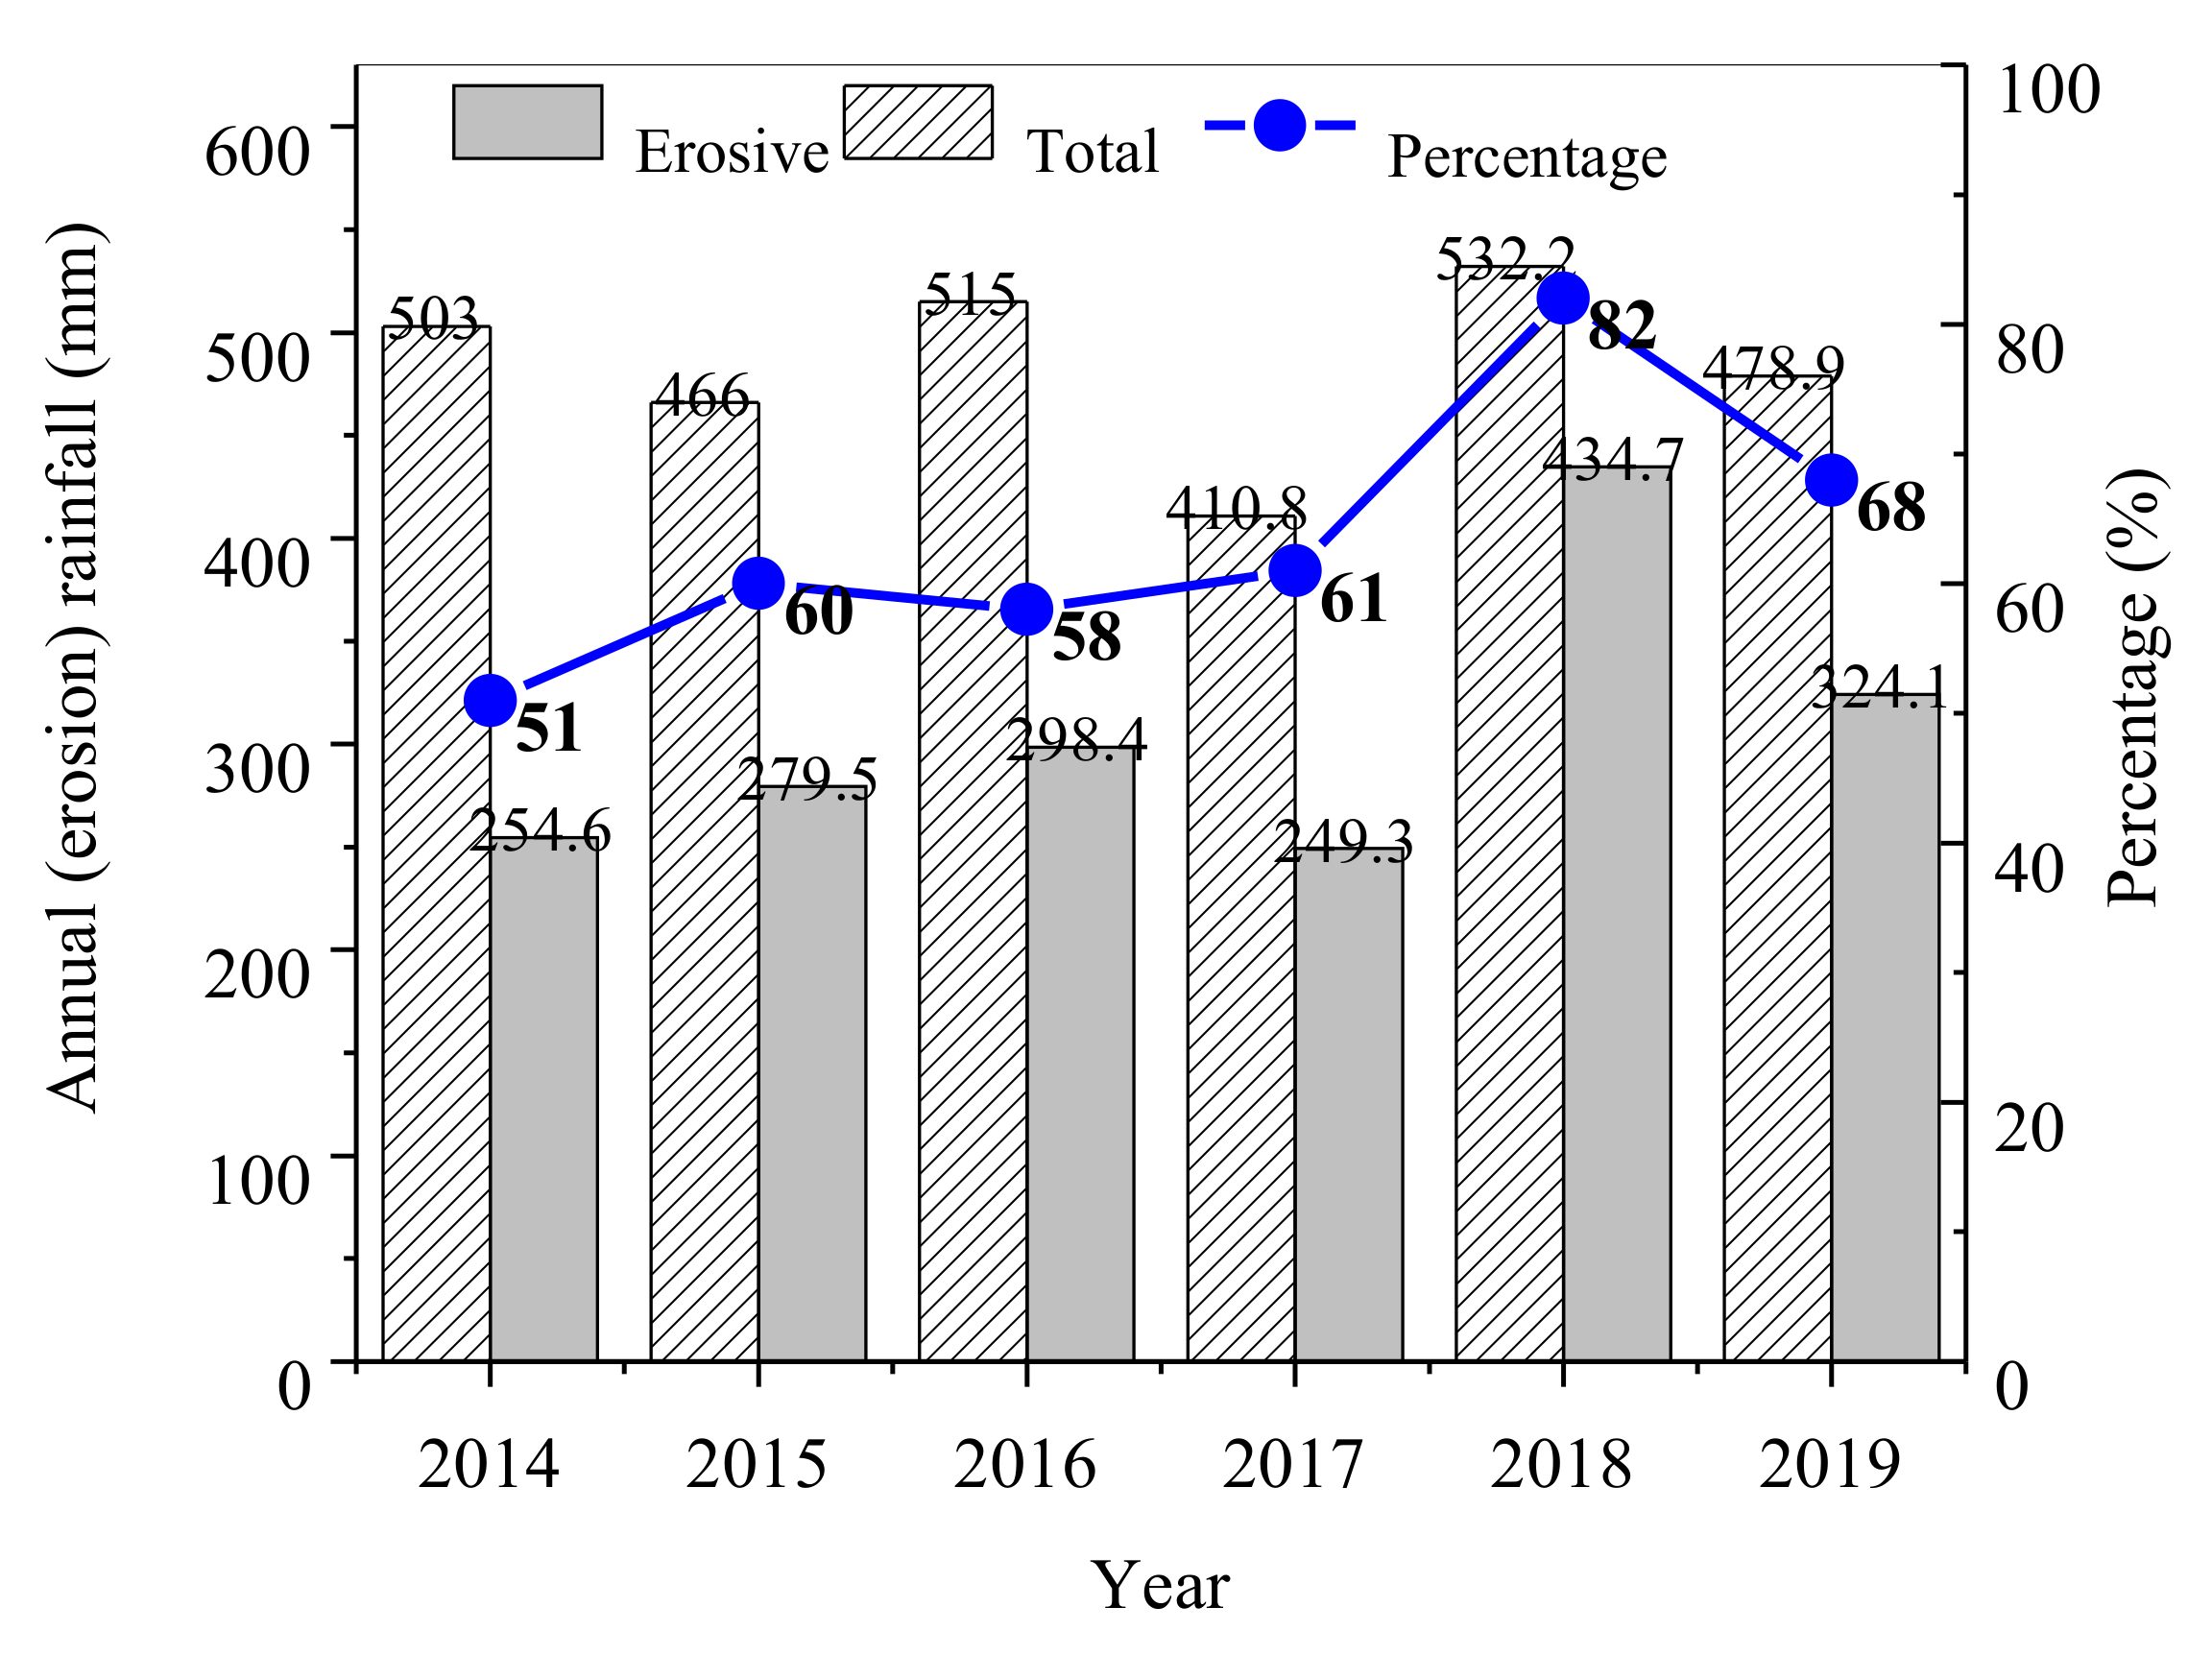
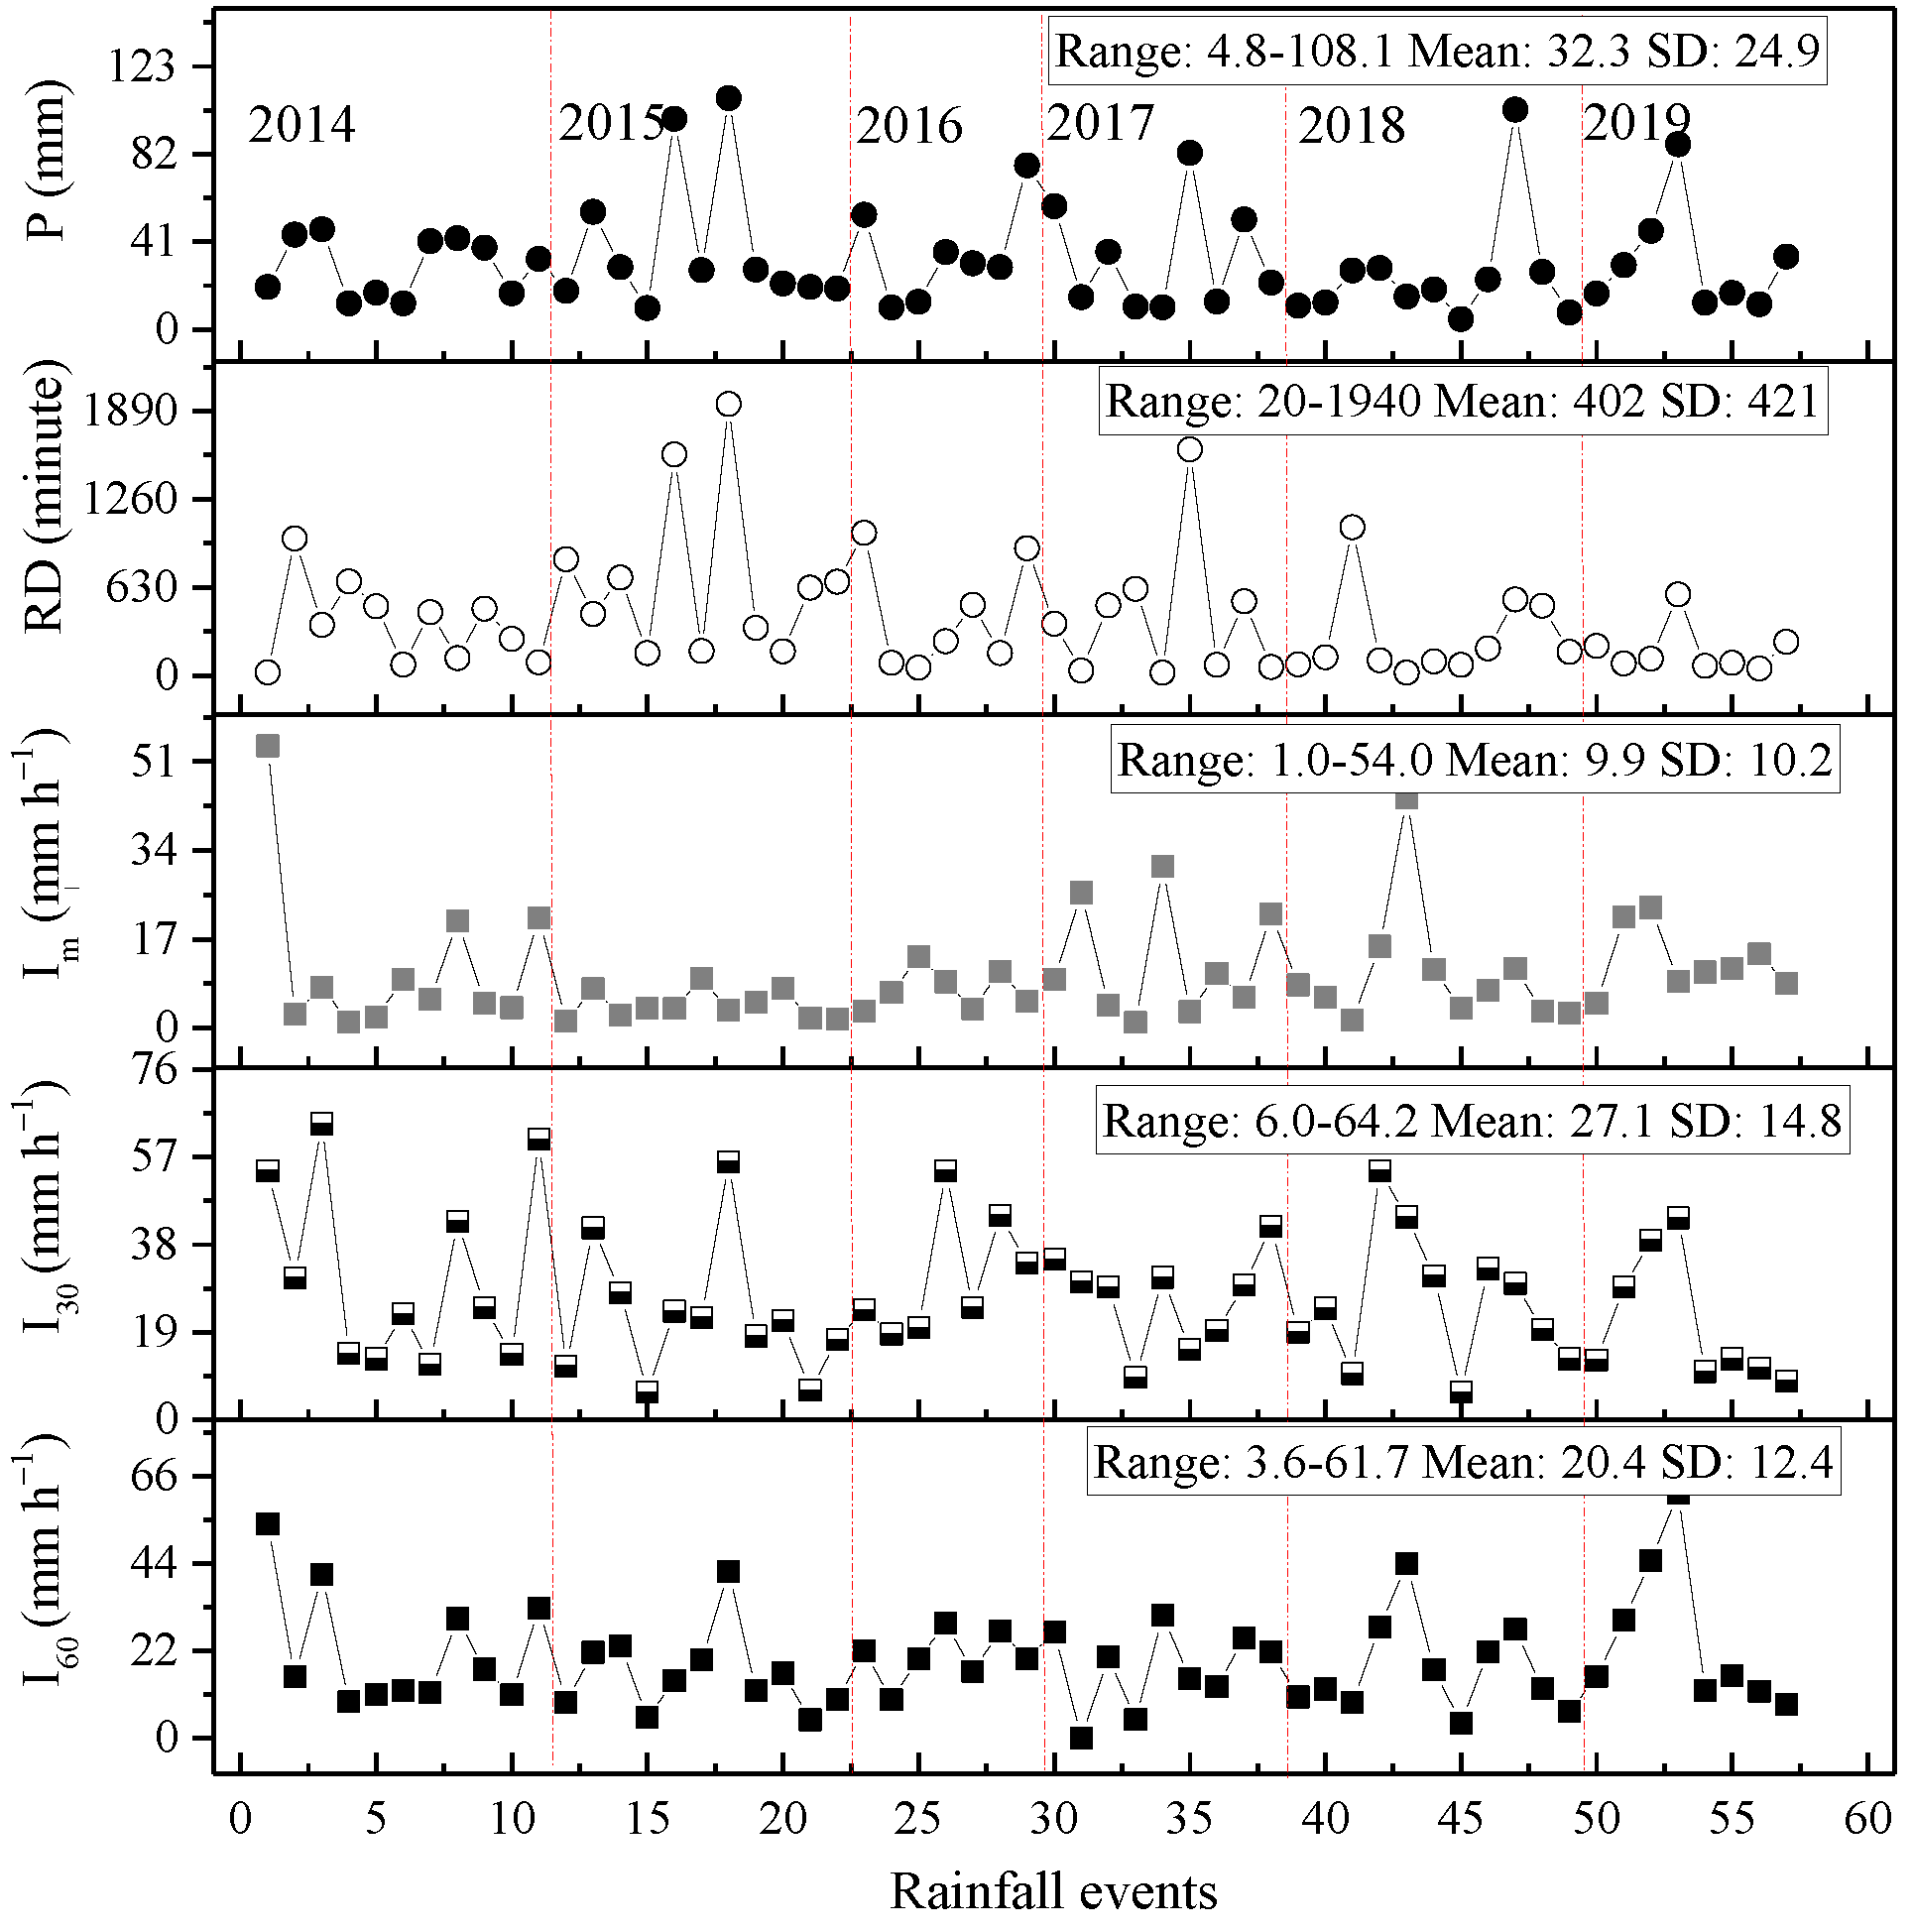
For the period 2014–2019, the annual total rainfall amounts ranged from 410 mm in 2017 to 532 mm in 2018, and the percentages of erosive rainfall amount (i.e., the ratio of annual erosive rainfall amount to the total) was over 50% for all the years. There were seven to eleven erosive rainfall events each year, with a total of 57 erosive rainfall events during the study period (Figure 2). The event rainfall properties varied significantly. The minimum and maximum P values were 4.8 and 108.10 mm, respectively, with an average of 32.3 mm. There were five events with rainfall amounts higher than 80 mm. The RD values ranged from 20 to 1940 min, with an average of 402 min and a standard deviation of 421 min. The Im values ranged from 1.0 to 54.0 mm h−1, with an average of 9.9 mm h−1. During the study period, higher intensity rainfall occurred after 2017. Although the minimum and maximum values for I30 and I60 had similar changing patterns to Im for each year, the mean values of I30 and I60 were much higher than the counterparts of Im. The minimum values for I30 and I60 were 6.00 and 3.60 mm h−1, respectively, and both I30 and I60 had maximum values higher than 60 mm h−1 (Figure 3).
3.2. Surface Runoff and Soil Loss
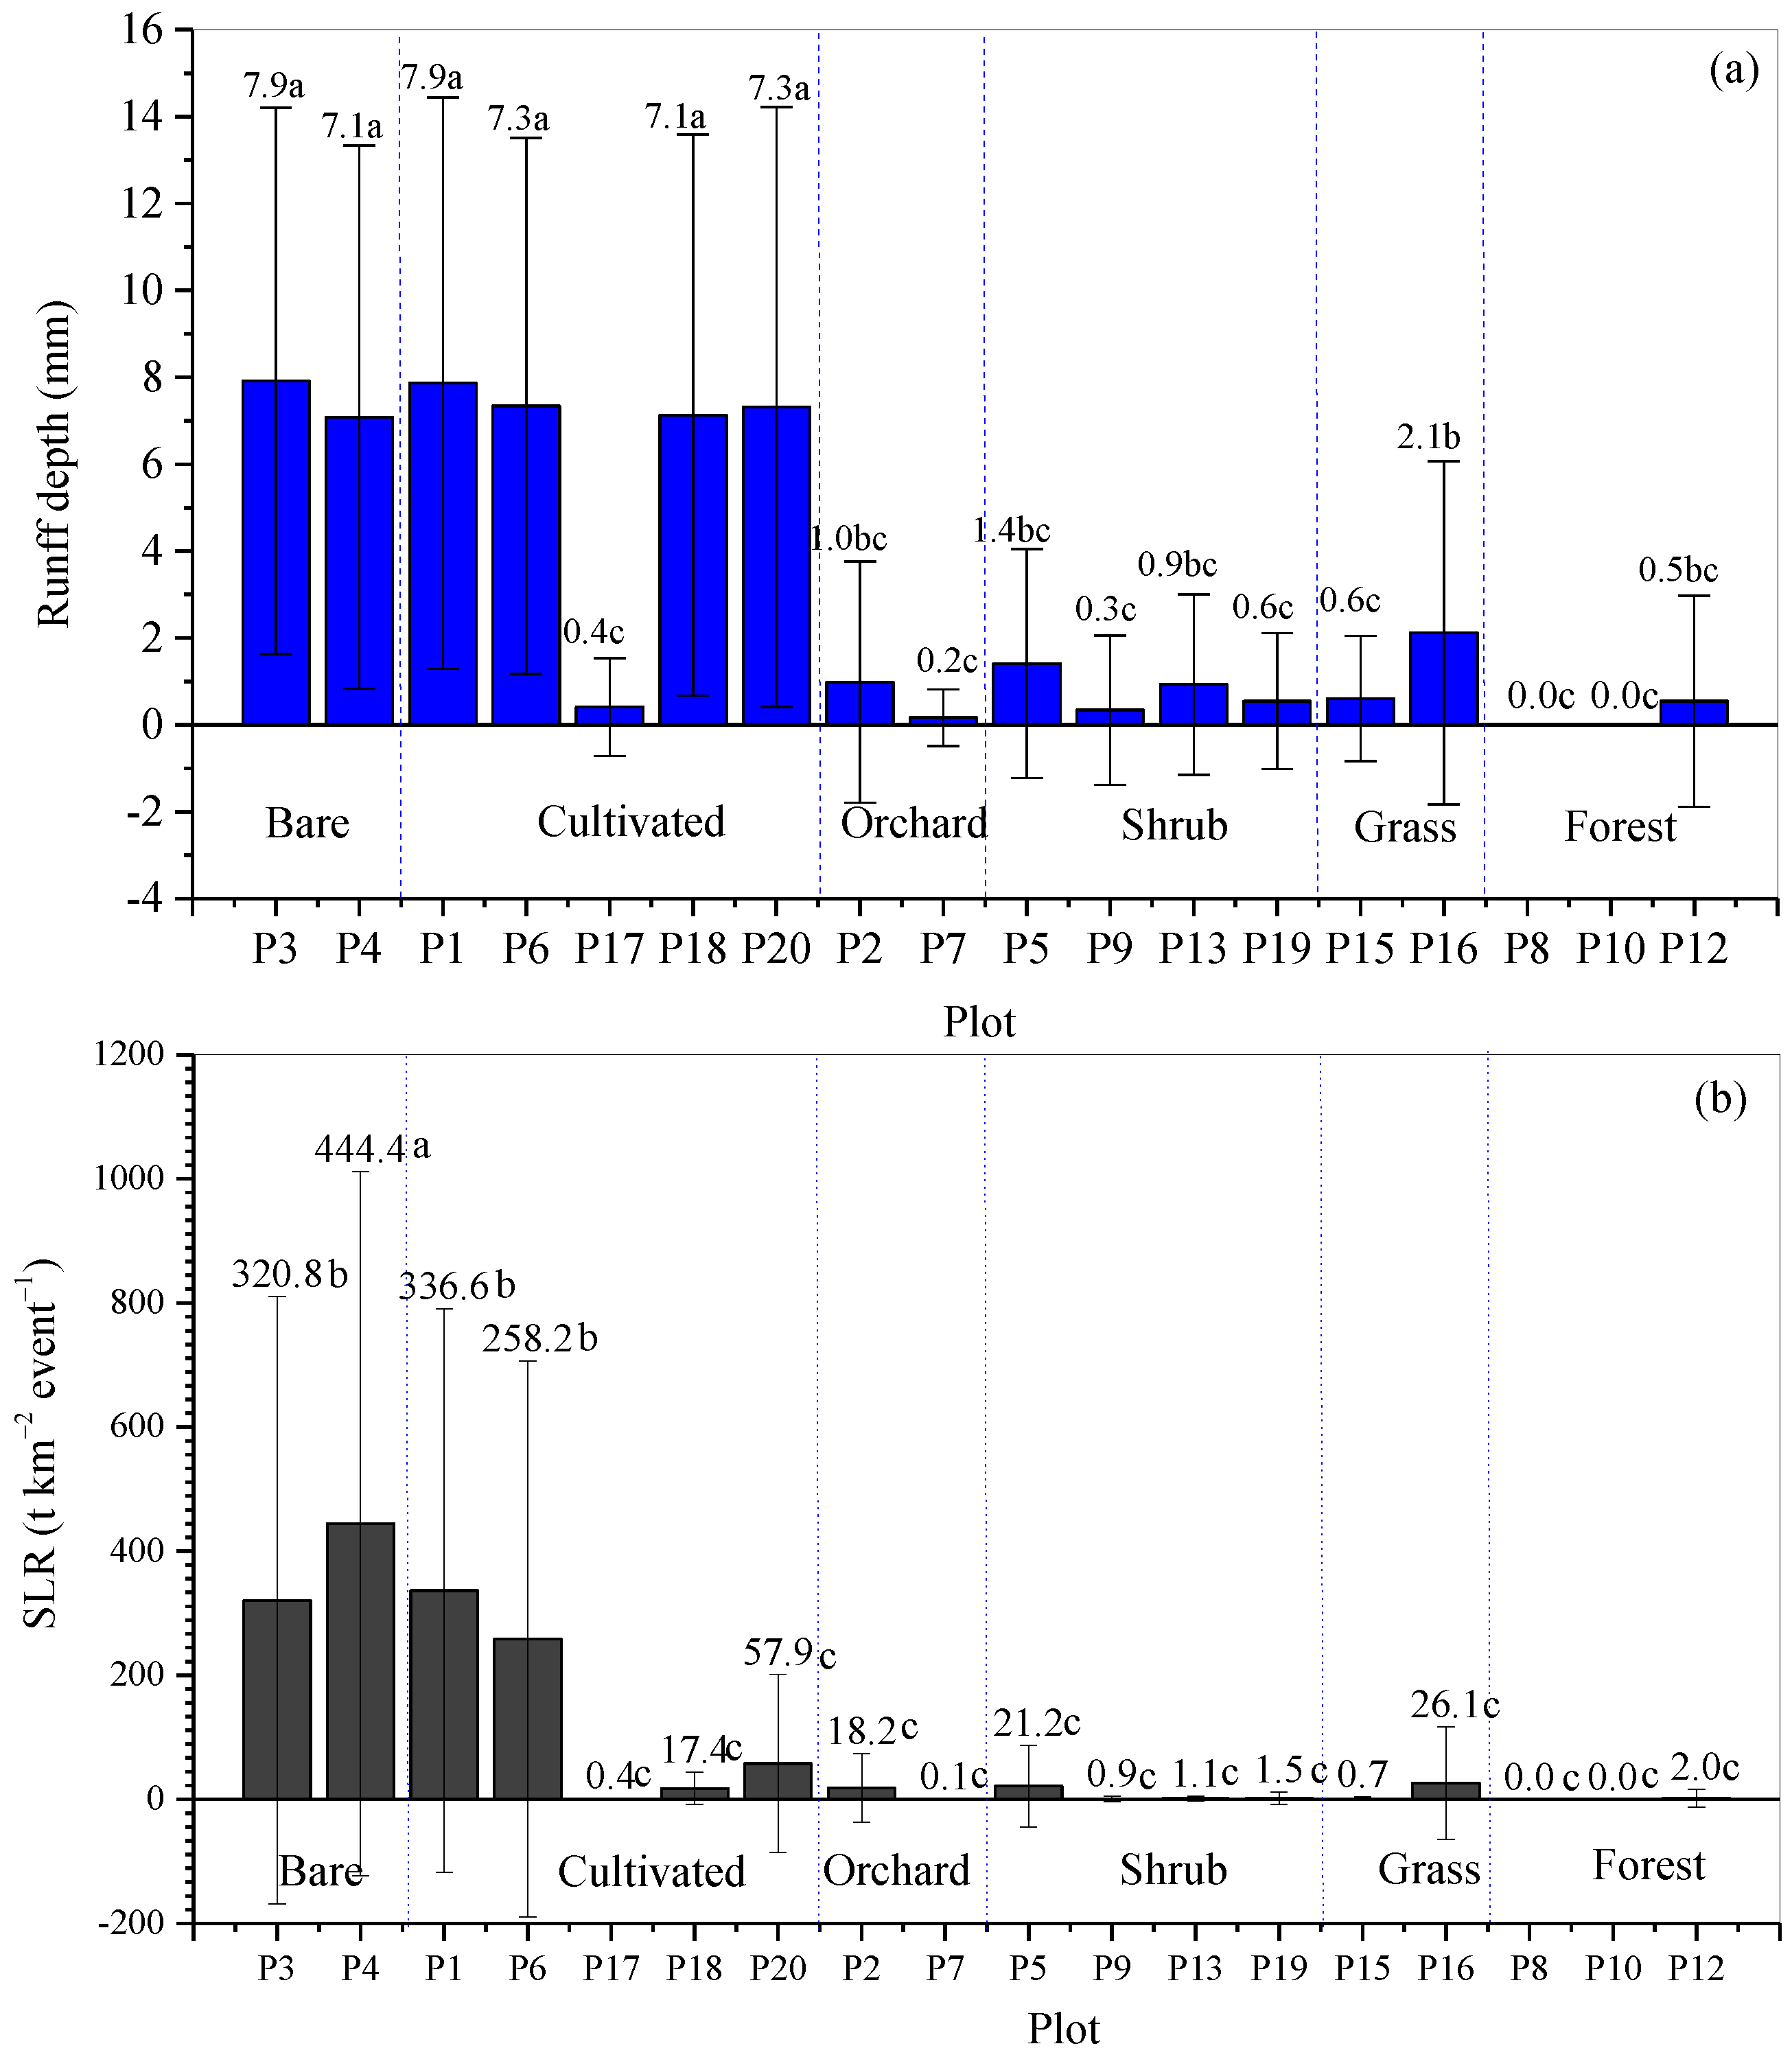
The event runoff depths varied from 0 to 7.9 mm depending on land use types and soil conservation measures (Figure 4a). Except for the cultivated plot with a terrace, the runoff depths from bare and cultivated plots were not significantly different at the 0.05 level. However, they were significantly higher than those from other plots. Although runoff depths from orchard, shrub, grass, and forest plots were much lower, significant differences also existed among them (Figure 4). For example, the runoff depth from Plot 16 was significantly higher than those from other plots.
The event SLRs on the plots also varied greatly. The highest event-averaged SLR of 444.4 t km−2 occurred on the bare Plot 4 and the lowest values occurred on the forest Plots 8 and 10. The SLRs on bare plots and cultivated Plots 1 and 6 were much higher than those from other plots (Figure 4b).
Among the individual plots, the event runoff depths and SLRs varied greatly, especially for the cultivated and bare plots. For example, on the cultivated Plot 1, the highest SLR during one rainfall event was above one thousand, and the lowest SLR was less than ten. A similar phenomenon also occurred on the bare plots. The event runoff depths and SLRs on the other plots with soil conservation measures had smaller fluctuation magnitudes.
The annual runoff depth and annual SLR from bare land were 71.2 mm and 3634.5 t km−2 yr−1, respectively, which were significantly higher than those from cultivated land and other land use types. Cultivated land also had a significantly higher annual runoff depth and annual SLR than those from other land use types. For cultivated land, the terraced plot generated the least annual runoff depth (i.e., 3.9 mm) and annual SLR (i.e., 4.1 t km−2 yr−1), which were significantly less than the counterparts from other plots (Table 3).
3.3. TN and TP Losses
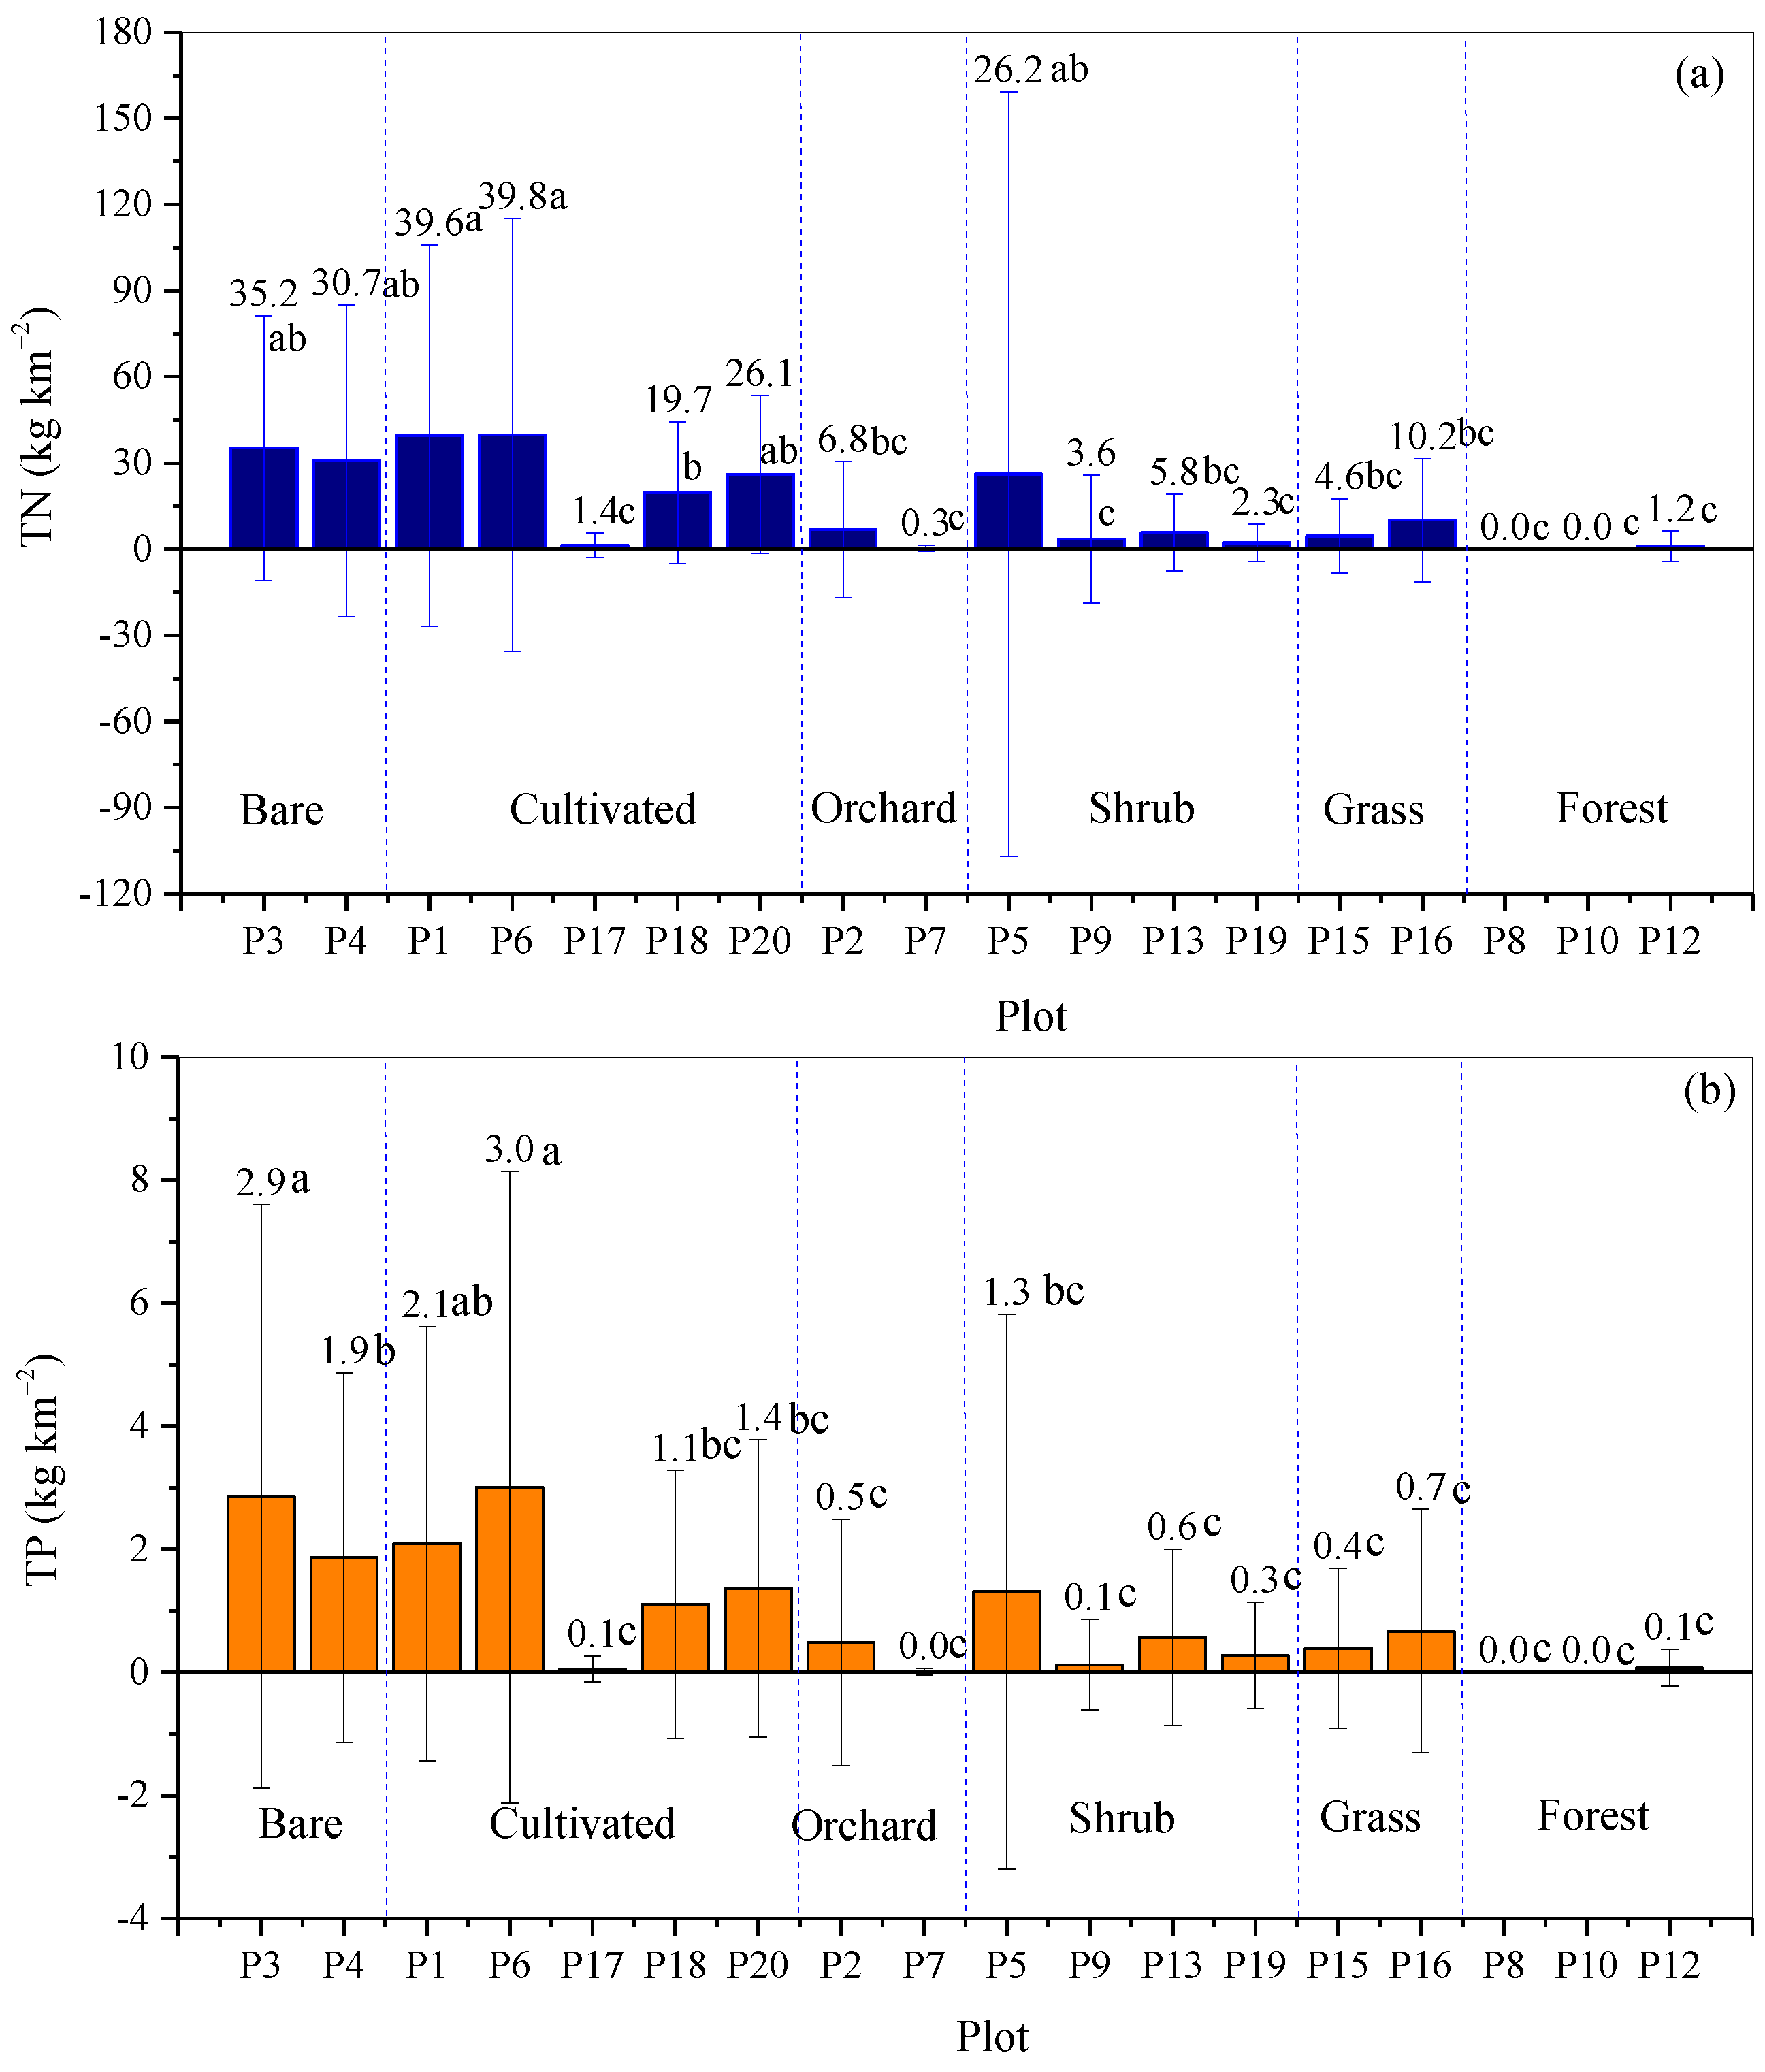
The event-averaged losses of TN and TP presented similar changing trend to H and SLR from the plots (Figure 5). Cultivated plots had the highest TN and TP losses, with 39.8 and 3.0 kg km−2, respectively. In contrast, the vegetated plots (i.e., grass, shrub, and forest plots) had lower TN and TP losses. The TN and TP losses from bare plots differed insignificantly with those from cultivated Plots 1 and 6, which were significantly higher than those from orchard, shrub, grass, and forest plots.
For cultivated plots, the TN losses from Plots 1 and 6 were 39.6 and 39.8 kg km−2, respectively, which were higher than those from Plots 17, 18, and 20. The contour tillage Plots 18 and 20 had significantly lower TN loss due to smaller slope gradients (Table 1). The terraced Plot 17 also had a significantly lower TN loss of 1.4 kg km−2 than Plots 1, 6, 18, and 20. In contrast, the TN losses from shrub, grass, and forest plots varied from zero to 10.2 kg km−2 which differed insignificantly. TP losses had a similar changing pattern to that of TN losses. The TP loss on cultivated Plot 6 was 3.0 kg km−2 which was insignificantly higher than those from bare Plot 4 and significantly higher than those from other plots. The TP losses from orchard, shrub, grass, and forest plots ranged from 1.3 kg km−2 to 0.0 kg km−2 which differed insignificantly. Plot 17 had significantly lower TP loss of 0.1 kg km−2 than those from other cultivated plots, and Plot 6 had a significantly higher TP loss than Plots 18 and 20.
During 2014–2019, the mean annual TN losses ranged from zero to 377.7 t km−2 among the plots (Table 2). The averaged TN loss of 313.4 t km−2 from bare plots was the highest, followed by those of cultivated plots (240.5 t km−2), shrub plots (90.1 t km−2), grass plots (70.1 t km−2), orchard plots (33.5 t km−2), and forest plots (3.7 t km−2). The annual averaged TN loss from bare plots was significantly higher than those from other plots at the 0.05 level. Affected by soil conservation measures and slope gradient, TN losses varied greatly for individual land use types. The TN losses ranged from 13.0 to 377.7 t km−2 for the cultivated plots, from 21.6 to 248.9 t km−2 for the shrub plots, and from 43.7 to 96.5 t km−2 for the grass plots. The annual TP loss exhibited a similar pattern to TN loss, although it was less than TN loss for each plot. Annually, the highest TP loss of 22.4 t km−2 occurred on bare plots, followed by cultivated plots (14.5 t km−2), shrub plots (5.4 t km−2), and other plots.
4. Discussion
Land use, soil conservation measures, and slope characteristics can have a significant influence on runoff, soil, and nutrient losses [23,24,25]. A stratified forest can effectively offer a certain degree of protection against runoff generation and soil loss relative to bare and cultivated soils [25], leading to the lowest runoff depth and SLR on Plots 8 and 10. Similar to other study results [4,25,26,27,28], the cultivated plots had higher runoff depth and SLR in contrast to other land use types. Noticeably, the runoff depths and SLRs from cultivated Plots 1, 6, 17, 18, and 20 varied greatly, depending on slope gradient and soil conservation measures. The cultivated Plot 17 with terrace had an even lower runoff depth and SLR, which, to some extent, disturbed the comparisons of the mean of the cultivated plots with the mean of other land use groups (Table 3).
In the present study, the terrace had a higher efficiency for controlling soil loss and runoff than that of contour tillage. Plots 17 and 18 had a same slope gradient, while more runoff and sediment were controlled by terraced Plot 17. This phenomenon has also been found on the Loess Plateau [18,25] and in other regions [24,25,26,27,28].
Affected by the measures, the responses of surface runoff and SLR changed greatly. The Pearson correlation coefficients among the five properties, runoff depth, and SLR indicated that almost all the runoff depths on the plots were correlated with P, except those on Plots 9 and 13. However, all the H and SLR on the cultivated plots (i.e., Plots 1, 6, 17, 18, and 20) and bare plots (i.e., Plots 3 and 4) were both significantly correlated with P and I30 and I60 at the 0.01 level. As a result, high intensity rainfall events with long RD induced severe soil loss on these plots. In comparison, for the plots covered with shrub or forest, runoff depth and SLR were significantly correlated with P or rainfall intensity. Noticeably, runoff depth and SLR from some plots were negatively correlated with RD, and the correlation coefficients for the plots with vegetated or engineering measures were smaller than those from cultivated and bare plots (Table 4). Different responses of plots to different rainfall properties can result from the protected capacities of implemented measures [18,24].
Slope gradient is an important factor influencing runoff generation and soil loss. However, masked by the implemented soil conservation measures, the impact of slope gradients of the runoff plots was not obvious, although they varied greatly (Table 1). For example, the slope gradients of Plots 8–10 and 15–16 were higher, whereas their runoff depths and SLRs were much lower than the counterparts from the bare and cultivated plots.
In the present study, TN and TP losses are significantly correlated with runoff depth and SLR at the 0.01 level (Table 5). This is because TN and TP can be carried away by both a dissolved status in runoff and particulate status in sediment [29]. Significant correlations among runoff depth, SLR, and TN and TP losses were also found by Li et al. [5]. For the runoff plots, both TN, and TP losses can be expressed by runoff depth in linear equations at the 0.001 significant level (Table 6). Noticeably, the adjusted R2 values of the linear equations were usually higher for the vegetated plots than those of the bare and cultivated plots, especially for the functions relating to runoff depth and TP. This indicated that more dissolved TN and TP losses can be explained by runoff variations for the vegetated plots.
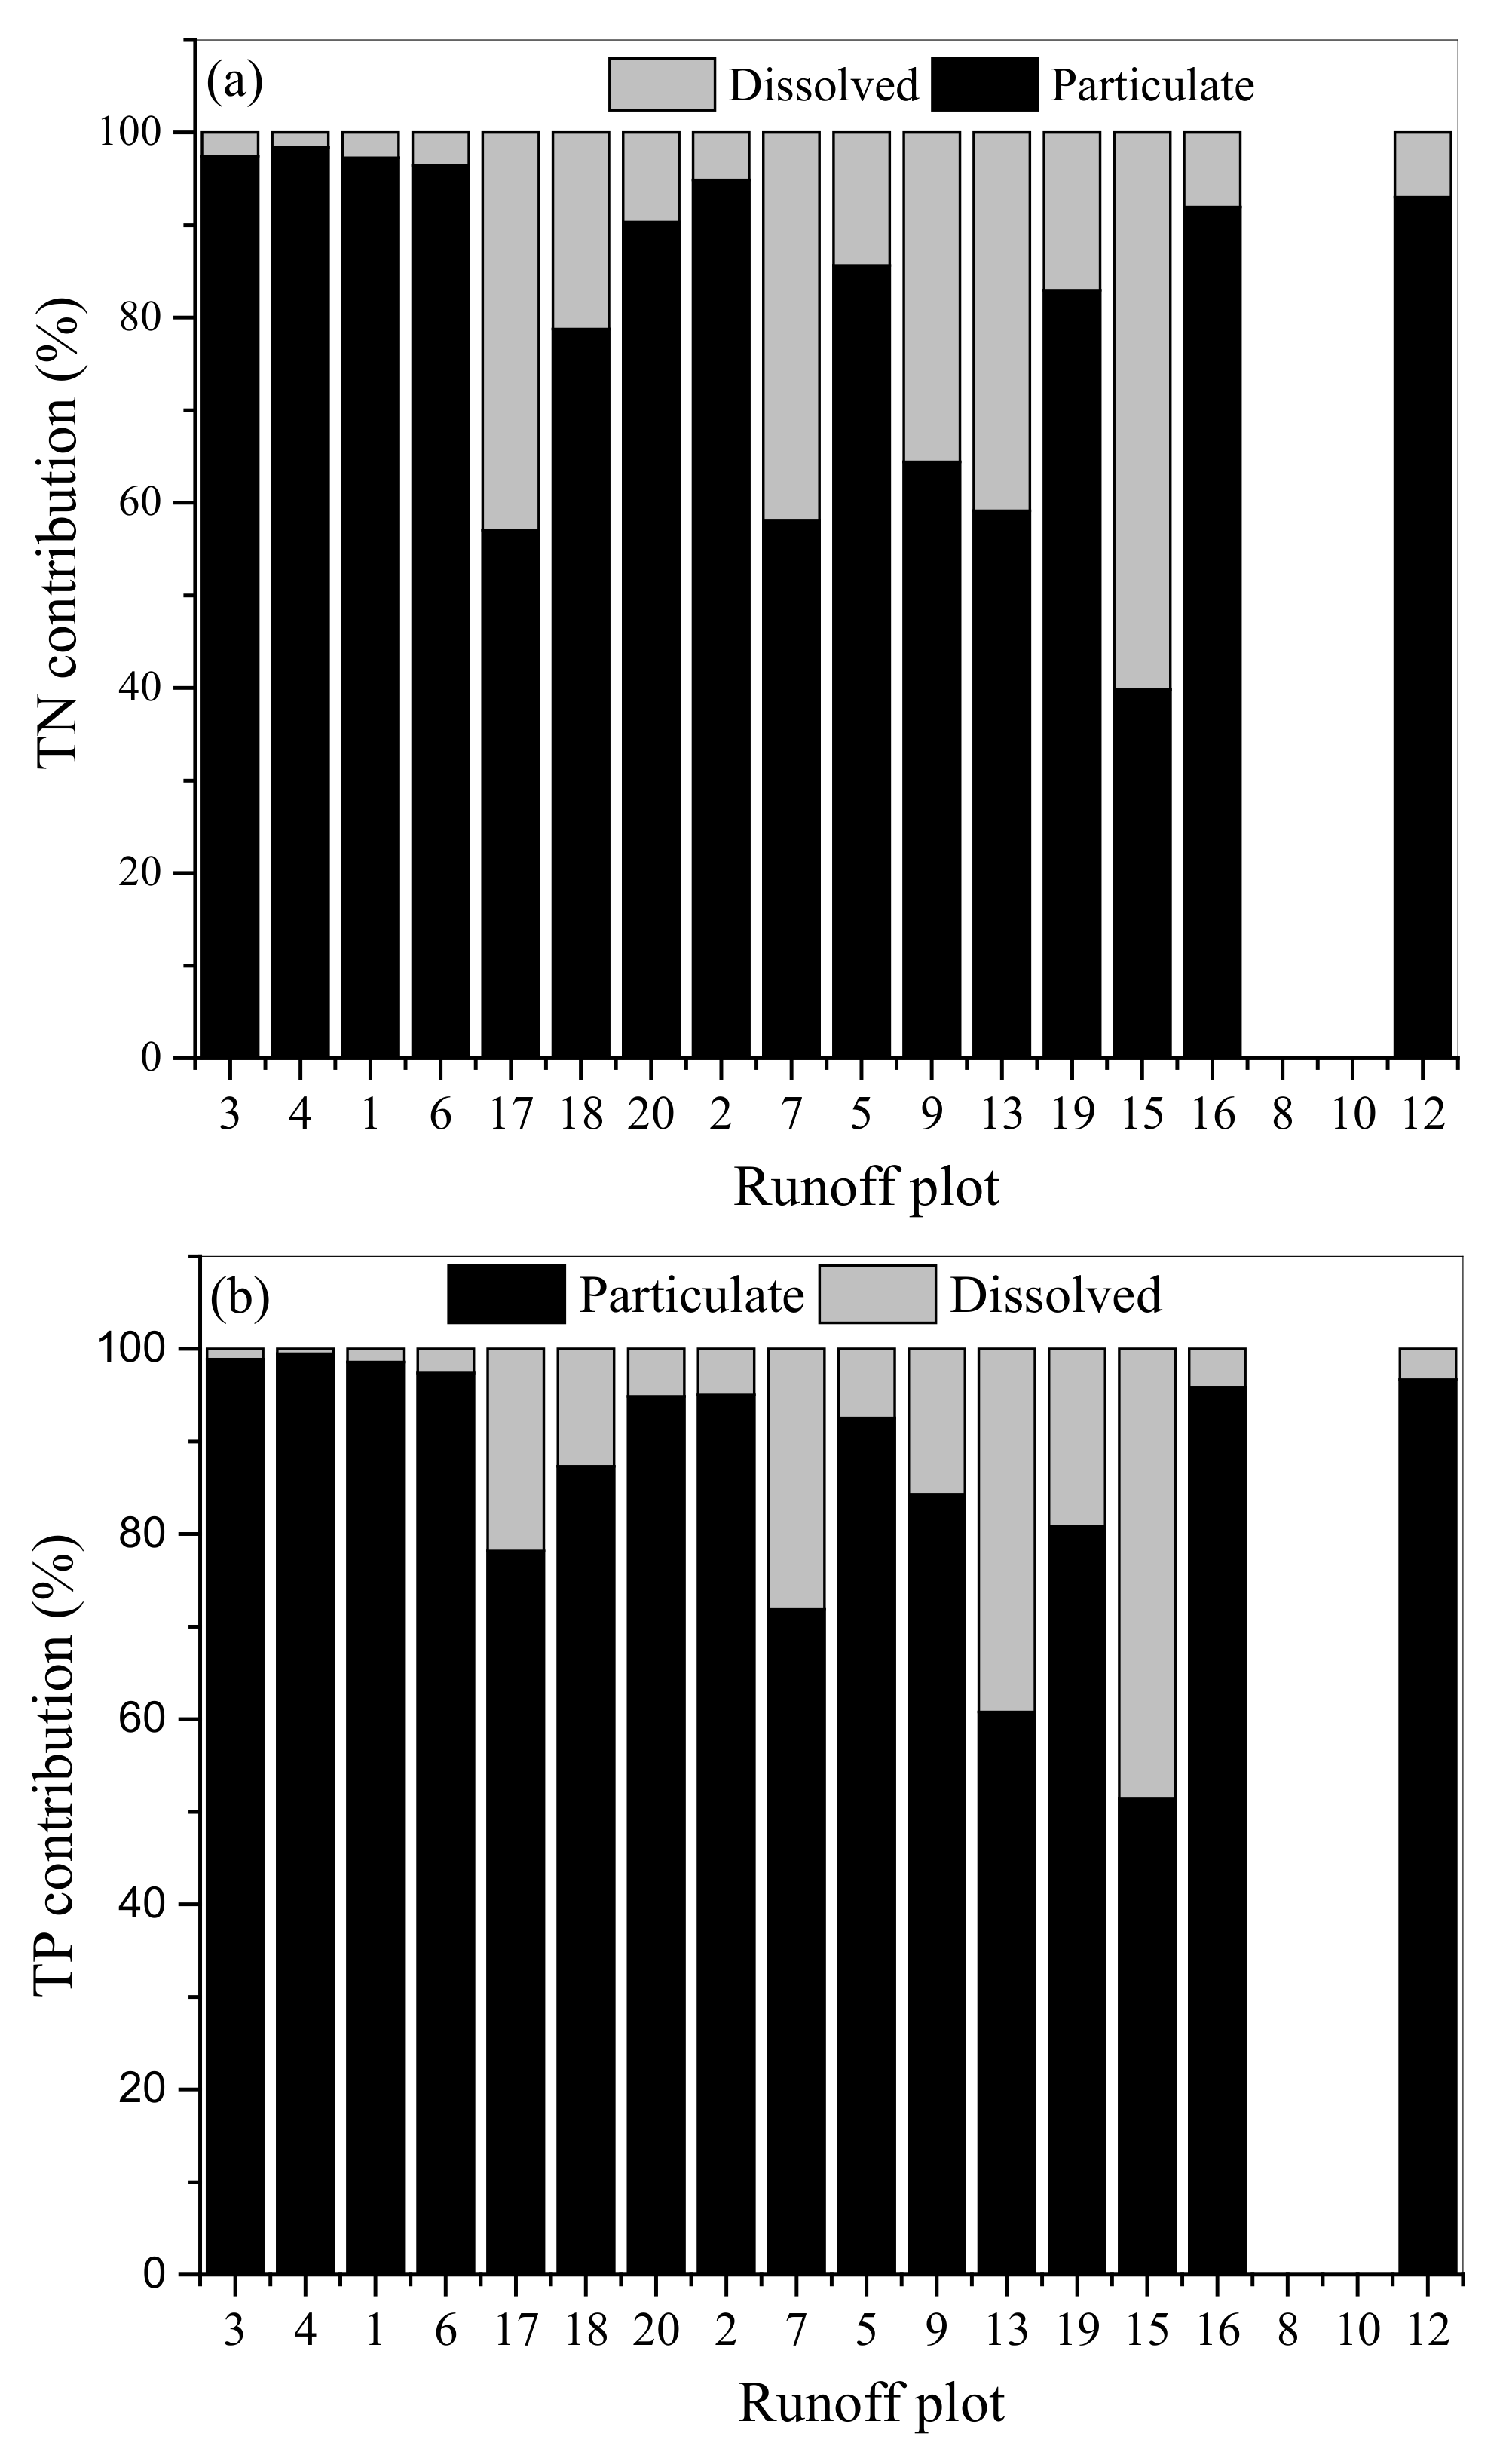
In the present study, only TN and TP losses in dissolved status were obtained that could underestimate their losses, because particulate nutrients in sediment were not included. Figure 6 indicates that most TN and TP were lost in particulate status. For the vegetated plots, more dissolved TN and TP occurred, which coincide with the higher R2 values of the regression equations between runoff depth and TN or TP (Table 4) [30]. However, relatively more percentages of TN and TP were lost in particulate status on the bare and cultivated plots, resulting in lower R2 values for the bare and cultivated plots. The present study agrees with the global results that 95% of TP and 55% of TN transport in rivers are particulate status [31]. This difference could result from different fertilizer input, rainfall characteristics, ground coverage, land management practices, and topographic characteristics [5,32].
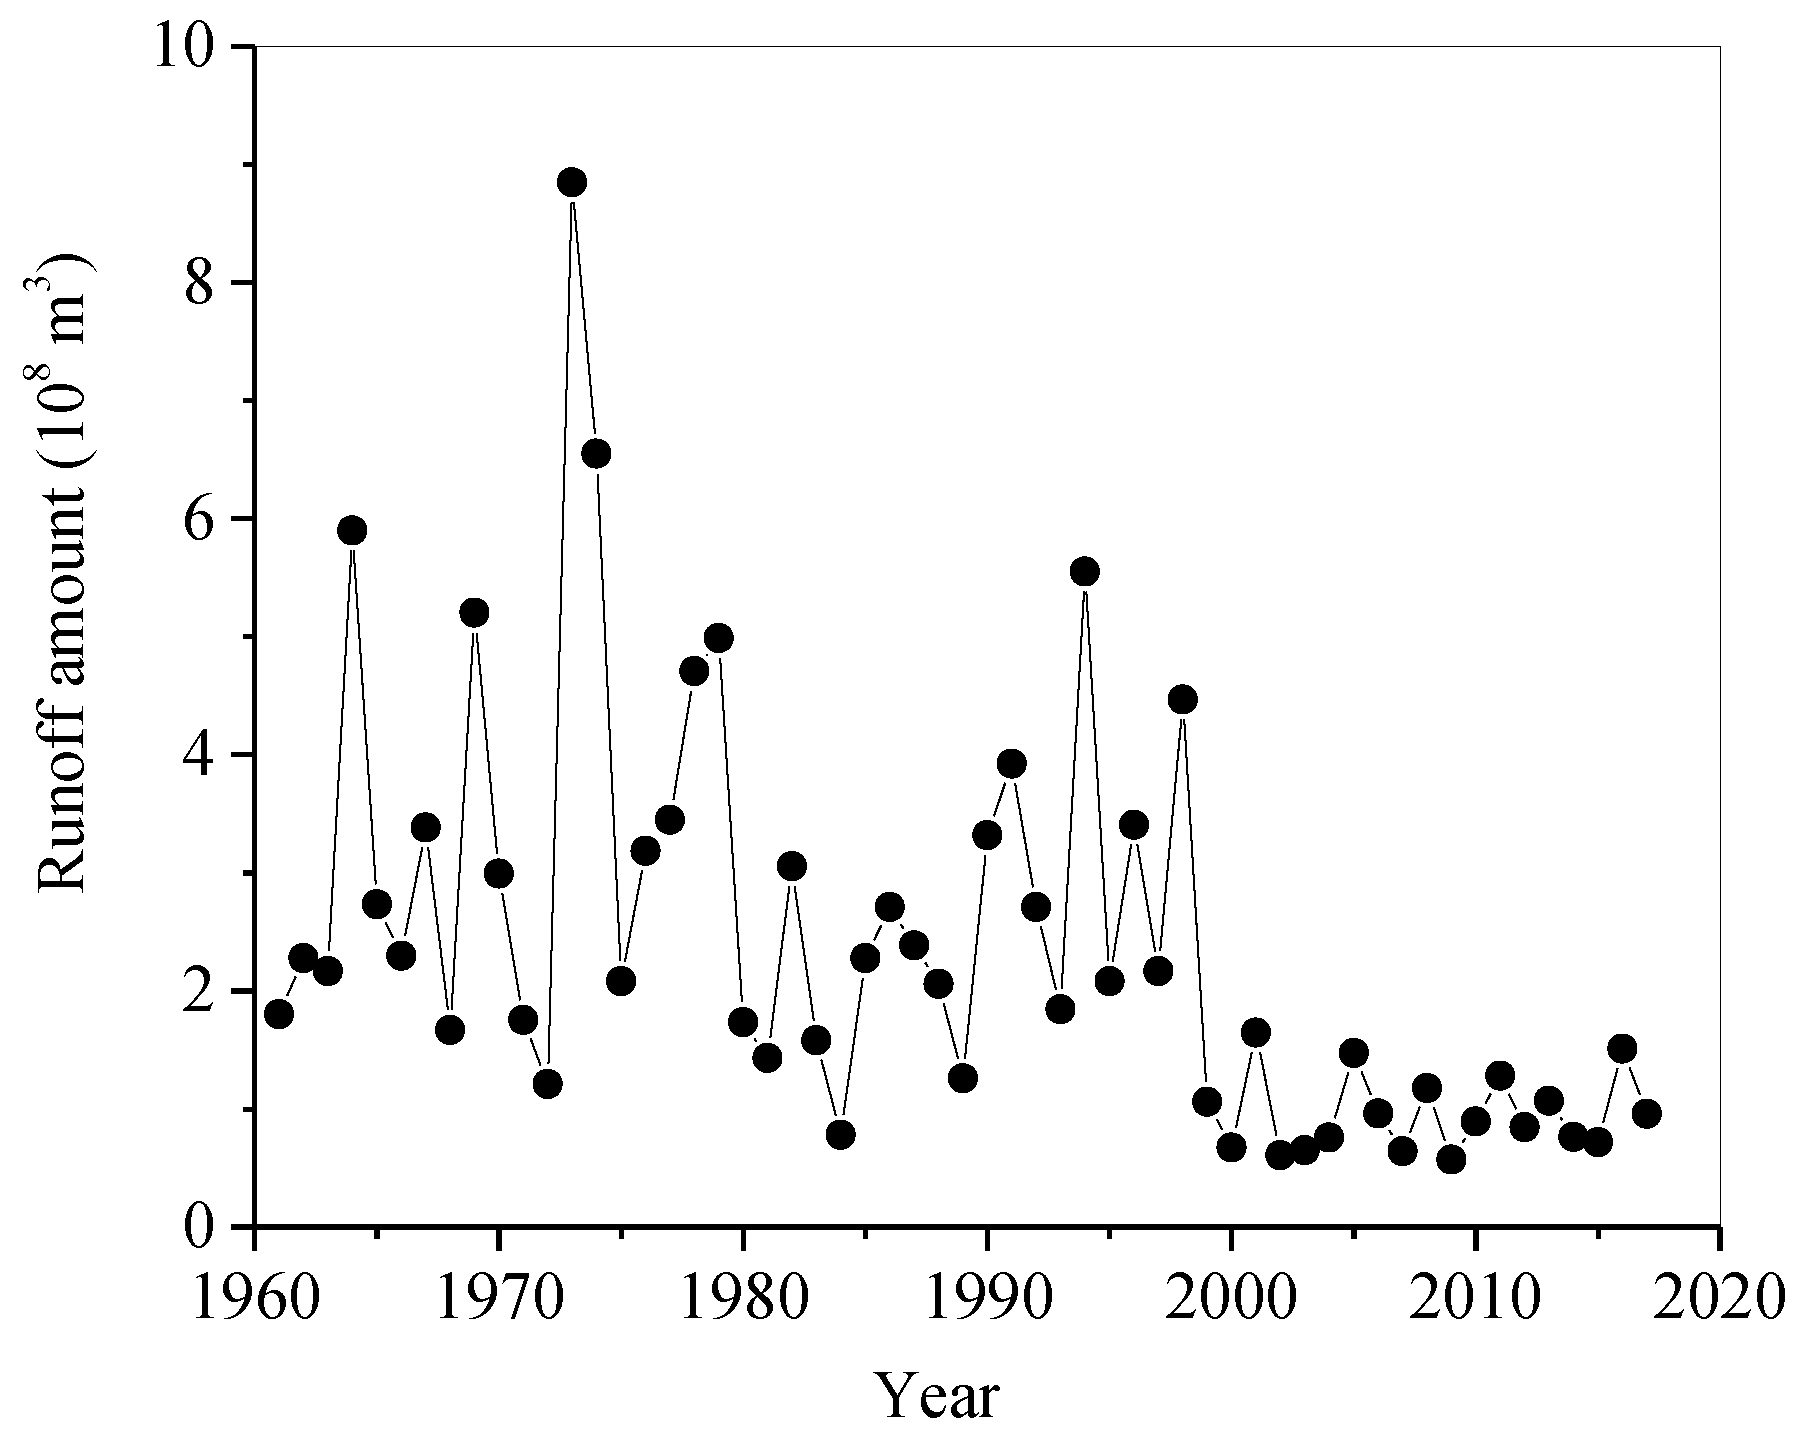
In the study region, the implemented soil conservation measures could play an important role in reducing water inflow into the Miyun Reservoir [6,33]. Since the 1990s, a national soil conservation program has been carried out to reduce soil erosion, and the Miyun Reservoir catchment was selected as the pilot area to implement the national policy, The Return of Agricultural Lands to Forest, in 1999 [20]. Figure 7 demonstrates that the initial time of implementing this program coincided well with a decrease in the annual water discharge from the Chaohe River in the study region, further verifying that the measures could greatly decrease water inflow into the reservoir.
The TP and TN losses were significantly different among the plots because different land use types and soil conservation measures have different surface structures, soil roughness, soil organic carbon, nutrient input from manure, and fertilizer [34]. In the present study, land use type is tightly linked to TN and TP losses, as pointed out by Tang et al. [20], and cultivated and bare lands are the major TN and TP loss area (Figure 5). Bhaduri et al. pointed out that nonpoint pollution increased by 15% when land use changed from woodland to arable land [35]. Sahu and Gu also indicated that TN loss can be effectively reduced by around 30% through establishing vegetation buffer strips in a watershed [36].
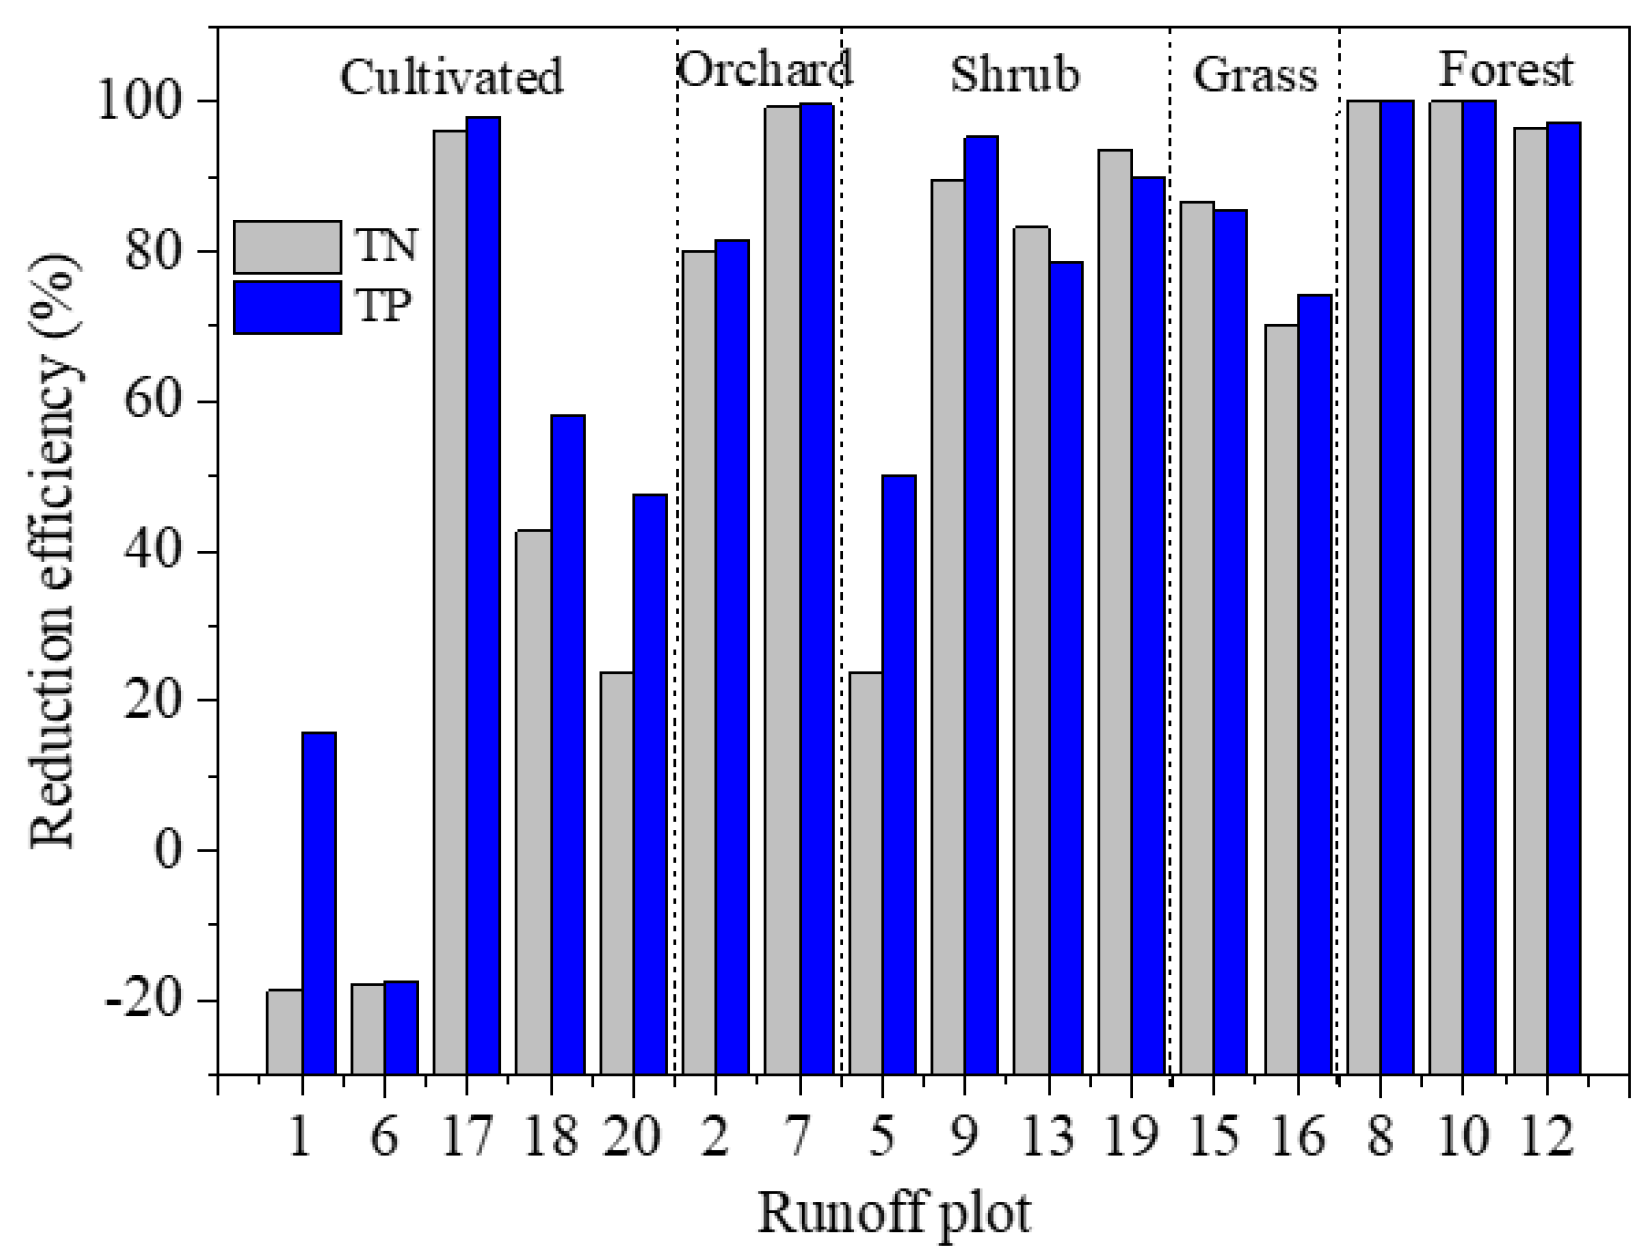
Water quantity and quality are the two problems for the Miyun Reservoir, both of which can lead to water resource use and should be considered comprehensively [22]. With decreasing river discharge, water pollution can cause serious problems for the water supply in this region. For example, the Guanting Reservoir had to be excluded as a source of drinking water in Beijing in 1997 because of severe contamination [8]. In the study region, the vegetated plots greatly reduced TN and TP losses (Figure 8), and a large amount of runoff was also intercepted that decreased downstream water quantity (Figure 4). In the study area, Wang et al. concluded that 68% of the decreased water inflow was caused by human activities [22]. A similar result was also found in the study region of [37]. On the contrary, more runoff and more nutrient losses (i.e., TN and TP) occurred on the bare and cultivated plots with the exception of the terraced Plot 17. Noticeably, contour tillage can greatly decrease TN and TP losses from a cultivated plot (i.e., Plot 18), and also allows more runoff to run downslope. This implies that contour tillage should be preferred for cultivated and bare lands in the study region. However, due to scale effect, specific contributions of these measures to downstream water resource in the Miyun Reservoir should be further investigated in future studies.
5. Conclusions
This study advances research on the variations of runoff, soil loss, TN, and TP losses from runoff plots in the Shixia catchment, northern China. The variations of runoff, sediment, and nutrient were mainly driven by rainfall characteristics, land use types, soil conservation measures, and slope gradients. High intensity rainfall with long RD has a significant impact on the bare and cultivated plots. Particulate TN and TP losses were higher in these plots than those in vegetated plots where most of the TP and TN were lost in dissolved status. Masked by the implemented measures, the impacts of slope gradient on soil erosion, as well as TN and TP losses were not evident in the study area. Annual sediment and nutrients were exported out in several rainstorms and surface runoff explained 10–96% of the dissolved nutrients.
In the study region, terrace and vegetation measures such as grass, shrub, and forest can effectively trap sediment, TN, and TP. Bare and cultivated plots without measures were the main sediment and nutrients source areas. From the perspective of considering both water quantity and quality for the Miyun Reservoir, contour tillage is preferred for the cultivated and bare lands in the study region. Further studies should be conducted to explore individual contributions of different soil conservation measures to the downstream water resource under different rainfall characteristics.
Funding
This work was financially funded by the National Natural Science Foundation of China (grant number 41977066) and the Beijing Natural Science Foundation (grant number 8202045).
Institutional Review Board Statement
Not applicable.
Informed Consent Statement
Not applicable.
Data Availability Statement
The data presented in the present study are available on request from the corresponding author.
Acknowledgments
Great thanks were owed to the Soil and Water Conservation Monitoring Station in Shixia, Beijing where data was monitored and those two anonymous referees for their invaluable suggestions to improve this article.
Conflicts of Interest
The author declares no conflict of interest.
References
- Alatorre, L.C.; Beguería, S.; Lana-Renault, N.; Navas, A.; García-Ruiz, J.M. Soil erosion and sediment delivery in a mountain catchment under scenarios of land use change using a spatially distributed numerical model. Hydrol. Earth Syst. Sci. 2012, 16, 1321–1334. [Google Scholar] [CrossRef] [Green Version]
- Damnati, B.; Ibrahimi, S.; Radakovitch, Q. Quantifying erosion using 137Cs and 210Pb in cultivated soils in three Mediterranean watershed: Synthesis study from El Hachef, Raouz and Nakhla (North West Morocco). J. Afr. Earth Sci. 2013, 79, 50–57. [Google Scholar] [CrossRef]
- Wuepper, D.; Borrelli, P.; Finger, R. Countries and the global rate of soil erosion. Nat. Sustain. 2020, 3, 51–55. [Google Scholar] [CrossRef]
- Janeau, J.L.; Gillard, L.C.; Jouquet, P.; Quynh, L.T.P.; Minh, L.T.N.; Anh, N.Q.; Orange, D.; Rinh, P.D.; Toan, T.D.; Hai, T.S.; et al. Soil erosion, dissolved organic carbon and nutrient losses under different land use systems in a small catchment in northern Vietnam. Agric. Water Manag. 2014, 146, 314–323. [Google Scholar] [CrossRef]
- Li, Y.; Kayode, K.S.; Huang, Z.G.; Guo, H.; Wei, L.C.; Abegunrin, T.P.; Gu, M.H.; Qin, Z.H. Particulate N and P exports from sugarcane growing watershed are more influenced by surface runoff than fertilization. Agric. Ecosyst. Environ. 2020, 302, 107087. [Google Scholar] [CrossRef]
- Qiu, J.L.; Shen, Z.Y.; Hou, X.S.; Xie, H.; Leng, G.Y. Evaluating the performance of conservation practices under climate change scenarios in the Miyun Reservoir Watershed, China. Ecol. Eng. 2020, 143, 105700. [Google Scholar] [CrossRef]
- Valentin, C.; Agus, F.; Alamban, R.; Boosaner, A.; Bricquet, J.P.; Chaplot, V.; de Guzman, T.; de Rouw, A.; Janeau, J.L.; Orange, D.; et al. Runoff and sediment losses from 27 upland catchments in SoutheastAsia: Impact of rapid land use changes and conservation practices. Agric. Ecosyst. Environ. 2008, 128, 225–238. [Google Scholar] [CrossRef]
- Qiu, J.L.; Shen, Z.Y.; Huang, M.Y.; Zhang, X.S. Exploring effective best management practices in the Miyun reservoir watershed, China. Ecol. Eng. 2018, 123, 30–42. [Google Scholar] [CrossRef]
- Wang, Z.J.; Hong, J.M.; Du, G.S. Use of satellite imagery to assess the trophic state of Miyun Reservoir, Beijing, China. Environ. Pollut. 2008, 155, 13–19. [Google Scholar]
- Gao, Y.; Yao, Z.; Liu, B.; Lv, A.F. Evolution trend of Miyun Reservoir inflow and its motivating factors analysis. Prog. Geogr. 2002, 2, 546–553. [Google Scholar]
- Ma, H.; Yang, D.W.; Tan, S.K.; Gao, B.; Hu, Q.F. Impact of climate variability and human activity on streamflow decrease in the Miyun Reservoir catchment. J. Hydrol. 2010, 389, 317–324. [Google Scholar] [CrossRef]
- Yan, T.Z.; Bai, J.W.; Arsenio, T.; Liu, J.; Shen, Z.Y. Future climate change impacts on streamflow and nitrogen exports based on CMIP5 projection in the Miyun Reservoir Basin, China. Ecohydrol. Hydrobiol. 2019, 19, 266–278. [Google Scholar] [CrossRef]
- Zhang, P.; Liu, Y.H.; Pan, Y.; Yu, Z.R. Land use pattern optimization based on CLUE-S and SWAT models for agricultural non-point source pollution control. Math. Comput. Model. 2013, 58, 588–595. [Google Scholar] [CrossRef]
- Zhang, L.; Zou, Z.H.; Shan, W. Development of a method for comprehensive water quality forecasting and its application in Miyun reservoir of Beijing, China. J. Environ. Sci. 2016, 56, 240–246. [Google Scholar] [CrossRef]
- Xu, W.; Cai, Y.P.; Yin, X.N.; Yan, H.; Zhang, L. Soil nitrogen supply capacity as an indicator of sustainable watershed management in the upper basin of Miyun Reservoir. Ecol. Indic. 2018, 92, 221–227. [Google Scholar]
- Xu, R.H.; Cai, Y.Q.; Wang, X.; Li, C.H.; Liu, Q.; Yang, Z.F. Agricultural nitrogen flow in a reservoir watershed and its implications for water pollution mitigation. J. Clean. Prod. 2020, 267, 122034. [Google Scholar] [CrossRef]
- Anache, J.A.; Wendland, E.C.; Oliveira, P.T.; Flanagan, D.C.; Nearing, M.A. Runoff and soil erosion plot-scale studies under natural rainfall: A meta-analysis of the Brazilian experience. Catena 2017, 152, 29–39. [Google Scholar] [CrossRef]
- Liang, Y.; Jiao, J.Y.; Tang, B.Z.; Cao, B.T.; Li, H. Response of runoff and soil erosion to erosive rainstorm events and vegetation restoration on abandoned slope farmland in the Loess Plateau region, China. J. Hydrol. 2020, 584, 124694. [Google Scholar]
- Zhang, X.X.; Song, J.X.; Wang, Y.R.; Deng, W.J.; Liu, Y.F. Effects of land use on slope runoff and soil loss in the Loess Plateau of China: A meta-analysis. Sci. Tot. Environ. 2021, 755, 142418. [Google Scholar] [CrossRef]
- Tang, L.H.; Yang, D.W.; Hu, H.P.; Gao, B. Detecting the effect of land-use change on streamflow, sediment and nutrient losses by distributed hydrological simulation. J. Hydrol. 2011, 409, 172–182. [Google Scholar] [CrossRef]
- Fang, H.Y. Responses of runoff and soil loss to rainfall regimes and soil conservation measures on cultivated slopes in a hilly region of Northern China. Int. J. Environ. Res. Public Health 2021, 18, 2102. [Google Scholar] [CrossRef] [PubMed]
- Wang, X.Y.; Hu, Q.J.; Zhu, F.Y.; He, W.; Wang, X.F.; Wang, G. Loss of nutrients in runoff and soil in the watershed of Miyun Reservoir-as an example of Shixia experimental area. J. Cap. Norm. Univ. 2001, 2, 79–85. [Google Scholar]
- Fang, N.F.; Wang, L.; Shi, Z.H. Runoff and soil erosion of field plots in a subtropical mountainous region of China. J. Hydrol. 2017, 522, 387–395. [Google Scholar] [CrossRef]
- Fang, H. Impacts of soil conservation measures on runoff and soil loss in a hilly region, Northern China. Agric. Water. Manag. 2021, 247, 106740. [Google Scholar]
- Wen, Z.; Brian, G.; Jiao, F.; Lei, W.; Shi, H. Stratified vegetation cover index: A new way to assess vegetation impact on soil erosion. Catena 2010, 83, 87–93. [Google Scholar]
- Cerdan, O.; Govers, G.; Le Bissonais, Y.; Van Oost, K.; Poesen, J.; Saby, N.; Gobin, A.; Vacca, A.; Quinton, J.; Auerswald, K.; et al. Rates and spatial variations of soil erosion in Europe: A study based on erosion plot data. Geomorphology 2010, 122, 167–177. [Google Scholar] [CrossRef]
- Maetens, W.; Vanmaercke, M.; Poesen, J.; Jankauskas, B.; Jankauskiene, G.; Ionita, I. Effects of land use on annual runoff and soil loss in Europe and the Mediterranean: A meta-analysis of plot data. Prog. Phys. Geogr. 2012, 36, 599–653. [Google Scholar] [CrossRef]
- Adimassu, Z.; Tamene, L.; Degefie, D.T. The influence of grazing and cultivation on runoff, soil erosion, and soil nutrient export in the central highlands of Ethiopia. Ecol. Process. 2020, 9, 23. [Google Scholar] [CrossRef]
- Quinton, J.N.; Catt, J.A.; Hess, T.M. The selective removal of phosphorus from soil: Is event size important. J. Environ. Qual. 2001, 30, 538–545. [Google Scholar] [CrossRef] [Green Version]
- Meybeck, M. Carbon, nitrogen, and phosphorus transport by world rivers. Am. J. Sci. 1982, 282, 401–450. [Google Scholar] [CrossRef]
- Zhang, G.H.; Liu, G.B.; Wang, G.L.; Wang, Y.X. Effects of vegetation cover and rainfall intensity on sediment-bound nutrient loss, size composition and volume fractal dimension of sediment particles. Pedosphere 2011, 21, 676–684. [Google Scholar] [CrossRef]
- Wang, X.; Zang, N.; Liang, P.Y.; Cai, Y.P.; Li, C.H.; Yang, Z.F. Identifying priority management intervals of discharge and TN/TP concentration with copula analysis for Miyun Reservoir inflows, North China. Sci. Tot. Environ. 2017, 609, 1258–1269. [Google Scholar] [CrossRef]
- Hormann, G.; Horn, A.; Fohrer, N. The evaluation of land-use options in mesoscale catchments prospects and limitations of eco-hydrological models. Ecol. Modell. 2005, 187, 3–14. [Google Scholar] [CrossRef]
- Wang, S.P.; Zhang, Z.Q.; McVicar, T.R.; Guo, J.T.; Tang, Y.; Yao, A.K. Isolating the impacts of climate change and land use change on decadal streamflow variation: Assessing three complementary approaches. J. Hydrol. 2013, 507, 63–74. [Google Scholar] [CrossRef]
- Bhaduri, B.; Harbor, J.; Engel, B.; Grove, M. Assessing watershed-scale, long-term hydrologic impacts of land-use change using a GIS-NPS model. Environ. Manag. 2000, 26, 643–658. [Google Scholar] [CrossRef] [PubMed]
- Sahu, M.; Gu, R.R. Modeling the effects of riparian buffer zone and contour strips on stream water quality. Ecol. Eng. 2009, 35, 1167–1177. [Google Scholar] [CrossRef]
- Li, Z.J. Impacts of different allocation plans as soil and water conservation measures on annual runoff in the Chaohe River basin. Bull. Soil Water Conserv. 2010, 30, 108–112. [Google Scholar]
Figure 1.
Site of the experimental station and the runoff plots. The numbers in red color in the lower figure represent runoff plots.
Figure 1.
Site of the experimental station and the runoff plots. The numbers in red color in the lower figure represent runoff plots.

Figure 2.
Total annual and erosive rainfall amounts and the percentages of erosive rainfall to annual total in 2014–2019.
Figure 2.
Total annual and erosive rainfall amounts and the percentages of erosive rainfall to annual total in 2014–2019.

Figure 3.
Rainfall characteristics of the recorded 57 erosive rainfall events in 2014–2019. Note: P represents rainfall amount; RD represents rainfall duration; Im, I30, and I60 represent mean, maximum 30, and maximum 60 rainfall intensity, respectively.
Figure 3.
Rainfall characteristics of the recorded 57 erosive rainfall events in 2014–2019. Note: P represents rainfall amount; RD represents rainfall duration; Im, I30, and I60 represent mean, maximum 30, and maximum 60 rainfall intensity, respectively.

Figure 4.
Runoff depth (a) and soil loss rate (SLR) (b) on the runoff plot. Note: Average values on the bars with the same letter were not significantly different at p = 0.05, as determined by Fisher’ protected least significant difference test.
Figure 4.
Runoff depth (a) and soil loss rate (SLR) (b) on the runoff plot. Note: Average values on the bars with the same letter were not significantly different at p = 0.05, as determined by Fisher’ protected least significant difference test.

Figure 5.
Event-averaged total nitrogen (TN) (a) and total phosphorous (TP) (b) loss rates from the plots in the study area. Note: Average values on the columns with the same letter are not significantly different at p = 0.05, as determined by Fisher’ protected least significant difference test. The numbers on the X axis represent runoff plots. For example, the first number 3 represents Plot 3.

Figure 6.
Contributions of the dissolved TN (a) and TP (b) in runoff and the counterparts in particulate status on the sediment to the total TN and TP losses. The numbers on the X axis represent plots. For example, the first number 3 represents Plot 3.
Figure 6.
Contributions of the dissolved TN (a) and TP (b) in runoff and the counterparts in particulate status on the sediment to the total TN and TP losses. The numbers on the X axis represent plots. For example, the first number 3 represents Plot 3.

Figure 7.
Annual water inflow into the Miyun Reservoir from the Chaohe River (data from Hydrological Data of Haihe River Basin, Annual Hydrological Report).
Figure 7.
Annual water inflow into the Miyun Reservoir from the Chaohe River (data from Hydrological Data of Haihe River Basin, Annual Hydrological Report).

Figure 8.
Reduction efficiencies of annual TN and TP losses by soil conservation measures. The numbers on the X axis represent plots. For example, the first number 1 represents Plot 1.
Figure 8.
Reduction efficiencies of annual TN and TP losses by soil conservation measures. The numbers on the X axis represent plots. For example, the first number 1 represents Plot 1.


Table 1.
Information of the selected 18 runoff plots in the study area.
| Land Use | Plot | Slope (°) | Soil Depth (cm) | Land Use and Soil Conservation Measures |
|---|---|---|---|---|
| Bare land | 3 | 16.5 | 30 | - |
| 4 | 14.4 | 20 | - | |
| Cultivated | 1 | 16.5 | 30 | - |
| 6 | 14.4 | 20 | Contour tillage | |
| 17 | 3.5 | 60 | Terrace | |
| 18 | 3.5 | 60 | Contour tillage | |
| 20 | 6.3 | 20 | Contour tillage | |
| Orchard | 2 | 16.5 | 30 | Terrace |
| 7 | 9.4 | 20 | Terrace | |
| Shrub | 5 | 14.4 | 20 | Vitex negundo (coverage, 40–60%) |
| 9 | 27 | 30 | Vitex negundo (coverage, 40–50%) | |
| 13 | 18.6 | 15 | Vitex negundo (coverage, 40–50%) | |
| 19 | 6.3 | 20 | Vitex negundo (coverage, 45–60%) | |
| Grass | 15 | 19 | 15 | Alfalfa (50–60%) |
| 16 | 19 | 15 | Alfalfa (10–15%) | |
| Forest/grass | 8 | 27 | 20 | Robinia and grass (coverage, 90–100%) |
| Forest | 10 | 27 | 20 | Robinia (coverage, 40%); fish-scale pits (size, 1 × 1.5 m) |
| Forest/shrub | 12 | 17.1 | 15 | Platycladus orientalis and robinia pseudoacacia (coverage, 90%); fish-scale pits (size, 1 × 1.5 m) |
Table 2.
TN and TP concentrations in the sediments from different plots (data are from [22]).
Table 2.
TN and TP concentrations in the sediments from different plots (data are from [22]).
| Land Use | Concentrations in Sediment (mg kg−1) | |
|---|---|---|
| TN | TP | |
| Corn | 3240 | 584 |
| Forest | 6920 | 466 |
| Bare | 4220 | 792 |
| Orchard | 7790 | 1070 |
| Grass | 4450 | 602 |
| Corn (contour tillage) | 3560 | 663 |
| Corn (terrace) | 4210 | 437 |
Table 3.
Mean annual surface runoff, soil loss rate (SLR), and nutrient (TN and TP) losses from the plots in 2014–2019. The numbers in the bracket are standard deviations. Average values in the columns with the same letter were not significantly different at p = 0.05, as determined by Fisher’ protected least significant difference test.
| Land Use | Plots | Runoff (mm) | SLR (t km−2 yr−1) | TN (t km−2 yr−1) | TP (t km−2 yr−1) |
|---|---|---|---|---|---|
| Bare | 3 | 75.2 (34.5) a | 3047.2 (2048.7) b | 334.8 (298.3) a | 27.1 (29.2) a |
| 4 | 67.3 (39.9) ab | 4221.8 (2287.4) a | 292.0 (265.3) ab | 17.7 (17.6) ab | |
| Mean | 71.2 (35.8) a | 3634.5 (2159.3) ab | 313.4 (270.1) a | 22.4 (23.5) ab | |
| Cultivated | 1 | 74.7 (23.7) a | 3198.1 (1222.4) ab | 376.5 (312.4)a | 19.9 (20.1) ab |
| 6 | 69.8 (21.0) ab | 2453.1 (944.3) b | 377.7 (350.3) a | 28.6 (24.0) a | |
| 17 | 3.9 (4.2) c | 4.1 (3.5) d | 13.0 (14.8) b | 0.5 (0.6) c | |
| 18 | 67.7 (21.3) ab | 165.4 (83.6) d | 187.6 (100.4) ab | 10.5 (11.7) bc | |
| 20 | 69.5 (21.8) ab | 549.9 (261.4) cd | 248.0 (71.1) | 13.0 (8.0) bc | |
| Mean | 57.1 (32.8) b | 1274.1 (1474.6) c | 240.5 (244.2) ab | 14.5 (17.2) ab | |
| Orchard | 2 | 9.4 (10.7) c | 172.5 (246.1) d | 64.6 (125.2) b | 4.6 (9.4) c |
| 7 | 1.6 (3.9) c | 0.5 (1.2) d | 2.5 (6.1) b | 0.1 (0.3) c | |
| Mean | 5.5 (8.7) c | 86.5 (188.7) d | 33.5 (90.5) b | 2.4 (6.7) c | |
| Shrub | 5 | 13.4 (10.2) c | 201.8 (326.2) d | 248.9 (509.4) ab | 12.5 (23.9) bc |
| 9 | 3.2 (6.4) c | 8.4 (19.8) d | 34.1 (80.4) b | 1.2 (2.6) c | |
| 13 | 8.8 (8.2) c | 10.9 (11.7) d | 55.4 (51.9) b | 5.4 (6.6) c | |
| 19 | 5.2 (5.5) c | 14.3 (29.4) d | 21.6 (26.9) b | 2.6 (4.3) c | |
| Mean | 7.7 (8.3) c | 58.8 (174.8) d | 90.1 (259.8) b | 5.4 (12.6) bc | |
| Grass | 15 | 5.8 (6.4) c | 6.5 (11.7) d | 43.7 (48.4) b | 3.7 (5.6) c |
| 16 | 20.1 (11.2) c | 247.9 (280.8) d | 96.5 (56.7) b | 6.4 (7.1) bc | |
| Mean | 13.0 (11.5) c | 172.2 (227.6) d | 70.1 (57.3) b | 5.0 (6.2) bc | |
| Forest | 8 | 0.0 (0.0) c | 0.0 (0.0) d | 0.0 (0.0) b | 0.0 (0.0) c |
| 10 | 0.0 (0.0) c | 0.0 (0.0) d | 0.0 (0.0) b | 0.0 (0.0) c | |
| 12 | 5.2 (7.3) c | 19.0 (43.7) d | 11.1 (14.7) b | 0.7 (0.8) c | |
| Mean | 1.7 (4.7) c | 6.3 (25.4) d | 3.7 (9.6) b | 0.2 (0.6) c |
Table 4.
The matrix of Pearson correlation coefficients among the five rainfall properties of the 57 erosive rainfall events, runoff depth (H) and soil loss rate (SLR), during 2014–2019.
Table 4.
The matrix of Pearson correlation coefficients among the five rainfall properties of the 57 erosive rainfall events, runoff depth (H) and soil loss rate (SLR), during 2014–2019.
| RD | P | Im | I30 | I60 | ||
|---|---|---|---|---|---|---|
| H | P1 | 0.271 * | 0.641 ** | 0.080 | 0.539 ** | 0.394 ** |
| P2 | 0.379 ** | 0.419 ** | −0.137 | 0.205 | 0.125 | |
| P3 | 0.333 * | 0.596 ** | 0.049 | 0.464 ** | 0.361 ** | |
| P4 | 0.256 | 0.538 ** | 0.081 | 0.481 ** | 0.357 ** | |
| P5 | 0.123 | 0.305 * | 0.173 | 0.407 ** | 0.285 * | |
| P6 | 0.236 | 0.569 ** | 0.148 | 0.655 ** | 0.463 ** | |
| P7 | 0.566 ** | 0.536 ** | −0.137 | 0.202 | 0.117 | |
| P9 | −0.102 | 0.168 | 0.213 | 0.112 | 0.298 * | |
| P12 | 0.271 * | 0.589 ** | −0.030 | 0.117 | 0.138 | |
| P13 | 0.085 | 0.258 | 0.195 | 0.395 ** | 0.238 | |
| P15 | 0.222 | 0.363 * | 0.192 | 0.362 ** | 0.231 | |
| P16 | 0.212 | 0.551 ** | 0.165 | 0.524 ** | 0.402 ** | |
| P17 | 0.439 ** | 0.674 ** | −0.034 | 0.326 * | 0.281 * | |
| P18 | 0.363 ** | 0.640 ** | −0.022 | 0.517 ** | 0.357 ** | |
| P19 | 0.297 * | 0.371 ** | −0.039 | 0.121 | 0.083 | |
| P20 | 0.272 * | 0.649 ** | 0.087 | 0.548 ** | 0.408 ** | |
| SLR | P1 | −0.025 | 0.349 ** | 0.234 | 0.489 ** | 0.391 ** |
| P2 | 0.062 | 0.229 | 0.082 | 0.279 * | 0.133 | |
| P3 | −0.028 | 0.288 * | 0.229 | 0.403 ** | 0.349 ** | |
| P4 | −0.122 | 0.262 * | 0.292 * | 0.423 ** | 0.371 ** | |
| P5 | −0.100 | 0.093 | 0.175 | 0.201 | 0.150 | |
| P6 | 0.064 | 0.375 ** | 0.192 | 0.465 ** | 0.392 ** | |
| P7 | 0.366 ** | 0.416 ** | −0.101 | 0.120 | 0.005 | |
| P9 | −0.134 | 0.050 | 0.226 | 0.077 | 0.242 | |
| P12 | 0.495 ** | 0.431 ** | −0.086 | 0.266 * | 0.240 | |
| P13 | −0.158 | −0.009 | 0.211 | 0.317 * | 0.139 | |
| P15 | −0.097 | 0.017 | 0.228 | 0.201 | 0.081 | |
| P16 | −0.049 | 0.310 * | 0.108 | 0.174 | 0.214 | |
| P17 | 0.012 | 0.364 ** | 0.122 | 0.212 | 0.295 * | |
| P18 | −0.074 | 0.311 * | 0.105 | 0.284 * | 0.299 * | |
| P19 | 0.033 | −0.018 | −0.074 | −0.055 | −0.080 | |
| P20 | 0.338 ** | 0.521 ** | 0.056 | 0.396 ** | 0.389 ** |
Note: P1, p2, …, P20 represent the runoff plots. “*” and “**” represent significant at p = 0.05 and 0.01, respectively.
Table 5.
Pearson correlation coefficients among annual runoff depth (AH), annual soil loss rate (ASLR), total nitrogen (TN), and total phosphorus (TP) losses.
Table 5.
Pearson correlation coefficients among annual runoff depth (AH), annual soil loss rate (ASLR), total nitrogen (TN), and total phosphorus (TP) losses.
| H | SLR | TN | TP | |
|---|---|---|---|---|
| H | 1 | |||
| ASLR | 0.787 ** | 1 | ||
| TN | 0.913 ** | 0.821 ** | 1 | |
| TP | 0.888 ** | 0.830 ** | 0.966 ** | 1 |
Note: “**” represent significant at p = 0.01.
Table 6.
Parameters of regression function y = a + b * H between event runoff depth (H) and TN and TP losses from each type of plots during the study period. Note: H represent runoff depth.
Table 6.
Parameters of regression function y = a + b * H between event runoff depth (H) and TN and TP losses from each type of plots during the study period. Note: H represent runoff depth.
| Land Use | TN | TP | |||||||
|---|---|---|---|---|---|---|---|---|---|
| Plots | a | b | Adj. R2 | Sig. | a | b | Adj. R2 | Sig. | |
| Bare | 3, 4 | 4.35 | 3.82 | 0.22 | 0.000 | 0.34 | 0.27 | 0.17 | 0.000 |
| Cultivated | 1, 6, 17, 18, 20 | 3.82 | 3.58 | 0.22 | 0.000 | 0.10 | 0.24 | 0.22 | 0.000 |
| Orchard | 2, 7 | −0.05 | 6.20 | 0.55 | 0.000 | −0.01 | 0.59 | 0.71 | 0.000 |
| Shrub | 5, 9, 13, 19 | −2.62 | 14.96 | 0.20 | 0.000 | −0.06 | 0.77 | 0.42 | 0.000 |
| Grass | 15, 16 | 3.56 | 1.57 | 0.09 | 0.000 | 0.03 | 0.37 | 0.45 | 0.000 |
| Forest | 12 | 0.02 | 2.11 | 0.92 | 0.000 | 0.01 | 0.12 | 0.92 | 0.000 |
Publisher’s Note: MDPI stays neutral with regard to jurisdictional claims in published maps and institutional affiliations. |
© 2021 by the author. Licensee MDPI, Basel, Switzerland. This article is an open access article distributed under the terms and conditions of the Creative Commons Attribution (CC BY) license (https://creativecommons.org/licenses/by/4.0/).
Share and Cite
MDPI and ACS Style
Fang, H. The Effect of Soil Conservation Measures on Runoff, Soil Erosion, TN, and TP Losses Based on Experimental Runoff Plots in Northern China. Water 2021, 13, 2334. https://doi.org/10.3390/w13172334
AMA Style
Fang H. The Effect of Soil Conservation Measures on Runoff, Soil Erosion, TN, and TP Losses Based on Experimental Runoff Plots in Northern China. Water. 2021; 13(17):2334. https://doi.org/10.3390/w13172334
Chicago/Turabian StyleFang, Haiyan. 2021. "The Effect of Soil Conservation Measures on Runoff, Soil Erosion, TN, and TP Losses Based on Experimental Runoff Plots in Northern China" Water 13, no. 17: 2334. https://doi.org/10.3390/w13172334
Note that from the first issue of 2016, this journal uses article numbers instead of page numbers. See further details here.