Article

Response of Merlot Grapevine to Drought Is Associated to Adjustments of Growth and Nonstructural Carbohydrates Allocation in above and Underground Organs

1
Department of Agricultural Food, Animal and Environmental Sciences, University of Udine, Via delle Scienze 206, 33100 Udine, Italy
2
Department of Life Sciences, University of Trieste, Via Licio Giorgieri, 5, 34127 Trieste, Italy
*
Author to whom correspondence should be addressed.
Co-first author, these authors contributed equally to this work.
Water 2021, 13(17), 2336; https://doi.org/10.3390/w13172336
Submission received: 22 July 2021 / Revised: 16 August 2021 / Accepted: 24 August 2021 / Published: 26 August 2021

Abstract

:
Studying changes in partitioning of dry matter and nonstructural carbohydrates (NSC) content in both aboveground and underground perennial tissues in drought-affected grapevines could provide insights into plant response and carbon allocation strategies during stress periods. The analysis of soluble NSC and starch content in leaf petioles, due to their role in hydraulic segmentation, should also be considered. In the present research, these aspects have been investigated in Merlot grapevines grown in pots and subjected to progressive and increasing soil dehydration, and in well-irrigated vines. Drought conditions caused drastic reduction of shoot elongation and total plant leaf area development in favor of a greater biomass allocation and partitioning towards roots, where most of the NSC reserves were also conserved. Dry matter content of the perennial organs increased in stressed vines due to growth reduction, allocation of carbon reserves and possible anatomical modifications. Vines subjected to drought showed a higher NSC content in petioles, supporting the hypothesis that they are involved as compatible solutes in osmotic adjustments.

1. Introduction

It has been ascertained that future global warming scenarios will increase the drought risk in most cultivated regions in the next several decades [1,2,3]. Drought can seriously affect crop yield and quality, and, in exceptional cases, crop survival [4,5,6]. Where applicable, irrigation practices are largely adopted to compensate seasonal water deficit, even though such practices may also generate negative environmental aftermaths [7]. In this context, agricultural research must deal with this emerging problem by either optimizing water usage or creating more tolerant/resistant breeds. To achieve these objectives a deeper understanding on the responses and on the mechanisms implemented by plants under stress conditions is needed. Grapevine (Vitis vinifera L.) is mostly cultivated in Mediterranean climate areas but has been also gradually expanding to other climatic regions. Grapevine has demonstrated a high phenotypic plasticity and is considered as a model perennial plant in many studies in plant science. Under water deficit conditions, stomatal closure is one of the main physiological responses adopted by plants and could have strong effects on plant carbon balance. The regulation of stomatal closure in relation to the water potential has been proposed as a crucial discriminant between two distinct behaviors: isohydricity and anisohydricity [8]. Moreover, Schultz [9] demonstrated that in grapevines both of these behaviors are present, but this categorization is not strictly genotype-dependent and could be influenced by environmental factors [10,11]. Thus, there is no clear evidence on which of the two behaviors is most performant under drought [12]. Even though Hochberg et al. [10] suggested that the terminology should be reconsidered, it is still considered convenient. Isohydric plants are more prone to stomatal closure and therefore are more subject to carbon starvation; as opposite, the anisohydric varieties, accepting a major risk of dehydration, can maintain high photosynthetic rates during water shortages. The sugars produced by photosynthesis are mainly allocated in three ways: i. consumed by the primary or secondary metabolism; ii. invested in new growth; or iii. accumulated in the reproductive organs or stored in the perennial organs. As far as plant metabolism is concerned, there are many chemical compounds and pathways involved in water stress responses that may create complex and aggregated modulations, most of which are not yet fully understood [13,14,15]. The different carbon allocation between sinks (new vegetation or storage organs), and therefore investments in the brief or long term, could have a consistent impact on the carbon balance. Due to water deficit, modifications on the root to shoot ratio have been observed in many plant species [16,17]. In fact, shoot growth is often reduced, favoring root growth, in order to increase water absorption and to explore deeper soil layers [18]. Starch is an amorphous glucose polymer and by far the major carbon reserve compound in the plant kingdom. Starch accounts for the main part of the nonstructural carbohydrates (NSC), and can be efficiently converted in soluble sugars, if necessary [19]. Soluble sugars are primarily involved in plant metabolism but can also play an important role in signaling and osmoprotective processes [20].
This study aims at parsing the multifaceted role of NSC metabolism in plants, investigating the interplay between NSC allocation and partitioning and plant growth as drivers of plant plasticity during water deficit events. We hypothesized that NSC are involved as compatible solutes in osmotic adjustments in vines subjected to drought. We tested such a hypothesis in a trial designed to oblige vines to experience a progressive and increasing soil dehydration, creating favorable conditions for the implementation of adaptive strategies.

2. Materials and Methods

2.1. Plant Material and Modulated Drought Stress Treatment

The experiment was set up in the experimental farm “A. Servadei” of the University of Udine (Udine, Italy) (46°02′ N, 13°13′ E; 88 m a.s.l.) in the summer season 2020. At DOY (day of year) 128 (7 May), 112 one-year-old vines (Vitis vinifera L., VCR—Rauscedo, Italy) cultivar Merlot (clone R18 grafted onto SO4 rootstock) were bed out on 20 L pots filled with a mixture of soil (80%) collected at the farm site (2 cm-sieved, 50% sand and 20% clay) and peat (20%). The experiment was conducted under a tunnel with open sides covered with a polyethylene film to exclude rain watering. At the beginning of June, the tunnel film was whitened with a shade paint (ca 30% light attenuation) to avoid excessive radiation-induced overheating of the air and pots. Vines were arranged on four single rows (1.3 × 0.4 m) with a NW-SE orientation. To limit environmental differences, the rows were divided in two plots (with alternated treatments) consisting of 12 plants each and 2 additional plants at the row heads were disposed as buffers. One shoot was trained vertically, whereas bunches and lateral shoots were regularly removed.
For each vine row, a drip irrigation line was placed with four emitters per pot (PCJ 2 L h−1, Netafim, Hatzerim, Israel), keeping all plants well-watered until the beginning of the experiment. At DOY 205 (23 July) the treatments were set as follows: the control (well-watered, WW) plants were irrigated with 100% of ETLYS (lysimeter evapotranspiration) throughout the experimental period; the stressed vines (water stressed, WS) received 50% of ETLYS up to DOY 237 and then the regime was halved (25%) until DOY 260 (16 September). Irrigation was supplied every day during the night. The daily ETLYS was directly determined as the average water loss calculated on four potted vines (of the group WW) placed each on a scale (self-constructed) that served as a lysimeter. The same system was previously described by Hochberg et al. [21]. Moreover, four other scales were used to monitor the ET in WS plants throughout the experiment.

2.2. Plant Water Status and Gas Exchange Monitoring

On weekly basis, stem water potential (Ψs) and gas exchange parameters were measured on fully expanded leaves throughout the experiment. To assess the Ψs, the leaves were bagged and covered with aluminium foil 1 h before the measures, which took place during sunny days around midday (between 12 am and 2 pm). After that time, the leaves were collected singularly and the petioles were excised using a razor blade. While still bagged, the leaves were immediately placed into a Scholander’s pressure bomb (Soil Moisture Co., Santa Barbara, CA, USA) and pressurized using a nitrogen cylinder. The Ψs was determined when the xylem sap was visibly spurting out from the cut end of the petiole. The weekly data of Ψs were computed to calculate the integral of the accumulated water deficit using the model proposed by Fernández et al. [22]. The plants were transferred to the laboratory the day before the sampling date and maintained in the dark until processing started (at 7 am). The gas exchange parameters were measured using an infrared gas analyzer (LI-6400, LI-COR corp., Lincoln, NE, USA). The measurements were taken at a constant light intensity (1000 μmol m−2 s−1) as well as CO2 concentration (400 μmol mol−1) and ambient temperature and humidity. The intrinsic water use efficiency (iWUE) was calculated by dividing net photosynthesis (PN) by stomatal conductance (gs).

2.3. Morphometric and Biomass Measurements

The evaluations were performed at three sampling times: T0 (pre-treatment); T1, 32 DOE (day of experiment); and T2, 55 DOE. Shoot (at internode between 4th and 5th leaf) and petiole (at 4th leaf) portions were sampled for the NSC analysis. Then, the whole root of each grapevine was discarded from the pot, quickly washed under tap water and thoroughly cleaned with compressed air from soil particles. A pool of three fine root portions (cut approx. 5 cm from the tip, corresponding to the maturation zone of the primary root [23], and with 2.5–3 cm length) was immediately sampled for biochemical analysis.
The remaining roots, main leaves and the whole annual shoot were separately weighed to assess fresh weight (FW). After this step, all leaves of each vine were placed on an optical scanner to estimate their area, enabling the assessment of three morphological characteristics: total leaf area, mean leaf area and leaf number per each vine. Root, leaf and shoot samples were then dried at 70 °C for 48 h to provide the dry biomass weight (DW) and the measurements of their dry matter content (DMC) expressed as mg DW g−1 FW [24] as well as the root-to-shoot ratio (R/S).

2.4. Measurements of Non-Structural Carbohydrates

The extraction of starch and total soluble NSC was performed as described in [25], with the following modifications: after extraction with 80% ethanol, soluble carbohydrates were recovered in the alcoholic supernatant, while the pellet (containing both starch and maltodextrin oligosaccharide fractions) was incubated in 0.5 mL 2 mM HEPES-Tris pH 6.7 at 25 °C overnight. After a 14,000× g centrifugation for 5 min, solubilized maltodextrin oligosaccharides were recovered in the suspension and combined with all soluble carbohydrate fraction (hereinafter referred to as total soluble NSC), whereas the remaining starch in the pellet was processed as already detailed. Starch and total soluble NSC were quantified by the Anthrone assay method [26], as outlined in [27], and expressed as mg of glucose equivalent g−1 DW by using standard solutions of amylose and glucose for calibration curves of starch or soluble sugars, respectively.

2.5. Statistical Analysis

The effect of treatment, time and their interaction on morphometric and biochemical parameters were tested using a two-way analysis of variance (ANOVA). ANOVA assumptions were checked by diagnostic plot of residuals. When necessary, variables were subjected to logarithmic transformation. A posteriori pairwise comparison of means was performed using Tukey’s test (p < 0.05) only where significant interactions were found. Correlations between morphometric and biochemical variables were also assessed by Pearson test.
All the statistical analyses were performed in R statistical software (v. 4.0.3) [28]. Outlier records were detected by the function “outlier Test” of the ‘car’ package [29] and removed from models (where p < 0.01).

3. Results

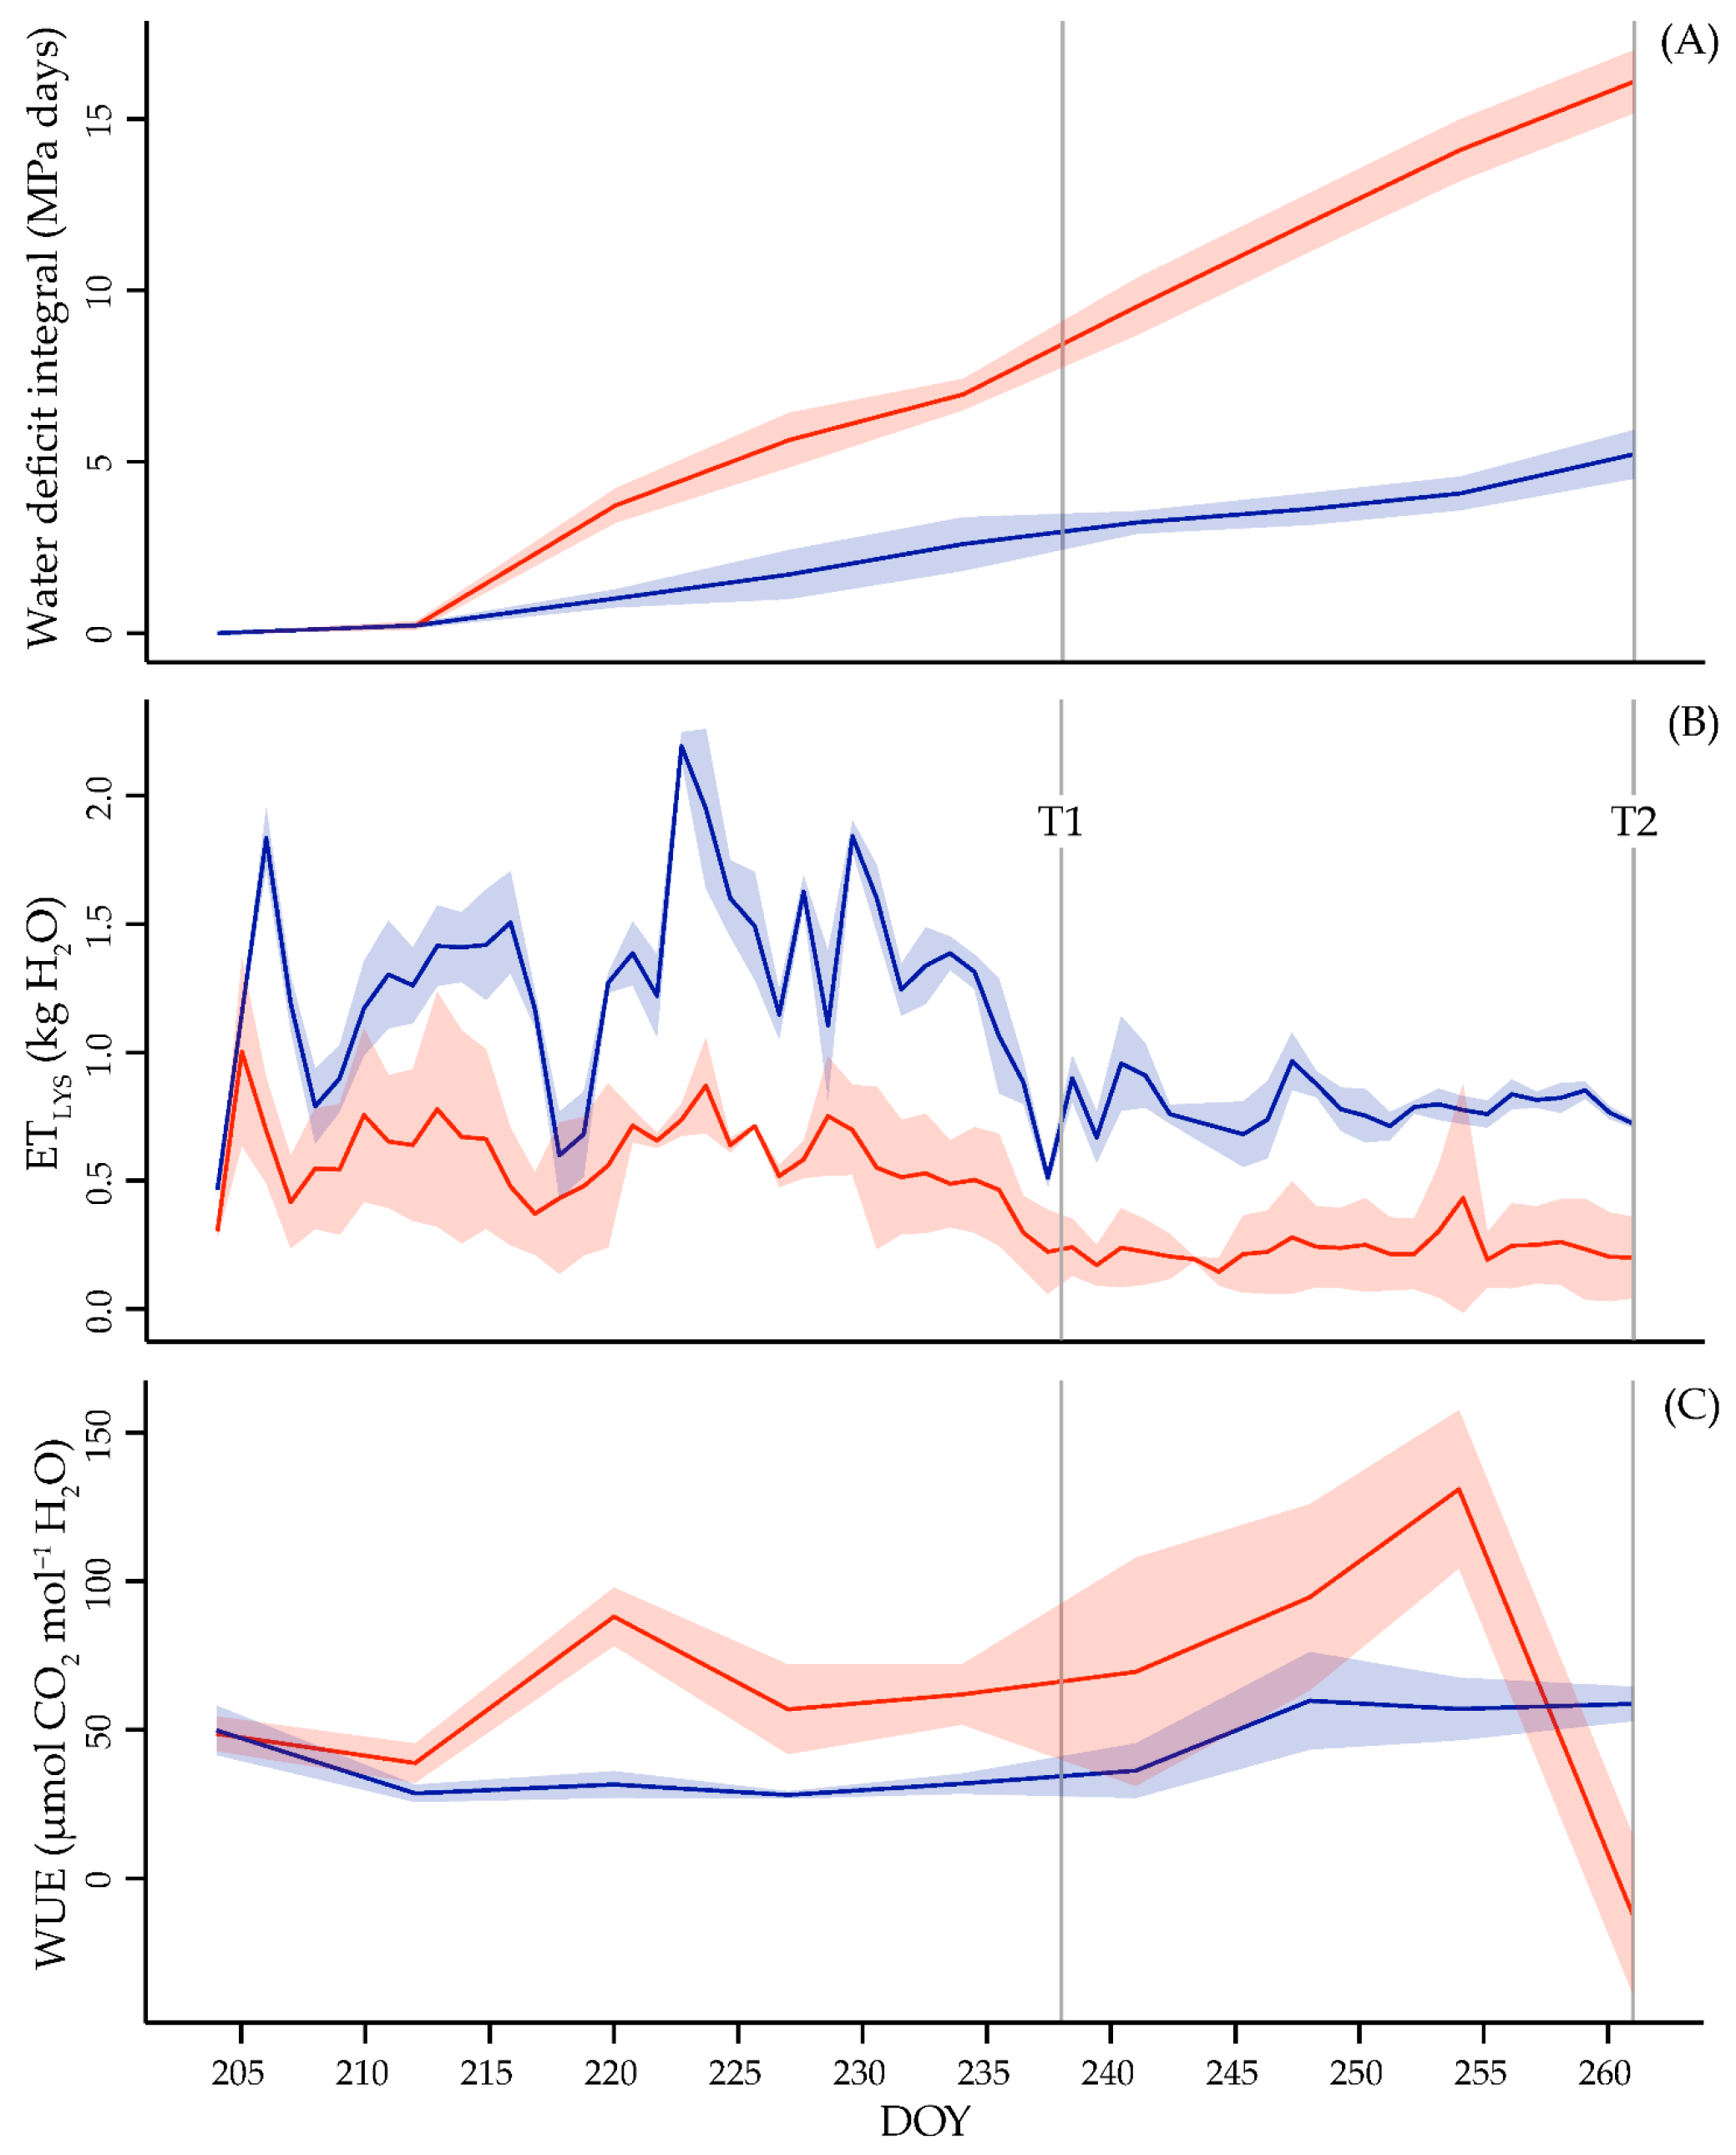
3.1. Water Plant Status and Use Efficiency

The Ψs is a reliable measure to assess plant water status [30]. During the experiment stressed vines reached a minimum value of −0.88 MPa, suggesting that severe dehydration levels were avoided. The trend of the plant water status shows an increasing difference between WW and WS during the experiment (Figure 1A).
WW ETLYS trend (Figure 1B) was closely related to the variability in the environmental conditions. Differently, in case of the WS plants, the daily variation of the ETLYS tended to stabilize as a consequence of the drought progression. Thus, the limited water availability during the stress period obliged WS vines to optimize their water consumption. Intrinsic WUE at leaf level (Figure 1C) was constantly higher in WS plants except for the final measurement when, due to the prolonged water deficit conditions, the values of PN in WS plants suddenly dropped down. Concerning this point, all the considered gas exchange parameters (PN, gs and E) were significantly reduced in WS during the water deficit interval (Figure S1).

3.2. Biomass and Morphometric Traits in Different Organs in Response to Modulated Drought Stress

Root and shoot biomass parameters were consistently correlated in both treatments whereas a lack of a consistent correlation pattern was observed when comparing these variables and leaf morphometric traits (Figure S2).

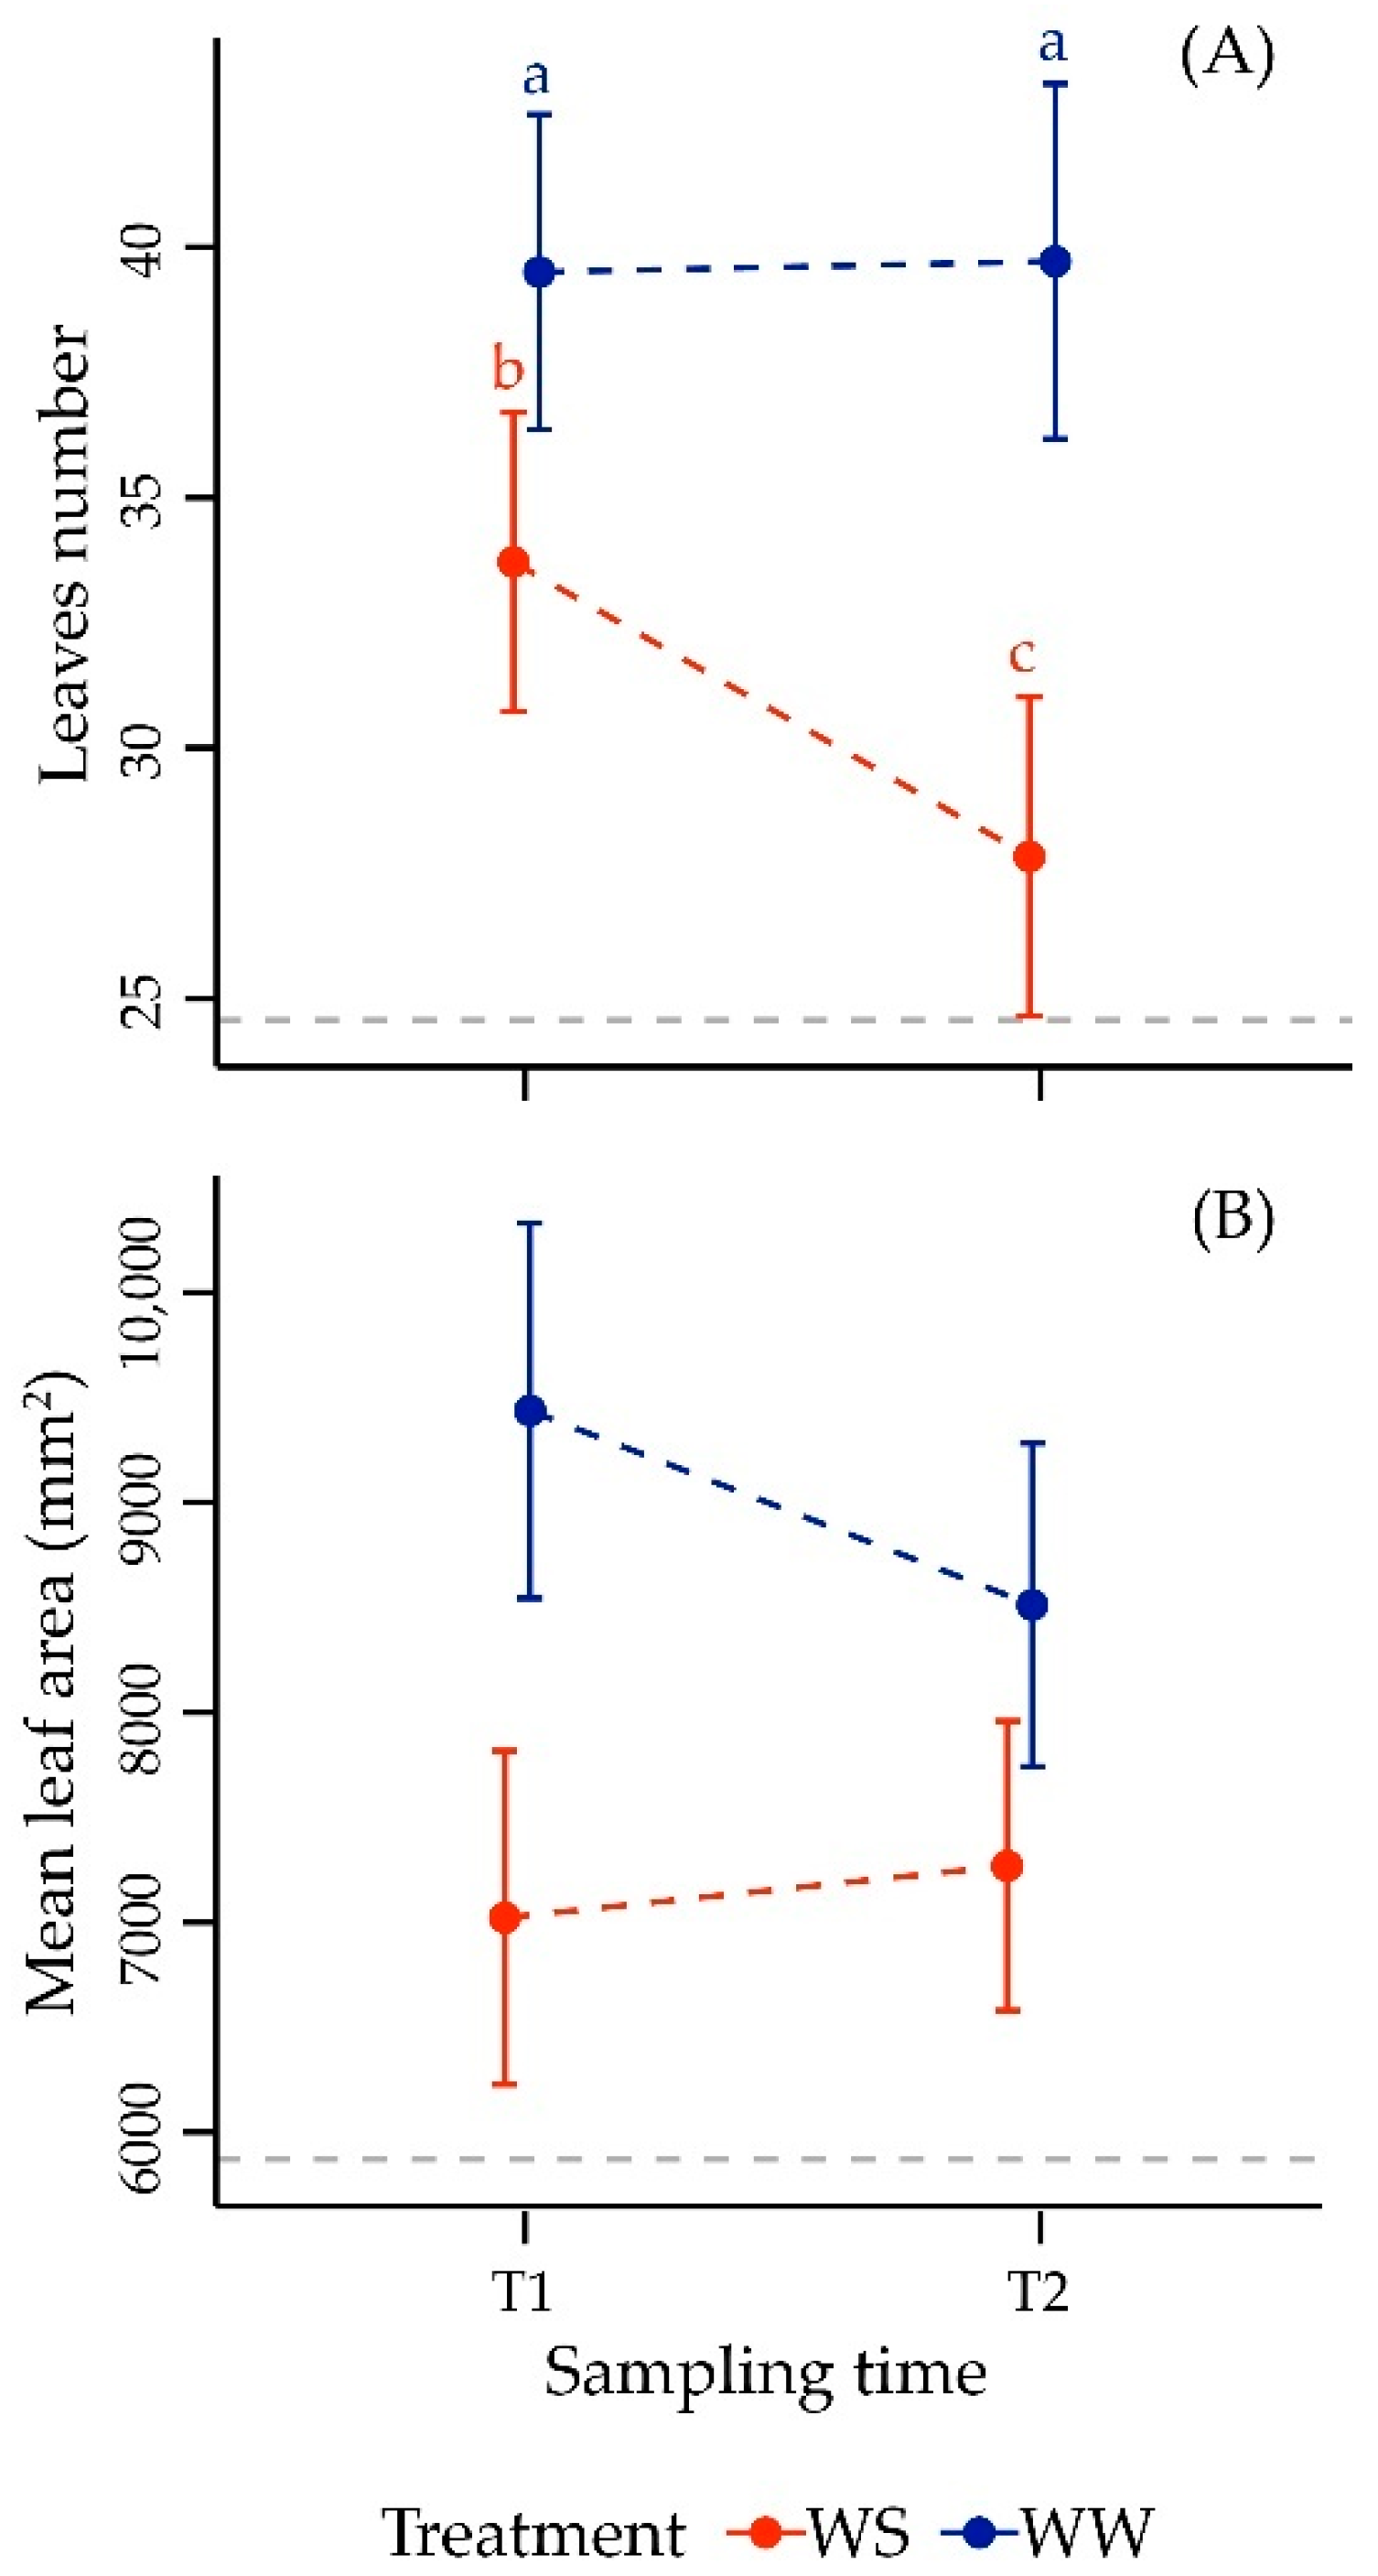
3.2.1. Morphometric Parameters in Leaf

As it is shown in Table 1, a highly significant effect was observed when considering drought-modulated stress factor and the interaction between treatment and time. Water restriction caused a significant reduction in number of leaves per plant at both stages analyzed (Figure 2A). In WS plants the decrease in leaf number at T1 was significant in respect to WW. In September the number of leaves per plant in WS vines was further reduced, whereas an inverse behavior was observed in WW, where this trait remained substantially stable.
Mean leaf area was highly related to the extent of expansion of the foliar lamina in the canopy and, hence, theoretically also to the water status of the plant. The ANOVA results showed that variance in mean leaf area was significantly affected by water supply (Table 1). Notably, mean leaf area changed in an opposite way during the experiment when considering WW and WS, respectively (Figure 2B). Nevertheless, leaves were always constantly smaller in their average size in WS plants, regardless the stress intensity. The difference in leaf size was larger at the first level of stress and then it reduced in September, after the second drought treatment. Distinctly, WW exhibited an enhanced average leaf area only in the early season (starting from the initial value in July of 5870 ± 1164 mm2, dotted grey line in Figure 2B), which declined from August.

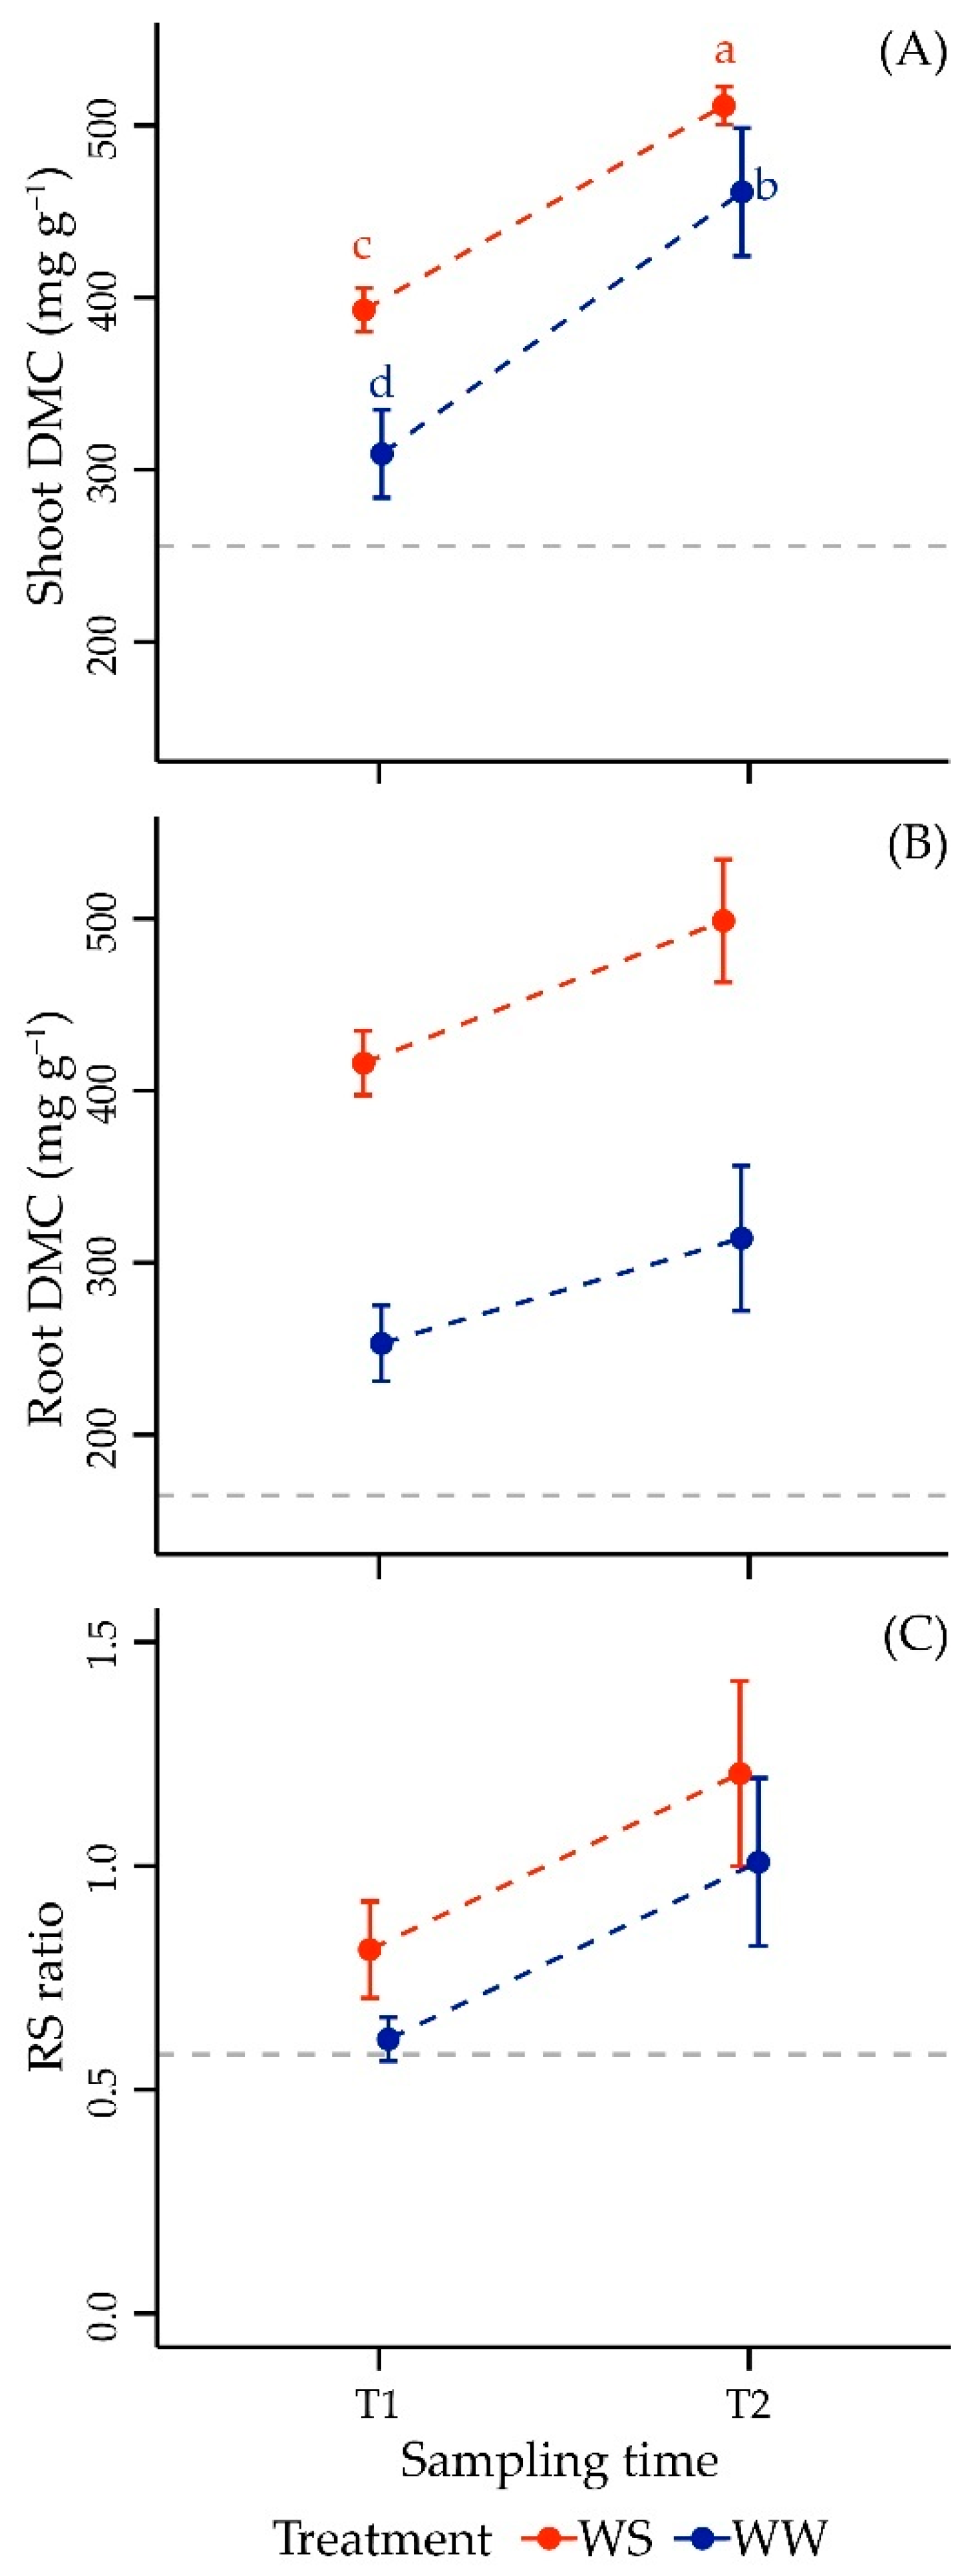
3.2.2. Dry Matter Content and Morphometric Parameters in Shoot

Shoot DMC was mainly predicted by time, drought and their interaction (Table 1).
Accumulation of dry mass in annual shoot increased throughout the season in WW: compared to T0 (dotted grey line, Figure 3A), it showed ~21% growth at T1 in August and +80% at the final sampling time T2. When grapevines were subjected to increasing drought levels over time, shoot DMC was always significantly higher than in irrigated vines at both sampling times, as compared to the control. Similar to what was observed in WW, shoot DMC also continued to significantly grow throughout the season, despite water stress, with a larger change (dry mass was even doubled at the end of the experiment compared to the initial level in July, where in WW the increase was equal to ~80% more of the initial state).
When we consider total shoot DW, chosen as good predictor of organ growth, it was evident that treatment strongly explained most of the variance, while timing was not significant (Table S1). More in detail, in control vines a significant gradual development of the whole annual shoot (as total DW) was detected (Figure S3A). In contrast to what was assessed for DMC, drought stress caused a different effect on total shoot DW, since all stressed vines resulted in an overall reduction in their values compared to well-watered ones. Nonetheless, WS vines continued to grow in their total shoot mass over the whole experiment time, although at a lesser extent, compared to WW. Overall, shoot DW increased by ~176% from the initial level to the one measured at the end of experiment, despite the ongoing severity of drought stress.

3.2.3. Dry Matter Content and Morphometric Parameters in Root

DMC was highly affected over time and by drought in root, though their interaction was not significant, differently to what was shown in shoots (Table 1).
WW plants exhibited an increasing root DMC throughout the period of the experiment (Figure 3B), as well as WS vines. It is noteworthy that water limitation caused a strong significant enhancement in root DMC, as evidenced by the large increase observed in WS in August (+64%) and in September (+59%) compared to their relative control.
Regarding the effect on root growth, estimated as total DW, the variance was significantly described by both time and treatment factors, without any significant interaction among them (Table S1). Specifically, a steep increase of root DW in WW samples was also observed (Figure S3B) over time, reaching three and five-fold greater values than T0 in T1 and T2, respectively. As in shoot, WS vines exhibited a strong reduction in root development, though accompanied by some increase over time. In August, root DW was 19.8 ± 2.76 g (2.5-fold more compared to initial level and −20.5% compared to the respective control) and during the second stress grew to a value of 30.48 ± 4.00 g (a 3.9-fold increase compared to initial level and −27% with respect to its control).

3.2.4. Root-to-Shoot Ratio

ANOVA results highlighted clearly that this variable displayed important changes between treatment and time but not for their interaction (Table 1). Grapevines distributed more biomass in their underground organs than in leaves and shoots at the end of growing season in September, and this physiological aspect was evident in both WS and WW (Figure 3C). In WS samples the ratio was greater than in WW, in both T1 (+33%) and T2 (+20%).
A stronger direct correlation was observed among the R/S ratio and root DMC observed in WS compared to WW (r = 0.853, Figure S2). We also observed a significant negative correlation between root DMC and leaf number found only in WS (r = −0.789, Figure S2).

3.3. Non-Structural Carbohydrate Content in Different Organs in Response to Modulated Drought Stress

A lack of a consistent correlation pattern between soluble NSC and starch in the various organs considered was observed in both treatments (Figure S2).

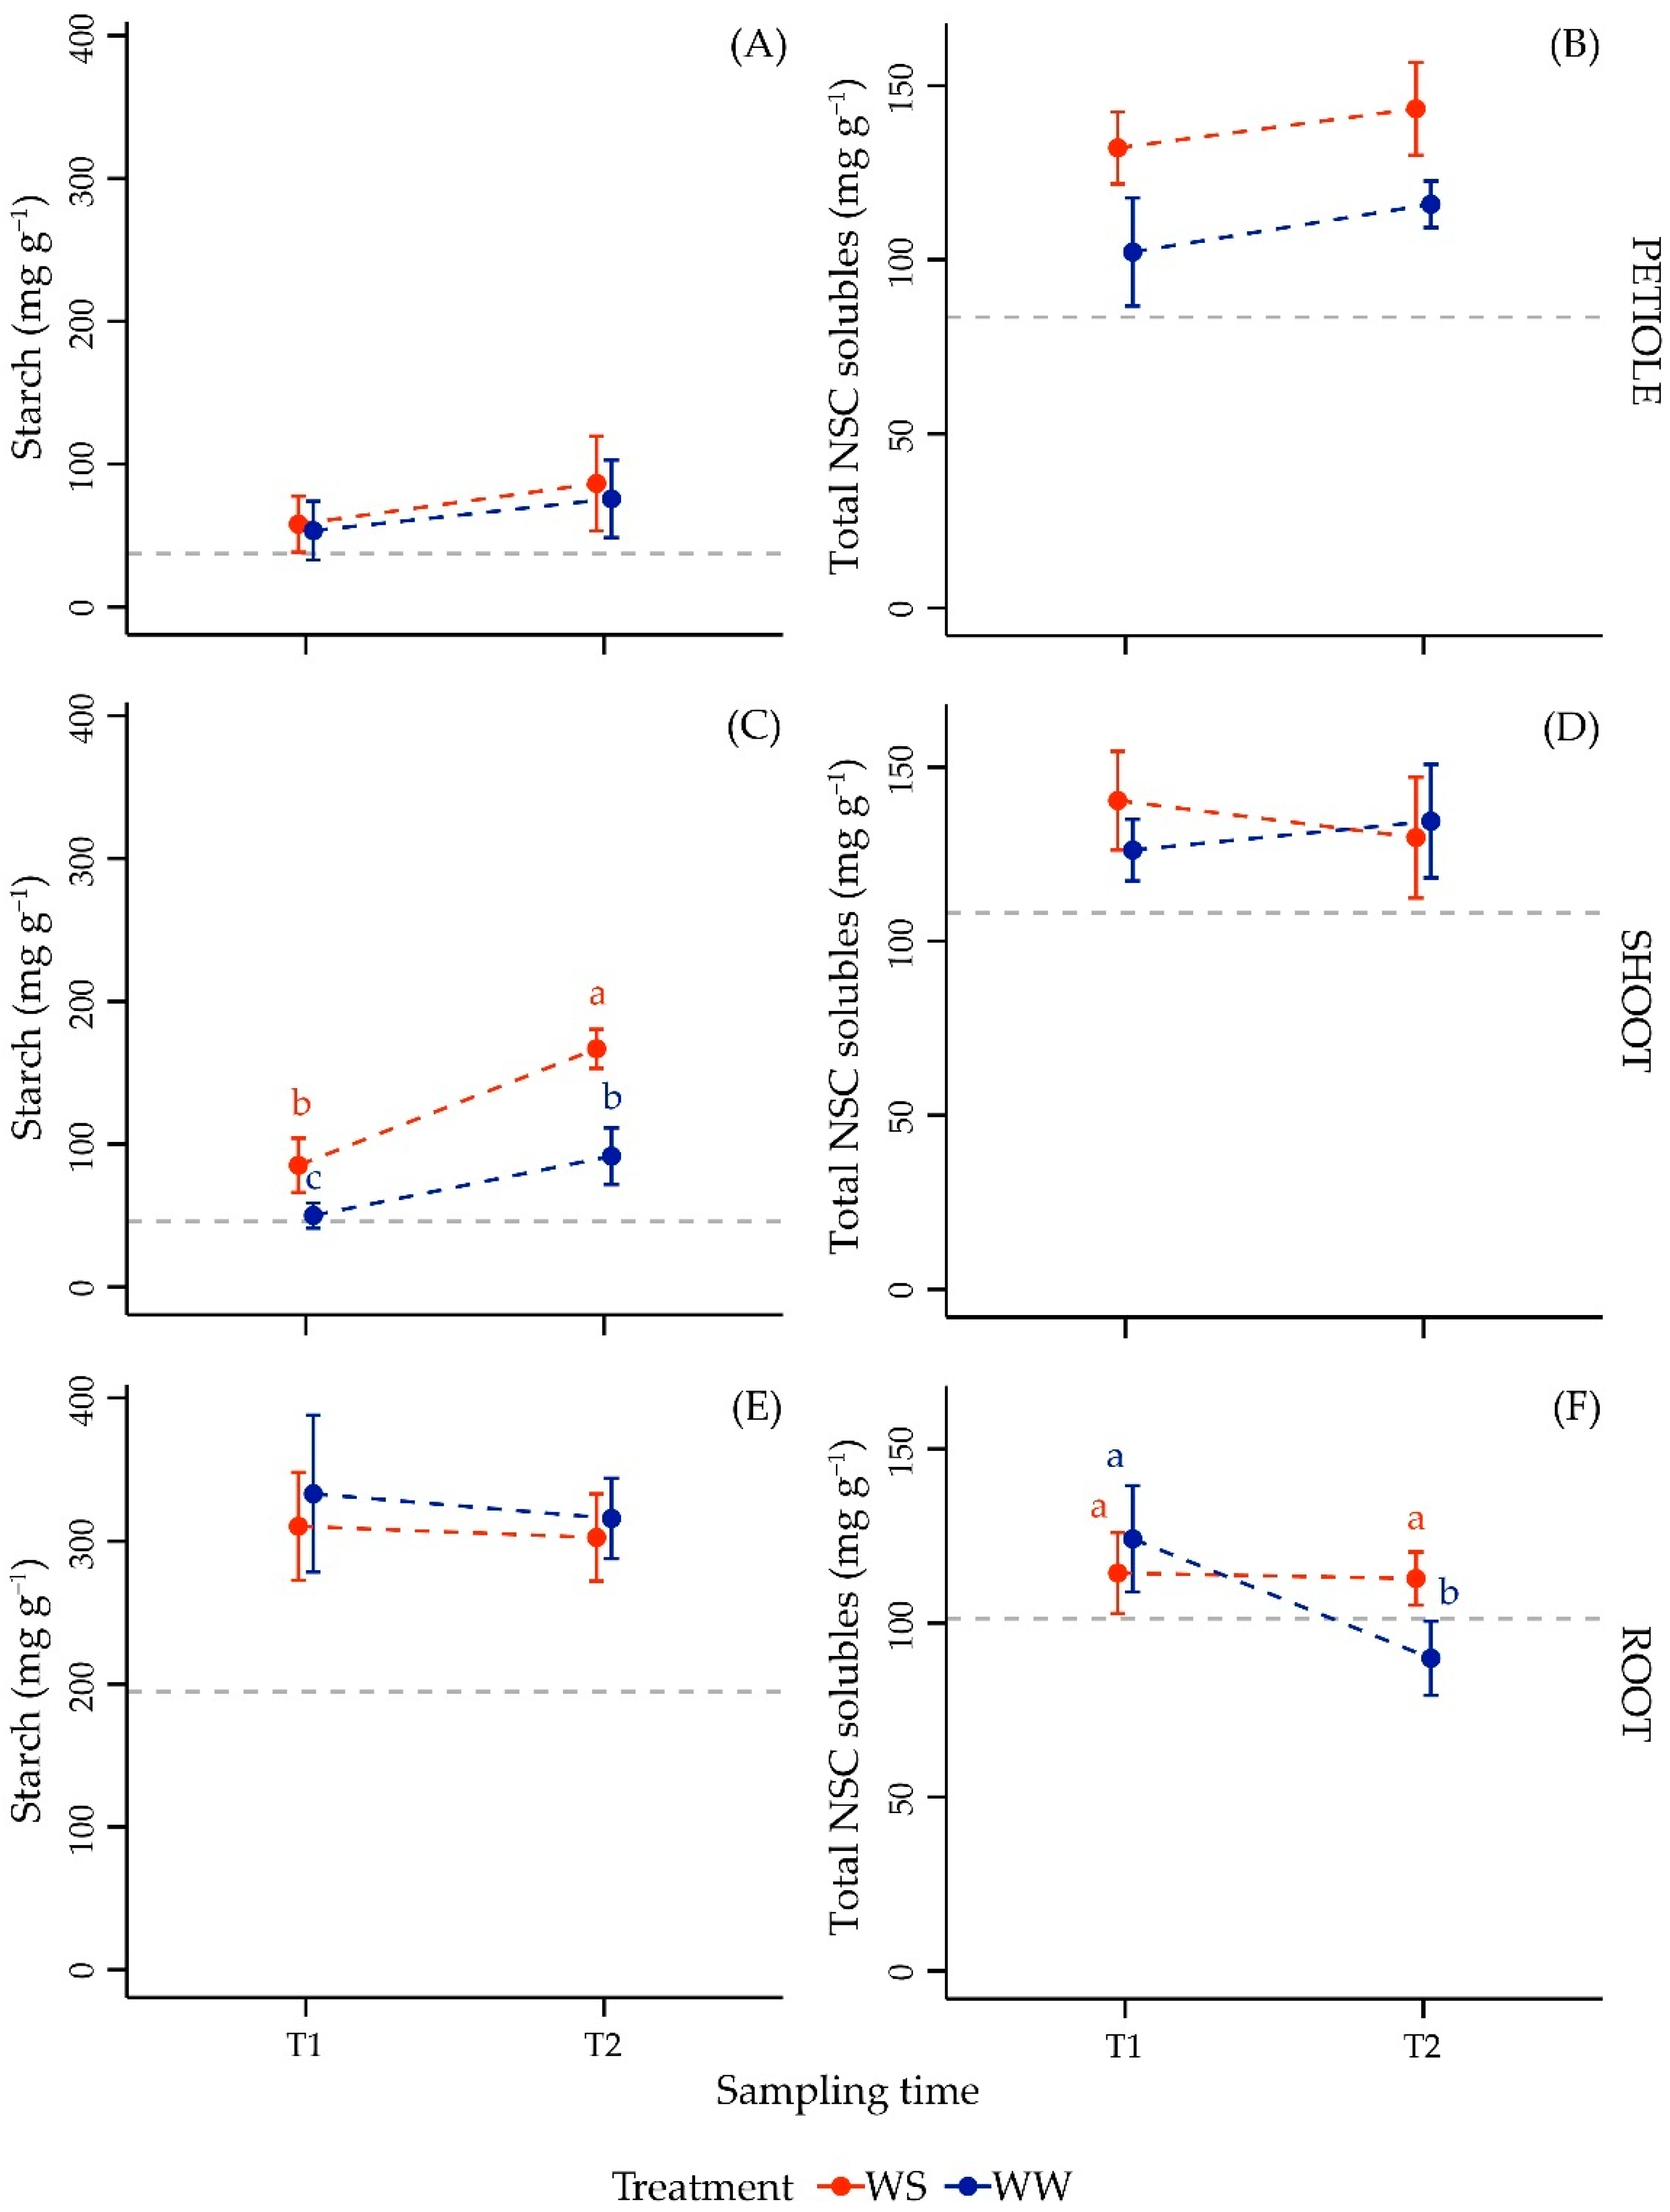
3.3.1. NSC Content in Leaf Petiole

Time and treatment differently influenced petiole starch and soluble NSC content (Table 2). Petiole starch concentration significantly changed over the season timing, while no differences were found due to water stress. Conversely, soluble NSC content was affected by the water treatment and time; no significant interaction between the two factors was observed.
The pattern of starch pool was similar in both WW and WS along the experimental period (Figure 4A), showing a gradual increase from the beginning of the drought imposition, throughout T1 and T2.
The pattern in total soluble NSC changes was different to what was observed in starch, as drought always induced a significant accumulation of these carbohydrates, despite the intensity level of imposed stress (Figure 4B). More in detail, the increase in total soluble NSC in WS petiole was +29% at T1 and +24% at the second period, as compared to WW values. Again, a gradual increase in their concentration was also appreciable, encompassing the entire period of experiment, reaching higher values at T2 with respect to what was detected at the previous stage (+13.4% in WS, whereas it corresponded to +8% in WW).

3.3.2. NSC Content in Shoot

When comparing the effect of drought and time on the specific pools of NSC in shoot, a more complex situation could be observed. ANOVA analysis revealed that the differences in starch content could be significantly attributed to the two experimental factors and their interaction (Table 2). Total soluble NSC was similar, as highlighted by the lack of significance for all factors including their interaction.
As can be observed in Figure 4C, starch was increasingly accumulated throughout the considered period in shoot from both WW and WS. In WW, starch concentration ranged from an initial concentration of 46.00 ± 16.14 to 50.06 ± 8.83 mg g−1 at T1, and then it doubled by the final stage. In WS vines, the increase was 1.85 times more with respect to the initial value at T1 and even 3.6 times more at T2. As a result, at the last stage, when WS vines were subjected to the more severe drought level, starch content in shoot was significantly higher compared to WW, reaching 82% of increase.
Unlike starch, the total soluble NSC pool changed in both WS and WW plants during time and over treatment with an inverse pattern (Figure 4D). Specifically, a slight increase (6.5%) in NSC content in WW shoots was ascertained, reaching the level of 126.18 ± 8.86 and 134.49 ± 16.33 mg g−1 at T1 and T2, respectively. WS vines accumulated high levels of soluble NSC at the first sampling time (140.40 ± 14.19 mg g−1, +11% with respect to control), but later at T2 they reduced their shoot concentration to the far lower value of 129.78 ± 17.35 mg g−1, similarly to what was found in WW.
Finally, observing the correlation pattern between shoot morphological traits and NSC, we found that shoot DMC and shoot starch in both WW and WS grapevines were significantly correlated (r_WS = 0.639; r_WW = 0.828, Figure S2).

3.3.3. NSC Content in Root

In roots, starch was neither influenced by any of the considered factors, nor by their combination, whereas in the case of total soluble NSC both sampling time and the interaction (time × treatment) became significant (Table 2).
In WW vines, starch was accumulated in the first period of experiment (+32% from July to August). Further, starch reserve levels were not affected on T2. WS plants followed a similar pattern (+23% compared to the basal concentration) (Figure 4E,F). Afterwards, starch content did not change in more stressed roots at T2, quite similar to the same level previously seen in WW.
When considering the total soluble NSC content in roots at T1, a lack of significance was found due to water supply treatment. Then, the level of NSC in WS roots remained quite the same, whereas in well-watered samples it drastically decreased (28% less than in WS).
A lack of any significant correlation of root DMC (or any other morphological traits) with neither root starch nor soluble NSC content, respectively, was found (Figure S2).
Finally, differently from petiole or shoot, root starch amount was predominant over total soluble NSC pool. It was overall three times more than total soluble carbohydrates independently of the experimental factors.

4. Discussion

The present study shows that WS plants were exposed to an increasing level of drought, ranging from mild (50 < gs < 150 mmol H2O m−2 s−1) to moderate (<50 mmol) intensity levels, as defined on the stomatal conductance basis [15,31] (Figure S1), and displayed also by increasing accumulated water stress values (Figure 1A). Given that stomatal closure is one of the early well-known responses adopted by vine plants to protect from the risk of hydraulic failure [12,32], we expected that WS would respond to drought by drastically reducing gas exchanges and net photosynthesis. However, it has been found that WS vines regulated their water use by largely enhancing iWUE (Figure 1C) from the imposition of the mild water restriction on-wards. This was in accordance to what was recently stated by authors [12,33], that different genotypes may exhibit substantial variations in the extent of their control on stomatal closure, depending also on environmental conditions and intensity of stress. In some varieties, the plant exhibits a mild restriction of gas exchange under drought conditions (i.e., anisohydric), sustaining photosynthesis even at lower leaf water potential [9]. This leads to a trade-off between carbon assimilated and water lost by transpiration and represents some degree of tolerance of the plant under drought. Generally, this hydraulic behavior causes an improvement of the plant WUE under moderate stress, as found in the present work.
This behavior, characterized by a gradual significant lowering of midday Ψs, confirmed that Merlot grapevines maintained their stomata only partially closed under drought conditions, in agreement with what was reported by other researchers [9,14,34,35]. Since stomatal closure is usually less susceptible to water stress or temporally delayed in anisohydric-like response, photosynthesis is also less constrained in comparison with isohydric response. Thus, some authors suggested that anisohydric response could protect against carbon starvation [36,37,38] and, hence, is more adapted to survive under conditions of mild, prolonged drought [39]. Altogether, in our trial we can assume that the levels of carbon assimilation under drought did not sacrifice allocation of NSC reserves in vine perennial organs, at the expense of plant growth.
In accordance with the above suggestions, we found that both drought conditions reached at T1 and T2 greatly affected plant growth through a differential biomass allocation in root vs. shoot and leaf canopy (Figure 2 and Figure 3). Indeed, although total root biomass was significantly smaller, WS plants sacrificed mainly above-ground growth with respect to their underground organ. This resulted also in the improvement of their water use efficiency, as mentioned above, given that the restricted transpiration area was better equilibrated to the limited water supply. Bringing all the results together, mild to moderate stress induced the vines to stop the elongation of the annual shoots, thus reducing the number of principal leaves compared to vines under well-watered regime. It is well-known that soil water scarcity has a strong impact on grapevine shoots [31,40] by blocking shoot internode extension, as well as leaf lamina expansion [21] and, when the drought is particularly severe, even shedding leaves, to some extent [14]. In our experimental conditions, WS was shown to face increasing drought imposition by maintaining on the shoot a small, but large enough, number of mature leaves, characterized by a smaller leaf area if compared to WW. When drier conditions were reached at T2, WS vines also experienced a significant loss of leaves. We speculate that at this stage the plant did not develop the apical, less-expanded leaves of the shoot, as we found a strong inverse relation among number of leaves and mean leaf area only in WS samples (r = −0.667 and r = 0.620 in WS compared to WW, Figure S2). In this regard, several studies have demonstrated that under abiotic stresses, elevated levels of endogenous abscisic acid (ABA) inhibited shoot growth [41], in addition to the best-known role of controlling stomatal closure and promoting root elongation against lateral root formation [41,42].
Moreover, dry mass allocation was expected to be sensitive to environmental constraints, such as nutrient or water limitation, being changing over certain phenological stages of a plant [43]. In our experiment, WS vines largely increased their DMC in roots and shoots with respect to WW. DMC partitioning was favored more in roots than in shoots, thus resulting in an increased root-to-shoot ratio in WS (Figure 3). These results were also confirmed by a stronger direct relationship observed among R/S ratio and root DMC observed in WS compared to WW (r = 0.853, Figure S2), or the significant inverse relation between root DMC and leaf number found only in WS (r = −0.789, Figure S2).
Our results can be rationalized by the strategy that grapevines exploit to mitigate the risk of hydraulic failure in case of water shortage, limiting canopy vigor in favor of the underground organ. Preferential development of roots with respect to shoots is important for more exploration into deeper soil layers, as already reported by various authors across various species [31,43,44]. Additionally, a higher density of roots measured in WS could suggest that grapevine roots under dehydration could afford other strategies to cope with stress conditions, such as modifications of their anatomical tissues (e.g., increasing suberin deposition in cell walls) [31,45,46] and/or by reducing vessel size or building thicker walls of fibers [43,47]. Both these anatomical strategies cooperate in maximizing water absorption [48], lowering grapevine root hydraulic conductivity. These acclimation-induced anatomical adjustments, in association with modulated aquaporin expression or activation at various extent in different varieties, could synergistically interact improving iWUE under drought [49].
Interestingly, starch and soluble NSC content in roots were not affected by drought imposition. Relatively elevated pools of soluble sugars were also preserved in both WW and WS over time in order to push forward biochemical reactions for their interconversion to starch. This was confirmed by the lack of any significant correlation of root DMC (or any other morphological traits) with neither root starch nor soluble NSC content, respectively (Figure S2). Nevertheless, it is also conceivable that root DMC increased in Merlot grapevines under water deficit due to xylem anatomical changes, as it is well-known that drought affects xylogenesis by reducing cambial cell layers and vessel lumen [50,51,52]. These acclimatory modifications have been already demonstrated to occur in some grapevine varieties in organs such as dormant cane stem [53], mature stem [54,55] or leaf petiole [25,56].
As opposite, shoot DMC and shoot starch in both WW and WS grapevines were significantly correlated (r_WS = 0.639; r_WW = 0.828, Figure S2), suggesting that in annual shoot dry matter partitioning was mainly devoted to sustain starch reserves along the vegetative season (from T1 to T2) and even along drought intensification (Table 2 and Figure 4). The latter results thus point out that in Merlot water shortage firstly arrested or decrease stem elongation and then delayed the depression of photosynthetic rate. Consistently with this result, previous studies attributed NSC accumulation in drought-stressed organs to a lag between decrease in growth and carbon assimilation [57]. This may cause an improvement of carbohydrate allocation to the shoot, which protects the plant against future abiotic or biotic challenges.
Given the importance of leaf petiole as one of the most vulnerable organs of the grapevine plant to embolism occurrence during drought [58], NSC concentration was followed in this organ during the modulation of stress. Differently from root and shoot organ, NSC pools in leaf petioles were mainly ascribed to relatively higher concentrations of soluble sugars (>100 mg g−1 DW), instead of the starch counterpart (Figure 4). Considering the leaf petiole, we could speculate that starch reserves are mainly ascribed to storage in amorphous form, and soluble, osmo-compatible NSC fractions could be derived from both photosynthesis and starch remobilization. Noticeably, in contrast to perennial organs, soluble NSC in petioles were strongly affected by drought with a high level of significance, being always higher in WS compared to WW (Table 2 and Figure 4). Moreover, a direct relationship among soluble NSC and petiole starch (r = 0.683, respectively, Figure S2) was observed in WS petioles, indicating that starch reserves sustained the high concentration of soluble sugars. For instance, high levels of sucrose strongly correlated with starch content in sprouting tubers of Arum species when its reserve pools started to be remobilized [59].
All together, these results could support the hypothesis that petiole soluble sugars could be involved in osmotic regulation. Consistent with the present study, we recently demonstrated that in Syrah variety showing a near-anisohydric response to a short severe stress, maltose/sucrose levels increased over the whole drought imposition and also two days after re-irrigation, suggesting the important contribution of the latter to turgor maintenance [25]. Indeed, these sugars together with organic acids, proline, polyamines and other osmolytes decrease leaf osmotic potential as already described in leaf mesophyll [12,14,60,61]. Additionally, besides their contribution to osmotic adjustment, elevated soluble sugars contribute as nutrients or energy reserve, antioxidant activities, membrane protection and cell integrity in parenchyma tissues, as well as favor an improved capacity of hydraulic recovery [27,62]. In any case, it could not be excluded that in Merlot variety also anatomical adjustments such as vessel size restriction at the petiole level actually could simultaneously cooperate contributing to improve resistance to water limitation. In this regard, in comparing petiole xylematic traits among Cabernet Sauvignon and Syrah varieties, we have evidenced that anisohydric-like Syrah also produced narrower vessels after experiencing a short severe drought stress [25].

5. Conclusions

The progressive water stress imposed on pot-grown Merlot grapevines caused a drastic restriction in shoot elongation and total leaf area development in favor of a more active biomass allocation and partitioning towards the underground organ. Overall, the mitigation of the evaporative demand at the plant level operated by these long-term adjustments is essential for drought tolerance and therefore vines could preserve, though reduced, a sufficient C assimilation increasing their water use efficiency, even in front of a risky lowering of water potential. The data clearly show that C fixation was mainly devoted to preserving NSC (mainly starch) pools in roots at safe thresholds or even to enhance them in woody stems, suggesting their pivotal role as strategic reserves in preparation for facing future stresses. Nevertheless, investigation of anatomical changes and NSC patterns in roots affected by drought is still scarce, and further studies are needed to better understand the modifications imposed by water stress. Moreover, the elevation of soluble NSC observed at the level of petioles suggests that they also potentially play the role of osmoprotectants and osmocompatible compounds and not only as merely metabolic C supply. To date, this strategy applies to anisohydric behaviour, confirming Merlot to belong to this hydraulic category. Other experiments are ongoing and will be carried out in the next future with the aim to examine the responses of varieties with different hydraulic behaviour subjected to various scenarios of water constrains.

Supplementary Materials

The following are available online at https://www.mdpi.com/article/10.3390/w13172336/s1, Table S1: ANOVA table of root and shoot dry weight, Figure S1: Leaf gas exchanges, Figure S2: Correlation matrix, Figure S3: Root and shoot dry weight.

Author Contributions

Conceptualization, P.S., E.P., R.B. and M.V.; methodology, all authors; formal analysis, F.B., E.B. and M.V.; investigation, E.P., R.B., M.V., V.C., E.B., A.C.; data curation, M.V. and F.B.; validation, G.A., M.V. and F.B.; writing—original draft preparation, E.P., R.B. and M.V.; writing—review and editing, all authors; visualization, M.V.; supervision, E.P. and P.S.; funding acquisition, P.S. All authors have read and agreed to the published version of the manuscript.

Funding

This research was funded by the project Acquavitis, which was implemented as part of the Programme Interreg V-A Italy-Slovenia 2014–2020—funded by the European Regional Development Fund.

Data Availability Statement

The data presented in this study are available in the supplementary materials, and raw data are available on request to the corresponding author.

Acknowledgments

The authors would like to thank Diego Chiabà for the help during the set up of the lysimeter system, and Gianni Tassan for the technical support during the implementation of the trial.

Conflicts of Interest

The authors declare no conflict of interest.

References

  1. Cramer, W.; Guiot, J.; Fader, M.; Garrabou, J.; Gattuso, J.-P.; Iglesias, A.; Lange, M.A.; Lionello, P.; Llasat, M.C.; Paz, S.; et al. Climate Change and Interconnected Risks to Sustainable Development in the Mediterranean. Nat. Clim. Chang. 2018, 8, 972–980. [Google Scholar] [CrossRef] [Green Version]
  2. Santos, J.A.; Fraga, H.; Malheiro, A.C.; Moutinho-Pereira, J.; Dinis, L.-T.; Correia, C.; Moriondo, M.; Leolini, L.; Dibari, C.; Costafreda-Aumedes, S.; et al. A Review of the Potential Climate Change Impacts and Adaptation Options for European Viticulture. Appl. Sci. 2020, 10, 3092. [Google Scholar] [CrossRef]
  3. Masson-Delmotte, V.; Zhai, P.; Pörtner, H.-O.; Roberts, D.; Skea, J.; Shukla, P.R.; Pirani, A.; Moufouma-Okia, W.; Péan, C.; Pidcock, R.; et al. IPCC 2018: Summary for Policymakers. In Global Warming of 1.5 °C. An IPCC Special Report on the Impacts of Global Warming of 1.5 °C above Pre-Industrial Levels and Related Global Greenhouse Gas Emission Pathways, in the Context of Strengthening the Global Response to the Threat of Climate Change, Sustainable Development, and Efforts to Eradicate Poverty; Available online: https://www.ipcc.ch/sr15/ (accessed on 10 July 2021).
  4. Farooq, M.; Wahid, A.; Kobayashi, N.; Fujita, D.; Basra, S.M.A. Plant Drought Stress: Effects, Mechanisms and Management. Agron. Sustain. Dev. 2009, 29, 185–212. [Google Scholar] [CrossRef] [Green Version]
  5. Poni, S.; Gatti, M.; Palliotti, A.; Dai, Z.; Duchêne, E.; Truong, T.-T.; Ferrara, G.; Matarrese, A.M.S.; Gallotta, A.; Bellincontro, A.; et al. Grapevine Quality: A Multiple Choice Issue. Sci. Hortic. 2018, 234, 445–462. [Google Scholar] [CrossRef] [Green Version]
  6. Sorek, Y.; Greenstein, S.; Netzer, Y.; Shtein, I.; Jansen, S.; Hochberg, U. An Increase in Xylem Embolism Resistance of Grapevine Leaves during the Growing Season Is Coordinated with Stomatal Regulation, Turgor Loss Point and Intervessel Pit Membranes. New Phytol. 2021, 229, 1955–1969. [Google Scholar] [CrossRef]
  7. Perret, S.R.; Payen, S. Irrigation and the Environmental Tragedy: Pathways towards Sustainability in Agricultural Water Use. Irrig. Drain. 2020, 69, 263–271. [Google Scholar] [CrossRef]
  8. Tardieu, F. Variability among Species of Stomatal Control under Fluctuating Soil Water Status and Evaporative Demand: Modelling Isohydric and Anisohydric Behaviours. J. Exp. Bot. 1998, 49, 419–432. [Google Scholar] [CrossRef] [Green Version]
  9. Schultz, H.R. Differences in Hydraulic Architecture Account for Near-Isohydric and Anisohydric Behaviour of Two Field-Grown Vitis vinifera L. Cultivars during Drought: Hydraulic Conductance and Stomatal Behaviour. Plant Cell Environ. 2003, 26, 1393–1405. [Google Scholar] [CrossRef]
  10. Hochberg, U.; Rockwell, F.E.; Holbrook, N.M.; Cochard, H. Iso/Anisohydry: A Plant–Environment Interaction Rather Than a Simple Hydraulic Trait. Trends Plant Sci. 2018, 23, 112–120. [Google Scholar] [CrossRef]
  11. Villalobos-González, L.; Muñoz-Araya, M.; Franck, N.; Pastenes, C. Controversies in Midday Water Potential Regulation and Stomatal Behavior Might Result From the Environment, Genotype, and/or Rootstock: Evidence From Carménère and Syrah Grapevine Varieties. Front. Plant Sci. 2019, 10, 1522. [Google Scholar] [CrossRef] [Green Version]
  12. Gambetta, G.A.; Herrera, J.C.; Dayer, S.; Feng, Q.; Hochberg, U.; Castellarin, S.D. The Physiology of Drought Stress in Grapevine: Towards an Integrative Definition of Drought Tolerance. J. Exp. Bot. 2020, 71, 4658–4676. [Google Scholar] [CrossRef]
  13. Yadav, B.; Jogawat, A.; Rahman, M.S.; Narayan, O.P. Secondary Metabolites in the Drought Stress Tolerance of Crop Plants: A Review. Gene Rep. 2021, 23, 101040. [Google Scholar] [CrossRef]
  14. Degu, A.; Hochberg, U.; Wong, D.C.J.; Alberti, G.; Lazarovitch, N.; Peterlunger, E.; Castellarin, S.D.; Herrera, J.C.; Fait, A. Swift Metabolite Changes and Leaf Shedding Are Milestones in the Acclimation Process of Grapevine under Prolonged Water Stress. BMC Plant Biol. 2019, 19, 69. [Google Scholar] [CrossRef]
  15. Hochberg, U.; Degu, A.; Fait, A.; Rachmilevitch, S. Near Isohydric Grapevine Cultivar Displays Higher Photosynthetic Efficiency and Photorespiration Rates under Drought Stress as Compared with near Anisohydric Grapevine Cultivar. Physiol. Plant. 2013, 147, 443–452. [Google Scholar] [CrossRef] [PubMed]
  16. Ledo, A.; Paul, K.I.; Burslem, D.F.R.P.; Ewel, J.J.; Barton, C.; Battaglia, M.; Brooksbank, K.; Carter, J.; Eid, T.H.; England, J.R.; et al. Tree Size and Climatic Water Deficit Control Root to Shoot Ratio in Individual Trees Globally. New Phytol. 2018, 217, 8–11. [Google Scholar] [CrossRef]
  17. Benjamin, J.G.; Nielsen, D.C.; Vigil, M.F.; Mikha, M.M.; Calderon, F. Water Deficit Stress Effects on Corn (Zea mays, L.) Root: Shoot Ratio. Open J. Soil Sci. 2014, 4, 151–160. [Google Scholar] [CrossRef] [Green Version]
  18. Anjum, S.A.; Ashraf, U.; Zohaib, A.; Tanveer, M.; Naeem, M.; Ali, I.; Tabassum, T.; Nazir, U. Growth and Developmental Responses of Crop Plants under Drought Stress: A Review. Zemdirb. Agric. 2017, 104, 267–276. [Google Scholar] [CrossRef]
  19. MacNeill, G.J.; Mehrpouyan, S.; Minow, M.A.A.; Patterson, J.A.; Tetlow, I.J.; Emes, M.J. Starch as a Source, Starch as a Sink: The Bifunctional Role of Starch in Carbon Allocation. J. Exp. Bot. 2017, 68, 4433–4453. [Google Scholar] [CrossRef]
  20. Dong, S.; Beckles, D.M. Dynamic Changes in the Starch-Sugar Interconversion within Plant Source and Sink Tissues Promote a Better Abiotic Stress Response. J. Plant Physiol. 2019, 234–235, 80–93. [Google Scholar] [CrossRef]
  21. Hochberg, U.; Bonel, A.G.; David-Schwartz, R.; Degu, A.; Fait, A.; Cochard, H.; Peterlunger, E.; Herrera, J.C. Grapevine Acclimation to Water Deficit: The Adjustment of Stomatal and Hydraulic Conductance Differs from Petiole Embolism Vulnerability. Planta 2017, 245, 1091–1104. [Google Scholar] [CrossRef] [PubMed]
  22. Fernández, M.D.; Hueso, J.J.; Cuevas, J. Water Stress Integral for Successful Modification of Flowering Dates in ‘Algerie’ Loquat. Irrig. Sci. 2010, 28, 127–134. [Google Scholar] [CrossRef]
  23. Gambetta, G.A.; Fei, J.; Rost, T.L.; Knipfer, T.; Matthews, M.A.; Shackel, K.A.; Walker, M.A.; McElrone, A.J. Water Uptake along the Length of Grapevine Fine Roots: Developmental Anatomy, Tissue-Specific Aquaporin Expression, and Pathways of Water Transport. Plant Physiol. 2013, 163, 1254–1265. [Google Scholar] [CrossRef] [PubMed] [Green Version]
  24. Pérez-Harguindeguy, N.; Díaz, S.; Garnier, E.; Lavorel, S.; Poorter, H.; Jaureguiberry, P.; Bret-Harte, M.S.; Cornwell, W.K.; Craine, J.M.; Gurvich, D.E.; et al. New Handbook for Standardised Measurement of Plant Functional Traits Worldwide. Aust. J. Bot. 2013, 61, 167. [Google Scholar] [CrossRef]
  25. Falchi, R.; Petrussa, E.; Braidot, E.; Sivilotti, P.; Boscutti, F.; Vuerich, M.; Calligaro, C.; Filippi, A.; Herrera, J.C.; Sabbatini, P.; et al. Analysis of Non-Structural Carbohydrates and Xylem Anatomy of Leaf Petioles Offers New Insights in the Drought Response of Two Grapevine Cultivars. Int. J. Mol. Sci. 2020, 21, 1457. [Google Scholar] [CrossRef] [PubMed] [Green Version]
  26. Yemm, E.W.; Willis, A.J. The Estimation of Carbohydrates in Plant Extracts by Anthrone. Biochem. J. 1954, 57, 508–514. [Google Scholar] [CrossRef] [Green Version]
  27. Tomasella, M.; Petrussa, E.; Petruzzellis, F.; Nardini, A.; Casolo, V. The Possible Role of Non-Structural Carbohydrates in the Regulation of Tree Hydraulics. Int. J. Mol. Sci. 2019, 21, 144. [Google Scholar] [CrossRef] [Green Version]
  28. R Core Team. R: A Language and Environment for Statistical Computing; R Foundation for Statistical Computing: Vienna, Austria, 2020. [Google Scholar]
  29. Fox, J.; Weisberg, S. An {R} Companion to Applied Regression; Sage: Thousand Oaks, CA, USA, 2019. [Google Scholar]
  30. Choné, X. Stem Water Potential Is a Sensitive Indicator of Grapevine Water Status. Ann. Bot. 2001, 87, 477–483. [Google Scholar] [CrossRef] [Green Version]
  31. Lovisolo, C.; Perrone, I.; Carra, A.; Ferrandino, A.; Flexas, J.; Medrano, H.; Schubert, A. Drought-Induced Changes in Development and Function of Grapevine (Vitis Spp.) Organs and in Their Hydraulic and Non-Hydraulic Interactions at the Whole-Plant Level: A Physiological and Molecular Update. Funct. Plant Biol. 2010, 37, 98. [Google Scholar] [CrossRef]
  32. Cochard, H.; Coll, L.; Le Roux, X.; Améglio, T. Unraveling the Effects of Plant Hydraulics on Stomatal Closure during Water Stress in Walnut. Plant Physiol. 2002, 128, 282–290. [Google Scholar] [CrossRef]
  33. Dayer, S.; Herrera, J.C.; Dai, Z.; Burlett, R.; Lamarque, L.J.; Delzon, S.; Bortolami, G.; Cochard, H.; Gambetta, G.A. The Sequence and Thresholds of Leaf Hydraulic Traits Underlying Grapevine Varietal Differences in Drought Tolerance. J. Exp. Bot. 2020, 71, 4333–4344. [Google Scholar] [CrossRef] [PubMed] [Green Version]
  34. Williams, L.E.; Baeza, P. Relationships among Ambient Temperature and Vapor Pressure Deficit and Leaf and Stem Water Potentials of Fully Irrigated, Field-Grown Grapevines. Am. J. Enol. Vitic. 2007, 58, 173–181. [Google Scholar]
  35. Shellie, K.; Glenn, D.M. Wine Grape Response to Kaolin Particle Film Under Deficit and Well-Watered Conditions. Acta Hortic. 2008, 792, 587–591. [Google Scholar] [CrossRef]
  36. McDowell, N.; Pockman, W.T.; Allen, C.D.; Breshears, D.D.; Cobb, N.; Kolb, T.; Plaut, J.; Sperry, J.; West, A.; Williams, D.G.; et al. Mechanisms of Plant Survival and Mortality during Drought: Why Do Some Plants Survive While Others Succumb to Drought? New Phytol. 2008, 178, 719–739. [Google Scholar] [CrossRef]
  37. Sade, N.; Gebremedhin, A.; Moshelion, M. Risk-Taking Plants: Anisohydric Behavior as a Stress-Resistance Trait. Plant Signal. Behav. 2012, 7, 767–770. [Google Scholar] [CrossRef] [Green Version]
  38. Sade, N.; Vinocur, B.J.; Diber, A.; Shatil, A.; Ronen, G.; Nissan, H.; Wallach, R.; Karchi, H.; Moshelion, M. Improving Plant Stress Tolerance and Yield Production: Is the Tonoplast Aquaporin SlTIP2;2 a Key to Isohydric to Anisohydric Conversion? New Phytol. 2009, 181, 651–661. [Google Scholar] [CrossRef]
  39. Gerzon, E.; Biton, I.; Yaniv, Y.; Zemach, H.; Netzer, Y.; Schwartz, A.; Fait, A.; Ben-Ari, G. Grapevine Anatomy as a Possible Determinant of Isohydric or Anisohydric Behavior. Am. J. Enol. Vitic. 2015, 66, 340–347. [Google Scholar] [CrossRef]
  40. Pellegrino, A.; Lebon, E.; Simonneau, T.; Wery, J. Towards a Simple Indicator of Water Stress in Grapevine (Vitis vinifera L.) Based on the Differential Sensitivities of Vegetative Growth Components. Aust. J. Grape Wine Res. 2005, 11, 306–315. [Google Scholar] [CrossRef]
  41. Cardoso, A.A.; Gori, A.; Da-Silva, C.J.; Brunetti, C. Abscisic Acid Biosynthesis and Signaling in Plants: Key Targets to Improve Water Use Efficiency and Drought Tolerance. Appl. Sci. 2020, 10, 6322. [Google Scholar] [CrossRef]
  42. Rosales, M.A.; Maurel, C.; Nacry, P. Abscisic Acid Coordinates Dose-Dependent Developmental and Hydraulic Responses of Roots to Water Deficit. Plant Physiol. 2019, 180, 2198–2211. [Google Scholar] [CrossRef] [Green Version]
  43. Brunner, I.; Herzog, C.; Dawes, M.A.; Arend, M.; Sperisen, C. How Tree Roots Respond to Drought. Front. Plant Sci. 2015, 6, 547. [Google Scholar] [CrossRef] [Green Version]
  44. Dry, P.R.; Loveys, B.R.; Düring, H. Partial Drying of the Rootzone of Grape. II. Changes in the Pattern of Root Development. Vitis 2000, 39, 4. [Google Scholar]
  45. Barrios-Masias, F.H.; Knipfer, T.; McElrone, A.J. Differential Responses of Grapevine Rootstocks to Water Stress Are Associated with Adjustments in Fine Root Hydraulic Physiology and Suberization. J. Exp. Bot. 2015, 66, 6069–6078. [Google Scholar] [CrossRef] [Green Version]
  46. Yıldırım, K.; Yağcı, A.; Sucu, S.; Tunç, S. Responses of Grapevine Rootstocks to Drought through Altered Root System Architecture and Root Transcriptomic Regulations. Plant Physiol. Biochem. 2018, 127, 256–268. [Google Scholar] [CrossRef]
  47. Moura, J.C.M.S.; Bonine, C.A.V.; De Oliveira Fernandes Viana, J.; Dornelas, M.C.; Mazzafera, P. Abiotic and Biotic Stresses and Changes in the Lignin Content and Composition in Plants. J. Integr. Plant Biol. 2010, 52, 360–376. [Google Scholar] [CrossRef]
  48. Steudle, E. Water uptake by plant roots: An integration of views. In Recent Advances of Plant Root Structure and Function; Gašparíková, O., Čiamporová, M., Mistrík, I., Baluška, F., Eds.; Springer: Dordrecht, The Netherlands, 2001; pp. 71–82. ISBN 978-90-481-5598-9. [Google Scholar]
  49. Vandeleur, R.K.; Mayo, G.; Shelden, M.C.; Gilliham, M.; Kaiser, B.N.; Tyerman, S.D. The Role of Plasma Membrane Intrinsic Protein Aquaporins in Water Transport through Roots: Diurnal and Drought Stress Responses Reveal Different Strategies between Isohydric and Anisohydric Cultivars of Grapevine. Plant Physiol. 2009, 149, 445–460. [Google Scholar] [CrossRef] [Green Version]
  50. Savi, T.; Bertuzzi, S.; Branca, S.; Tretiach, M.; Nardini, A. Drought-induced Xylem Cavitation and Hydraulic Deterioration: Risk Factors for Urban Trees under Climate Change? New Phytol. 2015, 205, 1106–1116. [Google Scholar] [CrossRef] [PubMed] [Green Version]
  51. Nardini, A.; Savi, T.; Losso, A.; Petit, G.; Pacilè, S.; Tromba, G.; Mayr, S.; Trifilò, P.; Lo Gullo, M.A.; Salleo, S. X-ray Microtomography Observations of Xylem Embolism in Stems of Laurus nobilis Are Consistent with Hydraulic Measurements of Percentage Loss of Conductance. New Phytol. 2017, 213, 1068–1075. [Google Scholar] [CrossRef] [PubMed] [Green Version]
  52. Eckert, C.; Sharmin, S.; Kogel, A.; Yu, D.; Kins, L.; Strijkstra, G.-J.; Polle, A. What Makes the Wood? Exploring the Molecular Mechanisms of Xylem Acclimation in Hardwoods to an Ever-Changing Environment. Forests 2019, 10, 358. [Google Scholar] [CrossRef] [Green Version]
  53. Falchi, R.; Petrussa, E.; Zancani, M.; Casolo, V.; Beraldo, P.; Nardini, A.; Sivilotti, P.; Calderan, A.; Herrera, J.C.; Peterlunger, E.; et al. Summer Drought Stress: Differential Effects on Cane Anatomy and Non-Structural Carbohydrate Content in Overwintering Cabernet Sauvignon and Syrah Vines. BIO Web Conf. 2019, 13, 03007. [Google Scholar] [CrossRef]
  54. Jacobsen, A.L.; Rodriguez-Zaccaro, F.D.; Lee, T.F.; Valdovinos, J.; Toschi, H.S.; Martinez, J.A.; Pratt, R.B. Grapevine Xylem Development, Architecture, and Function. In Functional and Ecological Xylem Anatomy; Hacke, U., Ed.; Springer International Publishing: Cham, Switzerland, 2015; pp. 133–162. ISBN 978-3-319-15782-5. [Google Scholar]
  55. Munitz, S.; Netzer, Y.; Shtein, I.; Schwartz, A. Water Availability Dynamics Have Long-Term Effects on Mature Stem Structure in Vitis vinifera. Am. J. Bot. 2018, 105, 1443–1452. [Google Scholar] [CrossRef] [Green Version]
  56. Hochberg, U.; Degu, A.; Gendler, T.; Fait, A.; Rachmilevitch, S. The Variability in the Xylem Architecture of Grapevine Petiole and Its Contribution to Hydraulic Differences. Funct. Plant Biol. 2015, 42, 357. [Google Scholar] [CrossRef]
  57. Mitchell, P.J.; O’Grady, A.P.; Tissue, D.T.; White, D.A.; Ottenschlaeger, M.L.; Pinkard, E.A. Drought Response Strategies Define the Relative Contributions of Hydraulic Dysfunction and Carbohydrate Depletion during Tree Mortality. New Phytol. 2013, 197, 862–872. [Google Scholar] [CrossRef]
  58. Hochberg, U.; Albuquerque, C.; Rachmilevitch, S.; Cochard, H.; David-Schwartz, R.; Brodersen, C.R.; McElrone, A.; Windt, C.W. Grapevine Petioles Are More Sensitive to Drought Induced Embolism than Stems: Evidence from in Vivo MRI and Microcomputed Tomography Observations of Hydraulic Vulnerability Segmentation: Hydraulic Vulnerability Segmentation in Grapevine. Plant Cell Environ. 2016, 39, 1886–1894. [Google Scholar] [CrossRef] [Green Version]
  59. Petrussa, E.; Boscutti, F.; Vianello, A.; Casolo, V. ‘Last In-First Out’: Seasonal Variations of Non-Structural Carbohydrates, Glucose-6-Phosphate and ATP in Tubers of Two Arum Species. Plant Biol. 2018, 20, 346–356. [Google Scholar] [CrossRef]
  60. Chaves, M.M. Mechanisms Underlying Plant Resilience to Water Deficits: Prospects for Water-Saving Agriculture. J. Exp. Bot. 2004, 55, 2365–2384. [Google Scholar] [CrossRef] [Green Version]
  61. Gurrieri, L.; Merico, M.; Trost, P.; Forlani, G.; Sparla, F. Impact of Drought on Soluble Sugars and Free Proline Content in Selected Arabidopsis Mutants. Biology 2020, 9, 367. [Google Scholar] [CrossRef]
  62. Secchi, F.; Pagliarani, C.; Zwieniecki, M.A. The Functional Role of Xylem Parenchyma Cells and Aquaporins during Recovery from Severe Water Stress: Response of Xylem Parenchyma Cells to Embolism. Plant Cell Environ. 2017, 40, 858–871. [Google Scholar] [CrossRef] [PubMed]
Figure 1. Split lines interpolating mean value (full color line) ± standard deviation (shaded area) of water deficit integral (panel A), crop evapotranspiration (panel B) and water use efficiency (panel C), measured in Merlot vines under well-watered (WW—blue line) and water stress (WS—red line) conditions. Data are referred to the whole experimental period.
Water 13 02336 g001
Figure 2. Mean values ± standard deviation of leaves number (panel A), and mean leaf area (panel B) in Merlot vines under well-watered (WW) and water stress (WS) conditions at sampling times T1 and T2 (237 and 260 DOY). The horizontal dotted line indicates the value of the variables at T0 (205 DOY). Different letters correspond to statistically significant differences (p < 0.05).
Water 13 02336 g002
Figure 3. Mean values ± standard deviation of dry matter content (DMC) of shoot and root (panels A and B, respectively), and of RS ratio (panel C) in Merlot vines under well-watered (WW) and water stress (WS) conditions at sampling times T1 and T2 (237 and 260 DOY). The horizontal dotted line indicates the value of the variables at T0 (205 DOY). Different letters correspond to statistically significant differences (p < 0.05).
Water 13 02336 g003
Figure 4. Mean values ± standard deviation of starch and total NSC soluble concentration in petiole (panels A and B), in shoot (panels C and D) and root (panels E and F) in Merlot vines under well-watered (WW) and water stress (WS) conditions at sampling times T1 and T2 (237 and 260 DOY). The horizontal dotted line indicates the value of the variables at T0 (205 DOY). Different letters correspond to statistically significant differences (p < 0.05).
Water 13 02336 g004
Table 1. Outcomes of the analysis of variance (two-way ANOVA) applied to leaf number, mean leaf area, shoot and root DMC, and R/S ratio in relation to drought stress (treatment), time and their interactions.
FactorDfF Valuep-Value
Leaves number
Time1, 222.890.103
Treatment1, 2248.40<0.001 ***
Time × Treatment1, 225.760.025 *
Mean Leaf Area
Time1, 220.410.528
Treatment1, 2234.67<0.001 ***
Time × Treatment1, 223.560.072
log(Shoot DMC)
Time1, 22213.21<0.001 ***
Treatment1, 2253.49<0.001 ***
Time × Treatment1, 228.170.009 **
log(Root DMC)
Time1, 2327.77<0.001 ***
Treatment1, 23204.32<0.001 ***
Time × Treatment1, 230.220.639
log(R/S ratio)
Time1, 2460.35<0.001 ***
Treatment1, 2416.60<0.001 ***
Time × Treatment1, 240.690.411
*, ** and *** significance at the p < 0.05, 0.01 and 0.001 levels, respectively.
Table 2. Outcomes of the analysis of variance (two-way ANOVA) applied to starch content and total soluble NSC content in petiole, shoot and root in relation to drought stress (treatment), time and their interactions.
FactorDfF Valuep-Value
PETIOLElog(Starch)
Time1, 176.140.024 *
Treatment1, 170.470.504
Time × Treatment1, 170.020.883
PETIOLETotal NSC solubles
Time1, 156.200.025 *
Treatment1, 1527.21<0.001 ***
Time × Treatment1, 150.050.824
SHOOTStarch
Time1, 24104.48<0.001 ***
Treatment1, 2483.73<0.001 ***
Time × Treatment1, 2411.080.003 **
SHOOTTotal NSC solubles
Time1, 240.040.835
Treatment1, 240.750.395
Time × Treatment1, 242.960.098
ROOTStarch
Time1, 210.410.528
Treatment1, 211.360.256
Time × Treatment1, 210.100.756
ROOTTotal NSC solubles
Time1, 2315.91<0.001 ***
Treatment1, 232.660.116
Time × Treatment1, 2313.770.001 **
*, ** and *** significance at the p < 0.05, 0.01 and 0.001 levels, respectively.
Publisher’s Note: MDPI stays neutral with regard to jurisdictional claims in published maps and institutional affiliations.

