Article

Changes in Algal Plankton Composition and Physico-Chemical Variables in a Shallow Oxbow Lake

1
Department of Hydrobiology, University of Debrecen, Egyetem tér 1, H-4032 Debrecen, Hungary
2
Pál Juhász-Nagy Doctoral School of Biology and Environmental Sciences, University of Debrecen, Egyetem tér 1, H-4032 Debrecen, Hungary
3
Department of Physical Geography and Geoinformatics, University of Debrecen, Egyetem tér 1., H-4032 Debrecen, Hungary
4
Department of Land Use, University of Debrecen, Böszörményi út 138, H-4032 Debrecen, Hungary
5
Centre for Ecological Research, Institute of Aquatic Ecology, Karolina út 29, H-1113 Budapest, Hungary
6
Department of Water Supply and Sewerage, Faculty of Water Sciences, University of Public Service, H-6500 Baja, Hungary
*
Author to whom correspondence should be addressed.
Water 2021, 13(17), 2339; https://doi.org/10.3390/w13172339
Submission received: 30 June 2021 / Revised: 19 August 2021 / Accepted: 21 August 2021 / Published: 26 August 2021
(This article belongs to the Special Issue Algae: Indices of Water and Ecological Quality)

Abstract

:
In our work, we sought to answer whether we find differences among the various zones of an oxbow lake with different land uses based on physico-chemical variables and dominant algal plankton species. The two ends of the oxbow lake are bordered by settlements, and near them there are open water areas where fishing is the major utilization form. Between the two open water areas we find a protected area with a large aquatic plant coverage and two transition zones towards the open water areas. The oxbow lake receives periodic water replenishment only at one end from one of the open water areas. During summer—due to the lack of rain—the water of the oxbow lake is used for irrigation in the surrounding arable land, so the water level fluctuation can be significant in the riverbed. Our study was performed within a vegetation period of spring, early summer, mid-summer, and fall. In connection with the ecological classification of a smaller water body, studies on the physical and chemical properties of the water and the composition of the algal plankton are usually carried out in few places and relatively infrequently. The characteristics of a water body are also influenced by seasonal changes, which can be the changes in the extent of vegetation coverage, the way land is used and the possibility of water replenishment, to which the algal community usually responds with changes. Based on our study, it can be said that even in a relatively small water body, we found a large differences based on the chemical and physical properties of the water and the characteristic algal species. Open water zones, areas with large macrovegetation coverage, and the transition zones were separated from each other.

1. Introduction

All over the world, shallow lakes are considered to be biodiversity hotspots for aquatic wildlife and human demands. Numerous aquatic ecosystems have been affected by significant alterations, whether caused by natural or anthropogenic pressure. These disturbances or human utilizations of these ecosystems are a cause of general anxiety due to their importance in providing ecosystem services [1,2]. Shallow lakes are easily affected by climate change and human impacts—for example, contamination with heavy metals [3], and these lakes are the most widespread water bodies, more common than deep lakes all around the world [4]. Many shallow lakes were created at the edge of the ice cover during the Weichselian glaciation period [5]. Shallow lakes could have appeared naturally or have been created by anthropogenic activities such as digging for peat, sand, gravel, or clay, processes which produced considerable numbers of shallow lakes and ponds [5,6] over the long term.
Lakes can have major inputs and major outputs, in accordance with additional sources of input and output water [7]. Lake ecosystems are made up of physical, chemical and biological properties, and these variables can be affected by river water and thus can affect the diversity of biotas in many ways [7,8]. Water bodies can be divided into at least two categories based on their transparency [9]. The first category includes water bodies with high transparency where the bottom is covered with submerged macrophytes; the second category consists of water bodies with low transparency and high phytoplankton abundance [10,11].
Oxbow lakes have a priority for research and conservation due to their actual impact on the ecology, biodiversity, and social economy of the surrounding localities [1]. Oxbow lakes represent a distinct type of aquatic ecosystem due to their origin, and their morphometric and hydrodynamic parameters, especially compared to post-glacial lakes. The functioning of oxbow lakes is directly and indirectly associated with the temporal fluctuations of the water level in nearby rivers [12]. Oxbow lakes are understood as small or shallow lakes which are characteristic types of standing waters in lowland areas. Most oxbow lakes can be found in lowlands with densely populated surroundings, which usually involves high risks of degradation [13]. They are critical refugees for maintaining biodiversity, because they provide unique habitats. The community structure and the diversity of aquatic organisms can indicate the environmental conditions [14].
The trophic state of a lake is highly dependent on the nutrient concentration and can be determined by the relationship between nutrient inputs and outputs. The unique nature of the water bodies studied means that there are regions (open water regions) with oxygen conditions, nitrogen, and phosphorus cycles characteristic of shallow water bodies, but there are other regions (covered with vegetation) where wetlands with oxygen, nitrogen, or phosphorus conditions are characteristic. Nitrogen- and phosphorus forms are the most important factors in limiting algal growth and thus lakes with higher nutrient input cause the growth of more plants and algae [15,16].
In the lotic system of the Nagy–Morotva oxbow lake, which receives water from the Tisza River, the irregular dynamics of inflow and the variable flushing rates markedly alter environmental conditions for communities [17]. Changes in phytoplankton dynamics are a result of a complex interplay of physical, chemical, and biological processes [17].
Since the Nagy–Morotva oxbow lake has one major input canal, the water quality in the lower part of the lake is estimated to be different to that in the upper part. The capacity of freshwater ecosystems to transform or retain added solutes is a function of inputs, hydrology, and biogeochemical processes [18].
Studies have found that macrophytes have a very high impact on the physico-chemical parameters of the water and the whole trophic structure, but the greatest impact is on influencing algal growth through allelopathic secretions. On the other hand, macrophytes provide refuge for microorganisms, support the diversity of fish populations, and prevent sediment resuspension [10,19,20,21,22,23,24].
Phytoplankton dynamics are linked to annual fluctuations in temperature, stratification, light availability, and nutrient consumption. Changing climatic conditions can modify the physico-chemical factors and alter phytoplankton structure and composition. Phytoplankton response to the changing conditions can be direct through physiology, and indirect by mediating the effects on environmental factors limiting primary production-most notably light and nutrients [25].
The main aim of our study is to determine whether the ‘open water’, ‘transitional’, and ‘macrophyte’ regions differ from each other based on physico-chemical variables and phytoplankton composition in the case of a shallow oxbow. We also aimed to establish the trophic conditions based on the algal plankton in the different zones of the oxbow lake during the investigated period.

2. Materials and Methods
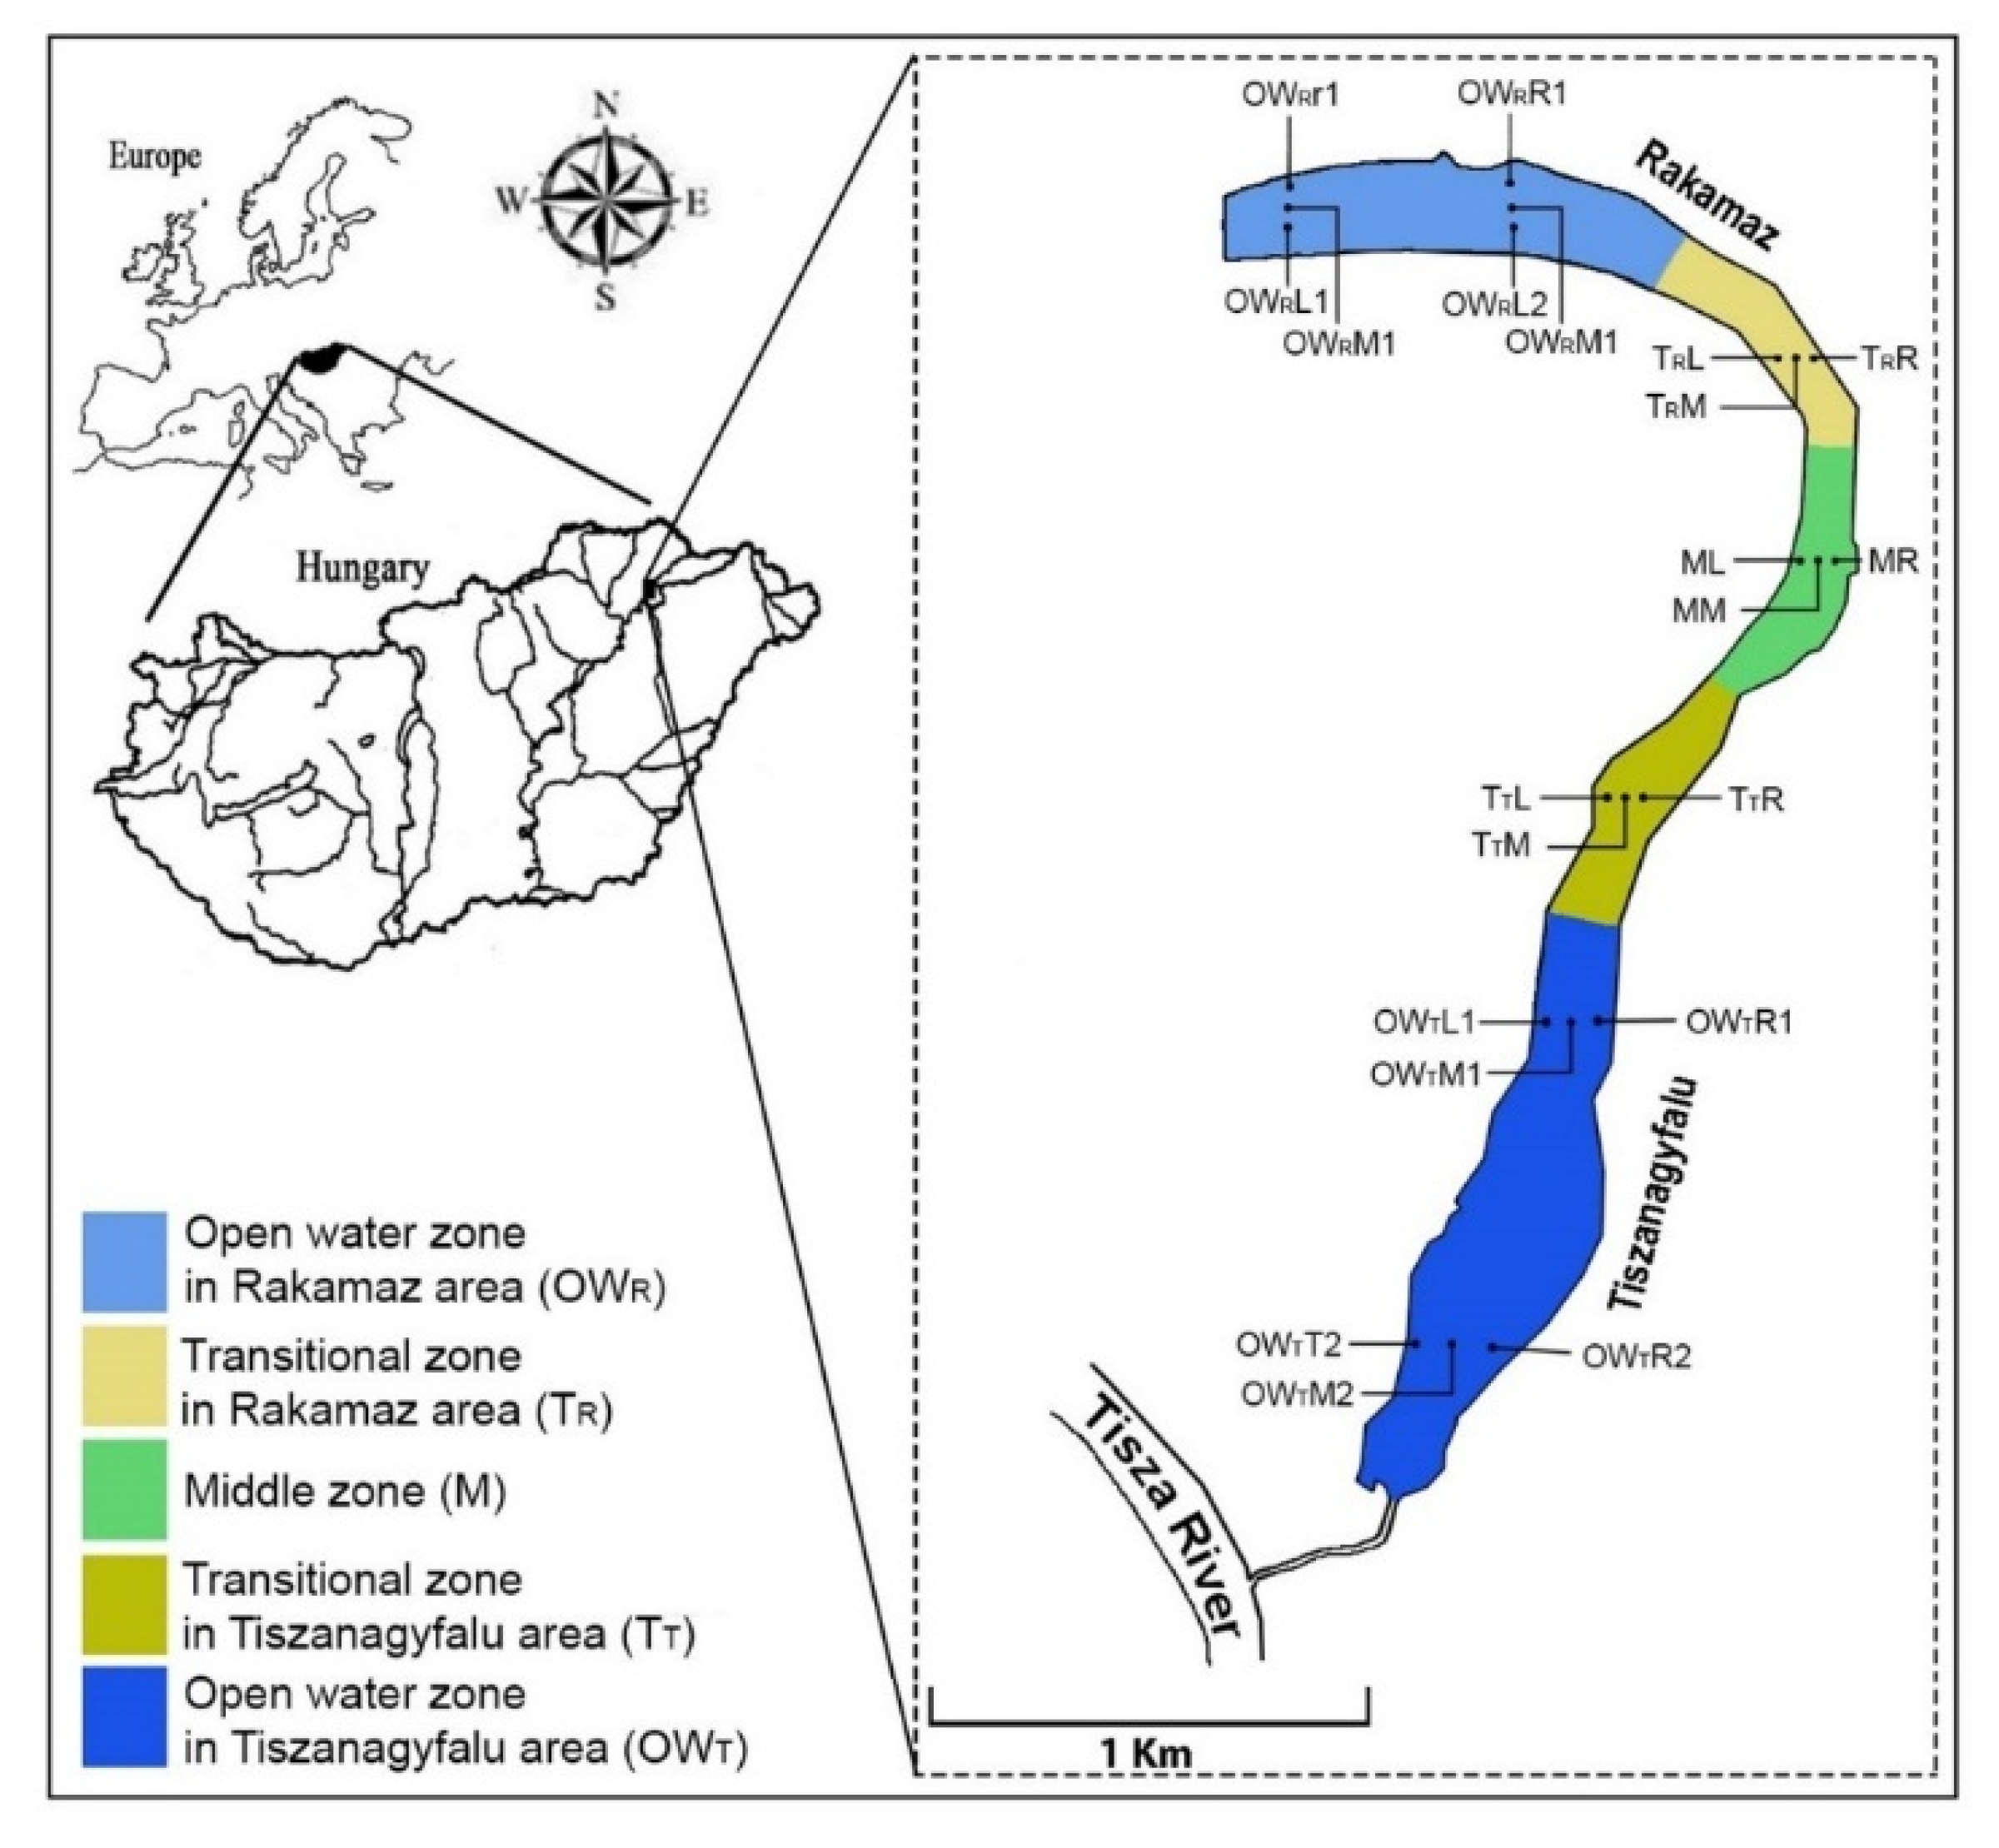
2.1. Study Site

The oxbow lake studied—the Nagy–Morotva oxbow lake—is in the Szabolcs-Szatmár-Bereg county of Northeastern Hungary (48.112823° N, 21.473902° E). The lake was laid down naturally from the Tisza River (Figure 1). There are settlements at both ends of the oxbow lake, at the northern end is Rakamaz, and near the southern end is Tiszanagyfalu, and there are large open water areas at both ends of the lake. The connection between the open water zones and the macrovegetation covered zones forms a transition zone between them. Transitional zones are found between the open water zones and the zones with high macrovegetation coverage. Based on these considerations, the oxbow lake can be divided into several zones: an open water zone near Rakamaz (OWR), a middle zone with a high coverage of macrovegetation (M), an open water zone near Tiszanagyfalu (OWT), and two transitional zones between the open water regions and the middle zone, from Rakamaz (TR) and from Tiszanagyfalu (TT). The oxbow lake can receive water from the Tisza River through a canal at Tiszanagyfalu. The water in the oxbow lake is used as irrigation water during the drier period, mostly in summer. Fishing is also a typical water use in both open water zones. At the same time, the middle zone is fully covered by Water Soldier (Stratiotes aloides L.).

2.2. Sample Collection

Well distributed sampling points—in spatial and temporal scales—were selected, to ensure that the collected samples represented the mosaic nature of the Nagy–Morotva lotic system. Water samples were taken at 21 sites from the oxbow lake, distributed on 7 transects, with each transect having 3 samples (left, middle, and right sides). Water samples were collected during April, June, July, and October 2019.
The OWR zone (Open Water-Rakamaz) included the sampling points of OWRL1, OWRM1, OWRR1, OWRL2, OWRM2, and OWRR2, the TR zone (transitional zone-Rakamaz) included TRL, TRM, and TRR, the M zone (Middle zone) included ML, MM, and MR, the TT zone (transitional zone-Tiszanagyfalu) included TTL, TTM, and TTR, and the OWT zone (open water-Tiszanagyfalu) included OWTL1, OWTM1, OWTR1, OWTL2, OWTM2, and OWTR2 (Figure 2). There was only one main water input for the oxbow lake—the Tisza River—which is supporting the water in the lake through the OWT zone. A pump station used for irrigation was located in the M zone. The OWR zone was estimated as a standing water area as the water retention was longer, unlike in the OWT zone. The OWR and OWT zones were used for fishing, while the other zones were highly protected areas and covered with macrophytes (mostly with water soldier and submerged vegetation).
For chemical analysis and algal counting, the samples were collected with a weighted plastic tube at each sampling point. The physical and chemical parameters were measured according to the analytical methods of the Hungarian water quality monitoring service (Hungarian National Standards, MSZ 12749:1993).
The algal samples were immediately fixed on the field with Lugol’s iodine for subsequent algal counting with the Utermöhl inverted microscope technique [26]. The microscopic investigation was done with an Olympus-IX73 inverted and an Olympus-BX53 microscope using phase-contrast and Nomarski-contrast technologies.
Coordinates of the sampling points were recorded by a Garmin eTrex30 type gps device. At each sampling point (on a field), we measured the temperature (°C), conductivities (µS cm−1), optical dissolved oxygen (mg/L), and chlorophyll-a content (µg/L) with an YSI EXO-2-S3 equipment. Depth and transparency were measured with a Secchi disk. During the laboratory phase we measured total suspended solids (mg/L), ORP (mV), chlorophyll-a (mg/L), sulphate ion (mg/L), nitrite-nitrogen (mg/L), nitrate-nitrogen (mg/L), ammonium-ion (mg/L), Kjeldahl-nitrogen (mg/L), dissolved orthophosphate-ion (mg/L), total-phosphorus (mg/L), chemical oxygen demand (CODCr and CODsMn) (mg/L), BOD5 (mg/L), CO32− (mg/L), H-CO3 (mg/L), and humic acid (mg/L) based on Chemical Analysis of Water and Wastes Methods. During the laboratory phase the total suspended solids (mg/L) was measured according to the Hungarian Standard MSZ 260-3:1973. The pH was measured using a Hach Lange HQ30d flexi multimeter using an IntelliCAL™ PHC101 pH electrode. Biochemical oxygen demand (BOD5) was measured according to the International Standard of MSZ EN1899-2:2000. Permanganate based chemical oxygen Demand (CODsMn) was measured according to the Hungarian Standard MSZ 448-20:1990, and chromate based chemical oxygen demand (CODCr) was measured according to the Hungarian Standard MSZ ISO 6060: 1991. The dissolved orthophosphate-ion was measured according to the Hungarian Standard MSZ 12750-17:1974, and the total phosphorus was measured with a Hach Lange DR6000TM one-way UV–vis spectrophotometer. The amount of nitrate (NO3) was measured according to Hungarian Standard MSZ 12750-18:1974, and the nitrite (NO2) according to the Hungarian Standard MSZ 1484-13:2009. Ammonium (NH4+) was measured according to the Hungarian Standard MSZ ISO 7150-1:1992, and the amount of Kjeldahl nitrogen was measured according to Hungarian Standard MSZ 260-12: 1987. The sulphate ion (SO42−) was measured according to the International Standard ISO 15923-1. The measurement of total alkalinity (hydrogen carbonate HCO3 and carbonate CO32−) was based on the Hungarian Standard MSZ448-11:1986. The humic acid content was measured using the method practiced by Tisza River Regional Waterworks Ltd. HKE-3: 2002. Chlorophyll-a content was measured using hot methanol extraction and spectrophotometry [27].

2.3. Data Analysis

The phytoplankton data is counted as individuals/liter (ind./L−1). A multivariate approach was used for statistical analysis to illustrate biotic and abiotic change patterns and correlations between environmental parameters and phytoplankton distribution. Principle component analysis (PCA) was applied to reveal the pattern of phytoplankton variability in relation to environmental characteristics using PAST ver. 2.17c [28]. Logarithm transformation was used to linearize the dataset. Both phytoplankton and physiochemical data was normalized (log+1) before being generated as a PCA output. The phytoplankton data was analyzed in the var–covar matrix based between-group PCA, while the correlation matrix based between-group PCA was used for the physio-chemical parameters. To obtain the correlation coefficients, we used Pearson’s correlation calculation on the log+1 transformed data.

3. Results

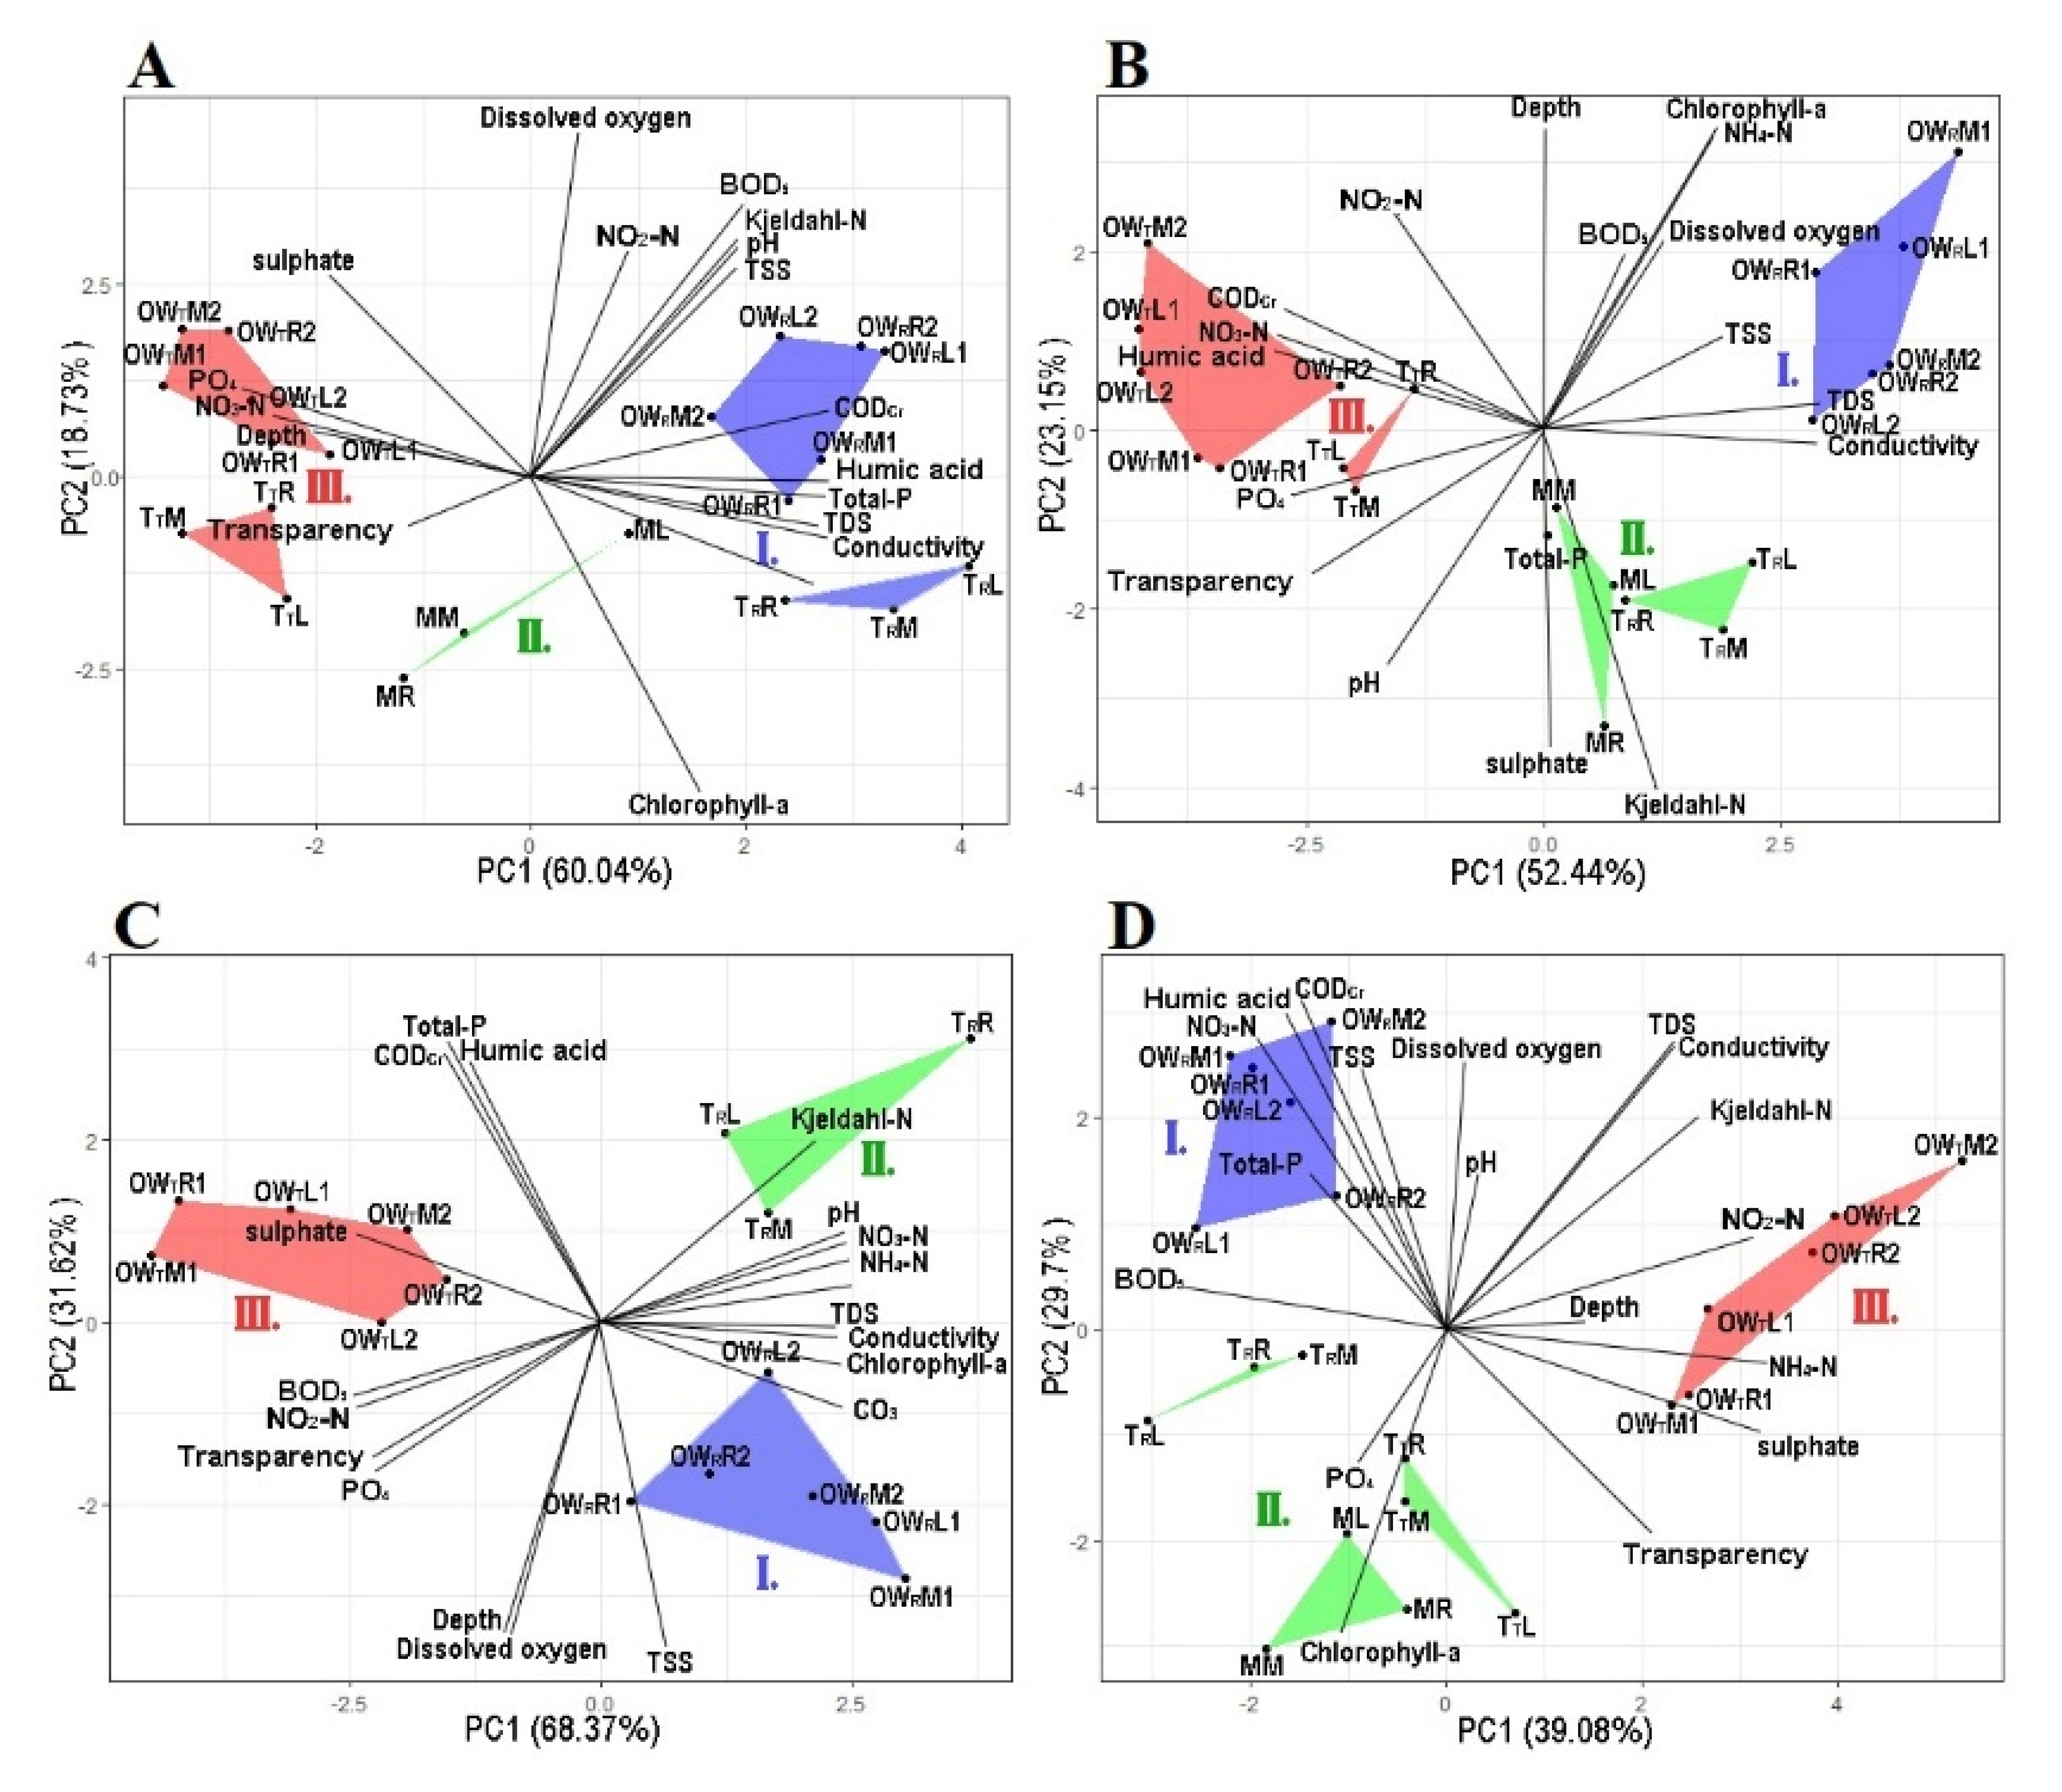
3.1. Principal Component Analysis of Physical and Chemical Variables

During the April sampling period, the between-group PCA (principal component analysis) calculated on the physico-chemical variables showed that the five zones could be divided into three groups (Figure 2A). The first axis (PC1) explained 60% of the total variance and the second axis (PC2) explained 18.7% of the total variance. Group I during the April sampling period was affected by the high concentrations of TDS, EC, CODcr, humic acid, Kjeldahl-N, BOD5, TSS, total-P, chlorophyll-a, and NO2-N. Group II was the transitional zone between Groups I and III, and was characterized by low concentrations of NO2-N and ODO. Group III was affected by high transparency (Secchi) and high concentrations of SO42−, NO3-N, PO43−, and NO2-N.
In June, the five zones could be divided into three groups based on the PCA (Figure 2B). The first axis (PC1) explained 52.4% of the total variance, while the second axis (PC2) explained 23.2%. Group I was affected by high concentrations of chlorophyll-a, TDS, NH4-N, ODO, BOD5, and TSS. Group II was affected by high concentrations of Kjeldahl-N, total-P, and sulphate ion. Group III was affected by high transparency (Secchi) and high concentrations of PO43−, humic acid, NO3-N, NO2-N, and CODcr. Table 1 contains all of the measured physical and chemical variables values during the four studied months.
In July, the three zones could be divide into three groups based on the PCA (Figure 2C). The first axis (PC1) explained 68.4% of the total variance, while the second axis (PC2) explained 31.6%. Group I was highly affected by high concentrations of ODO, Depth, TSS, CO32−, conductivity, and chlorophyll-a. Group II was highly affected by high Kjeldahl-N, CODsMn, pH, N, NO3-N, NH4-N, and humic acid. Group III was highly affected by high concentrations of sulphate ion, BOD5, and NO2-N. However, due to the high density of macrophytes in the middle zone and in the second transitional zone, it was impossible to collect samples from these zones.
In October, the five zones could be divide into three groups based on the PCA (Figure 2D). The first axis (PC1) explained 39% of the total variance, while the second axis (PC2) explained 29.7%. Group I was highly affected by high concentrations of ODO, NO3-N, TSS, CODcr, humic acid, total-P, and BOD5. Group II was affected by high concentrations of PO43− and chlorophyll-a. Group III was highly affected by high transparency, and high concentrations of Kjeldahl-N, EC, TDS, NH4+, sulphate ion, NO2-N.

3.2. Principal Componant Analysis of the Algal Plankton

Based on the PCA of the phytoplankton abundances, during April the five zones could be divided into three groups (Figure 3A). The first axis (PC1) explained 46.9% of the total variance, while the second axis (PC2) explained 29.1%. The species of Tetraedron triangulare Korshikov 1953 and Pediastrum duplex Meyen 1829 have a high abundance in Group I, and T. triangulare has a significant positive correlation with conductivity (r = 0.66, p ≤ 0.05), TDS (r = 0.67, p ≤ 0.05), humic acid (r = 0.68, p ≤ 0.05), and CODCr (r = 0.58, p ≤ 0.05), and have a significant negative correlation with transparency (r = −43, p = 0.05). P. duplex has a significant positive correlation with conductivity (r = 0.49, p ≤ 0.05), TDS (r = 0.52, p ≤ 0.05), humic acid (r = 0.55, p ≤ 0.05), and CODCr (r = 0.54, p ≤ 0.05), and a significant negative correlation with transparency (r = −4.7, p ≤ 0.05). The species Cyclotella sp. and Dinobryon sertularia Ehrenberg 1834 have a high abundance in Groups I and II, and Cyclotella sp. has a significant positive correlation with conductivity (r = 0.48, p ≤ 0.05), TDS (r = 0.45, p ≤ 0.05), chlorophyll-a (r = 0.64, p ≤ 0.05), and humic acid (r = 0.5, p ≤ 0.05), and a significant negative correlation with NO3-N (r = −42, p = 0.056). D. sertularia has a significant positive correlation with conductivity (r = 0.53, p ≤ 0.05), TDS (r = 0.49, p ≤ 0.05), chlorophyll-a (r = 0.58, p ≤ 0.05), CODcr (r = 0.45, p ≤ 0.05), and humic acid (r = 0.6, p ≤ 0.05), and a significant negative correlation with PO43− (r = −0.44, p = 0.05), while there is a significant negative correlation between Cyclotella sp. and NO3-N (r = −0.36, p = 0.1). The highest abundance of T. triangulare was in Group II, with a significant positive correlation with chlorophyll-a (r = 0.51, p ≤ 0.05), and a significant negative correlation with NO3-N (r = −0.45, p ≤ 0.05). Oscillatoria sp. has a high abundance in Groups II and III, but there was no significant correlation with physico-chemical parameters.
In June, the sampling points of the five zones could be divided into three groups based on the PCA (Figure 3B). The first axis (PC1) explained 61.8% of the total variance, while the second axis (PC2) explained 23.3%. Cosmarium sp. has a high abundance in Groups I and II, and a significant positive correlation with conductivity (r = 0.43, p ≤ 0.05), TDS (r = 0.41, p = 0.06), and TSS (r = 0.76, p ≤ 0.05), and a significant negative correlation with transparency (r = −0.45, p ≤ 0.05) and PO43− (r = 0.52, p ≤ 0.05). P. duplex has a high abundance in Groups I and II, and a significant positive correlation with conductivity (r = 0.66, p ≤ 0.05), TDS (r = 0.62, p ≤ 0.05), TSS (r = 0.74, p ≤ 0.05), and chlorophyll-a (r = 0.53, R = 0.01) and a significant negative correlation with transparency (r = −0.55, p ≤ 0.05), humic acid (r = −0.36, p = 0.1), and PO43− (r = 0.68, p ≤ 0.05). D. sertularia has a high abundance in Group I, and has a significant positive correlation with conductivity (r = 0.52, p ≤ 0.05), TDS (r = 0.49, p ≤ 0.05), TSS (r = 0.7, p ≤ 0.05), chlorophyll-a (r = 0.39, R = 0.08), and a significant negative correlation with transparency (r = −0.45, p ≤ 0.05), humic acid (r = −0.44, p ≤ 0.05), and PO43− (r = 0.5, p ≤ 0.05). The species Cyclotella sp. and Coelastrum microsporum Nägeli 1855 have the highest abundance in Group II, and Cyclotella sp. has a significant positive correlation with TSS (r = 0.5, p ≤ 0.05), Kejldahl-N (r = 0.43, p ≤ 0.05), and TP (r = 0.43, p ≤ 0.05). C. microsporum has a significant positive correlation with sulphate ion (r = 0.6, p ≤ 0.05). Oscillatoria sp. has a high abundance in Groups II and III, and a significant positive correlation with transparency (r = 0.54, p ≤ 0.05), CODcr (r = 0.54, p ≤ 0.05), NO3-N (r = 0.5, p ≤ 0.05), and PO43− (r = 0.53, p ≤ 0.05), and a significant negative correlation with conductivity (r = −0.6, p ≤ 0.05), TDS (r = −0.6, p ≤ 0.05), and chlorophyll-a (r = 0.4, p ≤ 0.01).
During July, the three zones could be divided into three groups based on the PCA (Figure 3C). The first axis (PC1) explained 64.6% of the total variance, while the second axis (PC2) explained 35.4%. Staurastrum paradoxum (Meyen ex Ralfs 1848) has the highest abundance in Group I. S. paradoxum has a significant positive correlation with conductivity (r = 0.5, p = 0.08), TDS (r = 0.45, p = 0.09), and NH4-N (r = 0.6, p ≤ 0.05), and a significant negative correlation with CODcr (r = −0.05, p = 0.07), humic acid (r = −0.45, p = 0.09), sulphate ion (r = 0.5, p = 0.07), and TP (r = −0.5, p = 0.06). Monactinus simplex (Meyen) Corda 1839 has the highest abundance in Group II. It has a significant positive correlation with NH4-N (r = 0.5, p = 0.05), and a significant negative correlation with secchi depth (r = −0.6, p = 0.01). Aulacoseira granulata (Ehrenberg) Simonsen 1979, Nostoc sp., Peridinium cinctum (O.F.Müller) Ehrenberg 1832, and Phacus sp. have the highest abundance in Group III, and A. granulata has a significant positive correlation with humic acid (r = 0.5, p = 0.05), and a significant negative correlation with conductivity (r = −0.45, p = 0.08), Kjeldahl-N (r = −0.5, p ≤ 0.054), and TDS (r = −0.5, p = 0.08). Nostoc sp. has a significant positive correlation with humic acid (r = 0.52, p ≤ 0.05), and sulphate ion (r = 0.6, p ≤ 0.05), and a significant negative correlation with conductivity (r = −0.62, p ≤ 0.05), TDS (r = −0.65, p ≤ 0.05), Kjeldahl-N (r = −0.66, p ≤ 0.05), and HCO3 (r = −0.66, p ≤ 0.05). P. cinctum has a significant positive correlation with humic acid (r = 0.66, p ≤ 0.05), CODcr (r = 0.66, p ≤ 0.05), and TP (r = 0.5, p = 0.07), and a significant negative correlation with conductivity (r = −0.7, p ≤ 0.05), TDS (r = −0.7, p ≤ 0.05), HCO3 (r = −0.56, p ≤ 0.05), and chlorophyll-a (r = −0.44, p = 0.1). Phacus sp. has a significant positive correlation with CODcr (r = 0.6, p ≤ 0.05), and a significant negative correlation with conductivity (r = −0.6, p ≤ 0.05), TDS (r = −0.6, p ≤ 0.05), and NH4-N (r = −0.44, p = 0.1).
In October, the five zones could be divided into three groups based on the PCA (Figure 3D). The first axis (PC1) explained 41.8% of the total variance, while the second axis (PC2) explained 35.4%. Ankistrodesmus falcatus (Corda) Ralfs 1848 and Kephyrion littorale J.W.G. Lund 1942 have the highest abundance in Group I, and A. falcatus has a significant positive correlation with humic acid (r = 0.5, p ≤ 0.05) and HCO3 (r = 0.5, p ≤ 0.05), and a significant negative correlation with transparency (r = −0.4, p = 0.06), NH4+ (r = −0.44, p ≤ 0.05), and sulphate ion (r = −0.5, p ≤ 0.05). K. littorale has a significant positive correlation with humic acid (r = 0.47, p ≤ 0.05), BOD5 (r = 0.44, p ≤ 0.05), TP (r = 0.4, p = 0.06), and HCO3 (r = 0.5, p ≤ 0.05). Asterionella formosa Hassall 1850 has a high abundance in Group III, and a significant positive correlation with transparency (r = 0.5, p ≤ 0.05) and a significant negative correlation with TDS (r = −0.4, p = 0.08) and humic acid (r = −0.45, p ≤ 0.05). Oscillatoria sp. and Lemmermannia triangularis (Chodat) C.Bock & Krienitz in C.Bock et al. 2013 have the highest abundance in Group III, and Oscillatoria sp. has a significant positive correlation with transparency (r = 0.4, p = 0.07) and T. triangulare has a significant negative correlation with conductivity (r = −0.4, p = 0.1), TDS (r = −0.4, p = 0.08), and HCO3 (r = −0.5, p ≤ 0.05). Nizschia acicularis (Kützing) W.Smith 1853 has the highest abundance in Groups II and III, and a significant negative correlation with conductivity (r = −0.5, p ≤ 0.05), TDS (r = −0.4, p ≤ 0.05), and HCO3 (r = −0.4, p = 0.1).

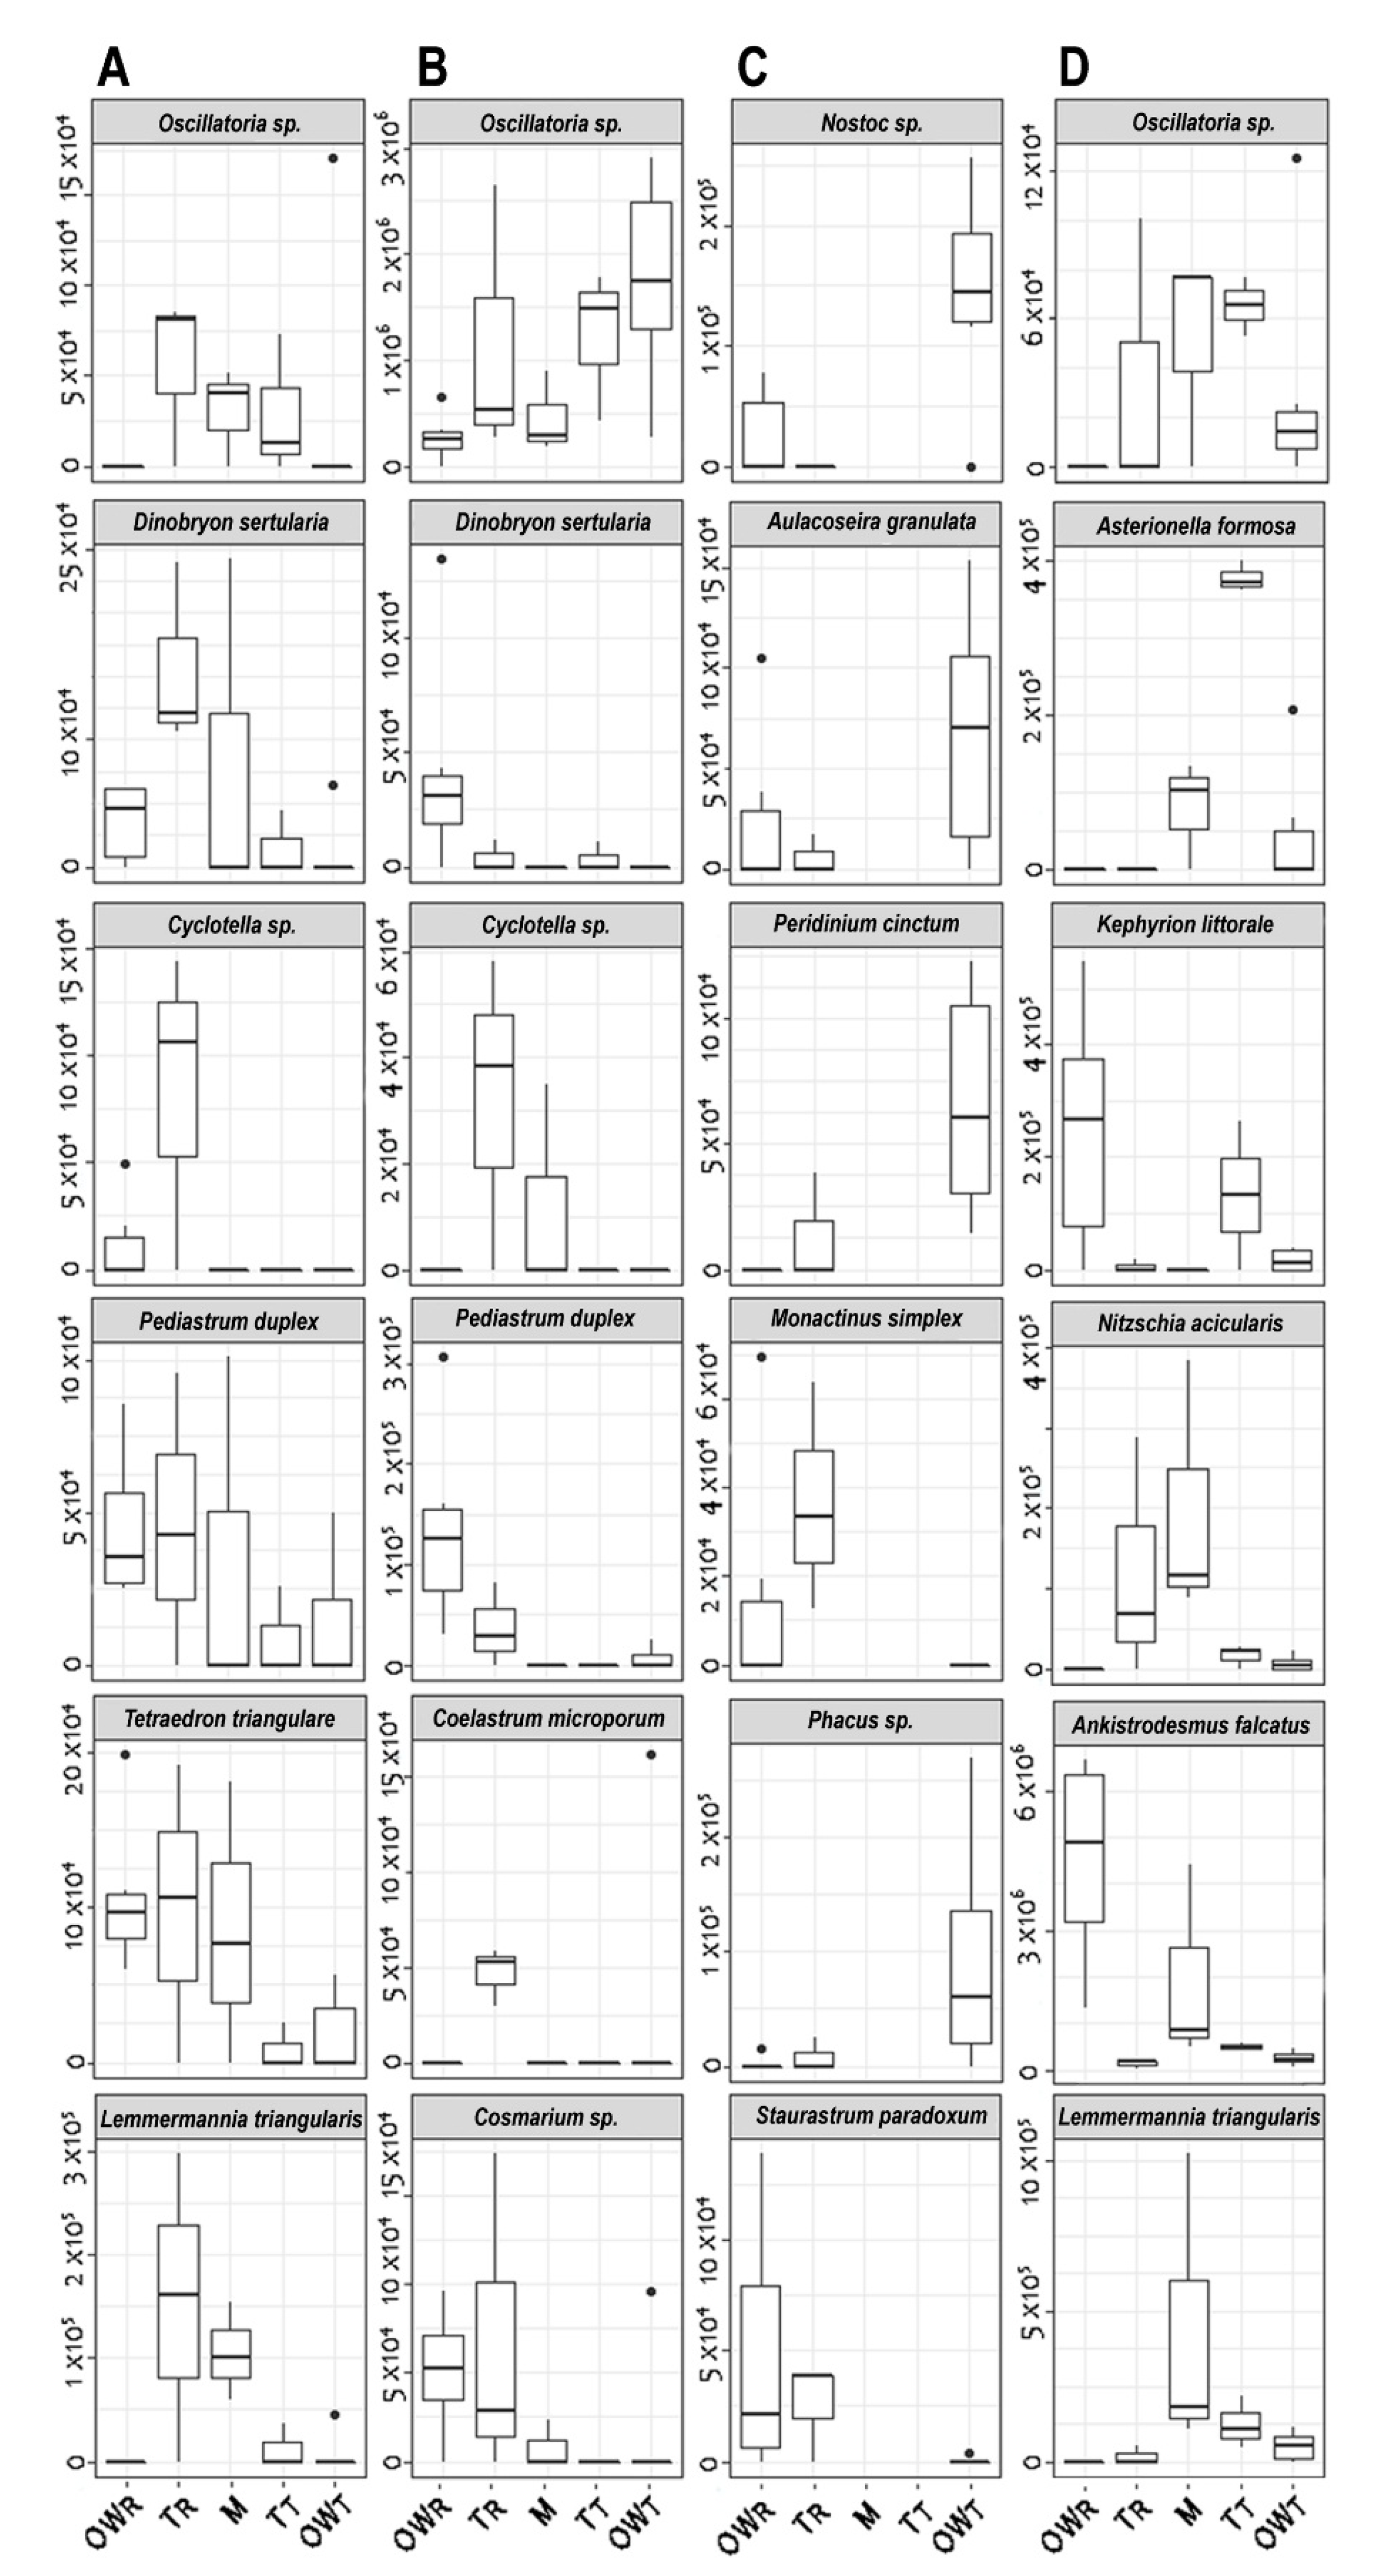
3.3. Occurrence of Dominant Algal Species in the Investigated Sampling Times

During April (Figure 4A), Cyclotella sp. has the highest variance and maximum abundance in the TR transect, while D. sertularia has the highest variance and abundance in the M zone. Oscillatoria sp. has the highest variance and abundance in the TR and TT zones, while the maximum occurred in the OWT zone. P. duplex has the highest variance and maximum abundance in the M, TR, and OWR zones respectively. L. triangularis has the maximum abundance in the OWR zone, while its highest variance was in the TR and M zones, respectively. L. triangularis species has the highest variance and maximum abundance in the sampling points of the TR and M zones, respectively.
In June (Figure 4B), Cosmarium sp. has the highest variance and maximum abundance in the TR and OWR transects, respectively. P. duplex has the highest variance and maximum abundance in the OWR and TR zones, respectively. D. sertularia has the highest variance and maximum abundance in the OWR zone. Cyclotella sp. has the highest variance and maximum abundance in the TR and M zones, respectively. C. microsporum has the highest variance maximum abundance in the TR zone, and Oscillatoria sp. has the highest variance and maximum abundance in the OWT, TR, and TT zones, respectively.
In July (Figure 4C), A. granulata, Nostoc sp., P. cinctum and Phacus sp. have the highest variances and maximum abundances in the OWT zone, while S. paradoxum has the highest variance and maximum abundance in the OWR zone. Monactinus simplex has the highest variance in the TR zone and the maximum abundance in the OWR zone.
In October (Figure 4D), A. falcatus has the highest variance and maximum abundance in the OWR and M zones, respectively. K. littorale has the highest variance and maximum abundance in the OWR and TR zones, respectively. A. formosa has the maximum abundance in the TT transect and the highest variance in the M and OWT zones, respectively. Oscillatoria sp. has the highest variance and maximum abundance in the TR and M zones, respectively. L. triangularis has the highest variance maximum abundance in the M zone. N. acicularis has the highest variance and maximum abundance in the M and TR zones, respectively.

4. Discussion

In April, the oxbow lake can be divided into two groups of three zones based on both physico-chemical variables and the characteristic algal species. The two open water zones (OWR and OWT) were clearly separated from each other, and from the middle zones too. Typically the water in the OWR zone is more stagnant than in the OWT zone, where there is the possibility to replenish water from the Tisza River. The dominant algal group in April was green algae (Chlorophyceae with 40% of the total abundance), which were found in colony-forming forms of the genus such as T. triangulare and P. duplex, which are characteristic of the OWR zone. The Chlorophyceae group negatively correlated with NO3-N, a phenomenon which was also observed at Lake Glebokie in Poland [29]. P. duplex was a characteristic species of the OWR transect in Group I in April. It is a cosmopolitan species, but prefers meso- and eutrophic water bodies [30,31]. Based on Ramezanpoor’s study [32], T. triangulare prefers low oxygen concentrations; however, according to another study, this species is typical of relatively nutrient-poor (oligo- and mesotrophic) waters with a neutral pH [33], while another research study pointed out that T. triangulare was the most abundant in cases of high macrovegetation coverage (Lake Dabrowka, Poland) [34].
We also found during our study that the TR zone is similar to the OWR zone, based on physico-chemical variables. The OWR and TR zones were characterized by very high total phosphorus-ion, Kjeldahl–nitrogen concentrations, and high chemical oxygen demand, all of which indicate a higher trophic level of water. Relatively high conductivity was characteristic of the OWR and TR zones in April. In addition, the TR zone was characterized by the presence of aquatic plants such as S. aloides L., C. demersum, and N. alba L. at the beginning of the annual vegetation period. Members of Dinobryon sp. and Cyclotella sp. mostly occur—with high abundances—in oligo- and mesotrophic waters in the temperate zone [35,36]. Members of the Dinobryon genus prefer waters around estuaries [37] as well as those with relatively high conductivity [38].
Except for its physico-chemical variables, the TR zone is similar to the M (Middle) zone, based on the characteristic algal species. The M zone of the oxbow lake in April was characterized by a relatively small amount of nutrient resource. In Group II (in April)—on the basis of PCA—the M zone was characterized by low dissolved oxygen and nitrite-nitrogen concentrations. The other characteristic taxon in this group is the Oscillatoria genus, which is abundant in waters used for irrigation [39,40]. One of the main uses of the oxbow lake studied is irrigation, with the water extraction point being located in the M zone. Most of the aquatic plant coverage (S. aloides L., C. demersum, N. alba L.) of the M zone was the remains of the previous vegetation period (which can be found under the water surface). This phenomenon provides different conditions and different habitats for the algal community. Based on our study, it can be concluded that the influence of macrophytes—which is very characteristic of the M zone—is already significant in April toward the open water zone (OWR).
The third group in April included the sections of the TT (transitional zone-Tiszanagyfalu) and OWT (open water-Tiszanagyfalu) regions. The group is characterized by very high sulphate ion, PO43−, transparency, and NO3-N values. The third group in April included the sections of the TT (transitional zone-Tiszanagyfalu) and OWT (open water-Tiszanagyfalu) regions, which are characterized by very high sulphate ion, PO43−, transparency, and NO3-N values.
In June the oxbow lake also can be divided into three groups based on the PCA of physico-chemical variables and the characteristic algal plankton community. The first group includes the OWR zone. This group was characterized by high concentrations of TDS, conductivity, TSS, humic acid, chlorophyll-a, NH4-N, ODO, and BOD5. The first group includes the transects of the OWR zone characterized by the presence of large numbers of P. duplex, Dinobryon, and Cosmarium species. The two open water zones (OWR and OWT) were clearly separated from each other, and the OWR zone was strongly separated from the other areas in June, both in terms of physico-chemical variables and in characteristic algal species. Dinobryon was the most specific taxa of Group I (OWR); it often occurs in waters characterized by relatively higher conductivity [41]. Cosmarium taxa are also characteristic of Group I in June; this genus is widely distributed in Europe but prefers eutrophic habitats [42]. P. duplex is a common species in warmer, meso-, and eutrophic waters [43,44]. The high BOD5 and NH4-N values indicate a tendency to eutrophication during June, while high conductivity, TDS, and TSS values indicate that the water was concentrating in the oxbow lake at the beginning of the warm and irrigation periods.
The second group contains the TR and M zones, characterized by very high Kjeldahl-N, total-P, and sulphate ion concentrations. The second group is characterized by the high abundance of Cyclotella and C. microporum. By the beginning of summer, a large extent of macrovegetation coverage formed on the water surface (S. aloides L., Trapa natans, Lemna minor, Nymphaea alba L., and Nuphar lutea) and in the water column (C. demersum L.). These macrophytes provide unique conditions and different habitats for the algal plankton community, which could influence algal plankton composition through resource competition, allelopathy and differences in light conditions [24,45]. Plants covering the surface of the water can seal the water column below them, thus inhibiting the dissolution of oxygen from the atmosphere [46]. By the beginning of the summer, a very significant macrophyte coverage had developed on the water surface in the TR zone, which contributed to the development of anaerobic conditions. It can be also concluded that the impact of the macrophyte coverage—which was very dense in the TR, M, and TT zones—is already significant in June towards the open water region (OWR) of Rakamaz. Despite the physical and chemical variables, the M zone is similar to the TT and OWT zones in terms of algal species composition. Cyclotella is a typical species of Group II in June, and it prefers water bodies with a high total-phosphorus concentration [47]. The other characteristic taxon of Group II is C. microporum, which prefers eutrophic waters [48]. C. microporum is also able to make good use of the various forms of carbon from organic substances in warm, heterotrophic, low-light environments, which results in the appearance of this species with high abundances [49].
The third group in June includes the transects of the TT and OWT zones which were characterized by very high PO43−, humic acid, NO3-N, NO2-N, CODcr, and transparency values. The characteristic taxon of Group III is the genus Oscillatoria, which is highly correlated with orthophosphate (r = 0.5, p = 0.01) which could influence cyanobacterial growth [50]. Oscillatoria very often occurs with a high abundance in waters used for irrigation and is able to produce a very large biomass with its vegetative reproduction. This usage of the oxbow lake significantly influences the composition of algae species.
In July, based on the PCA of physico-chemical variables and characteristic algal plankton species, the oxbow lakes’ transects can be divided into three groups. The two open water regions (OWR and OWT) were completely separated from each other, as occurred in the previous season.
The first group included the transects of the OWR zone. This group was characterized by high concentrations of TSS, ODO, depth, CO32−, chlorophyll-a, conductivity, and TDS. This group is also characterized by a high abundance of S. paradoxum. The water level decreased in late summer, and because of this, this group is characterized by a high conductivity. Here, the effect of water replenishment is even less noticeable than in Group III. The characteristic taxon of Group I was Staurastrum paradoxum. According to a Serbian study, 50% of the S. paradoxum taxon was found in mesotrophic and eutrophic water bodies [51].
The second group in July included the transect of the TR zone. Group II was characterized by very high CODsMn, which indicates a high organic matter content in the water body. High concentrations of nutrients are also found in this zone. In addition to a high concentration of Kjeldahl-N and high pH, high concentrations of NH4-N and NO3-N are also characteristic, indicating longer anaerobic periods, especially near the sediment. This group is characterized by a high abundance of M. simplex, which is able to produce large amounts of biomass by the end of summer with an inexhaustible source of nutrients [52].
The third group in July included the OWT zone, characterized by the highest concentrations of NO2-N, sulphate ion, humic acid, and BOD5. Group III′s main algal species were A. granulata, Nostoc sp., P. cinctum, and Phacus. One of the most characteristic taxons of Group III is Phacus. Members of this genus have been observed in rice fields where anaerobic conditions can develop due to prolonged flooding [53]. However, they are very fond of the presence of large amounts of organic matter. Another characteristic taxon of this group is the genus Nostoc, which is capable of nitrogen fixation from the atmosphere. Despite their large numbers, they do not reduce the amount of nitrogen forming in the water body. Furthermore, Nostoc correlates negatively with conductivity (r = −0.62, p = 0.01), and it has been found that cyanobacteria such as Nostocales occurs more frequently in shallow lakes with low conductivity [54]. A. granulata, a species which mostly occurs in the summer vegetation period [55], is also a characteristic species in Group III. The same group is also characterized by P. cinctum, which in many cases has been found in eutrophic or meso-eutrophic standing waters [56,57], and is highly correlated with humic acid (r = 0.65, p = 0.01). A high concentration of humic acid has been found to highly affect dinoflagellates growth [58]. This species prefers high temperatures, the presence of large amounts of nitrogen and organic matter in the water body. One of the typical water uses of this oxbow lake is fishing, during which (ground bait) a significant amount organic matter enters the water. At the same time, the other water use is the irrigation of the surrounding arable land, which significantly reduces the water level of the oxbow lake in summer, causing higher temperatures and increased evaporation.
In October, the oxbow lake can be divided into three separate groups based on the PCA of physico-chemical concentrations and characteristic algal plankton abundances. The two open water regions (OWR and OWT) were completely separated from each other as in the case of the summer sampling period.
The first group includes the OWR zone. This group was characterized by high concentrations of ODO, NO3-N, TSS, CODcr, humic acid, total-P, and BOD5, and characterized by a high abundances of K. littorale and A. falcatus. A. falcatus is a very effective algal species for removing ammonium nitrogen [59] from a water body, and causes the accumulated ammonium ion concentration—enriched during summer—to decrease. K. littorale is common in northern water bodies [60,61,62], in lakes considered oligo- and mesotrophic water bodies. This phenomenon indicates that the OWR zone was also mesotrophic in October.
The second group contains the TR, zone, characterized by the very high PO43− and chlorophyll-a concentrations. Orthophosphate is an easily accessible nutrient for algal plankton species, and its abundance created competition in the algal community. This can explain why we cannot identify a separate group based on the result of the PCA made on the algal plankton abundances. The second group consists of the sections of the TR zone, characterized by very low amount species. Through our study in October, the TR, TT, and M zones in Group II had similar characteristics based on physico-chemical variables. Meanwhile, the M and TT zones were similar to the OWT zone, based on the characteristic species.
In terms of algal plankton abundances, the oxbow lake was also divided into three groups in October, based on the principal component analysis of physico-chemical variables and on characteristic algal plankton species. The third group in October included the transects of the OWT zone, which were characterized by very high Kjeldahl-N, EC, TDS, NH4+, sulphate ion, NO2-N concentrations, and transparency values. This group consists of the transects of the M, TT, and OWT zones and is characterized by high abundances of A. formosa, Oscillatoria sp., L. triangulare, and N. acicularis. Due to the anaerobic conditions—typical for the summer period—high concentrations of nitrite nitrogen and orthophosphate ion remained in the water body. High concentrations of orthophosphate and nitrogen in water promote an increase in the amount of an easily dominant algal taxon [63]. Eutrophic waters are characterized by high concentrations of orthophosphate ion, and various nitrogen forms, such as Group III sections, where N. acicularis could easily become dominant. The lack of phosphorus is a limiting factor for phytoplankton. One species characteristic of Group III is A. formosa, which is common in mesotrophic and eutrophic lakes [64]. The high number of different nitrogen forms indicate prolonged anaerobic conditions during the decomposition of organic matter, which can provide an opportunity for the eutrophication processes. Low water levels, water scarcity, and water abstraction for irrigation are also indicated by the large presence of the genus Oscillatoria. L. triangulare also appeared in October at the M zone, which was also previously marked in April in the M zone. Another study also found that this species appears in conjunction with macrovegetation coverage [35]. The species was negatively correlated with ODO (r = −0.5, p = 0.01), and a study on 21 standing water body of the Araguaia River has shown that T. triangulare prefers high transparency and oxygen-deficient waters [65]. Our study also observed the impact of macrovegetation coverage, which was dense in October but less dense than in July in the TR, M, and TT zones.
In April, based on our results (physico-chemical and algal plankton) we found meso-eutrophic conditions (high conductivities, low dissolved oxygen concentrations) in the OWR zone (Figure 5), while a higher trophic condition was characteristic in the TR zone (high abundances of nutrients). However, a study on a high mountain lake in India [66] found that Chlorophyceae was only the second most dominant group. It was shown in our study that species of Chlorophyceae were the most dominant group. In the M zone, we found the lowest amount of nutrients and the least number of algal species, which indicated oligo-mesotrophic conditions. The occurrence of an increased amount of orthophosphate-ion indicated anaerobic conditions; however, the accumulation of nitrate-nitrogen indicates an external load of nutrients, larger amounts of which mainly occur in oxygen-filled, aerobic waters. The oxbow lake only gets its water supply from the Tisza River at the OWT zone. The TT and the OWT are deeper than the other zones, leading to an increased transparency. In spring, the high amount of orthophosphate-ion indicated anaerobic conditions near the sediment; however, the amount of nitrate-nitrogen indicated an external load of nutrients—more than that which mainly occurs in oxygen-rich aerobic environments.
Greater nutrient concentrations in the early summer stage (June) indicates the process of eutrophication and the increase in trophic levels. Welch et al. [67] in their research showed that the process of eutrophication could be slowed by adding water with low-nutrient content. Species that had become dominant during early summer indicated meso-eutrophic and eutrophic conditions in the open water zones and in the transitional zones, as well. High conductivity became a characteristic environmental variable, caused by evaporative loss accompanying a higher temperature at the early stages of the irrigation season. Our results suggests an increased amount of organic materials, and their decomposition from the huge quantities of the macrovegetational nutrient source. The characteristic species indicated eutrophic conditions in the M zone. The macrophyte stock had developed a huge coverage by the summer. Currents caused by irrigational water outlet and summer storms drifted the floating vegetation towards the open water zones.
In July, there was a decent amount of nutrients (easily accessible nitrogen forms) in the OWR zone, which caused a slight trophic condition decrease by the fall. Depending on the specific species, this part of the oxbow turned into a mesotrophic state. During the summer a significant amount of orthophosphate-ion was released from the sediment of the TR zone due to the long lasting anaerobic states, and the dominant species indicated eutrophic conditions, which ended the lack of phosphate and led to competition between algal taxons close to the end of the vegetation period. A huge macrophyte stock formed on top of the water in the M zone, significantly limiting the dissolution of oxygen into the water and the intensity of photosynthesis. Algal species that had become dominant during July indicated a meso-eutrophic-eutrophic relationship at the TT and OWT zones.
In October, the trophic level slightly decreased, becoming meso-eutrophic, but the dominant algal species indicated a higher trophic level. The trophic level remained mesotrophic in the OWR zone, despite the decreasing concentration of nutrients. The nutrient-abundant and anaerobic state was stagnant in the TT and OWT zones, and both showed similar conditions during the entire investigation period in terms of physico-chemical condition variables; furthermore, they are classified in the exact same group when it comes to specific species.
According to our research, it is beyond reasonable doubt that the factors (physico-chemical variables) mentioned above have a massive impact on both the OWT and the TT zone; the riverbed in these zones is deeper, leading to increased transparency. Senhikumar and Sivakumar [68] also found that the algal plankton composition is closely related to seasonal hydrography. It is safe to say that the two open-water regions of the oxbow (OWR and OWT) were in a meso-eutrophic state during the spring, and copious nutrient sources were available for primary producers. However, when it comes to the OWT zone, anaerobic states occurring near the sediment were significant, resulting in a release of nutrient sources. By summer the open water zones remained meso-eutrophic and eutrophic, while the conditions regarding the OWR during fall were mesotrophic. The macrovegetation coverage and the decrease in water levels influenced by irrigation had huge impacts on both of the transitional zones. In October, both of the zones showed meso-eutrophic conditions. A huge amount of macrophyte stock had accumulated over the year in the M zone, which had a huge impact on the nutrient quantities in the water. In the spring, the algal abundances indicated oligo-mesotrophic conditions; however, by summer, the trophic level of the water had increased significantly, and characteristic species showed eutrophic relations. Jargal et al. [69] found that large macrovegetation coverage, water level fluctuation and nutrient enrichment are the most common water quality issues. With the arrival of fall, the trophic conditions decreased once again to a mesotrophic level. Based on the dominant algal taxa, among the investigated areas of the oxbow lake, zone M experienced the greatest change in its trophic level.
When classifying a smaller water body, sampling of the algal plankton composition and physical and chemical properties takes place only at a few locations and on rare occasions. Certain aspects of waters are significantly influenced by factors of seasonal changes, the change in macrovegetation coverage, land use, and supplements of water; as a consequence, algal plankton abundance and dominance may undergo remarkable changes. According to our research, even in a small water body like the Nagy–Morotva oxbow lake, there are spectacular differences between physical and chemical attributes and algal species. Thus, open waters (OWR and OWT) and vegetation covered waters (M) separate from each other, and not only in the main zones but in the transitional zones too.

Author Contributions

Conceptualization, M.M.Y., I.S. and I.G.; Methodology, M.M.Y. and I.S.; Software, M.M.Y., S.S. and L.J.S.; Validation, G.D. and S.A.N.; Formal analysis, S.A.N. and É.Á.; Investigation, M.M.Y., I.B. and A.S.; Resources, S.A.N. and J.N.; Data curation, C.B., S.S. and L.J.S.; Writing—original draft preparation, M.M.Y. and I.S.; Writing—review and editing, M.M.Y., I.S. and C.B.; Visualization, M.M.Y. and I.S.; Supervision, I.G. and É.Á.; Project administration, S.A.N.; Funding acquisition, J.N. and S.A.N. All authors have read and agreed to the published version of the manuscript.

Funding

Project no. TKP2020-IKA-04 has been implemented with the support provided from the National Research, Development and Innovation Fund of Hungary, financed under the 2020-4.1.1-TKP2020 funding scheme.

Institutional Review Board Statement

Not applicable.

Informed Consent Statement

Not applicable.

Data Availability Statement

The study did not report any data.

Acknowledgments

We would like to express my appreciation toward my colleagues in the Department of Hydrobiology of the University of Debrecen for their great effort and contribution in sampling.

Conflicts of Interest

The authors declare no conflict of interest. The funders had no role in the design of the study; in the collection, analyses, or interpretation of data; in the writing of the manuscript, or in the decision to publish the results.

References

  1. Berta, C.; Tóthmérész, B.; Wojewódka, M.; Augustyniuk, O.; Korponai, J.; Bertalan-Balázs, B.; Nagy, S.A.; Grigorszky, I.; Gyulai, I. Community response of Cladocera to trophic stress by biomanipulation in a shallow oxbow lake. Water 2019, 11, 929. [Google Scholar] [CrossRef] [Green Version]
  2. Vincent, W.F. Effects of climate change on lakes. In Encyclopedia of Inland Waters; Likens, G.E., Ed.; Elsevier: Amsterdam, The Netherlands, 2009; pp. 55–60. [Google Scholar] [CrossRef]
  3. Nyeste, K.J.; Dobrocsi, P.; Czeglédi, I.; Czédli, H.; Harangi, S.; Baranyai, E.; Simon, E.; Nagy, S.A.; Antal, L. Age and diet-specific trace element accumulation patterns in different tissues of chub (Squalius cephalus): Juveniles are useful bioindicators of recent population. Ecol. Indic. 2019, 101, 1–10. [Google Scholar] [CrossRef] [Green Version]
  4. Meerhoff, M.; de Mello, T.F.; Kruk, C.; Alonso, C.; Bergonzoni, I.G.; Pacheco, J.P.; Lacerot, G.; Arim, M.; Beklioglu, M.; Balmana, S.B.; et al. Environmental warming in shallow lakes: A review of potential changes in community structure as evidenced from space-for-time substitution approaches. Adv. Ecol. Res. 2012, 46, 259–349. [Google Scholar] [CrossRef]
  5. Scheffer, M. Ecology of Shallow Lakes, 1st ed.; Springer: Dordrecht, The Netherlands, 2004; pp. 1–357. [Google Scholar] [CrossRef]
  6. Moss, B.; Stephen, D.; Alvarez, C.; Becares, E.; Van De Bund, W.; Collings, S.E.; Van Donk, E.; De Eyto, E.; Feldmann, T.; Fernández-Aláez, C.; et al. The determination of ecological status in shallow lakes—A tested system (ECOFRAME) for implementation of the European Water Framework Directive. Aquat. Conserv. 2003, 13, 507–549. [Google Scholar] [CrossRef]
  7. Bhateria, R.; Disha, J. Water quality assessment of lake water: A review. Sustain. Water Resour. Manag. 2016, 2, 161–173. [Google Scholar] [CrossRef] [Green Version]
  8. Hillbricht-Ilkowska, A. Shallow lakes in lowland river systems: Role in transport and transformations of nutrients and in biological diversity. Hydrobiologia 1999, 408, 349–358. [Google Scholar] [CrossRef]
  9. Dembowska, E.A.; Mieszczankin, T.; Napiórkowski, P. Changes of the phytoplankton community as symptoms of deterioration of water quality in a shallow lake. Environ. Monit. Assess. 2018, 190, 95. [Google Scholar] [CrossRef] [PubMed] [Green Version]
  10. Van Donk, E.; van de Bund, W.J. Impact of submerged macrophytes including charophytes on phyto- and zooplankton communities: Allelopathy versus other mechanisms. Aquat. Bot. 2002, 3–4, 261–274. [Google Scholar] [CrossRef]
  11. Song, Y.; Liew, J.H.; Sim, Z.H.; Mowe, M.A.D.; Mitrovic, S.M.; Tan, H.T.W.; Yeo, D.C.J. Effects of macrophytes on lake-water quality across latitudes: A meta-analysis. Oikos 2018, 128, 468–481. [Google Scholar] [CrossRef]
  12. Joniak, T.; Kuczyńska-Kippen, N. Habitat features and zooplankton community structure of oxbows int he limnophase: Reference to transitional phase between flooding and stabilization. Limnetica 2011, 29, 37–48. [Google Scholar]
  13. Borics, G.; Nagy, L.; Miron, S.; Grigorszky, I.; László-Nagy, Z.; Lukács, B.A.; G.-Tóth, L.; Várbíró, G. Which factors affect phytoplankton biomass in shallow eutrophic lakes? Hydrobiologia 2013, 714, 93–104. [Google Scholar] [CrossRef] [Green Version]
  14. Biggs, J.; von Fumetti, S.; Kelly-Quinn, M. The importance of small waterbodies for biodiversity and ecosystem services: Implications for policy makers. Hydrobiologia 2017, 793, 3–39. [Google Scholar] [CrossRef]
  15. Ferencz, B.; Dawidek, J.; Toporowska, M. Instability of water quality of a shallow, polymictic, flow-through lake. Water Air Soil Pollut. 2018, 229, 141. [Google Scholar] [CrossRef] [Green Version]
  16. Somlyai, I.; Berta, C.; Nagy, S.A.; Dévai, G.; Ács, É.; Szabó, L.J.; Nagy, J.; Grigorszky, I. Heterogeneity and anthropogenic impacts on a small lowland stream. Water 2019, 11, 2002. [Google Scholar] [CrossRef] [Green Version]
  17. Choudhury, A.K.; Pal, R. Phytoplankton and nutrient dynamics of shallow coastal stations at Bay of Bengal, Eastern Indian coast. Aquat. Ecol. 2010, 44, 55–71. [Google Scholar] [CrossRef]
  18. Carpenter, S.R.; Stanley, E.H.; Zanden, H.J.V. State of the World’s freshwater ecosystems: Physical, chemical, and biological changes. Annu. Rev. Environ. Resour. 2011, 36, 75–99. [Google Scholar] [CrossRef] [Green Version]
  19. Gligora, M.; Plenković-Moraj, A.; Kralj, K.; Grigorszky, I.; Peroš-Pucar, D. The relationship between phytoplankton species dominance and environmental variables in a shallow oxbow lake (Lake Vrana, Croatia). Hydrobiologia 2007, 584, 337–346. [Google Scholar] [CrossRef]
  20. Pereira, S.A.; Trindade, C.R.T.; Albertoni, E.F.; Palma-Silva, C. Aquatic macrophytes as indicators of water quality in subtropical shallow lakes, Southern Brazil. Acta Limnol. Bras. 2012, 1, 52–63. [Google Scholar] [CrossRef] [Green Version]
  21. Zingel, P.; Nõges, P.; Tuvikene, L.; Feldmann, T.; Järvalt, A.; Tõnno, I.; Agasild, H.; Tammert, H.; Luup, H.; Salujõe, J.; et al. Ecological processes in macrophytes- and phytoplankton-dominated shallow lakes. Proc. Est. Acad. Sci. Biol. Ecol. 2006, 55, 280–307. [Google Scholar]
  22. Carpenter, R.S.; Lodge, D.M. Effects of submerged macrophytes on ecosystem processes. Aquat. Bot. 1986, 26, 341–370. [Google Scholar] [CrossRef]
  23. Väliranta, M.; Kultti, S.; Nyman, M.; Sarmaja-Korjonen, K. Holocene development of aquatic vegetation in shallow Lake Njargajavri, Finnish Laplan, with evidence of water-level fluctuations and drying. J. Paleolimnol. 2005, 34, 203–215. [Google Scholar] [CrossRef]
  24. Ozimek, T.; Gulati, R.D.; van Donk, E. Can macrophytes be useful in biomanipulation of lakes? The Lake Zwemlust example. Hydrobiologia 1990, 200, 399–407. [Google Scholar] [CrossRef] [Green Version]
  25. Winder, M.; Sommer, U. Phytoplankton response to a changing climate. Hydrobiologia 2012, 698, 5–16. [Google Scholar] [CrossRef]
  26. Sakshaug, E. Phytoplankton Manual–Monography on Oceanographic Methodology. 6: A. Sournia; UNESCO: Paris, France, 1978; pp. 1–337. [Google Scholar] [CrossRef]
  27. Utermöhl, H. Neue Wege in der quantitativen Erfassung des Planktons (mit besonderer Berucksichtigung des Ultraplanktons). Verh. Int. Ver. Theor. Angew. Limnol. 1931, 5, 567–596. [Google Scholar] [CrossRef]
  28. Felföldy, L. A Biológiai Vízminősítés, 4th ed.; VGI: Budapest, Hungary, 1987; pp. 1–258. [Google Scholar]
  29. Hammer, Ø.; Harper, D.A.T.; Ryan, P.D. PAST: Paleontological statistics software package for education and data analysis. Palaeontol. Electron. 2001, 4, 1–9. [Google Scholar]
  30. Kozak, A.; Gołdyn, R.; Dondajewska, R.; Kowalczewska-Madura, K.; Holona, T. Changes in phytoplankton and water quality during sustainable restoration of an urban lake used for recreation and water supply. Water 2017, 9, 713. [Google Scholar] [CrossRef] [Green Version]
  31. Sige, D.C.; Dean, A.; Levado, E.; Tobin, M.J. Fourier-transform infrared spectroscopy of Pediastrum duplex: Characterization of a micro-population isolated from a eutrophic lake. Eur. J. Phycol. 2002, 37, 19–26. [Google Scholar] [CrossRef]
  32. Lenarczyk, J. Pediastrum Meyen sensu lato (Chlorophyceae) in the phytoplankton of lowland and upland water bodies of Central Europe (Poland). Fottea 2015, 15, 165–177. [Google Scholar] [CrossRef]
  33. Ramezanpour, Z.; Sukop, I.; Heteša, J. Phytoplankton diversity and their succession in water bodies of the Lednice Park during 2002 season. Acta Univ. Agric. Silvic. Mendel. Brun. 2004, 52, 83–96. [Google Scholar] [CrossRef] [Green Version]
  34. Willén, E. Planktonic green algae in an acidification gradient of nutrient-poor lakes. Arch. Protistenkd. 1992, 141, 47–64. [Google Scholar] [CrossRef]
  35. Celewicz-Gołdyn, S.; Kuczyńska-Kippen, N.; Nagengast, B. Phytoplankton community structure in two types (forest vs. field) of small water bodies. Steciana 2008, 12, 23–28. [Google Scholar]
  36. Watson, S.B.; Whitton, B.A.; Higgins, S.; Paerl, H.; Brooks, B.W.; Wehr, J.D. Harmful algal blooms. In Freshwater Algae of North America, 2nd ed.; Wehr, J., Sheath, R., Kociolek, J.P., Eds.; Academic Press: San Diego, CA, USA, 2015; pp. 1–11. [Google Scholar]
  37. Pappas, J.L. Phytoplankton assemblages, environmental influences and trophic status using canonical correspondence analysis, fuzzy relations, and linguistic translation. Ecol. Inform. 2010, 5, 79–88. [Google Scholar] [CrossRef] [Green Version]
  38. Dale, A.G. Colonies as Defence in the Freshwater Phytoplankton Genus Dinobryon (Chrysophyceae). Ph.D. Thesis, University of British Columbia, Vancouver, BC, Canada, 1985. [Google Scholar]
  39. Celewicz-Gołdyn, S. Abundance of Dinobryon divergens Imhoff in the eutrophic Lake Rosnowskie Duze in 2002–2003. Steciana 2005, 9, 23–30. [Google Scholar]
  40. Mohamed, Z.A. Allelophatic activity of Spirogyra sp.: Stimulating bloom formation and toxin production by Oscillatoria agardhii in some irrigation canals, Egyp. J. Plankton Res. 2002, 24, 137–141. [Google Scholar] [CrossRef] [Green Version]
  41. Brittain, S.; Mohamed, Z.A.; Wang, J.; Lehmann, V.K.; Carmichael, W.W.; Rinehart, K.L. Isolation and characterization of microcystins from a river nile strain of Oscillatoria tenuis Agardh ex Gomont. Toxicon 2000, 38, 1759–1771. [Google Scholar] [CrossRef]
  42. Taş, B.; Gönülol, A.; Taş, E. Seasonal dynamics and biomass of mixotrophic flagellate Dinobryon sertularia Ehrenberg (Chrysophyceae) in Derbent reservoir (Samsun, Turkey). Turk. J. Fish. Aquat. Sci. 2010, 10, 305–313. [Google Scholar] [CrossRef]
  43. Stamenković, M.; Cvijan, M. High tolerance to water pollution in Cosmarium boitierense Kouwets and Staurastrum bloklandiae Coesel et Joosten, taxa recorded for the first time from the Balkan Peninsula. Algol. Stud. 2008, 127, 83–94. [Google Scholar] [CrossRef]
  44. Hutchinson, G.E. A treatise on limnology. In Introduction to Lake Biology and the Limnoplankton; John Wiley & Sons: New York, NY, USA, 1967; Volume II, p. 1115. [Google Scholar]
  45. Del Zamaloa, M.C.; Tell, G. The fossil record of freshwater micro-algae Pediastrum Meyen (Chlorophyceae) in Southern South America. J. Paleolimnol. 2005, 34, 433–444. [Google Scholar] [CrossRef]
  46. Fonseca, B.M.; Bicudo, C.E.M. How important can the presence/absence of macrophytes be in determining phytoplankton strategies in two tropical shallow reservoirs with different trophic status? J. Plankton Res. 2010, 32, 31–46. [Google Scholar] [CrossRef] [Green Version]
  47. Stansbury, J.; Kozimor, L.; Admiraal, D.; Dove, E. Water quality modeling of the effects of macrophytes on dissolved oxygen in a shallow tailwater reservoir. Lake Reserv. Manag. 2008, 24, 339–348. [Google Scholar] [CrossRef] [Green Version]
  48. Wunsam, S.; Schmidt, R.; Klee, R. Cyclotella-taxa (Bacillariophyceae) in lakes of the Alpine region and their relationship to environmental variables. Aquat. Sci. 1995, 57, 360–386. [Google Scholar] [CrossRef]
  49. Bouterfas, R.; Belkoura, M.; Dauta, A. The effects of irradiance and photoperiod ont he growth rate of three freshwater green algae isolated from a eutrophic lake. Limnetica 2006, 25, 647–656. [Google Scholar]
  50. Lynch, D.L.; Fenwick, M.G.; Hansen, L.O. Heterotrophic nutrition in the genus Coelastrum Naeg. Trans. Am. Microsc. Soc. 1967, 86, 499–502. [Google Scholar] [CrossRef]
  51. Chang, X.; Eigemann, F.; Hilt, S. Do macrophytes support harmful cyanobacteria? Interactions with a green alga reverse the inhibiting effects of macrophyte allelochemicals on Microcystis aeruginosa. Harmful Algae 2012, 19, 76–84. [Google Scholar] [CrossRef]
  52. Fužinato, S.; Cvijan, M.; Krizamanić, J. A checklist of Desmids (Conjugatophyceae, Chlorophyta) of Serbia. III. Genus Staurastrum. Cryptogam. Algol. 2011, 32, 363–377. [Google Scholar] [CrossRef]
  53. Mihaljević, M.; Guncunski, D. Population dynamics of the Chlorococcal alga Pediastrum simplex Meyen in a carp fish pond. Acta Bot. Croat. 1994, 53, 61–67. [Google Scholar]
  54. Duangjan, K.; Wołowski, K.; Peerapornpisal, Y. New records of Phacus and Monomorphina taxa (Euglenophyta) for Thailand. Pol. Bot. J. 2014, 59, 235–247. [Google Scholar] [CrossRef] [Green Version]
  55. Kokociński, M.; Soininen, J. New insights into the distribution of alien cyanobacterium Chrysosporum bergii (Nostocales, Cyanobacteria). Psychol. Res. 2019, 67, 208–214. [Google Scholar] [CrossRef]
  56. Wang, C.; Li, X.; Lai, Z.; Tan, X.; Pang, S.; Yang, W. Seasonal variations of Aulacoseira granulate population abundance in the Pearl River Estuary. Estuar. Coast. Shelf. Sci. 2009, 85, 585–592. [Google Scholar] [CrossRef]
  57. Schweikert, M.; Meyer, B. Characterization of intracellular bacteria in the freshwater dinoflagellate Peridinium cinctum. Protoplasma 2001, 217, 177–184. [Google Scholar] [CrossRef] [PubMed]
  58. Grigorszky, I.; Kiss, K.T.; Béres, V.; Bácsi, I.M.; Hamvas, M.; Máthé, C.; Vasas, G.; Padisák, J.; Borics, G.; Gligora, M.; et al. The effects of temperature, nitrogen, and phosphorus on the encystment of Peridinium cinctum, Stein (Dinophyta). Hydrobiologia 2006, 563, 527–535. [Google Scholar] [CrossRef]
  59. Prakash, A.; Rashid, M.A. Influence of humic substances on the growth of marine phytoplankton: Dinoflagellates. Limnol. Oceanogr. 1968, 13, 598–606. [Google Scholar] [CrossRef]
  60. Ptail, H.S. The role of Ankistrodesmus falcatus and Scenedesmus quadricauda in sewage purification. Bioresour. Technol. 1991, 37, 121–126. [Google Scholar] [CrossRef]
  61. Meyer, R.L. Notes on the algae of Arkansas. 1. Chrsyococcus, Kephyrion, Kephyriopsis, Pseudokephyrion and Stenokalyx. J. Ark. Acad. Sci. 1971, 25, 12. [Google Scholar]
  62. Jones, R.; Ilmavirta, V. Spatial heterogeneity of phytoplankton in the Lokka reservoir, Finnish Lapland. Ann. Bot. Fenn. 1983, 20, 391–397. [Google Scholar]
  63. Kling, H.J.; Mugidde, R.; Hecky, R.E. Recent changes in the phytoplankton community of Lake Victoria in response to eutrophication. In Great Lakes of the World: Food Webs, Health and Integrity; Munawar, M., Hecky, R.E., Eds.; Backhuys: Leiden, The Netherlands, 2001; pp. 47–66. [Google Scholar]
  64. Lund, J.W.G. Studies on Asterionella Formosa Hass: II. Nutrient depletion and the spring maximum. J. Ecol. 1950, 38, 15–35. [Google Scholar] [CrossRef]
  65. Nabout, J.C.; Nogueira, I.S.; Oliveira, L.G. Phytoplankton community of floodplain lakes of the Araguaia River, Brazil, in the rainy and dry seasons. J. Plankton Res. 2006, 28, 181–193. [Google Scholar] [CrossRef] [Green Version]
  66. Ganai, A.H.; Parveen, S. Effect of physico-chemical conditions on the structure and composition of the phytoplankton community in Wular Lake at Lankrishipora, Kashmir. Int. J. Biodivers. Conserv. 2014, 6, 71–84. [Google Scholar] [CrossRef] [Green Version]
  67. Welch, E.B.; Barbiero, R.P.; Bouchard, D.; Jones, C.A. Lake trophic state change and constant algal composition following dilution and diversion. Ecol. Eng. 1992, 1, 173–197. [Google Scholar] [CrossRef]
  68. Senthilkumar, R.; Sivakumar, K. Studies on phytoplankton diversity in response to abiotic factors in Veeranam lake in the Cuddalore district of Tamil Nadu. J. Environ. Biol. 2008, 29, 747–752. [Google Scholar]
  69. Jargal, N.; Atique, U.; Mamun, M.; An, K.-G. Seasonal and long-term connections between trophic status, sestonic chlorophyll, nutrients, organic matter, and monsoon rainfall in a multipurpose reservoir. Water 2021, 13, 1720. [Google Scholar] [CrossRef]
Figure 1. Location of the Nagy–Morotva oxbow lake with indications of the sampling points. OWR represents the Open water zone of the Rakamaz area with the sampling transects and the sampling points. TR indicates the transitional zone between the open water zone of Rakamaz area (OWR) and the middle zone (M) which is characterized by a large macrovegetation coverage. TT indicates the transitional zone between the open water zone of the Tiszanagyfalu area (OWT) and the middle zone (M). OWT indicates the Open water zone of Tiszanagyfalu area. The numbers 1 and 2 represent the transects inside the zones. The L represents the left part of transects, the M represents the middle part of transect, and the R represents the right part of transects; these abbreviations apply to all sampling points.
Water 13 02339 g001
Figure 2. The principal component analysis based on the physico-chemical variables at each sampling point. Graph (A): April, Graph (B): June, Graph (C): July, Graph (D): October. The groups are represented by the following colors, Group I is blue, Group II is green and Group III is red. OWR represents the open water zone of the Rakamaz area with the sampling transects and the sampling points. TR represents the transitional zone between the open water zone of Rakamaz area (OWR) and the middle zone (M) which is characterized by a large macrovegetation coverage. TT represents the transitional zone between open water zone of Tiszanagyfalu area (OWT) and the middle zone (M). OWT represents the open water zone of the Tiszanagyfalu area. The numbers 1 and 2 represent the transects inside the zones. The letter L represents the left part of the transects, M represents the middle part of the transect, and R represents the right part of the transects; these abbreviations apply to all sampling points.
Water 13 02339 g002
Figure 3. Principal component analysis of the algal plankton data at each sampling point. Graph (A): April, Graph (B): June, Graph (C): July, Graph (D): October. The groups are represented by the following colors: Group I is blue, Group II is green and Group III is red. OWR represents the open water zone of the Rakamaz area with the sampling transects and the sampling points. TR represents the transitional zone between the open water zone of Rakamaz area (OWR) and the middle zone (M) which is characterized by a large macrovegetation coverage. TT represents the Transitional zone between the open water zone of Tiszanagyfalu area (OWT) and the middle zone (M). OWT represents the open water zone of the Tiszanagyfalu area. The numbers 1 and 2 represent the transects inside the zones. The letter L represents the left parts of the transects, M represents the middle parts of the transects, and R represents the right parts of the transects; these abbreviations apply to all sampling points.
Water 13 02339 g003
Figure 4. Boxplot of the most characteristic algal plankton species considered to have the highest abundance in the PCA at each transect. Graph (A): April, Graph (B): June, Graph (C): July, Graph (D): October. Rakamaz open water zone: OWR; Rakamaz transitional zone: TR; Middle zone: M; Tiszanagyfalu transitional zone: TT; Tiszanagyfalu open water zone: OWT.
Water 13 02339 g004
Figure 5. (A) April; (B) June; (C) July; (D) October. Trophic levels in various zones. OWR represents the open water zone of the Rakamaz area with the sampling transects and the sampling points. TR represents the transitional zone between the open water zone of Rakamaz area (OWR) and the Middle zone (M) which is characterized by a large macrovegetation coverage. TT represents the Transitional zone between the open water zone of the Tiszanagyfalu area (OWT) and the middle zone (M). OWT represents the open water zone of the Tiszanagyfalu area. The numbers 1 and 2 represent the transects inside the zones. The letter L represents the left parts of the transects, M represents the middle parts of the transects, and R represents the right parts of the transects; these abbreviations apply to all sampling points. The color scale represents the various trophic levels: blue means oligotrophic; lemon yellow means mesotrophic; orange means meso-eutrophic; red means eutrophic trophy level; white means impossible to sample.
Water 13 02339 g005
Table 1. Minimum, maximum, and median values of the physical and chemical variables for the investigated months.
VariablesAprilJuneJulyOctober
Min–Max
Median
Min–Max
Median
Min–Max
Median
Min–Max
Median
BOD5 (mg/L)2.43–4.74
2.89
1.04–4.08
2
1.48–5.02
3.2
1.48–5.02
3.2
Chlorophyll-a (mg/L)12.14–43.22
20.01
5.10–75.57
20.63
10.86–42.15
21.29
10.86–42.15
21.29
CODCr (mg/L)11–43
23
15–47
28
13–29
35
27.1–47
35
CODsMn (mg/L)5.3–8.02
7.04
7.01–11.73
8.38
11.36–22.10
16.88
11.36–22.10
16.88
Conductivity (µS/cm−1)360.47–496.05
423.30
308.45–469.59
378.68
361.77–421.00
384.70
361.77–421.00
384.70
Depth (cm)54–200
84
74–188
123
50–170
103
50–170
103
PO43− (mg/L)0.000–0.0093
0.0019
0.0087–0.0902
0.0434
0.0000–0.1212
0.0071
0.0000–0.1212
0.0071
H-CO3 (mg/L)18.8–164.55
84.63
111.33–199.47
157.72
143.81–231.5
176.28
143.81–231.5
176.28
Humic acid (mg/L)0.1–2.71
1.58
1.65–4.39
2.81
1.5–5.00
2.30
1.5–5.00
2.30
Kjeldahl-N (mg/L)0.59–4.07
1.67
–1.16–5.36
2.74
0.58–5.78
1.94
0.58–5.78
1.94
NO2-N (mg/L)0.0004–0.0033
0.0012
0.0000–0.0052
0.0004
0.0000–0.0008
0.0000
0.0000–0.0008
0.0000
NO3-N (mg/L)0.0000–0.3056
0.1136
0.0454–0.1249
0.0795
0.2923–0.4463
0.3489
0.2923–0.4463
0.3489
NH4-N (mg/L)0.0000–0.0000
0.0000
0.0000–0.1159
0.0000
0.0093–0.0432
0.0165
0.0093–0.0432
0.0165
ODO (mg/L)7.68–14.83
9.62
0.12–8.77
5.27
6.63–9.85
8.39
6.63–9.85
8.39
ORP (mV)174.9–227.6
194.6
172.4–235.6
211
429–505
462
429–505
462
pH6.97–8.08
7.51
6.4–7.85
7.16
6.25–7
6.8
6.25–7
6.85
Sulphate ion (mg/L)0.00–0.05
0.01
0.00–0.45
0.00
2.96–19.26
6.85
2.96–19.26
6.85
TDS (mg/L)268.00–371.67
327.33
206.33–301.67
257.00
318.33–363.00
334.33
318.33–363.00
334.33
Total-P (mg/L)0.07–0.15
0.10
0.07–0.51
0.21
0.30–1.01
0.36
0.30–1.01
0.36
Transparency (cm)40–100
57
51–101
78
50–120
80
50–120
80
TSS (mg/L)2.00–19.50
10.50
2.00–41.00
13.00
3.00–15.00
6.00
3.00–15.00
6.00
Publisher’s Note: MDPI stays neutral with regard to jurisdictional claims in published maps and institutional affiliations.

