
Effects of Long-Term Increases in Water Temperature and Stratification on Large Artificial Water-Source Lakes in South Korea

Han River Environment Research Center, National Institute of Environmental Research, 42, Dumulmeori-gil 68beon-gil, Yangseo-myeon, Yangpyeong-gun 12585, Gyeonggi-do, Korea
*
Author to whom correspondence should be addressed.
Water 2021, 13(17), 2341; https://doi.org/10.3390/w13172341
Submission received: 8 July 2021
/
Revised: 23 August 2021
/
Accepted: 24 August 2021
/
Published: 26 August 2021
(This article belongs to the Special Issue Water Quality Changes of Lakes and Rivers)
Abstract
:Long-term changes in air and water temperatures and the resulted stratification phenomena were observed for Soyang Lake (SY), Paldang Lake (PD), Chungju Lake (CJ), and Daecheong Lake (DC) in South Korea. Non-parametric seasonal Kendall and Mann-Kendall tests, Sen slope estimator, and potential energy anomaly (PEA) were applied. The lake surface water temperatures (LSWTs) of SY and DC increased at the same rate (0.125 °C/y), followed by those of CJ (0.071 °C/y) and PD (0.06 °C/y). Seasonally, the LSWT increase rates for all lakes, except PD, were 2–3 times higher than the air temperature increase rates. The lake stratification intensity order was similar to those of the LSWT increases and correlations. SY and DC displayed significant correlations between LSWT (0.99) and PEA (0.91). Thus, the LSWT significantly affected stratification when the water temperature increased. PD demonstrated the lowest correlation between LSWT and PEA. Inflow, outflow, rainfall, wind speed, and retention time were significantly correlated, which varied within and between lakes depending on lake topographical, hydraulic, and hydrological factors. Thus, hydraulic problems and nutrients should be managed to minimize their effects on lake water quality and aquatic ecosystems because lake cyanobacteria can increase as localized water temperatures increase.
1. Introduction
Surface water temperature is one of the most important factors for water quality [1]. Among the numerous factors impacting lake surface water temperature (LSWT), the near-surface (at elevation 3.4 m above site) air temperature plays a critical role [2,3]. Observations show that inland water bodies are increasingly warming worldwide, with the LSWT increasing at faster rates than the oceans [4]. Furthermore, lake warming can be higher than that of the surrounding air temperature [5], particularly at mid-latitudes.
Paerl and Paul [6] found that the LSWT increases the vertical stratification intensity in freshwater and marine systems. Additionally, the stratification cycle is extended by seasonal warming. Stratification begins early in spring and continues through summer in freshwater environments, while destratification occurs later in fall [7,8,9].
A temperature difference of a few degrees can prevent complete water circulation [10]. Increased lake thermal stratification can change internal nutrient loads and lake productivity [11,12,13], intensify lake anoxia [11,14], and cyanobacteria blooms [6]. In Northern Europe, lakes with long-term (decade-scale) warming signs, such as cold LSWTs, deep and permanent vertical stratification, early ice cover melting, prolonged warm water temperatures, and long growing seasons, show increased dominant cyanobacteria, bloom rates, and durability [9,15,16].
Water temperature is not only influenced by the air temperature but also by factors, such as radiant heat, degree of radiant heat blocked by obstacles, temperatures of river water flowing from a watershed, and heat exchange at the water surface. Hence, the effect of air temperature on the water temperature can vary among different lakes [17,18].
Recent studies have indicated significant water warming in lakes globally [19,20,21,22,23]. However, the spatial and temporal coherence associated with these trends remains unclear [24]. Lakes are especially vulnerable to changes in environmental factors, thus, serving as a useful proxy for assessing climate change impacts [25,26,27].
Hence, analyzing long-term water temperature trends according to air temperature changes is necessary. These long-term trends of air and water temperatures must be analyzed for each lake individually because results vary among different lakes. To study the hydrological patterns, the Mann-Kendall test and seasonal Kendall test are mostly used. These non-parametric approaches have several benefits, including the ability to handle incomplete data, the need for few hypotheses, and independence from the data distribution. The World Meteorological Organization (WMO) also recommends these tests because they can estimate both annual and monthly changes [28].
The total water intake in South Korea is 6918 million m3/y, and the amount of lake water intake through dams is 3217 million m3/y, accounting for 45.1% of the total water intake. The annual water supply from Chungju (CJ) is the highest (3380 million tons (MT)), followed by Daecheong (DC, 1649 MT) and Soyang (SY, 1213 MT). Although Paldang Lake (PD) has a water storage capacity of 244 MT/d and a water supply of 880 MT/d, it is an important water source for the capital’s 26 million residents [29].
The effect of increasing air temperature on the water temperature due to climate change can manifest differently depending on the lake’s hydraulic and hydrological conditions and regional topographical characteristics. Therefore, this study analyzed the long-term trends of air temperatures and LSWTs in SY, PD, CJ, and DC, which are large water sources in South Korea, to examine the increasing trends of water temperature in each lake and the air temperature changes. In addition, the stratification index was calculated to analyze the effect of water temperature increase on stratification.
2. Materials and Methods
2.1. Study Sites and Lake Characteristics
SY, PD, CJ, and DC were selected as representative artificial water-source lakes in South Korea (Table S1). SY, located in the Bukhan River upstream of PD, was created after the construction of a multipurpose dam in 1973. It is the deepest artificial lake in South Korea (118 m at the full water level) and the largest lake in South Korea, with a basin area of 2703 km2, a water storage capacity of 2900 MT, and an annual water supply of 1213 MT. PD was formed in 1973 by the construction of the downstream Paldang dam, where the Bukhan River, Namhan River, and Gyeongan Stream intersect. The Paldang dam was originally constructed for power generation, but it currently serves as a multipurpose dam for supplying water to 26 million people in South Korea. The PD has a basin area of 23,800 km2, a total water storage capacity of 244 MT, and a daily water supply plan of 880 MT. CJ was formed in 1985 by the construction of a multipurpose dam, and it exhibits the second-largest water storage capacity after SY. Located on the Namhan River upstream of PD, CJ has a basin area of 6648 km2, a water storage capacity of 2750 MT, and an annual water supply of 3380 MT. DC was created when the multipurpose Daecheong dam was constructed in 1980. Located in the central region of South Korea, it exhibits a basin area of 3204 km2, a water storage capacity of 1490 MT, and an annual water supply of 1649 MT [28].
2.2. Air and Surface Water Temperatures and Data Analyses
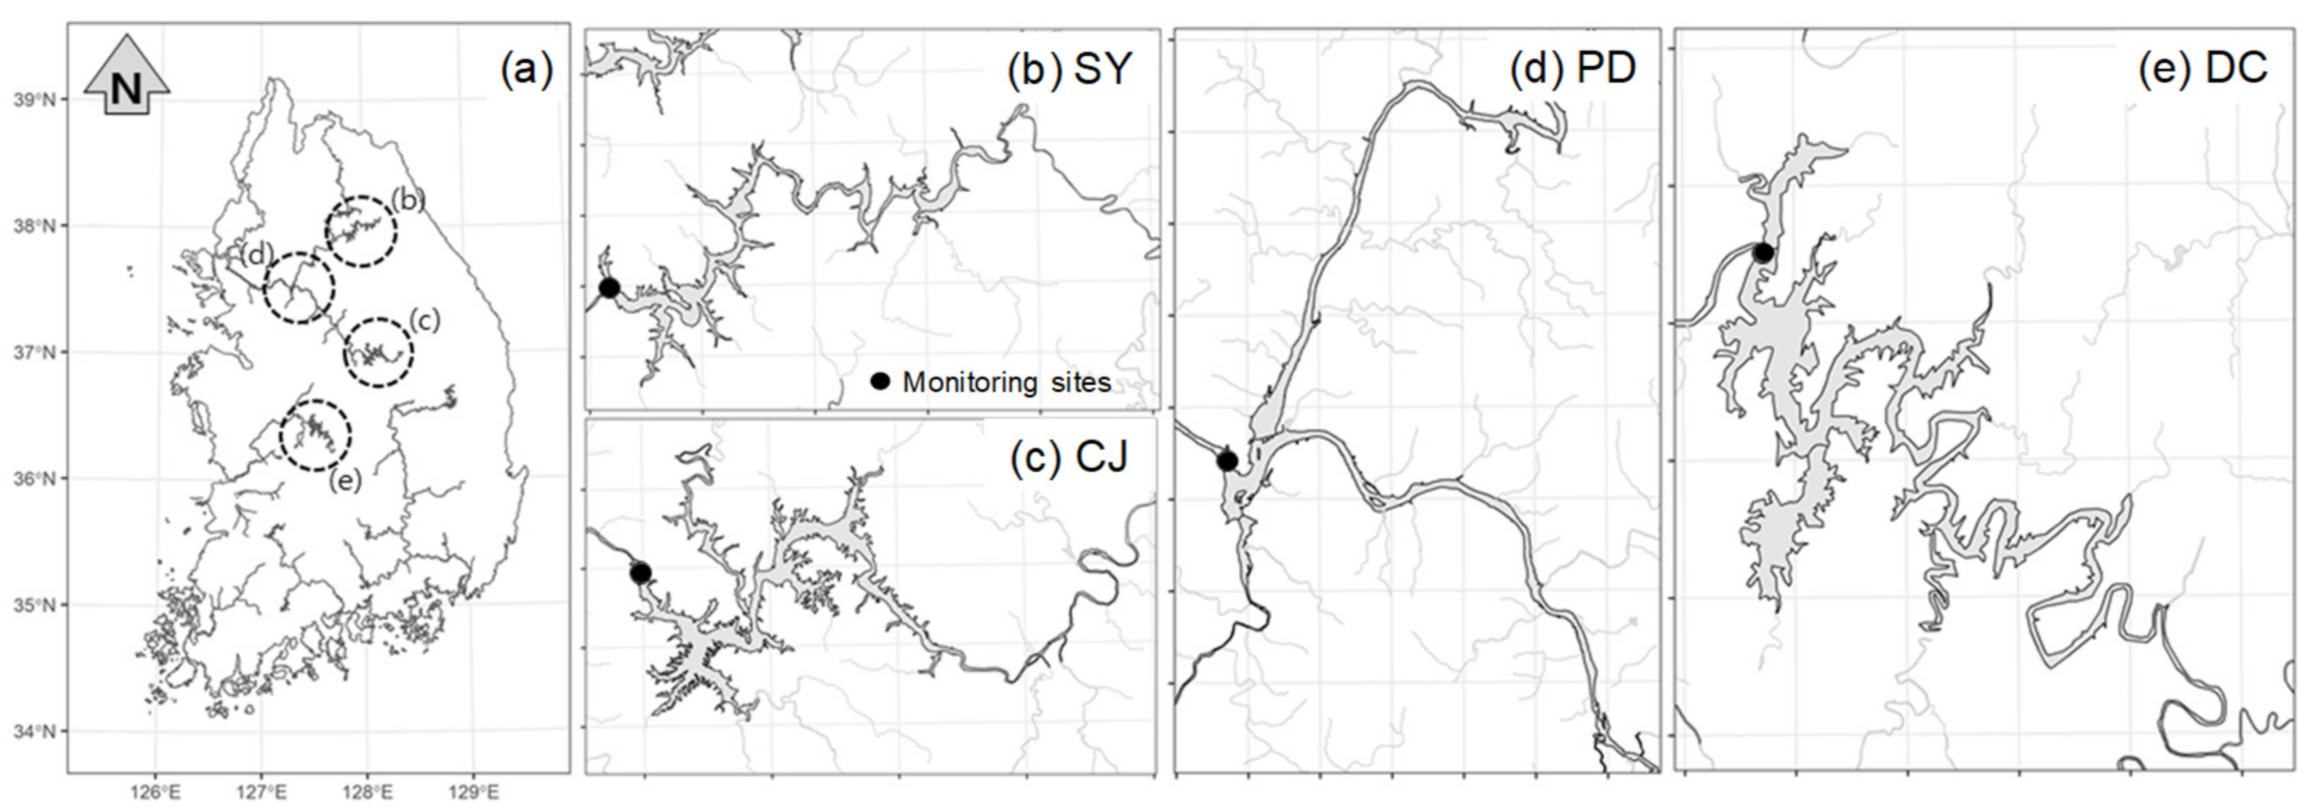
Monthly average air temperatures provided by the Chuncheon, Yangpyeong, Chungju, and Cheongju weather stations were used to analyze SY, PD, CJ, and DC, respectively [30]. The survey period was from 1973, when the weather stations initiated data collection for air temperature, to 2019. The locations for measuring the water temperature are displayed in Figure 1. The water temperature data used in the study were provided by the Water Environment Monitoring Network. The water temperatures were measured in the lake surface layers (0–0.5 m from the surface layer) monthly from 1993 for SY and DC, and weekly from 2003 for PD and CJ. The exact locations of measurement points, which were in front of the dams because the water in this area was the deepest, are presented in Table S2. Among the studied lakes, SY displayed the highest latitude and maximum water depth (100 m), followed by CJ (70 m), DC (46 m), which exhibited the lowest latitude, and PD (20 m). The PD data lacked some values in winter due to the high freezing rate in January and February caused by a small water depth and in summer due to heavy rains of the rainy season. The exact locations of measurement points, which were chosen to be in front of the dams because the water there was at its deepest, are presented in Table S2. Among the lakes studied, SY displayed the highest latitude and maximum water depth (100 m), followed by CJ (70 m), DC (46 m), which exhibited the lowest latitude, and PD (20 m). The PD data lacked some values in winter and summer because of the shallow lake becoming frozen in January and February and difficulty in data collection due to heavy rains in summer. In order to examine the relationship between surface water temperature, stratification intensity, and hydrological factors (inflow, outflow, rainfall, wind speed, and retention time), water samples from each lake were collected using a boat. For factors except for the retention time, data provided by the Water Resources Management Information System (WAMIS) was used. The retention time was obtained by calculating the water volume based on the water level-volume equation: dividing the range of water level by discharge amount. A Pearson correlation analysis was performed using the statistical program R (ver. 3.6.1) while Sigmaplot 12.0 (Systat Inc., Point Richmond, CA, USA) was used for graphing.
2.3. Statistical Methods for Long-Term Trend Analysis
2.3.1. Mann-Kendall Test
The Mann-Kendall statistical test was widely used to determine the importance of time series patterns of hydro-meteorological factors, such as temperature, water quality, streamflow, and precipitation [31,32,33]. To perform the Mann-Kendall test, differences between the later measured and earlier measured values, (xj-xi), were computed, where j > i and positive differences, no differences, and negative differences were assigned the integer values of 1, 0, and −1, respectively. Subsequently, the measurement statistic, S, was calculated as the number of the integers as follows:
where
The variance of S is given by:
If a tie is present in the data, then the variance of S is given by:
where g denotes the number of tied groups in the data set, tp denotes the number of data points in the pth tied group, and n denotes the total number of data points in the time series.
By the following Z-transformation for standardization, the statistic S would be approximately normally distributed as follows:
Later measured values are usually higher than earlier measured values, while S is a significant positive integer, indicating an upward trend. When S is a large negative number, however, later values are smaller than earlier values, indicating a downward trend. Finally, no trend was indicated when the absolute value of S was zero. The significance trend was determined at the 95% confidence limit (α = 0.05).
If a major trend is discovered, the rate of change can be estimated using the Sen slope estimator [34], which is the magnitude of the monotonic increase or decrease and is given as follows [35]:
Here, i < j, where I = 1, 2, ..., n−1, and j = 2, 3, ..., n. The median of the slopes corresponds to the Sen slope estimator value.
2.3.2. Seasonal Kendall Test
Seasonality was considered for the seasonal Kendall test, which computes the Mann-Kendall test independently for each season and then combines the results [36]. During monthly analysis, the observations of a particular month were only related to other observations of the same month. This test was used by previous studies to examine the annual patterns of the monthly mean temperature [32,37,38].
By measuring the weighted sums after applying the Mann-Kendall test for each season, unified patterns were obtained, thus, eliminating seasonality [31]. The total statistic Sk was derived by adding the seasonal Kendall statistics Si.
Finally, the Z-test statistic was calculated, and the following prediction was tested:
When the number of seasons and years is greater than 25, a normal distribution is used to estimate the distribution of Sk, with the probability equal to the sum of the individual Si expectations (zero) under the null hypothesis and the deviation equal to the sum of the individual Si variances. Sk was standardized (Equation (8)) by dividing its value by its standard deviation σsk and subtracting its expectation Uk = 0. A standard normal distribution table was used to test the results. If │ZSk│ > Zcrit, where Zcrit is the value of the standard normal distribution with an excess probability of α/2, the null hypothesis is rejected at the significance level α. The seasonal Kendall test is equivalent to the Mann-Kendall test in terms of significance. The applicability of the standard normal tables was not tested for a low number of seasons or years. Using a simplified version of the above-mentioned Sen slope estimator, an approximation of the trend slope for Y over time can be calculated as the median of all the slopes between data pairs within the same season.
The Sen slope for each season is determined as follows:
Here, i = 1, 2, …, m for each (Xij, Xik) pair, (where Xij is the datum for month i of the year j and Xik is the datum for month i of the year k), 1 ≤ k ≤ j ≤ ni, and ni is the number of known values in the ith season. The median of the values was used to calculate the seasonal slope estimator. A significant statistical trend was observed at a p-value less than 0.5 at 95% confidence.
2.3.3. Long-Term Air and Surface Water Temperature Trends in Lakes
The temperature and hydrological patterns could be undetectable due to seasonality [39]. Hence, the monthly average air and water temperatures were analyzed using the seasonal Kendall test, which generates a static outline for the whole year and does not include monthly or seasonal details. Thus, we used 4 seasonal mean temperatures to repeat the Mann-Kendall test and the Sen method [39]. The air temperatures were divided into 2 periods, 1973–2019 (47 years) and 1993–2019 (27 years), while monthly averages from 1993–2019 were used for the water temperatures. The increasing trends of seasonal air and water temperatures were grouped into 4 categories: spring (March–May), summer (June–August), fall (September–November), and winter (December–February of the next year).
2.4. Thermal Stratification Intensity in Lakes and Its Effect on Surface Water Temperature
The stratification intensity was calculated based on the water temperature at varying water depths during 2004–2019 using Equation (11) by applying the potential energy anomaly (PEA) as suggested by Simpson [40]. PEA represents the work per volume required to mix water layers fully, and it is equal to the difference between the current potential energy of the water layer and the potential energy when the water layers are fully mixed vertically. A larger PEA value implies a larger stratification intensity.
where g is the acceleration of gravity, z is the vertical coordinate (positive top from the bottom (–H) to the surface of the lake (η)), and ρ(z) is the density profile of the water column at depth D = H + η. The PEA, φ, is 0 for a totally mixed water column, positive for stable stratification and negative for unstable stratification. The amount of energy per volume used to vertically homogenize the entire water column is provided by φ. Pearson’s correlation analysis was performed to determine the relationship between the monthly stratification intensity and the monthly average surface water temperature.
3. Results and Discussion
3.1. Long-Term Air Temperature Trends in Lakes
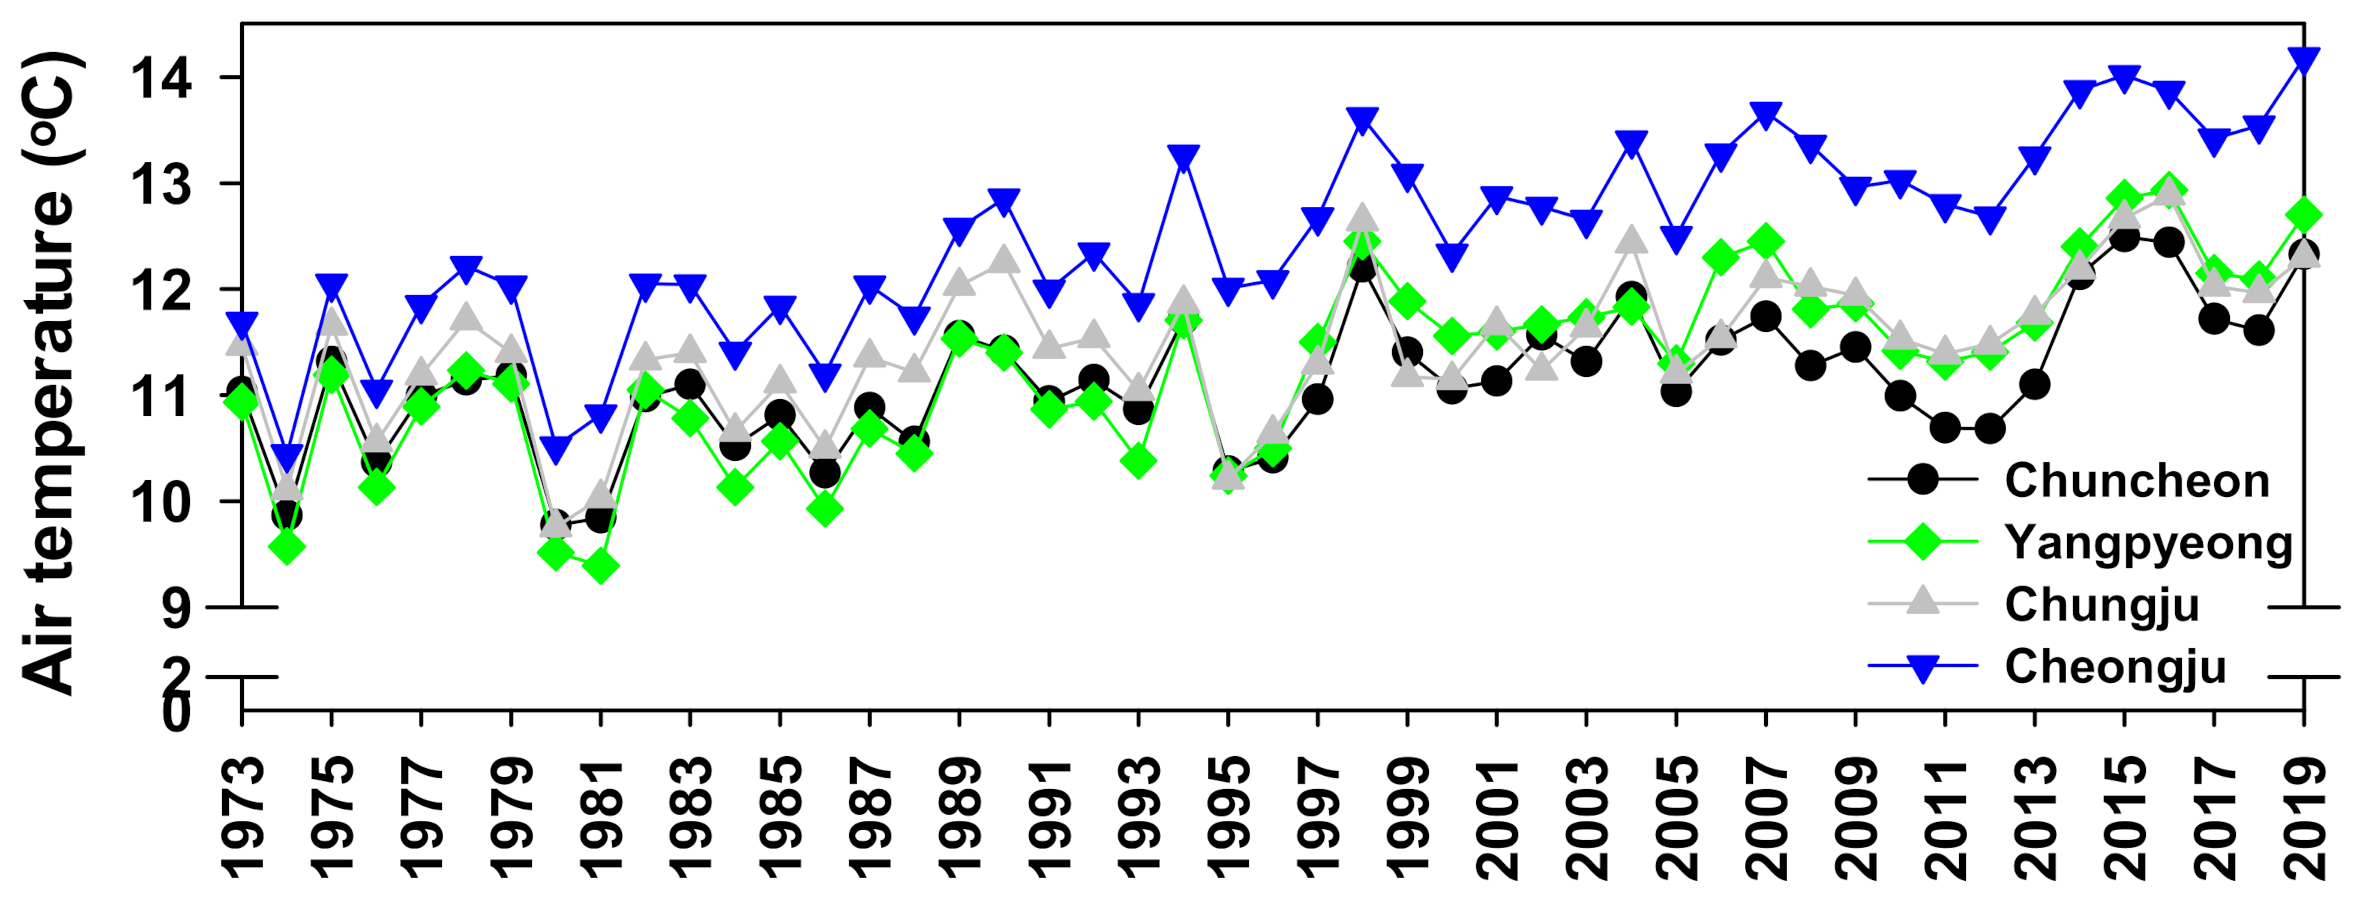
The air temperature was low in Chuncheon, which exhibited the highest latitude. The air temperature of Yangpyeong was lower than that of Chungju before 1997. However, after 1997, the air temperature of Yangpyeong increased marginally. In addition, Cheongju, with the lowest latitude, exhibited a high range of air temperatures (Figure 2).
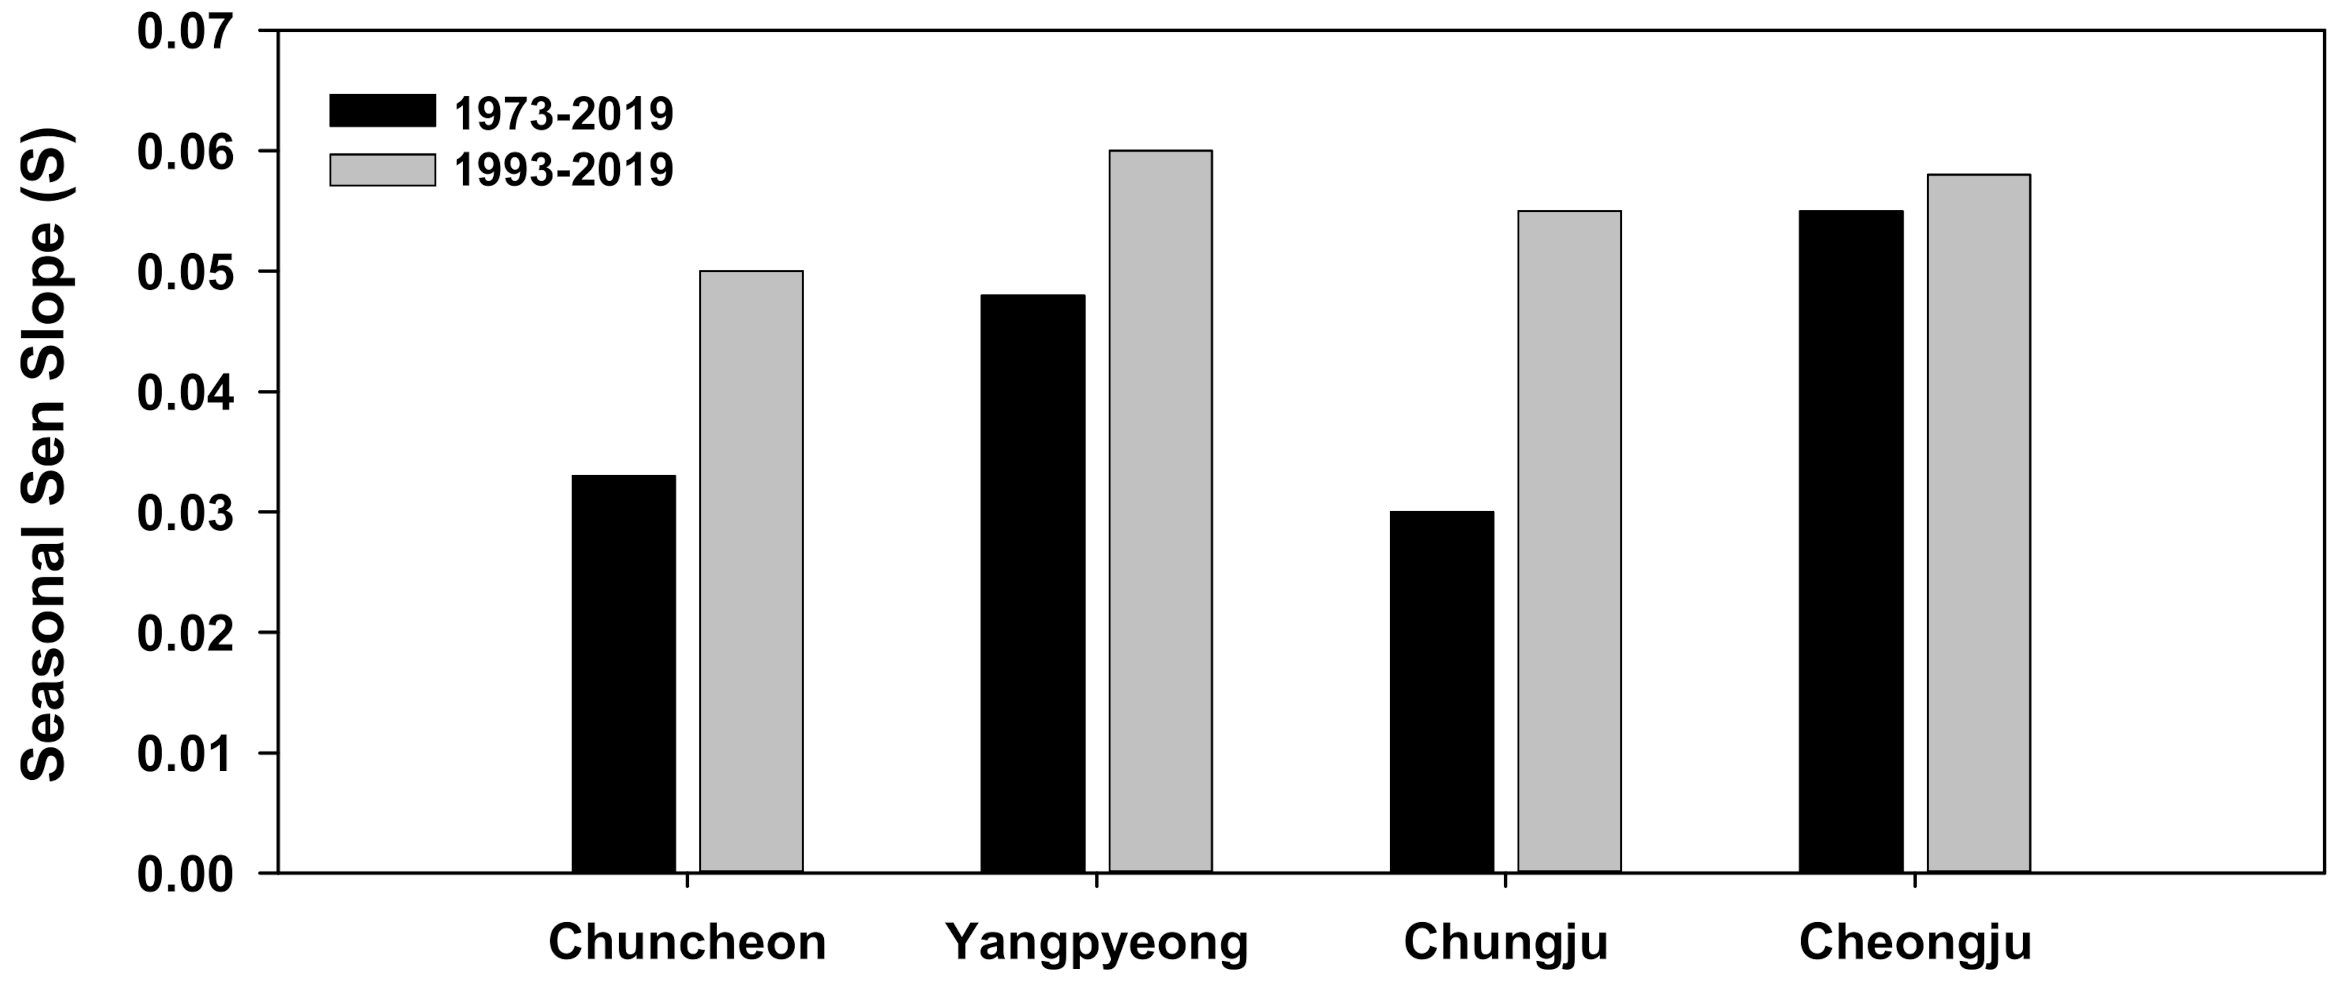
Application of the Mann-Kendall test to the time series data of annual surface air temperature showed an increasing trend with a high p-value. As previously mentioned, this finding is insufficient to suggest that no statistically significant patterns existed annually. Therefore, we performed the seasonal Kendall test on the monthly results [36]. Application of the seasonal Kendall test to the monthly average air temperatures during 1973–2019 and 1993–2019 demonstrated increasing trends and high statistical significance (p < 0.0001). Regarding the seasonal Sen slope estimator, the increase in air temperatures in the past 27 years was higher than that over the past 47 years in all regions as shown in Figure 3. The Intergovernmental Panel on Climate Change [41] reported that since the pre-industrial period, the temperature of the land surface air increased almost as much as the global average temperature. From 1850–1900 to 2006–2015, the average air temperature increased by 1.53 °C, and the global average surface temperature (land and ocean) increased by 0.87 °C. In addition, the global average surface air temperature between 2015 and 2019 was approximately 1.7 °C higher than pre-industrial temperatures and 0.3 °C warmer than between 2011 and 2015 [42].
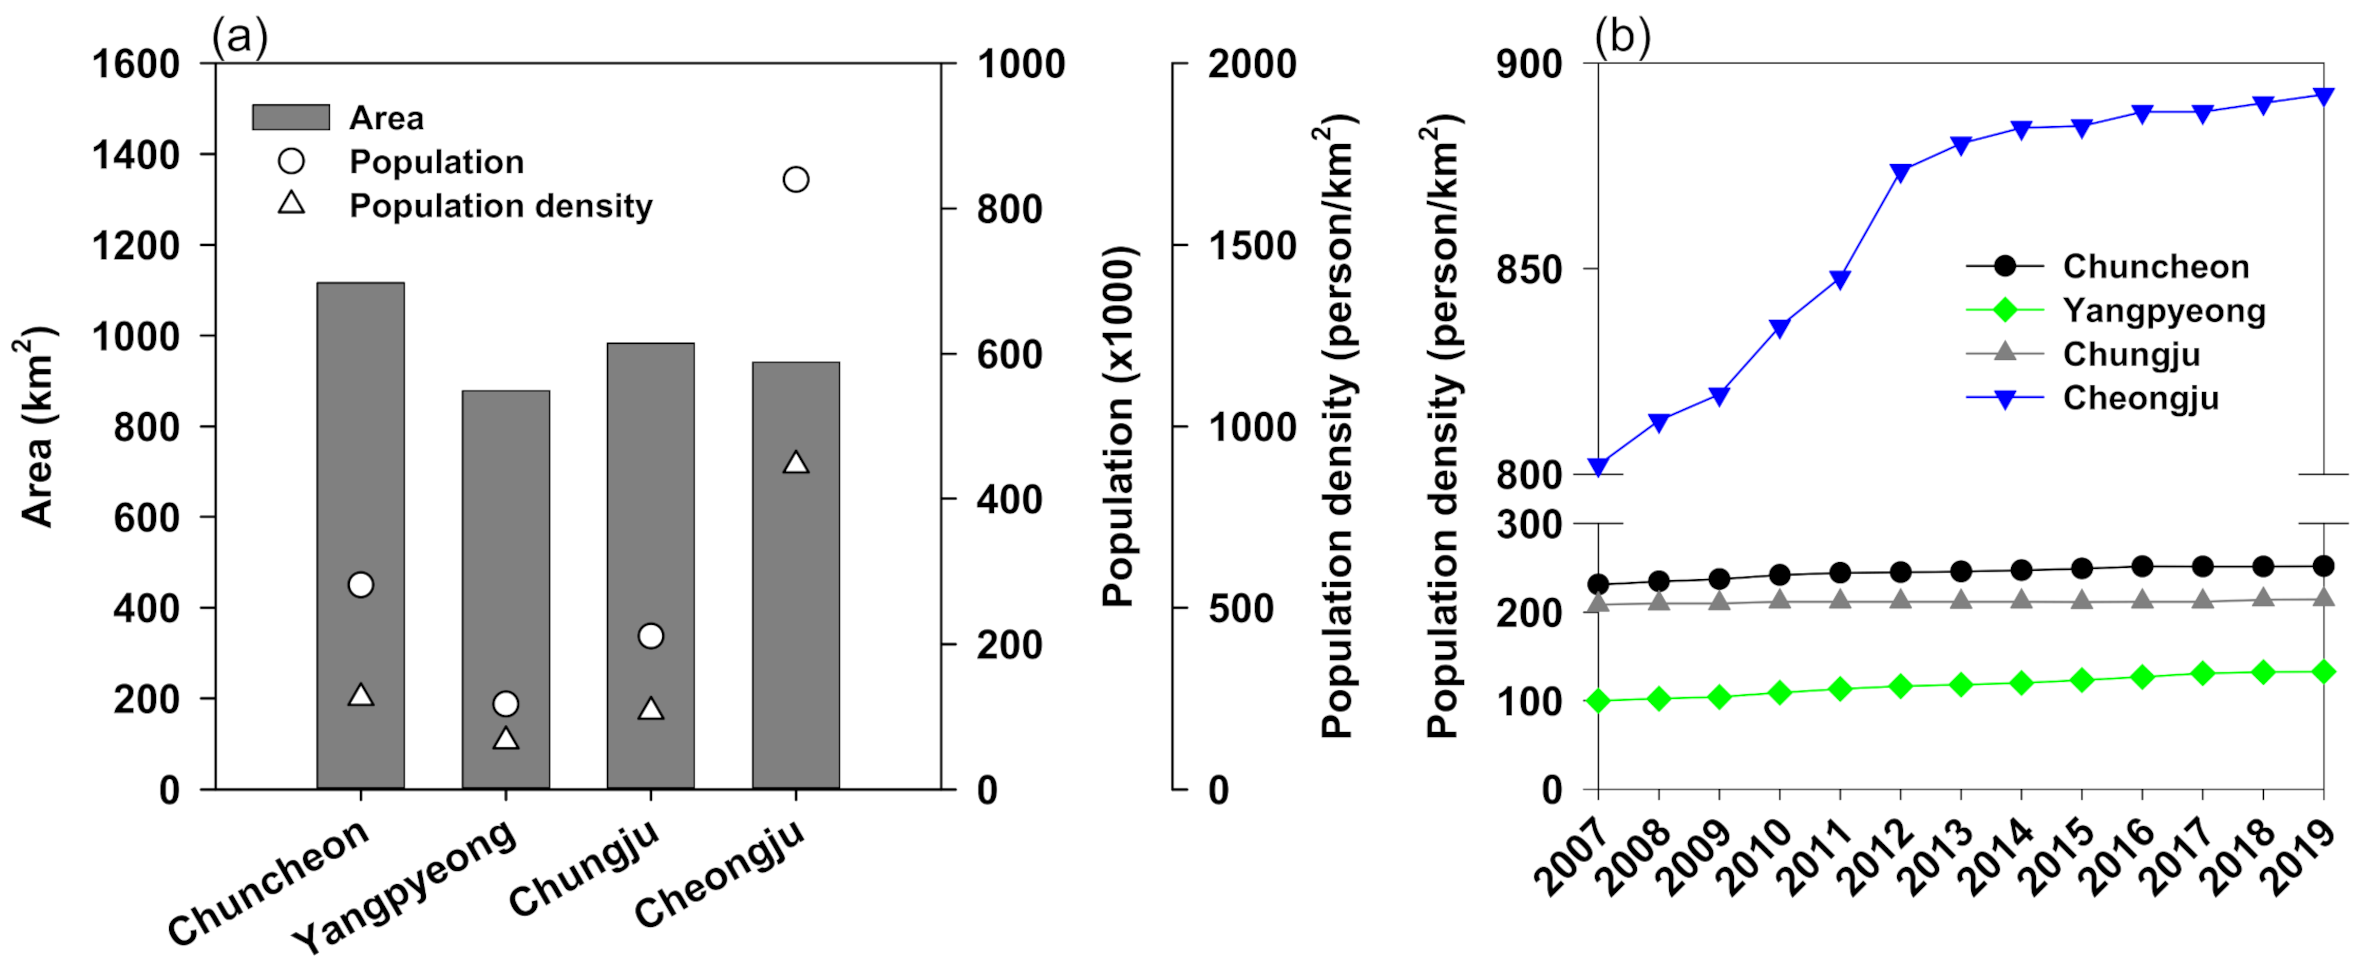
The air temperature increase for the past 27 years was higher than for the past 47 years in Chungju, which exhibited the highest degree of change from 0.030 °C to 0.055 °C, which was followed by Yangpyeong from 0.048 °C to 0.06 °C, and Cheongju demonstrated the least degree of air temperature increase. Urbanization can affect regional air temperatures [43,44,45]. Park et al. [46] found that urbanization affected the local warming trends for three different periods (40 year, 60 year, and 100 year) over South Korea by 30–45%, 25–30%, and 3–11%, respectively. Urbanization factors, such as urban growth, land use, and land cover change due to anthropogenic activities, have influenced the increase in local air temperatures despite large uncertainties in the estimation of the contribution of urbanization by period. Because these regions witnessed a low level of land-use changes, the population changes in these regions due to urbanization were examined. As illustrated in Figure 4a, the population density in 2019 was the highest in Cheongju (892 persons/km2) and the lowest in Yangpyeong (133 persons/km2). The population density of Cheongju has steadily increased since 2012 because Sejong city, a national administrative city, was built near Cheongju. This is thought to have caused population dispersion. However, the population growth rates (Figure 4b) in Yangpyeong and Chungju demonstrated a continuously increasing trend, suggesting that the effects of urbanization contributed to the changes in the air temperature in certain regions.
The seasonal Kendall test generates an overview figure of the whole year that does not include monthly or seasonal statistics [39]. Therefore, we used annual seasonal means (spring, summer, fall, and winter) to repeat the Mann-Kendall test and the Sen method by year. The Mann-Kendall test results (Table S3) displayed statistically significant increases in the air temperature by season except for some winters (p < 0.05). Excluding seasons without statistical significance, the slope of the air temperature increases for the past 27 years (0.033–0.075 °C) increased more than that for the past 47 years (0.024–0.058 °C). This increase was greater in summer (0.057–0.075 °C).
3.2. LSWT Long-Term Trends
Similar to the long-term trend analysis of air temperature wherein the monthly average surface water temperatures were analyzed using the seasonal Kendall test and the seasonal average surface water temperatures were analyzed using a Mann-Kendall test, the LSWTs for 1993–2019 (27 years) demonstrated statistically significant increasing trends (p < 0.005) (Table 1). SY and DC displayed the highest slope static at 0.125 °C/y, followed by CJ at 0.071 °C/y and PD at 0.066 °C/y. The increase rate of the water temperatures was higher than the increase rate of the air temperatures for the same period. SY and DC demonstrated the highest water temperature increase rate, followed by CJ and PD. As compared to local air temperature averages, many lakes warmed faster than the local air temperature, with the difference becoming more pronounced in colder lakes and at higher latitudes [20].
SY demonstrated statistically significant increases (p < 0.05) in all the seasons. The water temperature increased in summer and fall at a rate of 0.519 °C/y and 0.331 °C/y, respectively, whereas the increase rate was low in winter (0.057 °C/y). PD exhibited statistical significance only in spring, with an increased rate of 0.078 °C/y. CJ displayed statistical significance in all seasons except winter (p < 0.05), with increasing rates of 0.175 °C/y and 0.157 °C/y in spring and summer, respectively. DC also demonstrated statistically significant increases in all seasons except winter, with the largest increase rate in summer (0.370 °C/y). Each lake displayed different increase rates, and most lakes exhibited a high, increasing water temperature in summer and statistically significant increases in spring and summer. The significant intra-annual trend variation indicates that each season’s trends do not represent the lake’s response to climate change well. For example, the north of Europe is dominated by fall trends, while the south is dominated by winter trends. Because of the intra-lake trend fluctuations, the trend at single in-situ stations does not always reflect the response of the whole lake [20]. The degree of amplification of LSWT varies annually during summer. It is larger in cold lakes (high latitudes and altitude) and characterized by short warming seasons, and is represented by longer temperature and time scales in deep lakes due to increased heat inertia. Such lakes are more likely to display responses above the local inter-annual summer surface air temperature variability and exhibit a response beyond the variability of surface air temperature between local summers [47].
3.3. Stratification Intensity and Its Guiding Factors
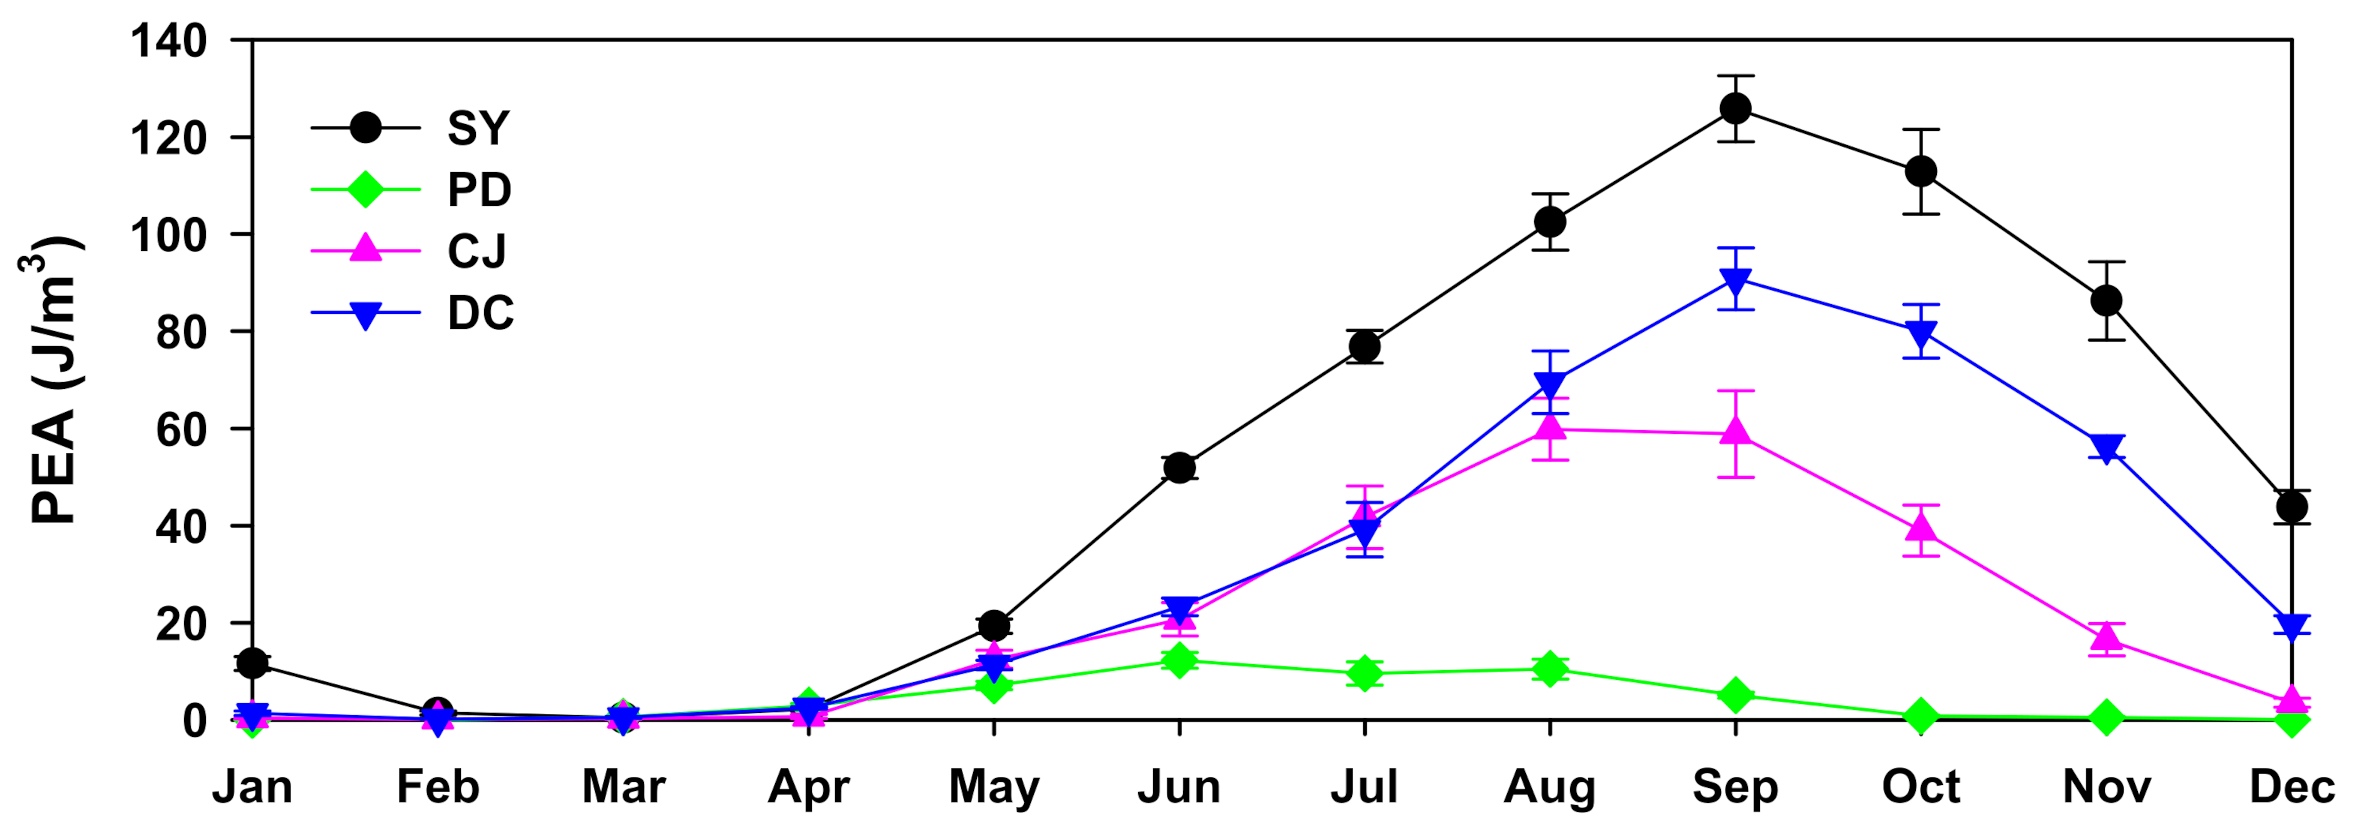
Stratification typically begins to form in spring during an increase in the surface water temperature, and it later weakens when the surface water temperature decreases. The stratification intensity was calculated using monthly average PEA based on the water temperature data from 2004 during the initiation of water temperature measurements by water depth. Consequently, SY displayed the highest stratification intensity at 53.7 J/m3 (0–169.1 J/m3), followed by DC at 33.4 J/m3 (0.0–119.7 J/m3), CJ at 21.5 J/m3 (−2.5–121.6 J/m3), and PD at 4.8 J/m3 (−0.1–28.1 J/m3) (Figure 5). The average PEA of Saemangeum Lake, a domestic coastal area, ranged from 16.9 J/m3 to 27.7 J/m3 by zones [48], and the average PEA in Gwangyang Bay and Jinju Bay Sea areas ranged from 2.2 J/m3 to 33.2 J/m3 [49].
The stratification intensities of SY and DC, which are freshwater lakes, were much higher than those of the sea areas, and the monthly maximum stratification intensity was particularly high in summer. Stratification reached full scale in May. The maximum stratification observed in June for PD, with a low water depth, was faster than that in the other lakes. Stratification was observed in August for CJ and in September for SY and DC. The stratification intensity weakened at the start of September for PD and CJ, which demonstrated a mixing pattern that was initiated in December. The stratification weakened from October in DC and SY but remained until December. The monthly average PEA exceeded 30 J/m3 from June to December for SY, from July to November for DC, and from July to October for CJ. PD displayed an increasing pattern of PEA from June to August, but it was not higher than the monthly average.
The dependence of the model parameters (such as lake surface area, surface layer volume, maximum depth, mean depth, the equivalent diameter of a circle having the same surface as the lake, and retention time) on the primary morphological variables (as stated by Toffolon et al. [50]) allowed for a quantitative description of the strong effect of the lake mean depth on thermal inertia, and the hysteresis trend between the air and lake surface temperatures. An and Lee [51] also illustrated that the relationship between air and water temperatures can be altered depending on the increasing and decreasing trends of air temperatures due to the water temperature hysteresis and because water has a greater specific heat than air. Due to intensive rainfalls in summer in South Korea, the low-temperature water flowing from the upstream of the lake weakens the lake stratification. The retention time of each lake can vary according to its hydrologic management. Physical factors of lakes, such as differences in water temperature, upstream river inflow rate, and retention time, significantly affect the delivery and accumulation of thermal energy of water bodies [10,52,53,54]. Particularly for PD, the average water temperature change in the surface layer and water depth is considered to be complex because mixing occurs inside the lake due to the flow of the Namhan River and the Bukhan River, which have different water temperatures during various periods [55]. Although various factors affect the formation and retention time of stratification, the effect of retention time is also a major reason why CJ exhibits faster stratification formation and weakening periods despite CJ exhibiting a higher water depth and storage capacity than DC.
3.4. Factors Influencing Stratification
Stratification varies based on topographical, hydrological, and meteorological factors [56]. According to a local study on Saemangeum Lake [48], the causes of stratification were low wind velocity and high flow rate in summer, and the causes for stratification in Gwangyang Bay and Jinju Bay were increased in the flow rate and water temperature due to solar radiation [49]. Magee and Wu [12] studied three lakes with different morphometries in the United States, and the subsequent Pearson’s correlations and environment perturbation scenarios revealed that wind speed had a more significant impact on temperature and stratification variables than shifts in air temperature, and that depending on the path of local wind speed changes, wind may either intensify or reduce the influence of warmer air temperatures on the lake thermal structure.
In South Korea, fluctuations in water temperatures vary greatly depending on the season and region due to intensive rainfall during the rainy or typhoon season in summer resulting from the regional monsoon climate. Consequently, fluctuations in the lake inflow amount are high, and fluctuations in the retention time can also affect stratification.
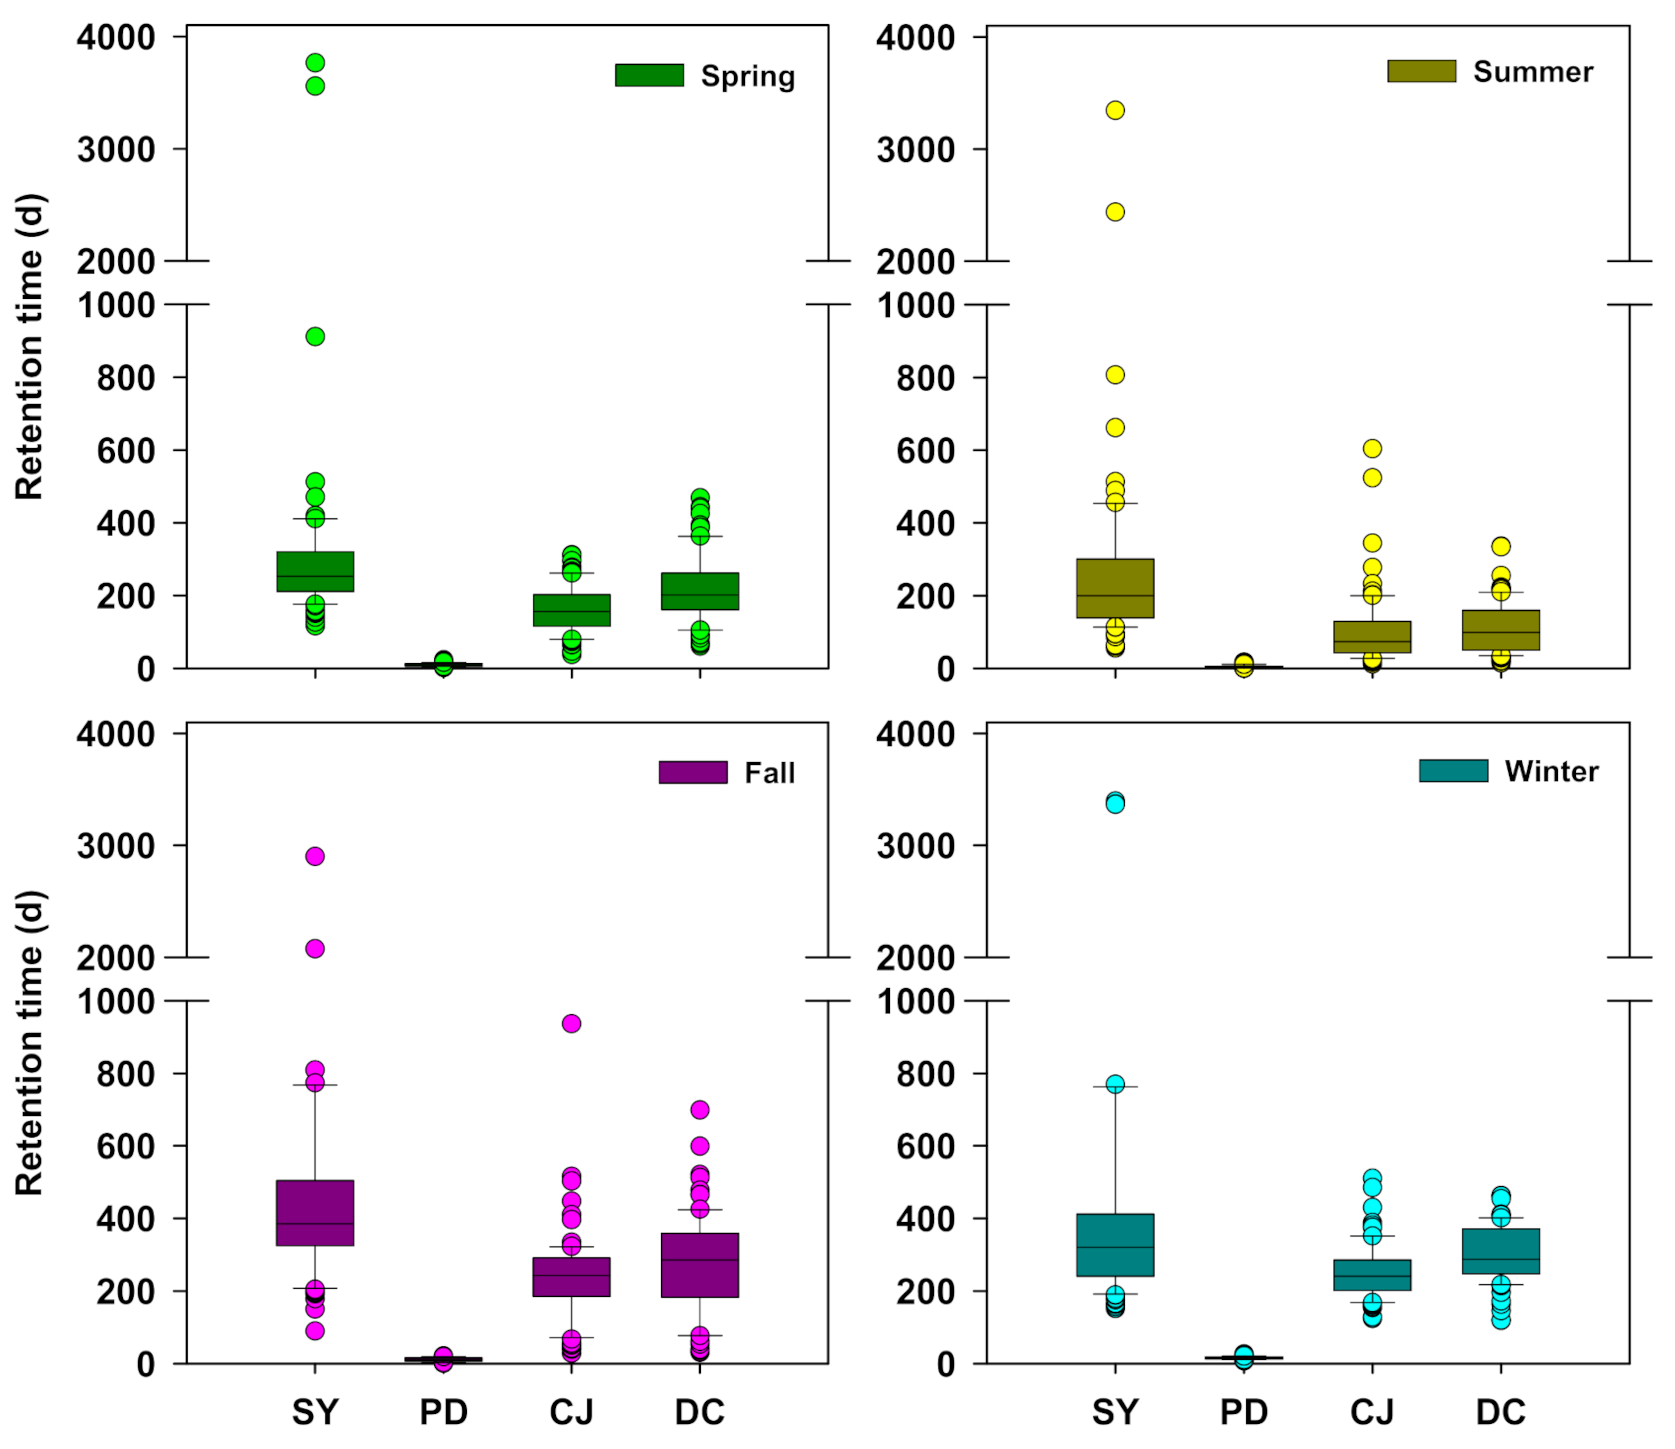
Figure 6 shows the seasonal retention time in lakes. The average retention time was the highest in SY, followed by DC, CJ, and PD. SY exhibited a retention time of over 200 d in every season. Its retention time was the shortest in summer (232.9 d) and longest in fall (451.7 d). DC exhibited the shortest retention time (128.0 d) in summer and the longest (307.8 d) in fall, whereas CJ exhibited the shortest retention time (116.5 d) in summer and the longest (247.9 d) in fall. PD displayed the shortest retention time throughout the year. Thus, the retention time was the longest in fall, followed by winter, spring, and summer. Except for PD, the retention time was the longest in fall and the shortest in summer due to the intensive rainfall during this period. PD displayed the shortest retention time (5.6 d) in summer and the longest (14.7 d) in winter (December–February of the following year).
Correlations between the LSWT and stratification intensity (PEA), inflow, outflow, temperature, rainfall, wind speed, and retention time were analyzed (Table 2). The LSWT typically displayed a statistically significant correlation with the PEA, and the descending order of the correlation coefficients was as follows: SY (0.85) > DC (0.74) > CJ (0.71) > PD (0.69). LSWT and PEA showed strong positive correlations in SY and DC. The correlations were particularly strong in spring at r = 0.99 and r = 0.91 for SY and DC, respectively. Hence, the LSWT exhibited considerably affected stratification during the period of increase in water temperature. Additionally, it was strongly correlated with air temperatures in spring and fall. PD is known to be a river-type lake due to its fast retention time and shallow water depth. It exhibited a weaker correlation between LSWT and PEA than that of other lakes. Additionally, the correlations between LSWT and inflow, outflow, rainfall, wind speed, and retention time in summer, with heavy rainfall, varied, but the correlations were statistically significant. In CJ, the PEA was correlated with wind velocity and air temperature. According to Piccolroaz et al. [57], unusual warming may be caused by two factors: increased stratification intensity and high summer air temperature anomalies. These can result from a warm spring, which can be measured by the lumped model air2water to simulate the lake surface temperature as a function of air temperature alone.
In large lakes with long retention times, the surface water temperature that has increased due to the hysteresis of the water temperature following an increase in the air temperature typically remains high for long durations. Yu et al. [58] claimed that due to the hysteresis phenomenon, which demonstrates a gradually decreasing water temperature trend during the period of increase in air temperature similar to the period of decrease in PD, the increase in air temperature during summer continues for a prolonged period, further delaying the decrease in water temperature when the water body is large.
The PEA displayed statistically significant correlations with air temperature and wind velocity in CJ and PD as presented in Table 3. This was because lakes in which the surface water temperature is significantly affected by air temperature, the air temperature increases in summer, and the continuation of stratification that occurs in spring directly affect the increase in the surface water temperature. If the correlation between air and surface water temperatures is not high, it is more substantially affected by various factors, such as wind velocity, inflow, outflow, and retention time. The correlation between air and surface water temperatures varies between rivers and lakes and among lakes according to topographical, hydraulic, and hydrological factors. Moreover, correlations can also vary within the same lake at different locations with varying water depths and retention times. Therefore, a localized increase in water temperature can have potentially negative influences, such as food web communication [22], the dominance of nitrogen-fixing phytoplankton [9], lake water chemistry, primary production, plankton population composition, nutrient cycling [23], and hydrologic modifications [6] in the entire lake. Therefore, hydraulic problems in the lakes should be addressed, and nutrients should be managed, especially in those parts of lakes that are vulnerable to localized temperature increases, to minimize their effects on the lake aquatic ecosystem.
4. Conclusions
Lake water quality management is essential for regional water resource security. The LSWT increases as air temperatures rise as a result of climate change, influencing lake stratification, aquatic habitats, and water quality. The effect of rising LSWT due to long-term increases in air temperature on stratification intensity in SY, PD, CJ, and DC was investigated in this study. In the past 27 years (1993–2017), the rate of air temperature rise (0.05–0.06 °C/y) was greater than the rate (0.03–0.055 °C/y) over the previous 47 years (1973–2019); with a higher air temperature increase in the summer (0.057–0.075 °C). Except for PD, the pace of increase in the LSWT was normally 2–3 times that of the air temperature increase in the summer. SY, such as the LSWT rise, had the highest average stratification intensity from 2004–2019, followed by DC, CJ, and PD. Stratification started in May and peaked in September. The relationship between LSWT and PEA was substantial, however, due to its shorter retention time and shallower water depth than the other lakes, PD had the lowest correlation. Because of the short retention time in summer with heavy rainfall, the inflow, outflow, rainfall, wind speed, and retention time associations were statistically significant. As water and air temperatures increased from spring to summer, stratification continued in large lakes with long retention times. However, lakes with weak correlations between air and surface water temperatures were affected by wind velocity, inflow, outflow, and retention time. Therefore, topographical, hydraulic, and hydrological factors influenced the relationship between air and surface water temperatures in lakes. Furthermore, the correlation varied within the lake. Hydraulic issues and nutrients should be controlled to limit their impact on lake water quality and aquatic ecosystems since localized water temperature increases can enhance lake cyanobacteria.
Supplementary Materials
The following are available online at https://www.mdpi.com/article/10.3390/w13172341/s1, Table S1. Studied lake dimensions, Table S2. Study site locations and monitoring frequencies, Table S3. Seasonal air temperature trends according to the Mann-Kendall test.
Author Contributions
Conceptualization, S.-J.Y. and J.-K.I.; methodology, S.-J.Y. and J.-Y.S.; software, H.-Y.K.; validation, J.-Y.S. and Y.-C.C.; formal analysis, H.-Y.K. and S.-J.Y.; investigation, H.-Y.K. and Y.-C.C.; resources, S.-J.Y.; data curation, S.-J.Y. and J.-K.I.; writing—original draft preparation, S.-J.Y. and J.-K.I.; writing—review and editing, S.-J.Y., J.-Y.S., H.-Y.K., Y.-C.C., and J.-K.I.; visualization, H.-Y.K.; supervision, S.-J.Y.; project administration, S.-J.Y.; funding acquisition, S.-J.Y. All authors have read and agreed to the published version of the manuscript.
Funding
This research was supported by the National Institute of Environmental Research (NIER) [grant number NIER-2021-01-01-134], funded by the Ministry of Environment (MOE) of the Republic of Korea.
Institutional Review Board Statement
Not Applicable.
Informed Consent Statement
Not Applicable.
Data Availability Statement
Not Applicable.
Conflicts of Interest
The authors declare no conflict of interest.
References
- Chang, H. Spatial analysis of water quality trends in the Han River basin, South Korea. Water Res. 2008, 42, 3285–3304. [Google Scholar] [CrossRef]
- Livingstone, D.M.; Padisák, J. Large-scale coherence in the response of lake surface-water temperatures to synoptic-scale climate forcing during summer. Limnol. Oceanogr. 2007, 52, 896–902. [Google Scholar] [CrossRef] [Green Version]
- Piccolroaz, S.; Toffolon, M.; Majone, B. A simple lumped model to convert air temperature into surface water temperature in lakes. Hydrol. Earth Syst. Sci. 2013, 17, 3323–3338. [Google Scholar] [CrossRef]
- Schneider, P.; Hook, S.J.; Radocinski, R.G.; Corlett, G.K.; Hulley, G.C.; Schladow, S.G.; Steissberg, T.E. Satellite observations indicate rapid warming trend for lakes in California and Nevada. Geophys. Res. Lett. 2009, 36, 36. [Google Scholar] [CrossRef]
- Austin, J.A.; Colman, S. Lake Superior summer water temperatures are increasing more rapidly than regional air temperatures: A positive ice-albedo feedback. Geophys. Res. Lett. 2007, 34, 34. [Google Scholar] [CrossRef] [Green Version]
- Paerl, H.W.; Paul, V.J. Climate change: Links to global expansion of harmful cyanobacteria. Water Res. 2012, 46, 1349–1363. [Google Scholar] [CrossRef]
- De Stasio, B.T., Jr.; Hill, D.K.; Kleinhans, J.M.; Nibbelink, N.P.; Magnuson, J.J. Potential effects of global climate change on small north-temperate lakes: Physics, fish, and plankton. Limnol. Oceanogr. 1996, 41, 1136–1149. [Google Scholar] [CrossRef]
- Peeters, F.; Straile, D.; Lorke, A.; Ivingstone, D.M.L. Earlier onset of the spring phytoplankton bloom in lakes of the temperate zone in a warmer climate. Glob. Chang. Biol. 2007, 13, 1898–1909. [Google Scholar] [CrossRef] [Green Version]
- Elliott, J.A. The seasonal sensitivity of Cyanobacteria and other phytoplankton to changes in flushing rate and water temperature. Glob. Chang. Biol. 2010, 16, 864–876. [Google Scholar] [CrossRef]
- Wetzel, R.G. Limnology: Lake and River Ecosystems; Gulf Professional Publishing: Houston, TX, USA, 2001. [Google Scholar]
- Ficker, H.; Luger, M.; Gassner, H. From dimictic to monomictic: Empirical evidence of thermal regime transitions in three deep alpine lakes in Austria induced by climate change. Freshw. Biol. 2017, 54, 1345–2283. [Google Scholar] [CrossRef]
- Magee, M.R.; Wu, C.H. Response of water temperatures and stratification to changing climate in three lakes with different morphometry. Hydrol. Earth Syst. Sci. 2017, 21, 6253–6274. [Google Scholar] [CrossRef] [Green Version]
- Verburga, P.; Hecky, R.E. The physics of the warming of Lake Tanganyika by climate change. Limnol. Oceanogr. 2009, 54, 2418–2430. [Google Scholar] [CrossRef]
- Palmer, M.E.; Yan, N.D.; Somers, K.M. Climate change drives coherent trends in physics and oxygen content in North American lakes. Clim. Chang. 2014, 124, 285–299. [Google Scholar] [CrossRef]
- Wagner, C.; Adrian, R. Cyanobacteria dominance: Quantifying the effects of climate change. Limnol. Oceanogr. 2009, 54, 2460–2468. [Google Scholar] [CrossRef]
- Weyhenmeyer, G.A. Warmer winters: Are planktonic algal populations in Sweden’s largest lakes affected? AMBIO 2001, 30, 565–571. [Google Scholar] [CrossRef] [PubMed]
- Stefan, H.G.; Preud’Homme, E.B. Stream Temperature Estimation from Air Temperature. JAWRA J. Am. Water Resour. Assoc. 1993, 29, 27–45. [Google Scholar] [CrossRef]
- Stefan, H.G.; Sinokrot, B.A. Projected global climate change impact on water temperatures in five north central U.S. streams. Clim. Chang. 1993, 24, 353–381. [Google Scholar] [CrossRef]
- Cha, Y.C.; Chung, S.W.; Yoon, S.W. Forecasting the Effect of Global Warming on the Water Temperature and Thermal Stratification in Daecheong Reservoir. J. Environ. Impact Assess. 2013, 22, 329–343. [Google Scholar] [CrossRef] [Green Version]
- Lieberherr, G.; Wunderle, S. Lake Surface Water Temperature Derived from 35 Years of AVHRR Sensor Data for European Lakes. Remote Sens. 2018, 10, 990. [Google Scholar] [CrossRef] [Green Version]
- O’Reilly, C.M.; Sharma, S.; Gray, D.K.; Hampton, S.E.; Read, J.S.; Rowley, R.J.; Schneider, P.; Lenters, J.D.; McIntyre, P.B.; Kraemer, B.M.; et al. Rapid and highly variable warming of lake surface waters around the globe. Geophys. Res. Lett. 2015, 42, 10773–10781. [Google Scholar] [CrossRef] [Green Version]
- Rice, E.; Dam, H.G.; Stewart, G.M. Impact of Climate Change on Estuarine Zooplankton: Surface Water Warming in Long Island Sound Is Associated with Changes in Copepod Size and Community Structure. Chesap. Sci. 2015, 38, 13–23. [Google Scholar] [CrossRef]
- Piccolroaz, S.; Healey, N.C.; Lenters, J.; Schladow, S.G.; Hook, S.J.; Sahoo, G.B.; Toffolon, M. On the predictability of lake surface temperature using air temperature in a changing climate: A case study for Lake Tahoe (U.S.A.). Limnol. Oceanogr. 2018, 63, 243–261. [Google Scholar] [CrossRef] [Green Version]
- Sharma, S.; Gray, D.K.; Read, J.S.; O’Reilly, C.M.; Schneider, P.; Qudrat, A.; Gries, C.; Stefanoff, S.; E Hampton, S.; Hook, S.; et al. A global database of lake surface temperatures collected by in situ and satellite methods from 1985–2009. Sci. Data 2015, 2, 1–9. [Google Scholar] [CrossRef] [PubMed] [Green Version]
- Adrian, R.; O’Reilly, C.M.; Zagarese, H.; Baines, S.B.; Hessen, D.O.; Keller, W.; Livingstone, D.M.; Sommaruga, R.; Straile, D.; van Donk, E.; et al. Lakes as sentinels of climate change. Limnol. Oceanogr. 2009, 54, 2283–2297. [Google Scholar] [CrossRef]
- Quayle, W.; Peck, L.S.; Peat, H.; Ellis-Evans, J.C.; Harrigan, P.R. Extreme Responses to Climate Change in Antarctic Lakes. Science 2002, 295, 645. [Google Scholar] [CrossRef]
- Williamson, C.E.; Saros, J.E.; Vincent, W.; Smol, J. Lakes and reservoirs as sentinels, integrators, and regulators of climate change. Limnol. Oceanogr. 2009, 54, 2273–2282. [Google Scholar] [CrossRef]
- Ali, R.; Kuriqi, A.; Abubaker, S.; Kisi, O. Long-Term Trends and Seasonality Detection of the Observed Flow in Yangtze River Using Mann-Kendall and Sen’s Innovative Trend Method. Water 2019, 11, 1855. [Google Scholar] [CrossRef] [Green Version]
- Ministry of Environment. Water Environment Information System. Available online: http://www.water.nier.go.kr (accessed on 4 January 2021).
- Korea Meteorological Administration. Available online: https://www.kma.go.kr (accessed on 1 May 2021).
- Mann, H.B. Nonparametric tests against trend. Econometrica 1945, 13, 245–259. [Google Scholar] [CrossRef]
- Kendall, M.G. Rank Correlation Methods; Charles Griffin: London, UK, 1975. [Google Scholar]
- Yue, S.; Pilon, P.; Cavadias, G. Power of the Mann-Kendall and Spearman’s rho tests for detecting monotonic trends in hydrological series. J. Hydrol. 2002, 259, 254–271. [Google Scholar] [CrossRef]
- Helsel, D.R.; Hirsch, R.M. Statistical Methods in Water Resources; US Geological Survey: Reston, VA, USA, 2019.
- Sen, P.K. Estimates of the regression coefficient based on Kendall’s tau. J. Am. Stat. Assoc. 1968, 63, 1379–1389. [Google Scholar] [CrossRef]
- Hirsch, R.M.; Slack, J.R.; Smith, R.A. Techniques of trend analysis for monthly water quality data. Water Resour. Res. 1982, 18, 107–121. [Google Scholar] [CrossRef] [Green Version]
- Detsch, F.; Otte, I.; Appelhans, T.; Nauss, T. A Comparative Study of Cross-Product NDVI Dynamics in the Kilimanjaro Region—A Matter of Sensor, Degradation Calibration, and Significance. Remote Sens. 2016, 8, 159. [Google Scholar] [CrossRef] [Green Version]
- Pyrgou, A.; Santamouris, M.; Livada, I. Spatiotemporal Analysis of Diurnal Temperature Range: Effect of Urbanization, Cloud Cover, Solar Radiation, and Precipitation. Climate 2019, 7, 89. [Google Scholar] [CrossRef] [Green Version]
- Anghileri, D.; Pianosi, F.; Soncini-Sessa, R. Trend detection in seasonal data: From hydrology to water resources. J. Hydrol. 2014, 511, 171–179. [Google Scholar] [CrossRef]
- Simpson, J.; Hughes, D.; Morris, N. The relation of seasonal stratification to tidal mixing on the continental shelf. Deep-Sea Res. 1977, 24, 327–340. [Google Scholar]
- IPCC. IPCC Special Report on Climate Change, Desertification, Land Degradation, Sustainable Land Management, Food Security, and Greenhouse Gas Fluxes in Terrestrial Ecosystems; Summary for Policymakers, Approved Draft; United Nations: New York, NY, USA, 2019; Available online: https://www.ipcc.ch/srccl/ (accessed on 4 January 2021).
- Siegmund, P.; Abermann, J.; Baddour, O.; Canadell, P.; Cazenave, A.; Derksen, C.; Garreau, A.; Howell, S.; Huss, M.; Isensee, K. The Global Climate in 2015–2019; World Meteorological Organization: Geneva, Switzerland, 2019. [Google Scholar]
- Cui, Y.; Xu, X.; Dong, J.; Qin, Y. Influence of Urbanization Factors on Surface Urban Heat Island Intensity: A Comparison of Countries at Different Developmental Phases. Sustainability 2016, 8, 706. [Google Scholar] [CrossRef] [Green Version]
- Paranunzio, R.; Ceola, S.; Laio, F.; Montanari, A. Evaluating the Effects of Urbanization Evolution on Air Temperature Trends Using Nightlight Satellite Data. Atmosphere 2019, 10, 117. [Google Scholar] [CrossRef] [Green Version]
- Qiu, J.; Yang, X.; Cao, B.; Chen, Z.; Li, Y. Effects of Urbanization on Regional Extreme-Temperature Changes in China, 1960–2016. Sustainability 2020, 12, 6560. [Google Scholar] [CrossRef]
- Park, B.-J.; Kim, Y.-H.; Min, S.-K.; Kim, M.-K.; Choi, Y.; Boo, K.-O.; Shim, S. Long-Term Warming Trends in Korea and Contribution of Urbanization: An Updated Assessment. J. Geophys. Res. Atmos. 2017, 122, 10637–10654. [Google Scholar] [CrossRef]
- Woolway, R.I.; Merchant, C.J. Amplified surface temperature response of cold, deep lakes to inter-annual air temperature variability. Sci. Rep. 2017, 7, 4130. [Google Scholar] [CrossRef] [Green Version]
- Kim, T.-I.; Lee, H.-R.; Chang, K.-I. Seasonal Variation of Density Stratification in the Saemangeum Waters, Korea. Ocean Polar Res. 2006, 28, 339–352. [Google Scholar] [CrossRef] [Green Version]
- Kang, Y.-S.; Chae, Y.-K.; Lee, H.-R. Variation of Density Stratification due to Fresh Water Discharge in the Kwangyang Bay and Jinju Bay. J. Korean Soc. Coast. Ocean Eng. 2011, 23, 126–137. [Google Scholar] [CrossRef]
- Toffolon, M.; Piccolroaz, S.; Majone, B.; Soja, A.-M.; Peeters, F.; Schmid, M.; Wüest, A. Prediction of surface temperature in lakes with different morphology using air temperature. Limnol. Oceanogr. 2014, 59, 2185–2202. [Google Scholar] [CrossRef] [Green Version]
- An, J.-H.; Lee, K.-H. Correlation and hysteresis analysis of air-water temperature in four rivers: Preliminary study for water temperature prediction. J. Environ. Pol. 2013, 12, 17–32. [Google Scholar]
- Kim, J.; Atique, U.; Mamun, M.; An, K.-G. Long-Term Interannual and Seasonal Links between the Nutrient Regime, Sestonic Chlorophyll and Dominant Bluegreen Algae under the Varying Intensity of Monsoon Precipitation in a Drinking Water Reservoir. Int. J. Environ. Res. Public Health 2021, 18, 2871. [Google Scholar] [CrossRef] [PubMed]
- Martin, J.L.; McCutcheon, S.C. Hydrodynamics and Transport for Water Quality Modeling; CRC Press: Boca Raton, FL, USA, 2018. [Google Scholar]
- Ziemińska-Stolarska, A.; Kempa, M. Modeling and Monitoring of Hydrodynamics and Surface Water Quality in the Sulejów Dam Reservoir, Poland. Water 2021, 13, 296. [Google Scholar] [CrossRef]
- Kong, D. Evaluating effect of density flow from upstream on vertical distribution of water quality at the Paldang Reservoir. J. Korean Soc. Water Environ. 2019, 35, 557–566. [Google Scholar]
- Hofmeister, R.; Burchard, H.; Bolding, K. A three-dimensional model study on processes of stratification and de-stratification in the Limfjord. Cont. Shelf Res. 2009, 29, 1515–1524. [Google Scholar] [CrossRef]
- Piccolroaz, S.; Toffolon, M.; Majone, B. The role of stratification on lakes’ thermal response: The case of L ake S uperior. Water Resour. Res. 2015, 51, 7878–7894. [Google Scholar] [CrossRef] [Green Version]
- Yu, S.J.; Ryu, I.G.; Park, M.J.; Im, J.K. Long-term relationship between air and water temperatures in Lake Paldang, South Korea. Environ. Eng. Res. 2021, 26, 200177. [Google Scholar] [CrossRef]
Figure 1.
Locations of water temperature measurement points of (a) all the studied lakes and in (b) SY, (c) CJ, (d) PD, and (e) DC.
Figure 1.
Locations of water temperature measurement points of (a) all the studied lakes and in (b) SY, (c) CJ, (d) PD, and (e) DC.

Figure 2.
Regional changes in the annual average air temperature (1973–2019).

Figure 3.
Long-term variations in seasonal Sen slope of surface air temperature in the surveyed area.
Figure 3.
Long-term variations in seasonal Sen slope of surface air temperature in the surveyed area.

Figure 4.
(a) Population densities in 2019 and (b) population density variation in Chuncheon, Yangpyeong, Chungju, and Cheongju.
Figure 4.
(a) Population densities in 2019 and (b) population density variation in Chuncheon, Yangpyeong, Chungju, and Cheongju.

Figure 5.
Monthly variations in PEA at the four lakes.

Figure 6.
Seasonal average retention time (d) in lakes (1993–2019).


Table 1.
Long-term and seasonal trends of LSWT.
| Lake | Season | Surface Water Temp. | ||
|---|---|---|---|---|
| S | p | Seasonal Sens Slope | ||
| SY | Year (‘93-’19) | 1584 | 2.2 × 10⁻¹⁶ | 0.125 *** |
| Spring | 163 | 0.006 | 0.116 ** | |
| Summer | 153 | 0.002 | 0.519 ** | |
| Fall | 200 | 2.94 × 10⁻⁵ | 0.331 *** | |
| Winter | 116 | 0.016 | 0.057 * | |
| PD | Year (‘93-’19) | 727 | 1.22 × 10⁻⁵ | 0.066 *** |
| Spring | 145 | 0.003 | 0.078 ** | |
| Summer | 79 | 0.103 | 0.095 | |
| Fall | −27 | 0.587 | −0.017 | |
| Winter | 57 | 0.241 | 0.023 | |
| CJ | Year (‘93-’19) | 1093 | 3.95 × 10⁻¹¹ | 0.071 *** |
| Spring | 178 | 0.0002 | 0.175 *** | |
| Summer | 178 | 0.0002 | 0.157 *** | |
| Fall | 96 | 0.047 | 0.056 * | |
| Winter | −20 | 0.691 | −0.010 | |
| DC | Year (‘93-’19) | 1263 | 7.17 × 10⁻¹⁵ | 0.125 *** |
| Spring | 129 | 0.007 | 0.130 ** | |
| Summer | 173 | 0.0003 | 0.370 *** | |
| Fall | 128 | 0.008 | 0.209 ** | |
| Winter | 27 | 0.584 | 0.000 | |
p-value: * p < 0.05; ** p < 0.01, *** p < 0.001.
Table 2.
Correlation between LSWT and the influencing factors in the four lakes.
| Lake | Season | PEA | Inflow | Outflow | Air Temp. | Rainfall | Wind | Retention Time |
|---|---|---|---|---|---|---|---|---|
| SY | Year (‘93-’19) | 0.85 * | 0.4 | 0.17 | 0.67 | 0.49 | −0.33 | 0.02 |
| Spring | 0.99 * | 0.15 | 0.36 | 0.86 * | 0.52 | −0.19 | −0.16 | |
| Summer | 0.89 * | 0.33 | 0 | 0.54 | 0.29 | −0.25 | 0.04 | |
| Fall | 0.44 | 0.48 | −0.17 | 0.94 * | 0.46 | 0.17 | 0.17 | |
| Winter | 0.83 * | 0.14 | 0.1 | −0.36 | 0.06 | 0.12 | 0.11 | |
| PD | Year (‘93-’19) | 0.69 * | 0.34 | 0.34 | 0.96 * | 0.53 | −0.28 | −0.46 |
| Spring | 0.87 * | 0.22 | 0.22 | 0.98 | 0.28 | −0.45 | −0.3 | |
| Summer | 0.69 * | −0.55* | −0.55 * | 0.6 | −0.34 * | 0.32 | 0.52* | |
| Fall | 0.75 * | 0.3 | 0.3 | 0.98 * | 0.37 | −0.34 | −0.32 | |
| Winter | 0.43 * | −0.3 | −0.24 | 0.33 | −0.09 | 0.01 | 0.28 | |
| CJ | Year (‘93-’19) | 0.71 * | 0.39 | 0.31 | 0.86 * | 0.54 | −0.42 | −0.05 |
| Spring | 0.79 * | 0.15 | 0.29 | 0.97 * | 0.39 | −0.28 | −0.38 | |
| Summer | 0.54 * | −0.11 | −0.15 | 0.87 * | 0.03 | −0.41 | 0.09 | |
| Fall | 0.63 * | 0.45 | 0.34 | 0.98 * | 0.54 | −0.17 | −0.21 | |
| Winter | 0.55 * | 0.38 | 0.01 | −0.11 | −0.04 | −0.43 | 0.3 | |
| DC | Year (‘93-’19) | 0.74 * | 0.44 | 0.39 | 0.77 * | 0.54 | −0.25 | −0.39 |
| Spring | 0.91 * | −0.05 | 0.36 | 0.93* | 0.31 | −0.17 | −0.46 | |
| Summer | 0.61 | 0.41 | 0.19 | 0.59 | 0.33 | 0.15 | 0.13 | |
| Fall | 0.61 * | 0.34 | 0.33 | 0.92 * | 0.43 | 0.28 | −0.64 | |
| Winter | 0.80 * | 0.18 | 0.27 | −0.33 | −0.27 | −0.33 | 0.1 |
p-value: * p < 0.05.
Table 3.
Correlation between PEA and influencing factors in the four lakes.
| Lake | Season | Inflow | Outflow | Air Temp. | Rainfall | Wind | Retention Time |
|---|---|---|---|---|---|---|---|
| SY | Year (‘93-’19) | 0.2 | 0.09 | 0.38 | 0.24 | −0.45 | 0.01 |
| Spring | 0.15 | 0.33 | 0.81 * | 0.51 | −0.19 | −0.13 | |
| Summer | 0.22 | 0.16 | 0.55 | 0.18 | −0.19 | −0.03 | |
| Fall | 0.08 | 0.17 | 0.42 | −0.01 | −0.23 | −0.15 | |
| Winter | −0.03 | 0.27 | −0.24 | 0.16 | 0.06 | −0.15 | |
| PD | Year (‘93-’19) | 0.02 | 0.02 | 0.67 * | 0.27 | 0.13 | −0.09 |
| Spring | −0.11 | −0.1 | 0.81 * | 0.07 | −0.32 * | 0.03 | |
| Summer | −0.58 * | −0.57 * | 0.21 | −0.34 * | 0.66 * | 0.86 * | |
| Fall | 0.08 | 0.07 | 0.73 * | 0.19 | −0.1 | −0.13 | |
| Winter | −0.36 * | −0.36 * | 0.11 | −0.17 | 0.14 | 0.37 | |
| CJ | Year (’93-’19) | 0.3 | 0.16 | 0.58 * | 0.37 | −0.41 * | 0.07 |
| Spring | 0.21 | 0.41 | 0.71 * | 0.36 | −0.31 * | −0.35 | |
| Summer | 0.08 | −0.04 | 0.47 * | −0.01 | −0.28 | −0.04 | |
| Fall | 0.25 | 0.05 | 0.61 * | 0.34 | −0.24 * | 0.12 | |
| Winter | 0.50 * | −0.38 * | 0.23 | 0.11 | −0.48 * | 0.76 * | |
| DC | Year (’93-’19) | 0.31 | 0.32 | 0.37 | 0.31 | −0.37 | −0.03 |
| Spring | −0.05 | 0.32 | 0.80 * | 0.34 | −0.06 | −0.47 | |
| Summer | 0.44 | 0.44 | 0.39 | 0.32 | 0.17 | −0.15 | |
| Fall | 0.24 | 0.26 | 0.53 | 0.34 | 0.18 | −0.28 | |
| Winter | 0.25 | 0.14 | −0.09 | −0.31 | −0.46 | 0.36 |
p-value: * p < 0.05.
Publisher’s Note: MDPI stays neutral with regard to jurisdictional claims in published maps and institutional affiliations. |
© 2021 by the authors. Licensee MDPI, Basel, Switzerland. This article is an open access article distributed under the terms and conditions of the Creative Commons Attribution (CC BY) license (https://creativecommons.org/licenses/by/4.0/).
Share and Cite
MDPI and ACS Style
Yu, S.-J.; Son, J.-Y.; Kang, H.-Y.; Cho, Y.-C.; Im, J.-K. Effects of Long-Term Increases in Water Temperature and Stratification on Large Artificial Water-Source Lakes in South Korea. Water 2021, 13, 2341. https://doi.org/10.3390/w13172341
AMA Style
Yu S-J, Son J-Y, Kang H-Y, Cho Y-C, Im J-K. Effects of Long-Term Increases in Water Temperature and Stratification on Large Artificial Water-Source Lakes in South Korea. Water. 2021; 13(17):2341. https://doi.org/10.3390/w13172341
Chicago/Turabian StyleYu, Soon-Ju, Ju-Yeon Son, Ho-Yeong Kang, Yong-Chul Cho, and Jong-Kwon Im. 2021. "Effects of Long-Term Increases in Water Temperature and Stratification on Large Artificial Water-Source Lakes in South Korea" Water 13, no. 17: 2341. https://doi.org/10.3390/w13172341
Note that from the first issue of 2016, this journal uses article numbers instead of page numbers. See further details here.