1. Introduction
Geothermal manifestations are phenomena on the Earth’s surface in the form of geothermal energy potential characterized by symptoms such as fumaroles, steaming grounds, and hot springs with temperatures that are relatively higher than the surrounding one [
1].
Ie Seu’um is one of the geothermal systems in the outflow zone of the Seulawah Agam Volcano, Aceh. The
Ie Seu’um spring is estimated to have a temperature of 89–92 °C with a geothermal reservoir temperature in the range of 186–204 °C, an enthalpy medium system, and a type of chloride fluids. The mineral contents of water are quite various, including bicarbonate, sulfate, chloride, sodium, potassium, and magnesium [
2]. The
Ie Seu’um spring and its flow are in residential areas; therefore, the water is widely used by the residents and tourists.
The water that comes out of the Earth’s crust generally contains numerous metal contents [
3], including heavy metals, which are dangerous for organisms [
4]. One of the heavy metals often found in geothermal water and sediment is arsenic [
5,
6]. There was a case of arsenic contamination reported in Bangladesh where polluted well water killed 3000 people and gave 125,000 victims skin cancer [
7]. Another case of poisoning occurred in west Bengal. Millions of people in nine districts used ground water that was contaminated by arsenic for drinking water [
7]. There has been no study reported on the incidence of the effects of arsenic exposure on the
Ie Seu’um population. However, the local communities use the ground water and surface water, which has contact with geothermal water. This habit risks the communities by heavy metal exposure. The arsenic that enters the body can last a long time in the hair [
8]. Arsenic will bind to the sulfhydryl (-SH) and cystine disulfide (-S-S) groups in the hair [
9]. The amount of metal in the hair correlates with the amount of metal absorbed by the body [
10].
The natural arsenic levels of 0.002 mg/L would increase 1000 times in the reservoir [
11]. In Mexico, 6–51% arsenic levels were detected in the geothermal reservoir. In El Salvador, the water from a reservoir close to a geothermal power plant contains an arsenic level of 8.9 mg/L [
12]. Meanwhile, the geothermal energy in Japan contains arsenic ranging from 1.8–6.4 mg/L. In addition, the geothermal sources in Iceland and Hawaii are also indicated as sources of arsenic contamination. The presence of arsenic in geothermal water is influenced by the origin of magma and its chemical composition [
11]. The geothermal water coming out from the tectonic plate of divergent boundaries generally has relatively low concentrations of arsenic, such as in the Icelandic hydrothermal system. In contrast, hydrothermal systems at or near the tectonic plate of convergent boundaries, such as in Japan, the Philippines, Indonesia, and New Zealand, tend to emit geothermal water with high concentrations of arsenic [
13].
Using the Atomic Hydride Generation Atomic Absorption Spectrophotometry method, Yuksel et al. (2010) also reported arsenic levels in volunteer hair that ranged from 21–367 µg/kg [
14]. Yuksel et al. (2015) also used Graphite Furnace Atomic Absorption Spectrophotometry (GF-AAS), another method for analyzing arsenic in samples, for arsenic analysis in miners and obtained 3.83–52.44 µg/L of arsenic in their blood, 1.26–27.54 µg/L in their urine, and 0.06–7.90 mg/kg in their hair [
15].
Given the dangers of arsenic and the absence of research on the content of heavy metals in the Ie Seu’um geothermal manifestation area, collecting data on the content of heavy metals, such as arsenic, in geothermal water in the Ie Seu’um area is very important. In this study, the arsenic concentrations in the hot spring and its flow, the sediment, the water source around the hot spring and around its flow, and human hair in the Ie Seu’um area were measured, and the method used was validated.
2. Materials and Methods
2.1. Tools and Materials
The tools used were as follows: Atomic Absorption Spectrophotometer (PinAAcle 900H PerkinElmer, Waltham, MA, USA), graphite furnace (THGA), autosampler (AS900), thermometer, pH meter, Total Dissolved Solid (TDS) meter, conductometer, salinity meter, shaker, analytical scales, hot plate with temperature control, 100-mesh sieve, 1000-milliliter polyethylene (PE) bottle, mortal, pestle, glass funnel, stirring rod, dropper pipette, micropipette, 100- and 50-milliliter volumetric flasks, an Erlenmeyer flask, measuring cup, beaker glass, stainless steel scissors, and a plastic scoop.
The materials used were argon gas, filter paper, 5 × 7 cm plastic clip, HNO3 p.a., HClO4 p.a., H2SO4 p.a., and As2SO3 standard solution.
2.2. Sampling Technique
The samples include hot spring water, groundwater, surface water, sediment, and human hair from the
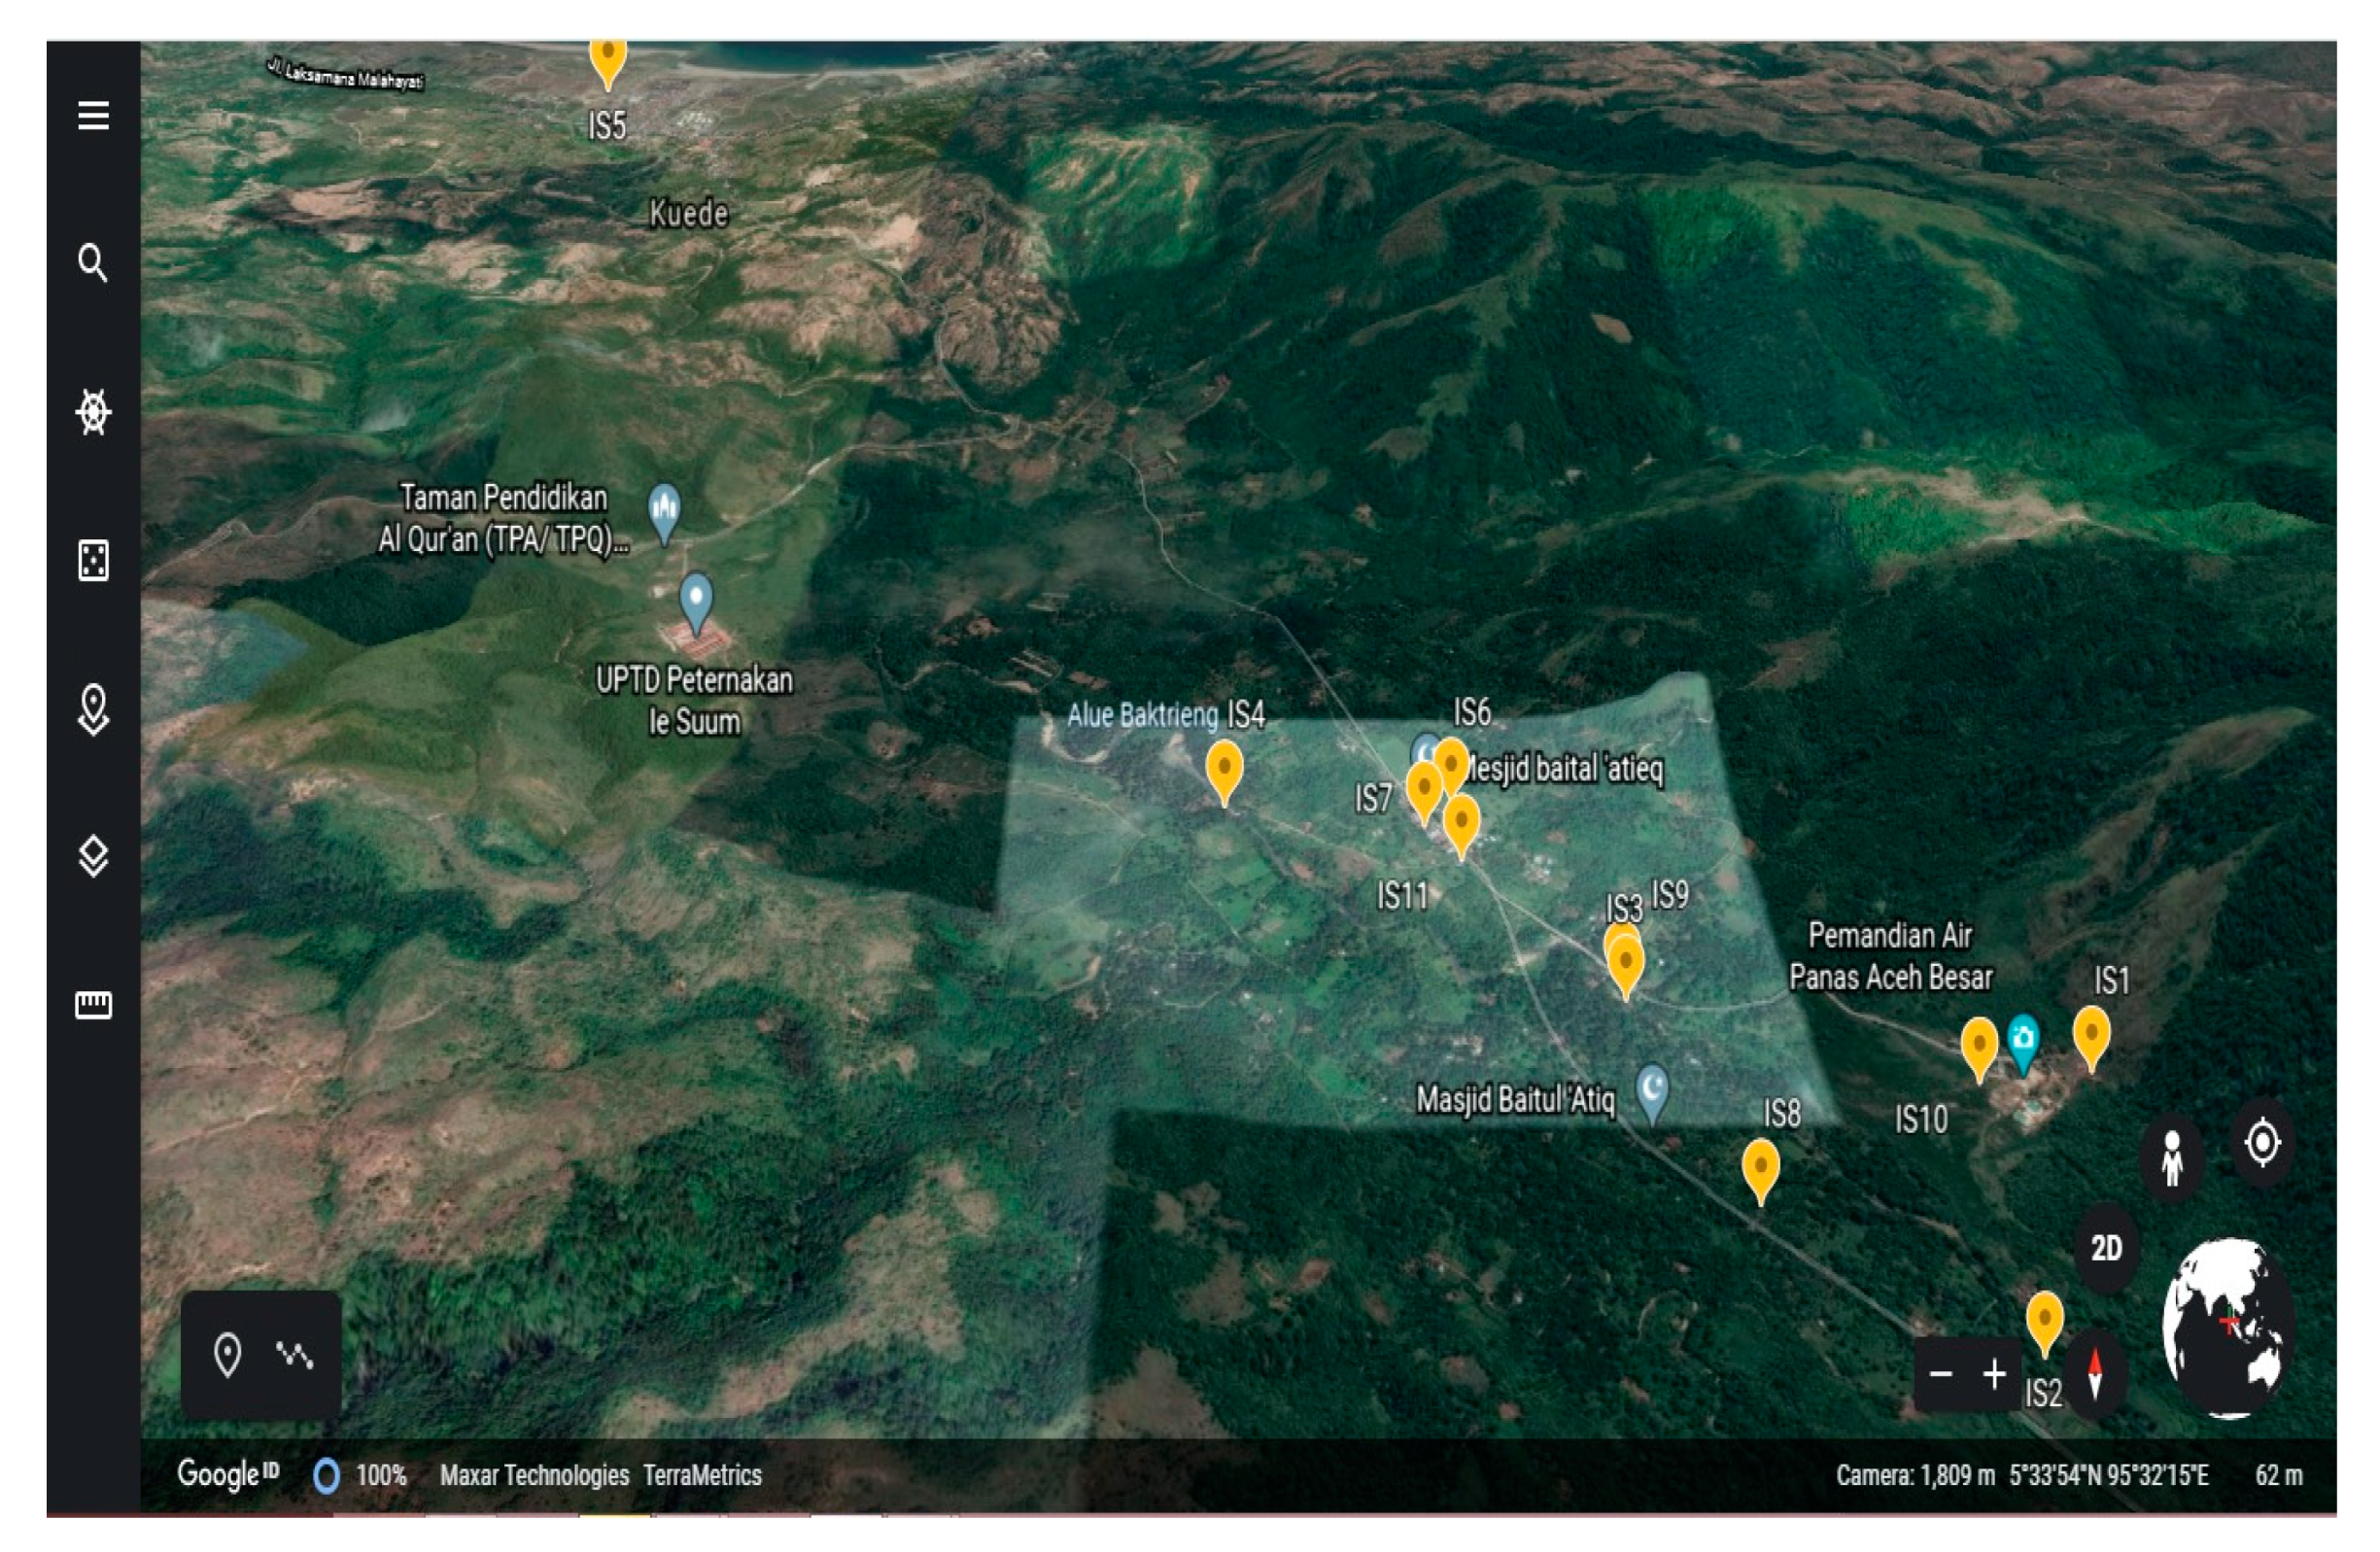
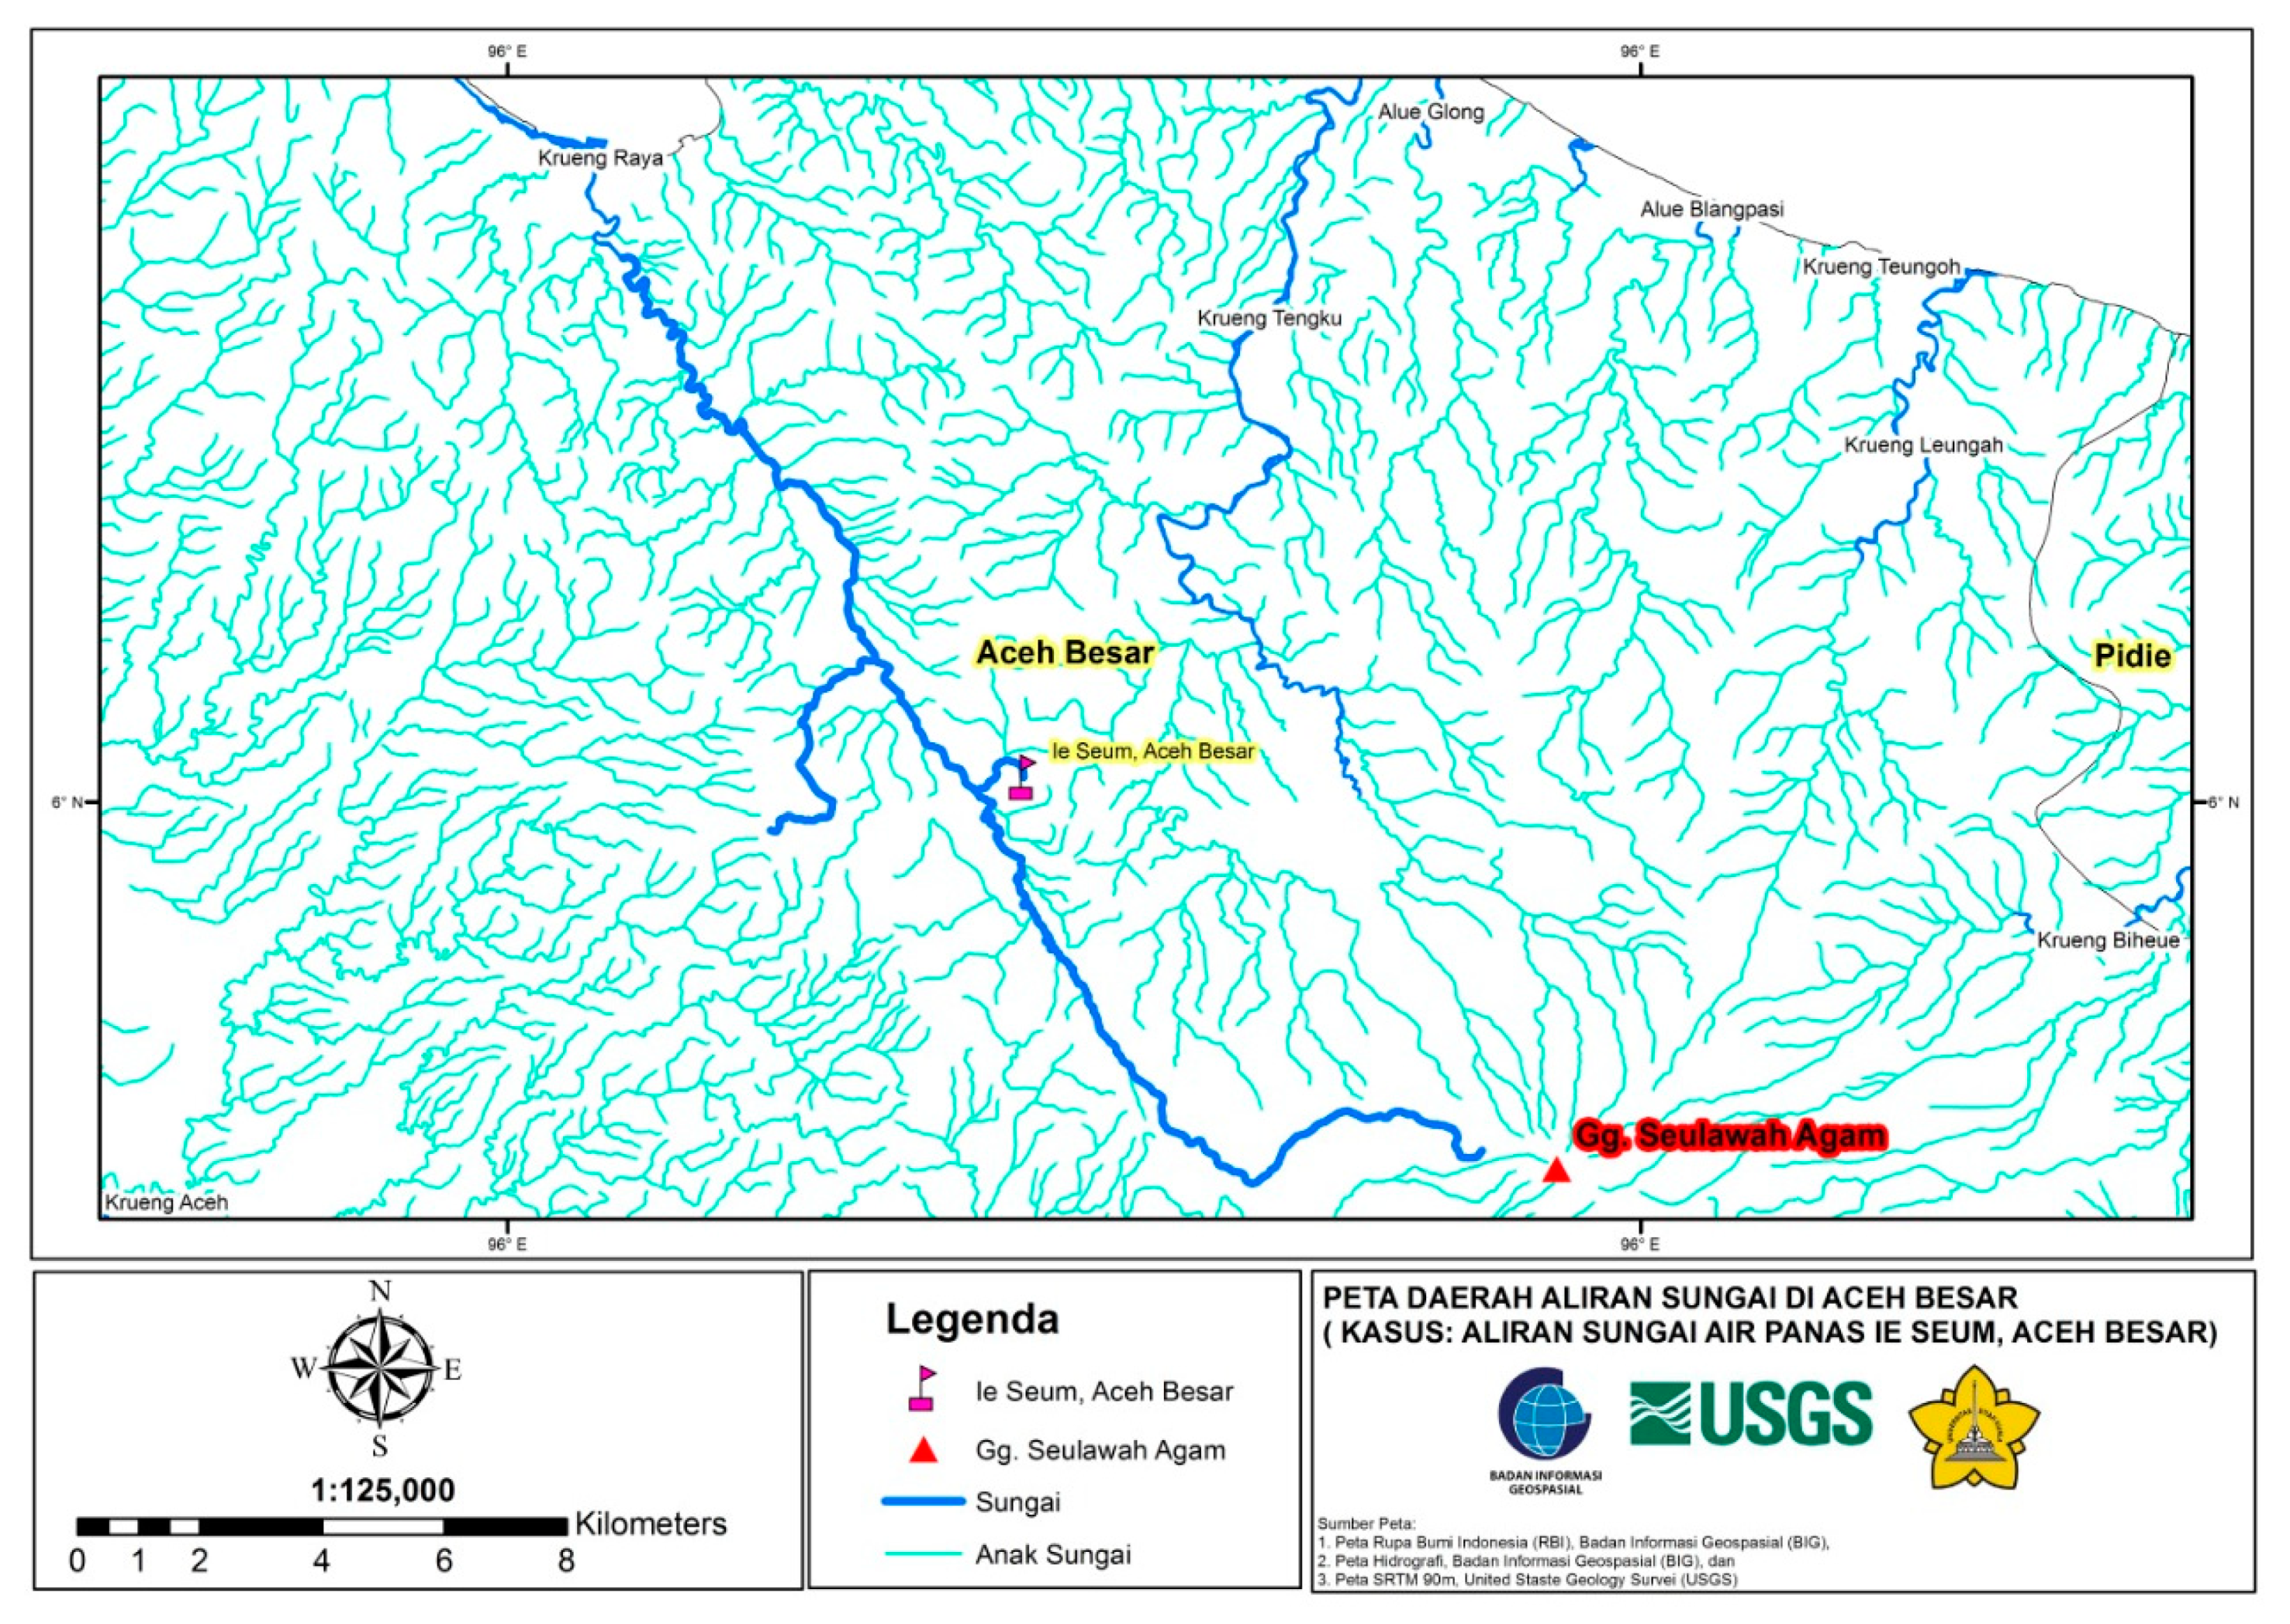
Ie Seu’um geothermal manifestation area. Groundwaters were collected from hot springs and wells, whereas surface waters were collected from rivers and estuaries. There were 11 sample points where the samples were collected, starting from the hot springs to the estuary. The purpose of sampling along the river and estuary was to study arsenic distribution in the water flow. Well waters were collected from the tourist and residential areas. The wells in the residential areas, including boreholes and dug wells, were analyzed to study the exposure of arsenic in underground waters. Meanwhile, sediment samples were collected from the bottom of the center of the rivers and estuaries where water samples were also collected. The sampling points for water and sediment samples are shown in
Table 1 and
Figure 1, whereas the
Ie Seu’um map, in general, is shown in
Figure 2.
2.2.1. Water Sampling
Water samples were collected using a plastic scoop and stored in a PE bottle that had been rinsed once with nitric acid and three times with sample water. The samples were preserved with the addition of nitric acid until pH < 2 and cooled at 4 ± 2 °C [
16]. The samples were then sent to the laboratory for arsenic analysis. In situ analysis was also conducted to obtain data on temperature, pH, TDS, conductivity, salinity, and the coordinates of the sampling points using portable digital thermometers, conductometers, pH meters, TDS meters, and GPS, respectively. For the control purpose, the distilled water was used as control water.
2.2.2. Sediment Samplings
Sediment samples from the bottom of river were collected using a stainless-steel spoon from several points of the river with the body of the researcher facing the upstream of the river. The samples were then mixed and stored on plastic clips labeled with a predetermined code [
17].
2.2.3. Hair Sampling
Hair samples were collected from as many as five points on the head of each respondent. The samples were obtained from residents living around the Ie Seu’um area. Respondents consisted of 10 women according to the criteria.
As for the inclusion criteria of the research, subjects are female; aged 18–49 years; living in Ie Seu’um Village; willing to be a research respondent; do not use chemicals on their hair, such as dyes and hair straighteners; do not suffer from chronic diseases; and use water sourced from Ie Seu’um ground water for daily needs.
Hair samples in the control group were taken from respondents with inclusion criteria that were matched with the control group, namely, female gender, aged 18–49 years, do not use chemicals on hair such as hair coloring and straightening, do not suffer from chronic diseases, have never lived around Ie Seum or other geothermal areas.
Before taking hair samples from the subjects who became research respondents, the respondents first signed a letter of willingness to become research respondents that had been prepared by the research team. The letter of willingness to be a research respondent has been known and approved by the head of public health center Mesjid Raya District, Aceh Besar Regency, and the local Village Head.
The hair was cut 0.5 cm from the roots using stainless steel scissors. Hair samples must be dry and should not be wet or oily [
10].
2.3. Sample Preparation
2.3.1. Sediment Sample Preparation
The sediment sample was cleaned of impurities such as plastic scraps and leaves. Then, the sample was dried at room temperature, crushed until homogeneous, and sieved with a 100-mesh sieve. The sample powder (3 g) was placed into a 250-milliliter Erlenmeyer flask. Demineralized water (25 mL) was added and stirred. HNO
3 p.a. (10 mL) and 3 boiling stones were added to the mixture. The Erlenmeyer flask was closed with a watch glass and heated until the remaining volume of the mixture reached ±10 mL. After cooling, HClO
4 (5 mL) was added to the mixture and heated again until it formed a white smoke, and the solution color turned clear yellowish. Afterward, heating was continued for 30 min. After cooling, the solution was filtered and diluted with deionized water in a 100-milliliter volumetric flask [
18].
2.3.2. Hair Sample Preparation
The hair sample was weighed at 0.2 g and washed with deionized water. The sample was then shaken for about 30 min using a mechanical shaker. The sample was placed into a 100-milliliter Erlenmeyer flask, and H
2SO
4 p.a. (4 mL) and HNO
3 p.a. (3 mL) were added. The Erlenmeyer flask was heated with the gradual addition of HNO
3 until the sample color turned brownish or blackish. HClO
4 (2 mL) was added and heated again until the solution color turned clear yellowish. The liquid extract was then diluted with deionized water in a 100-milliliter volumetric flask [
19].
2.4. Arsenic Analysis with GF-AAS
The solution (20 μL) was injected through the autosampler into the furnace tube for atomization. Arsenic levels were measured at (λ) 193.70 nm. Each sample was measured in three repetitions [
20].
2.5. Method Validation
The validation parameters observed were linearity, precision, %Recovery, LoD, and LoQ. Linearity is determined by standard measurements at seven concentration levels. Precision is determined via standard measurements at six repetitions. %Recovery is determined by measuring the spiked sample. LoD and LoQ are determined based on the acquisition of the calibration curve regression line [
21]. The equations are presented in
Table 2.
2.6. Calculation of the Standard Deviation of Concentration (Sc)
The uncertainty of the concentration measurement results of each parameter was presented in standard deviation values and some statistical function data using the LINEST function in Microsoft Excel (Microsoft Corporation, Redmond, WA, USA). The calculation results obtained statistical function data, including slope (m) and its standard deviation (Sm), intercept (b) and its standard deviation (Sb), the determination of coefficient (R), regression standard deviation (Sr), and standard deviation of concentration (Sc). The equations used in calculating standard deviation and statistical functions are presented in
Table 2 [
22].
3. Result and Discussion
3.1. Water Sample Characteristics
The parameters for the in situ analysis of water samples were pH, TDS, EC, temperature, and salinity. The result of the in situ analysis is shown in
Table 3.
The results of the in situ analysis (
Table 3) showed that the acidity level (pH) of all the water samples were relatively neutral (pH = 6.15–7.64), which still qualify for drinking and clean water (6.5 ≥ pH ≤ 8.5), except treatment drinking water (IS7) [
23]. The TDS test showed that the water in the geothermal manifestation location, namely, the hot springs (IS1) and borehole five (IS10), and the rivers that have been in direct contact with hot water flows (IS3, IS4, and IS5) had very high TDS levels (1614–4534 mg/L), thus not qualifying to be used either as drinking water or clean water. The water outside of the manifestation location, namely, borehole one (IS6), the treatment drinking water (IS7), and the community boreholes (IS8, IS9, and IS11), and the rivers that have not been in direct contact with the hot water flow (IS2) had low TDS levels (3.48–117.94 mg/L), thus, qualifying to be used as both drinking water and clean water (TDS ≤ 500 for drinking water and TDS ≤ 1000 for clean water) [
23].
The EC value was measured based on electrical conductivity from the electrolyte contained in the water sample. Similar to the TDS levels, the EC value of the water at the geothermal manifestation location (IS1 and IS10) and the rivers that have been in direct contact with the hot water flows (IS3, IS4, and IS5) had very high EC values (>1000 μS/cm); thus, indicating the presence of ions from hot springs in the surrounding water.
The salinity levels of the hot springs (IS1) and the boreholes (IS10) were also quite high, which were 17.8 and 8.46%, respectively, indicating a fairly high salt content in the geothermal water. This condition also affected the salinity of the river water, which has been in contact with hot water (IS3 and IS4), where the salinity increased up to four times compared with the natural river water (IS2). The water in the estuary (IS5) had the highest salinity, which was 19.08%, where the influence of seawater was already present. Meanwhile, the salinity of the well, refill, and borehole waters were quite normal and in accordance with the quality standard of freshwater salinity, which is <0.5% [
24].
There was an increase in the TDS and EC values of the IS11 resident well compared with the other resident wells. This was influenced by the location of the IS11 well, which was quite close to the geothermal manifestation location. The IS11 well is also directly around the hot water flow. The water temperature of the hot springs was quite high, which is up to 85 °C. However, the other water temperatures were normal and in accordance with the temperature of the surrounding environment, which is 27–30 °C, except for the boreholes (IS10) in the geothermal manifestation location, which was warm (36 °C). Based on the results of the in situ analysis, only the resident boreholes (IS8, IS9, and IS11), the boreholes (IS6), the treatment drinking water, and the rivers that have not been in contact with hot water flow are still suitable for daily use for the community in the area. Meanwhile, the water in the manifestation location and the river waters that have been in contact with the hot water flow do not qualify for clean water.
3.2. Method Validation
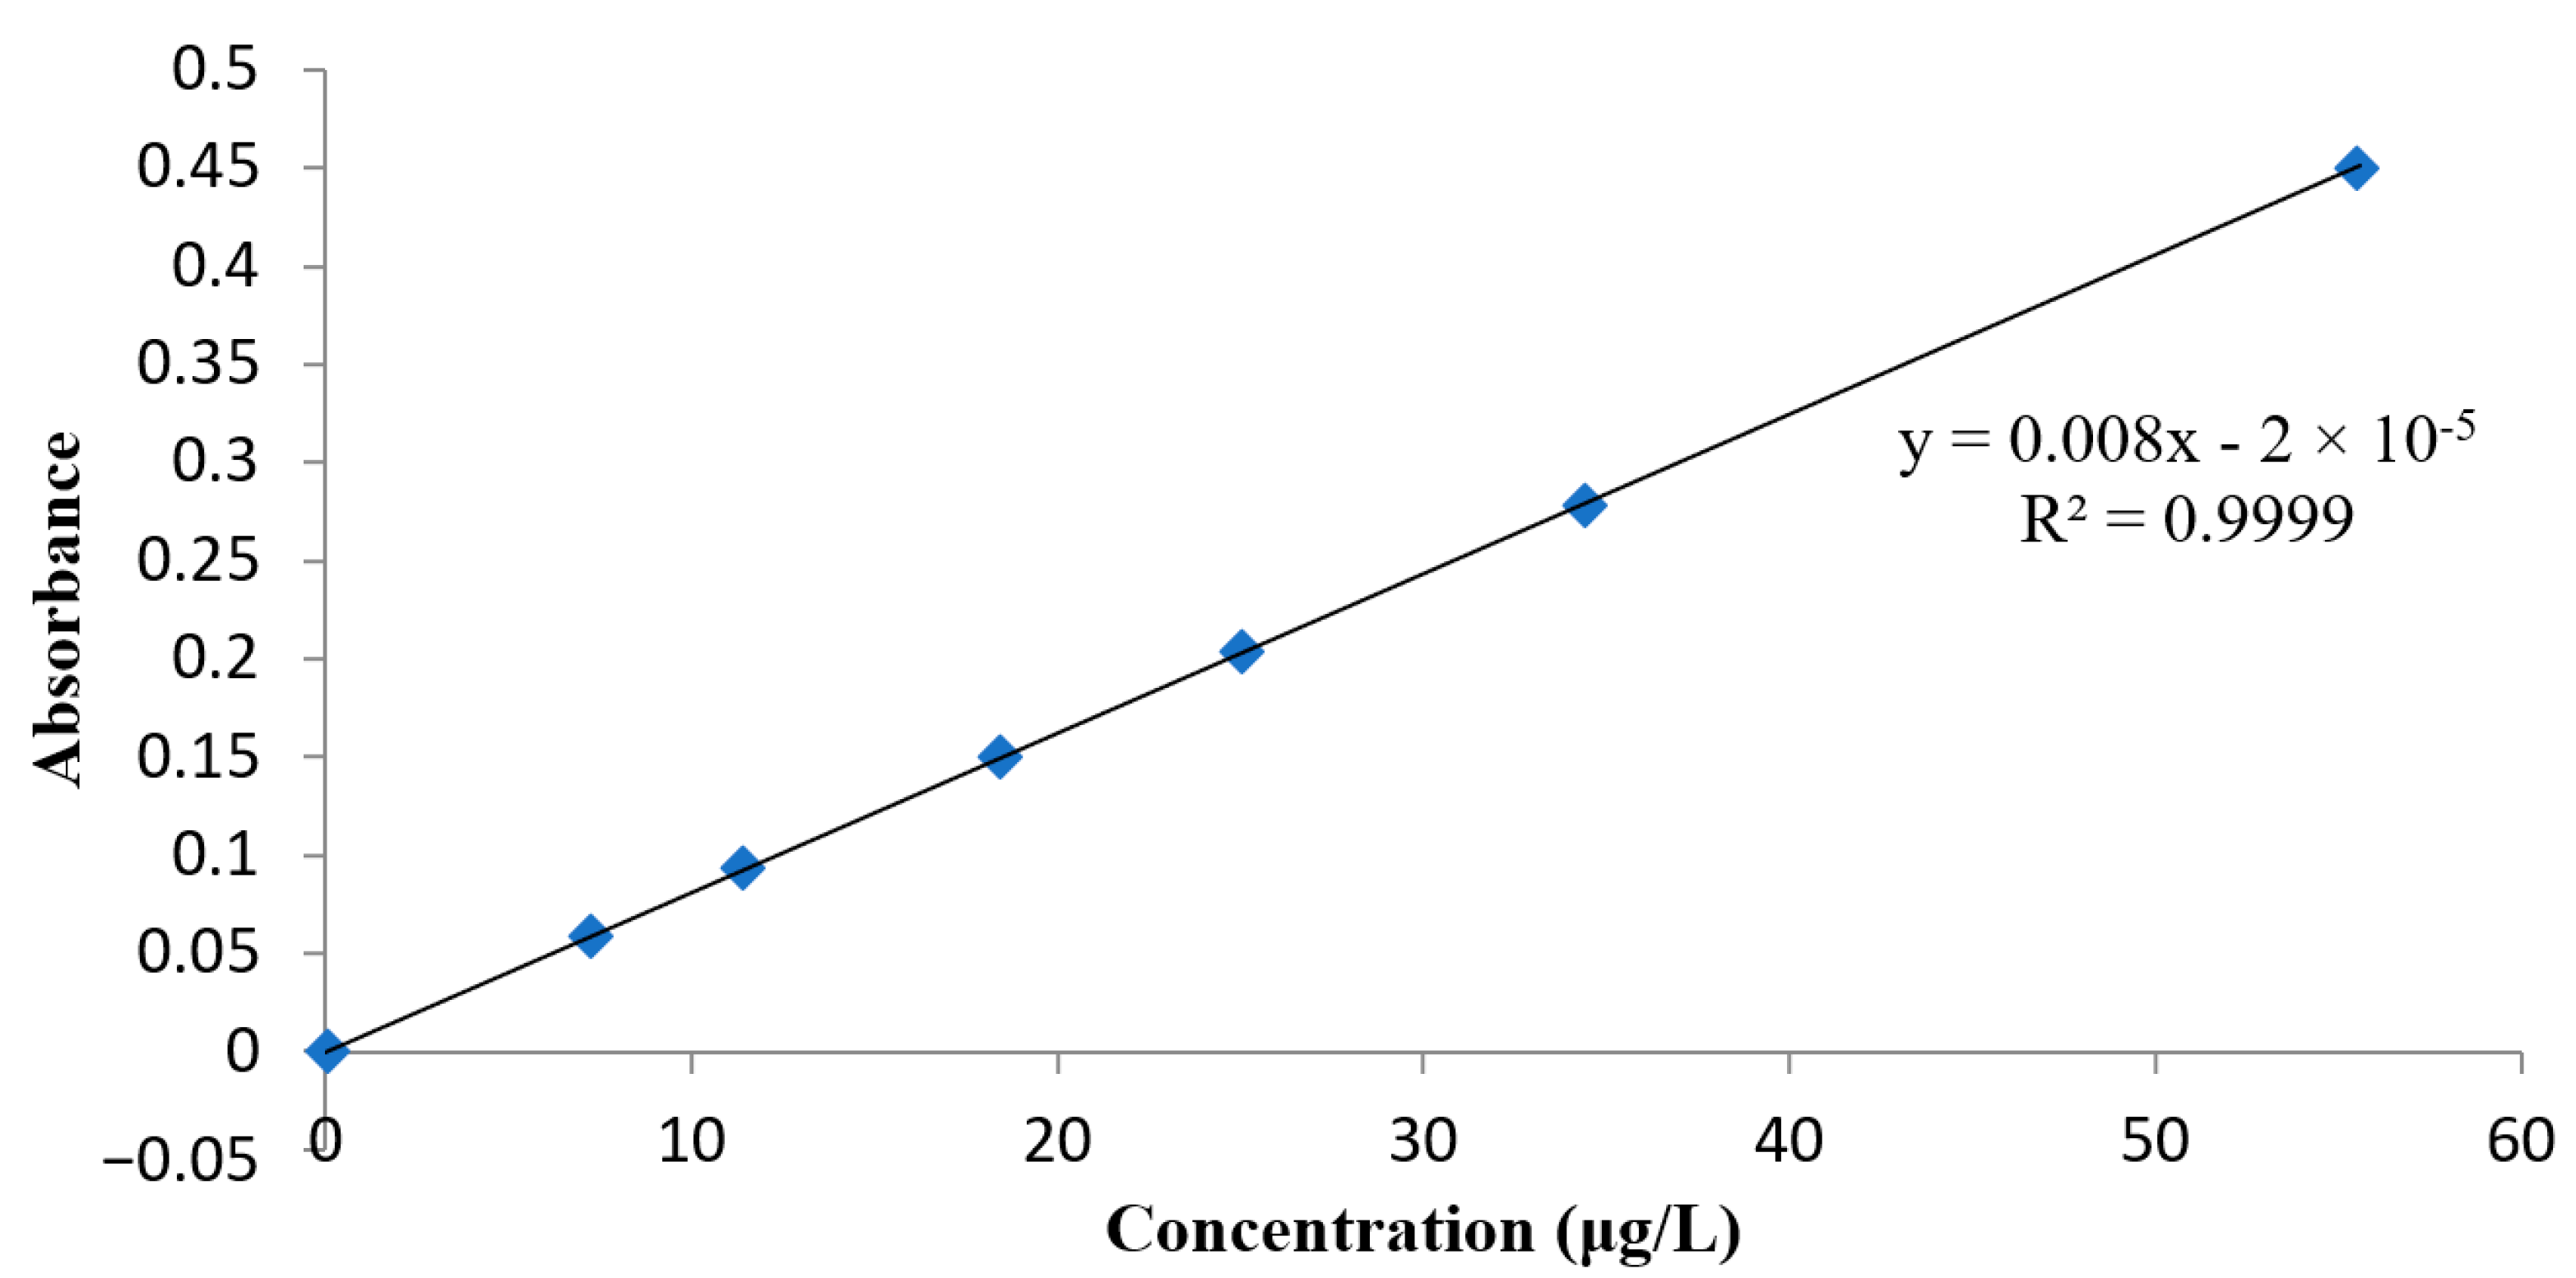
3.2.1. Calibration Curves and LoD/LoQ
The calibration curve obtained from this study is shown in
Figure 3. The R
2 value obtained from the curve was 0.9999, which was calculated based on Microsoft Excel. This showed that the calibration curve obtained a good correlation between the standard concentration and instrument response. Therefore, the calibration curve has the feasibility of analyzing samples. Based on the calibration curve, the LoD and LoQ values were 0.009 and 0.027 μg/L, which were statistically calculated using the LINEST function (
Table 4) in Microsoft Excel [
22].
3.2.2. Precision and %Recovery
Based on
Table 5, the %Recovery of the hair and sediment samples, which have been spiked with 30 μg/L arsenic standard solution, was in the allowable range of 70–125% [
25]. This suggested that the method used for hair and sediment preparation is suitable for arsenic analysis. The precision was also tested using 30 μg/L arsenic standard solutions, and the measurement showed good precision with %RSD < 2% [
25].
3.3. Arsenic Analysis in Water Samples
The validated method was applied to measure the arsenic levels in the water samples, the sediment, and resident hair in the geothermal manifestation area of
Ie Seu’um, Seulawah Agam Volcano, Aceh. The water samples analyzed included the hot springs (IS1), the rivers (IS2, IS3, and IS4), the estuary (IS5), the boreholes (IS6), the treatment drinking water (IS7), the resident boreholes (IS8, IS9, and IS11), and the boreholes in a geothermal manifestation location (IS10). The results showed that arsenic was detected in all the water samples at various concentrations (
Table 6).
The hot springs (IS1) showed very high arsenic levels of 166.73 µg/L, which are dangerous if exposed to organisms. This also affected the high levels of arsenic exposure to the borehole water in the manifestation location (IS10) and the river waters that have been in direct contact with hot water (IS3, IS4, and IS5). Both of these waters cannot be used by the surrounding community either as drinking water or clean water because they did not pass the water quality standards (10 μg/L for drinking water and 50 μg/L for clean water) recommended by Menkes RI (2017) and the WHO (2011) [
26,
27]. There was a decrease in the arsenic levels in the river flow from the contact point with hot water to the estuary, but the arsenic levels still exceeded the quality standard. This decrease was expected because of the dissolution by seawater. High arsenic levels were also detected in the borehole water (IS6) and the two resident boreholes (IS9 and IS11). These well waters were assumed to be exposed to arsenic from underground water, which has been exposed to arsenic from hot water. Meanwhile, the resident borehole water of IS9 and IS11 located along the river, which has been in contact with hot water, were exposed to arsenic from the river water.
Low levels of arsenic were detected in the river water (IS2), the treatment drinking water (IS7), and the boreholes (IS8). The arsenic levels in these three waters are at a safe level to be used by the community as clean water. Even the arsenic levels in the river water (IS2) and the treatment drinking water (IS7) still qualify for drinking water quality standards. The low levels of arsenic in the river water (IS2) are due to its location, which has not been in contact with hot water. The same thing was also shown in the resident borehole water (IS8), which was around the river water (IS2) with low arsenic levels. The low levels of arsenic in the treatment drinking water (IS7) are due to the fact that the water has been treated for consumption purposes.
3.4. Arsenic Analysis in Sediment Samples
Arsenic levels in the sediment were also identified along with the river flow at the same point as the water sampling. The results showed that the arsenic levels in the river flow sediments that had been in contact with hot water (IS3, IS4, and IS5) were twice higher than the sediments of drained water, which had not been in contact with hot water (
Table 7). This showed that hot water contributed to arsenic distribution in river sediments. However, the arsenic levels in the sediment were still normal. Based on Salim et al. (2009), the normal levels of arsenic in river sediments are in the range of 10–33 mg/kg, which corresponds to the value recommended by the National Oceanic and Atmospheric Administration (NOAA) [
28].
The lower arsenic levels in the sediment than those in the water can be caused by several factors, one of which is the difference in pH between the sediment and the water. Arsenic tends to be distributed to the water phase when the pH of the sediment is lower than that of the water. The reduction environment tends to liberate arsenic, whereas the oxidation environment in the presence of iron ions can absorb arsenic very well [
24]. Besides these factors, physical factors, such as water flow and erosion, are also causes of the reduced arsenic levels in the sediment.
3.5. Arsenic Analysis in Hair Samples
The hair samples obtained from 10 residents living around the
Ie Seu’um area were analyzed using GF-AAS, and the results were shown in
Table 8.
Arsenic exposures in people living around the geothermal areas were identified by measuring the accumulation of arsenic in hair. Ten people of various ages were used as respondents. The results showed that 9 out of the 10 respondents had been exposed to various arsenic levels (
Table 8). It should be noted that the nine people contaminated with arsenic live close to the rivers contaminated with arsenic originating from the
Ie Seu’um spring, while the one person who is not contaminated lives close to the streams of water that are not contaminated with arsenic but are still in the
Ie Seu’um area. This showed the high arsenic contamination in communities around the geothermal area. Although there is no quality standard issued by the government regarding arsenic in humans, several researchers have determined the level of arsenic poisoning in the human body. Wu and Chen (2010) stated that arsenic levels above 1 mg/kg are categorized as poisoning [
29]. This limit is determined based on the average arsenic level in the hair of healthy people in China, which was 1 mg/kg. However, according to Ali (2003), arsenic levels above 3 mg/kg are categorized as poisoning [
30]. Arsenic levels around 100 mg/kg were often found in people who were directly contaminated with arsenic material. The Mayo Clinic (2020) reported that the arsenic level in hair that has caused death is 210 mg/kg [
31].
Referring to the standards set by Wu and Chen (2010) and Ali (2003), the arsenic levels in the hair samples have passed the normal threshold for arsenic poisoning [
29,
30]. The high arsenic levels in human hair were due to arsenic accumulation through contaminated water, especially long time and continuous consumption. Although water treatment exists in the area with arsenic levels within safe limits, not all the residents used this water for consumption purposes.
Based on short interviews with the respondents, some residents used river water as drinking water. This is caused by the unawareness of the residents of the presence of heavy metals in the water due to geothermal activity. Moreover, arsenic poisoning in small doses does not show any symptoms in the short term; therefore, the symptoms of arsenic poisoning are difficult to identify earlier [
32]. The lethal dose of arsenic is 2 mg/kg/day [
8]. Further research is needed to identify the effects of arsenic exposure in the community around the
Ie Seu’um geothermal area. However, because of the indirect effect of arsenic exposure, the most rational action is prevention [
32].
Age and exposure level did not show a linear relationship. Although high arsenic levels were detected in the majority of older respondents, low arsenic levels were not indicated by younger respondents. This was due to the higher drinking needs of the age range of 19–29 years compared with the older one. This caused the young people to be more exposed to arsenic. Apart from being affected by the duration of contamination, arsenic accumulation in the body is also influenced by the intensity of the contamination. Therefore, the arsenic levels in hair are influenced not only by age but also by other factors such as the intensity and sources of exposure, such as contaminated drinks and foods [
32].
4. Conclusions
A validated method has been applied to analyze the arsenic levels in the water, sediment, and hair samples of residents in the Ie Seu’um geothermal area using GF-AAS. This method was very linear and sensitive and has good %Recovery and precision with a correlation coefficient of 0.9999, LoD of 0.009 μg/L, LoQ of 0.027 μg/L, recovery of 89.117–101.027% for hair samples and 88.337–105.175% for sediment samples, and RSD of 1.067%. The sample test results showed that the hot springs contained the highest arsenic with levels of 166.73 ± 0.0081 μg/L (IS1). Meanwhile, the water samples in the rivers that had not been in direct contact with the hot water (IS2) flow had the lowest arsenic content, which is 0.80 ± 0.0036 μg/L. All the river water samples that had been in contact with hot water, resident boreholes, and the boreholes located around the hot water streams/rivers were contaminated with arsenic above the water quality standard for both drinking water and clean water. Only the river water that had not been in contact with hot water and water treatment was detected with an arsenic level below the drinking water quality standard. In addition, the resident boreholes located far from the hot water flow were detected with an arsenic level below the clean water quality standard. All the sediment samples showed an arsenic contamination with levels between 2.56 and 6.86 mg/kg but were still within the normal limits recommended by the NOAA. The arsenic exposures in communities around the geothermal area were very high, where 9 out of 10 respondents were positive for arsenic with levels of 54.59–164.57 mg/kg, which were already above the threshold set by the researchers.


 ,
, 


