Article

Groundwater Quality Issues and Challenges for Drinking and Irrigation Uses in Central Ganga Basin Dominated with Rice-Wheat Cropping System

1
Groundwater Hydrology Division, National Institute of Hydrology, Roorkee 247667, India
2
Department of Farm Engineering, Institute of Agricultural Sciences, Banaras Hindu University, Varanasi 221005, India
3
Hydrological Investigation Division, National Institute of Hydrology, Roorkee 247667, India
4
School of Engineering, The University of Newcastle, Callaghan, NSW 2308, Australia
5
Environmental Hydrology Division, National Institute of Hydrology, Roorkee 247667, India
6
Central India Hydrology, National Institute of Hydrology-Regional Centre, Bhopal 462016, India
7
Department of Hydrology, Indian Institute of Technology, Roorkee 247667, India
8
Department of Civil Engineering, National Institute of Technology, Patna 800005, India
*
Authors to whom correspondence should be addressed.
Water 2021, 13(17), 2344; https://doi.org/10.3390/w13172344
Submission received: 9 July 2021 / Revised: 19 August 2021 / Accepted: 23 August 2021 / Published: 26 August 2021
(This article belongs to the Special Issue Groundwater Management in a Changing World: Challenges and Endeavors)

Abstract

:
Increased population and increasing demands for food in the Indo-Gangetic plain are likely to exert pressure on fresh water due to rise in demand for drinking and irrigation water. The study focuses on Bhojpur district, Bihar located in the central Ganga basin, to assess the groundwater quality for drinking and irrigation purpose and discuss the issues and challenges. Groundwater is mostly utilized in the study area for drinking and irrigation purposes (major crops sown in the area are rice and wheat). There were around 45 groundwater samples collected across the study region in the pre-monsoon season (year 2019). The chemical analytical results show that Ca2+, Mg2+ and HCO3 ions are present in abundance in groundwater and governing the groundwater chemistry. Further analysis shows that 66%, 69% and 84% of the samples exceeded the acceptable limit of arsenic (As), Fe and Mn respectively and other trace metals (Cu, Zn, Pb, Cd) are within the permissible limit of drinking water as prescribed by Bureau of Indian Standard for drinking water. Generally, high As concentration has been found in the aquifer (depth ranges from 20 to 40 m below ground surface) located in proximity of river Ganga. For assessing the irrigation water quality, sodium adsorption ratio (SAR) values, residual sodium carbonate (RSC), Na%, permeability index (PI) and calcium alteration index (CAI) were calculated and found that almost all the samples are found to be in good to excellent category for irrigation purposes. The groundwater facie has been classified into Ca-Mg-HCO3 type.

1. Introduction

Groundwater (GW) act as a vital natural resources for millions of people in India and around the globe for drinking, irrigation and industrial uses. Several studies have highlighted tremendous overexploitation of the groundwater across the world probably due to the advancement in industry and urban sectors [1,2]. GW being one of the most important components of the hydrological cycle which contributes to the sub-surface flow, makes it crucial in several hydrological models [3,4]. In order to decide the water suitability for various purposes such as domestic usage and irrigation, the GW quality requires special attention. Deteriorating GW quality on both regional and global scale causes apprehension for policy makers, researchers, engineers etc. [5]. Geogenic contamination of groundwater occurs due to various geo-chemical and biological reactions takes place while interaction of water with aquifer material, and anthropogenic contamination is due to human interferences in the environment [6,7]. Recently, various activities extending from GW extraction, excessive utilization of fertilizers, pesticides and domestic and industrial discharge reflects serious GW contamination [8,9,10,11]. It is very difficult to restore GW once it gets contaminated.
Groundwater serves about 80% of rural population and 50% of urban population of India [12,13]. Groundwater structures are increasing at an exponential rate to meet the water requirement for different purposes. The Indo-Gangetic plain accounts for 25% of global GW extraction and is one of the most important water systems on the Earth. The middle Gangetic plain (GP) plays an important role in providing livelihood to millions from its dominant rice–wheat cropping system [14]. The people use groundwater due to its fascinating features, such as its large storage volume, it can be extracted based on requirement, its lower risk compared to other surface water sources, etc. The key factor such as demand management, recharge enhancement and alternative water sources needs to be examined for GW sustainability and maximizing the value by proper utilization [15].
Various parts of India have been reported by GW contamination due to the presence of salinity, fluoride, arsenic, iron and nitrate content in the water. The use of natural resources in unplanned way resulting into more production of waste which pose a threat to groundwater. The groundwater pollution in several parts of the India is increasing at an alarming rate and it is high time to identify the sources and abate or remediate before it causes extensive damage to public health. The GW quality assessment is an important tool for examining groundwater utilization for drinking and irrigation purposes [16]. It is also affected by different processes extending from atmospheric condensation to the water discharged from a well. Additionally, GW quality differs from aquifer to aquifer, water table depth, season to season and retention time which affect the composition of dissolved solids present in it. It is necessarily required to perform water quality assessment for drinking water and irrigation purposes [17,18,19]. The Bhojpur district, Bihar located in the central Ganga basin has been selected for the present study. The economy of the district is dominated mostly by agriculture. The alluvial plain of study area shows dynamic characteristic of rivers (Ganga and Son) and depositional pattern of sediments. The lower and middle GP including Bhojpur district is affected by rampant occurrence of arsenic [11,20]. A numbers of studies have been carried out in lower GP to investigate occurrence and distribution of arsenic including other water quality parameters. However, very few studies have been reported for the present study area. A hydro-chemical study was carried out to identify groundwater chemistry and to assess the suitability for drinking and irrigation uses. A systematic approach was adopted for sampling, analyses and interpretation of primary and secondary data viz. hydrogeological and hydro-chemical. The outcome of this study may help in designing groundwater monitoring networks and remedial measures at regional and national levels.

2. Study Area

Bhojpur district, with a total geographical area of 2395 km2, is situated in Bihar state and was selected as the study area. The study area is located in central Ganga basin and lies within 25°10′ to 25°40′ N and 84°10′ to 84°50′ E. The district is covered by two major rivers viz., Ganga and Son in the north and eastern side (Figure 1). The population of the district is 27.20 lakh with population density of 1136 inhabitants per square kilometer.

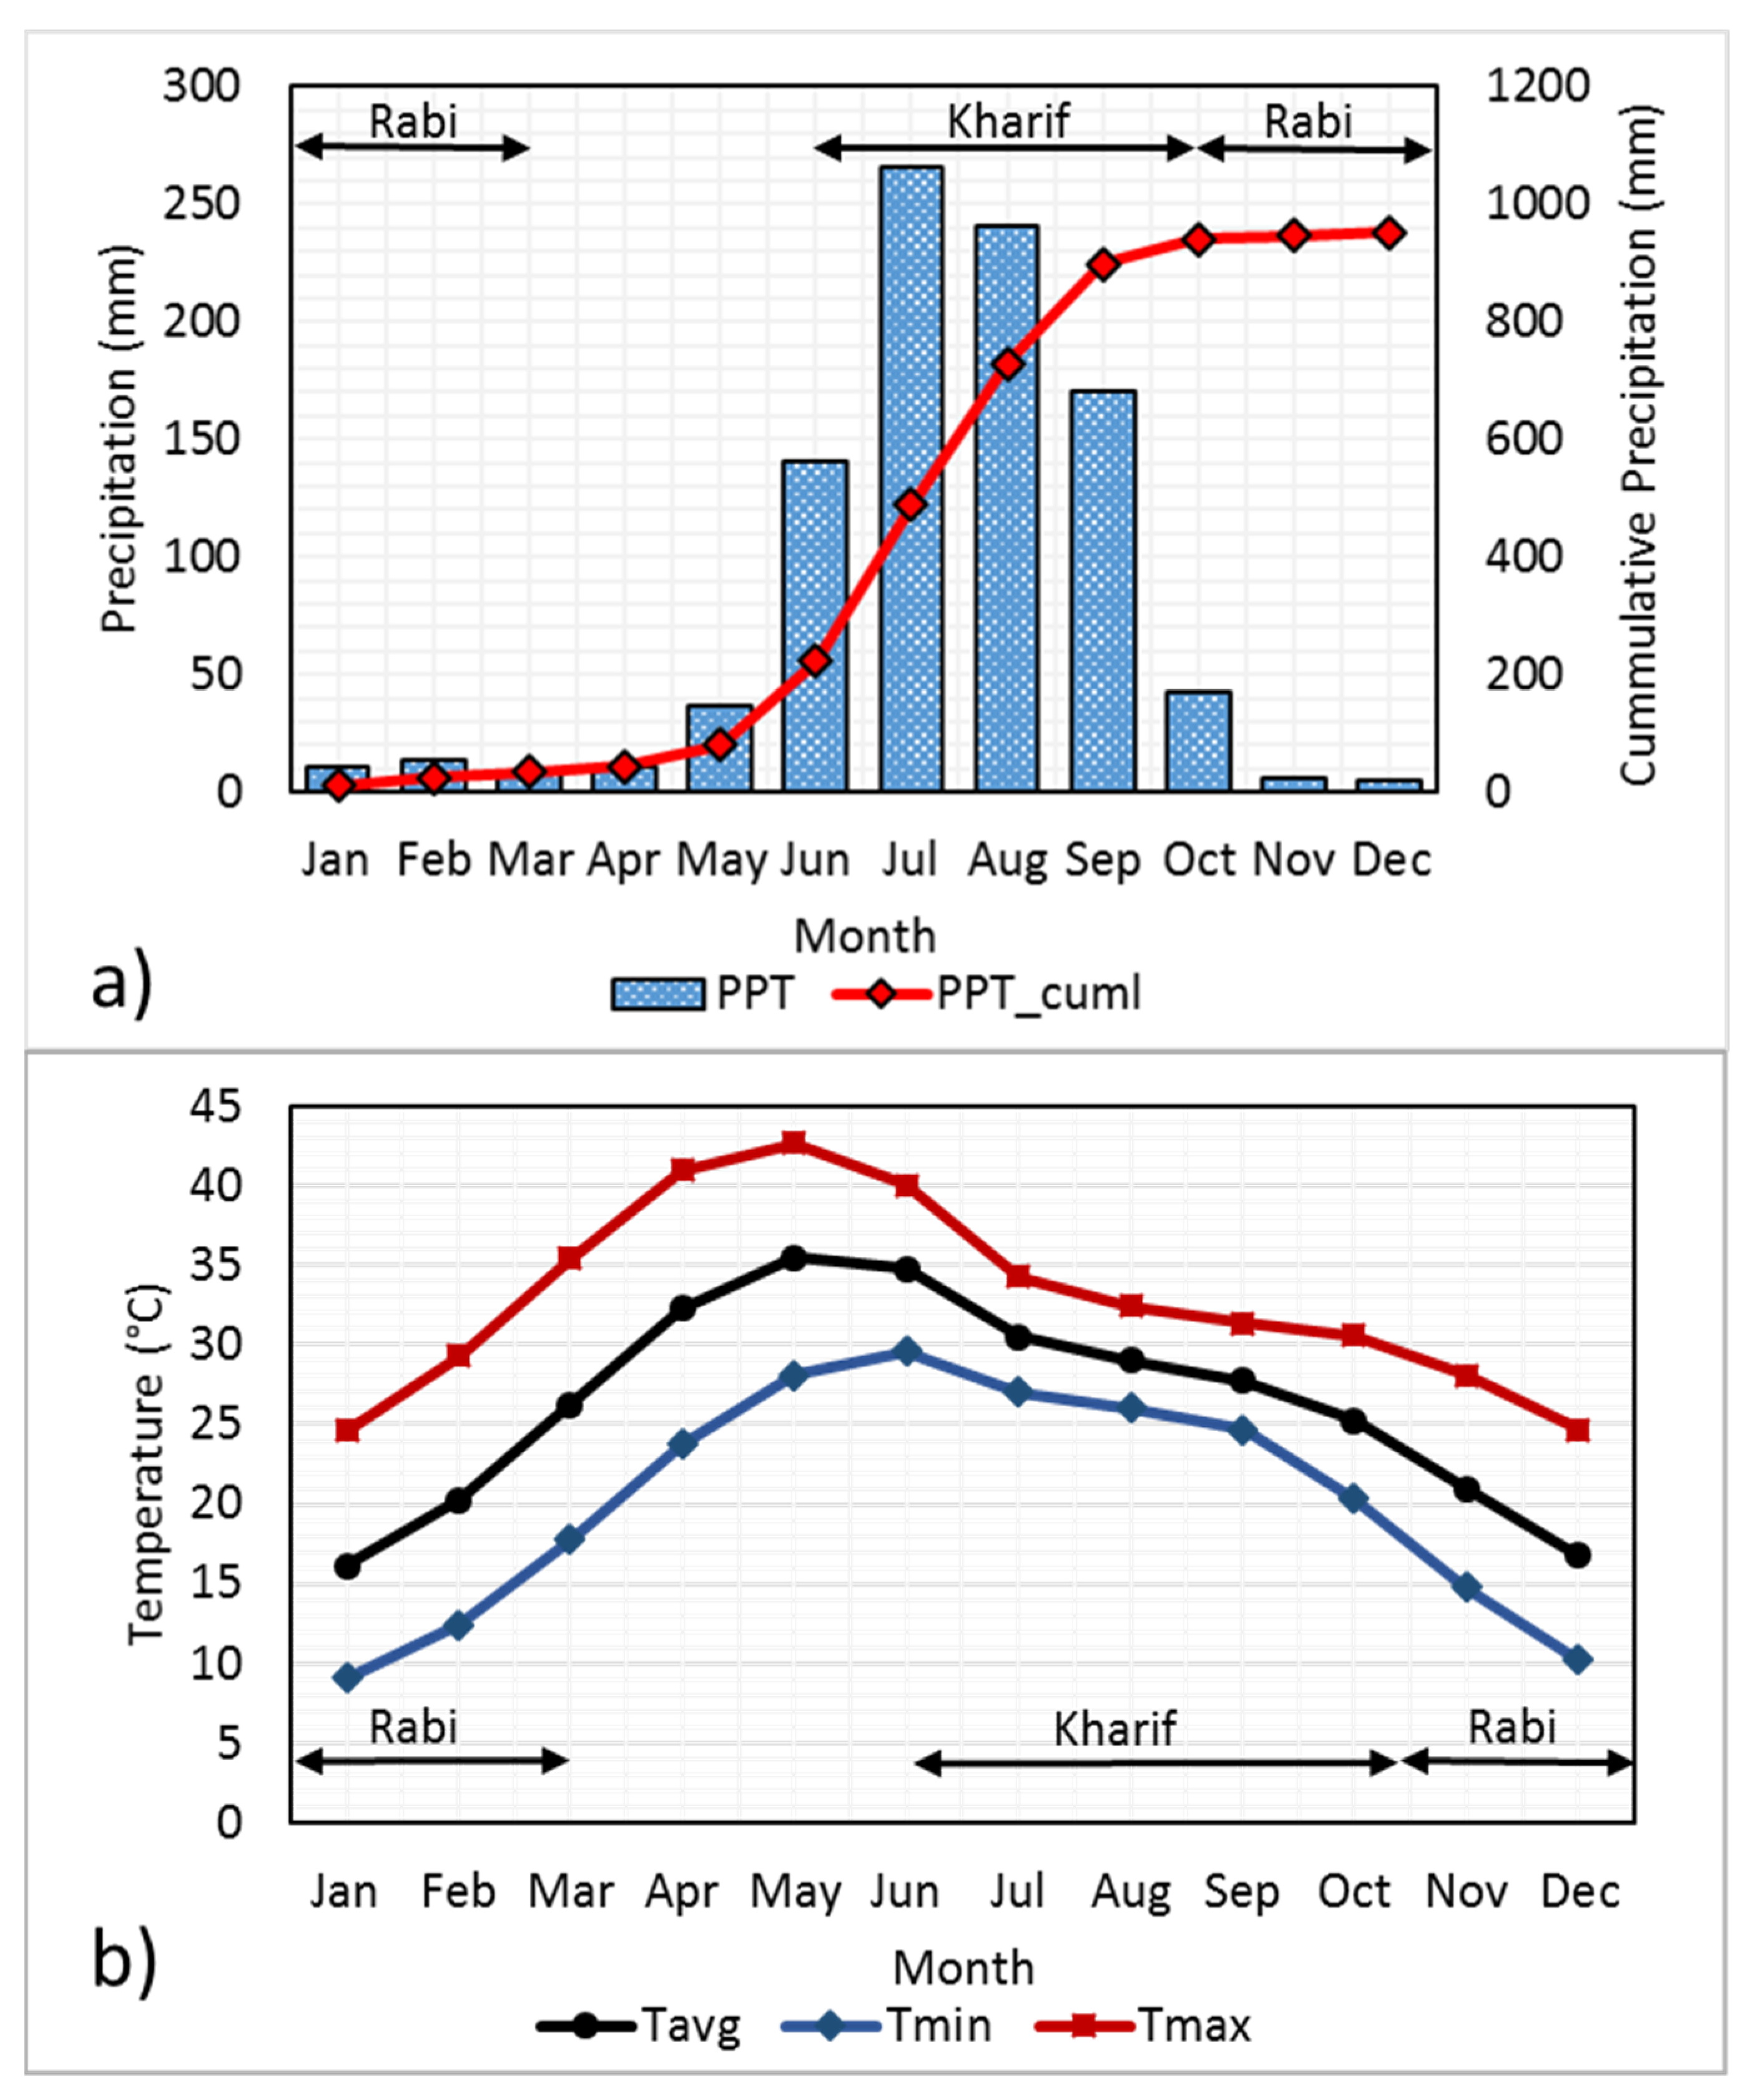
2.1. Hydroclimatology
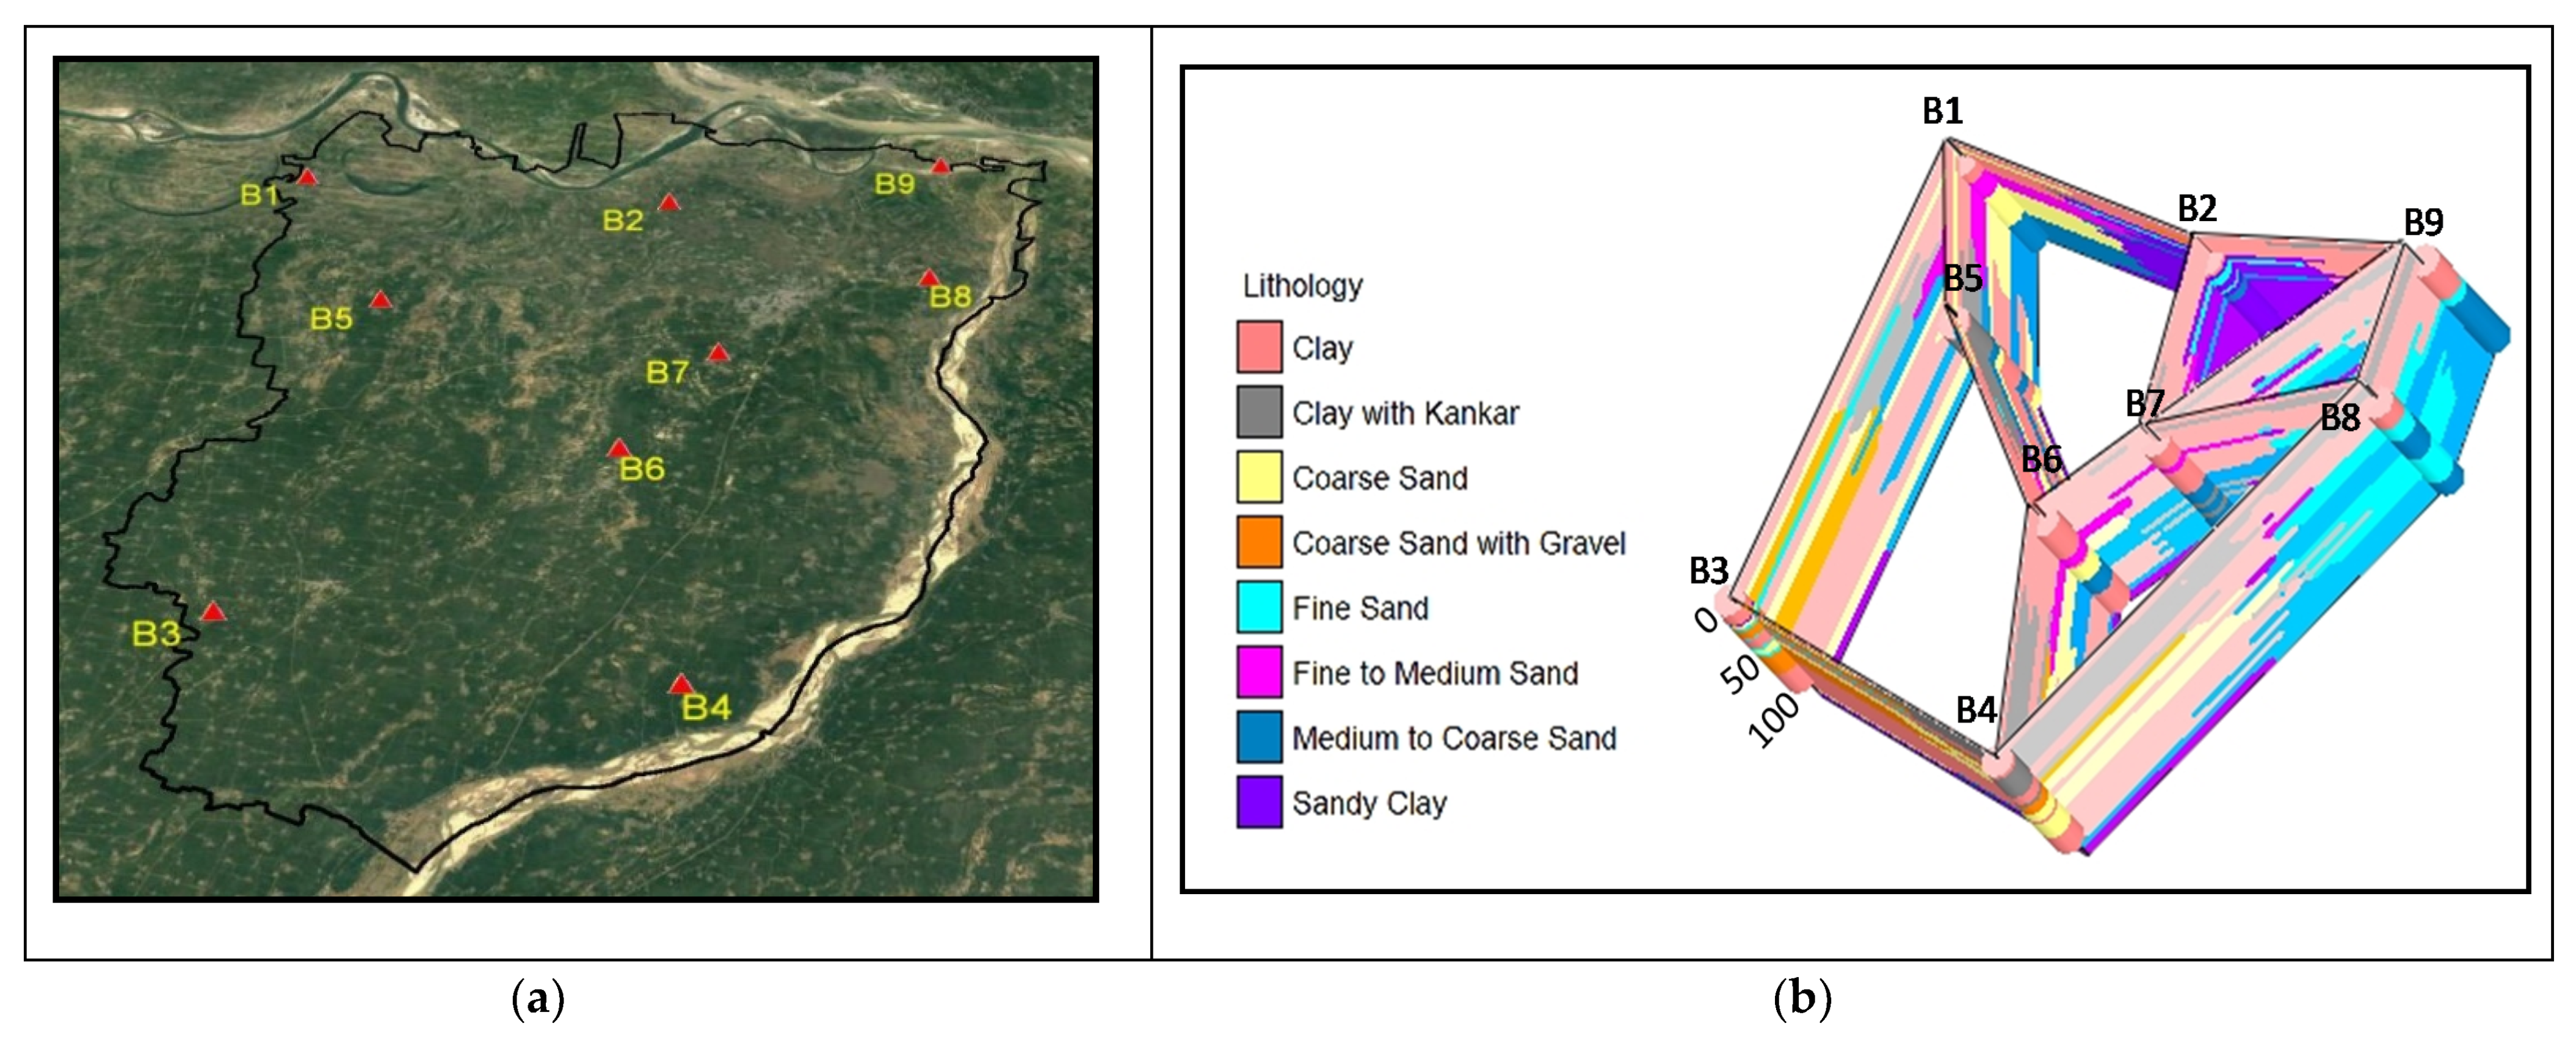
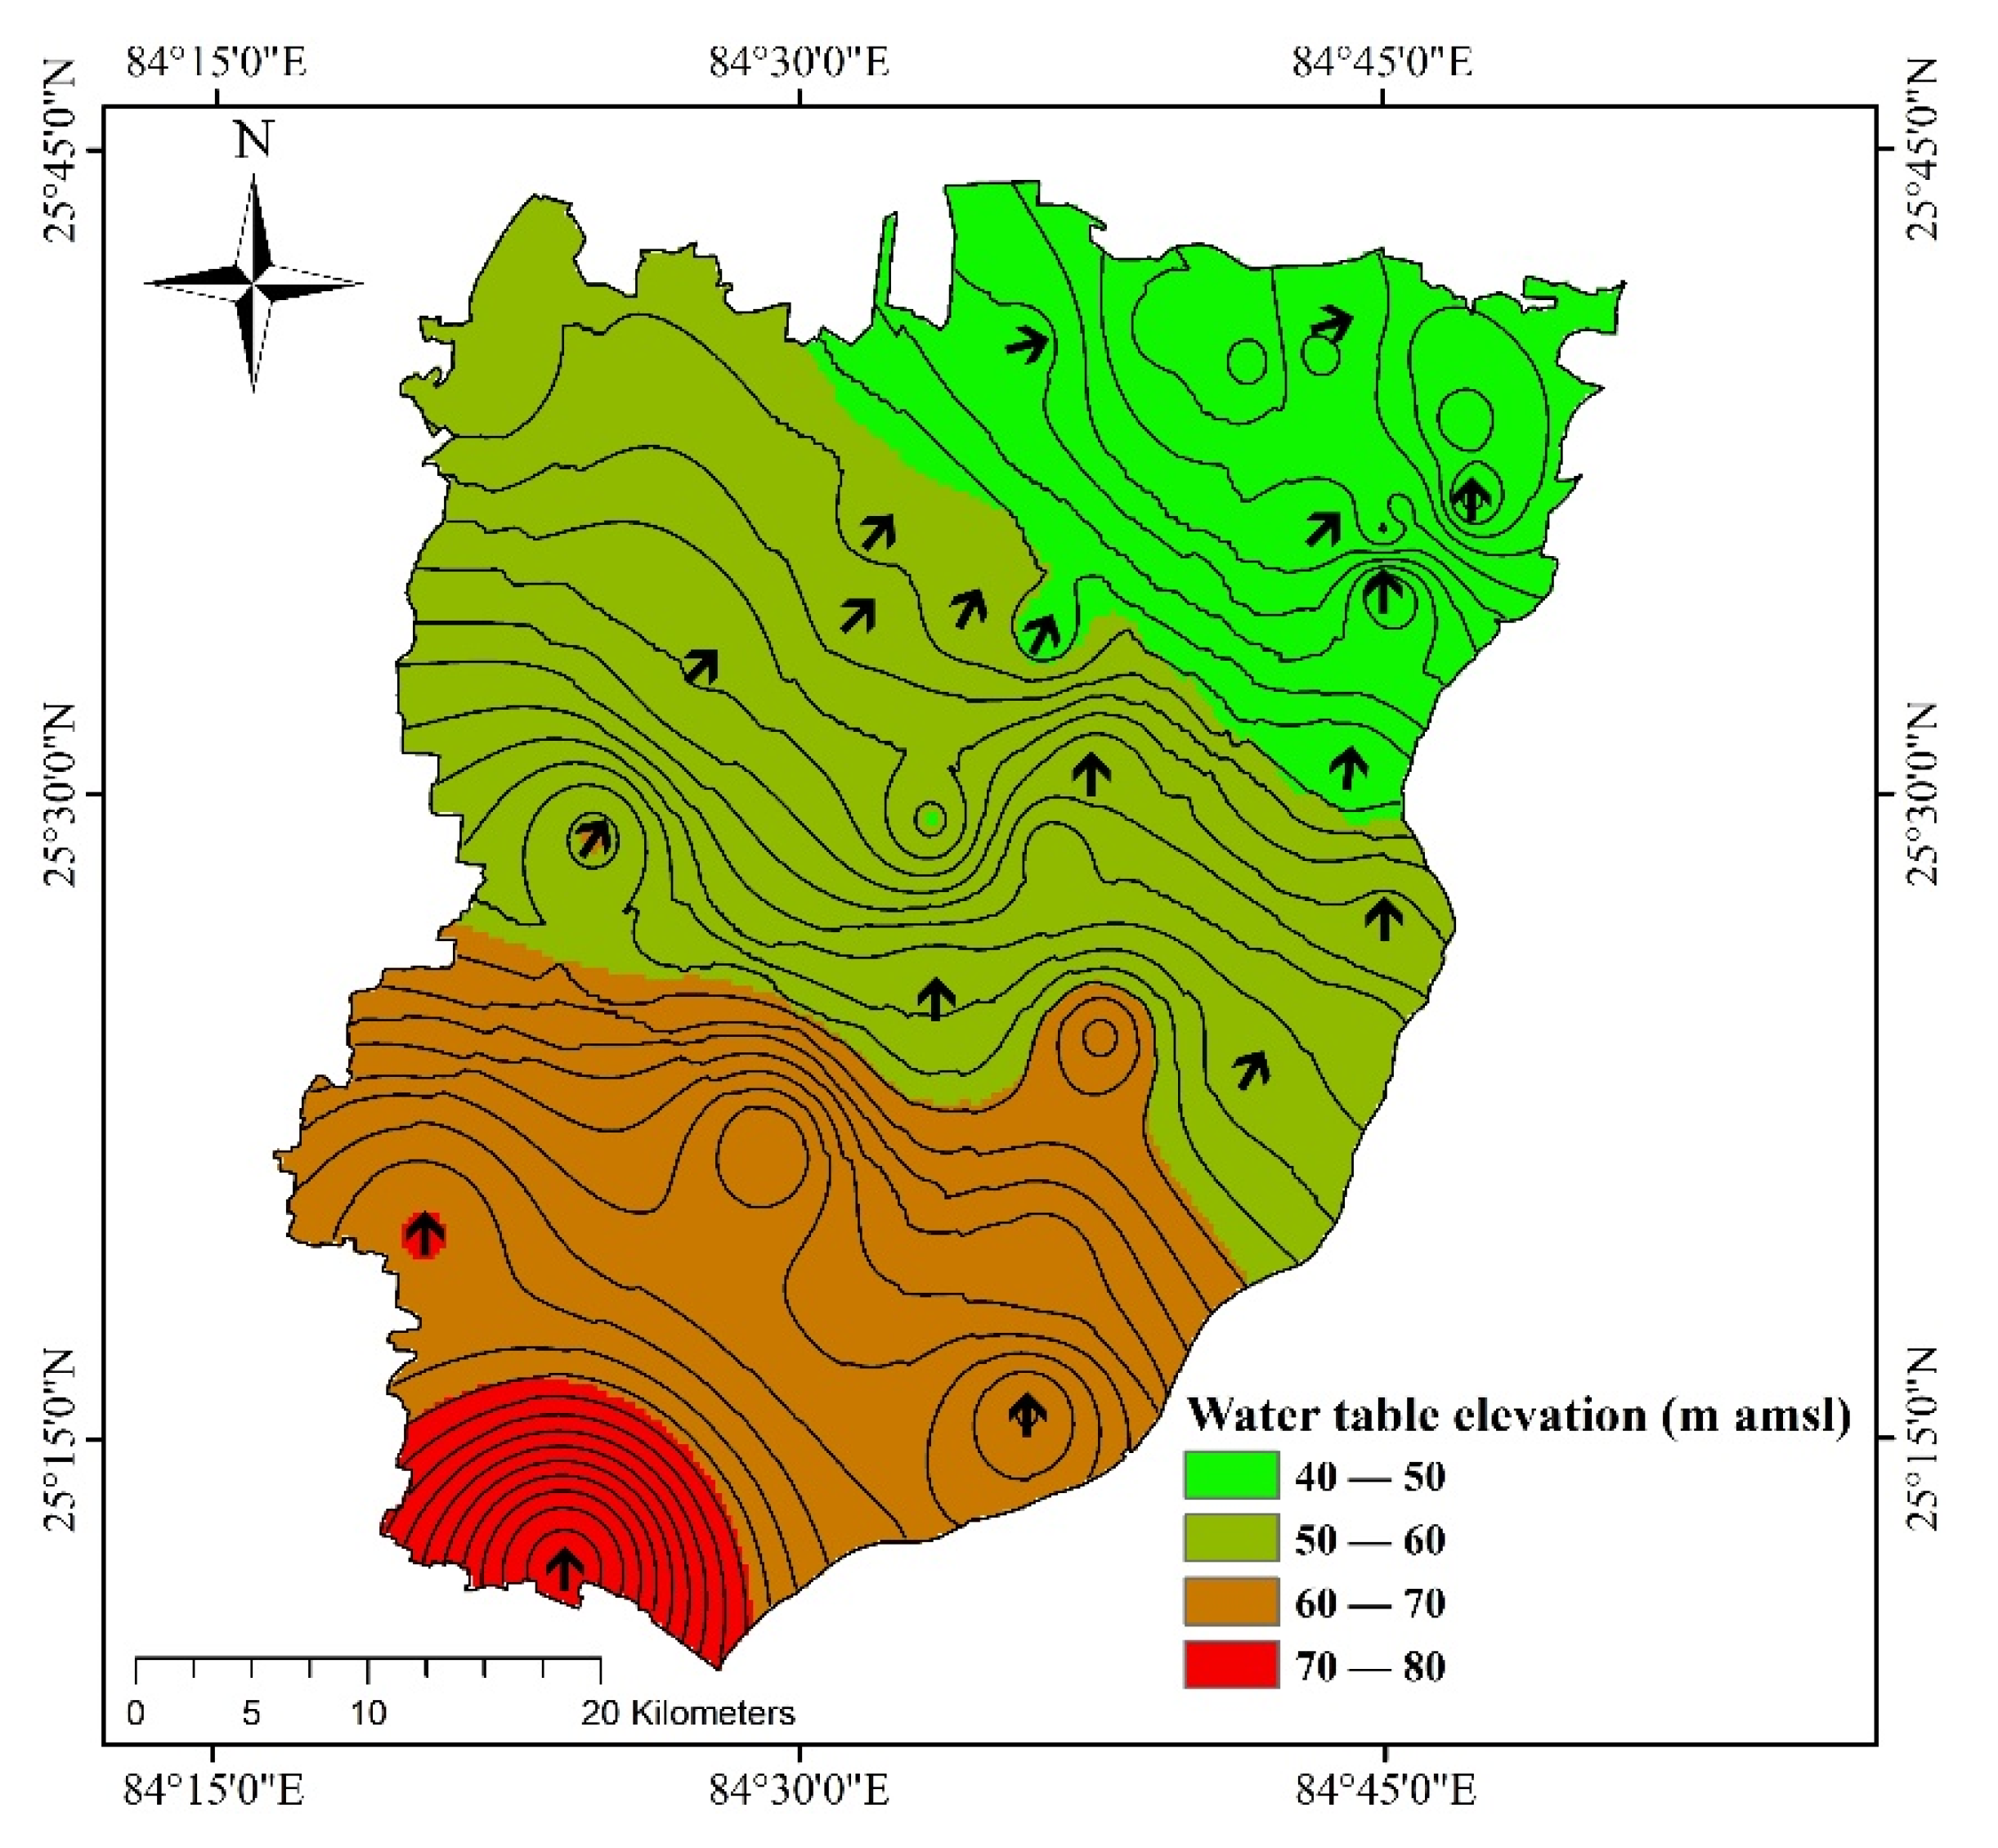
The study area has dry sub humid region with a warm and humid climate. Figure 2 shows the mean monthly precipitation for 30 years (1991–2020) for the Bhojpur district. It is shown that June to October months reflect the Kharif season while October to March represents the Rabi season. It can be seen that the average monthly precipitation is highest in the Kharif season accounting 266 mm in July. Almost ~87% of average annual precipitation occurs during Kharif season and most of the rainfall (about 85%) occurs in the south west monsoon [20]. The cumulative precipitation increases from January to December reaching its maximum value of 950 mm.
April and May are the hottest months such that average monthly temperature reaches to 35 °C, whereas January experiences the lowest mean minimum monthly temperature, falling down to ~9 °C. The average monthly temperature ranges between 25 °C to 35 °C in Kharif season while ~15 °C to 25 °C in Rabi season.

2.2. Hydrogeology

The river Ganga originates from the Himalaya and transports sediments through its course of travelling in the plain area. The deposited sediments determine the water chemistry of the area due to several processes such as rock weathering, rock–water interaction etc. Alluvial soils are mainly formed due to sediment deposits by the Indo-Gangetic-Brahmaputra rivers and Himalayan rocks form the parent material. Geologically, the alluvial soils are divided into younger and older alluvium and they are best suited for agriculture. The older alluvium represents the upland alluvial tract whereas younger alluvium forms the flood plains. The district Bhojpur is occupied by Quaternary Alluvium, which forms the potential aquifers. The Bhojpur district is covered by alluvial formation; northern part is enclosed by younger alluvium whereas central and southern part is covered by older alluvium (Figure 1). The older alluvium of the study area consists of dark coloured clay and silt rich with lime nodules locally known as Kankars. It is generally poorly sorted and less permeable. The unconsolidated younger alluvium occurs along the flood plain of rivers Ganga and Son and it is characterized by sandy clay, loam and contains less calcareous matter. In the study area, the top layer of geological stratum (within 30 m bgl) is an aquitard (Figure 3), which supports dug wells and shallow hand pumps. In fact, it works as an unconfined aquifer. From 30 m to approx. 100 m bgl, medium to coarse sand forms the aquifer and after that a thick layer (20–30 m) of clay is present. The deeper aquifers (>130 m bgl) are under either semi-confined or confined conditions which sustain the deep wells in the area [20].
The groundwater level data analyses (data collected from Central Ground Water Board (CGWB)) shows variation of groundwater level across the study area. The deepest groundwater level was observed in the north and northeast part of the study area. The unconfined aquifer has an average groundwater level ranging from 3 m bgl to 9 m bgl (data collected in pre-monsoon season, May 2017); the hydraulic gradients is about 0.0005 and groundwater flow directions are north and northeast (Figure 4) towards the river Ganga. In the pre-monsoon season, groundwater feeds into the Ganga river.

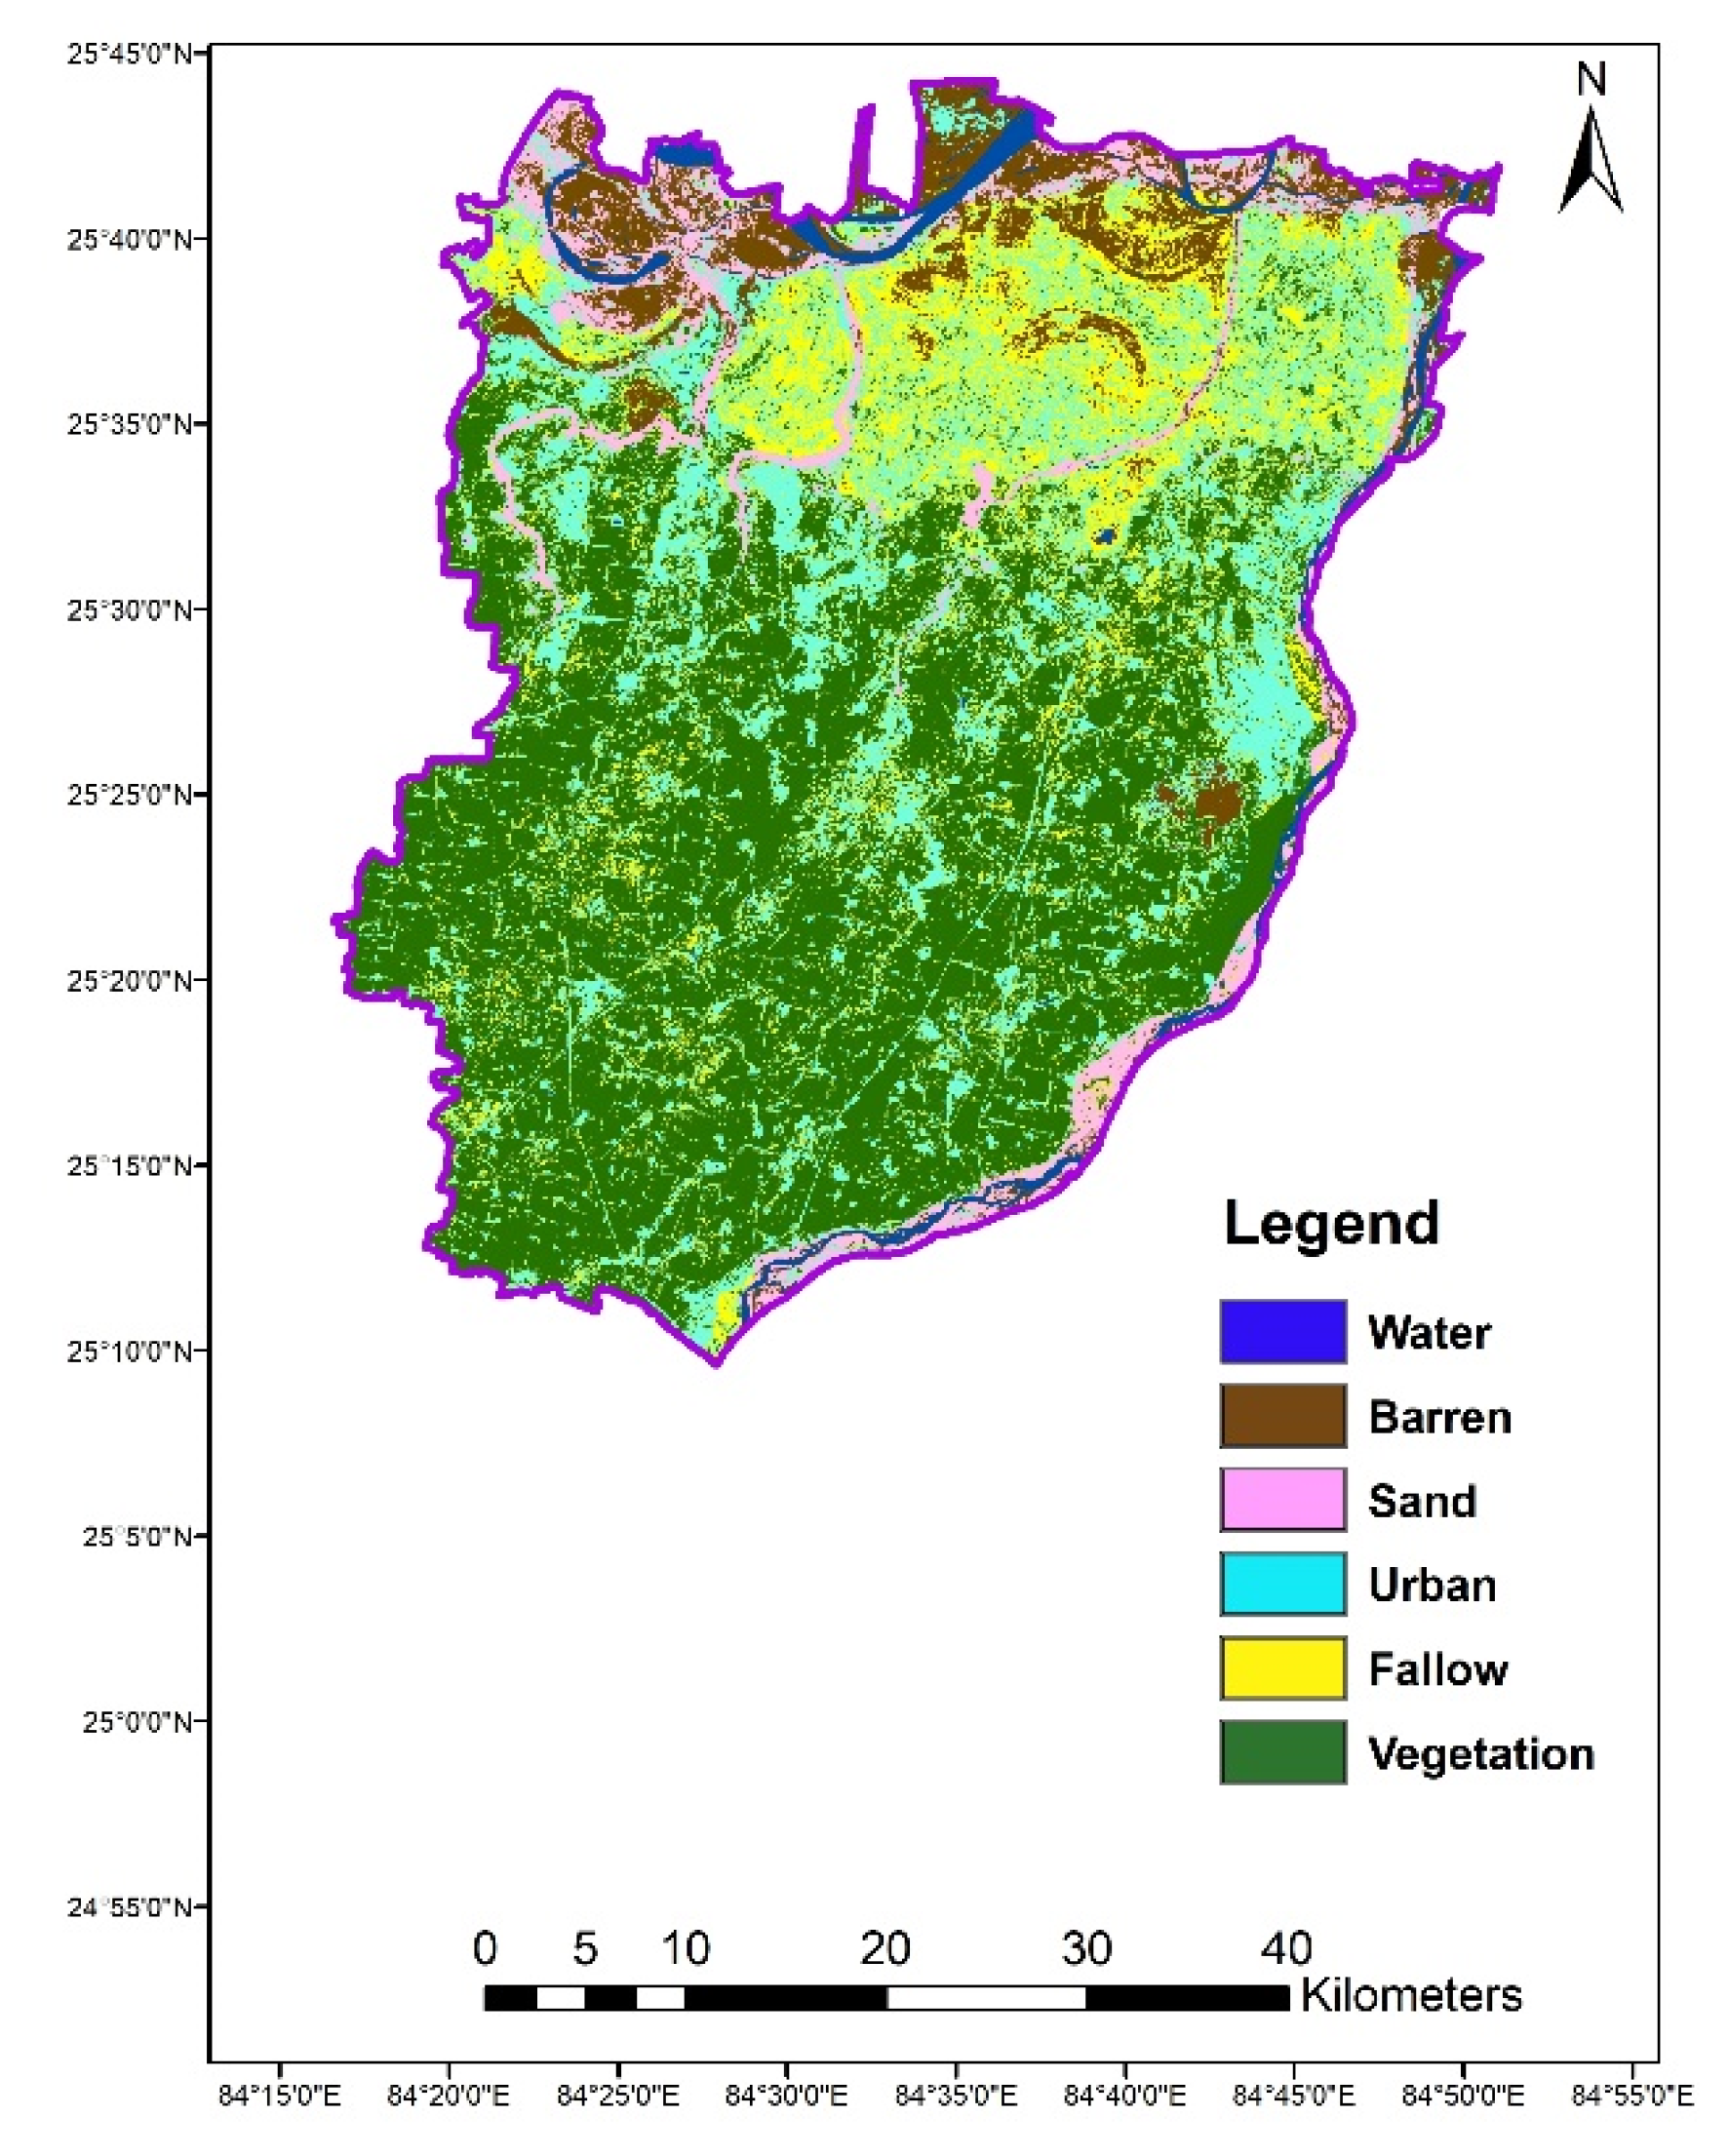
2.3. Land Use Land Cover

The land use land cover (LULC) map has been prepared using Landsat-8 satellite imagery (year 2018, 30 m resolution) obtained from United States Geological Survey (USGS) website. The LULC classification (Figure 5) showed the major land use types such that vegetation constitutes ~46.13% of total area, followed by built-up area (21.64%), fallow (16.52%), barren land (7.37%), sand bank (6.08%) and water (2.26%).

2.4. Agricultural Practices

Agriculture is the principal economic activity in the Bhojpur district. The district is considered as the rice bowl in the state and Rice- mill is a traditional industry. The major food crops apart from rice are wheat, pulses, oil seeds and maize etc. The geographical area is 233,729 Ha out of which 188,134 Ha is net cultivable area with nil forested area as per data of Department of Agriculture, Govt. of Bihar. The net irrigation area in Kharif season is 100,407 Ha and in Rabi season it becomes 68,781 Ha. In the Kharif season, the irrigated area covered by canal, private tube well, lift irrigation, state tube wells and other sources are 72,952, 24,478, 838, 454, 1685 Ha where as in Rabi season the areas covered by the irrigation sources are 29,700, 36,717, 153, 526 and 1685 Ha, respectively. The major kharif crops in the district are rice, maize and gram etc and major rabi crops are wheat, pulses, gram, mustard, potatoes etc.

3. Methodology

3.1. Data Collection and Instrumentation

A systematic sampling campaign was made and 45 groundwater samples were collected in the pre-monsoon season (May 2019) as shown in Figure 1. A clean polypropylene bottles were used for storing the water and the samples were brought to laboratory for the ions and trace metals analyses. The groundwater samples were collected from the existing hand pumps (HPs) in the study area (screening depth of HPs varies from 15 m to 60 m below ground surface in unconfined aquifer) and the details of water sampling is presented in Table A1. The purging of hand pumps for 15–20 min was conducted before taking the water samples. The water samples were filtered through 0.45 µm membrane filter and then stored in the sampling bottles. The physical parameters such as pH, and EC were measured in-situ using portable instruments (HQ40d portable meter, Hach, CO, USA). The water samples were analyzed for major ions using Ion-Chromatography (Dionex Series ICS-5000, Thermo Fisher Scientific, CA, USA) and Inductively Coupled Plasma-Optical Emission Spectrometry (VDV 5110, Agilent Technologies, CA, USA) respectively. The inorganic chemical parameters were analyzed following the procedures of standard methods [21,22]. The samples were run in triplicate and relative errors were less than ±6% for the analyzed water quality parameters. Groundwater samples were acidified onsite with HNO3 to reduce pH < 2 for trace metals (As, Fe, Mn, Pb, Zn, Cu and Cd) analyses.

3.2. Electrical Conductivity (EC) and Sodium Percentage (Na%)

The EC and Na% are important water quality indicator for classifying irrigation water [23]. Dissolved substance as salts are always present in water used for irrigation. The Na% was calculated by the equation:
Na % = ( Na + K ) ( Ca + Mg + Na + K ) * 100
where Na, Ca and Mg concentrations is in milli-equivalents per liter.

3.3. Alkali and Salinity Hazard (SAR)

The sodium or alkali hazard was determined by sodium adsorption ratio (SAR). SAR is determined by ratio of sodium and divalent cations as mentioned below:
SAR = Na ( Ca + Mg 2 ) 2
where Na, Ca and Mg concentrations is in milli-equivalents per liter.

3.4. Residual Sodium Carbonate (RSC)

Residual Sodium Carbonate (RSC) is also used as an index to indicate salinity hazard. When RSC increases, Ca and Mg gets precipitated from the water solution and thus increases the sodium percentage which increases the potential of sodium hazard. This excess is denoted by RSC and is expressed as
RSC = (CO32− + HCO3) − (Ca2+ + Mg2+)
where CO32− and HCO3 are expressed in milli-equivalents per liter.
Generally, water with RSC value > 2.5 is not considered fit for irrigation use, whereas RSC less than 1.25 is considered safe for irrigation water. A negative RSC values suggest that Ca2+ and Mg2+ is in surplus, while a positive RSC indicates presence of Na+ in the soil [7,24]. Based on the of RSC value, sodium hazard is classified as low (RSC < 1.25, medium (RSC 1.25–2.5) and high (RSC > 2.5).

3.5. Chloroalkaline Indices (CAI-I and CAI-II)

The Chloroalkaline indices are used to study the ion exchange processes between the groundwater and the aquifer while travelling and interacting with each other. Schoeller [25] proposed the CAI-I and CAI-II and expressed by following equations.
CAI I = Cl ( Na + + K + ) Cl
CAI II   = Cl ( Na + + K + ) ( SO 4 2 + CO 3 + HCO 3 + NO 3 )
The CAI-I and CAI-II indices indicates the exchange processes between alkali and alkaline earth metals and the values may be positive or negative. If CAI value is positive then it describes the exchange of Na+ and K+ in water with Mg2+ and Ca2+ in rocks. If CAI value is negative then it implies that a reverse exchange process occurs i.e., Mg2+ and Ca2+ in water with Na+ and K+ in rocks.

3.6. Permeability Index (PI)

The PI is an indicator to assess the appropriateness of water for irrigation uses. The permeability of soil may get affected when long term irrigation water containing high salt is applied in the field.
Doneen [26] formulated PI as given below:
PI = Na + + HCO 3 Ca 2 + + Mg 2 + + Na + × 100
The ions concentrations of the above equation are in meq/L
Doneen [26] classified water into three classes: suitable (class I, PI > 75%), good (class II, PI is in the range of 25–75%) and unsuitable (class III, PI < 25%). class I and class II is considered suitable for irrigation.

4. Results and Discussion

The analytical result of major ions, trace metals etc. is presented in Table 1 and the results were compared with prescribed limit for drinking water by Bureau of Indian Standard (BIS) [27]. The chemical results were correlated with hydro geomorphological characteristic of the area. The Na%, SAR, RSC, CAI and PI values were calculated to check suitability for irrigation purpose.

4.1. Hydrochemistry and Groundwater Quality Assessment for Drinking Water

The pH value shows that GW is slightly alkaline in nature and all the samples were found to be in the acceptable limit of Indian drinking water standards. The EC value indicated the occurrence of fresh water. The results show that 48% of the samples exceeded acceptable limit for TDS though they were within the permissible limit of BIS [27]. The total hardness (TH) is classified in soft, moderately hard and very hard category. About 64% samples were found under hard category and 36% under very hard category with concentration above 300 mg/L. In general, hardness of groundwater was not found within the acceptable limit of 200 mg/L but was within the permissible limit (600 mg/L).
It is observed that the GW in this study area is dominated by alkaline earth metals. For instance, Ca alone constitute 55.9% of the total cations in the groundwater of the study area. The majority of the water samples follow the majority of ions in order of Ca2+ > Na+ > Mg2+ > K+. About 58% of samples were found within the acceptable limit for Ca; while 42% of samples exceeded the acceptable limit. Magnesium (Mg) is abundant in earth crust and is a common constituent of natural water [28]. Results suggested that 77.8% of samples were within acceptable limit for drinking water, while remaining 22.2% of sample crossed the prescribed acceptable limit. The sodium is actually derived from different sources ranging from atmospheric deposition, evaporate dissolution and silicate weathering [29,30]. The sodium and potassium concentration was low and were found within the acceptable limit. Generally, potassium reported to be one-tenth or even one-hundredth that of sodium in groundwater. In anions, bicarbonates is the dominant anion and follows the abundance in the order of HCO3 > Cl > SO42− > NO3 > F in the groundwater samples. HCO3 contribute to alkalinity (acid neutralizing capacity) and 91% of the samples were found within the permissible limit. HCO3 shows a strong positive correlation with Ca, Mg and Na (Table 2). The chloride concentrations were within the acceptable limit. High concentrations of chloride lead to a salty taste in water. High sulphate level produces salty taste which makes it unpleasant for drinking and very high concentration might cause laxative effect in human. For the present case, sulphate concentration were within the acceptable limit. The excess application of fertilizers, leakages from sewage system etc. may cause GW contamination by nitrate, and fluoride occurrence in the groundwater is reported to be geogenic [31]. The nitrate and fluoride concentration were within the prescribed drinking water limit but nitrate concentration was observed high at few locations.
The hydrochemistry of groundwater depends on various factors such as water–aquifer matrix interaction, residence time, weathering processes and various chemical processes takes place while surface water moves through the sediment and reaches to groundwater. There are three major processes control the geochemistry of the area: carbonate dissolution, evaporite dissolution and silicate weathering [11,14]. The Gibb’s plots and bivariate plots indicate the source of solutes and for the present case rock–water interaction is the dominant process controlling the geochemistry of the area (Figure 6).
The bivariate plots between Ca + Mg and HCO3 + SO4 indicate both carbonate and silicate weathering with dominancy of silicate weathering processes as majority of data points are falling below the equal line (Figure 7a). The data points on the equal line represent the calcite and gypsum weathering processes and if they are plotted below the equal line, it implies that the excess of HCO3 + SO4 shall be balanced by alkalines (Na + K) provided through silicate weathering. The Ca + Mg should be equal to HCO3 if they derived from carbonate source as per stoichiometric of reaction. The plot between Ca + Mg and HCO3 (Figure 7b) shows that maximum groundwater data are near the HCO3 axis which again justify the prevalence of silicate weathering. It may be observed that arsenic concentration is high when silicate weathering prevails. The plot between Ca + Mg, Na + K and total cations (Figure 7c,d) reveals that Na + K increases with increasing dissolved salts and Ca + Mg are contributing more as cations.

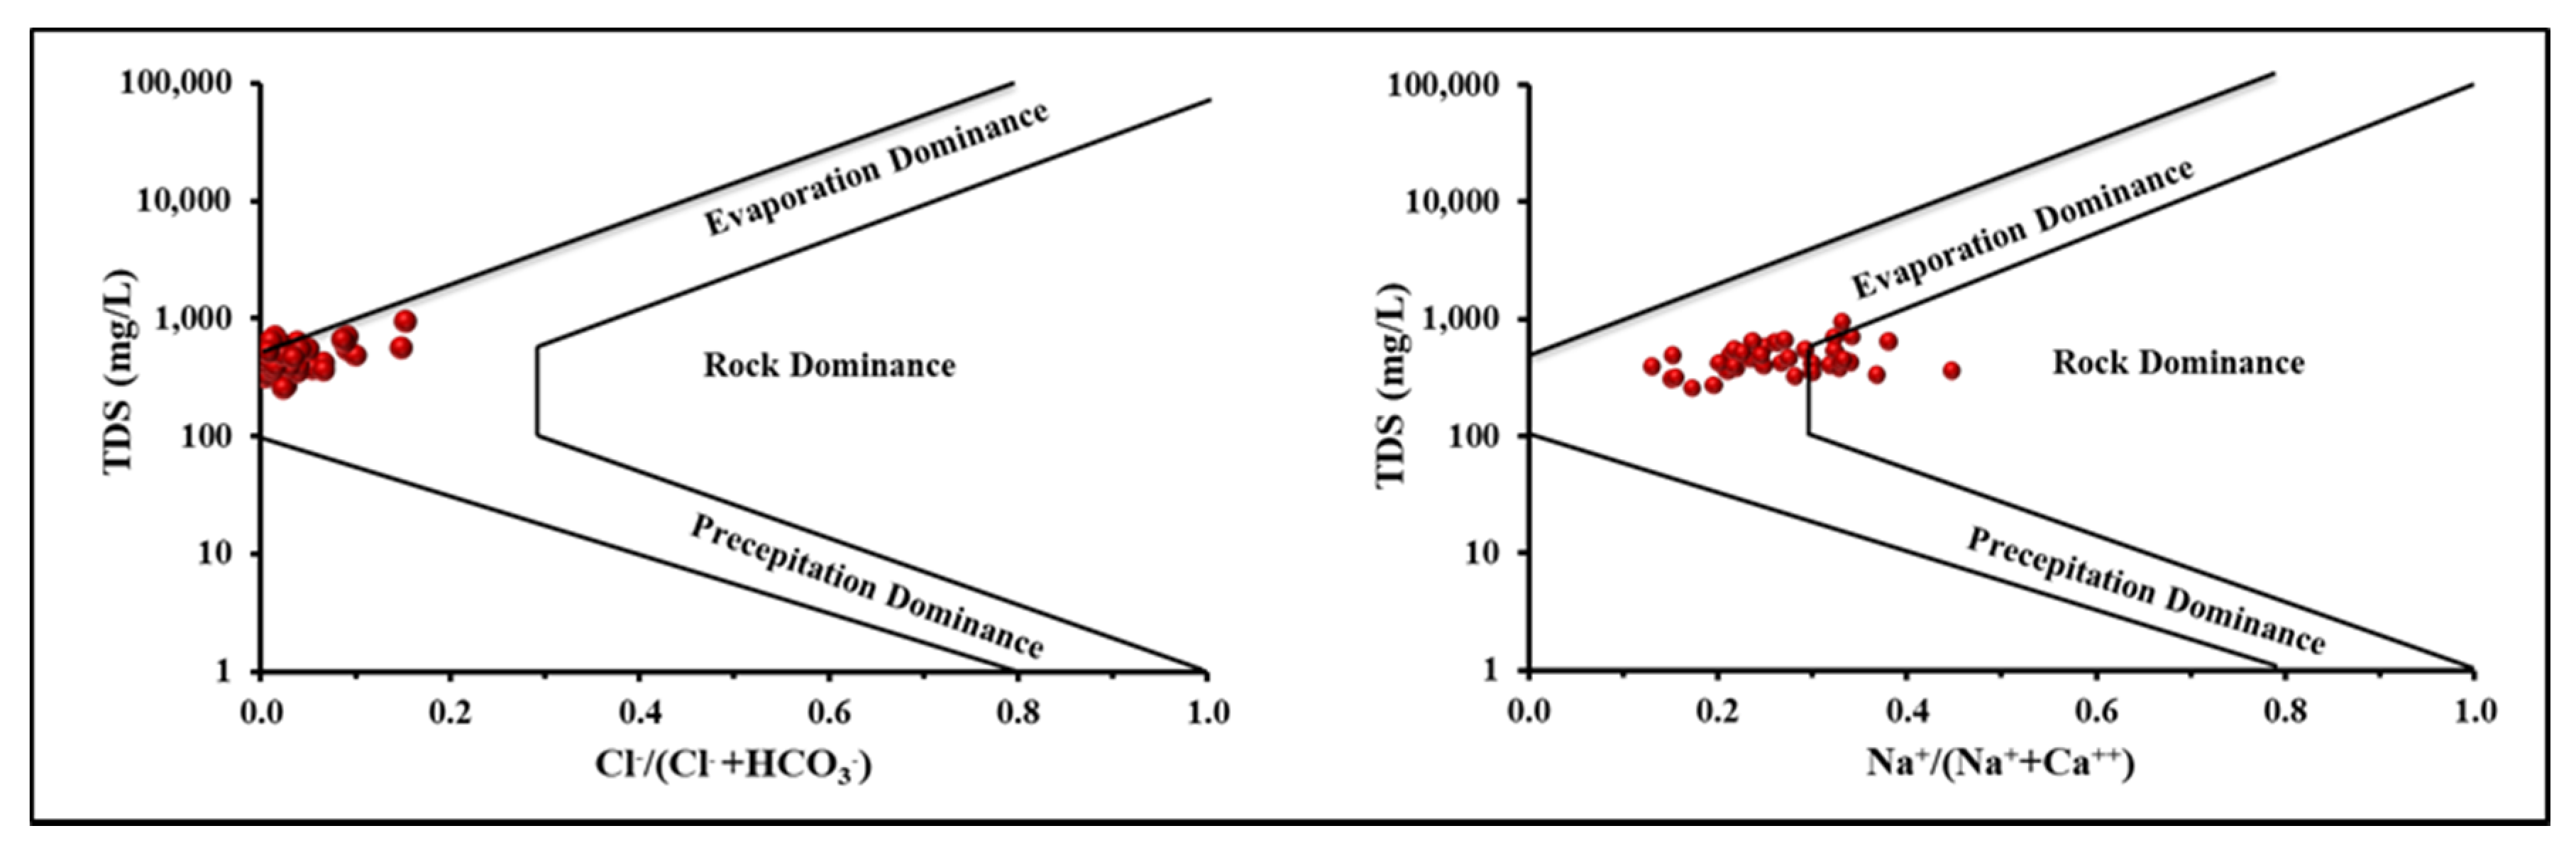
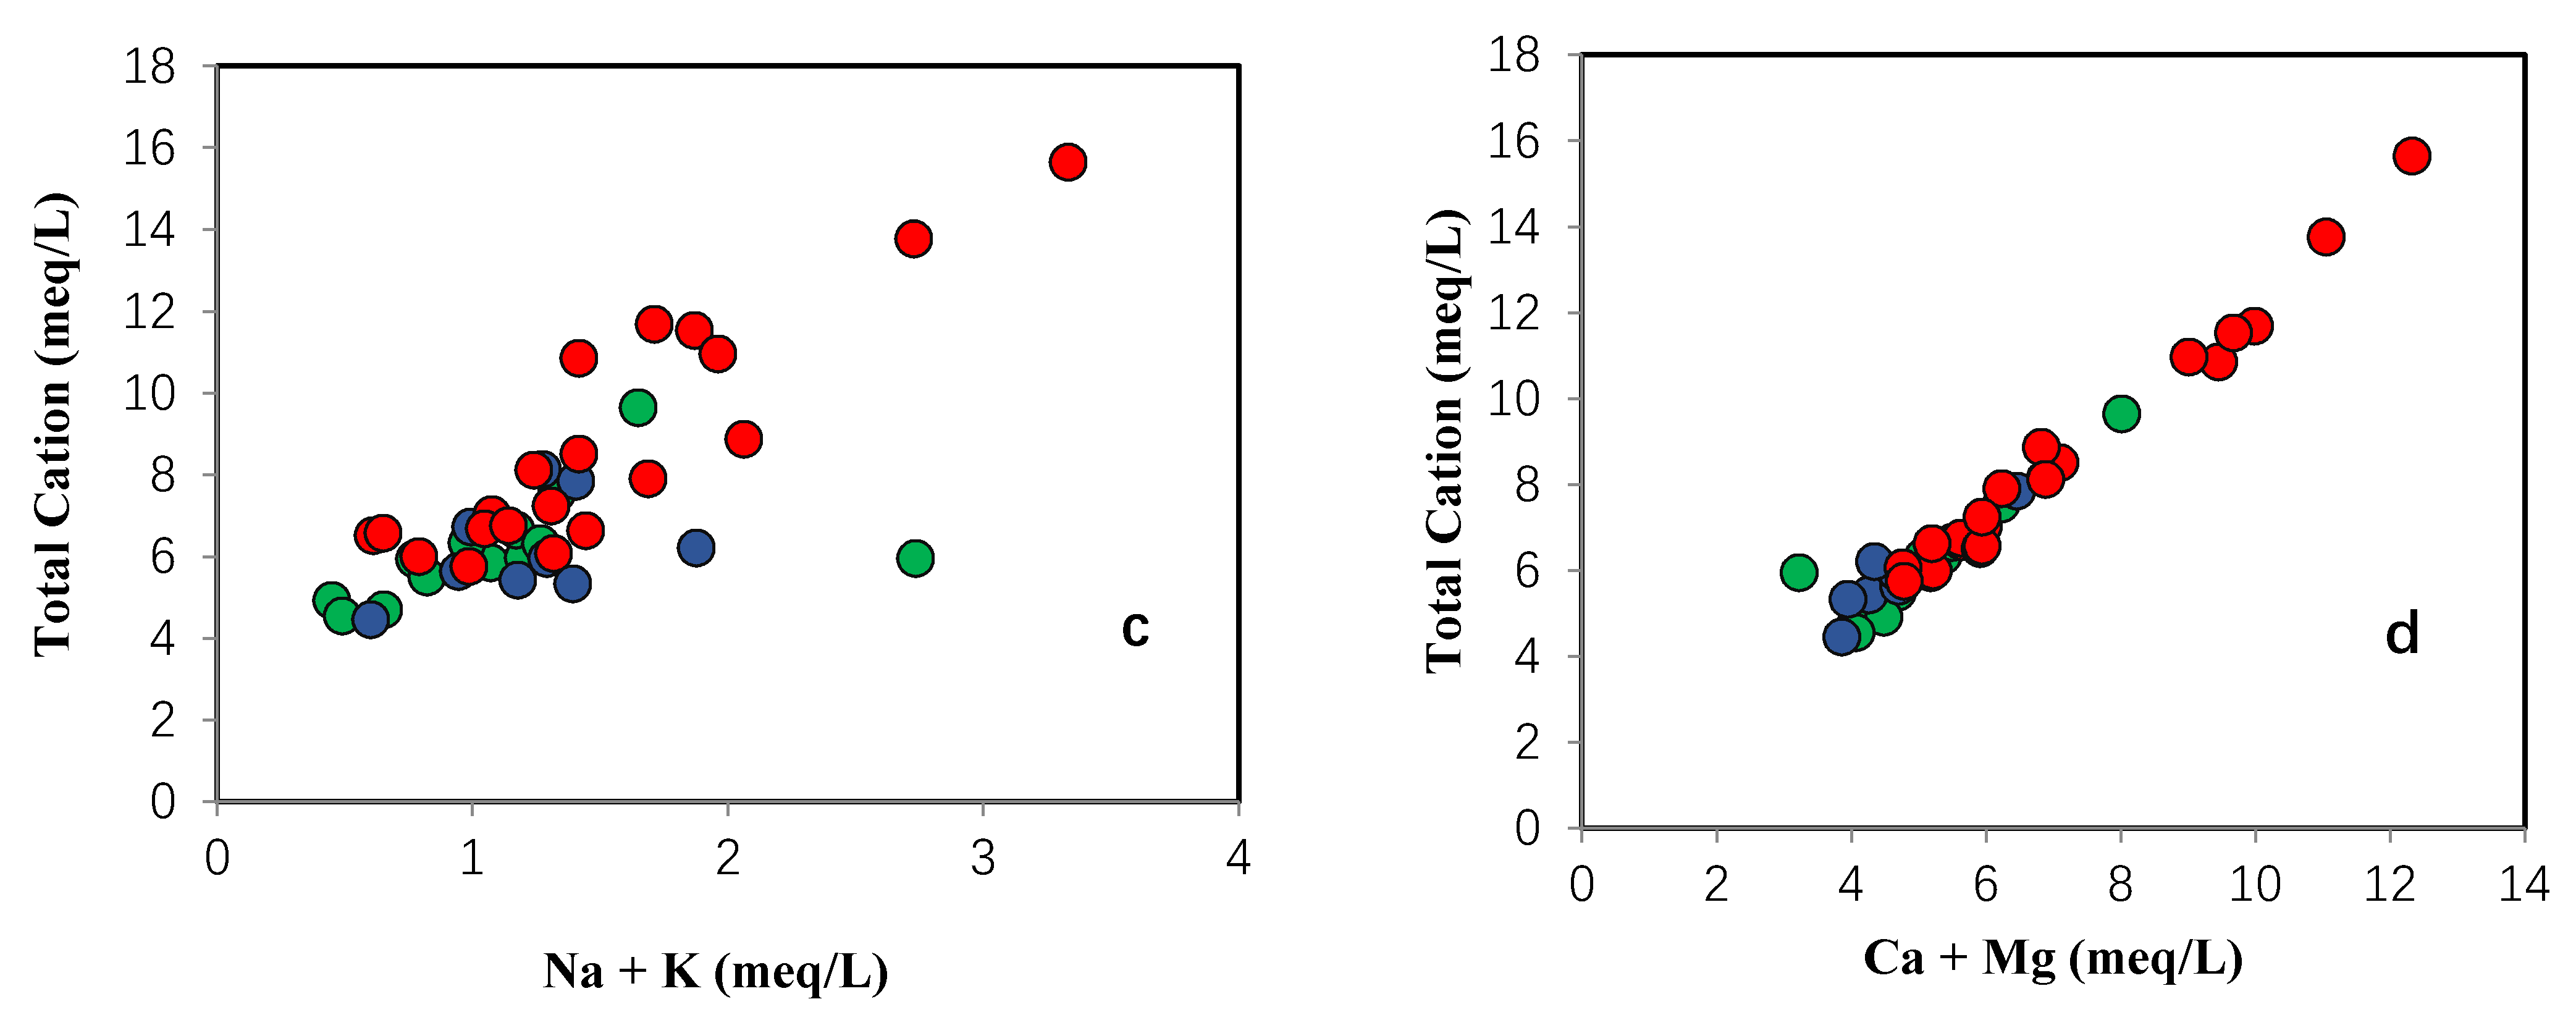
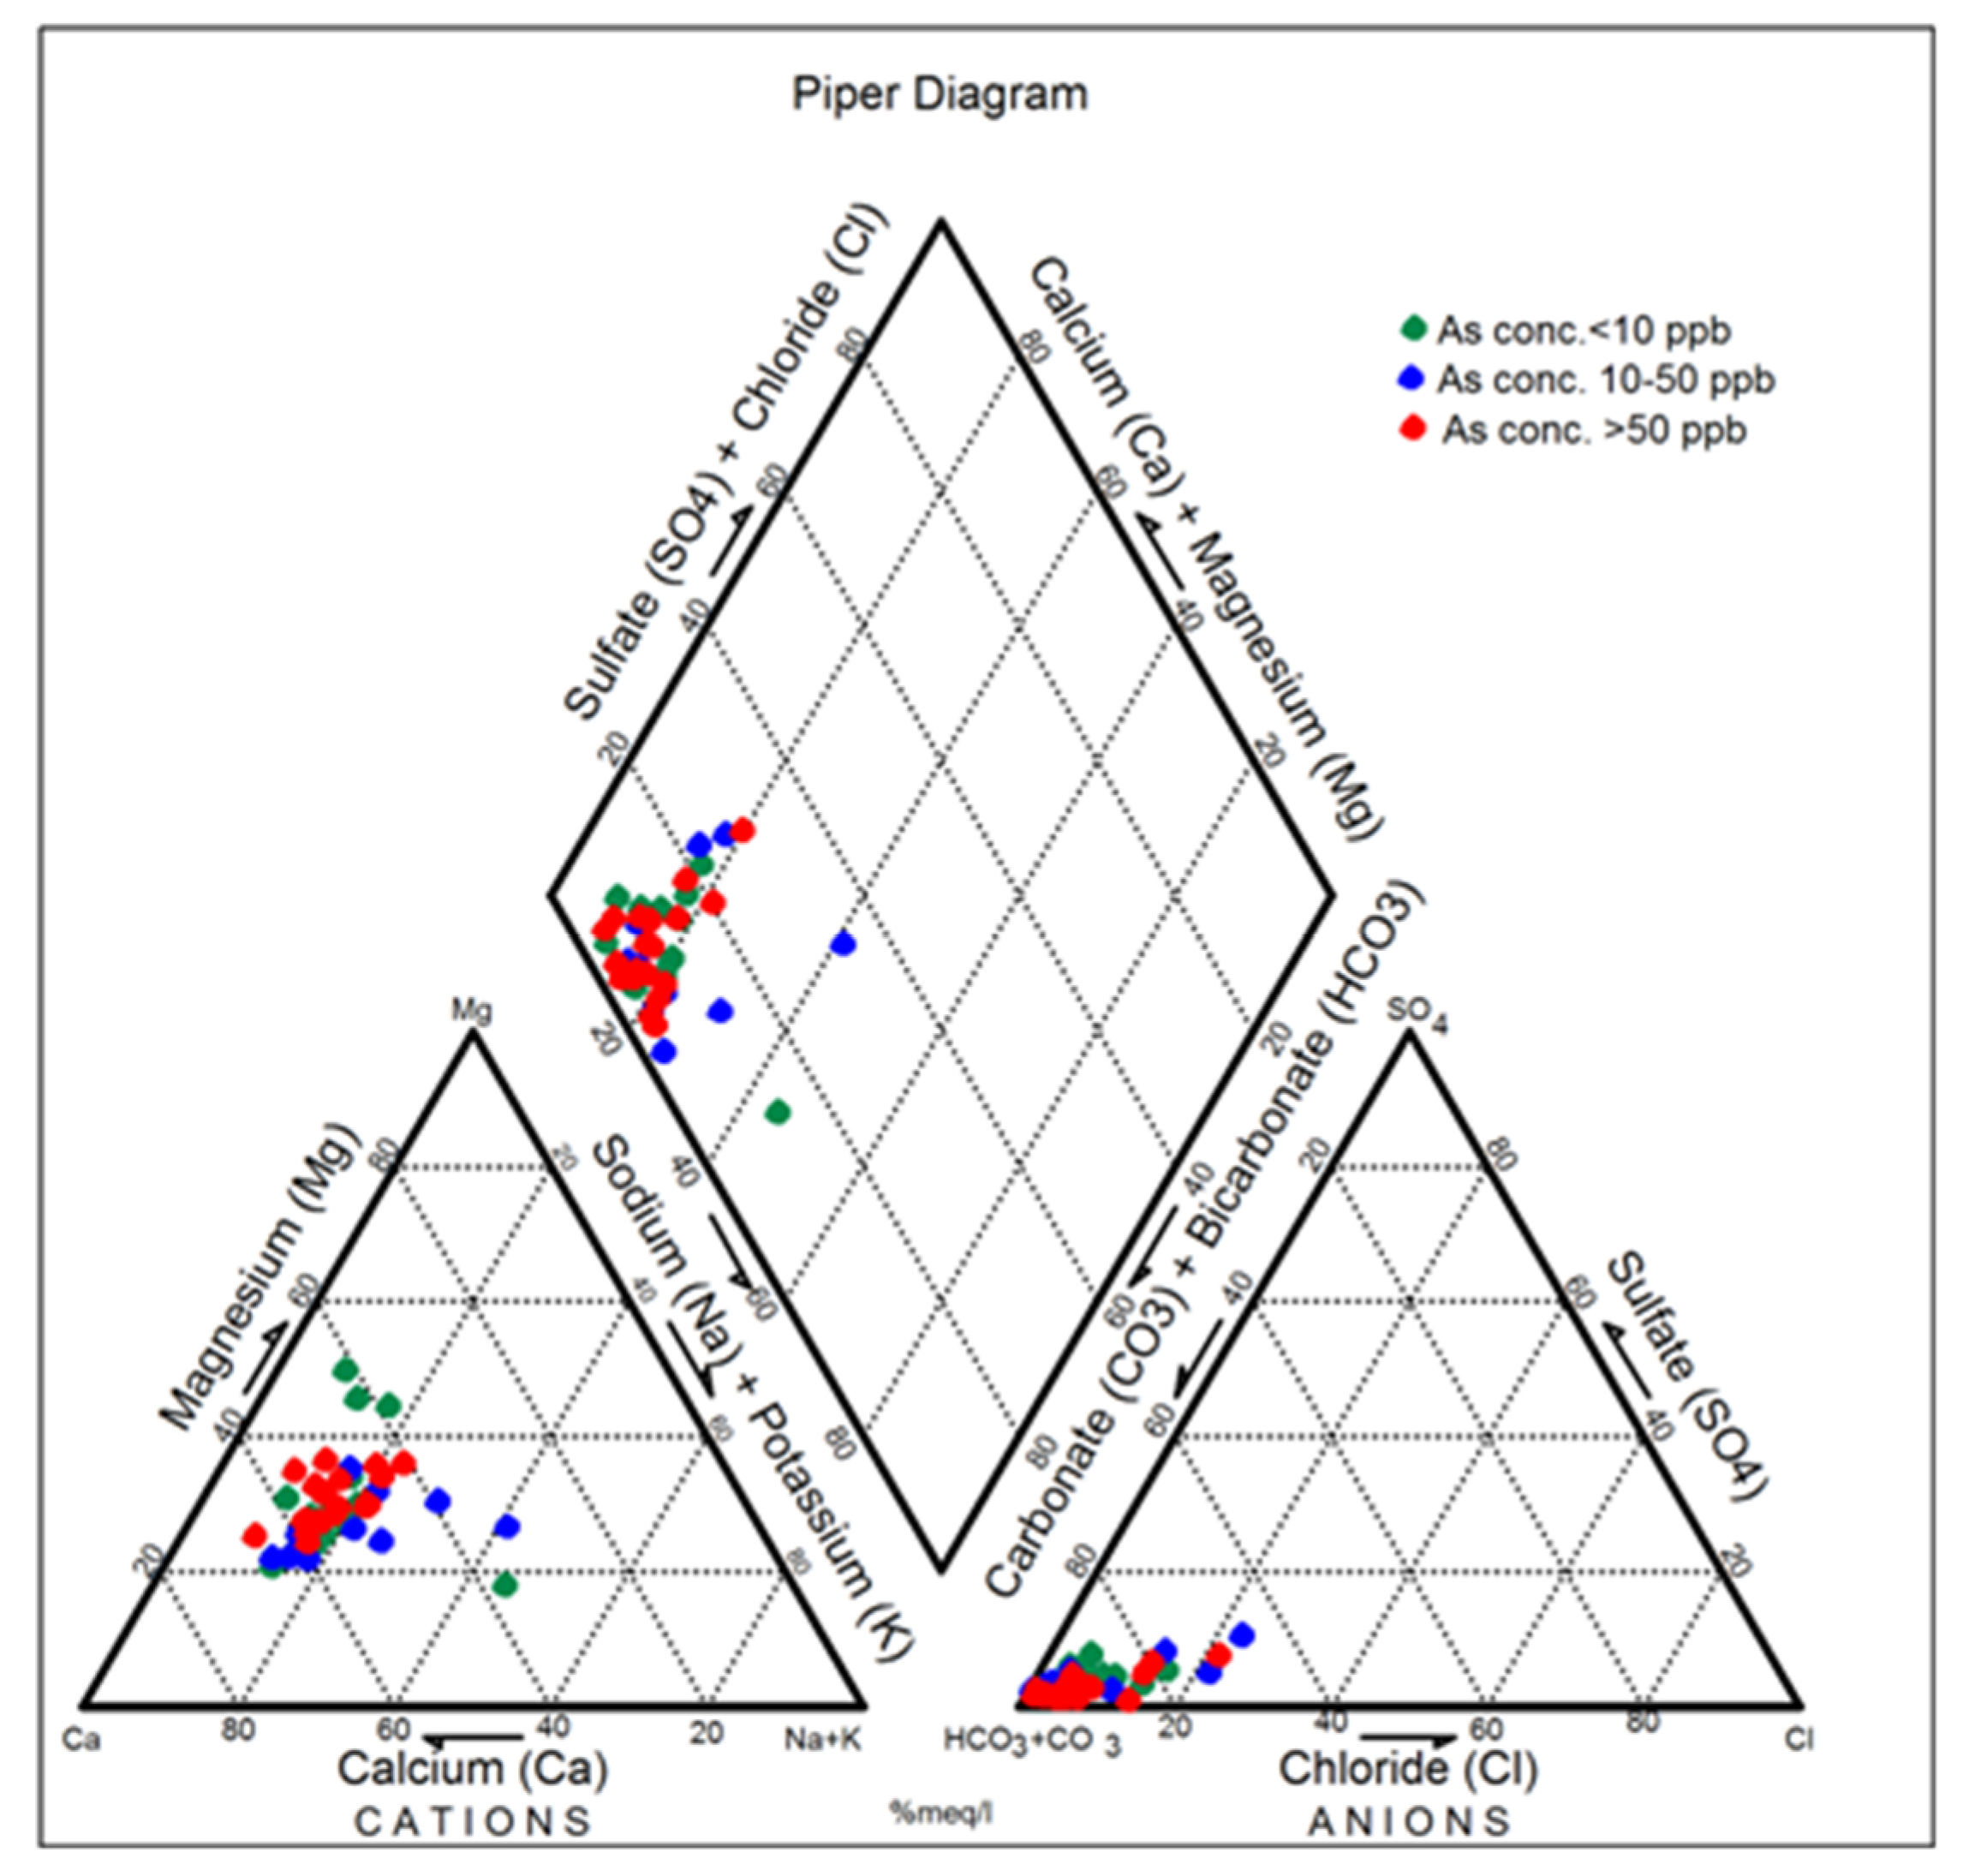
4.2. Groundwater Facies Classification
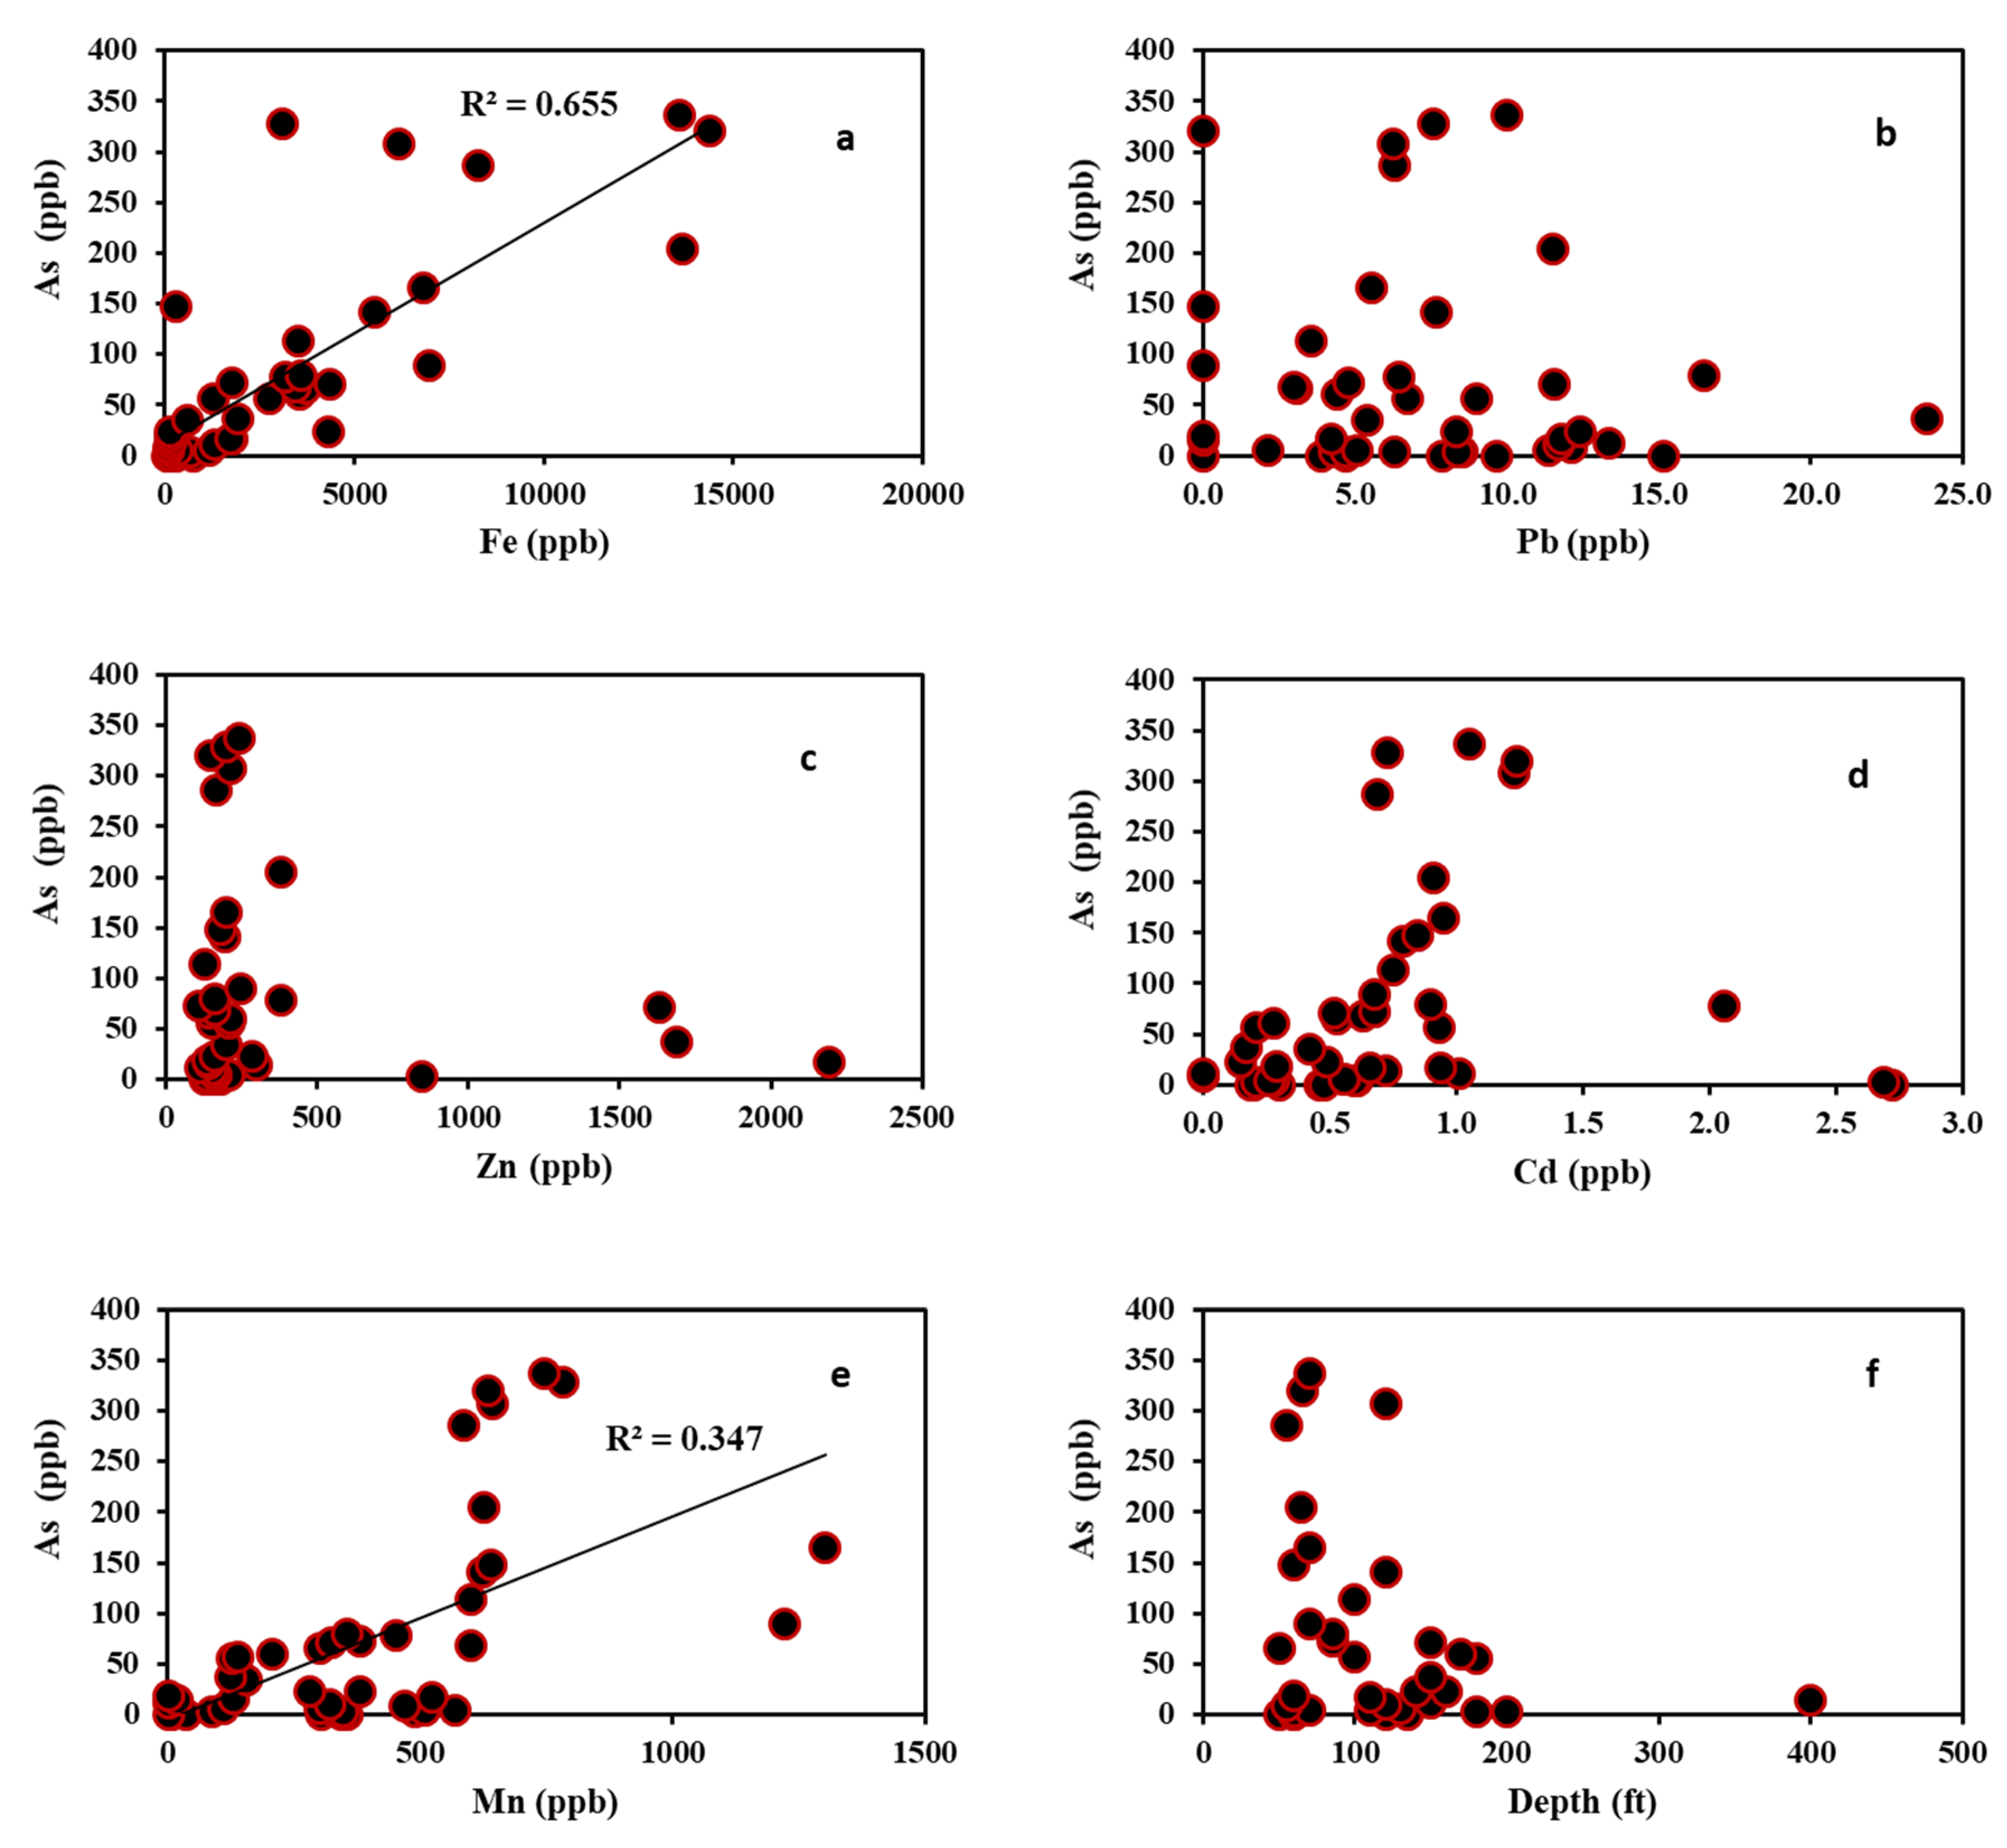
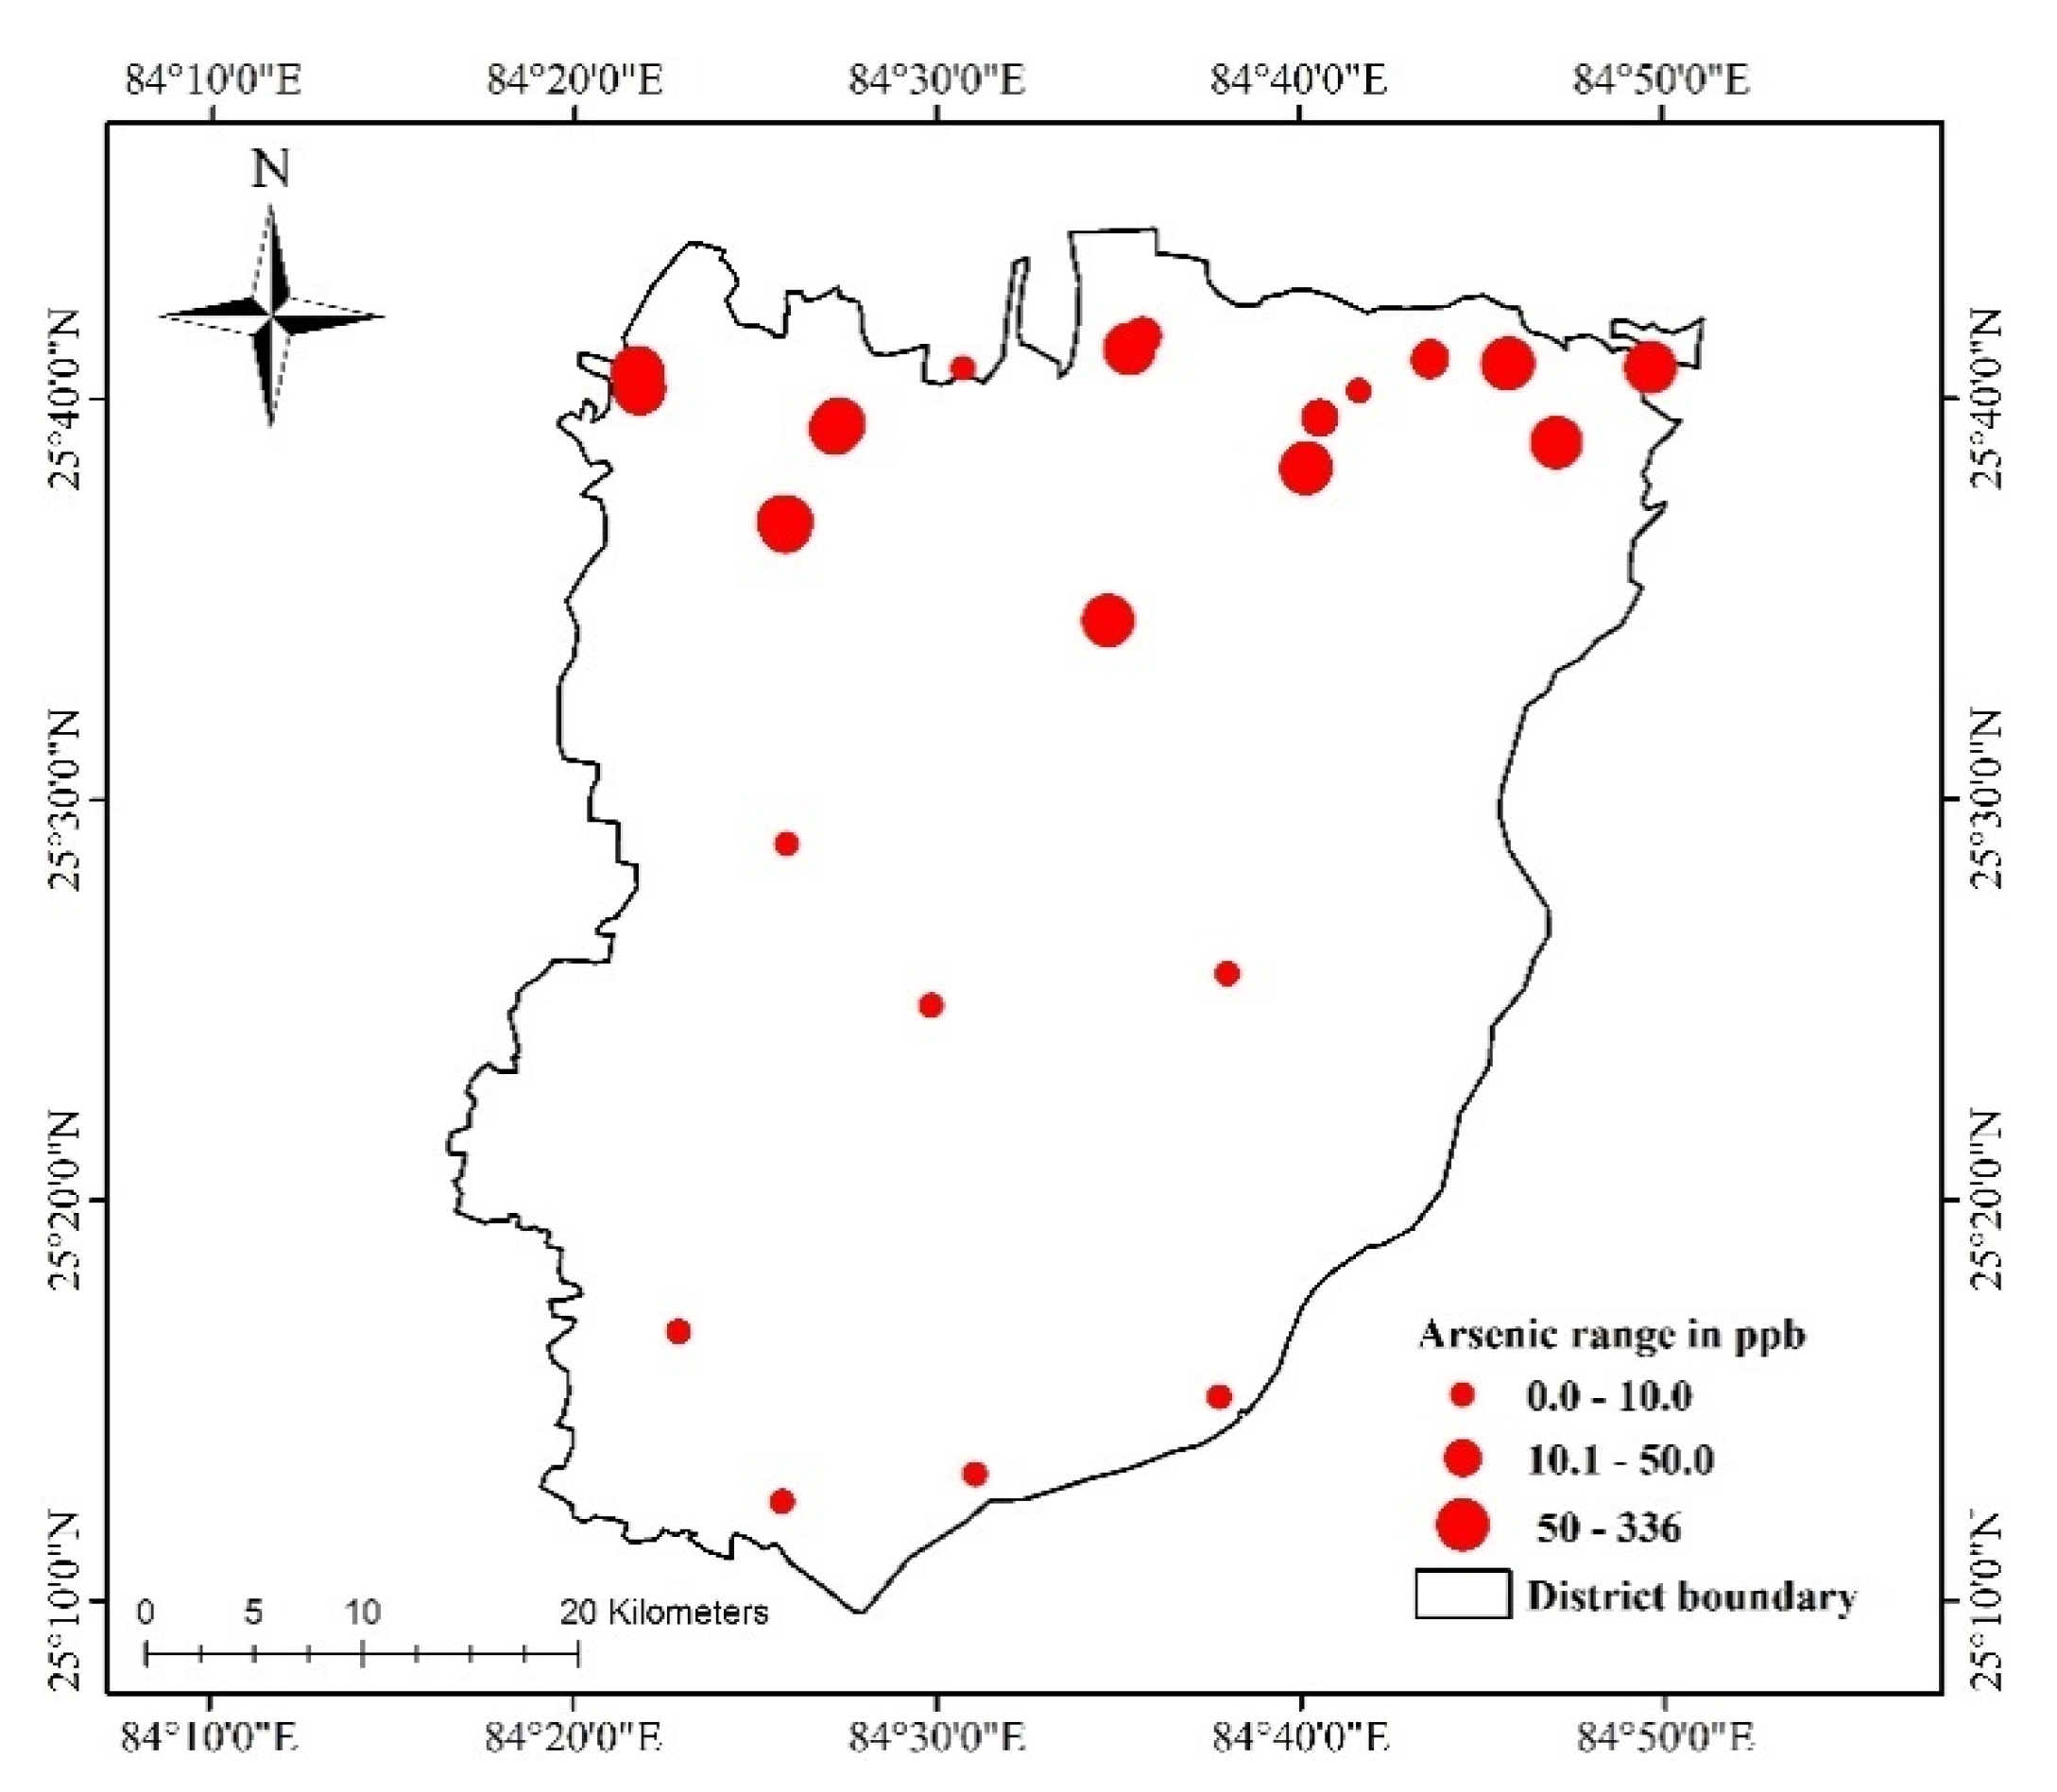
The major ions were plotted on the Piper trilinear diagram to classify and designate ionic nature of water [32]. The trilinear diagram clearly distinguishes the samples of different source and samples of similar qualities are shown as a group. The ionic signature helps in understanding the principal ions controlling the chemistry. Piper diagram classified all water samples into ‘Ca-Mg-HCO3 type’ (Figure 8).

4.3. Trace Metals

The trace metals (As, Cr, Cd, Mn, Cu, Fe and Zn) are naturally present in small and measurable amounts in the environment. These metals in small amounts may be a necessary part of nutrition but a high concentration of these metals become toxic and causes health hazards. The sources of trace metals contamination in groundwater or surface water may be due to industrial waste effluents, weathering of rocks and atmospheric deposition, etc. The statistical summary of trace metal results obtained in the study are given in the Table 1. About 66% of samples exceeded the acceptable limit (10 ppb) of arsenic and 44% of samples crossed the permissible limit (50 ppb). The distribution of arsenic concentration present in groundwater in the study area is shown in Figure A1. The highest concentration of arsenic (>50 ppb) were found in recent alluvial deposits, in the north-eastern areas, along a band wide about 20 km and parallel to the river Ganga. It is observed that arsenic concentrations were below 50 ppb at depth greater than 50 m as probably confined aquifer encounters at that depth. In the central and southern part which is covered by older alluvium, the arsenic concentration was found to be less than 10 ppb even if at shallower depth (up to 50 m). The arsenic occurrence may be due to reductive dissolution of iron-hydroxide which is present in sediment [11]. However, the exact nature and mechanism involved in the movement process are still unknown. Various researchers [33,34,35,36,37,38,39,40] reported that river Ganga and its tributaries have carried Himalayan sediment laden with arsenic and deposited in its flood plain. In the present study area, it is observed that high arsenic concentration was present in depth range of 20–40 m in the aquifer in the flood plain of river Ganga. Other investigators [34,35,36] have also reported that arsenic is present in the unconfined aquifer of shallow depth (15–47 m) and arsenic concentration varied from traces to 1461 ppb. It is witnessed that 69% of the samples surpassed the acceptable limit of Fe. High iron in the study area may be due to the dissolution of iron bearing minerals present in the aquifer material. The result revealed that about 15.6% of the analyzed samples fell within the acceptable limit (100 ppb) of Mn, and 65% of sample crossed the permissible limit. All other trace metals were found to be in permissible limit for drinking water. Arsenic is showing very good correlation with Fe, moderate relation with Mn and weak or no correlation was found with other trace metals (Figure 9). The correlation between As and Fe also justify our findings that arsenic may be releasing form iron-hydroxide.

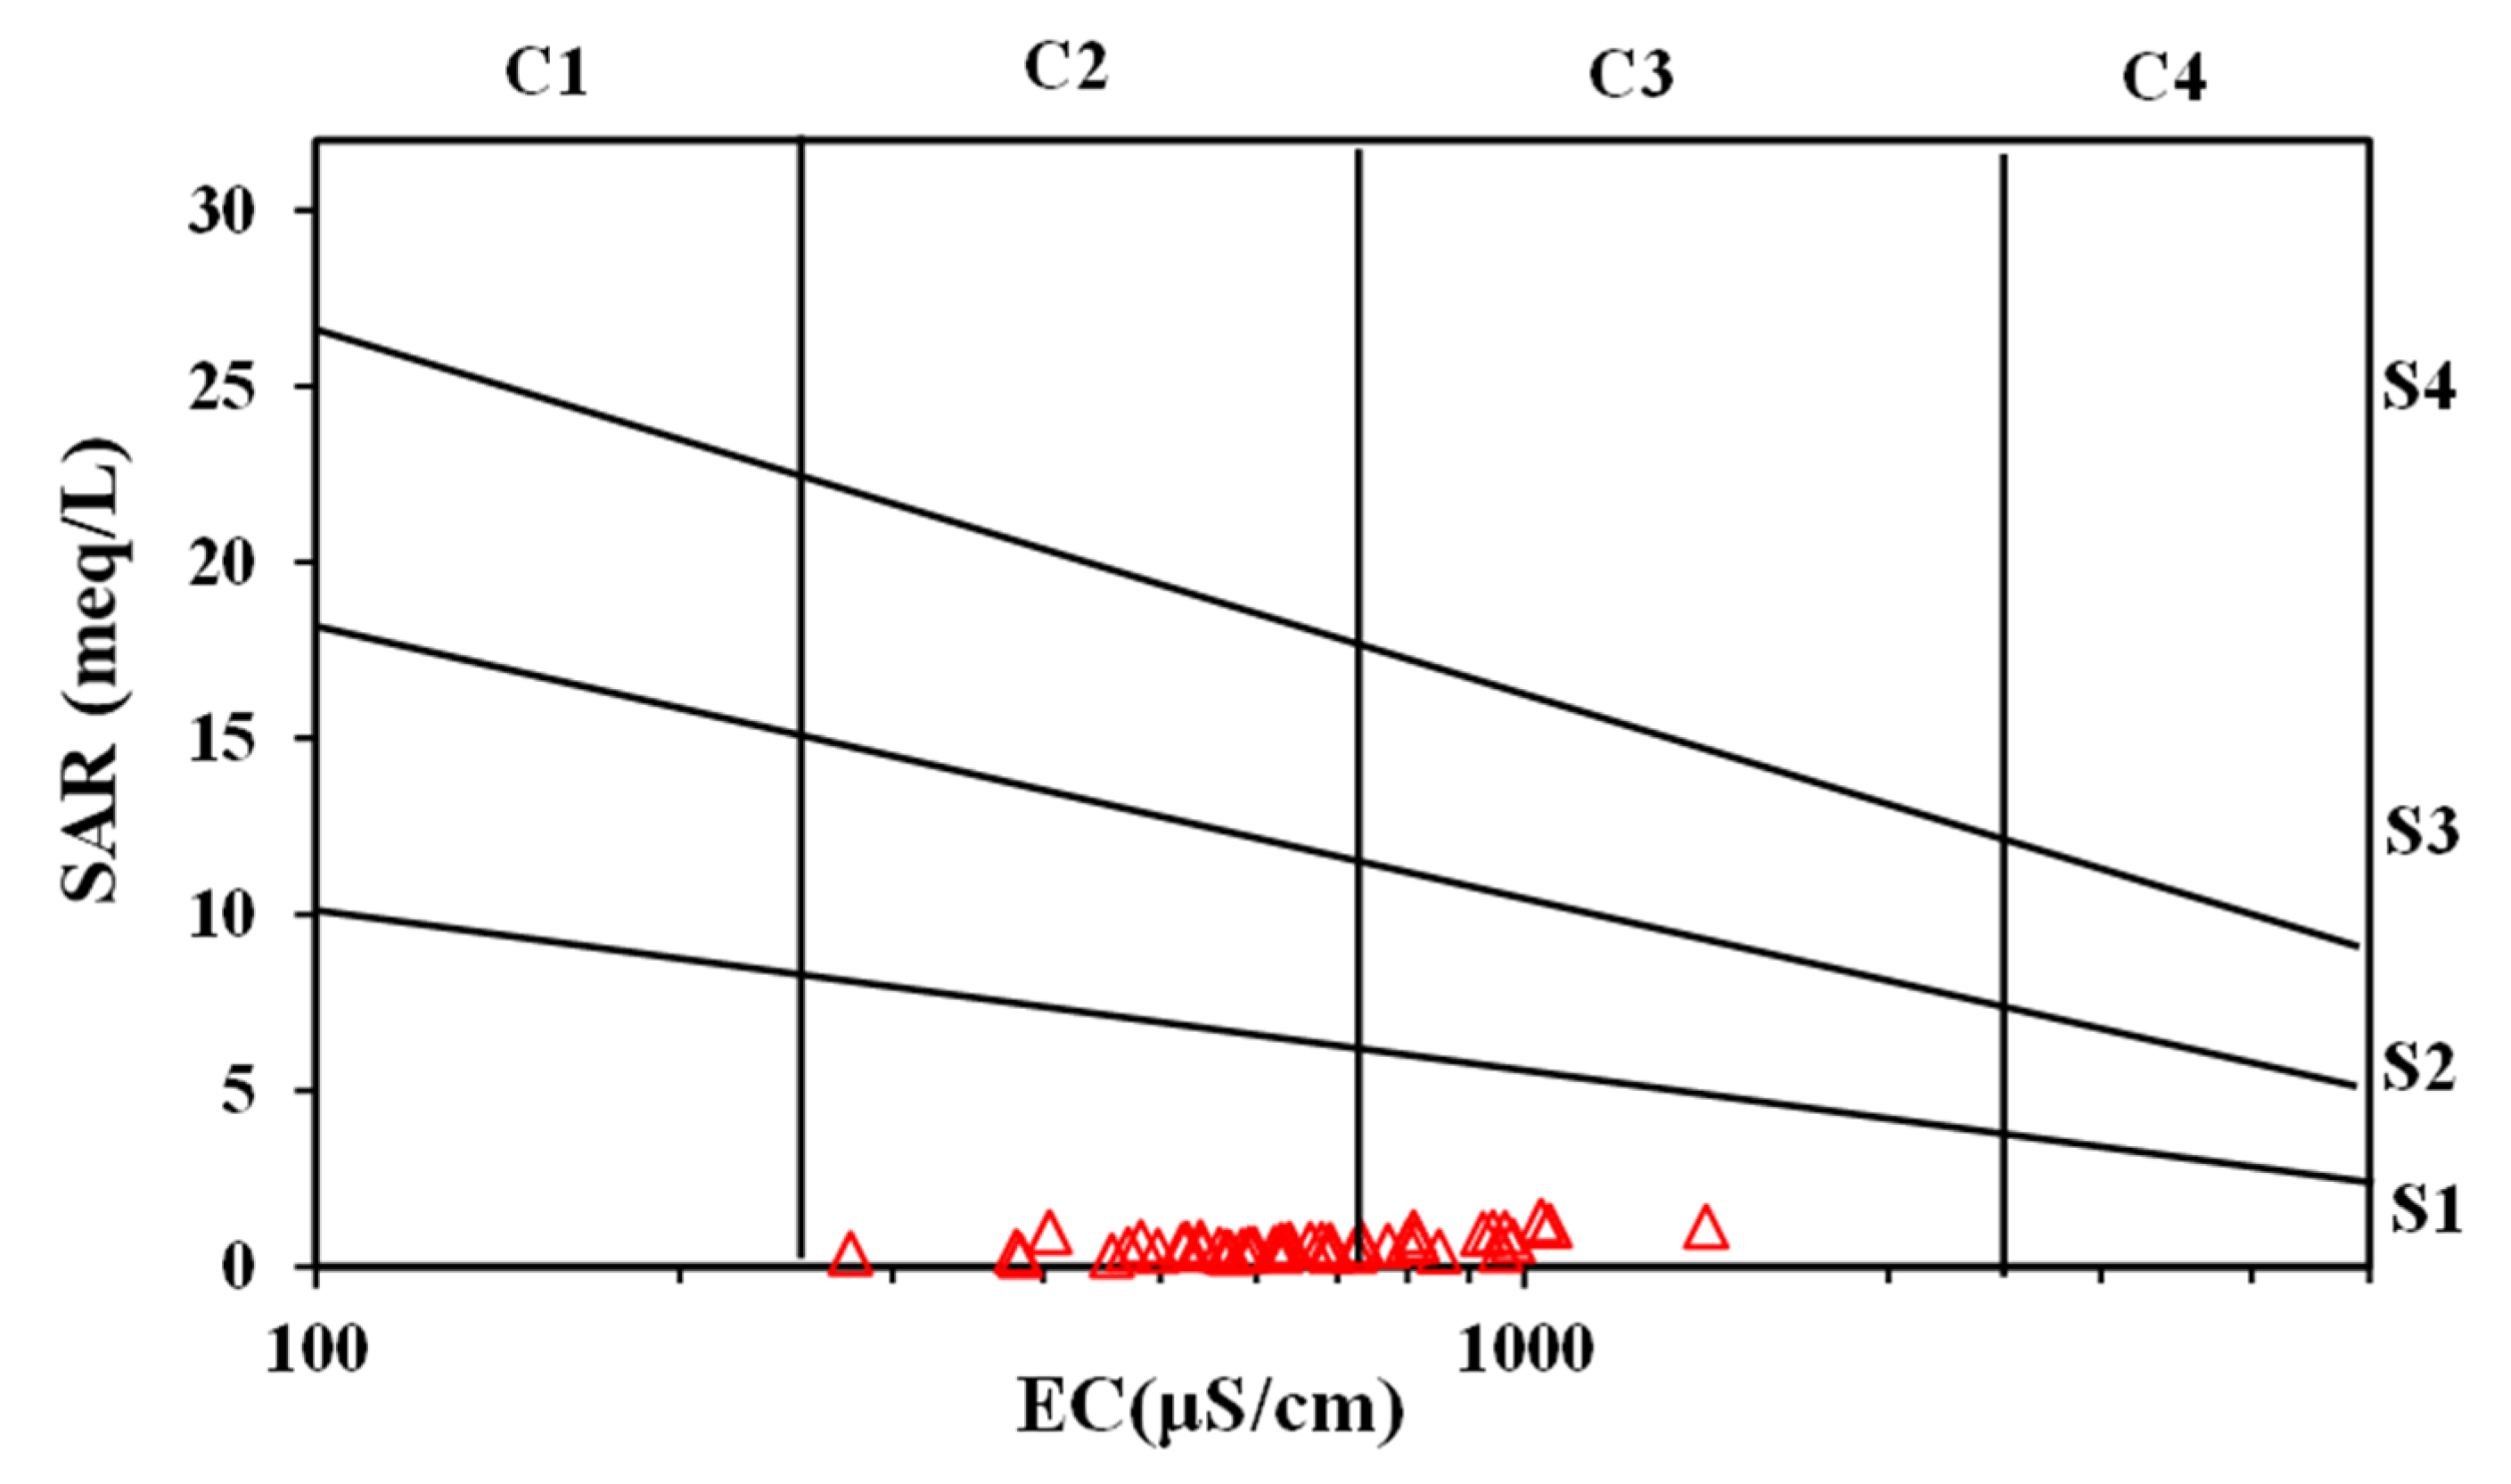
4.4. Groundwater Quality Assessment for Irrigation

GW suitability for irrigation purpose was assessed using EC, SAR, Na%, RSC, CAI and PI water quality indicators and the obtained results were compared with the Indian standard prescribed for irrigation uses. The Na% ranged between 12% and 62% (avg. 24%) (Table 3) which is falling under recommended values. The high percentage of Na causes deflocculating and impairment of the tilth and permeability of soils. The CAI-I and CAI-II values are negative for all the samples indicating that ion exchange may have happened between Ca2+ or Mg2+ in the groundwater with Na+ and K+ in the aquifer sediment. The permeability index (PI) ranged between 37.7% and 75.9%, with average value 54.1%. PI index result reveals that ~98% of samples were fallings under good class and while 2% under suitable category (PI > 75%).
There is a significant association between SAR and sodium absorbed on the soil. If irrigation water containing high percentage of sodium and low calcium, then sodium may be absorbed on soil and it may disturb soil structure and causes clay particles dispersion. The calculated SAR value ranged from 0 to 2 meq/L and all the samples fell in excellent category. The residual sodium carbonate (RSC) ranged between 2.46 to 2.74 meq/L. The results indicated that about 75.5% samples fell in excellent category (RSC < 1.25 meq/L) while remaining under good category (RSC 1.25–2.5 meq/L). Good rainfall in the area might be one of the reasons which govern low RSC values (suitable range for irrigation).
Plot of analytical data on Wilcox diagram [41] relating EC to Na% showed that 97.8% of groundwater samples of the study fell in excellent to good quality region, which can be used for irrigation purposes (Figure 10).
The total soluble salts in irrigation water determines salinity zone as low (EC = <250 µS/cm), medium (EC 250–750 µS/cm), high (EC 750–2250 µS/cm) and very high (EC 2250–5000 µS/cm). High value of EC in water leads to salinity and high sodium concentration leads to alkalinity in soil. It is reported that generally high concentration of solutes is present in irrigation water in areas where evaporation is maximum [42]. Normally, salinity problem arises where drainage is poor in irrigated agriculture. Due to the poor drainage, water table rises and due to capillary action, sodium salts accumulate in the soil near the root zone of the plants. In the present study, no samples fell in the low salinity category; however, 69% and 31% samples fell in medium and high salinity category which may be due to shallow water table in the area. Conjunctive use of water by mixing ground water with normal surface water in proper proportion should be practiced to avoid soil salinity. The US salinity diagram, showing SAR and EC that represents alkalinity hazard and salinity hazard, respectively, reflects that no sample fell in the category C1S1, while most of the water sample were in C2S1 (68.8%), C3S1 (31.11%) category indicating medium to high salinity (Figure 11) but suitable for irrigation use.

5. Conclusions

The hydro-chemical characteristics and groundwater quality have been assessed to check the suitability of GW for drinking and irrigation purpose for Bhojpur district, located in the central Ganga basin. The northern part of the district is covered by younger alluvium generated by the river Ganga, while the central and southern parts contain the older alluvial formation. The GW level analyses revealed that hydraulic gradient is towards river Ganga and GW is contributing to the river in pre-monsoon season. The carbonate and silicate weathering processes are taking place in the area with dominancy of silicate weathering. Overall, the rock–water interaction is controlling the geochemistry of the study region. The groundwater of the study area is classified into ‘Ca-Mg-HCO3 Type’. It is witnessed that 66%, 69% and 84% of the samples exceeding the acceptable limit of As, Fe and Mn respectively for drinking water purpose as prescribed by BIS, 2012 and all other analyzed major ions and trace metals are well within the permissible limit of drinking water. The higher concentration of arsenic was observed in the younger alluvium, flood plain of river Ganga. Generally arsenic is enriched in the depth range of 20–40 m below ground surface and hence this depth zone should be avoided for tapping GW. Arsenic concentrations are in acceptable range at depth greater than 50 m in the Ganga River floodplain. This is probably because a confined aquifer may be encountered at that depth. The samples were also checked for suitability of irrigation purposes based on Na%, SAR, RSC CAI and PI indices values and it is found that all the samples fell in excellent to good quality for irrigation except few samples. The GW in proximity to river Ganga is highly enriched with arsenic and irrigation is being applied by tapping aquifer at shallow depth (contaminated zone). As per the authors’ knowledge, there is no Indian standard guidelines for irrigation which considers the role of toxic metals as it may be absorbed by the plants and harmful to human health. Our research findings may help policy makers or planners to design the monitoring network in heavily cultivated area and investigate the impact of contaminated irrigation water on human health. The future research may be carried out on detailed hydrogeological structure with evolution of arsenic in the study area.

Author Contributions

S.K. (Sumant Kumar): Supervision, Conceptualization, Methodology, Investigation, Data Interpretation, Writing—review & editing, M.K.: Sample analysis, Investigation, Writing & editing, V.K.C.: Methodology, Writing—review & editing, V.K.: Sample analysis, Investigation, Software, Data Interpretation, Writing & editing, R.K.S.: Investigation, Data Interpretation, Writing & editing, N.P.: Methodology, Statistical analyses, Data Interpretation, Writing—review & editing, N.K.: Software, Statistical analyses, Writing—review & editing, A.S.: Methodology, Software, Data Interpretation, Writing—review & editing, S.S.: Writing—review & editing, R.S.: Data Interpretation, Writing—review & editing, G.K.: Writing—review & editing, S.P.I.: Writing—review & editing, S.K. (Sudhir Kumar): Writing—review & editing, B.K.Y.: Methodology, Writing—review & editing, N.S.M.: Writing—review & editing; A.C.: Map preparation. All authors have read and agreed to the published version of the manuscript.

Funding

Department of Water Resources, RD & GR, Ministry of Jal Shakti, Govt. of India under purpose driven study, National Hydrology Project.

Institutional Review Board Statement

Not applicable.

Informed Consent Statement

Not applicable.

Data Availability Statement

The data presented in this study are available on request from the corresponding author.

Acknowledgments

Authors kindly acknowledge Minor Water Resources Department, Government of Bihar and Central Ground Water Board, Faridabad for providing the agricultural and hydrological data.

Conflicts of Interest

The authors declare no conflict of interest.

Appendix A

Table A1. Sampling details with arsenic concentration in the study area.
S.No.Sample CodeLocationLatitudeLongitudeAquifer TypeScreening Depth of Hand
Pumps (Meter)
Arsenic
(ppb)
1S-1Paiga25.638784.6699Unconfined24.468
2S-2Paiga25.638484.669621.378
3S-3Semaria ojhapati25.615884.431136.611
4S-4Semaria ojhapati25.615884.432061.04
5S-5Semaria ojhapati25.616284.431015.265
6S-6Semaria ojhapati25.616084.430036.6308
7S-7Semaria ojhapati25.616084.430048.823
8S-8Semaria ojhapati25.616284.429120.1320
9S-9Semaria ojhapati25.618084.4296121.914
10S-10Semaria ojhapati25.615284.430354.93
11S-11Sahana/mangla25.614284.430325.980
12S-12Sudarpur barja25.680184.512133.54
13S-13Balaharpur25.670784.694036.6BDL
14S-14Balaharpur25.670784.694041.1BDL
15S-15Barahara 25.684284.726930.535
16S-16Barahara25.683484.726545.737
17S-17Sirsiyan 25.682084.762821.3337
18S-18Sirsiyan 25.681984.762351.860
19S-19Hazipur 25.659284.676142.723
20S-20Chamarpur25.655084.453236.6141
21S-21chamarpur 25.656984.455030.556
22S-22Sirhiya25.682184.762721.34
23S-23Sirhiya25.681984.762233.517
24S-24Sirsiya 25.681984.762218.33
25S-25Ishwarpura 25.678484.362218.3148
26S-26Ishwarpura 25.678484.362254.956
27S-27Ishwarpura 25.678484.362221.3165
28S-28Ishwarpura 25.678184.362616.8286
29S-29Ishwarpura 25.677984.362419.8205
30S-30Ishwarpura 25.671584.363227.4328
31S-31Baligaon 25.414984.497516.88
32S-32Naika tola25.482184.431139.63
33S-33Jaithwar25.279184.381818.319
34S-34Bahnuwa25.208384.429315.2BDL
35S-35Anhari25.219884.517642.7BDL
36S-36Anhari Surya temple25.219884.517645.711
37S-37Sahar 25.252084.629718.3BDL
38S-38Bhagawanpur25.428184.633418.3BDL
39S-39Bibiganj25.575284.578625.972
40S-40maulighat25.693784.594838.116
41S-41maulighat25.692584.595139.65
42S-42mauzampur25.688284.588645.771
43S-43Bindgaon25.680984.828927.46
44S-44Bindgaon 25.680384.828130.5113
45S-45Manikpur25.649084.784921.389
Figure A1. Arsenic distribution map in the study area.
Water 13 02344 g0a1

References

  1. Asadi, E.; Isazadeh, M.; Samadianfard, S.; Ramli, M.F.; Mosavi, A.; Nabipour, N.; Chau, K.W. Groundwater quality assessment for sustainable drinking and irrigation. Sustainability 2020, 12, 177. [Google Scholar] [CrossRef] [Green Version]
  2. MacDonald, A.; Bonsor, H.C.; Ahmed, K.M.; Burgess, W.G.; Basharat, M.; Calow, R.C.; Dixit, A.; Foster, S.S.D.; Gopal, K.; Lapworth, D.J.; et al. Groundwater quality and depletion in the Indo-Gangetic Basin mapped from in situ observations. Nat. Geosci. 2016, 9, 762–766. [Google Scholar] [CrossRef]
  3. Kumari, N.; Srivastava, A.; Sahoo, B.; Raghuwanshi, N.S.; Bretreger, D. Identification of Suitable Hydrological Models for Streamflow Assessment in the Kangsabati River Basin, India, by Using Different Model Selection Scores. Nat. Resour. Res. 2021, 1–19. [Google Scholar] [CrossRef]
  4. Srivastava, A.; Sahoo, B.; Raghuwanshi, N.S.; Singh, R. Evaluation of variable-infiltration capacity model and MODIS-terra satellite-derived grid-scale evapotranspiration estimates in a River Basin with Tropical Monsoon-Type climatology. J. Irrig. Drain. Eng. 2017, 143, 04017028. [Google Scholar] [CrossRef] [Green Version]
  5. Chaudhary, V.; Satheeshkumar, S. Assessment of groundwater quality for drinking and irrigation purposes in arid areas of Rajasthan, India. Appl. Water Sci. 2018, 8, 218. [Google Scholar] [CrossRef] [Green Version]
  6. Gautam, S.K.; Maharana, C.; Sharma, D.; Singh, A.K.; Tripathi, J.K.; Singh, S.K. Evaluation of groundwater quality in the Chotanagpur plateau region of the Subarnarekha river basin, Jharkhand State, India. Sustain. Water Qual. Ecol. 2015, 6, 57–74. [Google Scholar] [CrossRef]
  7. Rawat, K.S.; Singh, S.K. Water Quality Indices and GIS-based evaluation of a decadal groundwater quality. Geol. Ecol. Landsc. 2018, 2, 240–255. [Google Scholar] [CrossRef] [Green Version]
  8. Breida, M.; Younssi, S.A.; Ouammou, M.; Bouhria, M.; Hafsi, M. Pollution of Water Sources from Agricultural and Industrial Effluents: Special Attention to NO3, Cr (VI), and Cu (II). In Water Chemistry; IntechOpen: London, UK, 2019. [Google Scholar]
  9. Lwimbo, Z.D.; Komakech, H.C.; Muzuka, A.N. Impacts of Emerging Agricultural Practices on Groundwater Quality in Kahe Catchment, Tanzania. Water 2019, 11, 2263. [Google Scholar] [CrossRef] [Green Version]
  10. Fianko, J.R.; Nartey, V.K.; Donkor, A. The hydrochemistry of groundwater in rural communities within the Tema District, Ghana. Environ. Monit. Assess. 2009, 168, 441–449. [Google Scholar] [CrossRef]
  11. Kumar, S.; Kumar, V.; Saini, R.K.; Pant, N.; Singh, R.; Singh, A.; Kumar, S.; Singh, S.; Yadav, B.K.; Krishan, G.; et al. Floodplains landforms, clay deposition and irrigation return flow govern arsenic occurrence, prevalence and mobilization: A geochemical and isotopic study of the mid-Gangetic floodplains. Environ. Res. 2021, 21, 111516. [Google Scholar] [CrossRef]
  12. Biswas, A.; Bhattacharya, P.; Mukherjee, A.; Nath, B.; Alexanderson, H.; Kundu, A.K.; Chatterjee, D.; Jacks, G. Shallow hydrostratigraphy in an arsenic affected region of Bengal Basin: Implication for targeting safe aquifers for drinking water supply. Sci. Total Environ. 2014, 485, 12–22. [Google Scholar] [CrossRef]
  13. Kumar, S.; Ghosh, N.C.; Singh, R.P.; Singh, R.; Singh, S. Impact of canal recharge on groundwater quality of Kolayat area, district Bikaner, India. In Geostatistical and Geospatial Approaches for the Characterization of Natural Resources in the Environment; Springer: Cham, Switzerland, 2016; pp. 341–347. [Google Scholar]
  14. Saha, D.; Sahu, S. A decade of investigations on groundwater arsenic contamination in Middle Ganga Plain, India. Environ. Geochem. Health 2015, 38, 315–337. [Google Scholar] [CrossRef]
  15. Dillon, P.; Fernandez, E.E.; Tuinhof, A. Management of aquifer recharge and discharge processes and aquifer storage equilibrium. In IAH Contribution to GEF-FAO Groundwater Governance Thematic Paper 4; GEF-FAO: Rome, Italy, 2012; Available online: https://recharge.iah.org/files/2016/11/Management-of-aquifer-recharge-and-discharge-processes-and-aquifer-storage-equilibrium.pdf (accessed on 1 May 2021).
  16. Singh, S.; Ghosh, N.C.; Krishan, G.; Kumar, S.; Gurjar, S.; Sharma, M.K. Development of indices for surface and ground water quality assessment and characterization for Indian conditions. Environ. Monit. Assess. 2019, 191, 182. [Google Scholar] [CrossRef]
  17. Gupta, P.; Vishwakarma, M.; Rawtani, P.M. Assessment of water quality parameters of Kerwa Dam for drinking suitability. Int. J. Theor. Appl. Sci. 2009, 1, 53–55. [Google Scholar]
  18. Ramesh, K.; Elango, L. Groundwater quality and its suitability for domestic and agricultural use in Tondiar river basin, Tamil Nadu, India. Environ. Monit. Assess. 2011, 184, 3887–3899. [Google Scholar] [CrossRef]
  19. Jacintha, T.G.A.; Rawat, K.S.; Mishra, A.; Singh, S.K. Hydrogeochemical characterization of groundwater of peninsular Indian region using multivariate statistical techniques. Appl. Water Sci. 2017, 7, 3001–3013. [Google Scholar] [CrossRef] [Green Version]
  20. CGWB Groundwater Information Booklet: Bhojpur District, Bihar; Central Ground Water Board, Ministry of Water Resources, RD & GR. Government of India: New Delhi, India, 2013. Available online: http://cgwb.gov.in/District_Profile/Bihar/Bhojpur.pdf (accessed on 10 April 2021).
  21. APHA American Public Health Association Standard Methods for the Examination of Water & Wastewaters, 22nd ed.; APHA: Washington, DC, USA, 2012; Available online: http://srjcstaff.santarosa.edu/~oraola/Assets/APHA_SM_20.pdf (accessed on 13 April 2021).
  22. Jain, C.K.; Bhatia, K.K.S. Physico-Chemical Analysis of Water and Wastewater, User’s Manual; National Institute of Hydrology: Roorkee, India, 1998; Available online: http://117.252.14.250:8080/xmlui/handle/123456789/490 (accessed on 2 April 2021).
  23. Kumar, S.; Ghosh, N.C.; Singh, R.P.; Sonkusare, M.M.; Singh, S.; Mittal, S. Assessment of water quality of lakes for drinking and irrigation purposes in Raipur City, Chhattisgarh, India. Int. J. Eng. Res. Appl. 2015, 5, 42–49. [Google Scholar]
  24. Raghunath, H.M. Ground Water, 2nd ed.; Wiley: New Delhi, India, 1987; p. 353. [Google Scholar]
  25. Schoeller, H. Geochemistry of groundwater. In Groundwater Studies—An International Guide for Research and Practice; UNESCO: Paris, France, 1977; Volume 15, pp. 1–18. [Google Scholar]
  26. Doneen, L.D. Notes on Water Quality in Agriculture; Published as a water science and engineering paper 4001; Department of Water Science and Engineering, University of California: Davis, CA, USA, 1964. [Google Scholar]
  27. BIS. Indian Standard—Drinking Water Specification (2nd Revision); IS 10500; BIS: New Delhi, India, 2012. Available online: http://cgwb.gov.in/Documents/WQ-standards.pdf (accessed on 13 May 2021).
  28. Hem, J.D. Study and Interpretation of the Chemical Characteristics of Natural Water; Department of the Interior, US Geological Survey: Reston, Virginia, 1985. [Google Scholar]
  29. Chakrapani, G.J.; Saini, R.K.; Yadav, S.K. Chemical weathering rates in the Alaknanda–Bhagirathi river basins in Himalayas, India. J. Asian Earth Sci. 2009, 34, 347–362. [Google Scholar] [CrossRef]
  30. Zhang, J.; Huang, W.; Létolle, R.; Jusserand, C. Major element chemistry of the Huanghe (Yellow River), China—Weathering processes and chemical fluxes. J. Hydrol. 1995, 168, 173–203. [Google Scholar] [CrossRef]
  31. Pant, N.; Rai, S.P.; Singh, R.; Kumar, S.; Saini, R.K.; Purushothaman, P.; Nijesh, P.; Rawat, Y.S.; Sharma, M.; Pratap, K. Impact of geology and anthropogenic activities over the water quality with emphasis on fluoride in water scarce Lalitpur district of Bundelkhand region, India. Chemosphere 2021, 279, 130496. [Google Scholar] [CrossRef] [PubMed]
  32. Piper, A.M. A graphic procedure in the chemical interpretation of water analysis. Am. Geophys. Union Transcr. 1944, 25, 914–923. [Google Scholar] [CrossRef]
  33. Kumar, S.; Kumar, V.; Saini, R.K.; Kumar, C.P.; Raju, M.; Singh, S.; Singh, O.; Chakravorty, B. Detection of arsenic in groundwater of Laksar area, Haridwar District, Uttarakhand. J. Indian Water Res. Soc. 2019, 39, 42–48. [Google Scholar]
  34. Saha, D. Arsenic groundwater contamination in parts of middle Ganga plain, Bihar. Curr. Sci. 2009, 97, 753–755. [Google Scholar]
  35. Kunar, S.; Jain, S.K.; Shekhar, S.; Sharma, V. Arsenic in groundwater in India: An overview. Bhujal News 2009, 24, 6–14. [Google Scholar]
  36. Mukherjee, A.; Scalon, B.R.; Chaudhary, S. Regional hydrogeochemical study of groundwater arsenic contamination along transects from the Himalayan alluvial deposits to the India Shield, Central Gangetic Basin, India. Geol. Soc. Am. 2007, 39, 519. [Google Scholar]
  37. Singh, S.K.; Ghosh, A. Entry of arsenic into food material—A case study. World Appl. Sci. J. 2011, 13, 385–390. [Google Scholar]
  38. Kumar, S.; Joshi, S.K.; Pant, N.; Singh, S.; Chakraborty, B.; Saini, R.K.; Kumar, V.; Singh, A.; Ghosh, N.C.; Mukherjee, A.; et al. Hydrogeochemical evolution and groundwater recharge processes in arsenic enriched area in central Gangetic plain, India. Appl. Geochem. 2021, 131, 105044. [Google Scholar] [CrossRef]
  39. Saha, D.; Sinha, U.; Dwivedi, S. Characterization of recharge processes in shallow and deeper aquifers using isotopic signatures and geochemical behavior of groundwater in an arsenic-enriched part of the Ganga Plain. Appl. Geochem. 2011, 26, 432–443. [Google Scholar] [CrossRef]
  40. Saha, D.; Sarangam, S.S.; Dwivedi, S.N.; Bhartariya, K.G. Evaluation of hydrogeochemical processes in arsenic-contaminated alluvial aquifers in parts of Mid-Ganga Basin, Bihar, Eastern India. Environ. Earth Sci. 2009, 61, 799–811. [Google Scholar] [CrossRef]
  41. Wilcox, L.V. The Quality of Water for Irrigation Use; US Department of Agricultural Technical Bulletin: Washington, WA, USA, 1948. [Google Scholar]
  42. IS-11624: Indian Standard—Guidelines for the Quality of Irrigation Water; Bureau of Indian Standards: New Delhi, India, 1986; Available online: https://law.resource.org/pub/in/bis/S06/is.11624.1986.pdf (accessed on 12 April 2021).
Figure 1. Study area located in central Ganga basin, drainage network, geological map with sampling locations.
Water 13 02344 g001
Figure 2. (a) Average monthly precipitation and cumulative rainfall (b) average, minimum and maximum monthly temperature highlighting the Kharif and Rabi season.
Water 13 02344 g002
Figure 3. (a) Borelogs location in the study area; (b) fence diagram representing geological settings.
Water 13 02344 g003
Figure 4. Water table elevation and groundwater flow direction in the study area.
Water 13 02344 g004
Figure 5. The Land use and Land cover (LULC) classification in the study area.
Water 13 02344 g005
Figure 6. Gibb’s plot of logarithmic value of TDS vs. Cl/Cl + HCO3 and Na+/Na+ + Ca++.
Water 13 02344 g006
Figure 7. Bivariate plots of (a) Ca + Mg vs. HCO3 + SO4, (b) Ca + Mg vs. HCO3, (c) Na + K vs. total cation and (d) Ca + Mg vs. total cation concentration in the groundwater samples.
Water 13 02344 g007aWater 13 02344 g007b
Figure 8. Piper diagram showing the ionic nature of groundwater.
Water 13 02344 g008
Figure 9. Scatter plot (a) As vs. Fe (b) As vs. pb (c) As vs. Zn (d) As vs. Cd (e) As vs. Mn (f) As vs. depth.
Water 13 02344 g009
Figure 10. Plot of sodium percent (Na%) vs. electrical conductivity (EC).
Water 13 02344 g010
Figure 11. Salinity diagram showing the distribution of irrigation waters.
Water 13 02344 g011
Table 1. Statistical summary of groundwater quality in the study area.
ParametersMinimumMaximumAverageStd. Dev.BIS (2012)
Acceptable Limit
BIS (2012)
Permissible Limit
pH6.98.57.60.46.5–8.5-
EC2771415683213--
TDS (mg/L)23710345381615002000
TH (mg/L)122616292105200600
Ca (mg/L)321407425.175200
Mg (mg/L)10652612.230100
Na (mg/L)10732813.0--
K (mg/L)0.4270.373.9310.1--
F (mg/L)BDL0.580.220.1311.5
Cl (mg/L)1911819.02501000
HCO3 (mg/L)166639373373--
SO4 (mg/L)4431111200400
NO3 (mg/L)BDL29.42.36.745NR
As (ppb)BDL3367399.71050
Fe (ppm)0.0614.392.83.690.3NR
Mn (ppb)2.11303390291100300
Pb (ppb)BDL247.14.9710NR
Zn (ppb)1102190310432500015,000
Cd (ppb)BDL2.70.70.583NR
Cu (ppb)BDL1041.86501500
BDL: Below detection limit; NR: No relaxation.
Table 2. Inter-elemental correlation matrix of major ions.
pHECTDSFClHCO3SO4NO3CaMgNaK
pH1.0
EC−0.31.0
TDS−0.60.51.0
F0.20.1−0.31.0
Cl0.00.60.30.01.0
HCO3−0.30.80.30.10.31.0
SO40.10.50.20.10.80.21.0
NO30.10.30.20.10.50.20.51.0
Ca−0.40.70.40.00.60.70.40.31.0
Mg−0.10.80.30.10.60.80.50.40.71.0
Na−0.10.70.40.10.70.60.60.40.60.71.0
K0.1−0.10.00.00.0−0.10.20.0−0.1−0.10.01.0
Table 3. Parameters’ value for classification of irrigation water.
ParametersMinimumMaximumAverageIS 11,624 (1986): Classification of Irrigation Water
EC (µS/cm)2771415683Class: Low (Below 1500), Medium (1500–3000), High (3000–6000) Very high (Above 6000)
Na (%)126224-
SAR0.31.70.7Class: Low (Below 10), Medium (10–18), High (18–26), Very high (Above 26)
RSC−2.72.50.3Class-I RSC < 1.25 (low-Safe), Class-II RSC 1.25–2.5 (med. marginal) Class III > 2.5 (high-unsafe)
PI72.441.352.1Suitable (Class I, >75%), Good (Class II, 25–75%), Unsuitable (Class III, <25%).
CAI-I−11.7−0.93−1.6Class I Positive (+) CAI, Class II Negative (−)
CAI-II−0.14−0.20−0.13
Publisher’s Note: MDPI stays neutral with regard to jurisdictional claims in published maps and institutional affiliations.

