Article

The Phenomenological Theory of Turbulence and the Scour Evolution Downstream of Grade-Control Structures under Steady Discharges

by
Jessica Di Nardi
1,
Michele Palermo
1,*,
Fabián A. Bombardelli
2 and
Stefano Pagliara
1
1
Department of Energy, Systems, Territory and Construction Engineering, University of Pisa, 56122 Pisa, Italy
2
Department of Civil and Environmental Engineering, University of California, Davis, CA 95616, USA
*
Author to whom correspondence should be addressed.
Water 2021, 13(17), 2359; https://doi.org/10.3390/w13172359
Submission received: 12 July 2021 / Revised: 24 August 2021 / Accepted: 25 August 2021 / Published: 27 August 2021
(This article belongs to the Special Issue Erosion Processes in Hydraulic Engineering)

Abstract

:
A more complete understanding of scour mechanisms for flows downstream of grade-control structures, including their temporal evolution, has the potential to lead to improved predicting tools for design. To date, design equations have been mostly derived empirically, i.e., by parametric modelling (at generally-small scales) corresponding to specific structure configurations, and for limited ranges of hydraulic conditions. Although these approaches allowed different authors to propose many empirical and/or semi-empirical equations, they lack generality and may lead to incorrect estimations when applied outside their ranges of validity. First-principles-based methods with solid calibration and validation procedures can overcome these issues. Following recent theoretical advancements presented elsewhere by the last three authors, in this work we analyze and test the predictive capability of a scour evolution model based on the phenomenological theory of turbulence (PTT) by using a large dataset pertaining to different grade-control structures. Although the PTT model was developed (and validated) for scour evolution caused by oblique and vertical plunging jets, we show that its basic assumptions are still valid for the addressed low-head structures, encompassing rock structures, stepped gabion weirs, rock and bed sills, and others. Furthermore, we also provide interesting insights on scour evolution by contrasting the predicting capability of our model against experimental data by different authors for specific structures. Results of the comparison conclusively show that the PTT model has a general validity and represents a trustable tool to estimate scour evolution regardless of the structure configuration and hydraulic conditions.

1. Introduction

Grade-control structures (e.g., bed sills, weirs, gabion weirs, block ramps, etc.) are often used to limit bed degradation in rivers. Because of their reduced environmental impact, they have become more and more popular in the last decades, representing an effective alternative to traditional structures. Nevertheless, their presence modifies the flow dynamics, potentially resulting in localized scour phenomena which need to be carefully addressed in order to evaluate the risk of a structural failure. Because of the complexity of the scour mechanism, the analysis of such structures has been mainly conducted via laboratory models. Among others, Gaudio and Marion [1], Lenzi et al. [2], and Ben Meftah and Mossa [3] have investigated the scour process downstream of bed sills, providing equations to estimate the scour depth at equilibrium, and included some observations on its temporal evolution. Likewise, Guan et al. [4] and Wang et al. [5,6] studied flows past vertical and sloped submerged weirs. Pagliara and Palermo [7] and Pagliara et al. [8] analyzed similarities and differences in the flow behavior, and highlighted the main parameters affecting the scour process downstream of stepped gabion weirs, rock, grade-control structures, block ramps, and cross-vane weirs. They determined that the most important parameters were the tailwater depth and the densimetric Froude number.
Although these studies represent an advancement of knowledge in the field and are of practical importance, they are all subject to significant limitations. First, experimental results depend on tested configurations. Second, empirical equations proposed by different authors for relatively similar structures may result in widely-disparate estimations of the scour characteristics because of the diverse ranges of hydraulic parameters under which they were validated. Overall, they lack generality and do not provide exhaustive interpretations of the physics of the scour process.
For grade control structures and steady flow conditions, Bormann and Julien [9] partially overcame such limitations by proposing a methodology based on the application of jet diffusion theory [10] of an empirical nature. They assumed that equilibrium is reached when shear stress (τ) acting on the scour surface becomes equal to the critical counterpart (i.e., τc). Likewise, to model jet driven scour processes, Hoffmans [11,12] applied the linear momentum equation to a selected control volume. Furthermore, in this case, the analytical closure was obtained by introducing a non-dimensional parameter calibrated with experimental data. Therefore, both approaches can be classified as semi-theoretical.
More recently, an innovative, fully theoretical approach was proposed by Bombardelli and Gioia [13,14] and Gioia and Bombardelli [15]. Their approach is based on the application of the phenomenological theory of turbulence (PTT) to scour related problems. In so doing, they derived two theoretical expressions for the maximum scour depth that are valid for 2D and 3D cases (i.e., for two- and three-dimensional scour equilibrium configurations). This pioneering work paved the way to other, recent theoretical advancements. In particular, Bombardelli et al. [16] analyzed scour evolution due to vertical and oblique plunging jets. By assuming a simplified geometry for time-dependent scour hole enlargement, they provided unprecedented insights into scour dynamics, and derived two ordinary differential equations to predict scour depth evolution.
The method developed by Bombardelli et al. [16] has been recently corroborated by the findings of Palermo et al. [17], who showed that the approach is valid under steady-state flow conditions for structure configurations tested therein (vertical and non-linear unsubmerged weirs), regardless of bed sediment gradation and model scale. However, despite the promising results presented elsewhere, there is still no evidence that the evolution theory proposed by Bombardelli et al. [16] can successfully predict scour evolution downstream of grade-control structures under steady flows, especially in the frequent case of partially-submerged structures.
This paper aims at contributing to fill this gap of knowledge. To this end, for the first time, we will show that for the analyzed grade-control structures:
(1)
the basic assumptions of the PTT-theory are still valid, notwithstanding the fact that such structures are partially submerged in general.
(2)
the scour evolution is consistent with that of plunging jets, unsubmerged vertical weirs, and Piano Key weirs, that are non-linear weirs often used for stream rehabilitation projects [18].
(3)
two different phases can be distinguished, i.e., the developing and the developed phases. (It is worth remarking that this result was not obvious a priori. In fact, according to Tregnaghi et al. [19], generally scour processes are characterized by an “affine transformation of a scour hole profile into another” during scour evolution, but this does not imply that a homothetic expansion may occur (geometric similitude). Namely, the affine transformation is a necessary but not sufficient condition for a homothetic expansion of the scour hole.)
(4)
the equation to estimate the transition time between the two phases, proposed by Pagliara et al. [20], and further extended by Bombardelli et al. [16], also applies for grade-control structures.
(5)
the scour evolution equation developed by Bombardelli et al. [16] furnishes reasonably good estimations of the scour evolution, without tuning the coefficients and exponents derived for scour processes caused by jets.

2. PTT Approach: Literature Background

Bombardelli and Gioia [13,14], and Gioia and Bombardelli [15] pioneered a PTT-based method for scour related problems. They derived the following expressions to estimate the value of R = Δ + D at equilibrium (Req) for both 2D and 3D configurations, respectively:
R e q 2 D = K 1 ρ ρ s ρ Q h 2 / 3 d 2 / 3 g 1 / 3 ,
R e q 3 D = K 2 ρ ρ s ρ 3 / 5 Q h 2 / 5 d 2 / 5 g 1 / 5 ,
where Δ is the scour depth, D is the tailwater depth over the original bed level, K1 and K2 are constants (equal to 0.3 and 0.5, respectively, see [16]), h is the total head energy of the jet, d is the characteristic diameter of the movable bed (assumed to be equal to d50, with dxx indicating the material size for which xx% is finer), ρ is the density of water, ρs is bed sediment density, g is the gravitational acceleration, and Q is the unit discharge in Equation (1) and the total discharge in Equation (2). In Figure 1, we show a schematic of the scour hole along with the main geometric and hydraulic parameters, with α indicating the impinging angle of the jet on the water surface with respect to a horizontal plane.
Bombardelli et al. [16] investigated the scour evolution under several jet inclinations with respect to a horizontal plane (α). Such angles for a single plunging jet, generated by a circular pipe with diameter Dtest, were varied in the range 45° ≤ α ≤ 90°. The pipe was located either at the center of the channel (full-model arrangement), or close to the channel glassed wall (half-model arrangement). It is worth mentioning that Bombardelli et al. [16] corroborated the findings of Pagliara et al. [20,21], showing that results obtained with the half-model setup are consistent with those of the full-model when an equivalent jet diameter D* = 20.5Dtest is adopted. (Under such assumption, the mean jet velocity V of the half-model is equal to that pertaining to the full-model, thus resulting in the same densimetric Froude number Fdxx = V/(gdxx)0.5, with g’ = g(ρsρ)/ρ indicating the reduced acceleration due to gravity.) In addition, the non-dimensional time was assumed to be equal to T = t/Tr, where Tr = Dtest/(gd90)0.5 for full-model arrangement, and Tr = D*/(gd90)0.5 for half-model arrangement [16,19]. According to Oliveto and Hager [22], the reference time Tr accounts for the geometry of the structure, the approaching flow condition, and granulometric characteristics of the bed material. It can be expressed as Tr = LR/VR with LR and VR = (gd90)0.5, indicating the reference length and velocity, respectively.
Bombardelli et al. [16] distinguished two phases of the scour evolution, characterized by different physical mechanisms [20]: (1) the initial stage (developing phase) involving a very rapid increase of the scour hole dimensions and the formation of the downstream/surrounding dune; and (2) the developed phase, when both the scour hole and the dune enlarge homothetically up to the equilibrium configuration (that is reached asymptotically). The transition time (tT) between the two phases occurs for T = TT = tT/Tr, estimated as follows [16]:
log T T = 0.02 α + 3.62 ,
valid for 0.7 ≤ D/Dtest (or D/D*) ≤ 12.9; 30° ≤ α ≤ 90°; 13.0 ≤ Fd90 ≤ 46.4.
By invoking the conservation of mass of sediment and of energy within the scour hole and following the PTT-based approach proposed by Bombardelli and Gioia [13,14] and Gioia and Bombardelli [15], Bombardelli et al. [16] presented an unprecedented model to predict scour evolution. They derived the following ordinary differential equations (ODEs), valid for the 2D and 3D case, respectively:
d Δ d t = K 3 ρ s ρ g d 3 ρ D 1 Δ 1 / 2 R e q R 1 m 1 ,
d Δ d t = K 4 ρ s ρ g d 5 ρ D 2 1 Δ R e q R 5 / 3 1 m 2 ,
where m1 = m2 = 1.5 are coefficients (Foster et al. [23]), and K3 = 8 and K4 = 80 are two multiplicative constants. It is worth recalling that Bombardelli et al. [16] developed Equations (4) and (5) under the following hypotheses: (1) D is constant during the scour process; (2) Δ/D << 1; (3) the suspended/rotating sediment in the scour hole does not affect the energy transfer of the scour evolution; (4) the scour hole enlarges homothetically during the developed phase; (5) the scour volume is simplified as a cylinder for the 2D case and as a sphere for the 3D counterpart; (6) scalings for the shear stress τ proposed by Bombardelli and Gioia [13,14] and Gioia and Bombardelli [15] for the 2D and 3D cases are valid during the entire evolution process. Note that all the mentioned assumptions fully reflect the physics of the scour process and their validity will be also shown in the following sections. In particular, the hypotheses (3) and (6) were also validated by Palermo et al. [17,24]. Namely, Palermo et al. [24] analyzed the effect of the suspended/rotating material in the scour hole. They conducted specific experimental tests and proposed a novel, independent theoretical approach based on the conservation of angular momentum. Very interestingly, Palermo et al. [24] derived a theoretical expression for the shear stress that is analytically identical to that proposed by Bombardelli and Gioia [13,14], thus providing a further validation of the hypotheses (3) and (6). More recently, Palermo et al. [17] showed that the scalings for the shear stress τ hold true at all times at prototype scales. In addition, they corroborated the findings of Bombardelli et al. [16] at equilibrium, showing that the proposed approach is valid regardless of the bed sediment gradation and is not affected by scale effects. Finally, it is worth remarking that all the hypotheses adopted in our model are valid independently of the sediment bed gradation.

3. On the Applicability of the PTT to Grade-Control Structures

The scour evolution model presented by Bombardelli et al. [16] is strictly valid for the developed phase, although the authors showed that it has a good predicting capability during the developing phase as well. To extend that model to scour downstream of grade-control structures, we first need to revisit the basic assumptions enumerated in the previous section.
It is worth recalling that, for scour evolution caused by circular plunging jets, Pagliara et al. [20] and Bombardelli et al. [16] assumed T = t/Tr as the non-dimensional time, where Dtest (or D* for the half-model arrangement) was used to estimate Tr. Recently, Palermo et al. [17] have analyzed the scour evolution downstream of a PK weir. For such structure typology, Palermo et al. [17] showed that it is appropriate to replace the diameter Dtest (or D*) in Tr with the length of the weir crest. In so doing, they certified the validity of Equation (3), evidencing that the transition between the two phases is consistent with that observed in jet-driven scour processes. Based on these findings, we will assume TrB = B/(gd90)0.5, with B denoting the width of the channel (equal to the width of the analyzed grade-control structures). Therefore, we first address the occurrence of the two phases (developing and developed) for scour processes downstream of grade-control structures. Then, we show that an (almost) homothetic enlargement of the scour hole takes place in the developed phase.

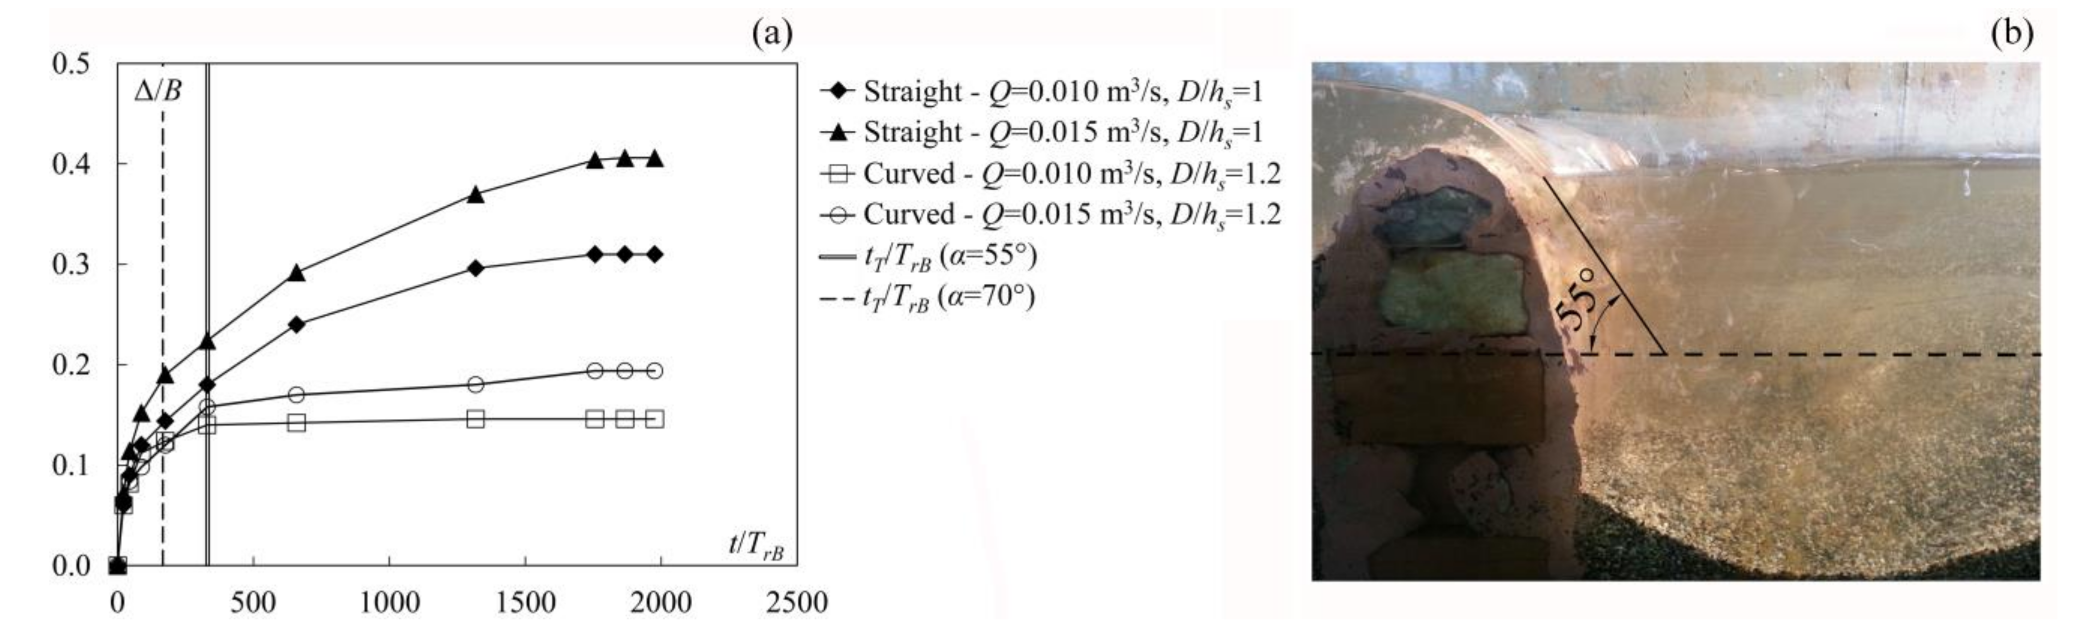
3.1. Developing and Developed Phases

The scour evolution of different grade-control structures was experimentally addressed by several authors. In particular, Ben Meftah and Mossa [3] analyzed the scour process occurring downstream of vertical sills in series. In Figures 1 and 4 in [3], sketches of the adopted sill and their disposition in series are shown. Tests were conducted by varying the distance between the sills under different hydraulic conditions and with one uniform bed material. In addition, Ben Meftah and Mossa [3] monitored scour evolution and distinguished three (3) phases: (1) a rapid “initial phase”, during which the scour reached around 65% of the maximum (i.e., equilibrium) scour depth (phase I); (2) an “intermediate phase”, with the scour depth reaching about 90% of the equilibrium value (phase II); and (3) an “equilibrium phase” characterized by “low bed shear stresses”, during which the scour depth slowly achieves its final configuration (phase III). Ben Meftah and Mossa [3] estimated that phase I, phase II, and phase III last approximately 10%, 30% and 60% of the entire time duration required to reach equilibrium, respectively.
Lu et al. [25] studied scour downstream of grade-control structures, under both steady and unsteady flow conditions and with two uniform bed materials. They simulated two grade-control structures, characterized by a downstream surface slope equal to 0.25 and 0.143, respectively, and the same total drop height. In Figure 1 in [25], the sketch of the experimental apparatus is shown. Experimental evidence allowed Lu et al. [25] to corroborate the existence of three phases for scour evolution downstream of the analyzed grade-control structures. They also provided a description of the scour mechanism during the different phases. Phase I lasts from the beginning of the scour to the formation of a small dune. In phase II, the scour hole enlarges and the “sediment particles oscillated along the downstream slope of the scour hole” [25] up to the final, equilibrium configuration (phase III). The authors of [25] also pointed out that, during phase III, bed material may occasionally slide along the downstream face of the scour hole, thus causing a temporary variation of longitudinal profiles. Nevertheless, they noticed that scour profiles during phases II and III exhibit a substantial similitude (i.e., scour evolves homothetically). Unlike Ben Meftah and Mossa [3], Lu et al. [25] did not provide an estimation of the duration of each phase.
It is worth remarking that none of the aforementioned studies furnished tools to estimate the transition time between the different phases, they only offered approximate quantitative descriptions. In addition, they provided limited insights on the different physical mechanisms characterizing the phases. Following the classification proposed by Pagliara et al. [20] and Bombardelli et al. [16] for jet scour evolution, we decided to re-analyze data by Ben Meftah and Mossa [3] and Lu et al. [25], and some selected results are presented in Figure 2 herein. The aim was to see if their three-stage characterization of the scour process is compatible with the two-phase model firstly put forward by Pagliara et al. [20]. In Figure 2, we contrasted values of the non-dimensional scour depth Δ/B against the non-dimensional time t/TrB for selected tests by Ben Meftah and Mossa [3,26]. (Note that data of Ben Meftah and Mossa, [3], refer to scour downstream of the first of three consecutive bed sills.) In order to highlight the transition between the developing and developed phase, in Figure 2a we only included data for t/TrB < 10,000. Conversely, in Figure 2b, we show the entire scour evolution pertaining to same tests in a semi-logarithmic plot. Ben Meftah and Mossa [26] conducted experimental tests with three different grade-control structures, having the same total drop height. More specifically, the upstream surface slope of all the three structures was kept constant and equal to 1H:1V. Also, three different inclinations of the downstream face were simulated, i.e., vertical, 1H:1V, and a 3H:1V. Tests were undertaken using one uniform bed material and under different hydraulic conditions. A diagram sketch of the tested structures is shown in Figure 2 of [26]. It should be noted that for runs R25, R20 and R3 of Ben Meftah and Mossa [26] shown in Figure 2, the inclination of the downstream surface of the grade-control structure was equal to 18° (i.e., 3H:1V slope), 45° (i.e., 1H:1V slope), and 90° (i.e., vertical face), respectively. In addition, data pertaining to runs R20 and R25 were extracted from Figure 6 of Ben Meftah and Mossa [26]. Thus, consistent with other tests done by the same authors and developed under similar conditions, we assumed that the equilibrium time is equal to 3 h and 14 h for runs R20 and R25.
By looking at Figure 2, it can be concluded that phase I of Ben Meftah and Mossa [3] and Lu et al. [25] seems to be consistent with the developing phase; likewise, phases II and III of Lu et al. [25] exhibit features that are similar to those of the developed phase. Apparently, the phase II considered by Ben Meftah and Mossa [3] could also encompass part of the developing phase and the transition between developing and developed phases. In this regard, it is important to remark that the stages are defined in terms of percentage of the equilibrium scour depth. However, the existence of developing and developed phases seems to be confirmed by recent results from the same authors [26], who extended their former analysis by comparing scour evolutions downstream of vertical bed sills and grade-control structures, characterized by different heights hs and inclinations, respectively. Ben Meftah and Mossa [26] pointed out that data pertaining to phases I and III exhibit two distinct and consistent trends, regardless of the analyzed structure configuration. Conversely, scour evolution pertaining to phase II depends on structure geometry. More specifically, the inclination of the downstream surface of the structure (assumed to be equal to the impingement angle α of the jet on the water surface) affects jet diffusion and flow characteristics in the downstream basin. Notably, experimental evidence allowed Ben Meftah and Mossa [26] to conclude that scour evolution is similar for α ranging between 45° and 90°, whereas scour evolves more slowly for smaller values of the angle α, thus reducing the difference of slopes of data trend pertaining to phase I and III. In particular, they observed that scour depth increases faster with the drop height for vertical structures. (Note that the impact angle of the jet increases with the drop height being water discharge and tailwater depth constant.) These results suggest that the kinetics of scour evolution downstream of grade-control structures mainly depends on the jet impact angle on the water surface. Such conclusion is fully consistent with the findings of Bombardelli et al. [16], who indicated that TT decreases with α (Equation (3)).
Overall, in Figure 2a, we show that scour evolution is reasonably consistent with the findings of Pagliara et al. [20] and Bombardelli et al. [16]. Namely, the different kinetics of the scour evolution in all the tests (represented by the different slopes of data trends) corroborate the existence of the two phases (developing and developed). In addition, the non-dimensional transition time TT is also well predicted by Equation (3), as shown by the vertical lines reported in Figure 2a. In this regard, we would like to remark that we calculated TT = tT/TrB assuming that α is equal to the inclination of the downstream structure surface for runs R25 and R20 (i.e., α = 18° and 45°, respectively), whereas we estimated that α = 80° for run R3 relative to a vertical structure. In turn, α < 30° is outside the range of applicability of Equation (3). Nonetheless, experimental evidence seems to confirm that Equation (3) provides reasonable estimations of the parameter TT, regardless of the structure configuration and the impingement angle α. Likewise, data pertaining to tests with bed sills [3] were also plotted in Figure 2. In this case, the non-dimensional transition time was calculated with Equation (3) assuming α = 0°, as the flow over the bed sill is almost horizontal and the drop height was relatively small. Also in this case, the transition time appears to be in good agreement with the kinetics of the scour evolution.
Similar considerations apply to tests conducted by Gaudio and Marion [1]. Namely, Gaudio and Marion [1] analyzed scour evolution downstream of bed sills located in series. The height of all the bed sills was 15 cm and their width was the same of the channel (B = 0.6 m). The distance between two successive sills was constant and equal to 2.50 m. Tests were conducted with one uniform bed material and under different hydraulic conditions. The diagram sketch of the experimental apparatus is illustrated in Figure 1 in [1].
In Figure 3, we contrast the non-dimensional values of Δ/B against t/TrB for some selected runs, along with the transition time calculated with Equation (3). In the absence of specific indications by the authors of [1], for these runs we estimated that α ranges between 0° and 10°. Once again, the existence of two distinct phases is confirmed in Figure 3. The predicted transition time (using α equal to 0° and 10° in Equation (3)) seems to be consistent with the kinetics of the scour process, i.e., the transition occurs in correspondence with the change of the slope. More specifically, the evolution of the non-dimensional variable Δ/B in the first instants of scour process (i.e., for t/TrB < 8000) is shown in Figure 3a. Overall, it is worth noticing that the transition time between the two phases (corresponding to the change of the slope of experimental curves of scour evolution) is well approximated by Equation (3).
To further certify our analysis, we took into consideration scour evolution pertaining to other structure typologies. Namely, Pagliara and Palermo [7] studied rock, grade-control structures, and stepped gabion weirs. To this end, the authors of [7] simulated rock, grade control structures by superimposing rock layers in such a way that the inclination of the upstream and downstream pseudo-bottom with respect to the horizontal was equal to α = 45°, resulting in two different structure heights. In addition, three different upstream configurations were tested, i.e., without an upstream filtering layer (configurations B1 and B2, according to the structure height), and with a permeable (configuration Bf) and impermeable (configuration Bf-imp) upstream filtering layer (see Figure 1 and Table 1 in [7] for diagram sketch and details of tested configurations, respectively). Likewise, Pagliara and Palermo [7] simulated a stepped gabion weir structure, made by different superimposed layers of prismatic gabions. The length and height of the steps of the structure were the same, resulting in a downstream slope of the pseudo-bottom equal to 45°. Four different upstream configurations of the structure were tested, i.e., without and with an upstream filtering layer (configurations GW0 and GWimp, and GWf and GWf-imp, respectively). In Figure 2 of [7], the diagram sketch of the simulated structure is shown and in Table 1 of [7] the different upstream configurations are summarized. Note that Pagliara and Palermo [7] published scour depth data at equilibrium. Therefore, in the following, we present scour evolution data of tests conducted by Pagliara and Palermo [7] with rock, grade-control structures not included in [7]. In Figure 4a, we show the scour evolution of selected tests with rock, grade-control structures (B2 configuration) conducted with similar downstream water levels and different discharges. In Figure 4b, data for stepped gabion weirs are presented (GWf-imp configuration). For these datasets, by using a camera located in front of the glassed wall of the channel, the authors were able to distinguish the two phases and identify the beginning of the homothetic expansion of the scour hole (empty symbols in Figure 4). Consequently, we tested the predicting capability of Equation (3) by assuming α equal to the inclination of the pseudo-bottom (i.e., α = 45°). As shown in Figure 4, for both structures, Equation (3) provides a reasonably good estimation of the transition time, thus confirming the consistency of the physics of scour evolution.
Similar results were also obtained using data relative to tests conducted by Palermo and Pagliara [27] with straight and curved rock sills (Figure 5a). Namely, Palermo and Pagliara [27] analyzed the scour evolution downstream of stepped gabion weirs, and straight and curved rock sills, under various flow discharges and tailwater levels. As for stepped gabion weirs, the experimental apparatus was the same of [7] (see also the sketch presented in Figure 1 of [27]). Rock sills were made of crushed stone layers with median diameters equal to 4.65 cm and tests were performed in two channels with two different uniform bed materials. As for curved sills, the ratio between the curvature radius of the sill and the width of the channel was equal to 0.5. In Figure 2 in [27], there is a sketch of the sills considered in this paper.
For tests with sills, pictures allowed us to estimate the impinging angle α. An example pertaining to a test conducted with Q = 0.010 m3/s and straight rock sill is shown in Figure 5b, for which we found that α ≈ 55°. Similarly, for curved rock sills tests, we estimated that α was almost equal to 70°. It is worth remarking that α only depends on the structure configuration, whereas it does not vary significantly with Q in the tested range of parameters. Consequently, we calculated the transition time with Equation (3) assuming α = 55° and α = 70° for straight and curved sills, respectively. Overall, in Figure 5a, we show that Equation (3) provides a reasonably good estimation of the transition between the two phases.

3.2. Homothetic Expansion of the Scour Hole

In this section, we show that the developed phase is characterized by a homothetic expansion of the scour hole. To this end, we inspect the ratio Δ/L as a function of the non-dimensional time t/TrB, considering that a homothetic expansion occurs when Δ/L tends to a constant value, with L indicating the scour length. For all the analyzed structures (and consistently with the definitions given in all the studies employed in this paper), the scour length L(t) was extrapolated from available longitudinal profiles at different instants. In other words, L was assumed to be equal to the distance between the points where the longitudinal scour profile (passing through the point of maximum scour depth) intersects the bed level (i.e., distance between origin and end point of the longitudinal profile). For scour downstream of rock, grade-control structures and stepped gabion weirs under steady flow conditions, Pagliara and Palermo [7] showed that the length of the scour increases linearly with its depth at equilibrium, thus corroborating the findings of Pagliara et al. [20,21], who concluded that Δ/L is almost constant during the developed phase. Furthermore, considering the similitude of non-dimensional scour profiles pointed out by Pagliara and Palermo [7], it is reasonable to assume that Δ/L is almost constant during the entire developed phase for rock, grade-control structures and stepped gabion weirs as well.
Nonetheless, to extend the validity of such an assumption to other structure typologies, we took into consideration data gathered from Gaudio and Marion [1], and Ben Meftah and Mossa [3,26], who investigated the evolution of longitudinal scour profiles. (Note that, as mentioned above, data of scour length L(t) were extrapolated from longitudinal profiles.) In Figure 6, we show Δ/L as function of t/TrB for some selected tests conducted in the mentioned studies. In particular, data pertaining to bed sills are plotted in Figure 6b and labeled according to the studies from which they were taken. Subscripts s1, s2 and s3 indicate the first, second and third sill of the series, respectively. In Figure 6a, a detailed view of the same data for t/TrB < 12,000 is shown.
Runs R3, R19 and R26 of Meftah and Mossa [26] were conducted with grade-control structures with the downstream surface inclination equal to α = 90°, 45° and 18°, respectively (Figure 6d). We also reported vertical lines corresponding to transition times calculated using Equation (3), with α ranging between 0° and 10° for tests with bed sills, and α = 18°, 45°, and 80° for tests with grade-control structures (see Section 3.1 for details). In Figure 6c, a detailed view of the same data for t/TrB < 6000 is shown.
Overall, it is apparent that Δ/L is almost constant for T > TT, i.e., a homothetic expansion of the scour hole occurs during the developed phase, regardless of the structure configuration. This represents an unprecedented result and confirms the validity of one of the hypotheses of the PTT-based scour evolution model presented by Bombardelli et al. [16].

4. Validation of the PTT-Evolution Model

4.1. Generalities on the PTT-Evolution Model and Its Applicability to Grade-Control Structures

As mentioned in Section 2, Bombardelli et al. [16] proposed two ODEs valid for 2D and 3D cases. In principle, a two-dimensional scour formation should be expected downstream of the analyzed structures. Nevertheless, the (perfect) two-dimensionality of the scour phenomenon never occurs in practical applications and rarely can be found in laboratory models either.
With regard to prototype structures, Palermo et al. [17] evidenced that the equilibrium morphology could be either 3D or (quasi-) 2D. This behavior can be explained by considering the heterogeneity of in-situ conditions that may result in a 3D scour configuration of the sediment bed.
As for laboratory models, it should be noticed that wall friction can cause a reduction of the scour depth in correspondence with the channel walls, especially at relatively small scales. This phenomenon is particularly evident under clear-water conditions for which the flow discharge is relatively low. In this regard, it is worth mentioning that Pagliara [28] investigated both the maximum scour depth and the average scour depth (in the cross-section where the maximum scour depth occurred) downstream of block ramps (i.e., a fully 2D structure). He found that the maximum scour depth was bigger than the corresponding average scour depth, especially for low values of the densimetric Froude number (see Figure 6 of Pagliara [28]). In addition, he also analyzed the transversal scour profiles in the section of maximum scour depth, showing that they were essentially 3D for most of the tests (see Figure 7 of Pagliara [28]). Considering that 2D scour rarely occurs both in nature and laboratory models, it appears reasonable to validate the predicting capability of Equation (5) using scour evolution data derived from our own and other authors’ studies for all the analyzed structures.
Equation (5) represents an Initial Value Problem (IVP). Therefore, we need to set the initial value of the scour depth Δin for t = tin, where tin indicates the initial time, and the asymptotic value of the scour depth Δeq at equilibrium. For the following analysis, we assumed Δin equal to the first experimental value of the scour depth and for tin the corresponding time. In so doing, we validated Equation (5) for the entire scour evolution, including the developing phase. In addition, we assumed Δeq = Δfin, with Δfin indicating the experimental value of the scour depth at equilibrium.
Furthermore, for practical applications, it could be useful to test the predicting capability of Equation (5) by assuming Δin as above and Δeq = Δeq,calc, with Δeq,calc indicating the scour depth at equilibrium estimated with empirical formulas proposed by the authors of each analyzed study. Numerical solutions were obtained initially by using the coefficients K4 and m2 proposed by Bombardelli et al. [16], and by assuming d = d50 in Equation (5). In the following section, we show the result of such comparisons for selected tests derived from different authors and pertaining to various structures.
It does not escape our attention that the dynamics of classical, jet-induced scour might not be identical in principle to the scour promoted in grade-control structures. However, by inspecting the flow past grade-control structures, it is possible to determine that it is consistent with that of an impinging jet for which the equilibrium theory [13,14,15] and, consequently, the evolution theory [16] adopted herein were developed. In this regard, for unsubmerged grade-control structures, Bormann and Julien [9] evidenced that an impinging jet regime occurs. Likewise, Guan et al. [29] clarified that such a flow regime may also occur downstream of submerged structures (e.g., weirs) depending on the level of submergence of the structure. More specifically, for low submerged structures, Guan et al. [29] stated that “the scour hole…is induced by the direct impact of the plunging jet. ...” Sketches in the paper [29] make it possible to visualize the similarities we are referring to.
Successively, Ben Meftah et al. [30] showed that similar considerations also apply for bed sills. Namely, in [30] they analyzed the hydrodynamics of the flow in the turbulent cauldron downstream of bed sills. They found that three different regions can be distinguished: Region 1, where the flow features are consistent with those of “free entering jet flows”; region 2, “characterized by vortex formations (eddies) due to the jet diffusion, located near the bottom of the scour hole and extended along the upstream scour-side”; and region 3, occurring downstream of region 2, where the flow becomes less turbulent. In addition, they highlighted that “the jet-like flow (region 1) plays a crucial role in the different phases of the scour development” (see also Figure 2 in [30]), thus corroborating the applicability of the PTT theory developed by [13,14,15] to all the structures analyzed herein.
In our calculations, a better agreement could be obtained by using ad hoc coefficients K4 and m2. More specifically, in the following section, we will also show that by only tuning the coefficient K4, the deviation between predicted and measured values of the variable Δ decreases. (The value of the coefficient m2 will be kept equal to 1.5, as suggested by Yalin [31] and Julien [32]). However, we chose not to do so to preserve the generality of the model. This behavior can be explained by considering that dΔ/dt increases with K4 (see Equation (5)), i.e., scour evolution becomes slower for smaller values of K4, especially during the developing phase. As scour in grade-control structures are characterized by a longer duration of the developing phase in comparison with pipe jet flows, because of lower jet flow inclination and velocity, we expect that, by selecting smaller values of K4, the predicting capability of Equation (5) improves for the analyzed structures.

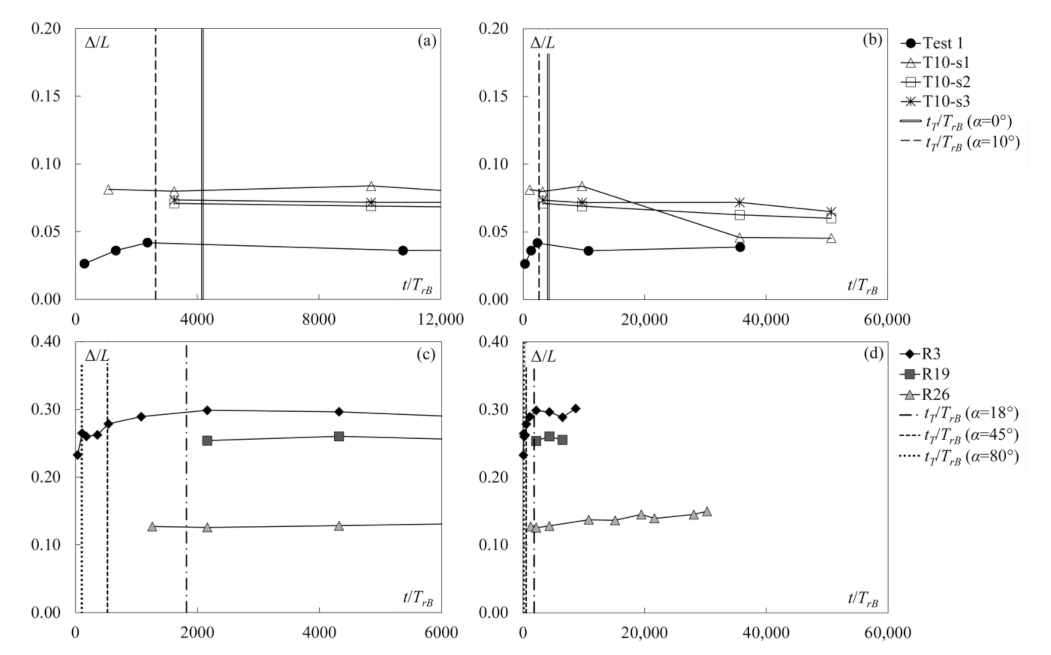
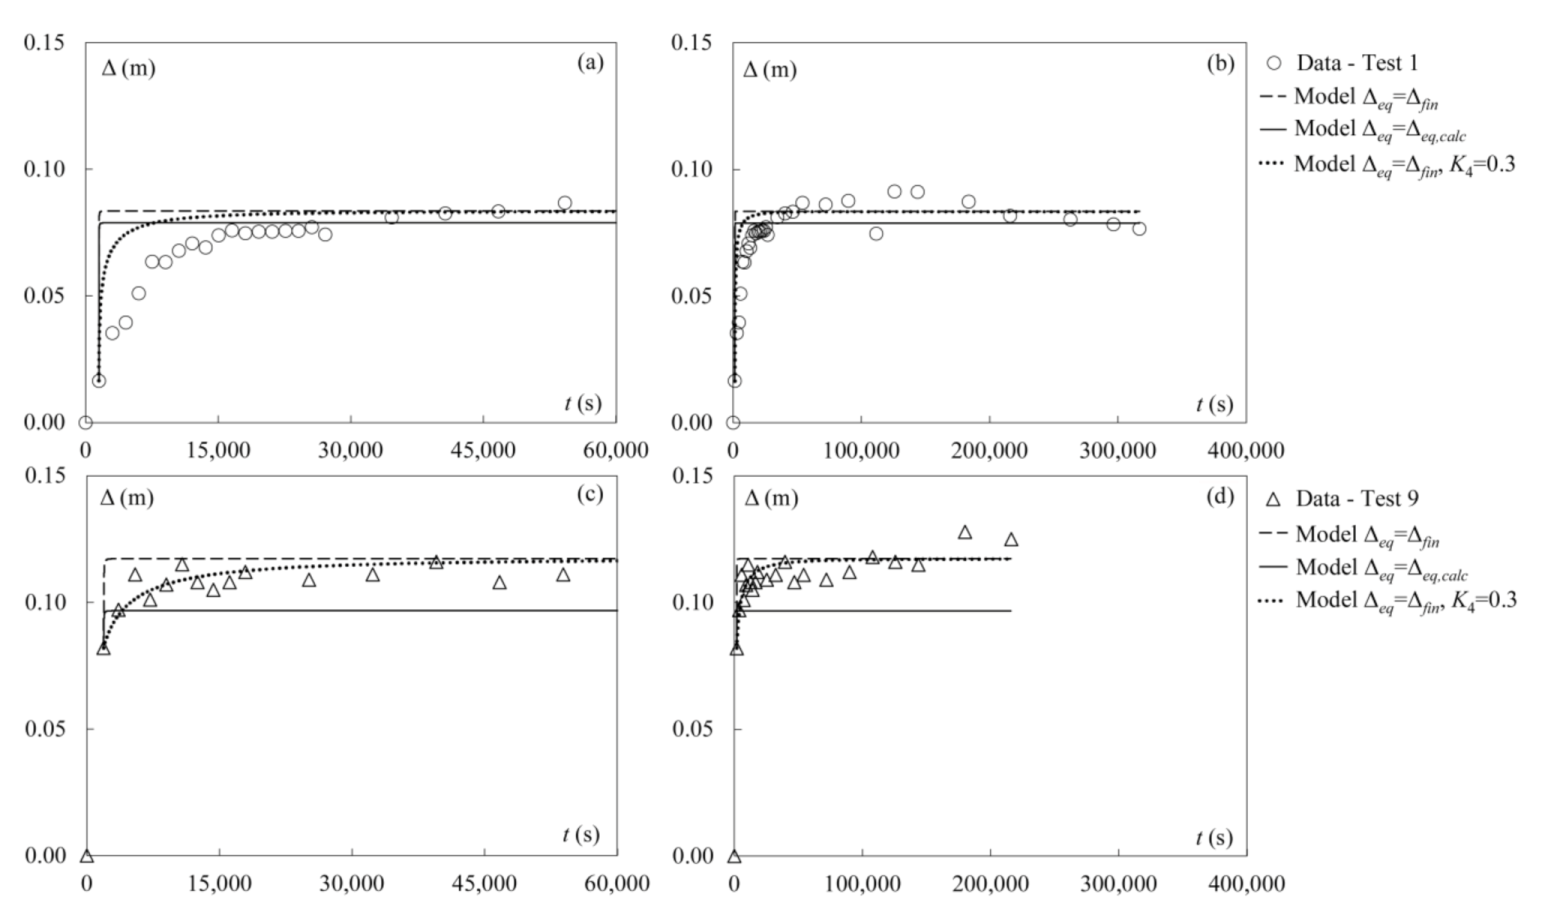
4.2. Validation with Data of Gaudio and Marion [1]

As an example, numerical solutions of Equation (5) (obtained as described in Section 4.1) are contrasted against selected experimental tests of Gaudio and Marion [1] (i.e., Test 1 and Test 9. Note that these are representative tests as they refer to the extreme - minimum and maximum - values of critical specific energy and Reynolds numbers tested by the authors). However, similar results were obtained for other tests not shown herein. To this end, the tailwater depth D is assumed to be equal to the normal water depth calculated according to Gaudio et al. [33].
First, the value of Δfin was assumed to be equal to the average value of scour depths after 20 h (as suggested by Gaudio and Marion, [1]). Under such assumptions, we found that the deviation between predicted and measured scour depths is less than 20% (Figure 7b,d). Higher deviations can be observed during the initial phase of the process (i.e., for t < 60,000 s, as shown in Figure 7a,c. However, the reduction of the model performance in the initial phase of the scour evolution should not surprise, as it was rigorously derived for the developed phase.)
Secondly, we also tested model predicting capability assuming Δeq = Δeq,calc, obtained with Equation (8) of Marion et al. [34] for uniform bed sediment and non-interfering bed sills. In Figure 7a,c, we show that the deviation between experimental data and predictions is generally higher in the initial phase of the process, whereas it reduces during the developed phase (i.e., deviation less than 25%, as shown in Figure 7b,d).
Finally, we also included the numerical solution of Equation (5) obtained by only changing the value of the constant K4 to 0.3 and assuming Δeq = Δfin (the dotted line in Figure 7). As mentioned above, the purpose of this comparison is to show that model predictions could be even better by tuning the coefficient K4.

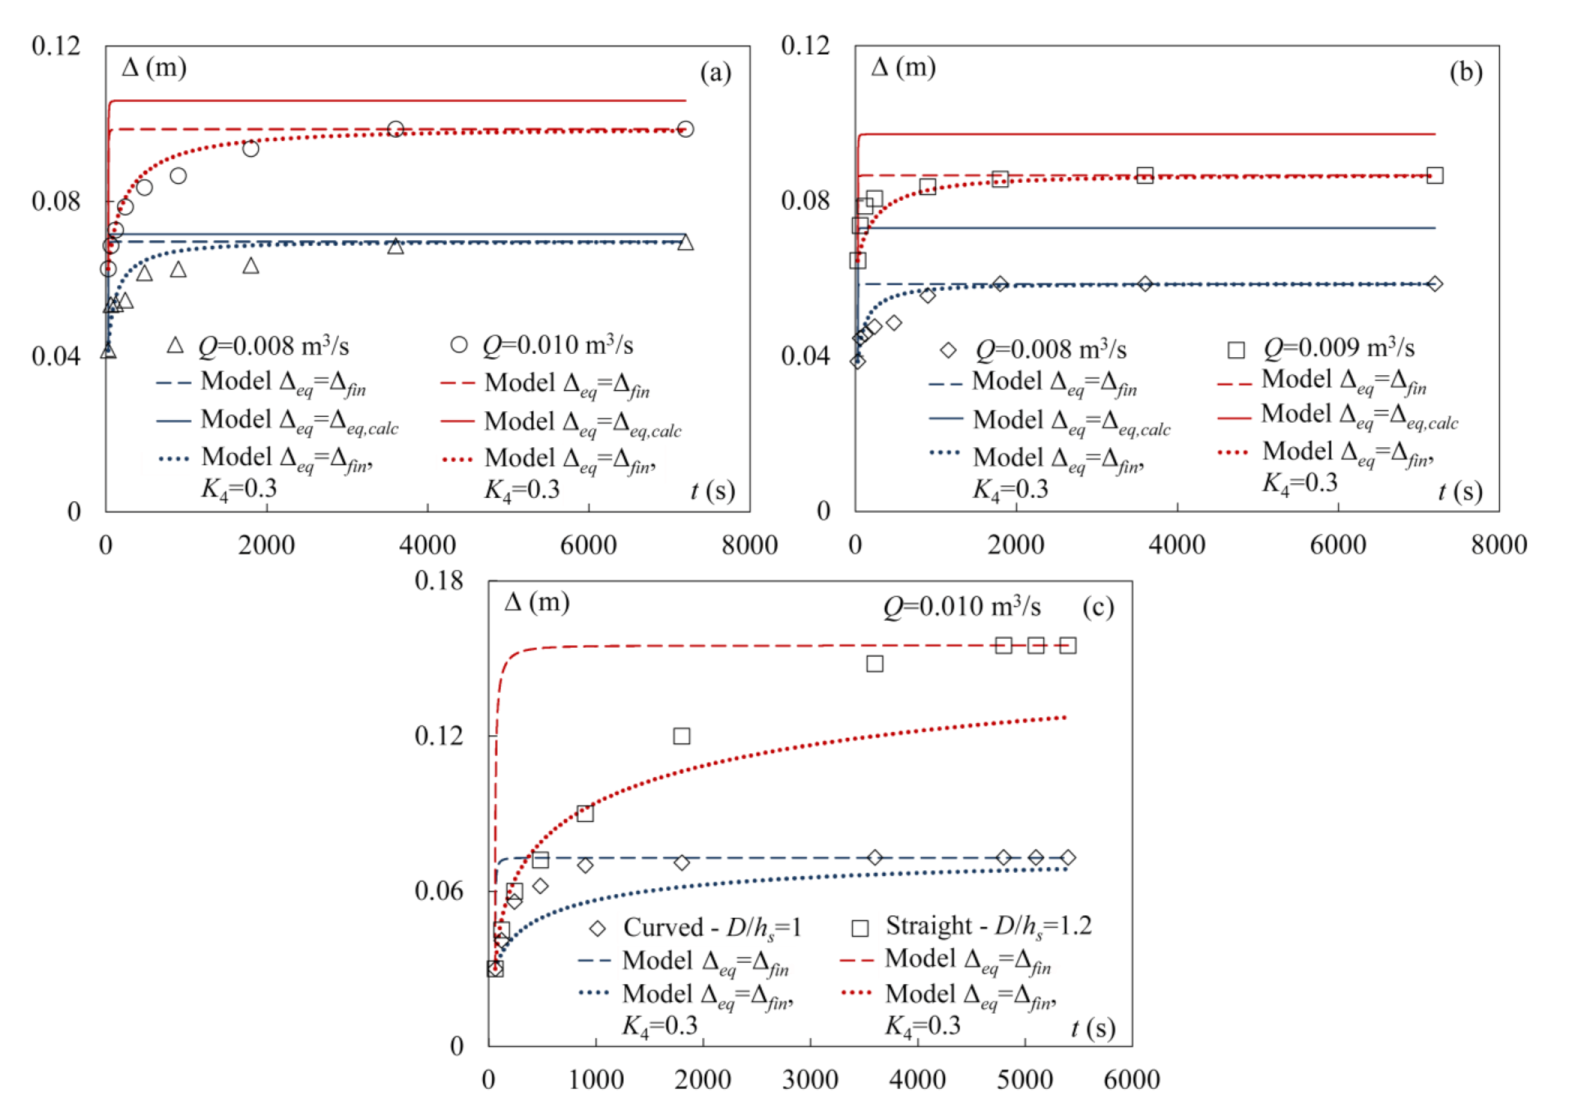
4.3. Validation with Scour Evolution Data Not Included in Pagliara and Palermo [7] and Data of Palermo and Pagliara [27]

Numerical solutions of Equation (5) are also contrasted against selected examples of scour evolution for rock, grade-control structures (Figure 8a) (data not included in Pagliara and Palermo [7]), and data pertaining to stepped gabion weirs (Figure 8b) and straight and curved rock sills (Figure 8c) (Palermo and Pagliara, [27]). Furthermore, in this case, the selected tests are representative of the general behavior of the scour evolution. Tested flow conditions are reported in the figure legends. To numerically solve Equation (5), we assumed that D is equal to the water depth in the channel downstream of the structure. As in the previous structures, in Figure 8a,b, we show numerical solutions of Equation (5) obtained assuming both Δeq = Δfin and Δeq = Δeq,calc calculated with Equations (3) and (6) of Pagliara and Palermo [7], valid for rock, grade-control structures and stepped gabion weirs, respectively. For straight and curved rock sills, we only contrast numerical solutions of Equation (5) obtained assuming Δeq = Δfin, as the authors did not provide any specific equation for such structure typology. Finally, for the sake of comparison, we also included the numerical solutions of Equation (5) obtained assuming Δeq = Δfin and K4 = 0.3 for all the analyzed structures.
Overall, the model is able to capture the scour evolution. In addition, its predicting capability improves in the developed phase. Notably, the mean deviation between calculated and measured values is higher when assuming Δeq = Δeq,calc.

4.4. Validation with Data of Lu et al. [25]

Finally, we extended our analysis to selected tests of Lu et al. [25]. To this end, we considered tests SM2R7-6 and SM1R4-5 that were conducted under different hydraulic conditions, different slopes of the downstream face of the structure and different bed materials. Therefore, these tests are representative of the general behavior. Also in this case, we assumed D to be equal to the water depth in the channel downstream of the structure. Note that this parameter was calculated from the Froude number Fr provided by Lu et al. [25] for each run. In addition, the value of Δeq,calc was computed using Equation (2) of Lu et al. [25], in which the maximum scour depth is expressed as a function of the structure height, d50, the tailwater depth, and a non-dimensional number accounting for the effect of the water depth at the toe of the structure. Such a non-dimensional number is similar to the densimetric Froude number introduced by the authors. In Figure 9, model predictions obtained assuming Δeq = Δeq,calc and Δeq = Δfin are contrasted against data for steady tests SM2R7-6 and SM1R4-5 of Lu et al. [25]. In all cases, the theoretical model predicts data reasonably well, especially for t > 2000 s (deviation less than 20%).
Like for the previous structures, we also included the numerical solution of Equation (5) obtained by only changing the value of the constant K4 to 0.3 and assuming Δeq = Δfin (dotted line in Figure 9).

5. Summary and Conclusions

The analysis of scour evolution under steady flow conditions was conducted considering different grade-control structures including rock and stepped gabion weirs, rock and bed sills and other grade-control structures characterized by different geometry of the downstream surface. To this end, we employed different datasets, mostly derived from the open literature, but also included unpublished data from the same authors pertaining to rock, grade-control structures.
In particular, we validated the predicting capability of a fully theoretical, scour evolution model based on the phenomenological theory of turbulence. This theoretical approach has been recently developed by the last three authors and validated for scour evolution caused by oblique and vertical plunging jets. In so doing, we summarized the basic assumptions of the model and then corroborated that scour evolution downstream of analyzed grade-control structures is fully consistent with that of jet-driven processes. We showed that scour evolution is characterized by two distinct phases—developing and developed. In addition, we highlighted that the developed phase consists in a homothetic expansion of the scour hole.
After assessing the validity of basic assumptions, we compared model predictions against experimental data. We showed that model predicting capability is slightly affected by the selected initial and asymptotic values of scour depth. We compared model predictions obtained by extracting experimental values of initial scour depths and either experimental or calculated values of equilibrium scour depth using empirical relationships proposed by different authors. We always garnered reasonably good results that are fully consistent and, sometimes, even better than those obtained using ad-hoc empirical approaches.
Overall, this study further corroborates the findings presented elsewhere by the last three authors, providing unprecedented insights on scour evolution downstream of grade-control structures. It does not escape to our attention that the proposed theoretical model can represent a significant advancement in terms of practical applications, as it is able to provide accurate estimations of scour evolution regardless of structure configurations, bed sediment gradation, and scale. Finally, it paves the way to a “universal” applicability of the theory. However, further analyses are needed, including the validation of the proposed approach for scour processes downstream of grade-control structures under unsteady flows.

Author Contributions

Conceptualization, M.P., J.D.N., F.A.B. and S.P.; methodology, M.P. and J.D.N.; validation, M.P. and J.D.N.; formal analysis, M.P., J.D.N., F.A.B. and S.P.; data curation, M.P. and J.D.N.; writing—original draft preparation, M.P., J.D.N., F.A.B. and S.P.; writing—review and editing, M.P., J.D.N., F.A.B. and S.P.; supervision, M.P. All authors have read and agreed to the published version of the manuscript.

Funding

This research received no external funding.

Institutional Review Board Statement

Not applicable.

Informed Consent Statement

Not applicable.

Data Availability Statement

Data used during in this study are available in the open literature. Unpublished data are available from the corresponding author upon reasonable request.

Acknowledgments

Authors would like to thank the technicians of the hydraulics laboratory of the University of Pisa, Nicola Bruni, Antonio Cecchi, Alessandro Michelotti, and Vincenzo Pennabea for their help in conducting experimental tests.

Conflicts of Interest

The authors declare no conflict of interest.

References

  1. Gaudio, R.; Marion, A. Time evolution of scouring downstream of bed sills. J. Hydraul. Res. 2003, 41, 271–284. [Google Scholar] [CrossRef]
  2. Lenzi, M.A.; Marion, A.; Comiti, F.; Gaudio, R. Local scouring in low and high gradient streams at bed sills. J. Hydraul. Res. 2002, 40, 731–739. [Google Scholar] [CrossRef]
  3. Ben Meftah, M.; Mossa, M. Scour holes downstream of bed sills in low-gradient channels. J. Hydraul. Res. 2006, 44, 497–509. [Google Scholar] [CrossRef]
  4. Guan, D.; Melville, B.W.; Friedrich, H. Live-bed scour at submerged weirs. J. Hydraul. Eng. 2015, 141, 04014071. [Google Scholar] [CrossRef]
  5. Wang, L.; Melville, B.W.; Guan, D.; Whittaker, C.N. Local scour at downstream sloped submerged weirs. J. Hydraul. Eng. 2018, 144, 04018044. [Google Scholar] [CrossRef]
  6. Wang, L.; Melville, B.W.; Whittaker, C.N.; Guan, D. Temporal evolution of clear-water scour depth at submerged weirs. J. Hydraul. Eng. 2020, 146, 06020001. [Google Scholar] [CrossRef]
  7. Pagliara, S.; Palermo, M. Rock grade control structures and stepped gabion weirs: Scour analysis and flow features. Acta Geophys. 2013, 61, 126–150. [Google Scholar] [CrossRef]
  8. Pagliara, S.; Palermo, M.; Kurdistani, S.M.; Hassanabadi, L.S. Erosive and hydrodynamic processes downstream of low-head control structures. J. Appl. Water Eng. Res. 2015, 3, 122–131. [Google Scholar] [CrossRef]
  9. Bormann, E.; Julien, P.Y. Scour downstream of grade control structures. J. Hydraul. Eng. 1991, 117, 579–594. [Google Scholar] [CrossRef] [Green Version]
  10. Beltaos, S.; Rajaratnam, N. Plane turbulent impinging jets. J. Hydraul. Res. 1973, 11, 29–59. [Google Scholar] [CrossRef]
  11. Hoffmans, G.J.C.M. Jet scour in equilibrium phase. J. Hydraul. Eng. 1998, 124, 430–437. [Google Scholar] [CrossRef]
  12. Hoffmans, G.J.C.M. Closure problem to jet scour. J. Hydraul. Res. 2009, 47, 100–109. [Google Scholar] [CrossRef]
  13. Bombardelli, F.A.; Gioia, G. Towards a theoretical model for scour phenomena. In River, Coastal, and Estuarine Morphodynamics, Proceedings of the RCEM 2005, 4th IAHR Symposium on River, Coastal and Estuarine Morphodynamics, Urbana, IL, USA, 4–7 October 2005; Parker, G., Garcìa, M., Eds.; CRC Press: Boca Raton, FL, USA, 2005; Volume 2, pp. 931–936. [Google Scholar]
  14. Bombardelli, F.A.; Gioia, G. Scouring of granular beds by jet-driven axisymmetric turbulent cauldrons. Phys. Fluids 2006, 18, 088101. [Google Scholar] [CrossRef] [Green Version]
  15. Gioia, G.; Bombardelli, F.A. Localized turbulent flows on scouring granular beds. Phys. Rev. Lett. 2005, 95, 014501. [Google Scholar] [CrossRef] [Green Version]
  16. Bombardelli, F.A.; Palermo, M.; Pagliara, S. Temporal evolution of jet induced scour depth in cohesionless granular beds and the phenomenological theory of turbulence. Phys. Fluids 2018, 30, 085109. [Google Scholar] [CrossRef]
  17. Palermo, M.; Bombardelli, F.A.; Pagliara, S.; Kuroiwa, J. Time-dependent scour processes on granular beds at large scale. Environ. Fluid Mech. 2021, 21, 791–816. [Google Scholar] [CrossRef]
  18. Palermo, M.; Crookston, B.; Pagliara, S. Analysis of Equilibrium Morphologies Downstream of a PK Weir Structure. Proccedings of the World Environmental and Water Resources Congress 2020, Henderson, NV, USA, 17–21 2020; pp. 43–51. [Google Scholar] [CrossRef]
  19. Tregnaghi, M.; Marion, A.; Gaudio, R. Affinity and similarity of local scour holes at bed sills. Water Resour. Res. 2007, 43, W11417. [Google Scholar] [CrossRef]
  20. Pagliara, S.; Hager, W.H.; Unger, J. Temporal evolution of plunge pool scour. J. Hydraul. Eng. 2008, 134, 1630–1638. [Google Scholar] [CrossRef] [Green Version]
  21. Pagliara, S.; Amidei, M.; Hager, W.H. Hydraulics of 3D plunge pool scour. J. Hydraul. Eng. 2008, 134, 1275–1284. [Google Scholar] [CrossRef]
  22. Oliveto, G.; Hager, W.H. Temporal Evolution of Clear-Water Pier and Abutments Scour. J. Hydraul. Eng. 2002, 128, 811–820. [Google Scholar] [CrossRef]
  23. Foster, G.; Meyer, L.; Onstad, C. An erosion equation derived from basic erosion principles. Trans. ASAE 1977, 20, 678–682. [Google Scholar] [CrossRef]
  24. Palermo, M.; Pagliara, S.; Bombardelli, F. Theoretical Approach for Shear-Stress Estimation at 2D Equilibrium Scour Holes in Granular Material due to Subvertical Plunging Jets. J. Hydraul. Eng. 2020, 146. [Google Scholar] [CrossRef]
  25. Lu, J.-Y.; Hong, J.-H.; Chang, K.-P.; Lu, T.-F. Evolution of scouring process downstream of grade-control structures under steady and unsteady flows. Hydrol. Process. 2013, 27, 2699–2709. [Google Scholar] [CrossRef]
  26. Ben Meftah, M.; Mossa, M. New Approach to Predicting Local Scour Downstream of Grade-Control Structure. J. Hydraul. Eng. 2020, 146, 04019058. [Google Scholar] [CrossRef]
  27. Palermo, M.; Pagliara, S. Effect of unsteady flow conditions on scour features at low-head hydraulic structures. J. Hydro-Environ. Res. 2018, 19, 168–178. [Google Scholar] [CrossRef]
  28. Pagliara, S. Influence of sediment gradation on scour downstream of block ramps. J. Hydraul. Eng. 2007, 133, 1241–1248. [Google Scholar] [CrossRef]
  29. Guan, D.; Melville, B.W.; Friedrich, H. Local scour at submerged weirs in sand bed channels. J. Hydraul. Res. 2016, 54, 172–184. [Google Scholar] [CrossRef]
  30. Ben Meftah, M.; De Serio, F.; De Padova, D.; Mossa, M. Hydrodynamic structure with scour hole downstream of bed sills. Water 2020, 12, 186. [Google Scholar] [CrossRef] [Green Version]
  31. Yalin, M.S. The Mechanics of Sediment Transport; Pergamon Press: Oxford, UK, 1977. [Google Scholar]
  32. Julien, P.Y. Erosion and Sedimentation, 2nd ed.; Cambridge University Press: Cambridge, UK, 2010. [Google Scholar]
  33. Gaudio, R.; Marion, A.; Bovolin, V. Morphological effects of bed sills in degrading rivers. J. Hydraul. Res. 2000, 38, 89–96. [Google Scholar] [CrossRef]
  34. Marion, A.; Tregnaghi, M.; Tait, S.J. Sediment supply and local scouring at bed sills in high-gradient streams. Water Resour. Res. 2006, 42, W06416. [Google Scholar] [CrossRef]
Figure 1. Diagram sketch of scour hole evolution, along with the main hydraulic and geometric parameters, with α indicating the impinging angle of the jet on the water surface with respect to a horizontal plane.
Water 13 02359 g001
Figure 2. Δ/B versus t/TrB for (a) t/TrB < 10,000 and (b) total test duration for tests T07, T08, T10 and T13 of Ben Meftah and Mossa [3] and tests R25, R20 and R3 of Ben Meftha and Mossa [26], along with the transition times calculated using Equation (3). Tests of Ben Meftah and Mossa [3] pertain to bed sills (for which we adopted α = 0°). Tests of Ben Meftah and Mossa [26], pertain to grade-control structures with inclined downstream surface for which we adopted α = 18° (Run R25), 45° (R20), and 80° (R3).
Water 13 02359 g002
Figure 3. Δ/B versus t/TrB for Test 1 (Q = 0.0122 m3/s), Test 7 (Q = 0.0179 m3/s), and Test 9 (Q = 0.0144 m3/s) of Gaudio and Marion [1] pertaining to bed sills (for which we estimated 0° < α < 10°), along with the vertical lines indicating the transition times calculated using Equation (3) with α = 0° and α = 10° for (a) t/TrB < 8000 (detailed view) and (b) total test duration.
Water 13 02359 g003
Figure 4. Δ/B versus t/TrB for (a) rock, grade-control structures (data not included in Pagliara and Palermo [7]) and (b) stepped gabion weirs tests (Palermo and Pagliara [27]), along with the vertical line indicating the transition time calculated using Equation (3) with α = 45°. Filled symbols pertain to the developing phase, whereas empty symbols belong to the developed phase.
Water 13 02359 g004
Figure 5. (a) Δ/B versus t/TrB for straight and curved rock sills (Palermo and Pagliara, [27]), along with vertical lines indicating the transition time calculated using Equation (3) with α = 55° and 70°. (b) Picture of a test conducted with a straight rock sill (Q = 0.010 m3/s).
Water 13 02359 g005
Figure 6. Δ/L versus t/TrB for selected tests pertaining to bed sills (Test 1 of Gaudio and Marion [1] and tests T10-s1, T10-s2 and T10-s3 of Ben Meftah and Mossa [3]): for (a) t/TrB < 12,000 (detailed view) and (b) total test duration; Δ/L versus t/TrB for selected tests pertaining to grade-control structures (tests R3, R19 and R26 of Ben Meftah and Mossa, [26]): for (c) t/TrB < 6000 (detailed view) and (d) total test duration.
Water 13 02359 g006
Figure 7. Comparison of numerical solutions of Equation (5) with experimental data pertaining to Test 1 (a) for t < 60,000 s (detailed view) and (b) total test duration, and Test 9 for (c) t < 60,000 s (detailed view) and (d) total test duration (data from Gaudio and Marion [1]). Numerical solutions were obtained assuming Δeq = Δfin (dashed line), Δeq = Δeq,calc (continuous line), and Δeq = Δfin and K4 = 0.3 (dotted line).
Water 13 02359 g007
Figure 8. Comparison of numerical solutions of Equation (5) with experimental data pertaining to: (a) rock, grade-control structures (data not included in Pagliara and Palermo [7]); (b) stepped gabion weirs (data from Palermo and Pagliara [27]); (c) straight and curved rock sills (data from Palermo and Pagliara [27]). Numerical solutions were obtained assuming Δeq = Δfin (dashed line), Δeq = Δeq,calc (continuous line), and Δeq = Δfin and K4 = 0.3 (dotted line).
Water 13 02359 g008
Figure 9. Comparison of numerical solutions of Equation (5) with experimental data pertaining to: (a) test SM2R7-6 and (b) test SM1R4-5 of Lu et al. [25]. Numerical solutions were obtained assuming Δeq = Δfin (dashed line), Δeq = Δeq,calc (continuous line), Δeq = Δfin and K4 = 0.3 (dotted line).
Water 13 02359 g009
Publisher’s Note: MDPI stays neutral with regard to jurisdictional claims in published maps and institutional affiliations.

