
Ecological Influences of Water-Level Fluctuation on Food Web Network


1
Key Laboratory of Ecological Impacts of Hydraulic-Projects and Restoration of Aquatic Ecosystem of Ministry of Water Resources, Institute of Hydroecology, Ministry of Water Resources and Chinese Academy of Sciences, Wuhan 430079, China
2
Donghu Experimental Station of Lake Ecosystems, State Key Laboratory of Freshwater Ecology and Biotechnology of China, Institute of Hydrobiology, Chinese Academy of Sciences, Wuhan 430072, China
*
Author to whom correspondence should be addressed.
†
Equal contribution.
Water 2021, 13(17), 2371; https://doi.org/10.3390/w13172371
Submission received: 4 August 2021
/
Revised: 24 August 2021
/
Accepted: 26 August 2021
/
Published: 29 August 2021
(This article belongs to the Section Biodiversity and Functionality of Aquatic Ecosystems)
Abstract
:Seasonal water-level fluctuations may lead to changes in river nutrients, which causes corresponding changes in the trophic structure of an aquatic food web, and finally affects the whole ecosystem. In this study, we focused on the Ganjing River, a tributary of the Yangtze River, China. Common organisms were sampled and measured for carbon and nitrogen stable isotopes in the wet and dry seasons, respectively, and the relative contributions of different food sources were combined to construct the food web, so as to realize the influence of water-level fluctuation on aquatic food web. Our results showed that basal food sources for fish consumers were endogenous carbon sources such as POM, zooplankton and zoobenthos in the dry season, while high water level exposed fish to more diverse and abundant food sources, and the contribution proportions of exogenous carbon sources (e.g., terrestrial detritus) to consumers increased in the wet season. In parallel, the abundance and species diversity of fish were higher than those in the dry season. Most fish species had relatively higher trophic levels in the dry season compared to the wet season, because the increase in fish densities led to an increase in piscivores fish. The food web was composed of planktonic and benthic food chains in the dry season. During the wet season, the planktonic food chain was dominant, followed by the herbivorous food chain, and the benthic food chain was relatively less important. Therefore, water-level fluctuation may alter the trophic linkages within fish communities, which contributed to a more complex and interconnected food web. Moreover, as we expect, the stable isotope analysis food web was broadly in line with the gut content analysis food web.
1. Introduction
Freshwater ecosystems, which contain a disproportionate number of the planet’s biodiversity [1], seem to be changing under the influence of natural environment and human activities at any moment. As a key environmental factor, short-term fluctuation of water level proves a crucial characteristic in the water bodies (such as lakes, rivers and reservoirs), which is also essential for the maintenance of aquatic biodiversity and productivity [2,3]. Water-level fluctuation has an impact on the ecological processes and patterns of water ecosystem in various aspects. For instance, variations in the hydrologic regime caused by water-level changes, accompanied by changes in light, climate and wave impacts [3], give rise to increases or decreases in the aquatic habitats for feeding, spawning, and migration [4,5]. These shifts can influence the composition of communities and the trophic relationships of species in food chains [6], which in turn make a difference in food web structure between high and low water-level period. However, the ecological influences driven by water-level fluctuation on the structures of freshwater food webs remain poorly studied at the moment [6,7].
Variation of flow regime and sediment transport driven by the hydrological regulation can alter habitat suitability and the contribution of native and allochthonous nutrients, which causes corresponding changes in trophic diversity and food web structure [8]. According to relevant studies, hydrological alterations may be the largest threat to fish biodiversity in the Yangtze River basin [4], which could affect fish density, abundance and food sources. Many fish migrate seasonally in response to water-level changes within the basin [9]. Beyond that, in terms of diet, the dependence of fish on endogenous and exogenous carbon sources shows significant seasonal difference due to the variations in hydrological conditions during the wet and dry season [10], while the change of food sources may be accompanied by the change of trophic structure of fish.
In recent years, stable isotope analysis technique has been widely used in aquatic ecosystems, especially in food webs, to reveal the energy flow and material transfer pathways in ecological communities [11,12,13]. A number of isotopic studies have been conducted in various aquatic habitats to assess changes in the composition of communities and major energy pathways following variations in hydrological regimes. For example, finding from the research in Lake Gucheng indicated that a rise of water level resulted in an ecosystem shift from a macrophyte-dominated state to a phytoplankton-dominated state [6]. Kaymak et al. [14] used carbon-and-nitrogen isotopes to analyse the effects of seasonal hydrologic variation and impoundment on assimilation of basal food sources by fish in a river, and they found that the effect of dams was small when compared to the influence of watershed characteristics, temperature and hydrological seasonal changes.
In this study, we studied the Ganjing River in the Three Gorges Reservoir, China, to focus on the ecological influences of water-level fluctuation on freshwater ecosystem, especially fish population structure. At the same time, the variations of food web structure and fish trophic levels in different hydrological seasons were analysed by using carbon and nitrogen stable isotopes technology, combined with fishery resources investigation. Furthermore, stable isotope mixing models have been widely applied to quantify dietary proportions of various sources to key consumers [15,16,17], and we introduced a Bayesian isotope mixing model (BIMM) to estimate the relative importance of different food resources.
2. Materials and Methods
2.1. Study Area
As a tributary of the Three Gorges Reservoir Region, the Ganjing River originates in the southeast of Liangping County, Chongqing, to end its course in the Yangtze River 3 km from the county seat of Zhongxian County. Following construction of the Three Gorges Dam, a catchment area was formed between the Yangtze estuary and Qijia Valley. The Three Gorges Reservoir is a unique canyon and river channel type reservoir with abundant and precious fresh water resources [18], which is located at the junction of the Sichuan Basin and the plain of the middle and lower reaches of the Yangtze River. The reservoir is 600 km long and 2000 m wide at its widest point. There are 10 tributaries (e.g., Daning River, Xiangxi River and Meixi River) with a catchment area of more than 1000 km2 flowing into the Yangtze River, and their fluctuation cycle is almost the same as that of the main stream. As a consequence of the operation of the Three Gorges Reservoir, the water level varies obviously in seasons (ranging from 145 to 175 m), forming a dramatic water-level difference in drawdown and flooding periods [19]. Since the Three Gorges Reservoir stores water in winter and spring, and releases water in summer and autumn, the reservoir keeps the low water-level from June to September and high water-level from October to April [20,21]. Meanwhile, the operation of the Three Gorges Reservoir has a great influence on the water level of Ganjing River, and its water-level is basically consistent with the trend of the dam water level. Our measured results showed that the mean water level in March was 169 m, that in June was 147 m, that in August was 155 m and that in December was 175 m.
2.2. Sample Collection
Different basal sources, invertebrates and fish samples were collected synchronously from the waterbody and riparian zone in the Ganjing River basin during the wet season (June and August) and dry season (December and April) from 2018 to 2019, respectively. A total of 12 sections were monitored, which covered both inside and outside the existing electric fence net area, including 10 sections on the trunk and tributaries of the Ganjing River and 2 sections in the Zhongxian County of the Yangtze River (Figure 1).
Fish samples were captured by gill nets near the sites, and a total of 27 dominant species were obtained (Table S1), which were divided into various feeding groups (herbivores: Ctenopharyngodon idellus, Parabramis pekinensis, Megalobrama skolkovii and Squaliobarbus curriculus; planktivores: Xenocypris argentea, Saurogobio dabryi, Hypophthalmichthys molitrix, Hypophthalmichthys nobilis, Coilia ectenes taihuensis and Hemiculter leucisculus; benthivores: Cyprinus carpio, Carassius auratus, Myxocyprinus asiaticus, Pelteobagrus vachelli, Pelteobagrus fulvidraco and Pelteobaggrus nitidus; piscivores: Clarias fuscus, Siniperca chuatsi, Culter dabryi, Culter alburnus, Erythroculter dabryi, Erythroculter oxycephaloides and Culter oxycephaloides; omnivores: Xenocypris microlepis, Distoechodon tumirostris, Luciobarbus capito and Spinibarbus sinensis). Dietary data were collected by searching the relevant literature and then examining citations in the original studies [22,23]. All sampled fish were identified, counted, measured and weighed, and their feeding habits were classified according to the literature [24].
Muscle tissues were sampled from the dorsal of fish and cryopreserved in centrifugal tubes for further processing. Terrestrial detritus referred to dead leaves of dominant terrestrial plants, which were collected by hand from the riparian zone, and aquatic detritus referred to the organic matter on the surface of sediments. After collecting the mixed water of surface (within 10 m of the surface), middle (10–20 m below the surface) and bottom (20–30 m below the surface) layers using a 1L hydrophore at each site, the water samples were filtered onto pre-combusted glass fibre filters (Whatman GF/C) to obtain particulate organic matter (POM). Samples of sediment and benthic animals were harvested with a Peterson mud digger. Later, benthic species identified were placed in distilled water overnight to empty the digestive tract of residues [25]. In order to acquire adequate sample tissue for analysis, benthic animals of the same species were pooled together. POM and sediment samples were acidified with 1 mol L−1 hydrochloric acid to remove the effects of carbonate contamination. Phytoplankton and zooplankton samples were collected through 64-μm and 112-μm plankton nets, respectively. The attached algae were scraped directly from stones along the shore using soft toothbrushes, and then rinsed with distilled water repeatedly to remove sediment particles and detritus [26]. All samples for stable isotope analyses were dried at 60 °C to a constant weight and ground into a fine powder with a bead mill type tissue grinder (MiniBeadbeater-16, Glen Mills, Inc., California, USA) in the laboratory [27].
2.3. Analysis of Stable Isotopes
The δ13C and δ15N values were measured using a Delta Plus mass spectrometer coupled to a Carloerba NC 2500 elementary analyzer. Stable isotope ratios are defined as parts per thousand (‰) according to the equation:, where X represents the corresponding ratio 13C/12C or 15N/14N and R represents 13C or 15N. The standard values of carbon (δ13C) and nitrogen (δ15N) isotopes were based on VPDB (Pee Dee Belemnite) and atmospheric N2, respectively [12]. The internationally used standard substance were IAEA-USGS24 and IAEA-USGS26.
In this study, all kinds of fish captured were the core components of the food web in the Ganjing River. According to feeding differentiation of fish species, we integrated potential food sources into seven major groups, including attached algae (A), POM (P), aquatic macrophyte (M), terrestrial detritus (DT), aquatic detritus (DA), zooplankton (ZP) and zoobenthos (ZB) for model construction. Trophic enrichment factor (TEF), caused by isotope fractionation during the process of digestion and metabolism, were Δδ13C = 0.40 ± 1.20 ‰ and Δδ15N = 3.4 ± 0.50 ‰ to correct stable isotopes values of food sources [11].
In order to really reflect the food web structure and characteristics in the Ganjing River, this paper also used BIMM developed by Kadoya [16], combined with the measured isotope values of samples to carry out diet prediction analysis and food web construction. Then, the gut content analysis (GCA) food web was compared with the stable isotope analysis (SIA) food web. BIMM model fitting was implemented by using the “R2WinBugs” package in R version (4.0.1). The diet matrix (P) and diet dependency matrix (D) were calculated according to the following equation [28]:
where is flow matrix, excluding flows to and from external; Ti is total inflows to compartment i (i = n + 1, usable export from the network; i = n + 2, unusable export from the network), excluding inflow from external sources; and I is identity matrix and its elements. The correlation level between the GCA diet matrix and the SIA diet matrix was estimated using Mantel tests in “Cultevo” package. The accuracy of the model was determined by comparing the difference between the isotopic values of samples and the predicted values of the model (Figure S1). All data processing, analysis and graphics production were carried out in R software.
3. Results
In total, 339 consumer and 195 basal food source samples were collected during the dry and wet seasons for carbon and nitrogen isotope ratios analysis, respectively. The stable isotope data of fish species (17 species in the dry season and 24 species in the wet season) fell within the isotopic mixing space determined by seven potential sources in both seasons, indicating that the carbon sources tested were the most probable food sources for consumers, and no significant collinearity was found among consumers, which was suitable for further analysis of food sources for consumers. We found that the δ13C values of most of fish we collected were higher in dry season than those in wet season, while the δ15N values were lower in dry season than those in wet season (Figure 2).
3.1. GCA Food Web
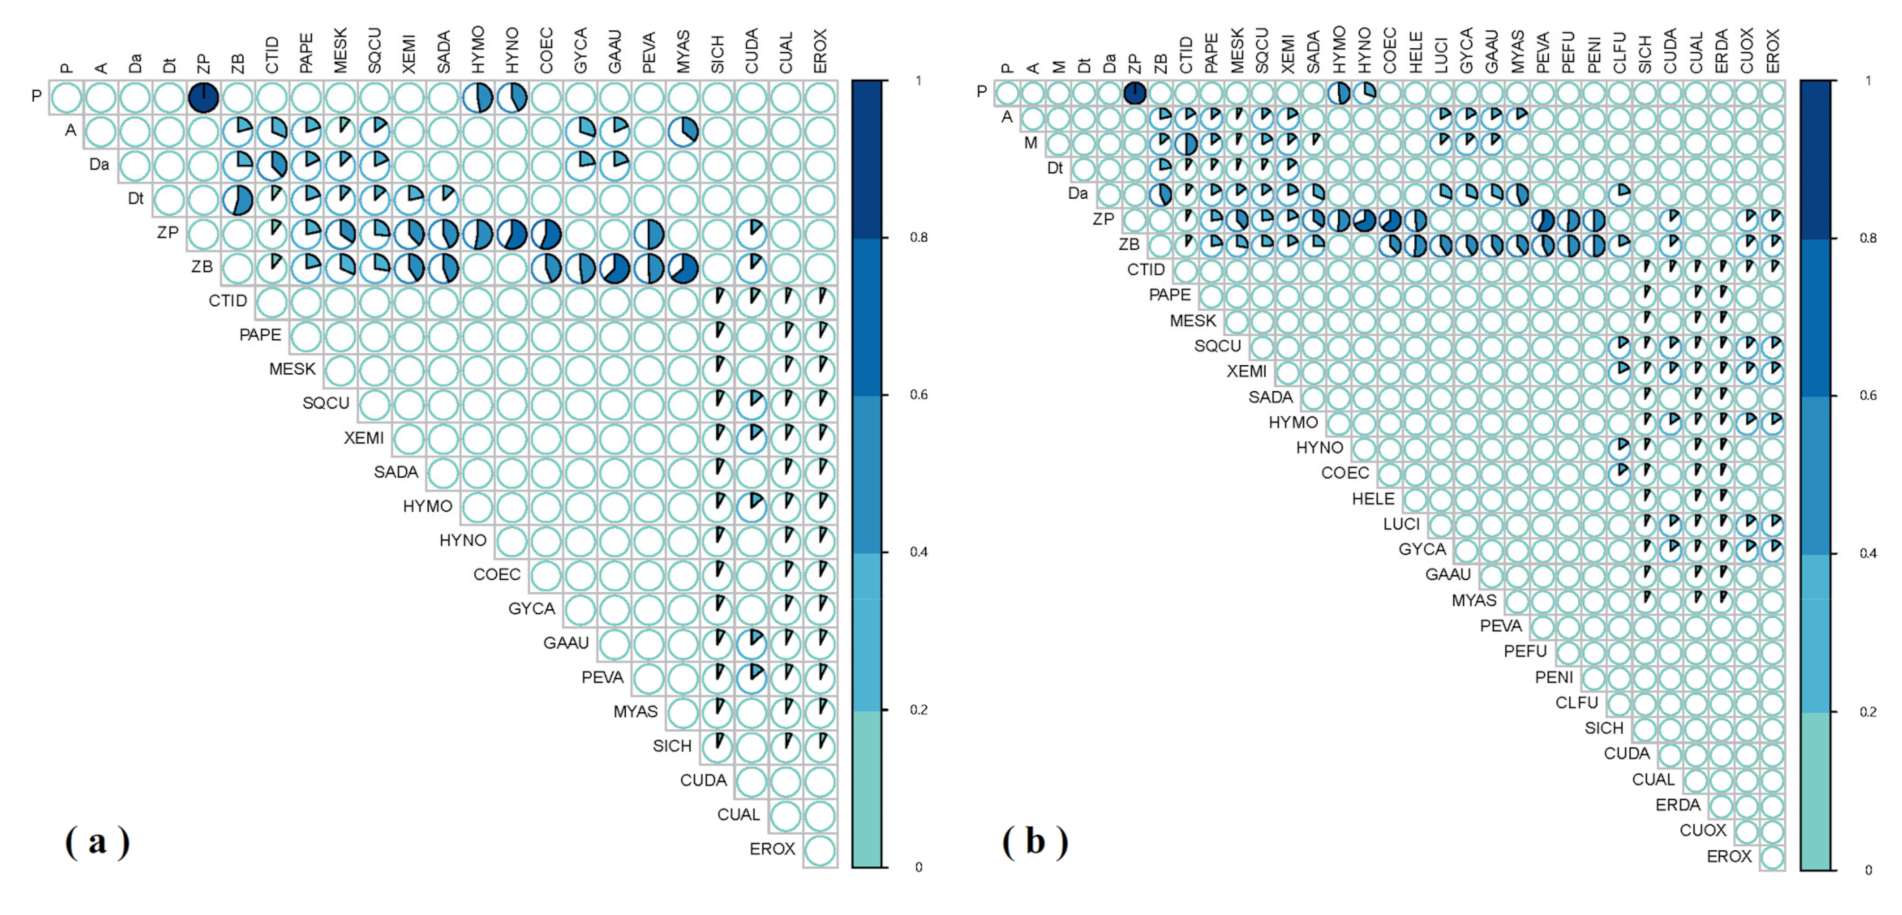
Based on the diet data of fish in the Three Gorges Reservoir, we constructed the GCA diet matrix and diet dependency matrix of food web in the Ganjing River (Figure 3 and Figure 4). Results from diet matrix revealed that among seven basal food sources, aquatic detritus, zooplankton and zoobenthos were the major food sources supporting the biomass of herbivores, planktivores and benthivores fish, respectively, during the dry season, and attached algae and terrestrial detritus made corresponding contributions to consumers. However, during the wet season, herbivores fish switch to primarily depend on aquatic macrophyte, while aquatic detritus accounted for a smaller proportion of food sources in fish diet and terrestrial detritus accounted for a larger proportion (Figure 3). According to the diet dependency matrix, dietary compositions varied from one predator to another in present study (Figure 4). In the dry season, the dependence of H. molitrix, H. nobilis and C. ectenes taihuensis on POM was higher than 90%. C. idellus, P. pekinensis, M. skolkovii and S. curriculus were more dependent on aquatic detritus (up to 80%). Species of X. microlepis, H. nobilis and C. ectenes taihuensis depended mostly on zooplankton (80–90%) and C. carpio, C. auratus, P. vachelli, M. asiaticus and C. dabryi assimilated large quantities of zoobenthos (up to 85–95%). During the wet season, dependence on POM was extremely high in H. molitrix, H. nobilis, C. heterodon and H. leucisculus, reaching more than 95%. C. idellus, P. pekinensis, M. skolkovii, S. curriculus and X. microlepis relied more heavily on aquatic macrophyte (up to 80%). Species of H. nobilis, C. ectenes taihuensis and H. leucisculus mostly assimilated zooplankton (80–90%) and C. carpio, C. auratus, P. vachelli, M. asiaticus, C. dabryi, P. fulvidraco and P. nitidus mainly depended on zoobenthos (up to 85–95%). However, food sources of consumers were little depended on terrestrial detritus and attached algae in both seasons.
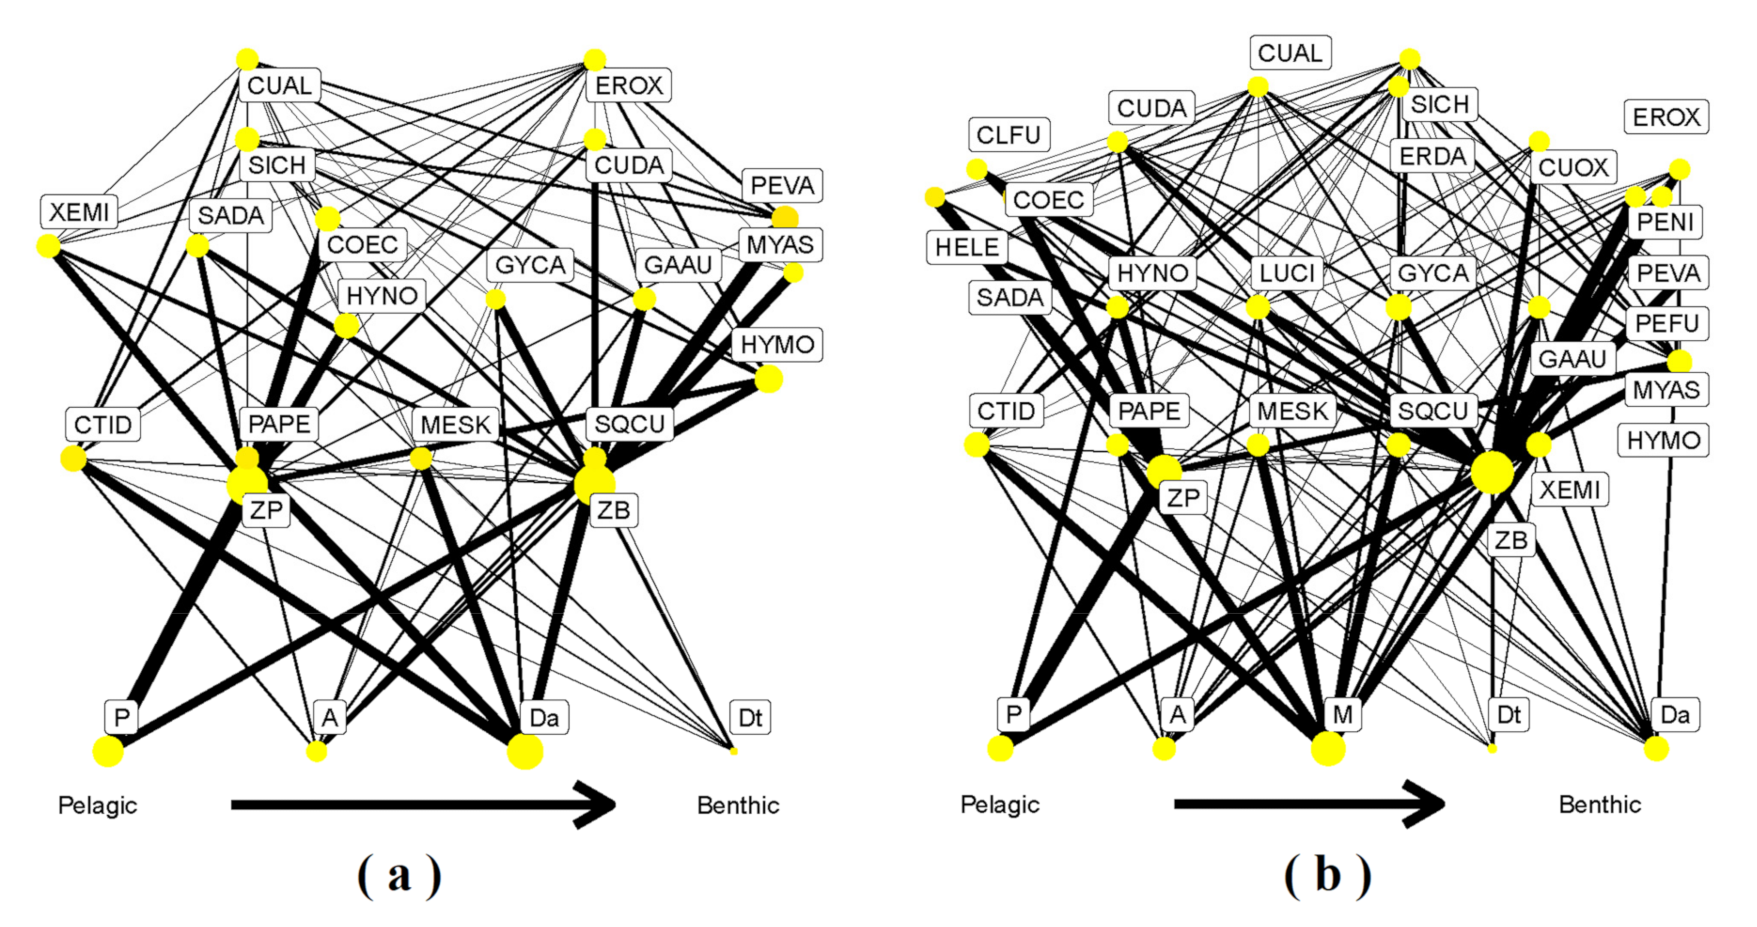
On the basis of the GCA diet matrix, we constructed the GCA food web in the Ganjing River (Figure 5). The point we primarily focused on was how tight the links were among the components. During the dry season, it was noticeable that POM, zooplankton, aquatic detritus and zoobenthos were the core components of the food web, which indicated that all of them played an important role in the food web, effectively linking primary producers and consumers. However, results showed that attached algae and terrestrial detritus appeared less important for consumers because of the low degree of linkage with species. In practical terms, it meant these two food sources (attached algae and terrestrial detritus) account for a small proportion of consumers’ diet. Furthermore, H. molitrix, H. nobilis, C. ectenes taihuensis, C. carpio, C. auratus and S. dabryi were of the secondary importance in the food web, and the degree of linkage with the core components was relatively strong, acting as an important intermediary in the transport of substances in the food web. Therefore, it can be found that the food web consisted of two major trophic chains based on diet analysis during the dry season in the Ganjing River, namely, the planktonic food chain which was relatively important from attached algae, zooplankton to H. molitrix, H. nobilis and other primary consumers and the benthic food chain from aquatic detritus, zoobenthos to omnivorous fish.
During the wet season, POM, zooplankton, zoobenthos and aquatic macrophyte were the core components of the food web, which effectively linked primary producers and primary consumers. Similar to the dry season, the results revealed that attached algae and terrestrial detritus were so poorly linked to other consumers that they did not appear to be of great importance in the food web. Besides, C. idellus, M. skolkovii, X. microlepis and C. auratus were subdominant in the food web, and had a high degree of linkage with the core components. Therefore, the food web was composed of three major trophic chains based on diet analysis during the wet season in the Ganjing River, namely, the planktonic food chain from POM, zooplankton to H. leucisculus, C. ectenes taihuensis and H. nobilis, the herbivorous food chain from aquatic macrophyte to C. idellus, M. skolkovii and P. pekinensis, and the benthic food chain from aquatic detritus, zoobenthos to benthivores fish (P. fulvidraco, C. carpio and C. auratus). The planktonic food chain was relatively important. Comparing the dry and wet seasons, we found significant differences in predator–prey connections (Figure 5). The addition of fish species to the food web during the wet season further complicated the linkages among consumers.
3.2. SIA Food Web
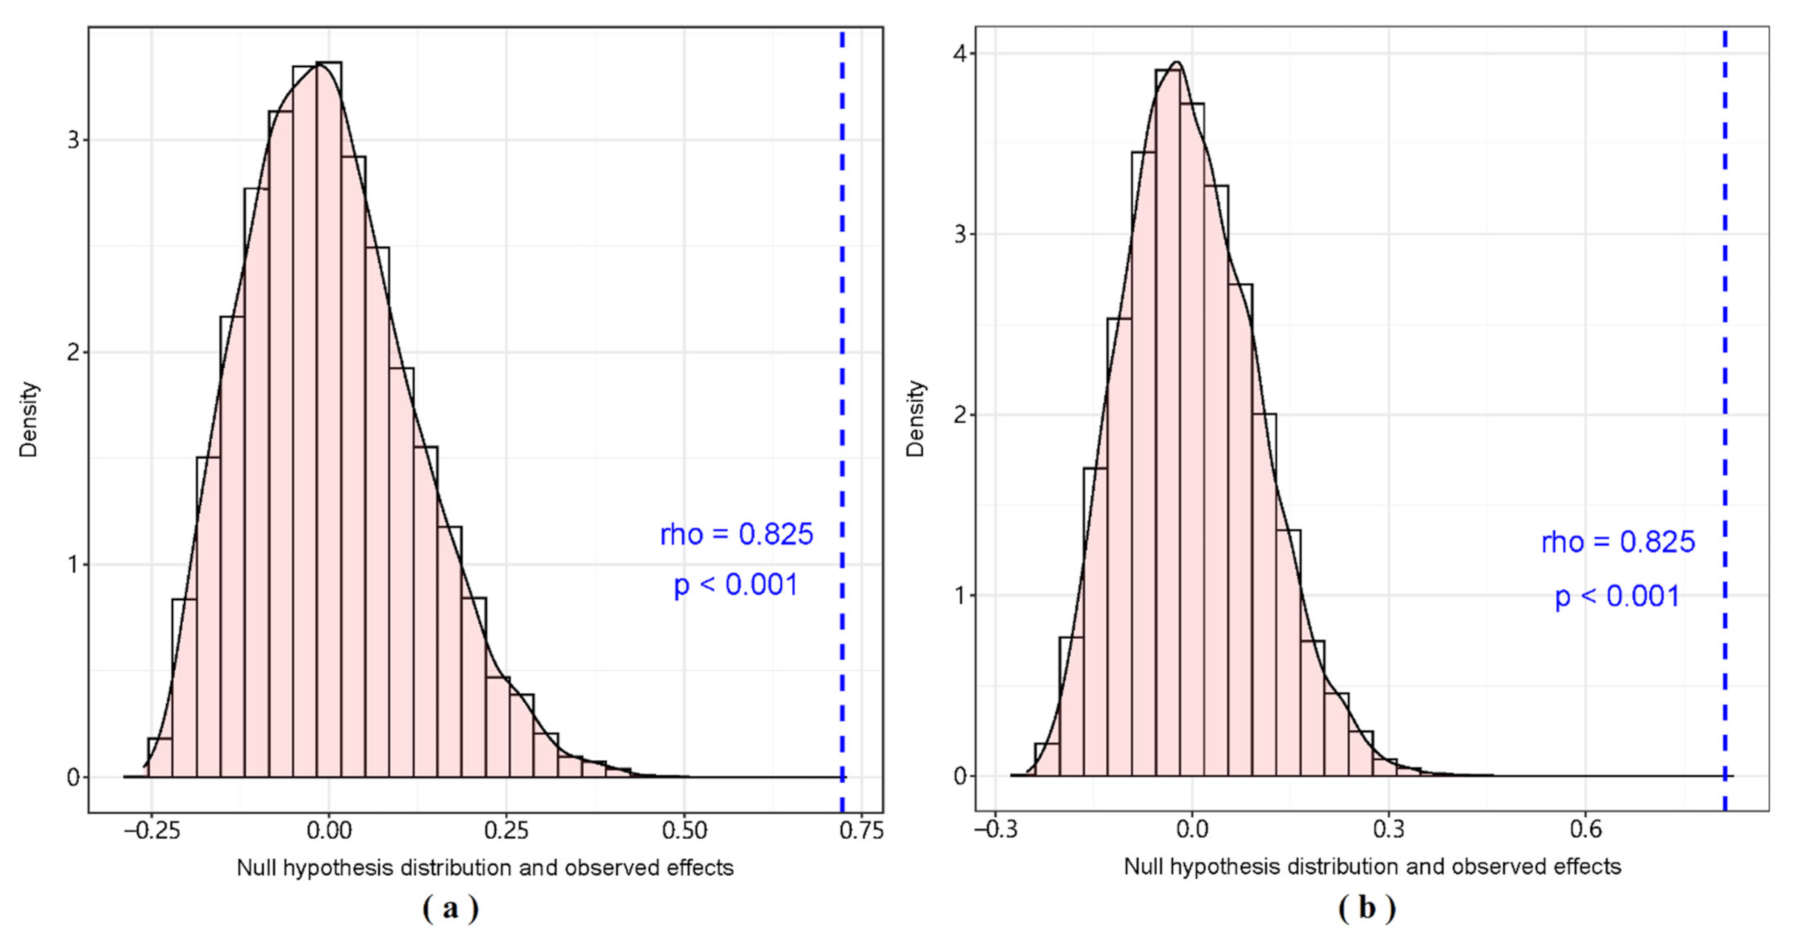
The observed isotope values of samples were brought into the BIMM for diet predicted analysis of each component in the food web, and the predicted diet matrix and food web were constructed (Figure 6 and Figure 7). The GCA diet matrix was compared with the SIA diet matrix to analyse correlation. Result demonstrated that strong correlation was observed between the two diet matrixes, which indicated that there had the very high consistency between the consumers’ diet and the predicted diet based on BIMM in the food web (p < 0.001, Figure 8).
Results from the SIA diet matrix showed that zooplankton and zoobenthos were the major food sources of fish in the Ganjing River, followed by aquatic macrophyte and POM, which were consistent with the GCA diet matrix. Besides, the SIA food web showed that during the dry season, the planktonic food chain from POM to zooplankton to planktivore fish was dominant in the food web, whereas the benthic food chain from aquatic detritus to zoobenthos and finally to omnivorous fish was relatively less important. During the wet season, the planktonic food chain from POM to zooplankton to planktonic fish was dominant in the food web, followed by the herbivorous food chain from aquatic macrophyte to herbivorous fish, and the benthic food chain from aquatic detritus to zoobenthos and finally to benthivores fish had lower relative importance. Additionally, H. molitrix, H. nobilis and zooplankton had a high degree of connection in the planktonic food web during the dry season, so did C. idellus, M. skolkovii and zooplankton during the wet season, which manifested that the GCA food web agreed well with the SIA food web.
4. Discussion
Rivers around the world are increasingly going through different ways of modification and hydrological regulation to provide services ranging from flood control to power generation [29,30]. In addition, under the influence of monsoon climate, precipitation has apparent seasonal and interannual variations in China, which makes the river flow show a certain periodicity. All these can cause change in water level of rivers. Seasonal water level fluctuations are a key factor affecting ecosystem function, although other potential factors such as ambient temperature and day length also play roles. Numerous environmental factors (such as water temperature, dissolved oxygen concentration, water velocity and nutrient concentration, etc.) and biological factors (such as primary production, organic carbon contents and fish densities, etc.) are affected by changes in water level [31,32,33]. Fishes that survive in it play a quite important role in ecosystems, which are the crucial link between the littoral zone and the deep water in food webs [34]. However, related researches showed that the regulation of water level in the Yangtze River basin has affected the diversity of fish species [4].
Water-level fluctuations may contribute to the exchange of matter and energy between the water body and the terrestrial sources in the littoral zone of the rivers [35], and thus change the basal food sources supporting the food web. In the present study, we have concluded that the contributions of endogenous and exogenous carbon to consumers were different in different hydrological periods. Basal resources for major consumers were endogenous carbon sources such as POM, zooplankton and benthic animals during the dry season in the Ganjing River, which was consistent with the finding that food web in the shallow turbid lakes relied largely on phytoplanktonic carbon sources, rather than terrestrial materials [36]. In the wet season, floods could expose fish consumers to a greater abundance and diversity of food sources [10,31,37]. Terrestrial organic sources were absorbed by terrestrial vegetation in dissolved form and enter the food web [38,39]. However, the relative availability of endogenous carbon to consumers is affected by low light and low temperatures that limit phytoplankton production during winter and spring [40]. Thus, the contribution of exogenous materials such as terrestrial detritus to fish increased during the wet season in the Ganjing River. Although the contribution of terrestrial detritus to aquatic consumers increased during the wet season, the contribution of terrestrial detritus and attached algae remained relatively low compared to other important carbon sources such as plankton and benthic organisms, which may be associated with the low production of these two sources, and thus insufficient to maintain the biomass of species.
As a continuous variable, trophic levels contain the dynamic changes of the populations and predator–prey relationships to provide a crucial framework for studying the interrelations among species and energy transfer and transfer efficiency in ecosystems [11,41]. In the river ecosystem researches, stable nitrogen isotope is usually used to construct the food web structure and to evaluate the trophic position of organisms [33,42,43]. Our results indicated the δ15N values of fish species showed significant seasonal variations in the Ganjing River, which may be related to different food sources. An increase of δ15N values in most fish species from the wet season to the dry season were of great significance for the piscivores and omnivores species. The trophic levels of fish in the dry season were greater than that in the wet season because of the limited sources of animal food items in the low water period. During the dry season, gradual drying up of floodplains led to an increase in fish densities, and predator–prey interactions among species intensified as habitat diminished and resources availability decreased [32]. That led to an increase in piscivores fish during the dry season, which in turn caused an increase in the trophic levels of predators [10]. In contrast, during the wet season, the abundance and species diversity of fish were greater than that in the dry season (as shown in Table S1), which contributed to a more complex and interconnected food web. Since there was a large amount of biomass which was easy to obtain in the river, fish tended to feed on aquatic plants (e.g., aquatic macrophyte) with low δ15N value during the wet season, and thus exhibited low δ15N value [10]. Meanwhile, the larger water area allowed fish to spread their range more widely and reduce the risk of predation. Fish interactions may be limited by lower fish densities, so some piscivores species may be less selective, feeding on invertebrates or fish [44,45]. Furthermore, allochthonous and littoral sources were more varied and the contribution proportion of organic detritus increased as water level rose, so high levels of omnivory occurred in fish consumers [31]. Interestingly, it has been demonstrated that the addition of a certain intensity of omnivory can locally stabilize the food web [46].
Environmental factors affect the food web structure and function by changing the energy flow pathways and the trophic levels of populations [1]. The water-level fluctuation caused by natural or anthropogenic disturbance usually changes the freshwater ecosystem from a clear water state dominated by macrophyte to a turbid state dominated by phytoplankton [6,47,48], which has notable deleterious impacts on aquatic organisms (e.g., survival of attached algae and distribution of invertebrates) [49,50]. According to our findings, several studies have also demonstrated that dramatic changes in water state were likely to alter the connections among consumers in the food web and may lead to changes in the dietary structure of organisms that could choose alternative energy channel to replace or increase food sources [51,52]. After the regime shift in the Ganjing River, the carbon sources for consumers became more abundant as the biomass of aquatic plants and the contribution of terrestrial detritus increased during the wet season, thus earning energy subsidies to help stabilize the food web. With the increase of species abundance, the food web structure presented with a more complex form. Therefore, the trophic structure of the food web exhibited remarkable temporal heterogeneity in the Ganjing River owing to the strong seasonal changes in hydrological characteristics and the diversity of food sources. Hence, water level fluctuations can alter the diet composition by affecting the productivity of the basal resources and the available carbon sources for consumers, and further change the trophic relationship between predator and prey and the trophic structure of food web.
Supplementary Materials
The following are available online at https://www.mdpi.com/article/10.3390/w13172371/s1, Figure S1: Observed and predicted isotope values distribution of carbon and nitrogen in BIMM. (a) Dry season. (b) Wet season. There was no significant difference between the modelling predicted values of carbon and nitrogen isotopes and the observed values of samples, and the coincidence degree between two data was high, which indicated that the prediction effect of the model was very well, Table S1: Total sample size of fish in the Ganjing River.
Author Contributions
Conceptualization, J.X. (Jun Xu) and B.Z.; Data curation, Y.Q. and J.X. (Jiayi Xie); Investigation, W.L. and E.W.; Methodology, J.X. (Jun Xu); Writing—original draft, Y.Q. and J.X. (Jiayi Xie); Writing—review and editing, Y.Q. and J.X. (Jiayi Xie). All authors have read and agreed to the published version of the manuscript.
Funding
This research was funded by the National Key Research and Development Program of China (Grant No. 2017YFC0505305) and the National Key R and D Program of China (Grant No. 2018YFD0900904).
Institutional Review Board Statement
The animal study was reviewed and approved by the Ethics Committee of Institute of Hydroecology, Ministry of Water Resources and Chinese Academy of Sciences.
Data Availability Statement
Data was contained within the article or Supplementary Materials.
Acknowledgments
We are grateful to Dan Yu, Biao Xiong, Chang Zeng, Chengcheng Li and Zhigang Chen for help in sampling.
Conflicts of Interest
The authors declare no conflict of interest.
References
- Dudgeon, D.; Arthington, A.H.; Gessner, M.O.; Kawabata, Z.-I.; Knowler, D.J.; Lévêque, C.; Naiman, R.J.; Prieur-Richard, A.-H.; Soto, D.; Stiassny, M.L.J.; et al. Freshwater biodiversity: Importance, threats, status and conservation challenges. Biol. Rev. 2006, 81, 163–182. [Google Scholar] [CrossRef] [PubMed]
- Naselli-Flores, L.; Barone, R. Importance of water-level fluctuation on population dynamics of cladocerans in a hypertrophic reservoir (Lake Arancio, south-west Sicily, Italy). Hydrobiologia 1997, 360, 223–232. [Google Scholar] [CrossRef]
- Wantzen, K.M.; Rothhaupt, K.-O.; Mörtl, M.; Cantonati, M.; G.-Tóth, L.; Fischer, P. Ecological effects of water-level fluctuations in lakes: An urgent issue. Hydrobiologia 2008, 613, 1–4. [Google Scholar] [CrossRef] [Green Version]
- Fu, C.; Wu, J.; Chen, J.; Wu, Q.; Lei, G. Freshwater fish biodiversity in the Yangtze River basin of China: Patterns, threats and conservation. Biodivers. Conserv. 2003, 12, 1649–1685. [Google Scholar] [CrossRef]
- Reidy, L.C.; Christer, N.; James, R.; Ng, R.Y. Implications of dam obstruction for global freshwater fish diversity. Bioscience 2012, 62, 539–548. [Google Scholar]
- Mao, Z.; Gu, X.; Cao, Y.; Luo, J.; Jeppesen, E. Pelagic energy flow supports the food web of a shallow lake following a dramatic regime shift driven by water level changes. Sci. Total Environ. 2020, 756, 143642. [Google Scholar] [CrossRef] [PubMed]
- Wang, Y.; Yu, X.; Li, W.; Xu, J.; Chen, Y.; Fan, N. Potential influence of water level changes on energy flows in a lake food web. Chin. Sci. Bull. 2011, 56, 2794–2802. [Google Scholar] [CrossRef] [Green Version]
- Atwood, T.B.; Wiegner, T.N.; MacKenzie, R.A. Effects of hydrological forcing on the structure of a tropical estuarine food web. Oikos 2012, 121, 277–289. [Google Scholar] [CrossRef]
- Liu, J.K. Lakes of the middle and lower basins of the Chang Jiang (China). In Lakes and Reservoirs; Elsevier: Amsterdam, The Netherlands, 1984. [Google Scholar]
- Wantzen, K.M.; Machado, F.D.A.; Voss, M.; Boriss, H.; Junk, W.J. Seasonal isotopic shifts in fish of the Pantanal wetland, Brazil. Aquat. Sci. 2002, 64, 239–251. [Google Scholar] [CrossRef]
- Post, D.M. Using Stable Isotopes to Estimate Trophic Position: Models, Methods, and Assumptions. Ecology 2002, 83, 703–718. [Google Scholar] [CrossRef]
- Xu, J.; Wen, Z.; Ke, Z.; Zhang, M.; Ping, X. Contrasting energy pathways at the community level as a consequence of regime shifts. Oecologia 2014, 175, 231–241. [Google Scholar] [CrossRef] [Green Version]
- Compson, Z.G.; Monk, W.A.; Hayden, B.; Bush, A.; O’Malley, Z.; Hajibabaei, M.; Porter, T.M.; Wright, M.T.; Baker, C.J.; Manir, M.S.A.; et al. Network-Based Biomonitoring: Exploring Freshwater Food Webs With Stable Isotope Analysis and DNA Metabarcoding. Front. Ecol. Evol. 2019, 7, 395. [Google Scholar] [CrossRef] [Green Version]
- Kaymak, N.; Winemiller, K.O.; Akin, S.; Altuner, Z.; Polat, F.; Dal, T. Stable isotope analysis reveals relative influences of seasonal hydrologic variation and impoundment on assimilation of primary production sources by fish in the Upper Yesilırmak River, Turkey. Hydrobiologia 2015, 753, 131–147. [Google Scholar] [CrossRef]
- Hopkins, J.B.; Ferguson, J.M.; Lyle, K. Estimating the Diets of Animals Using Stable Isotopes and a Comprehensive Bayesian Mixing Model. PLoS ONE 2012, 7, e28478. [Google Scholar] [CrossRef]
- Kadoya, T.; Osada, Y.; Takimoto, G. IsoWeb: A Bayesian Isotope Mixing Model for Diet Analysis of the Whole Food Web. PLoS ONE 2012, 7, e41057. [Google Scholar] [CrossRef] [PubMed] [Green Version]
- Erhardt, E.B.; Bedrick, E.J. A Bayesian framework for stable isotope mixing models. Environ. Ecol. Stat. 2013, 19, 377–397. [Google Scholar] [CrossRef]
- Bao, Y.; Gao, P.; He, X. The water-level fluctuation zone of Three Gorges Reservoir—A unique geomorphological unit. Earth Sci. Rev. 2015, 150, 14–24. [Google Scholar] [CrossRef]
- Zhang, Q.; Lou, Z. The environmental changes and mitigation actions in the Three Gorges Reservoir region, China. Environ. Sci. Policy 2011, 14, 1132–1138. [Google Scholar] [CrossRef]
- Guo, W.X.; Wang, H.X.; Jian-Xin, X.U.; Xia, Z.Q. Ecological operation for Three Gorges Reservoir. Water Sci. Eng. 2011, 4, 143–156. [Google Scholar] [CrossRef]
- Xiang, R.; Wang, L.; Li, H.; Tian, Z.; Zheng, B. Temporal and spatial variation in water quality in the Three Gorges Reservoir from 1998 to 2018. Sci. Total Environ. 2020, 768, 144866. [Google Scholar] [CrossRef]
- Ye, J. Studies in Community Composition and Feeding Ecology of Fish in the Littoral Zone of Mayliang Bay, Taihu Lake. Master Thesis, Huazhong Agricultural University, Wuhan, China, 2006. [Google Scholar]
- Ma, X.; Liu, C.; Liu, L.; Wang, Y.; Wang, J.; Zhang, Y. Study on the food web of fish in Baiyangdian lake based diet analysis. J. Hydroecol. 2011, 32, 85–90. [Google Scholar]
- Ding, R.H. The Fishes of Sichuan, China; Ding, R.H., Ed.; Sichuan Publishing House of Science and Technology: Chengdu, China, 1994. [Google Scholar]
- Eller, G.; Deines, P.; Grey, J.; Richnow, H.-H.; Krüger, M. Methane cycling in lake sediments and its influence on chironomid larval δ13C. FEMS Microbiol. Ecol. 2005, 54, 339–350. [Google Scholar] [CrossRef] [PubMed] [Green Version]
- Hamilton, S.K.; Lewis, W.M., Jr. Stable carbon and nitrogen isotopes in algae and detritus from the Orinoco River floodplain, Venezuela. Geochim. Cosmochim. Acta 1992, 56, 4237–4246. [Google Scholar] [CrossRef]
- Xu, J.; Wang, Y.; Wang, K.; Zeng, Q.; Zhang, M.; Zhang, H. Protocols for sample collection, pretreatment and preservation of aquatic organisms in stable isotope ecology. Acta Hydrobiol. Sin. 2020, 44, 989–997. [Google Scholar] [CrossRef]
- Kones, J.K.; Soetaert, K.; Oevelen, D.V.; Owino, J.O. Are network indices robust indicators of food web functioning? A Monte Carlo approach. Ecol. Model. 2009, 220, 370–382. [Google Scholar] [CrossRef]
- Nilsson, C.; Reidy, C.A.; Dynesius, M.; Revenga, C. Fragmentation and Flow Regulation of the World’s Large River Systems. Science 2005, 308, 405–408. [Google Scholar] [CrossRef] [Green Version]
- Best, J. Anthropogenic stresses on the world’s big rivers. Nat. Geosci. 2018, 12, 7–21. [Google Scholar] [CrossRef]
- Perga, M.-E.; Arfi, R.; Gerdeaux, D. Seasonal variations in fish δ13C and δ15N in two West African reservoirs, Sélingué and Manantali (Mali): Modifications of trophic links in relation to water level. Isot. Environ. Health Stud. 2005, 41, 109–123. [Google Scholar] [CrossRef] [PubMed]
- Winemiller, K.O.; Jepsen, D.B. Effects of seasonality and fish movement on tropical river food webs. J. Fish Biol. 1998, 53, 267–296. [Google Scholar] [CrossRef]
- Jepsen, D.B.; Winemiller, K.O. Structure of tropical river food webs revealed by stable isotope ratios. Oikos 2002, 96, 46–55. [Google Scholar] [CrossRef] [Green Version]
- Lundberg, J.G.; Kottelat, M.; Smith, G.R.; Gill, S.A.C. So Many Fishes, So Little Time: An Overview of Recent Ichthyological Discovery in Continental Waters. Ann. Mo. Bot. Gard. 2000, 87, 26–62. [Google Scholar] [CrossRef]
- Leira, M.; Cantonati, M. Effects of water-level fluctuations on lakes: An annotated bibliography. Hydrobiologia 2008, 613, 171–184. [Google Scholar] [CrossRef]
- Cremona, F.; Timm, H.; Agasild, H.; Tõnno, I.; Feldmann, T.; Jones, R.I.; Nõges, T. Benthic foodweb structure in a large shallow lake studied by stable isotope analysis. Freshw. Sci. 2014, 33, 885–894. [Google Scholar] [CrossRef] [Green Version]
- Roach, K.A.; Winemiller, K.O.; Layman, C.A.; Zeug, S.C. Consistent trophic patterns among fishes in lagoon and channel habitats of a tropical floodplain river: Evidence from stable isotopes. Acta Oecologica 2009, 35, 513–522. [Google Scholar] [CrossRef]
- Bartels, P.; Cucherousset, J.; Gudasz, C.; Jansson, M.; Karlsson, J.; Persson, L.; Premke, K.; Rubach, A.; Steger, K.; Tranvik, L.J.; et al. Terrestrial subsidies to lake food webs: An experimental approach. Oecologia 2012, 168, 807–818. [Google Scholar] [CrossRef] [PubMed]
- Scharnweber, K.; Syväranta, J.; Hilt, S.; Brauns, M.; Vanni, M.J.; Brothers, S.; Köhler, J.; Knežević-Jarić, J.; Mehner, T. Whole-lake experiments reveal the fate of terrestrial particulate organic carbon in benthic food webs of shallow lakes. Ecology 2014, 95, 1496–1505. [Google Scholar] [CrossRef] [PubMed] [Green Version]
- Schumann, R.; Hammer, A.; Görs, S.; Schubert, H. Winter and spring phytoplankton composition and production in a shallow eutrophic Baltic lagoon. Estuar. Coast. Shelf Sci. 2005, 62, 169–181. [Google Scholar] [CrossRef]
- Paine, R.T. Food Webs: Linkage, Interaction Strength and Community Infrastructure. J. Anim. Ecol. 1980, 49, 666–685. [Google Scholar] [CrossRef]
- Thorp, J.H.; Delong, M.D.; Greenwood, K.S.; Casper, A.F. Isotopic analysis of three food web theories in constricted and floodplain regions of a large river. Oecologia 1998, 117, 551–563. [Google Scholar] [CrossRef]
- Anderson, C.; Cabana, G. Estimating the trophic position of aquatic consumers in river food webs using stable nitrogen isotopes. J. N. Am. Benthol. Soc. 2007, 26, 273–285. [Google Scholar] [CrossRef]
- Lauzanne, L. Régimes alimentaires et relations trophiques des poissons du Lac Tchad. Cahiers ORSTOM Série Hydrobiologie 1976, 10, 267–310. [Google Scholar]
- Paugy, D.; Bénech, V. Les poissons d’eau douce des bassins côtiers du Togo (Afrique de l’Ouest). Revue d’Hydrobiologie Tropicale 1989, 22, 295–316. [Google Scholar]
- McCann, K.; Hastings, A. Re-Evaluating the omnivory-stability relationship in food webs. Proc. Biol. Sci. 1997, 264, 1249–1254. [Google Scholar] [CrossRef] [Green Version]
- Scheffer, M.; Nes, E.H.V. Shallow lakes theory revisited: Various alternative regimes driven by climate, nutrients, depth and lake size. Hydrobiologia 2007, 584, 455–466. [Google Scholar] [CrossRef] [Green Version]
- Ramstack Hobbs, J.M.; Hobbs, W.O.; Edlund, M.B.; Zimmer, K.D.; Theissen, K.M.; Hoidal, N.; Domine, L.M.; Hanson, M.A.; Herwig, B.R.; Cotner, J.B. The legacy of large regime shifts in shallow lakes. Ecol. Appl. 2016, 26, 2660–2674. [Google Scholar] [CrossRef] [PubMed]
- Lacoul, P.; Freedman, B. Environmental influences on aquatic plants in freshwater ecosystems. Environ. Rev. 2006, 14, 89–136. [Google Scholar] [CrossRef]
- Abrantes, K.G.; Sheaves, M. Importance of freshwater flow in terrestrial–aquatic energetic connectivity in intermittently connected estuaries of tropical Australia. Mar. Biol. 2010, 157, 2071–2086. [Google Scholar] [CrossRef]
- Scheffer, M.; Carpenter, S.; Foley, J.A.; Folke, C.; Walker, B. Catastrophic shifts in ecosystems. Nature 2001, 413, 591–596. [Google Scholar] [CrossRef]
- Rooney, N.; McCann, K.S. Integrating food web diversity, structure and stability. Trends Ecol. Evol. 2012, 27, 40–46. [Google Scholar] [CrossRef]
Figure 1.
The location of the Three Gorges Reservoir Region and the sampling sites in the Ganjing River. Samples were taken from the left and right banks of each monitoring site.
Figure 1.
The location of the Three Gorges Reservoir Region and the sampling sites in the Ganjing River. Samples were taken from the left and right banks of each monitoring site.

Figure 2.
Stable carbon and nitrogen isotopic signatures (mean ± SD) of basal food sources and consumers in the Ganjing River, corrected for trophic enrichment factor. Symbols with different colors and shapes represent different fish species and food sources. (a) During the dry season. CTID: C. idellus (n = 10); PAPE: P. pekinensis (n = 5); MESK: M. skolkovii (n = 10); SQCU: S. curriculus (n = 10); XEAR: X. argentea (n = 3); DITU: D. tumirostris (n = 4); HYMO: H. molitrix (n = 13); HYNO: H. nobilis (n = 15); COEC: C. ectenes taihuensis (n = 14); GYCA: C. carpio (n = 7); GAAU: C. auratus (n = 5); PEVA: P. vachelli (n = 5); SPSI: S. sinensis (n = 3); SICH: S. chuatsi (n = 4); CUDA: C. dabri (n = 5); CUAL: C. alburnus (n = 8); EROX: E. oxycephaloides (n = 8); P: POM (n = 22); A: attached algae (n = 21); Da: aquatic detritus (n = 10); Dt: terrestrial detritus (n = 4); ZP: zooplankton (n = 22); ZB: zoobenthos (n = 20). (b) During the wet season. CTID: C. idellus (n = 15); PAPE: P. pekinensis (n = 11); MESK: M. skolkovii (n = 15); SQCU: S. curriculus (n = 5); XEMI: X. microlepis (n = 5); SADA: S. dabryi (n = 7); HYMO: H. molitrix (n = 28); HYNO: H. nobilis (n = 20); COEC: C. ectenes taihuensis (n = 5); HELE: H. leucisculus (n = 6); LUCI: L. capito (n = 5); GYCA: C. carpio (n = 5); GAAU: C. auratus (n = 5); MYAS: M. asiaticus (n = 8); PEVA: P. vachelli (n = 10); PEFU: P. fulvidraco (n = 5); PENI: P. nitidus (n = 5); CLFU: C. fuscus (n = 5); SICH: S. chuatsi (n = 4); CUDA: C. dabryi (n = 5); CUAL: C. alburnus (n = 12); ERDA: E. dabryi (n = 13); CUOX: C. oxycephaloides (n = 3); P: POM (n = 27); A: attached algae (n = 12); M: aquatic macrophyte (n = 10); Da: aquatic detritus (n = 8); Dt: terrestrial detritus (n = 4); ZP: zooplankton (n = 20); ZB: zoobenthos (n = 15).

Figure 3.
The diet matrix of food web components during the dry season (a) and wet season (b) in the Ganjing River. The diagonal is food items, and the square edge is predators. The shades of blue and the degree of filled circles represent the percentage contribution of different food sources to consumers. The colour scale bar denotes the degree of prey percent contributions to consumers.

Figure 4.
The diet dependency matrix of food web components during the dry season (a) and wet season (b) in the Ganjing River, which estimates the direct and indirect dependence of consumers on food sources. The diagonal is food items, and the square edge is predators. The shades of green and degree of the filled square represent the predators’ dependence on the corresponding prey. The colour scale bar denotes the degree to which predators depend on its preys.

Figure 5.
Food web structure based on diet matrix during the dry season (a) and wet season (b) in the Ganjing River. The thickness of the line and sizes of the circle indicate the degree of trophic links, and thicker line and bigger circle manifest stronger trophic links between species.
Figure 5.
Food web structure based on diet matrix during the dry season (a) and wet season (b) in the Ganjing River. The thickness of the line and sizes of the circle indicate the degree of trophic links, and thicker line and bigger circle manifest stronger trophic links between species.

Figure 6.
Predicted diet matrix based on BIMM in the Ganjing River. (a) Dry season. (b) Wet season. The diagonal is food items, and the square edge is predators. The shades of blue and the degree of filled circles represent the percentage contribution of different food sources to consumers. The colour scale bar denotes the degree of prey percent contributions to consumers.

Figure 7.
Predicted food web based on BIMM in the Ganjing River. (a) Dry season. (b) Wet season. The thickness of the line and sizes of the circle indicate the degree of trophic links, and thicker line and bigger circle manifest stronger trophic links between species.
Figure 7.
Predicted food web based on BIMM in the Ganjing River. (a) Dry season. (b) Wet season. The thickness of the line and sizes of the circle indicate the degree of trophic links, and thicker line and bigger circle manifest stronger trophic links between species.

Figure 8.
Correlation analysis of diet matrix based on gut content analysis and diet matrix predicted by BIMM. (a) Dry season. (b) Wet season.
Figure 8.
Correlation analysis of diet matrix based on gut content analysis and diet matrix predicted by BIMM. (a) Dry season. (b) Wet season.

Publisher’s Note: MDPI stays neutral with regard to jurisdictional claims in published maps and institutional affiliations. |
© 2021 by the authors. Licensee MDPI, Basel, Switzerland. This article is an open access article distributed under the terms and conditions of the Creative Commons Attribution (CC BY) license (https://creativecommons.org/licenses/by/4.0/).
Share and Cite
MDPI and ACS Style
Que, Y.; Xie, J.; Xu, J.; Li, W.; Wang, E.; Zhu, B. Ecological Influences of Water-Level Fluctuation on Food Web Network. Water 2021, 13, 2371. https://doi.org/10.3390/w13172371
AMA Style
Que Y, Xie J, Xu J, Li W, Wang E, Zhu B. Ecological Influences of Water-Level Fluctuation on Food Web Network. Water. 2021; 13(17):2371. https://doi.org/10.3390/w13172371
Chicago/Turabian StyleQue, Yanfu, Jiayi Xie, Jun Xu, Weitao Li, Ezhou Wang, and Bin Zhu. 2021. "Ecological Influences of Water-Level Fluctuation on Food Web Network" Water 13, no. 17: 2371. https://doi.org/10.3390/w13172371
Note that from the first issue of 2016, this journal uses article numbers instead of page numbers. See further details here.