
Hydrological Responses of Watershed to Historical and Future Land Use Land Cover Change Dynamics of Nashe Watershed, Ethiopia


1
Faculty of Agriculture and Environmental Sciences, University of Rostock, Satower Str. 48, 18051 Rostock, Germany
2
Faculty of Civil and Environmental Engineering, Jimma Institute of Technology, Jimma University, Jimma 378, Ethiopia
*
Author to whom correspondence should be addressed.
Water 2021, 13(17), 2372; https://doi.org/10.3390/w13172372
Submission received: 2 August 2021
/
Revised: 23 August 2021
/
Accepted: 27 August 2021
/
Published: 29 August 2021
(This article belongs to the Special Issue Hydrological Processes in Small Catchments—Runoff and Sediment Yield in Changing Environment)
Abstract
:Land use land cover (LULC) change is the crucial driving force that affects the hydrological processes of a watershed. The changes of LULC have an important influence and are the main factor for monitoring the water balances. The assessment of LULC change is indispensable for sustainable development of land and water resources. Understanding the watershed responses to environmental changes and impacts of LULC classes on hydrological components is vigorous for planning water resources, land resource utilization, and hydrological balance sustaining. In this study, LULC effects on hydrological parameters of the Nashe watershed, Blue Nile River Basin are investigated. For this, historical and future LULC change scenarios in the Nashe watershed are implemented into a calibrated Soil and Water Assessment Tool (SWAT) model. Five LULC scenarios have been developed that represent baseline, current, and future periods corresponding to the map of 1990, 2005, 2019, 2035, and 2050. The predicted increase of agricultural and urban land by decreasing mainly forest land will lead till 2035 to an increase of 2.33% in surface runoff and a decline in ground water flow, lateral flow, and evapotranspiration. Between 2035 and 2050, a gradual increase of grass land and range land could mitigate the undesired tendency. The applied combination of LULC prognosis with process-based hydrologic modeling provide valuable data about the current and future understanding of variation in hydrological parameters and assist concerned bodies to improve land and water management in formulating approaches to minimize the conceivable increment of surface runoff.
1. Introduction
Land use land cover (LULC) change influences different fundamental features and processes such as hydrological, geomorphological, land productivity, and associated water resource systems in watersheds [1]. Changes of LULC have both long-term and short-term temporal and spatial impacts on watershed hydrology [2,3,4]. Topography and soil properties are more likely to result in short-term hydrologic variations. However, long-term changes like urbanization and deforestation, on the other hand, cause reductions in evapotranspiration and water recycling, which may result in reduced rainfall. Rainfall to runoff conversion is a complex, non-linear, time and space variable process. Runoff estimation in a watershed based on rainfall distribution is one of the most frequent analyses in hydrology [5]. LULC change may have an effect on the quality, quantity, distribution, and timing of water changes, which could affect a variety of water resource operations and managements, such as hydropower generation, irrigation, flood risk reduction, navigation, and a combination of these future water resource developments [6,7]. Therefore, it is important to investigate the impacts of LULC change on the hydrology of the catchment in order to address water resource operation and management issues.
To manage LULC and water resources effectively in a watershed, it is necessary to assess the historical, present, and potential future LULC dynamics [8]. The relations between LULC change and hydrological components have been conducted around the world and used to predict the impacts of future LULC on water resources [9,10]. Prediction and assessment of future watershed hydrology through advanced tools over a long period are very important to attain sustainable water resources at the catchment scale [11,12]. Modeling LULC change is used to identify where the change has, or will potentially occur [13]. Different hydrological simulation models are currently being utilized to simulate and project the impacts of LULC change on hydrological processes including Soil and Water Assessment Tool (SWAT), MIKE-system Hydrologic European (MIKE-SHE), Hydrologic Simulation Program-FORTRAN (HSPF), Dynamic Watershed Simulation Model (DWSM), Soil and Water Integrated Model (SWIM), and Distributed Hydrology Soil Vegetation Model (DHSVM) [14,15].
The simulation of various hydrological components and long term temporal scales, at watershed and sub-watershed levels, from small to large watershed sizes, and also the modelling of openness, readily and freely available data, minimum data input requirements from watersheds with poor data, and availability of graphical user interface are some of the significant factors considered in selecting the appropriate model to achieve the objectives of the study in the Nashe watershed [16]. Different model reviews conclude that SWAT can model the desired hydrological processes in more detail than many other watershed models [15] and simulates stream flow better than other hydrological models [17]. It is comprehensively used in Europe [18], North America [16], Australia [19], and Africa [20]. By testing it in different environments [14], the dynamic character of surface hydrological parameters in response to change of LULC can be indicated.
In several studies, SWAT is distinctively utilized for investigating the impacts of LULC change on hydrological processes in small and large watersheds [21,22,23]. It is also commonly used for modelling and analyzing hydrological processes in the context of changing LULC and land management, with high efficiency [24]. One study in the Wami River Basin, Tanzania [25] has been successfully performed in East Africa. In this region, factors such as soil type, seasonal rainfall, topography, social, political, demographic as well as economic issues together lead to great fluctuations in LULC, and these patterns are estimated to continue in the future [26]. Similarly, [20] conducted in East African watershed using SWAT model for assessment of water resources under land use impact and demonstrated an increment in surface runoff and decline in ground water recharge.
Accordingly, SWAT was implemented for this study based on the criteria specified for the Nashe watershed. Generally, SWAT is physically based, a spatially semi-distributed, daily time step parameter model designed to simulate all relevant parameters of a watershed—such as surface runoff, ground water, soil water, and lateral flow [27,28]. The studies conducted on the hydrological processes of watershed based on LULC change shows marked increase in rainy season flow and surface runoff potential in a given watershed that corresponds to the expansion of agricultural land and urban area at the decline of forest cover [2,29,30]. Authors [31] in Lake Tana and Beles watershed, [32] in Finchaa watershed, [33] in Hangar watershed, Ethiopia, and [34] in Rwanda have described the surface runoff increase because of the agricultural land expansion and decrease of forest covers.
Likewise, ground water flow decrease and surface runoff increase were also presented in Olifants basin South Africa, due to agricultural land and urban area expansion at the expenditure of range lands [24]. It is also reported by [35] in northeast Portugal, increases of lateral flow, evapotranspiration and decreases of surface runoff, and flow of ground water due to LULC change and afforestation scenario. In another study conducted by [36] in Ethiopia, Finchaa watershed, it was shown that surface runoff increment due to agricultural expansion and afforestation reduced surface runoff generation.
From African sub-Saharan countries, in Ethiopia, water resources are abundant for domestic use, production of agriculture, and hydropower generation. The available plentiful water resource potential is not being properly realized and translated into development because the country has significant problems related to water resources, such as flooding, deforestation, drought, land degradation, financial resources, and extreme hydrological variability [29]. The Blue Nile River Basin is one of the utmost diverse and significant river basins in Ethiopia. The Basin is serving as the largest tributary to the Nile River Basin, which is the basic water resource for the region and continent. It also contributes more than 60–70% of water to the Nile River, flowing through Sudan and Egypt [30]. Water from Ethiopian plateaus, particularly the Blue Nile River Basin has historically benefited downstream consumers in Egypt and Sudan in a variety of ways. Such benefits are now threatened due to dramatic changes in upstream land, water, and livestock management practices [37].
The Nashe watershed is the most productive area and contributes a large amount of water to the Blue Nile River Basin. Human-induced land degradation has occurred in the watershed, primarily as a result of agricultural expansion and urbanization [38]. Additionally, the fundamental problem in the Nashe watershed is the expansion of agricultural areas and urbanization at the expense of range land, forest land, and grass land—and this will also be expected to continue in the future [8]. Many people have been displaced and moved to available land areas within the watershed since the construction of the Nashe dam and have started agricultural activities on steep and marginal areas within and around the Nashe watershed which may have caused LULC changes. Some of these people relocated to urban areas and caused rapid urban expansion in the watershed [8]. As far as the author’s understanding, this is the first study focusing on watershed hydrology depending on historical and future LULC change effects on hydrological responses in the Nashe watershed, Ethiopia.
Therefore, determining the impacts of different time periods of LULC on the hydrological processes of the watershed and prioritization of the sub-basins will contribute to identifying strategies of hydrological response of the watershed. The study aimed to explore the historical and potential future LULC change impacts on the hydrological processes in the Nashe watershed, Blue Nile River Basin, Ethiopia. The following specific objectives were pursued to achieve the main objective: (i) to quantify and analyze the different characteristics of LULC change impacts on hydrological parameters at various Spatio-temporal scales; (ii) To develop LULC scenarios to explore the LULC change effect on hydrological parameters of the watershed.
To overcome this objective, LULC scenarios were developed depending on historical and potential future data to analyze the impacts of LULC change on water resources of the watershed. The findings obtained contribute useful information towards the enhancement of the current comprehension of hydrological parameter variation. Similarly, the findings are instructive for water resource planning and management measures aimed at reducing the negative effects of LULC change in the Nashe watershed.
The structure of this paper is as follows: The introduction of the study including the objective is described in the first section. The second section presents the study area including the data sets, hydrological modeling, sensitivity analysis, model calibration and validation, and model performance evaluation. In Section 3, a discussion of the most relevant results for land use land cover change, hydrological model performance evaluation, and hydrological responses to land use land cover change are provided. Finally, the conclusions of the study are described in Section 4.
2. Materials and Methods
2.1. Description of the Study Watershed
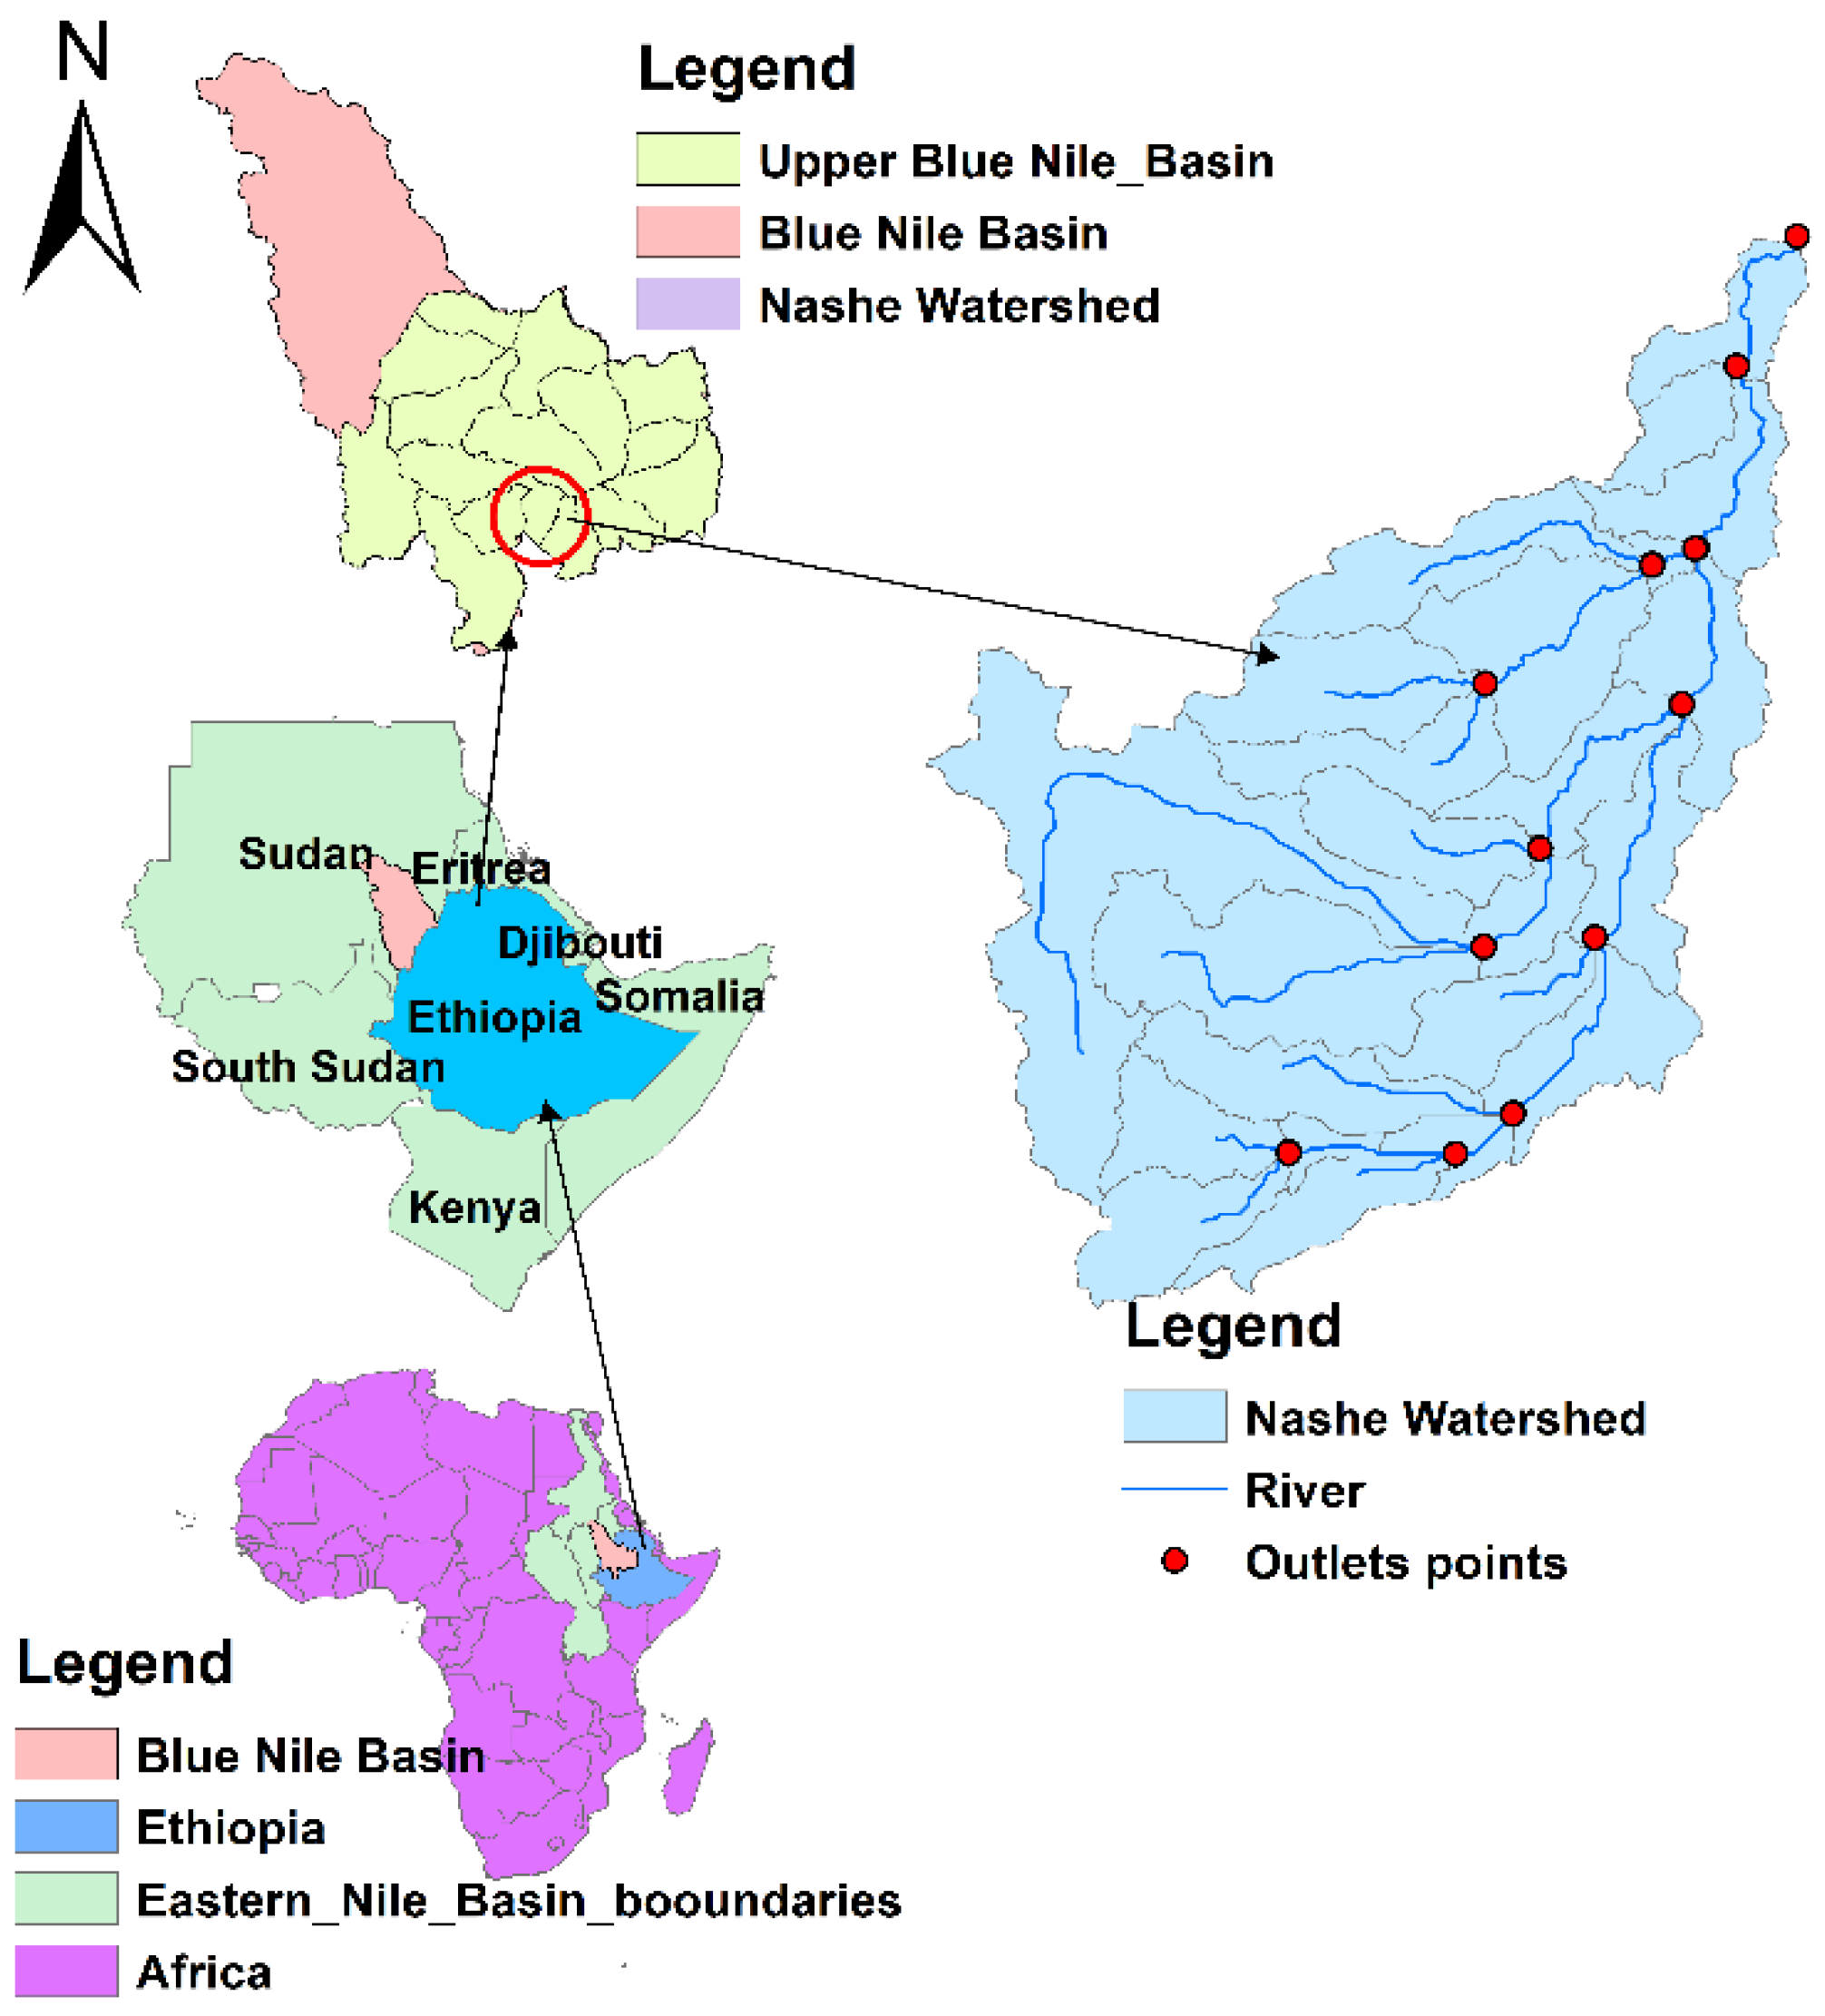
The Nashe catchment is the sub-basin of the Blue Nile River Basin, which is located in Oromia Regional state, Ethiopia. Geographically, the watershed is found between 9°35′ and 9°52′ N latitudes and 37°00′ to 37°20′ E longitudes (Figure 1). The watershed has an area of 945,78 km2 and administratively the area belongs to two woreda’s, Abay Chomen Woreda and Horo Woreda. The Nashe River valley starts on the highland plateau North-East of Shambu town and runs from west to east and then in the Northern direction. The valley elevation is above 2200 m, with the encompassing edges extending to over 2500 m. The watershed area varies in elevation from 1600 m in the lower plateau under the escarpment to hills and ridges of the highland, climbing to over 2500 m. The major sources of the Nashe River are the streams of Himane, Lege Ferso, and Abuna that drain swampy areas in the region of Bone Muleta. These streams form the Aseti River flow north and then south into the Nashe Valley.
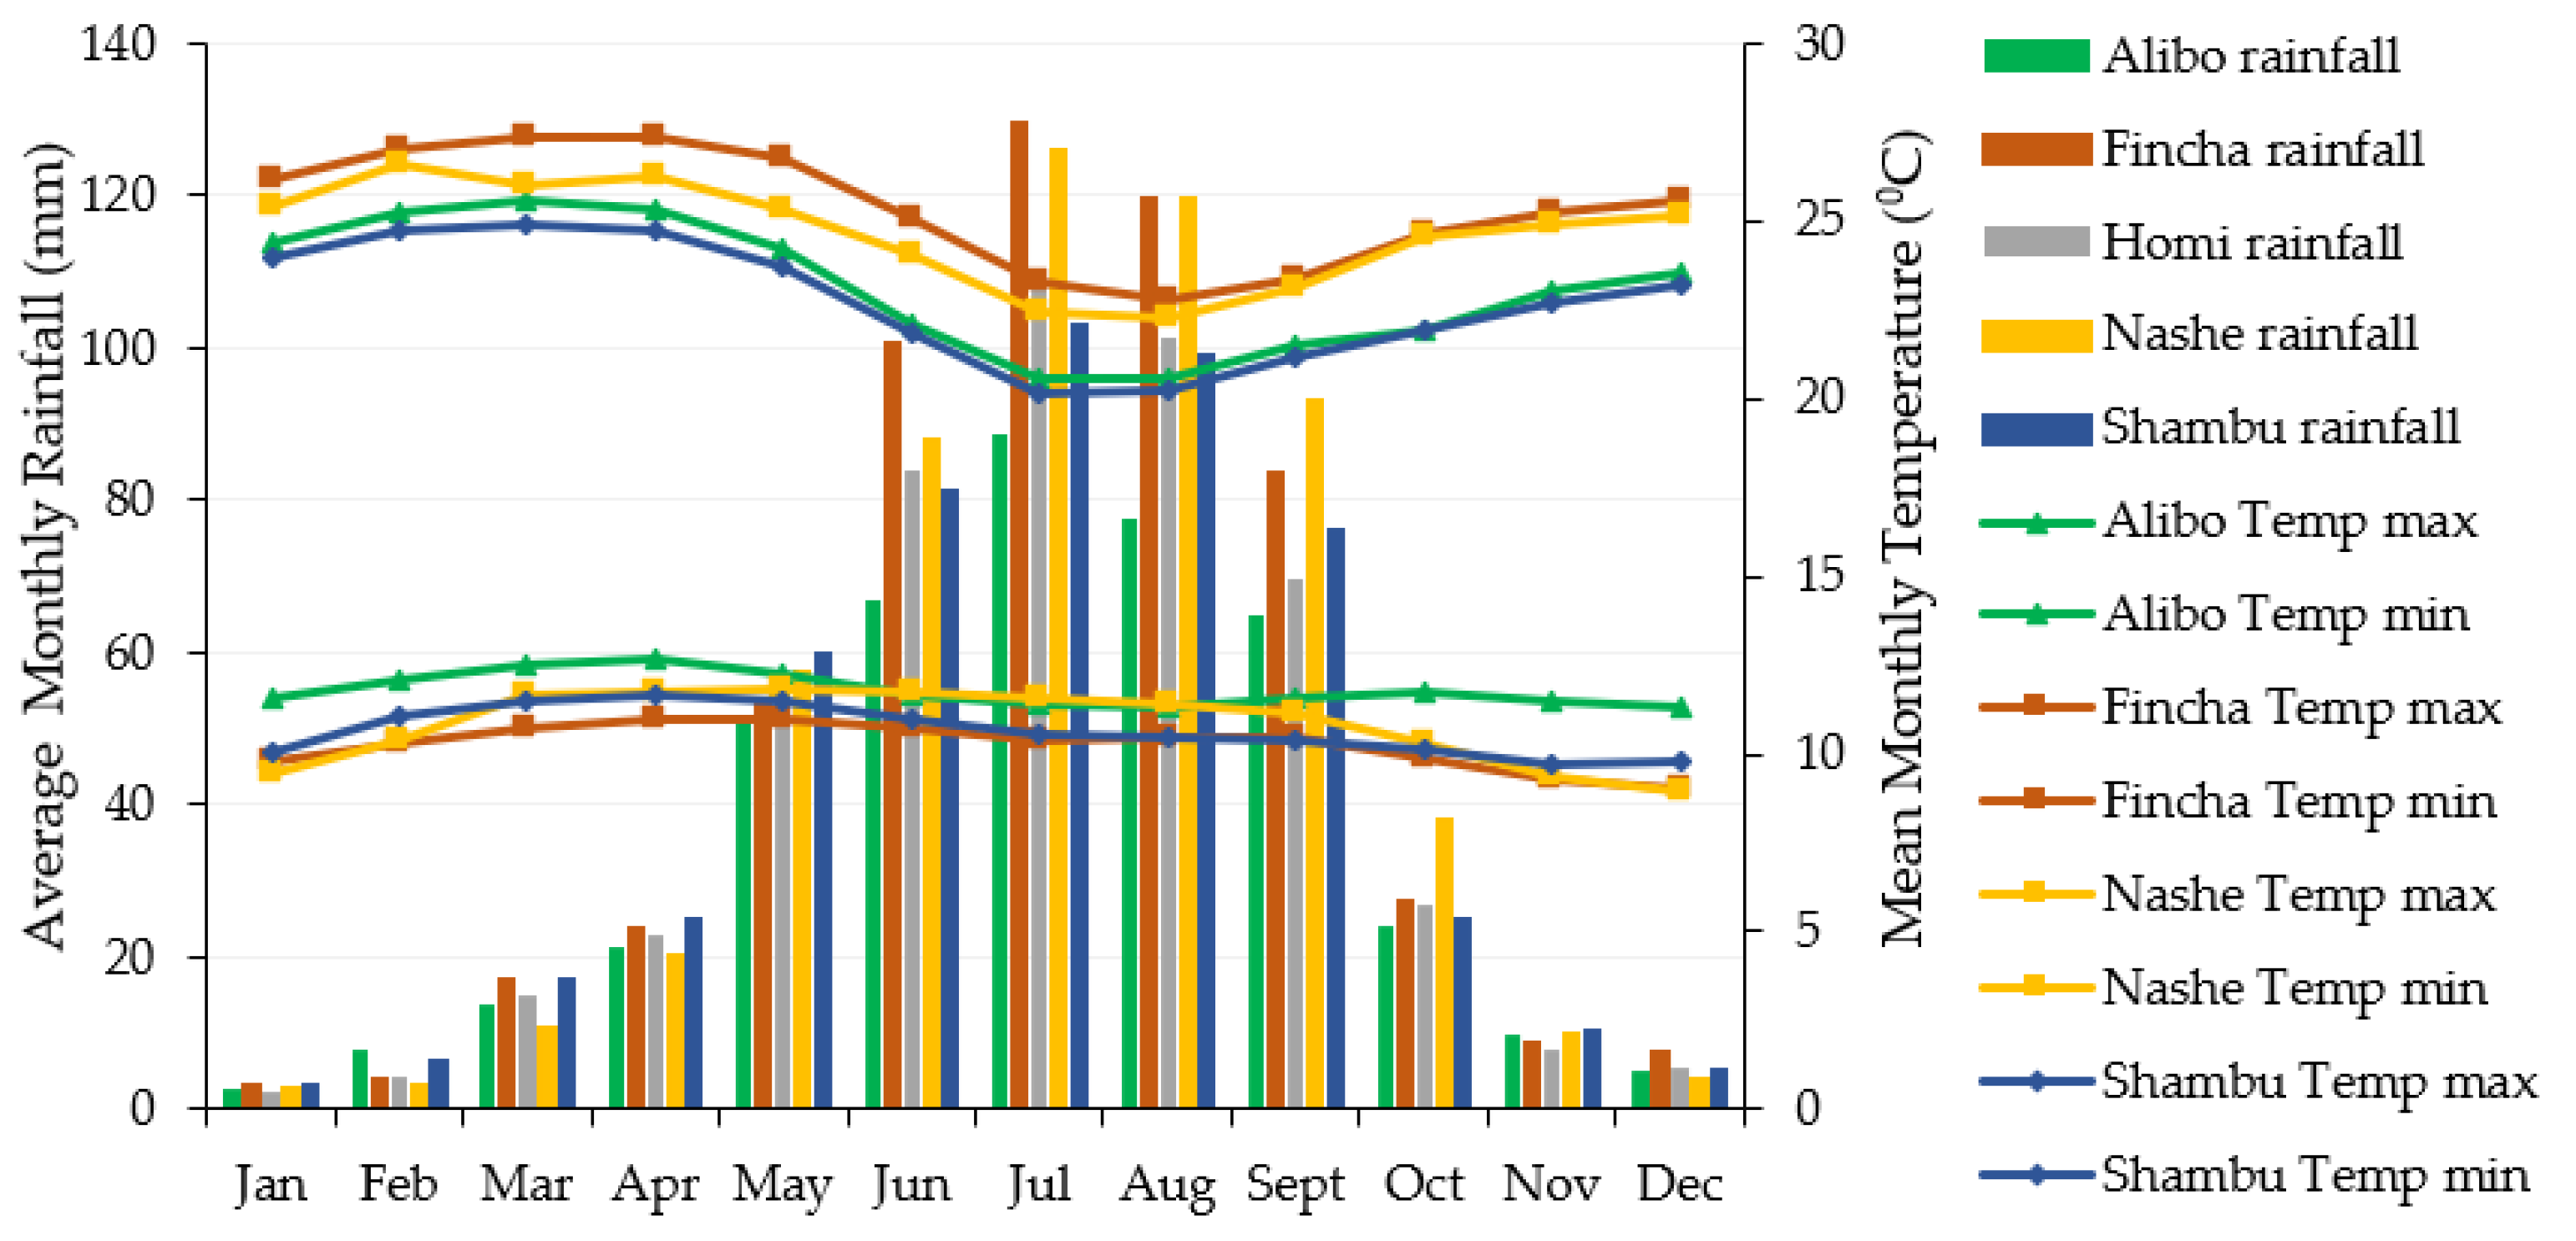
In the Nashe Swamp, the Aseti River meets the Babo Stream, which flows from the west. From this point downstream, the water is referred to as the Nashe River. The Nashe watershed rainfall varies from the maximum of 1600 mm per annum in the southern and western areas to 1200 mm per annum in the northern lowland areas, with June to September being the main rainy season. The average maximum and minimum temperature of the watershed ranges between 20.18–27.38 °C and 8.92–12.63 °C respectively. The average monthly rainfall and temperature features of the stations in the study watershed are depicted in Figure 2. The LULC categories of the watershed include forest land, range land, agricultural land, grass land, urban area, and water body. The soil types of the watershed include Haplic Alisols, Rhodic Nitosols, Haplic Arenosols, and Chromic Luvisols. A thick series of Mesozoic sedimentary layers covering the Precambrian foundation complex, largely overlain by Tertiary and Quaternary volcanic deposits dominates the geology of the area. Agriculture is the utmost significant economic activity and the major source of livelihood for the population and crop production is particularly concentrated in the main rainy season.
2.2. Model Input Data
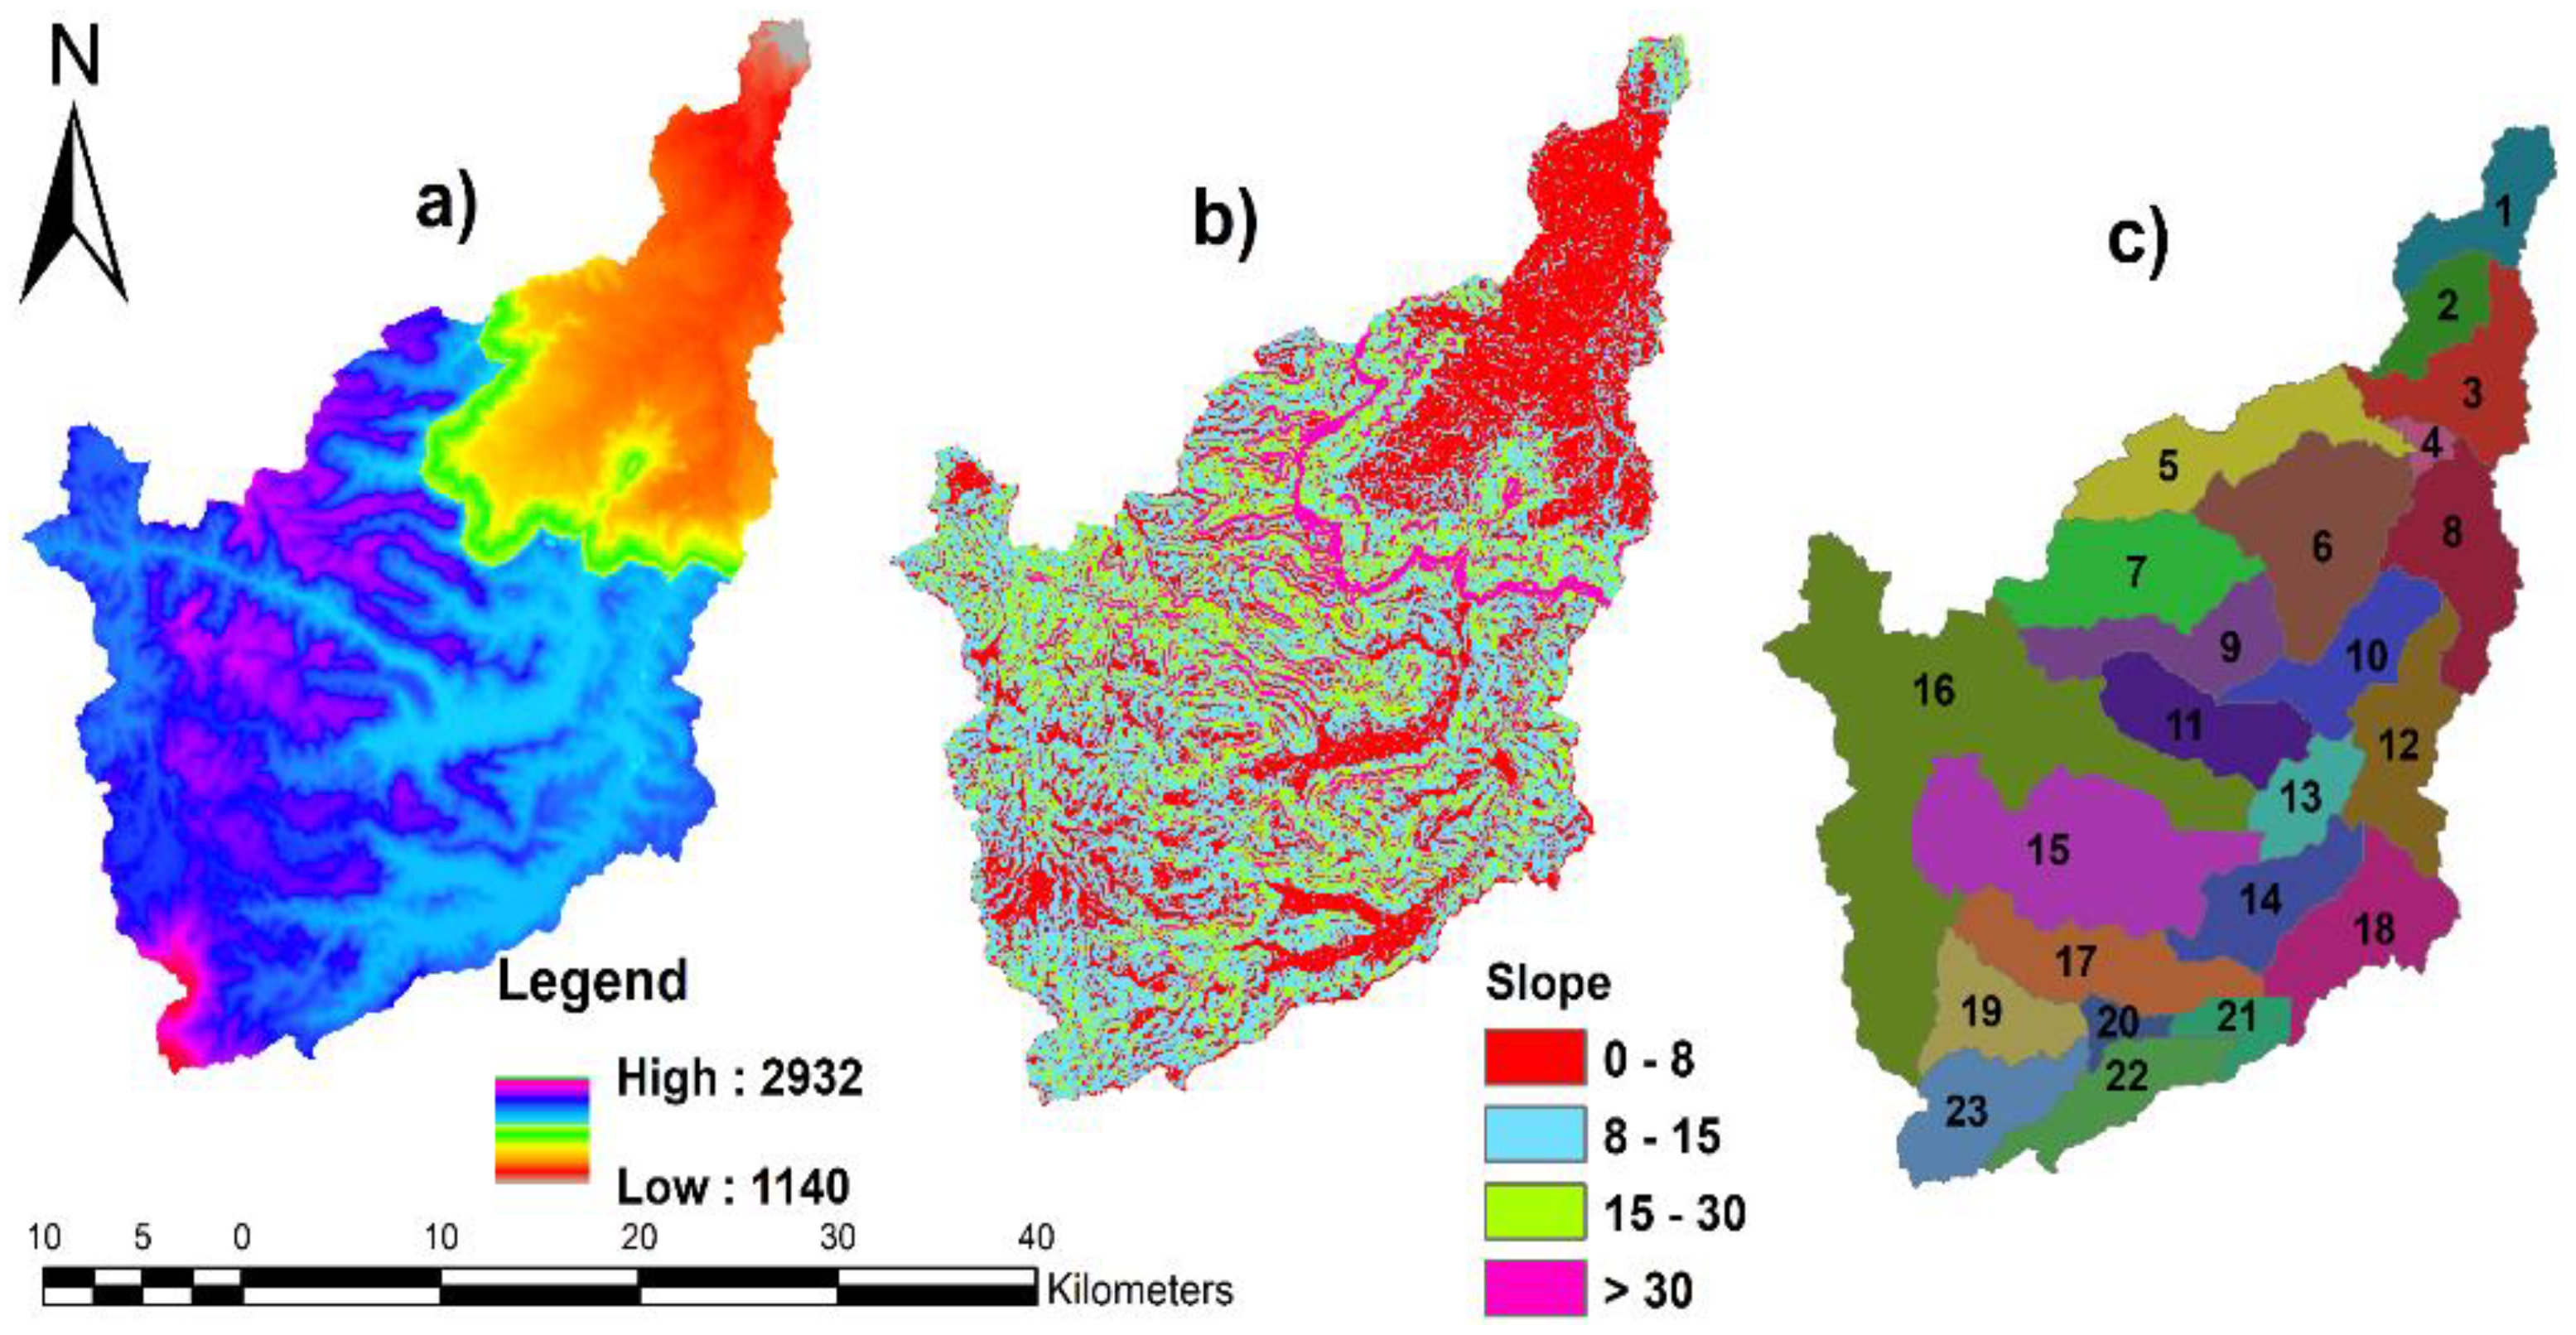
The required input data for the SWAT model incorporates a Digital Elevation Model (DEM), LULC maps, soil data and map, weather data, and hydrological data. Generally, the input data used in this study are summarized in Table 1. The DEM was the first input data in the SWAT model. It was utilized to compute the hydrological parameters of the catchment such as the direction of flow, flow accumulation, stream network generation, watershed delineation, sub-basin definition, and hydrologic response units (HRUs) setup. The DEM was also utilized to derive the slope gradient, slope length of terrain, and the network of the stream attributes such as channel length, slope, and width of sub-basin parameters. The DEM (Elevation), Slope, and classified sub-basins of the watershed are depicted in Figure 3.
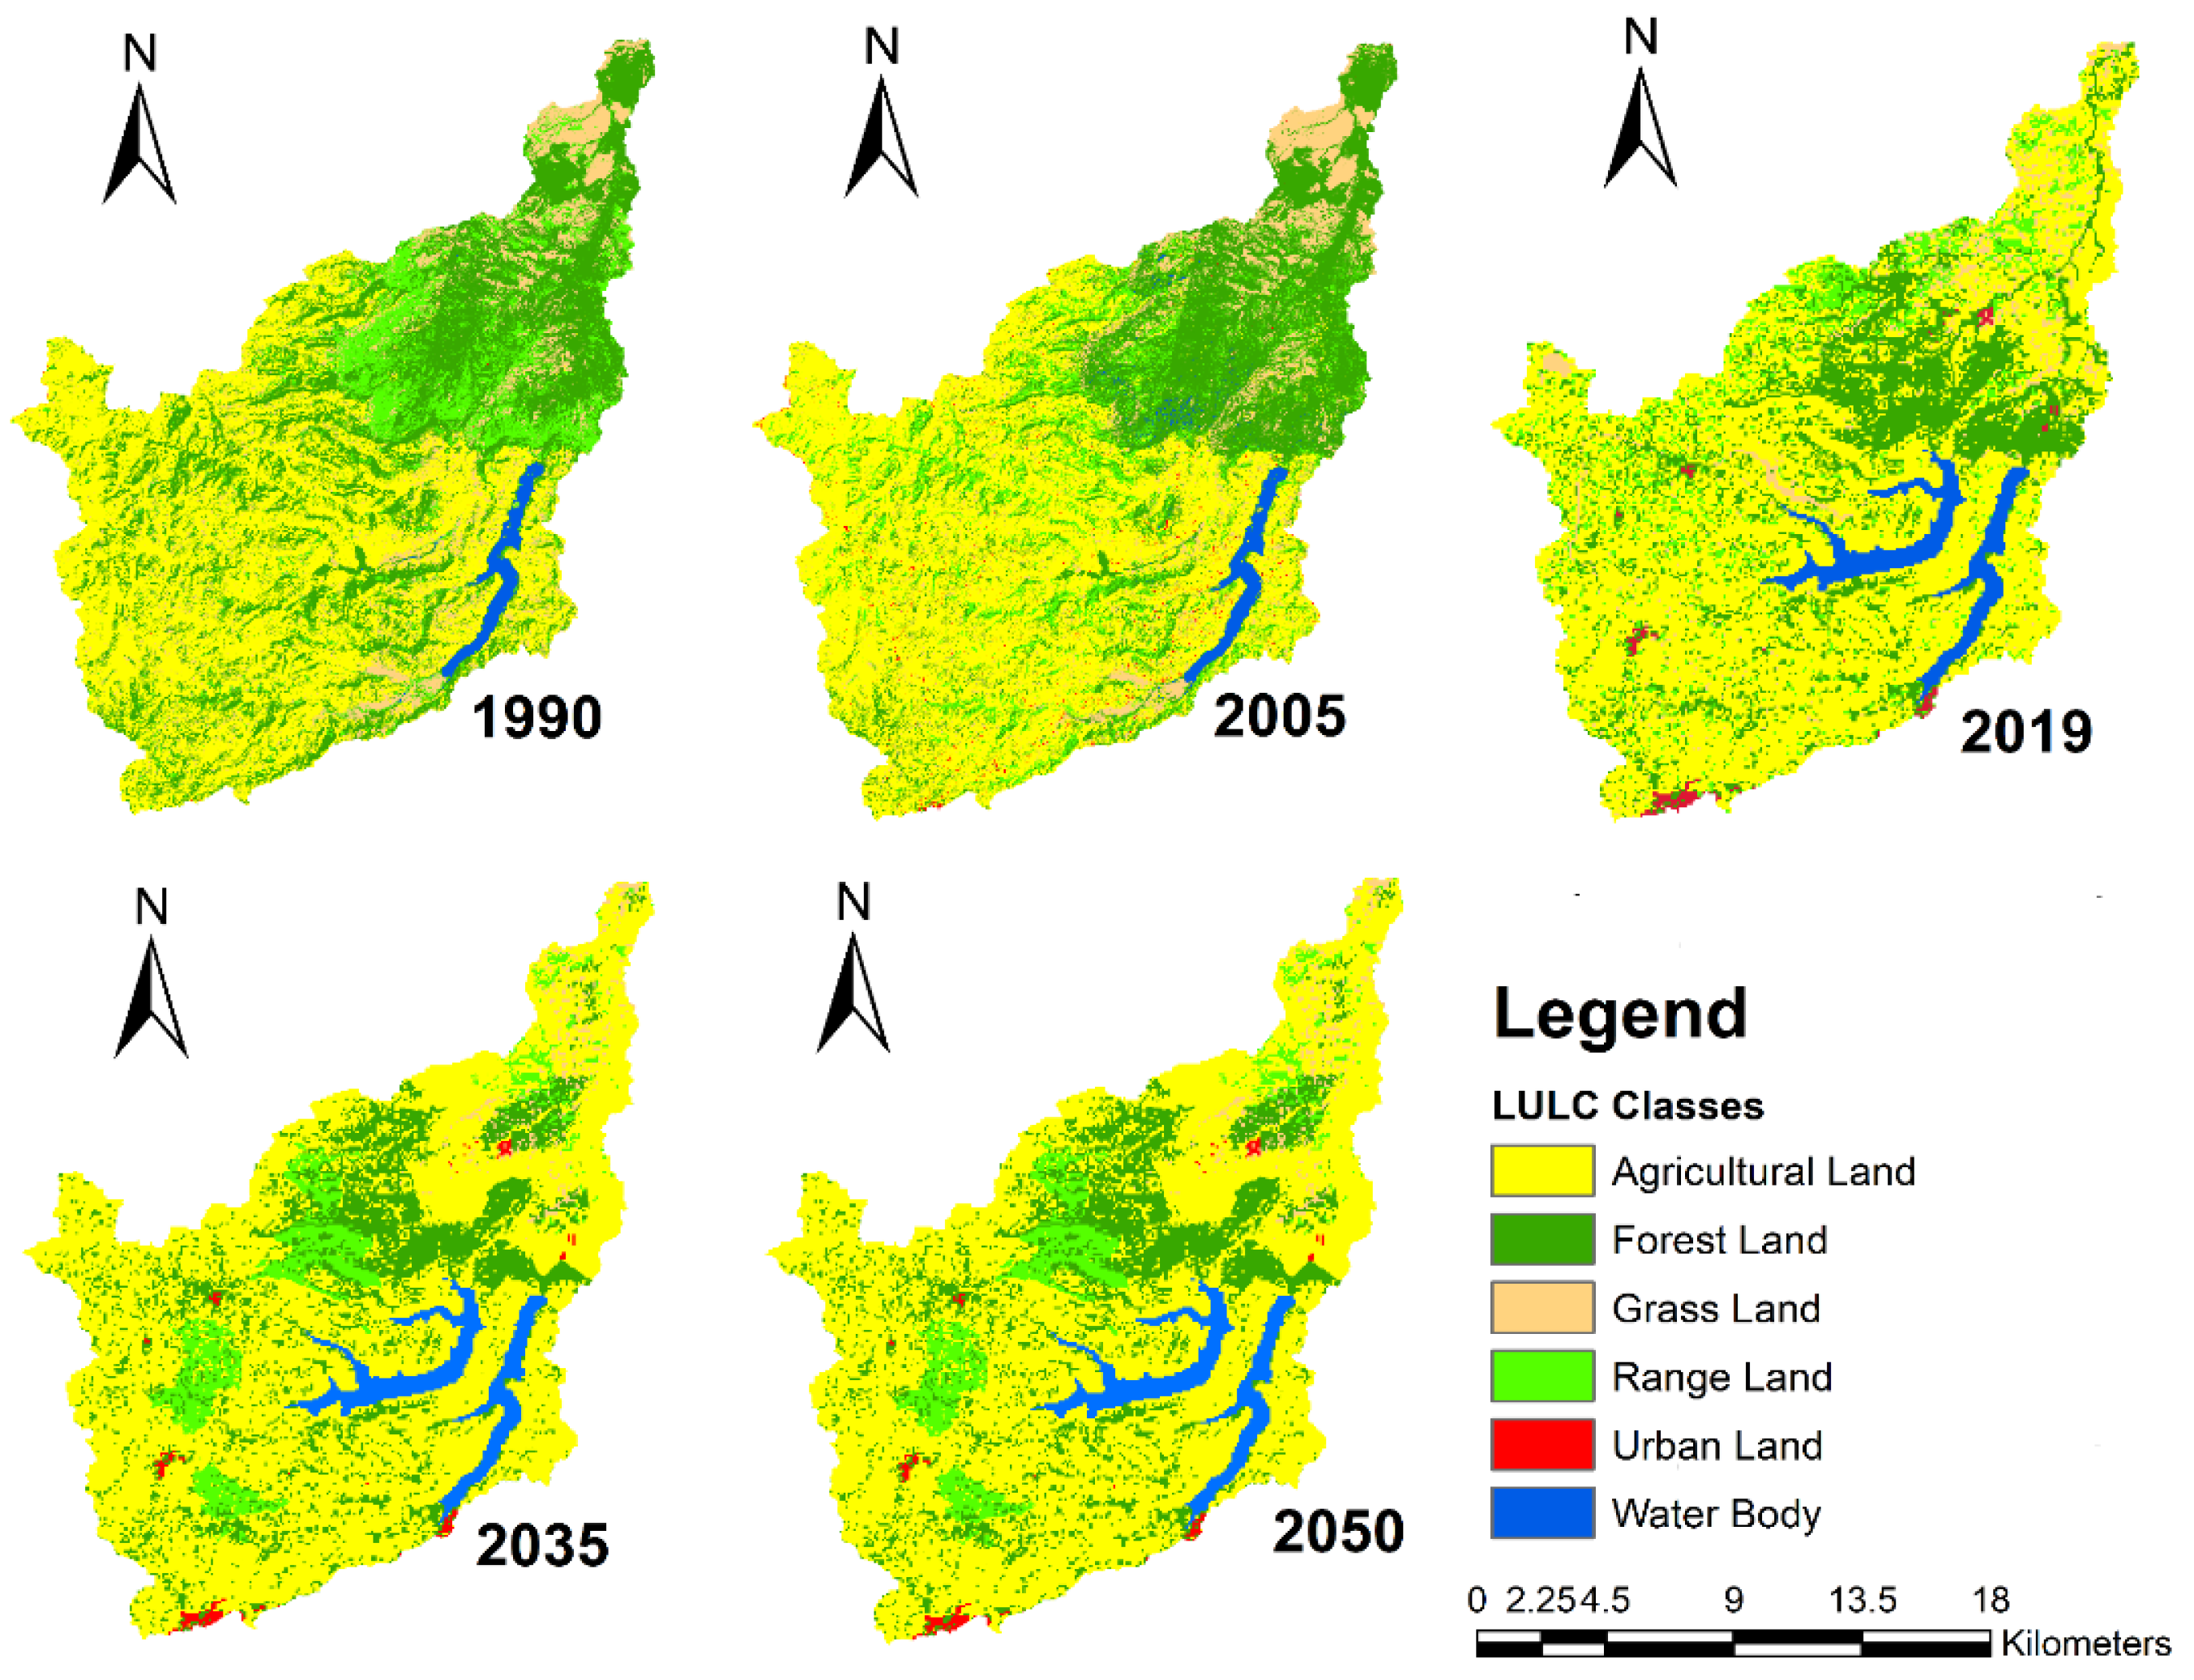
Land use land cover is also an indispensable input data influencing the hydrological responses of the watershed. The historical LULC images were obtained from Landsat images and classified using supervised classification in Earth Resource Data Analysis System (ERDAS) imagine model. The future LULC was predicted based on the classified historical satellite images using Land Change Modeler (LCM) integrated TerrSet model. Therefore, the classified historical LULC data for three time periods (1990, 2005, and 2019) and the two time periods (2035 and 2050) predicting LULC were conducted in detail by [8] and utilized in this study (Figure 4). The maps were utilized independently in the assessment of hydrological parameters in the watershed. The LULC classes of the watershed are agricultural land, forest land, grass land, range land, urban area, and water body [8].
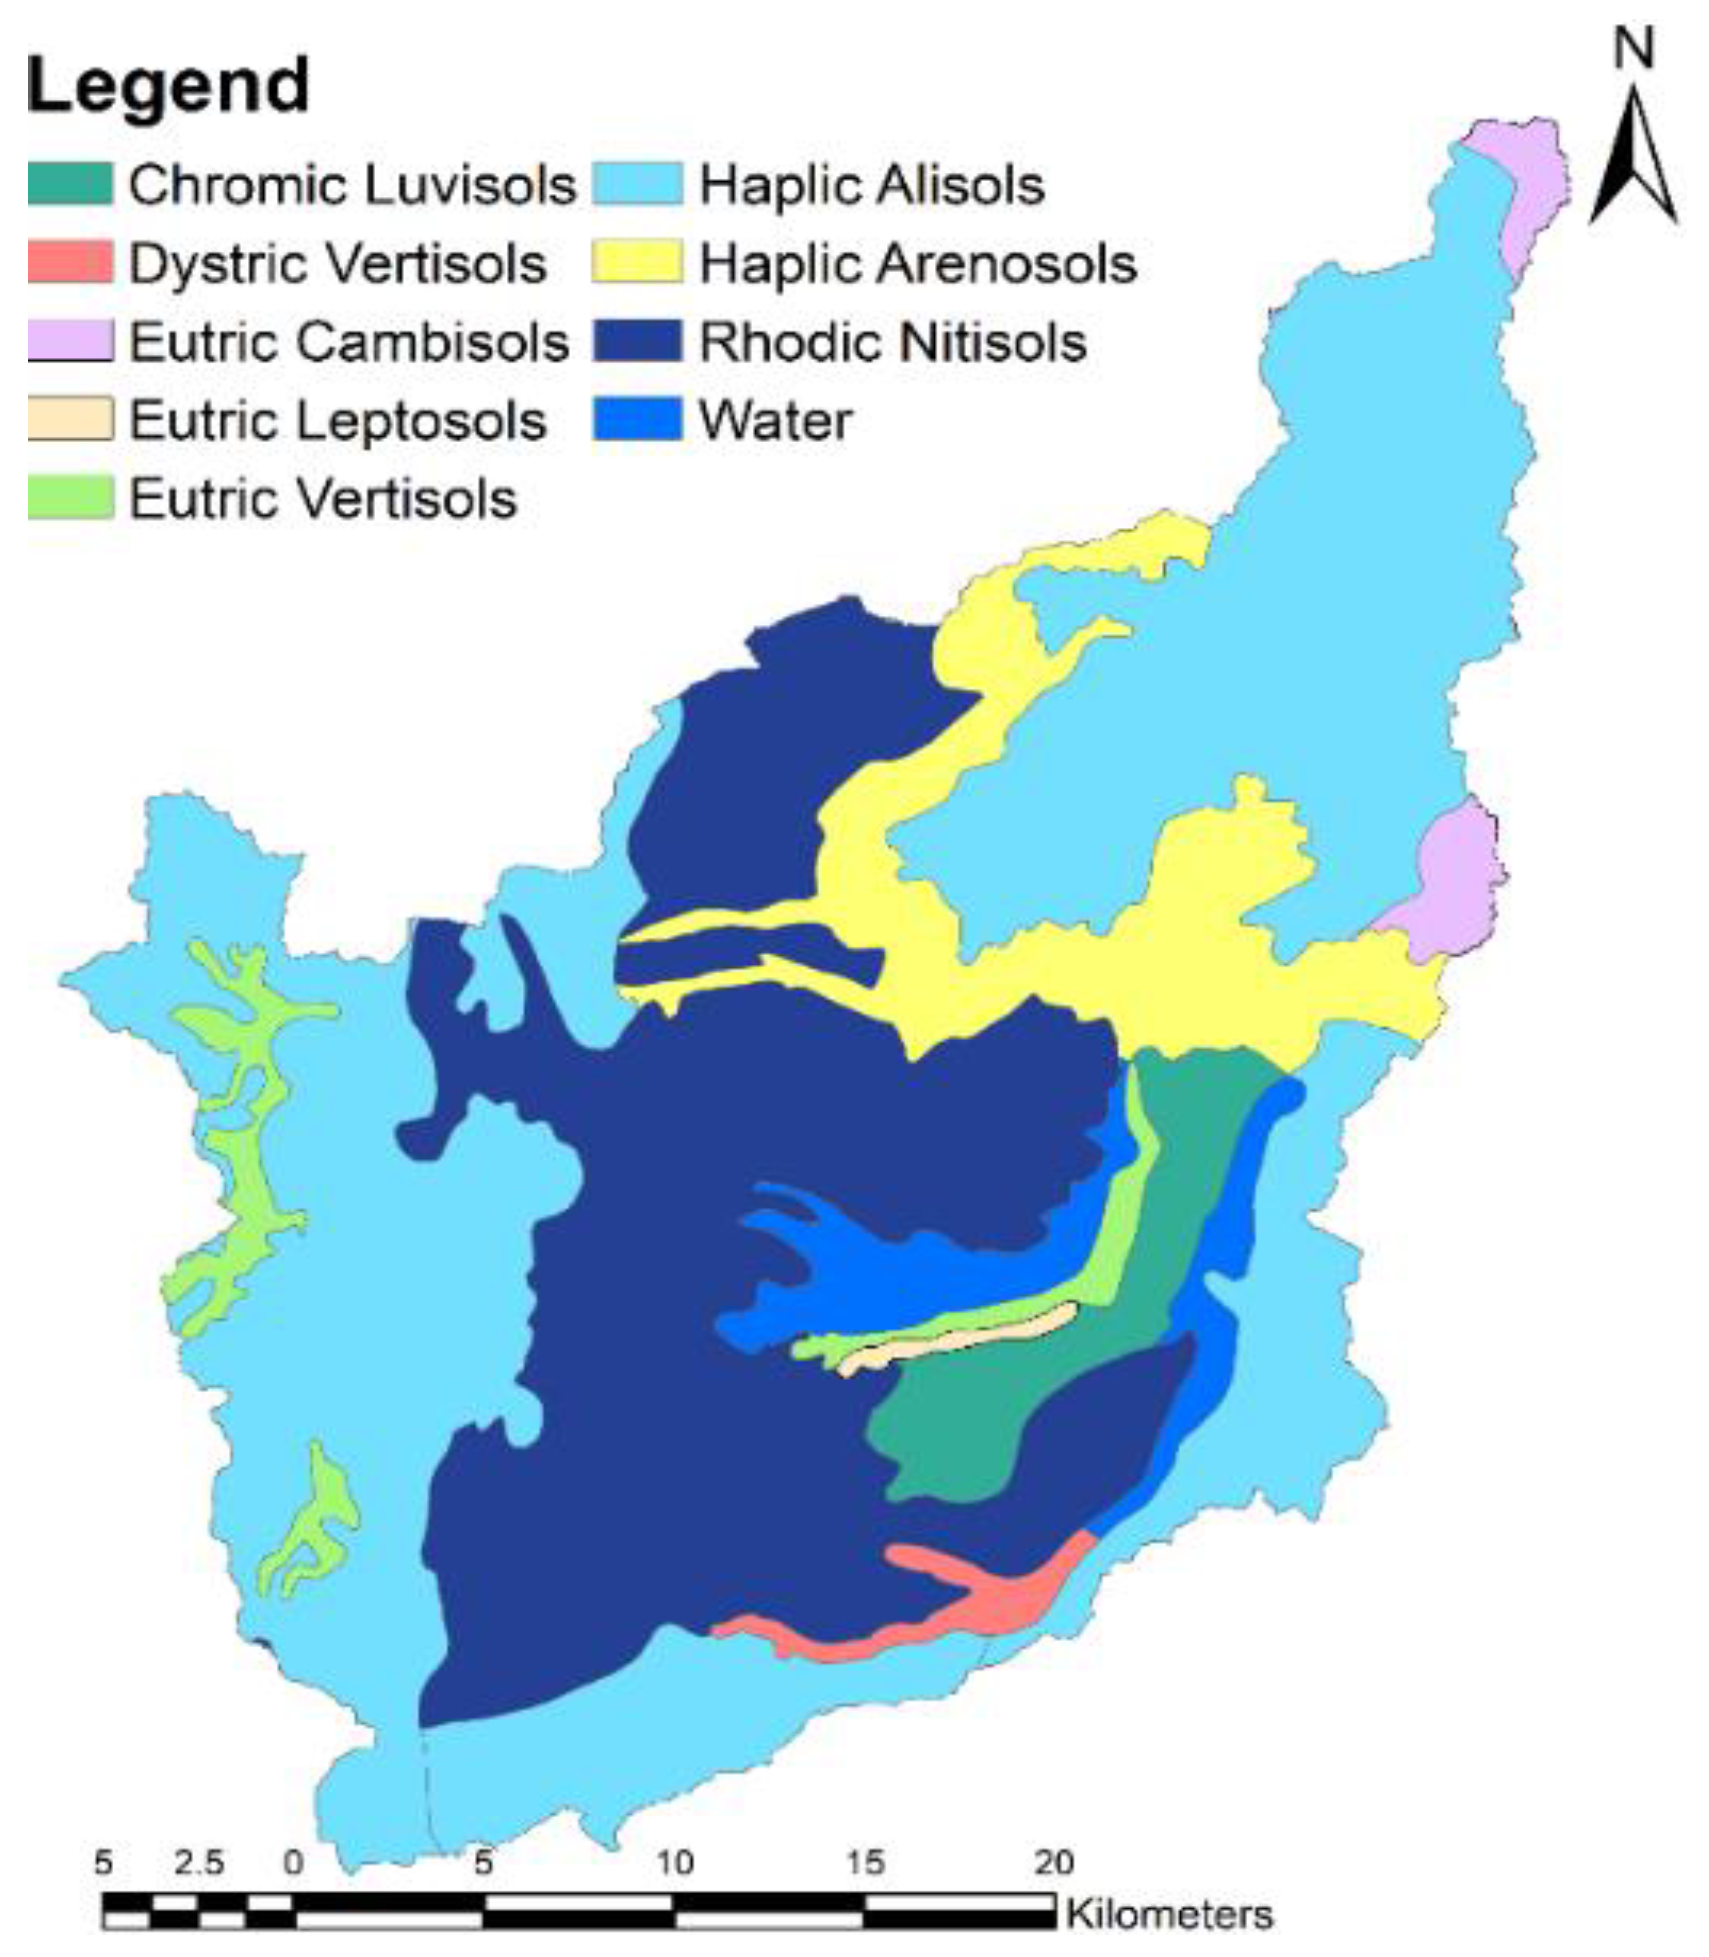
The necessary soil properties (physical and chemical parameters of the soils) required by SWAT were obtained from the Oromia Water Works Design and Supervision Enterprise (OWWDSE), literature, and from the design and feasibility study document of Finchaa Amarti Nashe Hydropower project. Therefore, using the collected parameters, the classified soil is adapted in the way the SWAT model requires. There are nine types of soil in the study watershed. Eutric Cambisols, Haplic Alisols, Haplic Arenosols, Rhodic Nitosols, Chromic Luvisols, Eutric Vertisols, Water, Eutric Leptosols, and Dystric Vertisols (Figure 5). The dominant soil type of the watershed is Haplic Alisols (47.01%) following Rhodic Nitosols (31.77%).
Historically, long-term daily weather data is required for the hydrological SWAT model. Therefore, the weather data were collected for five stations (Alibo, Finchaa, Homi, Nashe, and Shambu) within and nearby stations of the watershed. SWAT uses five types of daily weather data as input: precipitation, temperature (minimum and maximum), solar radiation, wind speed, and humidity. The missing data values of the weather were filled with the use of Xlstat. The consistency of data and homogeneity were also checked utilizing the double mass curve. The daily recorded hydrological (stream flow) data measured at the gauging station was utilized for the SWAT model calibration and validation.
2.3. Hydrological Modeling
The Hydrological SWAT model was developed to analyze the effect of land use land cover, management on water, and sediment at a watershed level at daily, monthly, and annual time increments. The SWAT model with spatially and temporally dispersed parameters was used to compute the LULC change effect on hydrological responses with changing soils, LULC, and slope [39]. There are two major hydrologic cycle phases in the SWAT simulation; the land and routing (channel-based) phase. The land phase simulates the quantity of water, nutrients, sediment, and pesticides delivered by surface runoff from each sub-basin to the corresponding main channel [40,41].
The hydrologic cycle of the land phase is simulated depending on the equation of water balance in each hydrological response unit (Equation (1)). In the SWAT model, the water balance is the foundation and driving force for all hydrological processes [13]. The routing phase controls stream processes such as movement of water, transport of sediment, and nutrient loading through the channel network until they reach the watershed’s outlet. SWAT calculates runoff volumes using the Soil Conservation Service Curve number method, lateral flow and percolation using the kinematic storage routine method, potential evapotranspiration using the Penman-Monteith equation, and peak runoff rate using the modified rational method.
Depending on the extent of the watershed and the detail of available geographical input data, the SWAT model splits a watershed into several sub-basins, which are further divided into smaller areas denoted as HRUs. HRUs are a composition of homogeneous land use, soil, slope, and management characteristics [16,17,42]. The SWAT model forecasts the effects of LULC changes on different hydrological parameters in the watershed at the HRUs and sub-watershed levels [42,43]. The SWAT divides the Nashe watershed depending on topographical data information into 23 sub-watersheds that are in turn divided into a total of 321 HRUs based on their soil type, land use land cover, and slope. The hydrologic response unit (HRU) was defined using the multiple land use/soil/slope technique, with a land use of 5%, a soil of 10%, and a slope of 10% threshold. By using these thresholds, land uses, soils, and slopes with smaller areas than their respective thresholds were integrated into larger land use, soil, and slope respectively by an area-weighted scheme.
where: SWo, SWt: initial and final soil water content respectively, Rday: precipitation, QSurf: surface runoff, Ea: evapotranspiration, Wseep: water entering the vadose zone from the soil profile, Qgw: return flow, t: time (days).
2.4. Sensitivity Analysis
The method of identifying the most significant parameters for the model is known as sensitivity analysis [16]. A model’s performance is only truly acceptable after a sensitivity analysis has been conducted. In this study, SUFI-2 (Sequential Uncertainty Fitting-2) algorithm, which is the interface of SWAT-CUP (Soil and Water Assessment Tool- Calibration Uncertainty Program), was used to accomplish sensitivity analysis [18]. The flow parameters were tested and the influential sensitive parameters were selected and used for further analysis (Table 2). The t-stat and p-value statistics from the model provided the measure and significance of sensitivity respectively. Therefore, a lesser p-value and a larger t-stat in absolute value indicate the sensitive parameters [18,44,45].
2.5. Model Calibration and Validation
The method of adjusting input model parameters to ensure that simulations match with observations, within the recommended ranges, so that prediction uncertainty is reduced, is known as model calibration. Whereas, the progression of affirming the calibrated parameters by evaluating them with an independent set of data without making any further modifications to the model parameters, is validation [16,46]. The model calibration and uncertainty analysis were also conducted in the SWAT-CUP program using the SUFI-2 algorithm. The uncertainty is determined by the 95PPU (95% prediction Uncertainty) band computed at the 97.5% and 2.5% levels of the variable output [18]. The 95PPU was computed through the method of Latin Hypercube sampling, which restricts 5% of the bad simulations.
The two measurements used to analyze the quality of uncertainty analysis are the p-factor and the r-factor. The p-factor is a proportion of measured data bracketed by the 95PPU that ranges from 0 to 1, with 1 being the optimal result. The r-factor ranges between 0 to infinity, and it is the average thickness of the 95PPU band to the standard deviation of the corresponding measured data [44,47,48,49]. Twenty-four years (1985–2008) of flow data were used for the calibration and validation. The first two years (1985–1986) were considered the model’s warm-up period. The period between 1987 and 1999 was utilized for calibration, whereas the period between 2000 and 2008 was used for model validation.
2.6. Model Performance Evaluation
The model performance evaluation was conducted to determine the consistency of simulated data compared to the measured data during the calibration and validation periods [45,50]. When simulating stream flow, the model’s performance was evaluated graphically and with different objective function values. The various indicators used to assess the performance of the SWAT model and to test the goodness of fit between monthly simulated and observed values are: Nash-Sutcliffe Efficiency (NSE)—designates the degree of fitness of observed and simulated data, Percent Bias (PBIAS)—a measure of how much the observed variable is either underestimated or overestimated, coefficient of determination (R2)—a measure of the consistency of simulated and observed data, as depicted in Equations (2)–(4). The objective functions for the calibrated and validated model were compared to the performance statistics ratings for monthly time steps to determine the performance of the model (Table 2).
where; Qsi, Qoi: the simulated and observed stream flow values, , the mean of the observed and simulated values.
2.7. Model Application for Scenario Simulation
Assessing the LULC change impact in the watershed on hydrological processes is substantial for the management of water resources [24,51]. Therefore, the calibrated and validated model with 1990, 2005, 2019, 2035, and 2050 LULC maps were utilized to reveal the effects of LULC variations on watershed hydrology. The simulated results were used to assess the effects of LULC change at the watershed level and to determine the involvement of individual changes at the sub-basin scale. A fixing–changing method was used in this study to explore the impacts of LULC change [21]. The model was run with a change in the LULC maps, while remaining model parameters from calibrated model and other SWAT inputs were constant. The method has been conducted by many researchers in different parts of the world [2,20,24,31,51,52].
The trend and future LULC change influences on watershed hydrological responses for the period 1990–2050 were evaluated using scenario-based simulation. Five kinds of LULC scenarios were established in this study, representing three periods, i.e., baseline, current, and future LULC conditions. The first two scenarios considered as a baseline were the LULC map corresponding to the years 1990 and 2005. The third scenario represents the current LULC, which corresponds to 2019. The fourth and fifth scenarios represent potential future LULC change that is projected for 2035 and 2050 under Business as Usual Scenario (Figure 4). The variations in LULC classes and hydrological components were assessed using the pair-wise Pearson’s correlation method [51]. In this study, the pair-wise Pearson correlation matrix was applied to develop linear correlations between dependent variables (hydrological components) and independent variables (land use land cover classes).
3. Results and Discussions
3.1. Land Use Land Cover Change
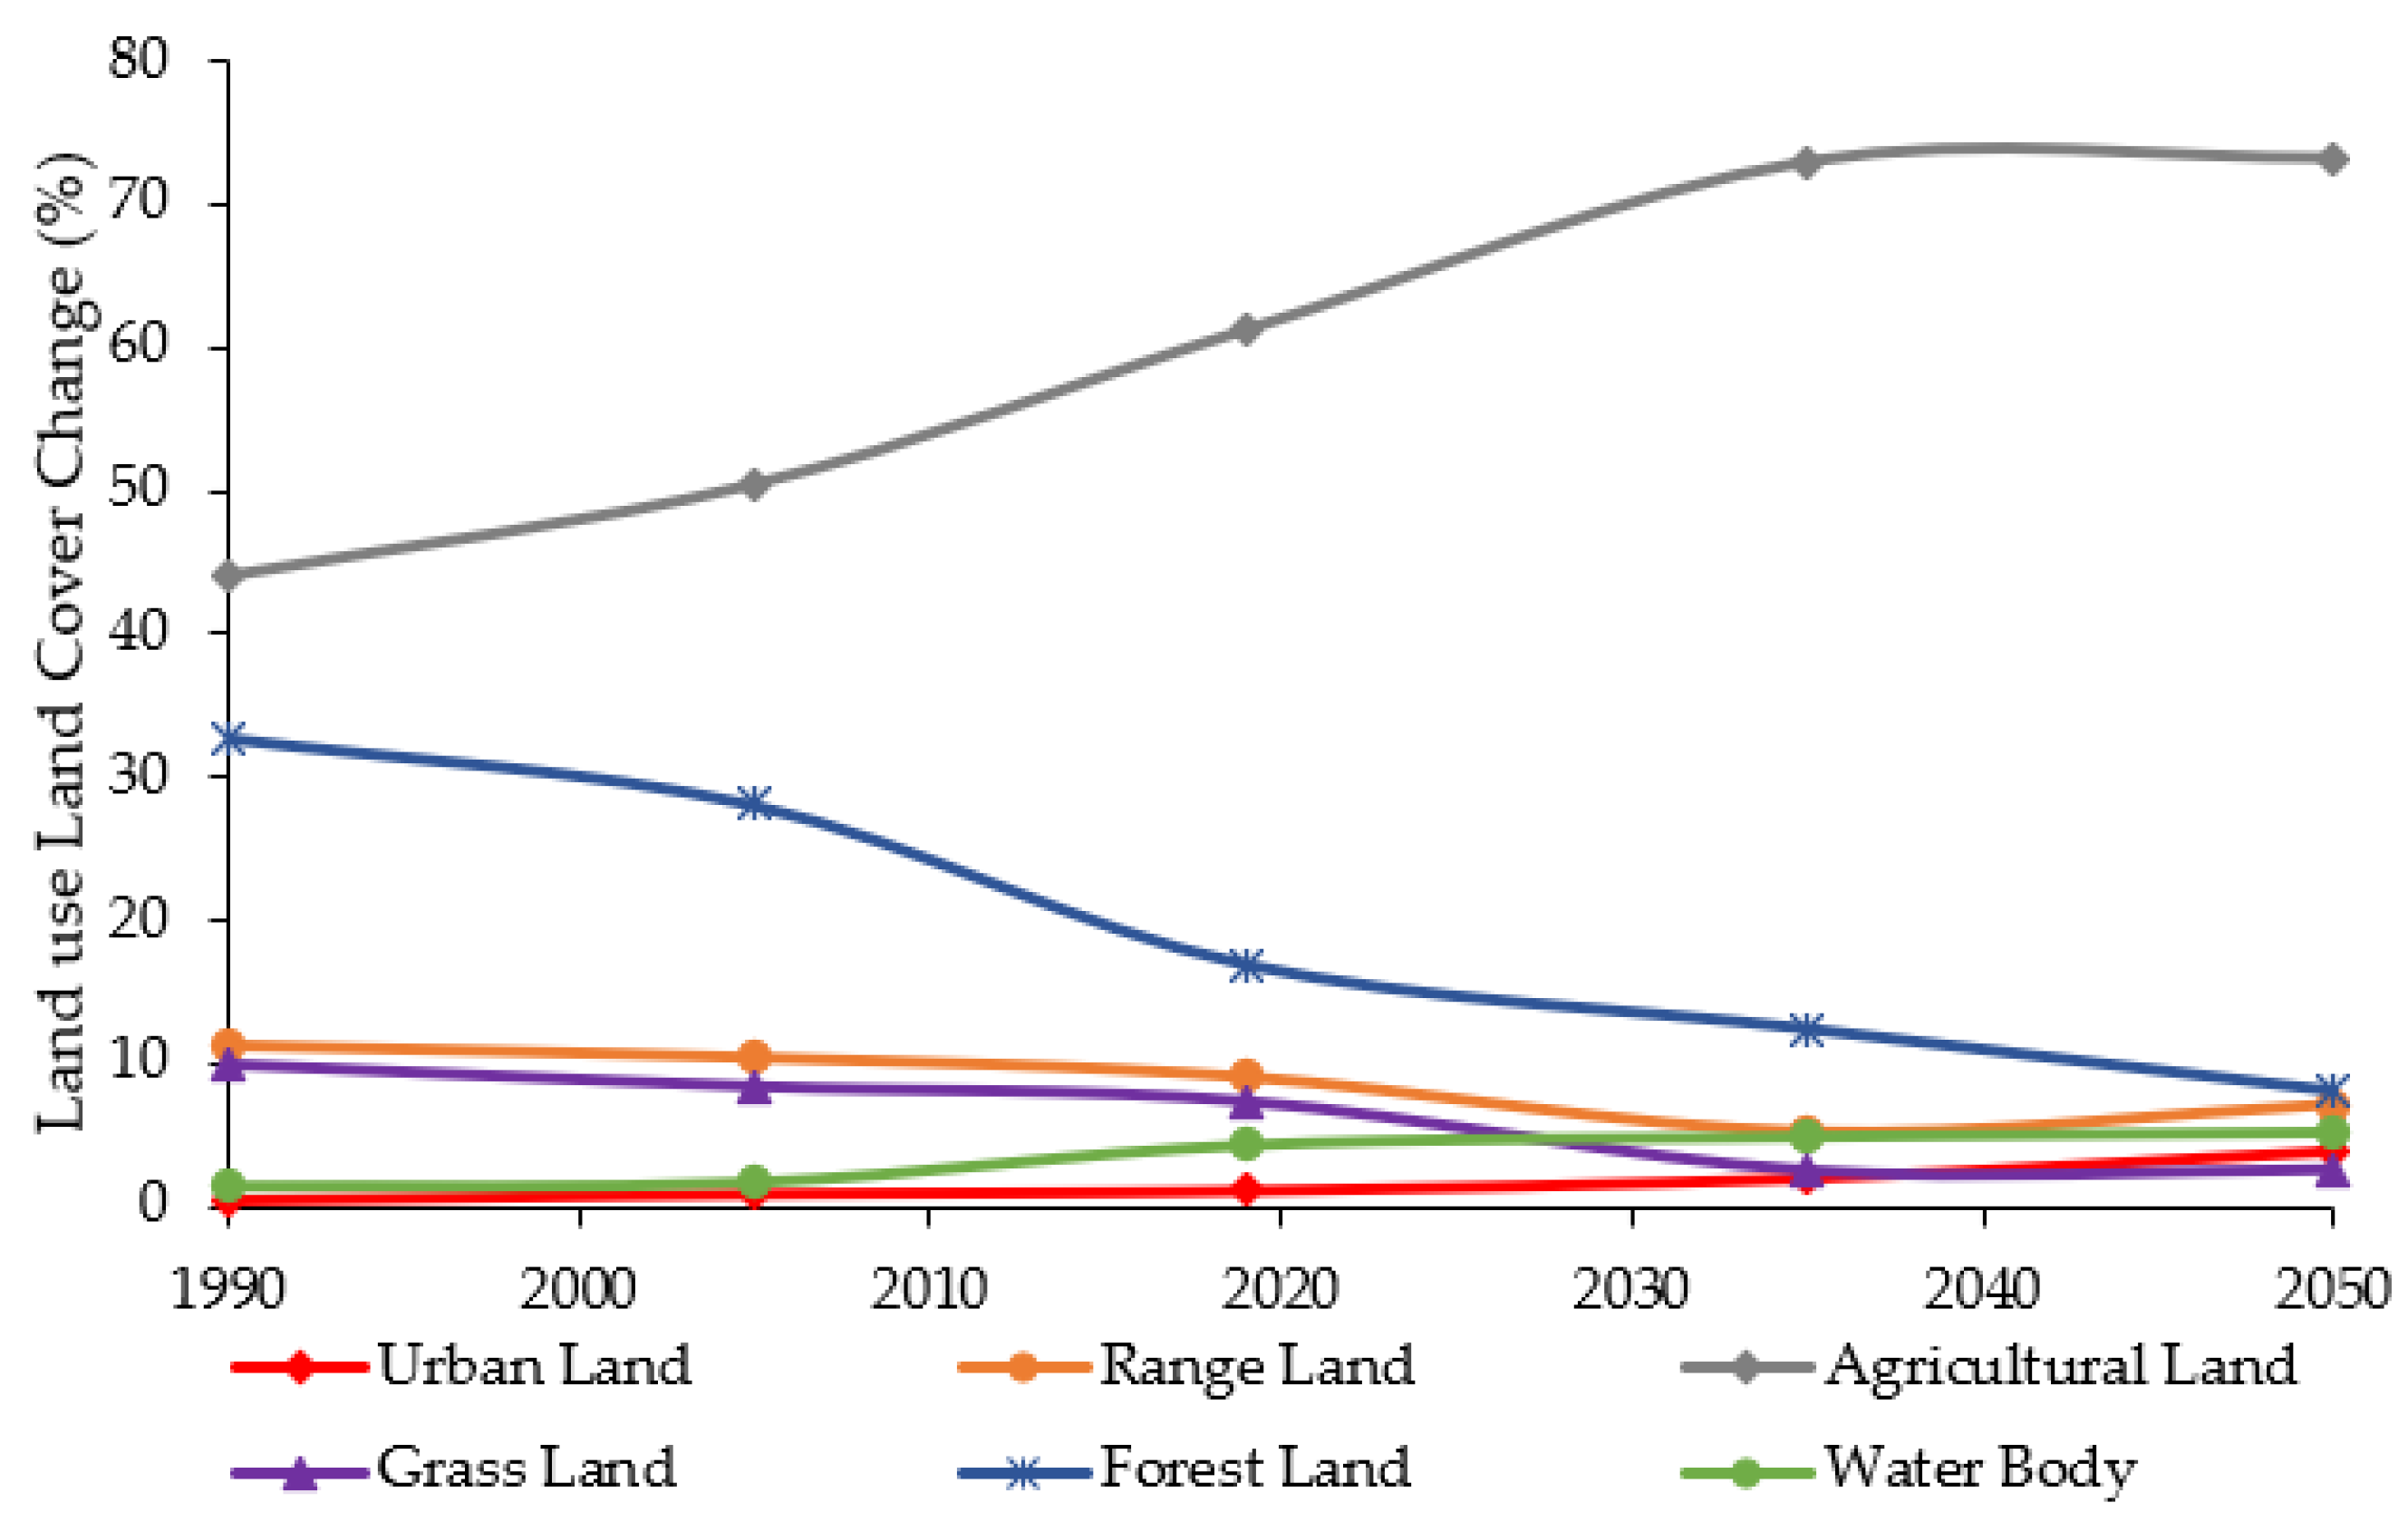
The classified, predicted, and analyzed LULC change of the Nashe watershed for the period of 1990 to 2050 is shown in Figure 4 and Figure 6 respectively. The assessment of LULC change shows that forest cover, range land, and grass land has been decreasing. However, high increasing rate of urban areas and agricultural land is also demonstrated. Similarly, an increase in grass land and range land occurred from 2035 to 2050. From the result, it is evident that changes occurred in all LULC classes [8]. According to [8], details about the historical and future LULC change analysis and the main drivers of the change of LULC in the Nashe watershed were conducted.
3.2. Hydrological Model Performance Evaluation
3.2.1. Sensitivity Analysis
In this research, the nine most influential sensitive parameters selected (p-value < 0.05) [53] were identified for the watershed and ranked according to their sensitivity based on the t-stat and p-value (Table 3). The sensitivity analysis indicated the overall importance of the nine parameters in determining the stream flow at the study area. The top three most sensitive parameters in the order of sensitivity are CN2.mgt, GW_DELAY.gw, and SOL_K (..).Sol. The parameters include those governing sub-surface and surface hydrological processes and stream routing.
3.2.2. Calibration and Validation
After finding the sensitive parameters on stream flow simulation it is important to identify key parameters and the parameter precision required for calibration [54]. To simulate the hydrological components of the watershed, the model validation proficiency was done using the calibrated parameters. The calibration of the model was implemented for the time period of 1987–1999 and validated for the period 2000–2008; the period from 1985–1986 was considered as the spin-up period. The data of stream flow has been calibrated and validated with the observed weather data and LULC scenarios of various time periods. Ref. [55] Proposed calibration and validation of the model to assess the effects of LULC change.
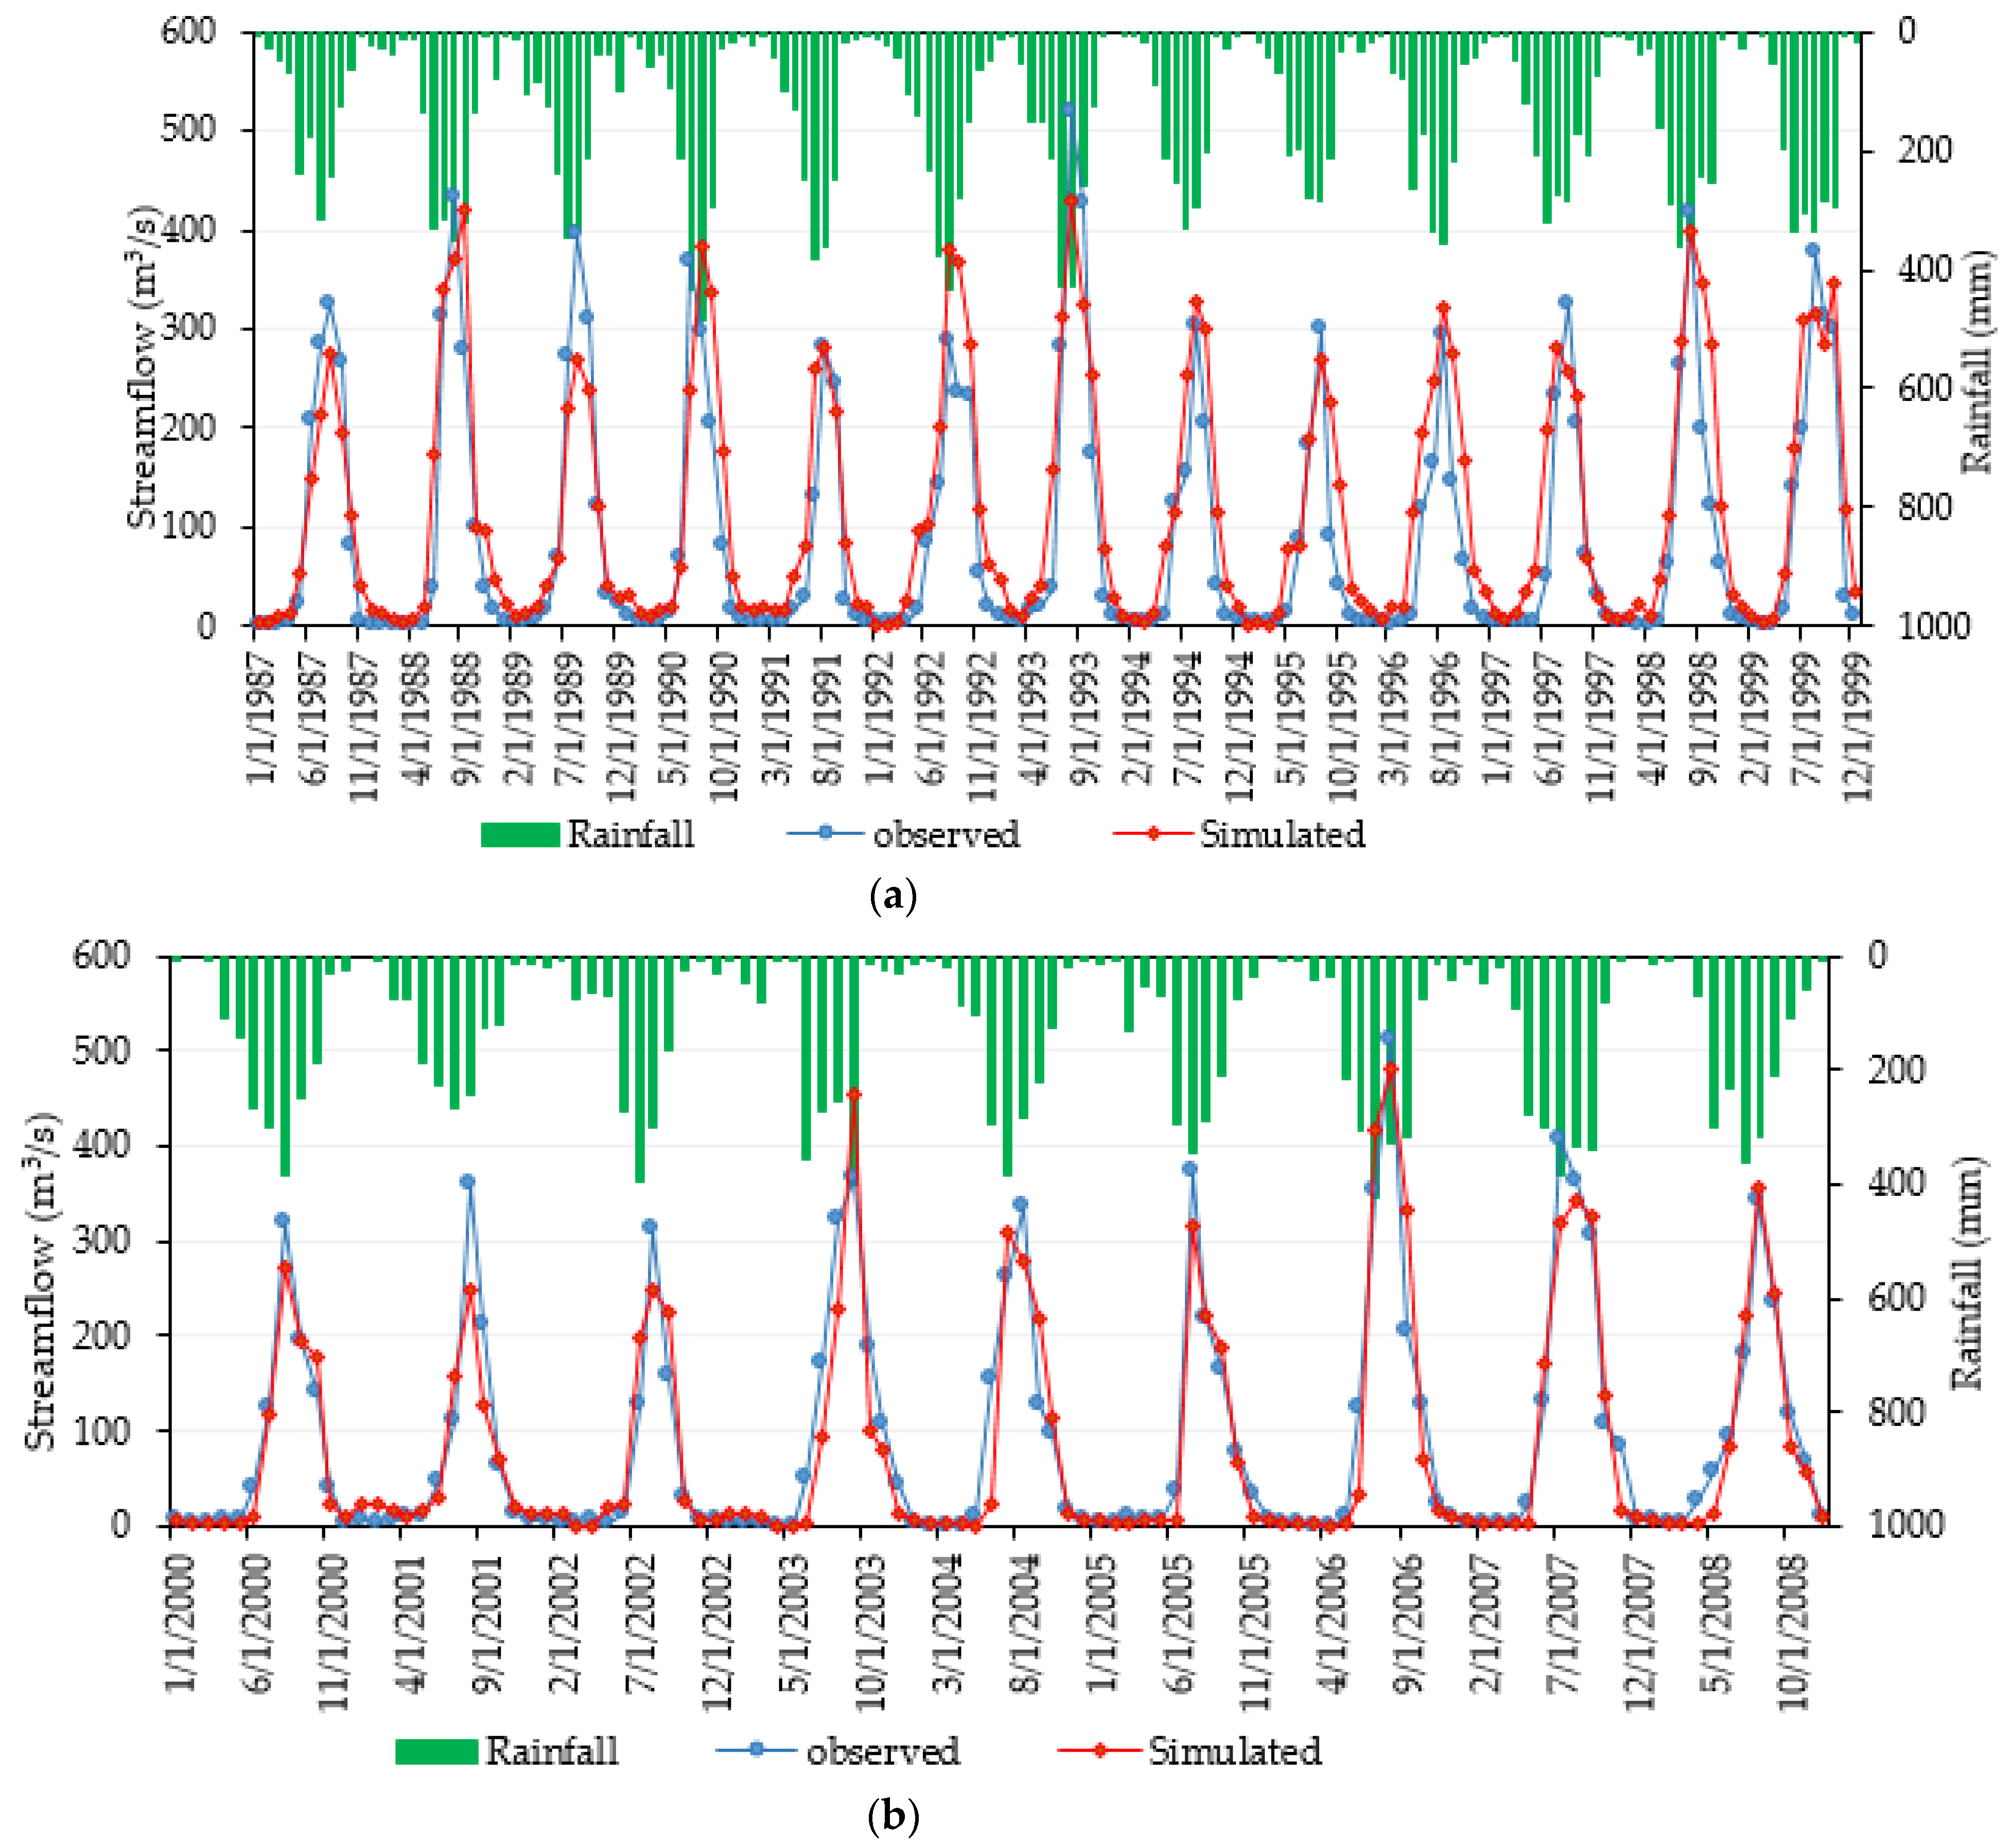
Figure 7a,b demonstrate the visual contrast of time series observed and simulated stream flow on a monthly basis to investigate the similarity of stream flows in the watershed through the calibration and validation periods. Reference [45] depicted that graphical comparison and statistical indices can assess the efficiency of the calibrated and validated parameters. During the calibration and validation period, the simulated flow values are marginally less than the observed value at at peak flow months. But the simulated flow is slightly greater than the observed value at low flow months. Generally, the model underestimates mean monthly stream flow (Figure 7). The simulated and observed graphical comparison shows a good agreement both in calibration and validation results.
3.2.3. Model Efficiency
The evaluation of simulated and observed stream flow computed through the statistical values of objective functions are in the acceptable range (Table 4) based on the performance assessment criteria (Table 2). Therefore, the performance indices obtained indicated a good performance rate of the model in simulating the impacts of LULC changes [36]. Thus, depending on the model performance indicator results, it can be justified that the model is applicable specifically for the Nashe watershed and in general for Blue Nile River Basin. The PBIAS of the study shows a small bias towards underestimation in both calibration and validation. However, depending on the result, no significant model over or underestimation was found, since the obtained values are in the recommended range.
3.3. Hydrological Responses to Land Use Land Cover Change
3.3.1. Seasonal Hydrology of the Watershed
The LULC change effect on the hydrological components of the watershed was mainly analyzed on annual, seasonal, and monthly basis. LULC classes from different time periods were utilized independently to analyze the change of LULC effect on the hydrological parameters of the Nashe watershed. For seasonal analysis, seasons in Ethiopia are categorized into three seasons in the year based on the rainfall magnitudes. The season of short rain (February to May), followed by the wet season lasts from June to September. The other season is the dry season, which lasts from October to January and can be generally characterized over the majority of the country. The hydrological components variability due to LULC change was assessed based on these three rainfall seasons. Similarly, the hydrological parameters to the LULC dynamics were also reflected in the peak flow and base flow in the Nashe watershed.
The well-known components of water balance are surface runoff, ground water, lateral flow, water yield, and evapotranspiration [43,56,57]. According to the findings, it was observed that more than 80% and 40% of the surface runoff and ground water occurs during the wet season for all LULC time periods, while less than 10% of the surface runoff occurs during the dry and short rainy seasons (Figure 8). Over Ethiopia, heavy rainfall (June to September) creates high seasonal flows and surface runoff. The reason might be that the surface runoff was more susceptible in summer than in other seasons. The LULC change from 2019 to 2035 increases the surface runoff in the wet season by 2.15% (5.48 mm). Similarly, when the LULC changed from 2035 to 2050 the surface runoff decreased by 1.41% (3.67 mm) in the same season.
In the season of short rain, the surface runoff increased by 1.17 mm (4.23%), and in the dry season by 0.57 mm (2.0 %) for the period of 2019–2050. The change in the hydrologic components due to LULC change decreased in the dry period, which mostly comes from base flow and increases runoff during the wet seasons, which is supplied from surface runoff [1]. The surface runoff decline can be accredited to increased infiltration [58]. The observed and simulated mean monthly stream flow shows that there was not much difference between them according to hydrological data.
The agricultural coverage and urban area expansion and extraction of forest land, range land, and grass land strongly influences surface runoff, peak flow, and base flow following rainfall events [8]. This causes alteration in soil moisture conditions and the water amount that percolates into the groundwater storage. Because infiltration diminishes with an increase in impervious surface, urban area growth normally increases high stream flow and decreases low stream flow. Similarly, a reduction in forest land reduces infiltration and evapotranspiration rates, resulting in a reduction in base flow and an increase in impervious surface covers [2,24]. Evapotranspiration was highest in the period from February to May and reached minimum values from the months of October to January.
Therefore, the result of this research is generally in agreement with the fact that agricultural land has less evapotranspiration than forest land [51,59]. Ref. [60] found that alteration of forest to agriculture and grassland increased peak flows and declined dry season flows in the Upper Mara watershed, affecting water scarcity during low flows. In general, the annual and seasonal watershed hydrology show an increasing or decreasing trend throughout the study period based on the trend of LULC change categories. According to studies conducted by [24,25,34,61,62], the rise in surface runoff and decline of ground water and evapotranspiration was attributed to the increase of agricultural area and urban areas at the expense of forest cover using the SWAT model.
3.3.2. Hydrological Responses to Land Use Land Cover Scenarios
The LULC scenarios were conducted using constant weather data and the variations of hydrological components were exclusively attributable to LULC change. The simulated surface runoff for the potential future LULC scenarios was higher than those of the baseline and current land uses because of further LULC changes (Table 5). The future scenario (LULC 2035) yields higher surface runoff and lower ground water flow in comparison to the other scenarios.
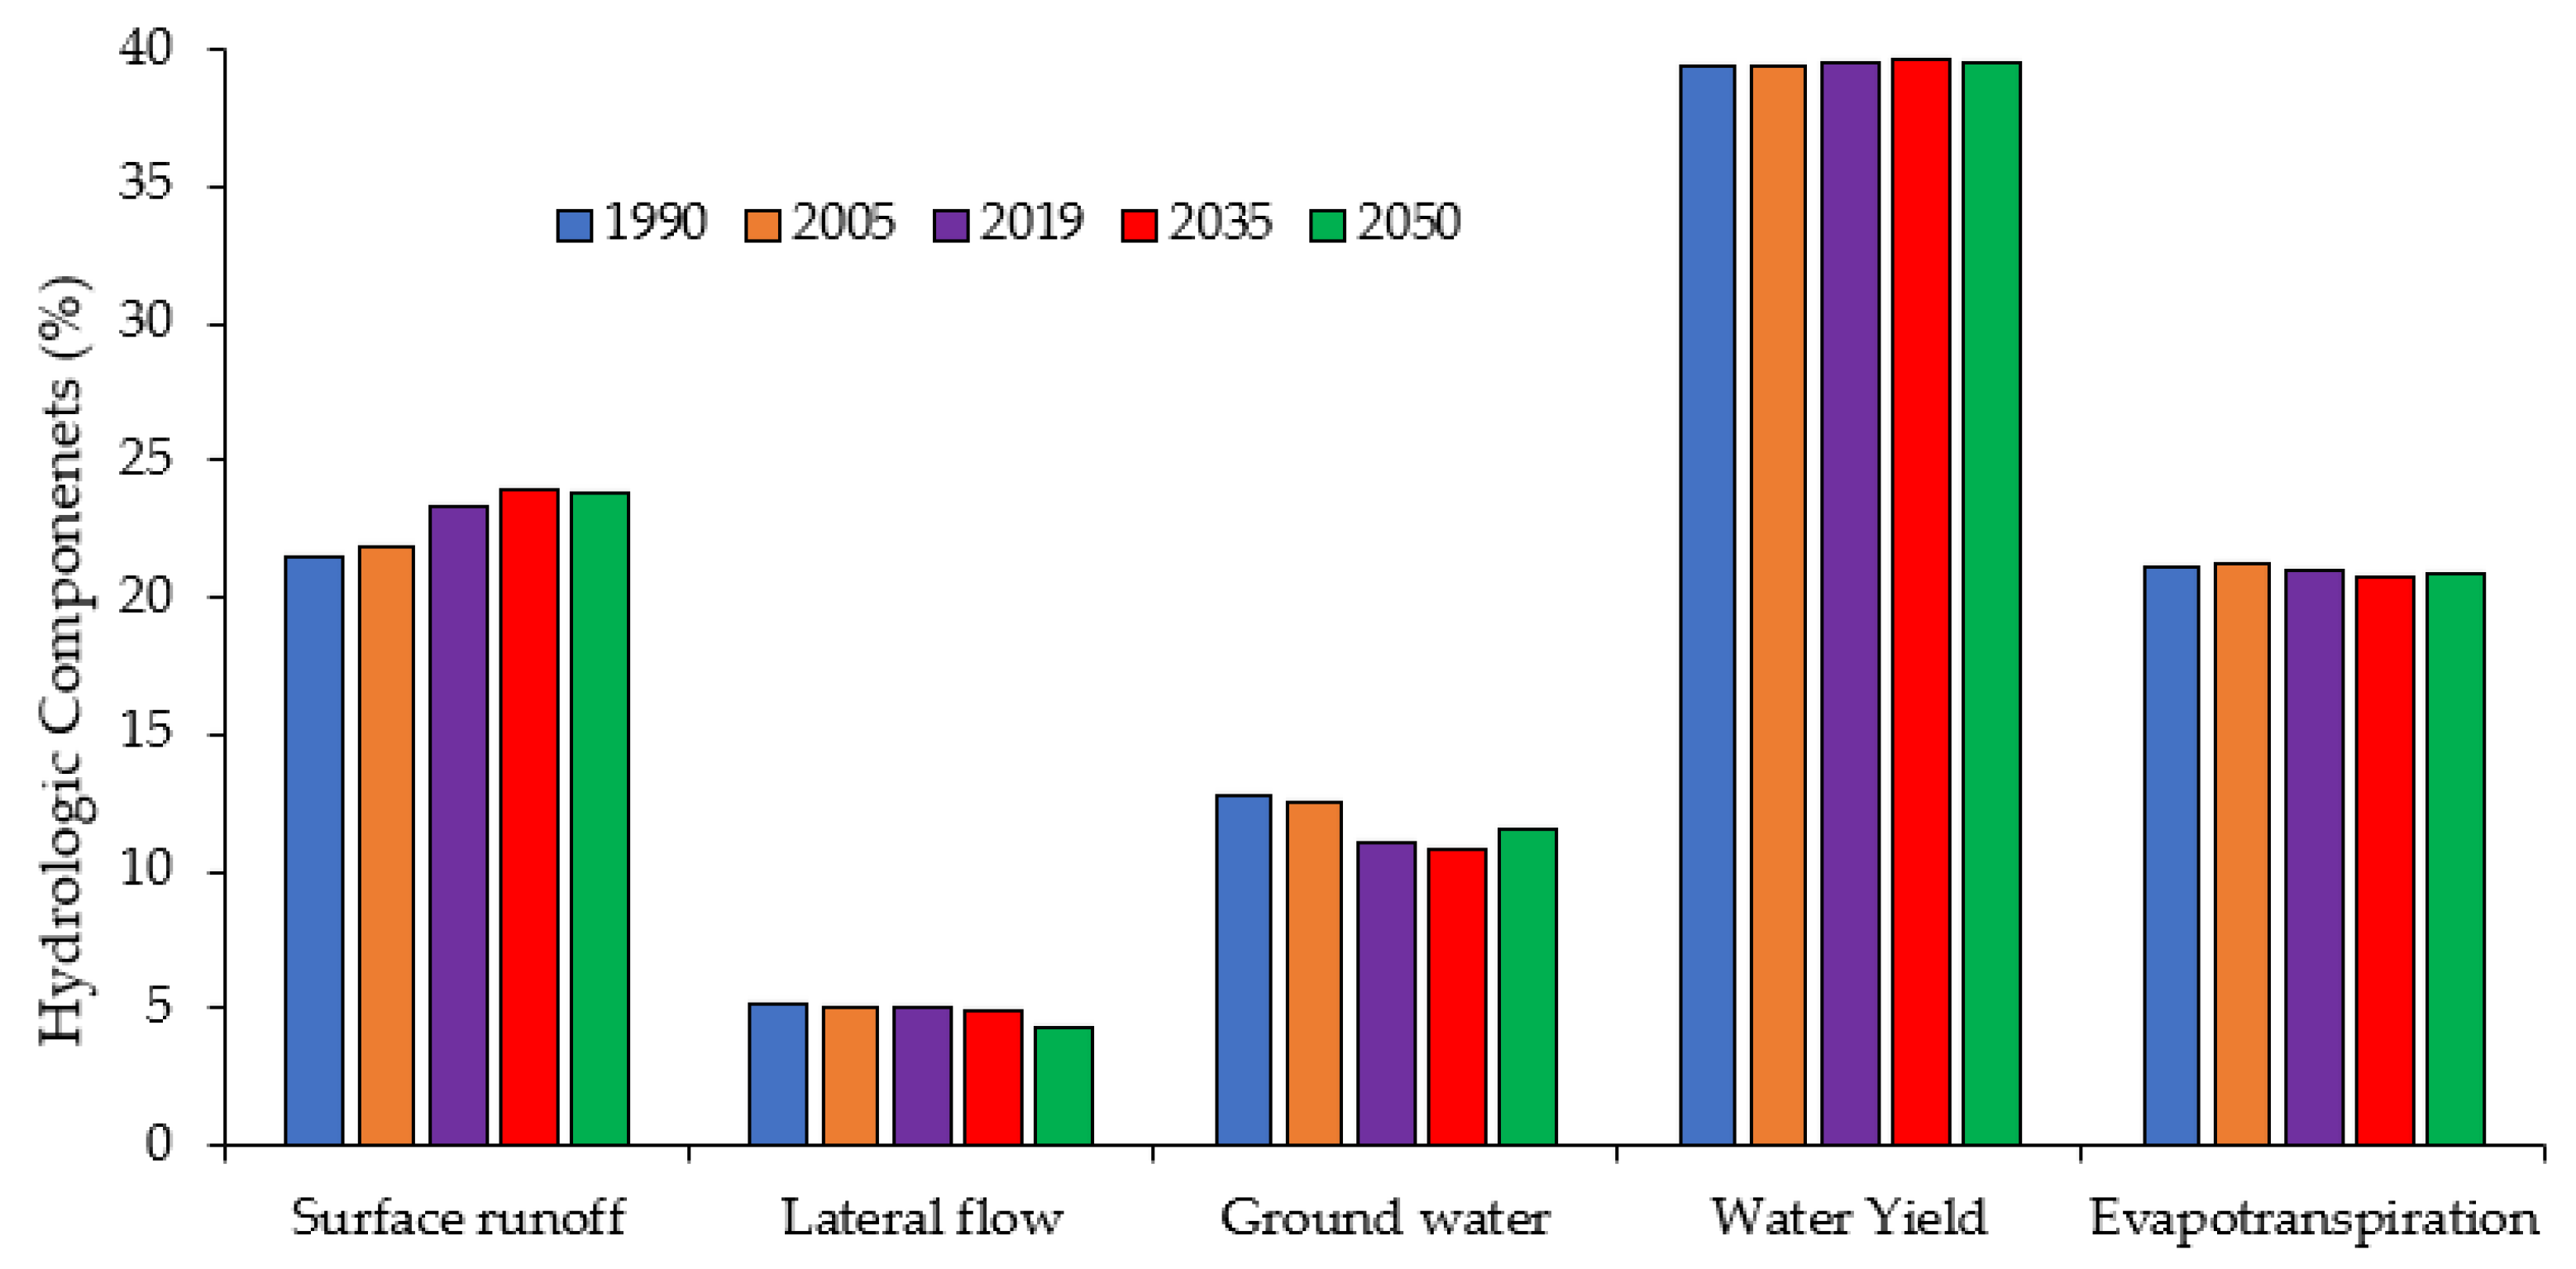
The average surface runoff of the catchment was increased by 7.94%, 10.45%, and 9.17% in 2019, 2035, and 2050 respectively, compared to the baseline scenario (1990). In contrast, the average annual lateral flow of the watershed declined by 2.27%, 5.55%, and 18.24% in 2019, 2035, and 2050 in relation to the baseline scenario (1990) (Figure 9). The continued increase of agricultural land and urban areas and extraction of forest cover, range land, and grass land will further increase the annual surface runoff in 2035. Unfortunately, the surface runoff will decrease from 2035 to 2050 due to the gradual increase of grass land and range land starting from the year 2035. The finding of the study is consistent with [24], from the three hydrologic parameters studied (surface runoff, groundwater, and base flow), surface runoff was the utmost affected by LULC changes.
3.3.3. Spatial Analysis of Watershed Hydrology to LULC Changes
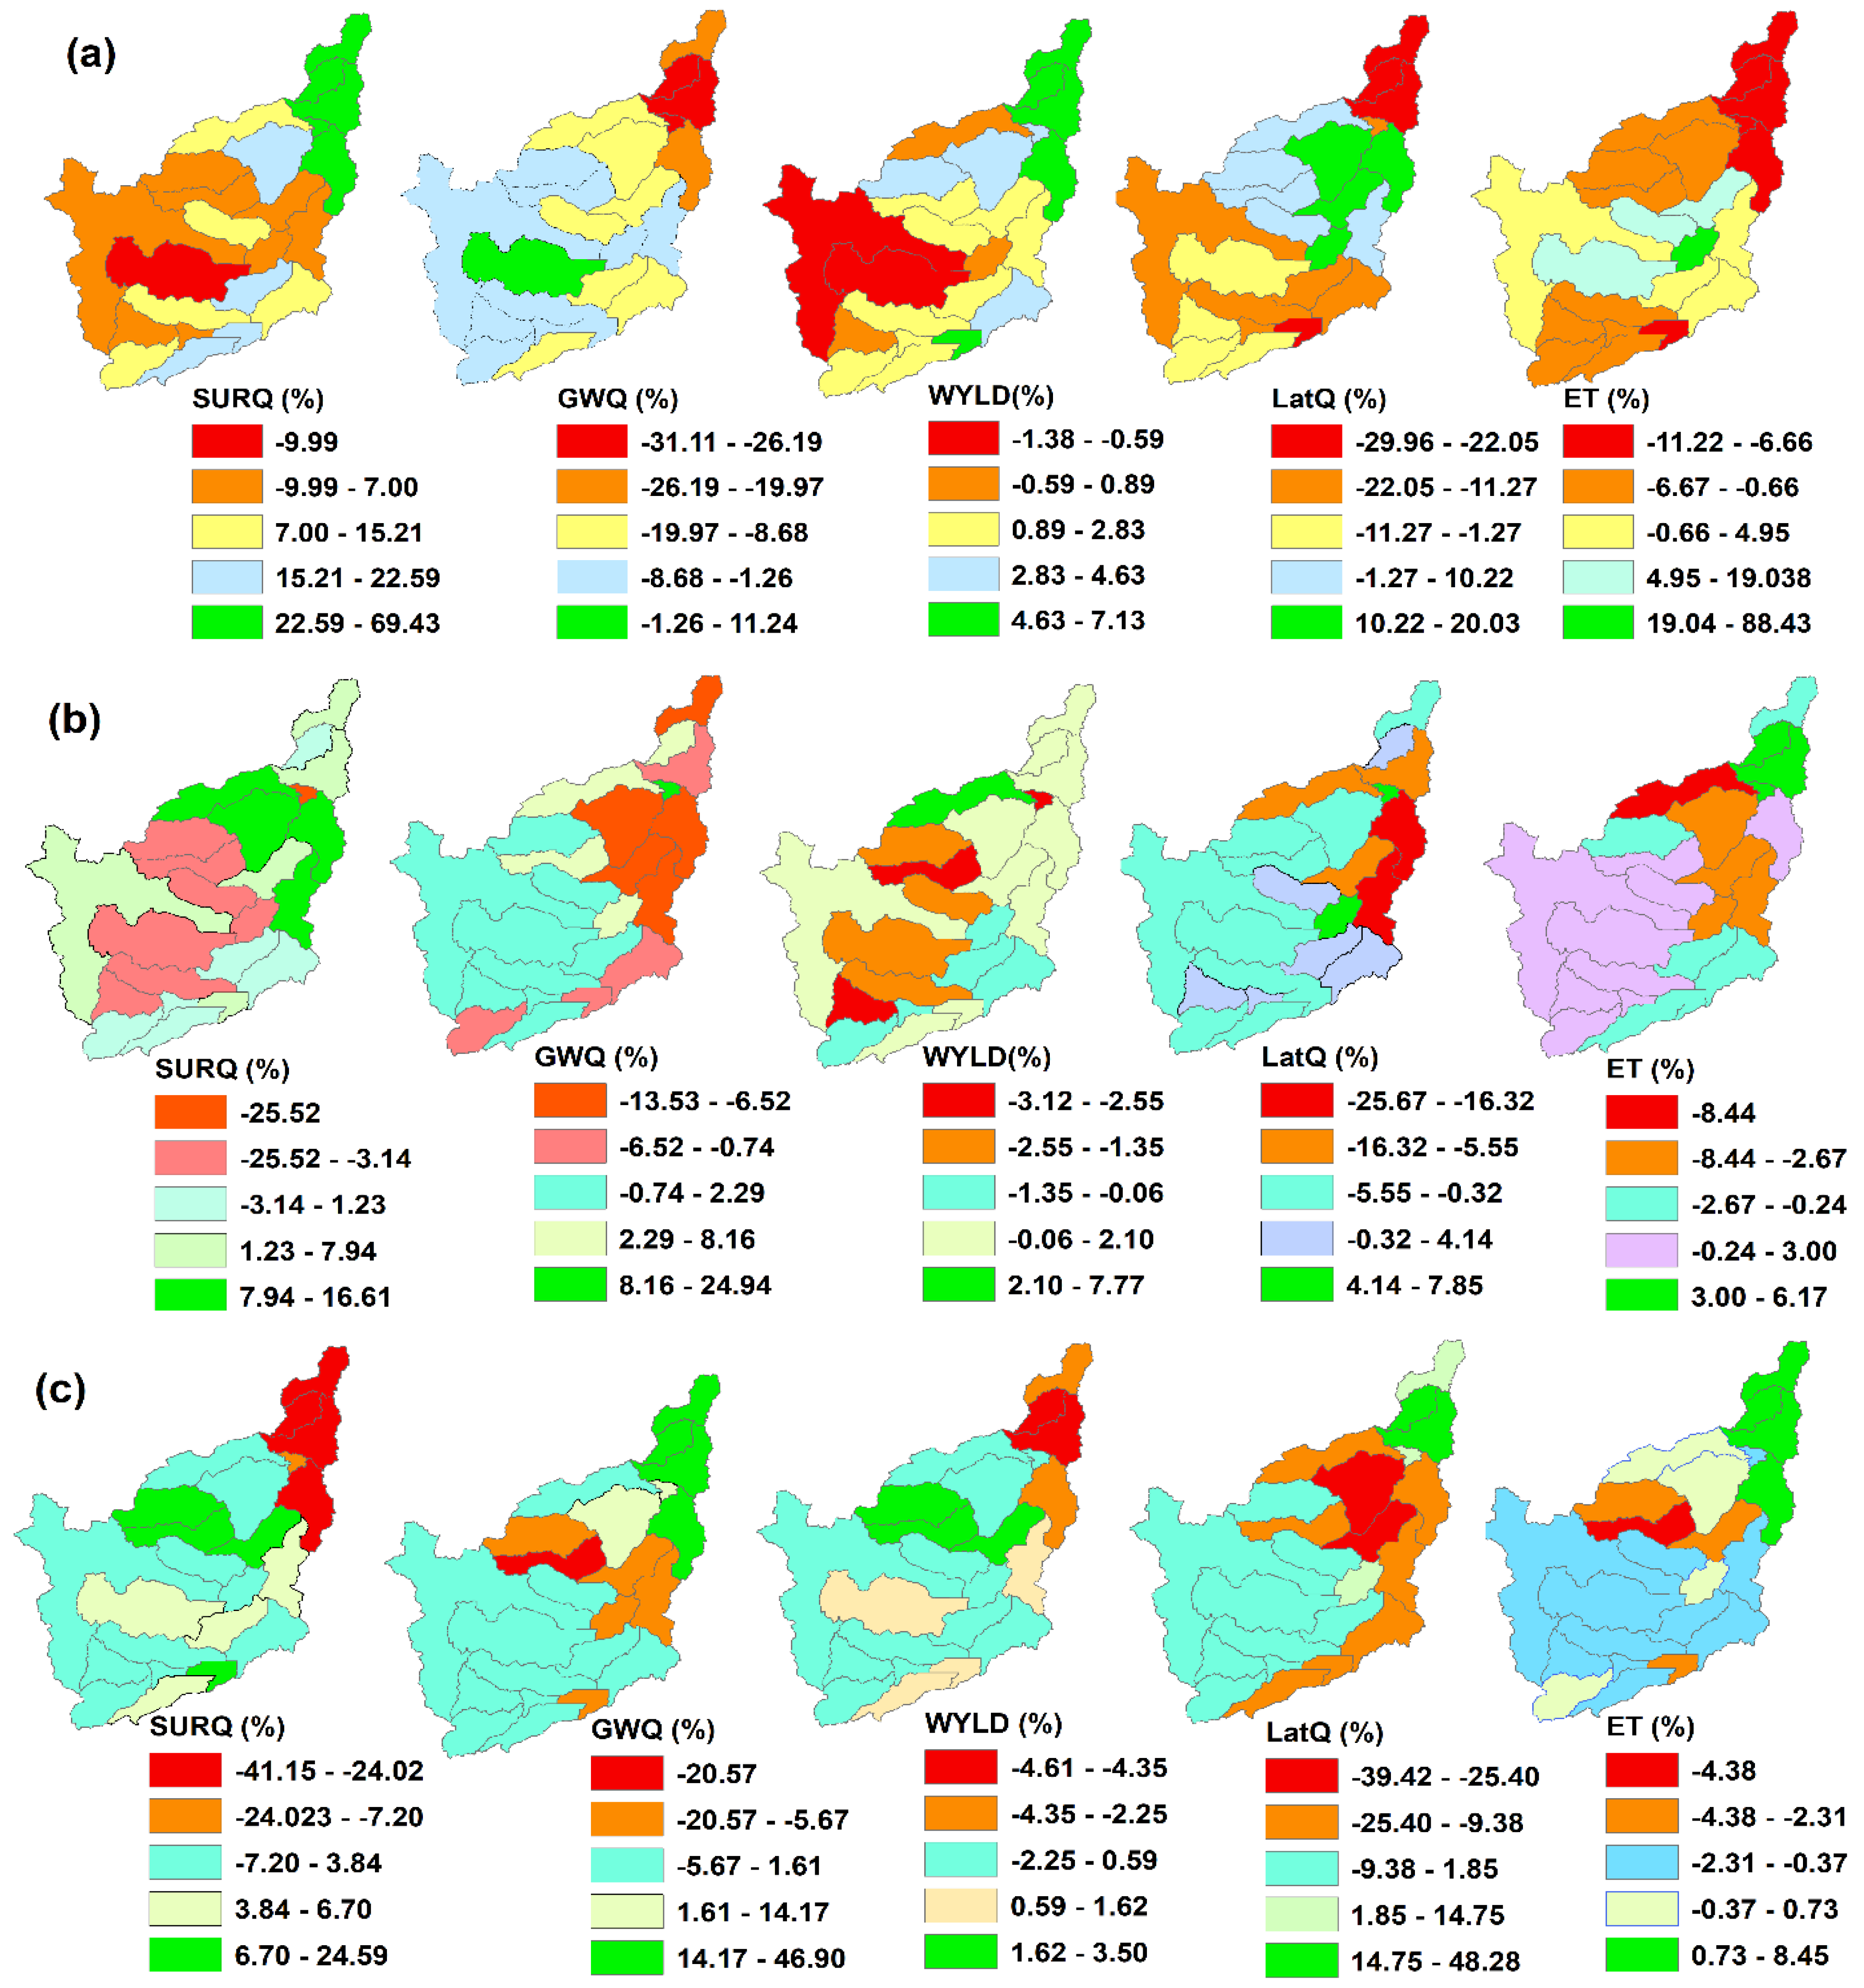
The change of hydrological response amount and direction in each of the sub-basins were assessed from 1990–2050 LULC data as shown in Figure 10 (a) 1990–2019, (b) 2019–2035, and (c) 2035–2050. Ref. [4] indicated the impact of changes of LULC on hydrological parameters at different spatio-temporal scales. Investigating the spatial LULC change impact on the hydrology of the watershed at the sub-basins level allows to define the degree of vulnerability of local water resources [63]. The spatial distribution expansion in agricultural land and urban areas is proved by the positive correlation with surface runoff. The correlations among LULC categories, the water balance components, and between the groups of variables have been shown by the correlation matrix (Table 6).
Similarly, surface runoff increased more in sub-basins characterized by higher urban development and increment of irrigation projects downstream of the watershed. Ref. [64] found that surface runoff is very highly susceptible to urbanization and LULC changes have significant effects on hydrological processes. A very strong positive Pearson correlation factor of 0.97 was found between surface runoff and agricultural land (Table 6). A strong negative correlation was also found between surface runoff and forest land. Changes in rainfall are the dominant factor that induces changes in water balance components.
The evapotranspiration spatial distribution increment matches with the areas detected to be covered by forest land. This agreement was approved by the maximum correlation coefficient of 1.00. Similarly, evapotranspiration is the main water availability determinant in the watershed since it negatively influences surface runoff. The surface runoff for the 1990–2019 time period decreased only in sub-basin 15 (Figure 10a) among all other sub-basins. From 1990 to 2035, surface runoff is the most significant increase in hydrological components occurring mainly in the downstream and central parts of the watershed. For the period of 2035–2050, the minimum surface runoff and water yield happened at downstream of the watershed. The maximum surface runoff occurred in sub-basin 13 and the surrounding areas. Whereas, sub-basin 7 has the least amount of surface runoff (Figure 10c).
Previous studies reported that the LULC change impact on water balance components—such as evapotranspiration—reduced from plant transpiration due to the decline of forest areas, simultaneously increasing surface runoff, particularly during the rainy season [65,66]. The slopes of the watershed in some parts of the downstream and northeastern part of the catchment are very high and steep. An increase in slope length and steep slopes combined with a decrease in forest cover, grass land, and range land increased surface runoff. Furthermore, the rainy season’s peak flow mostly occurs in July and August, resulting in significant surface runoff volumes due to saturated soils. The watershed’s maximum monthly discharges occurred in 2050, while the minimum flow occurred in 1990 (Figure 11) and most monthly peak flows happened in July and August. This causes flooding in some areas of the watershed, particularly downstream of the watershed. The scenarios generated a moderate increase in average annual stream flow for all future time periods due to projected increased surface runoff.
Generally, the increase of surface runoff in wet seasons may result in flooding and a decline in the dry season may affect water scheme practices. Additionally, water resource planners and managers should consider land use land cover change scenarios while planning and designing hydropower and irrigation projects. The impact of historical and future LULC change on hydrological components based on scenario analysis was not conducted in the Nashe watershed. Therefore, the outcomes found in this study offer concerned bodies a way to improve the LULC changes towards increasing forest land to modify surface runoff that contributes to wet season flow, and infiltration that supplies groundwater from which base flow contributed will be increased.
4. Conclusions
The investigation was conducted to analyze the effect of LULC changes on different hydrological processes of the Nashe watershed, Blue Nile River Basin, Ethiopia. For different LULC time periods, the SWAT was utilized to simulate historical and future continuous fluctuations in stream flow through time.
The findings lead to the following conclusions:
- Stream flow, which is the key hydrological parameter for water resources planning and management in the basin, changed due to LULC change. Droughts and floods which influence hydropower and irrigation production, may increase more frequently and last longer as a consequence of LULC change.
- For all time periods, LULC scenarios resulted in a modest increment in average annual stream flow which can be utilized as an input for reservoir operation in hydropower and irrigation projects.
- The relation of LULC categories and hydrological components revealed that the surface runoff was highly attributed to change in the agricultural land area with a higher correlation coefficient.
- The increase of surface runoff and decrease of ground water simulated during the wet season in the Nashe watershed of the Blue Nile River Basin may lead to increasing extreme weather events, sedimentation, runoff, siltation, and water shortages may occur during the dry season and obstruct socio-economic development in Ethiopia.
- Forest land coverage increase is important for decreasing surface runoff and wet season flow, and increasing lateral flow, ground water, and dry season flow. The appropriate management strategy should be prepared based on the commonly LULC change including afforestation in high-risk areas, such as downstream areas in the Northeastern regions of the watershed.
- The study showed that LULC change will affect the operation of the Nashe hydropower reservoir. Additionally, the predicted LULC changes might affect the land use projects within and outside the Nashe watershed and Blue Nile River Basin, including the GERD (Grand Ethiopian Renaissance Dam). Therefore, it is substantial to reduce the enduring adverse impact of LULC changes on the hydrological response of the Blue Nile River Basin tributaries by formulating and implementing land use management interventions that are essential for sustainable land use resources in Ethiopia.
- The decline of groundwater and surface runoff increase could pose a significant problem for agriculture and may increase the need for irrigation in the dry season. As a result, water storage in reservoirs, in addition to beside natural solutions may become more relevant.
- Understanding the impacts of potential LULC dynamics and how they influence watershed hydrology will allow planners and concerned bodies to formulate strategies to reduce adverse impacts of future LULC dynamics. The findings of the study may aid stakeholders and policy makers to make better decisions about water resources and land management in the future.
- Suitable management systems should be implemented, and it is necessary to have long-term water resource plans to minimize the flooding, soil erosion, and sedimentation caused by the change of LULC. Furthermore, proper conservation measures of water and soil are highly necessary, and should be flexible and adaptable to changing insights on the impacts.
Author Contributions
Conceptualization, M.K.L., T.A.D. and J.T.; methodology, M.K.L.; software, M.K.L.; validation, M.K.L., T.A.D. and J.T.; formal analysis, M.K.L.; investigation, M.K.L.; data curation, M.K.L.; writing original draft preparation, M.K.L.; writing review and editing, M.K.L., T.A.D. and J.T.; visualization, M.K.L.; supervision, T.A.D. and J.T. All authors have read and agreed to the published version of the manuscript.
Funding
This research was part of the DAAD-EECBP Home Grown PhD Scholarship Program under (EECBP Homegrown PhD Program-2019).
Institutional Review Board Statement
Not applicable.
Informed Consent Statement
Not applicable.
Data Availability Statement
The data used in this study can be available from the authors on reasonable request.
Acknowledgments
The first author thanks the German Academic Exchange Service (DAAD) for providing a scholarship during the study. The authors would like to acknowledge the University of Rostock for their willingness to finance the publication under the funding program Open Access Publication.
Conflicts of Interest
The authors declare that they have no conflicts of interest or financial conflicts to disclose.
References
- Zhang, L.; Nan, Z.; Yu, W.; Ge, Y. Hydrological Responses to Land-Use Change Scenarios under Constant and Changed Climatic Conditions. Environ. Manag. 2016, 57, 412–431. [Google Scholar] [CrossRef]
- Gashaw, T.; Tulu, T.; Argaw, M.; Worqlul, A.W. Modeling the hydrological impacts of land use/land cover changes in the Andassa watershed, Blue Nile Basin, Ethiopia. Sci. Total Environ. 2018, 619–620, 1394–1408. [Google Scholar] [CrossRef]
- Marhaento, H.; Booij, M.J.; Rientjes, T.H.M.; Hoekstra, A.Y. Attribution of changes in the water balance of a tropical catchment to land use change using the SWAT model. Hydrol. Process. 2017, 31, 2029–2040. [Google Scholar] [CrossRef]
- Warburton, M.L.; Schulze, R.E.; Jewitt, G.P.W. Hydrological impacts of land use change in three diverse South African catchments. J. Hydrol 2012, 414–415, 118–135. [Google Scholar] [CrossRef]
- Pang, S.; Wang, X.; Melching, C.S.; Feger, K.H. Development and testing of a modified SWAT model based on slope condition and precipitation intensity. J. Hydrol. 2020, 588, 125098. [Google Scholar] [CrossRef]
- Hyandye, C.B.; Worqul, A.; Martz, L.W.; Muzuka, A.N.N. The impact of future climate and land use/cover change on water resources in the Ndembera watershed and their mitigation and adaptation strategies. Environ. Syst. Res. 2018, 7, 1–24. [Google Scholar] [CrossRef] [Green Version]
- Elfert, S.; Bormann, H. Simulated impact of past and possible future land use changes on the hydrological response of the Northern German lowland “Hunte” catchment. J. Hydrol. 2010, 383, 245–255. [Google Scholar] [CrossRef]
- Leta, M.K.; Demissie, T.A.; Tränckner, J. Modeling and prediction of land use land cover change dynamics based on land change modeler (Lcm) in nashe watershed, upper blue nile basin, Ethiopia. Sustainability 2021, 13, 3740. [Google Scholar] [CrossRef]
- Aboelnour, M.; Gitau, M.W.; Engel, B.A. Hydrologic response in an urban watershed as affected by climate and land-use change. Water 2019, 11, 1603. [Google Scholar] [CrossRef] [Green Version]
- Maetens, W.; Vanmaercke, M.; Poesen, J.; Jankauskas, B.; Jankauskiene, G.; Ionita, I. Effects of land use on annual runoff and soil loss in Europe and the Mediterranean: A meta-analysis of plot data. Prog. Phys. Geogr. 2012, 36, 599–653. [Google Scholar] [CrossRef]
- Anand, J.; Gosain, A.K.; Khosa, R. Prediction of land use changes based on Land Change Modeler and attribution of changes in the water balance of Ganga basin to land use change using the SWAT model. Sci. Total Environ. 2018, 644, 503–519. [Google Scholar] [CrossRef]
- Verma, S.; Bhattarai, R.; Bosch, N.S.; Cooke, R.C.; Kalita, P.K.; Markus, M. Climate Change Impacts on Flow, Sediment and Nutrient Export in a Great Lakes Watershed Using SWAT. Clean-Soil Air. Water. 2015, 43, 1464–1474. [Google Scholar] [CrossRef]
- Gayathri, D.K.; Ganasri, B.P.; Dwarakish, G.S. A Review on Hydrological Models. Aquat. Procedia. 2015, 4, 1001–1007. [Google Scholar]
- Tegegne, G.; Park, D.K.; Kim, Y.O. Comparison of hydrological models for the assessment of water resources in a data-scarce region, the Upper Blue Nile River Basin. J. Hydrol. Reg. Stud. 2017, 14, 49–66. [Google Scholar] [CrossRef]
- Waseem, M.; Kachholz, F.; Tränckner, J. Suitability of common models to estimate hydrology and diffuse water pollution in North-eastern German lowland catchments with intensive agricultural land use. Front Agric. Sci. Eng. 2018, 5, 420–431. [Google Scholar] [CrossRef] [Green Version]
- Arnold, J.G.; Moriasi, D.N.; Gassman, P.W.; Abbaspour, K.C.; White, M.J.; Srinivasan, R.; Santhi, C.; Harmel, D.R.; van Griensven, A.; Liew, W.M.; et al. Swat: Model Use, Calibration, And Validation. Trans. ASABE 2012, 55, 1491–1508. [Google Scholar] [CrossRef]
- Gassman, P.W.; Sadeghi, A.M.; Srinivasan, R. Applications of the SWAT Model Special Section: Overview and Insights. J. Environ. Qual. 2014, 43, 1–8. [Google Scholar] [CrossRef] [PubMed]
- Abbaspour, K. SWAT-Calibration and Uncertainty Programs (CUP). Neprash Technology CA. Available online: http://www.neprashtechnology.ca/wp-content/uploads/2015/06/Usermanual_SwatCup.pdf (accessed on 25 August 2021).
- Shrestha, M.K.; Recknagel, F.; Frizenschaf, J.; Meyer, W. Assessing SWAT models based on single and multi-site calibration for the simulation of flow and nutrient loads in the semi-arid Onkaparinga catchment in South Australia. Agric. Water Manag. 2016, 175, 61–71. [Google Scholar] [CrossRef]
- Baker, T.J.; Miller, S.N. Using the Soil and Water Assessment Tool (SWAT) to assess land use impact on water resources in an East African watershed. J. Hydrol. 2013, 486, 100–111. [Google Scholar] [CrossRef]
- Wagner, P.D.; Kumar, S.; Schneider, K.; Earth, S. An assessment of land use change impacts on the water resources of the Mula and Mutha Rivers catchment upstream of Pune, India. Hydrol. Earth Syst. Sci. Discuss. 2013, 10, 1943–1985. [Google Scholar]
- Saddique, N.; Mahmood, T.; Bernhofer, C. Quantifying the impacts of land use/land cover change on the water balance in the afforested River Basin, Pakistan. Environ. Earth Sci. 2020, 79, 1–13. [Google Scholar] [CrossRef]
- Dos Santos, F.; de Oliveira, R.; Di Lollo, J. Effects of Land Use Changes on Streamflow and Sediment Yield in Atibaia River Basin—SP, Brazil. Water 2020, 12, 1711. [Google Scholar] [CrossRef]
- Gyamfi, C.; Ndambuki, J.M.; Salim, R.W. Hydrological responses to land use/cover changes in the Olifants Basin, South Africa. Water 2016, 8, 588. [Google Scholar] [CrossRef]
- Twisa, S.; Kazumba, S.; Kurian, M.; Buchroithner, M.F. Evaluating and predicting the effects of land use changes on hydrology in Wami river basin, Tanzania. Hydrology 2020, 7, 17. [Google Scholar] [CrossRef] [Green Version]
- Keenan, R.J.; Reams, G.A.; Achard, F.; de Freitas, J.V.; Grainger, A.; Lindquist, E. Dynamics of global forest area: Results from the FAO Global Forest Resources Assessment 2015. For. Ecol. Manag. 2015, 352, 9–20. [Google Scholar] [CrossRef]
- Rafiei, V.; Ghahramani, A.; An-Vo, D.A.; Mushtaq, S. Modelling hydrological processes and identifying soil erosion sources in a tropical catchment of the great barrier reef using SWAT. Water 2020, 12, 2179. [Google Scholar] [CrossRef]
- Krajewski, A.; Sikorska-Senoner, A.E.; Hejduk, L.; Banasik, K. An Attempt to Decompose the Impact of Land Use and Climate Change on Annual Runoff in a Small Agricultural Catchment. Water Resour. Manag. 2021, 35, 881–896. [Google Scholar] [CrossRef]
- Kebede, W.; Tefera, M.; Habitamu, T.; Alemayehu, T. Impact of Land Cover Change on Water Quality and Stream Flow in Lake Hawassa Watershed of Ethiopia. Agric. Sci. 2014, 5, 647–659. [Google Scholar] [CrossRef] [Green Version]
- Khadr, M. Forecasting of meteorological drought using Hidden Markov Model (case study: The upper Blue Nile river basin, Ethiopia). Ain. Shams. Eng. J. 2016, 7, 47–56. [Google Scholar] [CrossRef] [Green Version]
- Tekalegn, W.A.; Elagib, N.A.; Ribbe, L.; Heinrich, J. Hydrological responses to land use/cover changes in the source region of the Upper Blue Nile Basin, Ethiopia. Sci. Total Environ. 2017, 575, 724–741. [Google Scholar] [CrossRef]
- Dibaba, W.T.; Demissie, T.A.; Miegel, K. Watershed hydrological response to combined land use/land cover and climate change in highland ethiopia: Finchaa catchment. Water 2020, 12, 1801. [Google Scholar] [CrossRef]
- Galata, A.W.; Demissei, T.A.; Leta, M.K. Watershed Hydrological Responses to Changes in Land Use and Land Cover at Hangar Watershed, Ethiopia. Iran. J. Energy Environ. 2020, 11, 1–7. [Google Scholar]
- Karamage, F.; Zhang, C.; Fang, X.; Liu, T.; Ndayisaba, F.; Nahayo, L.; Kayiranga, A.; Nsengiyumva, J.B. Modeling rainfall-runoffresponse to land use and land cover change in Rwanda (1990–2016). Water 2017, 9, 147. [Google Scholar] [CrossRef] [Green Version]
- Santos, R.M.B.; Fernandes, L.F.S.; Cortes, R.M.V.; Pacheco, F.A.L. Hydrologic impacts of land use changes in the Sabor river basin: A historical view and future perspectives. Water 2019, 11, 1464. [Google Scholar] [CrossRef] [Green Version]
- Megersa, K.L.; Tamene, A.D.; Sifan, A.K. Impacts of Land Use Land Cover Change on Sediment Yield and Stream Flow. Int. J. Sci. Technol. 2017, 6, 763–781. [Google Scholar]
- Kitila, G.; Gebrekidan, H.; Alamrew, T. Soil quality attributes induced by land use changes in the Fincha’a watershed, Nile Basin of western Ethiopia. Sci. Technol. Arts. Res. J. 2018, 5, 16. [Google Scholar] [CrossRef] [Green Version]
- Gebrehiwot, S.G.; Bewket, W.; Gärdenäs, A.I.; Bishop, K. Forest cover change over four decades in the Blue Nile Basin, Ethiopia: Comparison of three watersheds. Reg. Environ. Chang. 2014, 14, 253–266. [Google Scholar] [CrossRef]
- Gumindoga, W.; Rientjes, T.H.M.; Haile, A.T.; Dube, T. Predicting streamflow for land cover changes in the Upper Gilgel Abay River Basin, Ethiopia: A TOPMODEL based approach. Phys. Chem. Earth. 2014, 76–78, 3–15. [Google Scholar] [CrossRef]
- Sith, R.; Nadaoka, K. Comparison of SWAT and GSSHA for high time resolution prediction of stream flow and sediment concentration in a small agricultural watershed. Hydrology 2017, 4, 27. [Google Scholar] [CrossRef] [Green Version]
- Banasik, K.; Hejduk, L.; Krajewski, A.; Wasilewicz, M. The intensity of siltation of a small reservoir in Poland and its relationship to environmental changes. Catena 2021, 204, 105436. [Google Scholar] [CrossRef]
- Kushwaha, A.; Jain, M.K. Hydrological Simulation in a Forest Dominated Watershed in Himalayan Region using SWAT Model. Water Resour. Manag. 2013, 27, 3005–3023. [Google Scholar] [CrossRef]
- Ghoraba, S.M. Hydrological modeling of the Simly Dam watershed (Pakistan) using GIS and SWAT model. Alexandria Eng. J. 2015, 54, 583–594. [Google Scholar] [CrossRef] [Green Version]
- Khalid, K.; Ali, M.F.; Rahman, N.F.A.; Mispan, M.R.; Haron, S.H.; Othman, Z.; Bachok, M.F. Sensitivity Analysis in Watershed Model Using SUFI-2 Algorithm. Procedia Eng. 2016, 162, 441–447. [Google Scholar] [CrossRef] [Green Version]
- Moriasi, D.N.; Gitau, M.W.; Pai, N.; Daggupati, P. Hydrologic and water quality models: Performance measures and evaluation criteria. Trans. ASABE 2015, 58, 1763–1785. [Google Scholar]
- Vilaysane, B.; Takara, K.; Luo, P.; Akkharath, I.; Duan, W. Hydrological Stream Flow Modelling for Calibration and Uncertainty Analysis Using SWAT Model in the Xedone River Basin, Lao PDR. Procedia Environ. Sci. 2015, 28, 380–390. [Google Scholar] [CrossRef] [Green Version]
- Abbaspour, K.C.; Vaghefi, S.A.; Srinivasan, R. A guideline for successful calibration and uncertainty analysis for soil and water assessment: A review of papers from the 2016 international SWAT conference. Water 2017, 10, 6. [Google Scholar] [CrossRef] [Green Version]
- Gholami, A.; Habibnejad Roshan, M.; Shahedi, K.; Vafakhah, M.; Solaymani, K. Hydrological stream flow modeling in the Talar catchment (central section of the Alborz Mountains, north of Iran): Parameterization and uncertainty analysis using SWAT-CUP. J. Water Land Dev. 2016, 30, 57–69. [Google Scholar] [CrossRef] [Green Version]
- Smarzyńska, K.; Miatkowski, Z. Calibration and validation of SWAT model for estimating water balance and nitrogen losses in a small agricultural watershed in central Poland. J. Water Land Dev. 2016, 29, 31–47. [Google Scholar] [CrossRef]
- Sao, D.; Kato, T.; Tu, L.H.; Thouk, P.; Fitriyah, A.; Oeurng, C. Evaluation of different objective functions used in the sufi-2 calibration process of swat-cup on water balance analysis: A case study of the pursat river basin, cambodia. Water 2020, 12, 2901. [Google Scholar] [CrossRef]
- Yan, B.; Fang, N.F.; Zhang, P.C.; Shi, Z.H. Impacts of land use change on watershed streamflow and sediment yield: An assessment using hydrologic modelling and partial least squares regression. J. Hydrol. 2013, 484, 26–37. [Google Scholar] [CrossRef]
- Tankpa, V.; Wang, L.; Awotwi, A.; Singh, L.; Thapa, S.; Atanga, R.A.; Guo, X. Modeling the effects of historical and future land use/land cover change dynamics on the hydrological response of Ashi watershed, northeastern China. Environ. Dev. Sustain. 2020, 23, 7883–7912. [Google Scholar] [CrossRef]
- Whittaker, G.; Confesor, R.; Di Luzio, M.; Arnold, J.G. Detection of overparameterization and overfitting in an automatic calibration of SWAT. Trans. ASABE 2010, 53, 1487–1499. [Google Scholar] [CrossRef]
- Boufala, M.; El Hmaidi, A.; Chadli, K.; Essahlaoui, A.; El Ouali, A.; Taia, S. Hydrological modeling of water and soil resources in the basin upstream of the Allal El Fassi dam (Upper Sebou watershed, Morocco). Model. Earth Syst. Environ. 2019, 5, 1163–1177. [Google Scholar] [CrossRef]
- Niraula, R.; Meixner, T.; Norman, L.M. Determining the importance of model calibration for forecasting absolute/relative changes in streamflow from LULC and climate changes. J. Hydrol. 2015, 522, 439–451. [Google Scholar] [CrossRef]
- Makhtoumi, Y.; Li, S.; Ibeanusi, V.; Chen, G. Evaluating water balance variables under land use and climate projections in the upper choctawhatchee River Watershed, in Southeast US. Water 2020, 12, 2205. [Google Scholar] [CrossRef]
- Nasiri, S.; Ansari, H.; Ziaei, A.N. Simulation of water balance equation components using SWAT model in Samalqan Watershed (Iran). Arab. J. Geosci. 2020, 13, 1–15. [Google Scholar] [CrossRef]
- Benegas, L.; Ilstedt, U.; Roupsard, O.; Jones, J.; Malmer, A. Effects of trees on infiltrability and preferential flow in two contrasting agroecosystems in Central America. Agric. Ecosyst. Environ. 2014, 183, 185–196. [Google Scholar] [CrossRef]
- Santos, D.V.; Laurent, F.; Abe, C.; Messner, F. Hydrologic response to land use change in a large basin in eastern Amazon. Water 2018, 10, 429. [Google Scholar] [CrossRef] [Green Version]
- Mango, L.M.; Melesse, A.M.; McClain, M.E.; Gann, D.; Setegn, S.G. Land use and climate change impacts on the hydrology of the upper Mara River Basin, Kenya: Results of a modeling study to support better resource management. Hydrol. Earth Syst. Sci. 2011, 15, 2245–2258. [Google Scholar] [CrossRef] [Green Version]
- Belihu, M.; Tekleab, S.; Abate, B.; Bewket, W. Hydrologic response to land use land cover change in the Upper Gidabo Watershed, Rift Valley Lakes Basin, Ethiopia. HydroResearch 2020, 3, 85–94. [Google Scholar] [CrossRef]
- Shawul, A.A.; Chakma, S.; Melesse, A.M. The response of water balance components to land cover change based on hydrologic modeling and partial least squares regression (PLSR) analysis in the Upper Awash Basin. J. Hydrol. Reg. Stud. 2019, 26, 100640. [Google Scholar] [CrossRef]
- Abe, C.A.; Lobo, F.D.L.; Dibike, Y.B.; Costa, M.P.D.F.; Dos Santos, V.; Novo, E.M.L. Modelling the effects of historical and future land cover changes on the hydrology of an Amazonian basin. Water 2018, 10, 932. [Google Scholar] [CrossRef] [Green Version]
- Aduah, M.S.; Jewitt, G.P.W.; Toucher, M.L.W. Assessing impacts of land use changes on the hydrology of a lowland rainforest catchment in Ghana, West Africa. Water 2017, 10, 9. [Google Scholar] [CrossRef] [Green Version]
- Panday, P.K.; Coe, M.T.; Macedo, M.N.; Lefebvre, P.; de Almeida Castanho, A.D. Deforestation offsets water balance changes due to climate variability in the Xingu River in eastern Amazonia. J. Hydrol. 2015, 523, 822–829. [Google Scholar] [CrossRef]
- Dias, L.C.P.; Macedo, M.N.; Costa, M.H.; Coe, M.T.; Neill, C. Effects of land cover change on evapotranspiration and streamflow of small catchments in the Upper Xingu River Basin, Central Brazil. J. Hydrol. Reg. Stud. 2015, 4, 108–122. [Google Scholar] [CrossRef] [Green Version]
Figure 1.
Location map of the study area.

Figure 2.
Monthly average rainfall and temperature features of the stations in the Nashe watershed.

Figure 3.
The DEM (Elevation) (m) (a), Slope (%) (b), and Sub-basins (c) of the Nashe watershed.

Figure 4.
The Land use land cover of the study watershed.

Figure 5.
The soil types of the Nashe watershed.

Figure 6.
Historical and predicted land use land cover dynamics in the Nashe watershed.

Figure 7.
Average monthly stream flow (a) Calibration and (b) Validation of the SWAT model for Nashe watershed.
Figure 7.
Average monthly stream flow (a) Calibration and (b) Validation of the SWAT model for Nashe watershed.

Figure 8.
Seasonal hydrological components of the Nashe watershed.

Figure 9.
Average annual hydrological components under land use land cover scenarios.

Figure 10.
Spatial distribution of hydrological components at the sub-basin level (a) 1990–2019, (b) 2019–2035, (c) 2035–2050.
Figure 10.
Spatial distribution of hydrological components at the sub-basin level (a) 1990–2019, (b) 2019–2035, (c) 2035–2050.

Figure 11.
The stream flow of the watershed for different LULC time periods.


Table 1.
Input data description used in the SWAT model.
| Data Types | Research Data | Resolution/Period | Sources |
|---|---|---|---|
| Spatial data | Digital Elevation Model (DEM) | 30 m | The shuttle radar topographic mapping obtained from the Ministry of Water, Irrigation, and Energy, Ethiopia |
| Land Use Land cover | 30 m/(1990, 2005, 2019, 2035, and 2050) | Derived from Landsat images (Landsat-5, Landsat-7, and Landsat-8) and Predicted by Land change modeler model [8] | |
| Soil | 1:50,000 | Ministry of Water, Irrigation, and Energy (MoWIE), Ethiopia | |
| Meteorological data | Daily observed weather data | 1985–2019 | National Meteorological Agency, Ethiopia |
| Hydrological data | Daily stream flow | 1985–2008 | Ministry of Water, Irrigation, and Energy (MoWIE), Ethiopia |
Table 2.
Performance evaluation measurements for stream flow simulation.
| Performance Rating | NSE | PBIAS | R² |
|---|---|---|---|
| Unsatisfactory | NSE ≤ 0.5 | PBIAS ≥ ±25 | R² < 0.50 |
| Satisfactory | 0.5 < NSE ≤ 0.65 | ±15 ≤ PBIAS < ±25 | 0.50 < R² < 0.70 |
| Good | 0.65 < NSE ≤ 0.75 | ±10 ≤ PBIAS < ±15 | 0.70 < R² < 0.80 |
| Very good | 0.75 < NSE ≤ 1 | PBIAS < ±10 | >0.80 |
Table 3.
Sensitive flow parameters and their rank.
| Parameters Name | Description | Sensitivity | Parameter Value | ||||
|---|---|---|---|---|---|---|---|
| t-Stat | p-Value | Rank | Min | Max | Fitted | ||
| r__RCHRG_DP.gw | Deep aquifer percolation fraction | −0.54 | 0.04 | 9 | 0 | 1 | 0.837 |
| r__SLSUBBSN.hru | Average slope length (m) | −0.83 | 0.03 | 8 | 0 | 150 | 76.98 |
| r__SOL_AWC (..).sol | Soil available water capacity (mm H2O/mm soil) | −0.96 | 0.03 | 7 | −25 | 25 | −12.1 |
| v__GWQMN.gw | Threshold depth of water in shallow aquifer required for return flow (mm) | −1.17 | 0.01 | 6 | 0 | 5000 | 1921 |
| v__CH_N2.rte | Manning’s roughness coefficient for the main channel | 1.96 | 0.00 | 5 | 0 | 1 | 0.524 |
| v__ALPHA_BF.gw | Base flow alpha factor for bank storage | 2.68 | 0.00 | 4 | 0 | 1 | 0.367 |
| r__SOL_K (..).sol | Saturated hydraulic conductivity (mm/hour) | 7.23 | 0.00 | 3 | −25 | 25 | 17.15 |
| v__GW_DELAY.gw | Ground water Delay from soil to channels (days) | −8.21 | 0.00 | 2 | 0 | 500 | 19.02 |
| r__CN2.mgt | SCS runoff curve number | 13.13 | 0.00 | 1 | −25 | 25 | −16.31 |
Table 4.
Stream flow calibration and validation model performance values of Nashe watershed.
| Index | R2 | NSE | PBIAS | p-Factor | r-Factor | Index |
|---|---|---|---|---|---|---|
| Calibration | 0.80 | 0.76 | 3.03 | 0.83 | 0.74 | Calibration |
| Validation | 0.85 | 0.80 | 1.28 | 0.80 | 0.69 | Validation |
Table 5.
Average annual hydrological components (mm) and percentage changes in the Nashe watershed.
| Hydrologic Components | LULC Scenarios | Changes (%) | |||||||
|---|---|---|---|---|---|---|---|---|---|
| 1990 | 2005 | 2019 | 2035 | 2050 | 1990–2005 | 2005–2019 | 2019–2035 | 2035–2050 | |
| Surface runoff | 288.15 | 292.04 | 311.02 | 318.26 | 314.56 | 1.35 | 6.50 | 2.33 | −1.16 |
| Lateral flow | 69.24 | 67.88 | 67.67 | 65.40 | 60.61 | −1.96 | -0.31 | −3.35 | −7.32 |
| Ground water | 171.59 | 166.99 | 147.20 | 143.72 | 152.89 | −2.68 | −11.85 | −2.36 | 6.38 |
| Water Yield | 528.98 | 526.02 | 526.86 | 527.96 | 528.06 | −0.56 | 0.16 | 0.21 | −0.02 |
| Evapotranspiration | 284.11 | 283.06 | 279.26 | 277.11 | 275.81 | −0.37 | −1.34 | −0.77 | −0.47 |
Table 6.
Pair-wise Pearson correlation coefficients for land use, land cover classes, and hydrological components between 1990 and 2050 time periods.
Table 6.
Pair-wise Pearson correlation coefficients for land use, land cover classes, and hydrological components between 1990 and 2050 time periods.
| SurfQ 1 | LatQ | GWQ | WYLD | ET | AGRL | FRST | GRSL | RNGL | UrbL | WatB | |
|---|---|---|---|---|---|---|---|---|---|---|---|
| SurfQ 1 | 1.00 | ||||||||||
| LatQ | −0.60 | 1.00 | |||||||||
| GWQ | −0.97 | 0.41 | 1.00 | ||||||||
| WYLD | −0.38 | 0.86 | 0.24 | 1.00 | |||||||
| ET | −0.96 | 0.79 | 0.88 | 0.57 | 1.00 | ||||||
| AGRL | 0.97 | −0.74 | −0.89 | −0.52 | −0.99 | 1.00 | |||||
| FRST | −0.96 | 0.79 | 0.89 | 0.60 | 1.00 | −0.98 | 1.00 | ||||
| GRSL | −0.89 | 0.78 | 0.78 | 0.51 | 0.95 | -0.97 | 0.93 | 1.00 | |||
| RNGL | −0.92 | 0.57 | 0.87 | 0.27 | 0.90 | −0.95 | 0.88 | 0.96 | 1.00 | ||
| UrbL | 0.71 | −0.99 | −0.53 | −0.82 | −0.87 | 0.84 | −0.86 | −0.87 | −0.69 | 1.00 | |
| WatB | 0.99 | −0.70 | −0.94 | −0.48 | −0.98 | 0.97 | −0.99 | −0.89 | −0.88 | 0.79 | 1.00 |
1 SUR Q: surface runoff, LAT Q: lateral flow, GWQ: groundwater flow, WYLD: water yield, ET: evapotranspiration, AGRL: agricultural land, FRST: forest land, GRSL: grassland, RNGL: range land, UrbL: Urban land, WatB: water body.
Publisher’s Note: MDPI stays neutral with regard to jurisdictional claims in published maps and institutional affiliations. |
© 2021 by the authors. Licensee MDPI, Basel, Switzerland. This article is an open access article distributed under the terms and conditions of the Creative Commons Attribution (CC BY) license (https://creativecommons.org/licenses/by/4.0/).
Share and Cite
MDPI and ACS Style
Leta, M.K.; Demissie, T.A.; Tränckner, J. Hydrological Responses of Watershed to Historical and Future Land Use Land Cover Change Dynamics of Nashe Watershed, Ethiopia. Water 2021, 13, 2372. https://doi.org/10.3390/w13172372
AMA Style
Leta MK, Demissie TA, Tränckner J. Hydrological Responses of Watershed to Historical and Future Land Use Land Cover Change Dynamics of Nashe Watershed, Ethiopia. Water. 2021; 13(17):2372. https://doi.org/10.3390/w13172372
Chicago/Turabian StyleLeta, Megersa Kebede, Tamene Adugna Demissie, and Jens Tränckner. 2021. "Hydrological Responses of Watershed to Historical and Future Land Use Land Cover Change Dynamics of Nashe Watershed, Ethiopia" Water 13, no. 17: 2372. https://doi.org/10.3390/w13172372
Note that from the first issue of 2016, this journal uses article numbers instead of page numbers. See further details here.