
The Significance of Hydrogen and Oxygen Stable Isotopes in the Water Vapor Source in Dingxi Area
by
 ,
,
Xixi Wu
1,2, 
Fenli Chen
1,2,*,
Xueyuan Liu
1,2,
Shengjie Wang
1,2,
Mingjun Zhang
1,2,
Guofeng Zhu
1,2,
Xin Zhou
1,2 and
Jufan Chen
1,2 1
College of Geography and Environmental Science, Northwest Normal University, Lanzhou 730070, China
2
Key Laboratory of Resource Environment and Sustainable Development of Oasis, Lanzhou 730070, China
*
Author to whom correspondence should be addressed.
Water 2021, 13(17), 2374; https://doi.org/10.3390/w13172374
Submission received: 6 July 2021
/
Revised: 25 August 2021
/
Accepted: 26 August 2021
/
Published: 29 August 2021
(This article belongs to the Section Hydrology)
Abstract
:Deuterium excess and stable oxygen isotopes in precipitation have been widely applied to trace the source of water vapor. In this study, hydrogen and oxygen isotope analyses of samples were collected on seven sampling stations in Dingxi area from April 2019 to April 2020. The seasonal variation of hydrogen and oxygen stable isotopes as well as the d-excess indicate that the source of water vapor in Dingxi area is mostly from a single source. However, there are different sources of water vapor in the summer. Meanwhile, water vapor sources were analyzed using the Lagrange algorithm, indicating two different principal water vapor sources for precipitation in the area: some locally recycled water vapor in summer and autumn, and most water vapor from the westerly belt. Further studies using the PSCF and CWT analysis methods show that the locally recycled water vapor contributes more to its precipitation in the northwest of Dingxi area.
1. Introduction
The stable isotope technique has been widely applied in many research areas, especially in hydrology, giving solutions for discovering the origin and formation of different water bodies [1,2,3,4]. As a tracer of water sources and hydrological processes [5], hydrogen and oxygen isotopes have contributed significantly to reflecting the atmospheric, land surface, and groundwater characteristics [6] and to our understanding of the evolution process of the water cycle in different geographical regions [7,8,9,10]. Due to the isotopic fractionation, there is a linear correlation between δ18O and δD, defined as the global atmospheric water line by Craig [11]. Furthermore, some scholars [12] believe that there is a close relationship between the characteristics of the atmospheric water line and the source of water vapor and distinguish different sources of water vapor according to the slope of the atmospheric water line.
Currently, the main methods for analyzing the sources of water vapor are the HYSPLIT and FLEXPART models [13], the isotope analysis method [14], and the Euler method [15]. As isotopic values likely diverge from different sources [16], it is possible to use the changes and distribution of stable isotopes of hydrogen and oxygen to determine the sources of water vapor in different climate regions [17]. D-excess in precipitation has been reported in conditions in which moisture recycling through evaporation plays a role in indicating the source of water vapor and the hydrological system [18,19]. Many scholars have confirmed that monsoon water vapor has an influence in the northwest region on a large scale to a certain extent [20,21,22]. However, research on the sources of water vapor in the northwestern inland of China found that the water vapor fractionation of precipitation is mainly dynamic and that the raindrops experienced a certain below-cloud secondary evaporation during the falling process, which also mixed with a certain amount of local moisture [23]. Since the isotope method still has limitations and produces inaccurate analyses of the proportion of different water vapor sources, scholars gradually used the HYSPLIT model combined with meteorological data to analyze water vapor sources more accurately, which makes for greater progress in research on the water vapor source.
At first, most scholars used a single method to analyze the sources of water vapor. In recent years, backward trajectory analysis combined with d-excess in water vapor has been used to calculate the potential sources. The Concentration Weighted Trajectory (CWT) model was used to identify that air parcels coming from the north-westerly direction affect the region of Patras [24], which shows the feasibility of using this method in indicating the source of water vapor. Some scholars [25,26] also analyzed the potential sources of the middle and upper reaches of the Heihe River in China using the Potential Source Contribution Factor (PSCF) and CWT methods, which was first used to identify the potential sources of pollutants using the airflow trajectory [27]. As there are few factors affecting the d-excess value and the d-excess value in the water vapor formed by evaporation is higher, the visual analyses from the PSCF and CWT methods can help better distinguish and identify the potential evaporation sources of each research site.
In recent decades, through stable isotope studies, scholars have gained a certain understanding of the source of water vapor in Northwest China and have proven that there is a certain amount of monsoon water vapor. However, as one of the extremely water-scarce regions in Gansu Province, is Dingxi also affected by monsoon water vapor? Therefore, exploring the source of water vapor in Dingxi has a far-reaching significance for the water cycle process in this area and provides ideas for the management and allocation of water resources. There are still few studies on the source of water vapor in small areas. This study used hydrogen and stable oxygen isotopes combined with airflow trajectory to analyze water vapor source information based on precipitation samples collected in Dingxi. On this basis, the PSCF and CWT methods were used to explore the potential evaporation source of each sampling point. In addition, the research shows that the PSCF and CWT methods are suitable for the identification of water vapor sources. With the development of isotope ratio infrared spectroscopy, it is now possible to directly measure isotopes with high time resolution. Therefore, in the future, it may be possible to accurately measure the isotope ratio in these fluxes to analyze the source of water vapor and to reduce uncertainty.
2. Data and Method
2.1. Sampling Sites and Acquired Dataset
2.1.1. Sampling Network
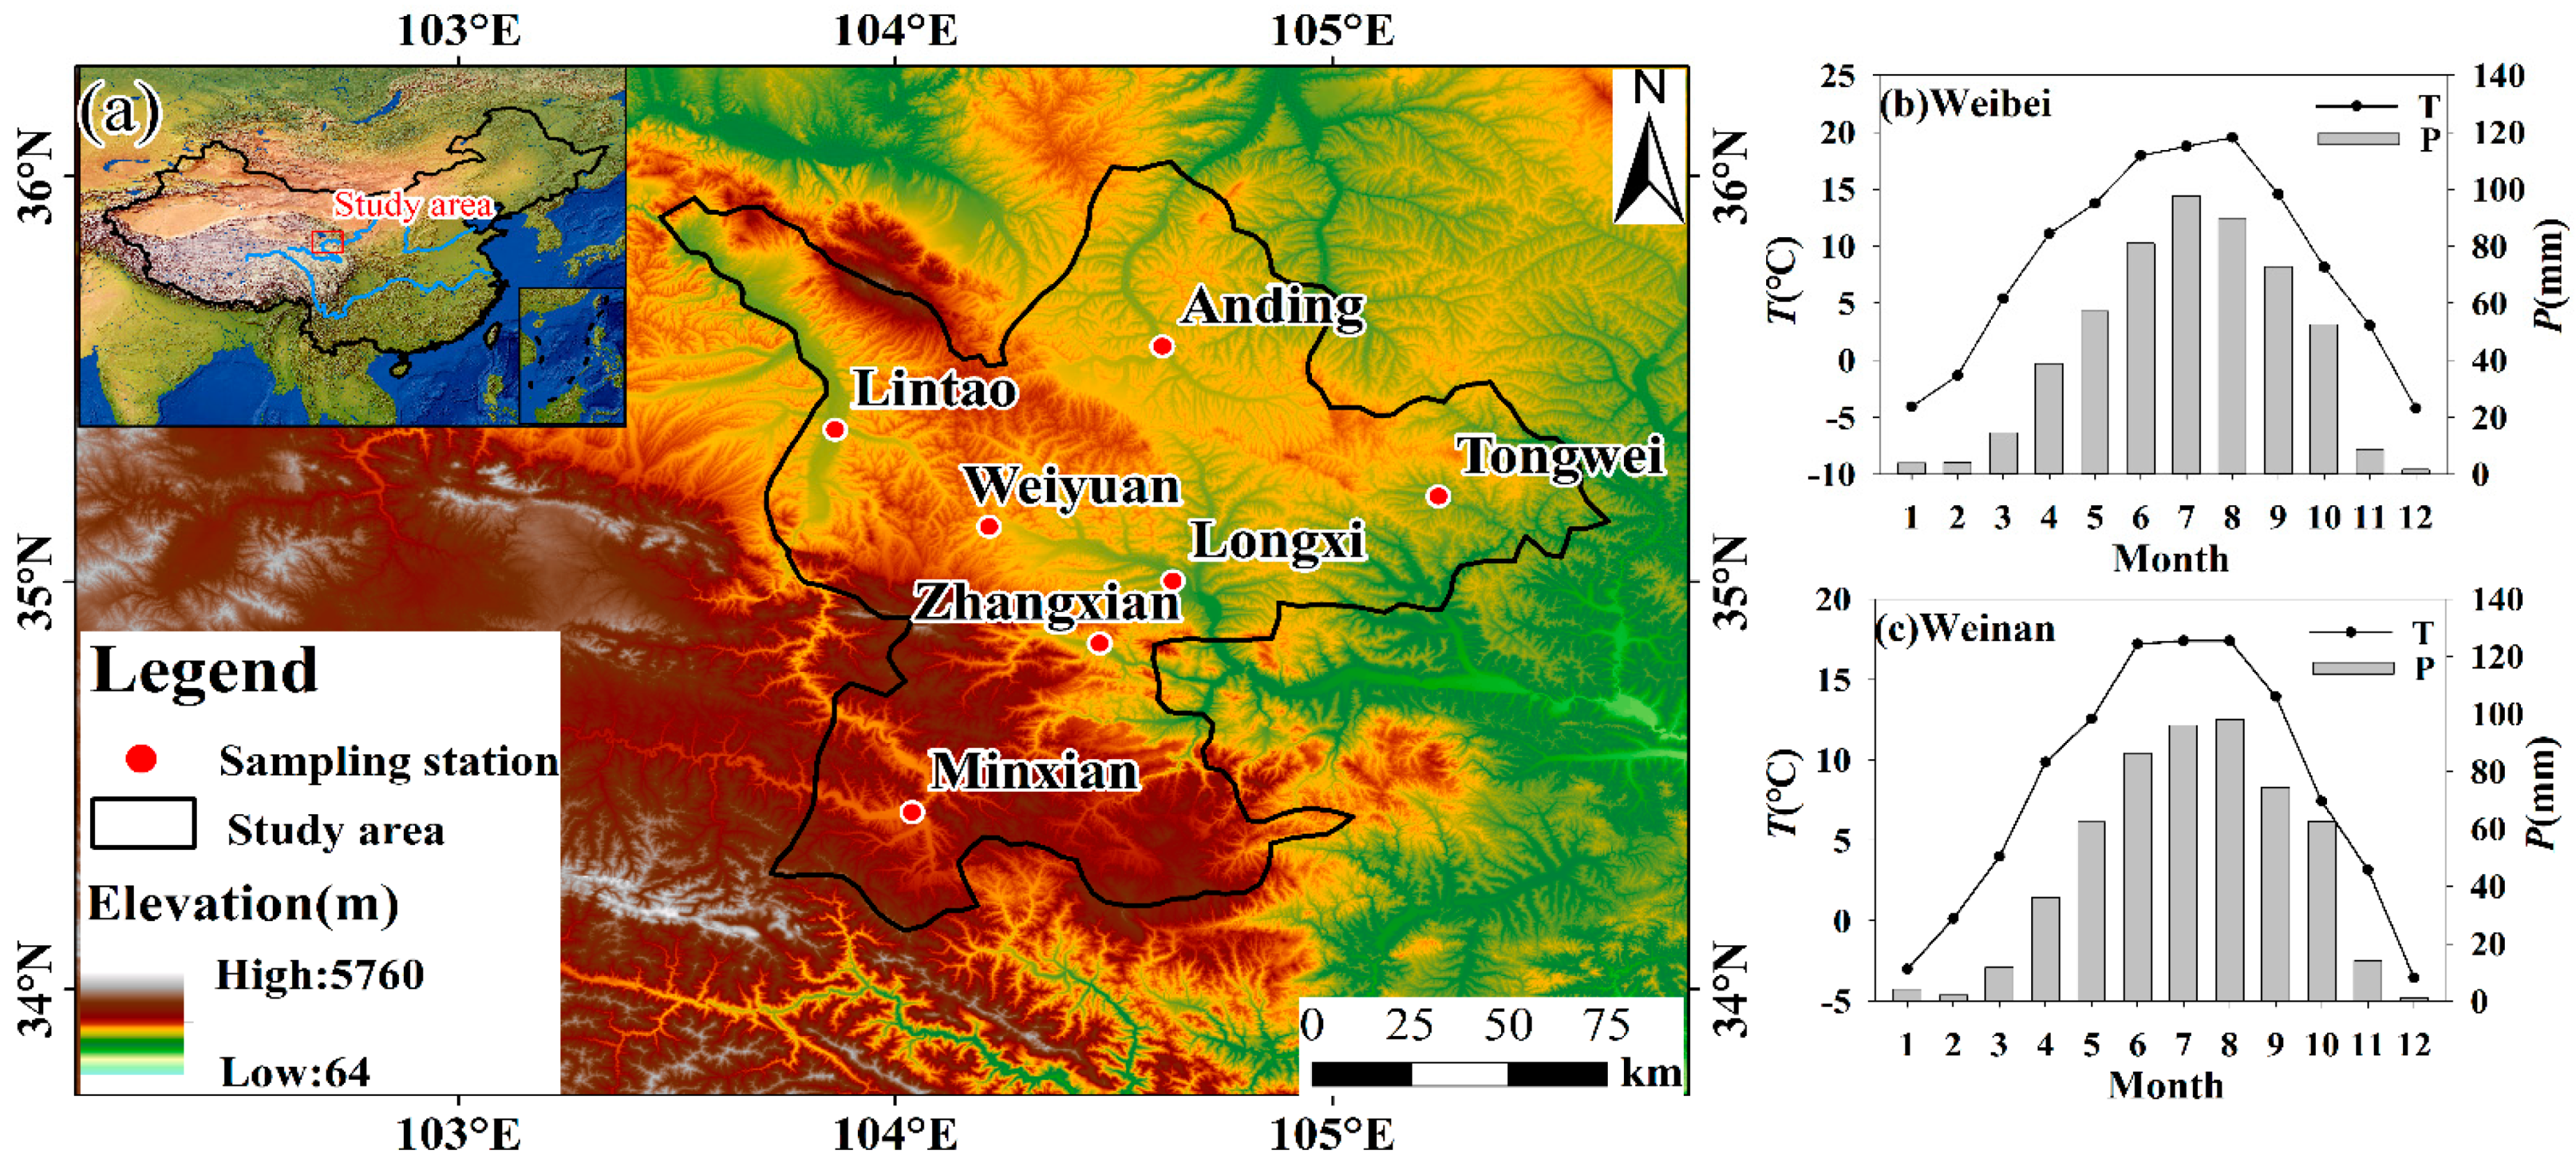
Dingxi is located in the central part of Gansu Province, inland northwest of China (34°26′–35°35′ N, 103°52′–105°13′ E). Simultaneously, it is at the intersection of the Loess Plateau, the Qinghai Tibet Plateau, and the West Qinling Mountains. In addition, the terrain of the area is undulating, with mountains crisscrossing [28]. Water resources are extremely scarce, and the climate varies greatly in the study area [29]. The study area is divided into Weibei and Weinan, with the Weihe River as the boundary, forming two unique climate types at the same time. Weibei belongs to the semi-arid area of the middle temperate zone, with less precipitation, including Anding, Longxi, Tongwei, Lintao, and the northern part of Weiyuan. Weinan, including Weiyuan, Zhangxian, and Minxian, is a warm, temperate, semi-humid area (in Figure 1, Weiyuan is considered part of Weinan). Figure 1a and b show the changes in temperature and precipitation in Weibei and Weinan during the sampling period from April 2019 to April 2020. The annual precipitation in Weibei is 523.2 mm during the sampling period, and the average temperature is 8.6 °C Weinan belongs to the cold and humid area, with an annual precipitation of 549.2 mm and an average temperature of 8.0 °C. The distribution of precipitation and temperature in the study area is uneven in time and space. Precipitation is mainly concentrated in summer, and compared with Weibei, Weinan has more precipitation. Moreover, the temperature is high in the summer and low in the winter, and the average temperature in Weinan is lower than that in Weibei.
2.1.2. Sampling and Laboratory Analysis
In this study, the precipitation samples were collected at seven sites, which includes Anding (35°58′ N, 104°61′ E), Longxi (35°00′ N, 104°63′ E), Weiyuan (35°14′ N, 104°21′ E), Tongwei (35°21′ N, 105°24′ E), Lintao (35°38′ N, 103°86′ E), Zhangxian (34°85′ N, 104°47′ E), and Minxian (34°43′ N, 104°04′) in Dingxi (Table 1 and Figure 1). The collection of the samples at the seven stations was implemented by a professional weather staff. A rain gauge and plastic funnel-bottle sets were used to collect the precipitation samples. The rain samples were collected quickly after precipitation events ended and then transferred to 50 mL HDPE (high-density polyethene) sample bottles to prevent evaporation of the precipitation. All of the sample bottles were sealed with waterproof tapes and stored frozen until the laboratory analysis. The number of samples at each station are shown in Table 1.
The samples were analyzed using a liquid water isotope analyzer DLT-100 (Los Gatos Research, Inc. Mountain View, San Jose, CA, USA) in the Stable Isotope Laboratory, College of Geography and Environmental Science, Northwest Normal University. Of the six values measured for each sample, the first two values were discarded to eliminate the memory effect, and the last four means were used in the study. The experimental values were expressed as δ-values and relative to Vienna Standard Mean Ocean Water (V-SMOW) using d notation:
where stands for the ratio of D/H or 18O/16O in the samples relative to V-SMOW, is the ratio of D/H or 18O/16O in the samples, and Rstandard is the ratio of D/H (0.00015576) or 18O/16O (0.0020052) in V-SMOW. The accuracy of measurement is ±0.6% for δD and ±0.2% for δ18O.
The hourly meteorological data (air temperature, relative humidity, precipitation, and vapor pressure) of each sampling site from April 2019 to April 2020 were acquired from the China Meteorological Data Network (http://www.nmic.cn/ (accessed on 12 May 2021)). In the trajectory calculation, the model needs the support of ARL format data, so the backward trajectory, CWT, and PSCF use the meteorological data provided by the NCEP (National Center for Environmental Prediction) (ftp://arlftp.arlhq.noaa.gov/pub/archives/reanalysis (accessed on 12 June 2021)), and the spatial resolution is 1° × 1°.
2.2. Methodology
2.2.1. Calculation of d-excess Value
The local meteoric water lines (LMWL), reflecting the correlation between δD and δ18O in precipitation, can be expressed as
where a is the slope, and b is the intercept.
Dansgaard [7] named the difference between δD and δ18O as d-excess based on the isotopic data of global meteoric precipitation. The formula is as follows:
The value of d-excess not only reflects the thermal conditions and water vapor balance conditions when the seawater forms clouds during the evaporation process but also reflects the natural environment and climatic conditions when precipitation is formed. Therefore, this study calculates the *d-excess value based on the difference between δD and δ18O of the local atmospheric precipitation and analyzes its indication of the source of water vapor. The calculation formula is as follows:
where a is the slope of LMWL.
2.2.2. Backward Trajectory Analysis
The backward trajectory model is usually used to calculate simple air mass trajectories and to simulate complex diffusion and deposition [30]. It was originally used to combine meteorological data with air pollutant data to explore the path of pollutants [31,32]. In recent years, scholars gradually used this model to explore the source of water vapor in each study area. Yi et al. [33] analyzed the water vapor sources and pathways for precipitations in East China in different stages of the East Asian summer monsoon using this model, which provides an important guidance to understanding the role of land surface conditions in modulating rainfall in North China. At the same time, Piao et al. [34] also used the moisture-tracing atmospheric model to reveal the summer water vapor sources in Northeast Asia and East Siberia. The above studies provide a basis for us to use this model to trace the source of water vapor in the study area.
Generally, a backward trajectory model can provide information about the source regions that impact a given site [35], and it was calculated using the HYSPLIT4.9 model from the National Oceanic and Atmospheric Administration (NOAA) Air Resources Laboratory (http://ready.arl.noaa.gov/HYSPLIT.php (accessed on 22 June 2021)) and using meteorological data from the NCEP Global Data Assimilation System (GDAS) (1° × 1°) [36]. Based on the precipitation samples of each station and using NOAA-NCEP/NCAR reanalysis data, this study generates a 10-day backward trajectory for each station and clusters the trajectories of each station. The main purpose of this method is to trace the hourly trajectory of airflow within a specified time length, and it usually uses a mixed or integrated single event Lagrange trajectory model, which was developed by the Atmospheric Research Laboratory of National Oceanic and Atmospheric Administration of the United States. Trajstat software based on hysplit mode [37] was used to calculate 240 (10d) backward trajectories of monthly precipitation events at each sampling site at 00:00, 06:00, 12:00, and 18:00 UTC each day [36], and the starting height of the model was 1500 m above the ground. The formula is as follows:
where is the final position of the air mass center at , is the initial position, is the velocity vector at position P at time t passing through the space-time difference, is the first guess position after time.
2.2.3. Potential Source Contribution Factor Analysis
PSCF is a conditional probability function that can show source areas that have the potential to contribute to the high concentrations of pollutants observed at the research sites [38,39]. At first, the PSCF model relied on backward trajectories to identifying regions of emission source at a long distance. Scholars [40,41] then gradually used the PSCF analysis method combined with the water vapor d-excess value to evaluate the potential water source areas in study areas, which makes our research on the water vapor source more in-depth on the basis of HYSPLIT. Understanding the potential water vapor source areas in Dingxi is of great significance to water resource allocation and water resources management in this area. In this study, the possible source area is given by PSCF combined with the vapor d-excess concentration of an air mass trajectory. The PSCF function is defined as the conditional probability that the concentration of a certain atmospheric component is higher than the set threshold when the airflow path through a certain area (i and j are longitude and latitude, respectively) passes through the research site. In this paper, the study area and its surrounding areas are divided into 0.1° × 0.1°, and the threshold value is the monthly average value of d-excess concentration in water vapor. When the d-excess concentration of water vapor corresponding to the trajectory is higher than this threshold, it is considered that the trajectory is a strong evaporation trajectory and the corresponding grid area is a strong evaporation area [42], which is the potential evaporation source.
where is the number of end points of strong evaporation trajectories passing through the grid (i, j) and the number of end points of all trajectories in the grid is ; then, PSCF can be defined as Formula (4). PSCF is a probability formula, an increase in the distance between the grid and the research point has a certain impact on the accuracy of the research results, and the smaller leads to errors [43]. Some scholars [38,44,45] introduced the weight function, namely Formula (6), to reduce the error.
2.2.4. Concentration Weight Trajectory Analysis
The CWT model was originally used to explore the potential sources of air pollutants using airflow trajectory [46]. However, Salamalikis et al. [24] used the CWT method combined with meteorological data and the water vapor d-excess value to analyze the source of water vapor in Greece, which confirmed the feasibility of applying the CWT method to study water vapor transportation. The d-excess value in the water vapor contains information about the origin and transportation of the air mass [47]. Therefore, based on the PSCF method, this study uses the CWT analysis method to distinguish the high and low value regions that affect the source of water vapor in the study area. In a CWT analysis, the grid precision is set to 0.1° × 0.1° and each grid has a weight value of d-excess concentration in water vapor, which is realized by calculating the average d-excess concentration in water vapor corresponding to all trajectories passing through the grid. The formula is as follows:
where stands for the mean weighted concentration in the grid cell (i, j) and the unit stands for ‰·m−3. k was the index of the trajectory, and stands for the concentration (the study refers to d-excess) measured upon the arrival of the trajectory k at the sampling site. stands for the mean residence time of the trajectory k in the grid cell (i, j). The error of CWT increases with the distance between the grid and the sampling point. When is small, the CWT model is great uncertainty. In order to reduce the uncertainty, the same weight function as PSCF is used.
3. Results and Discussion
3.1. Water Vapor Source Information Indicated by δ18O and d-excess
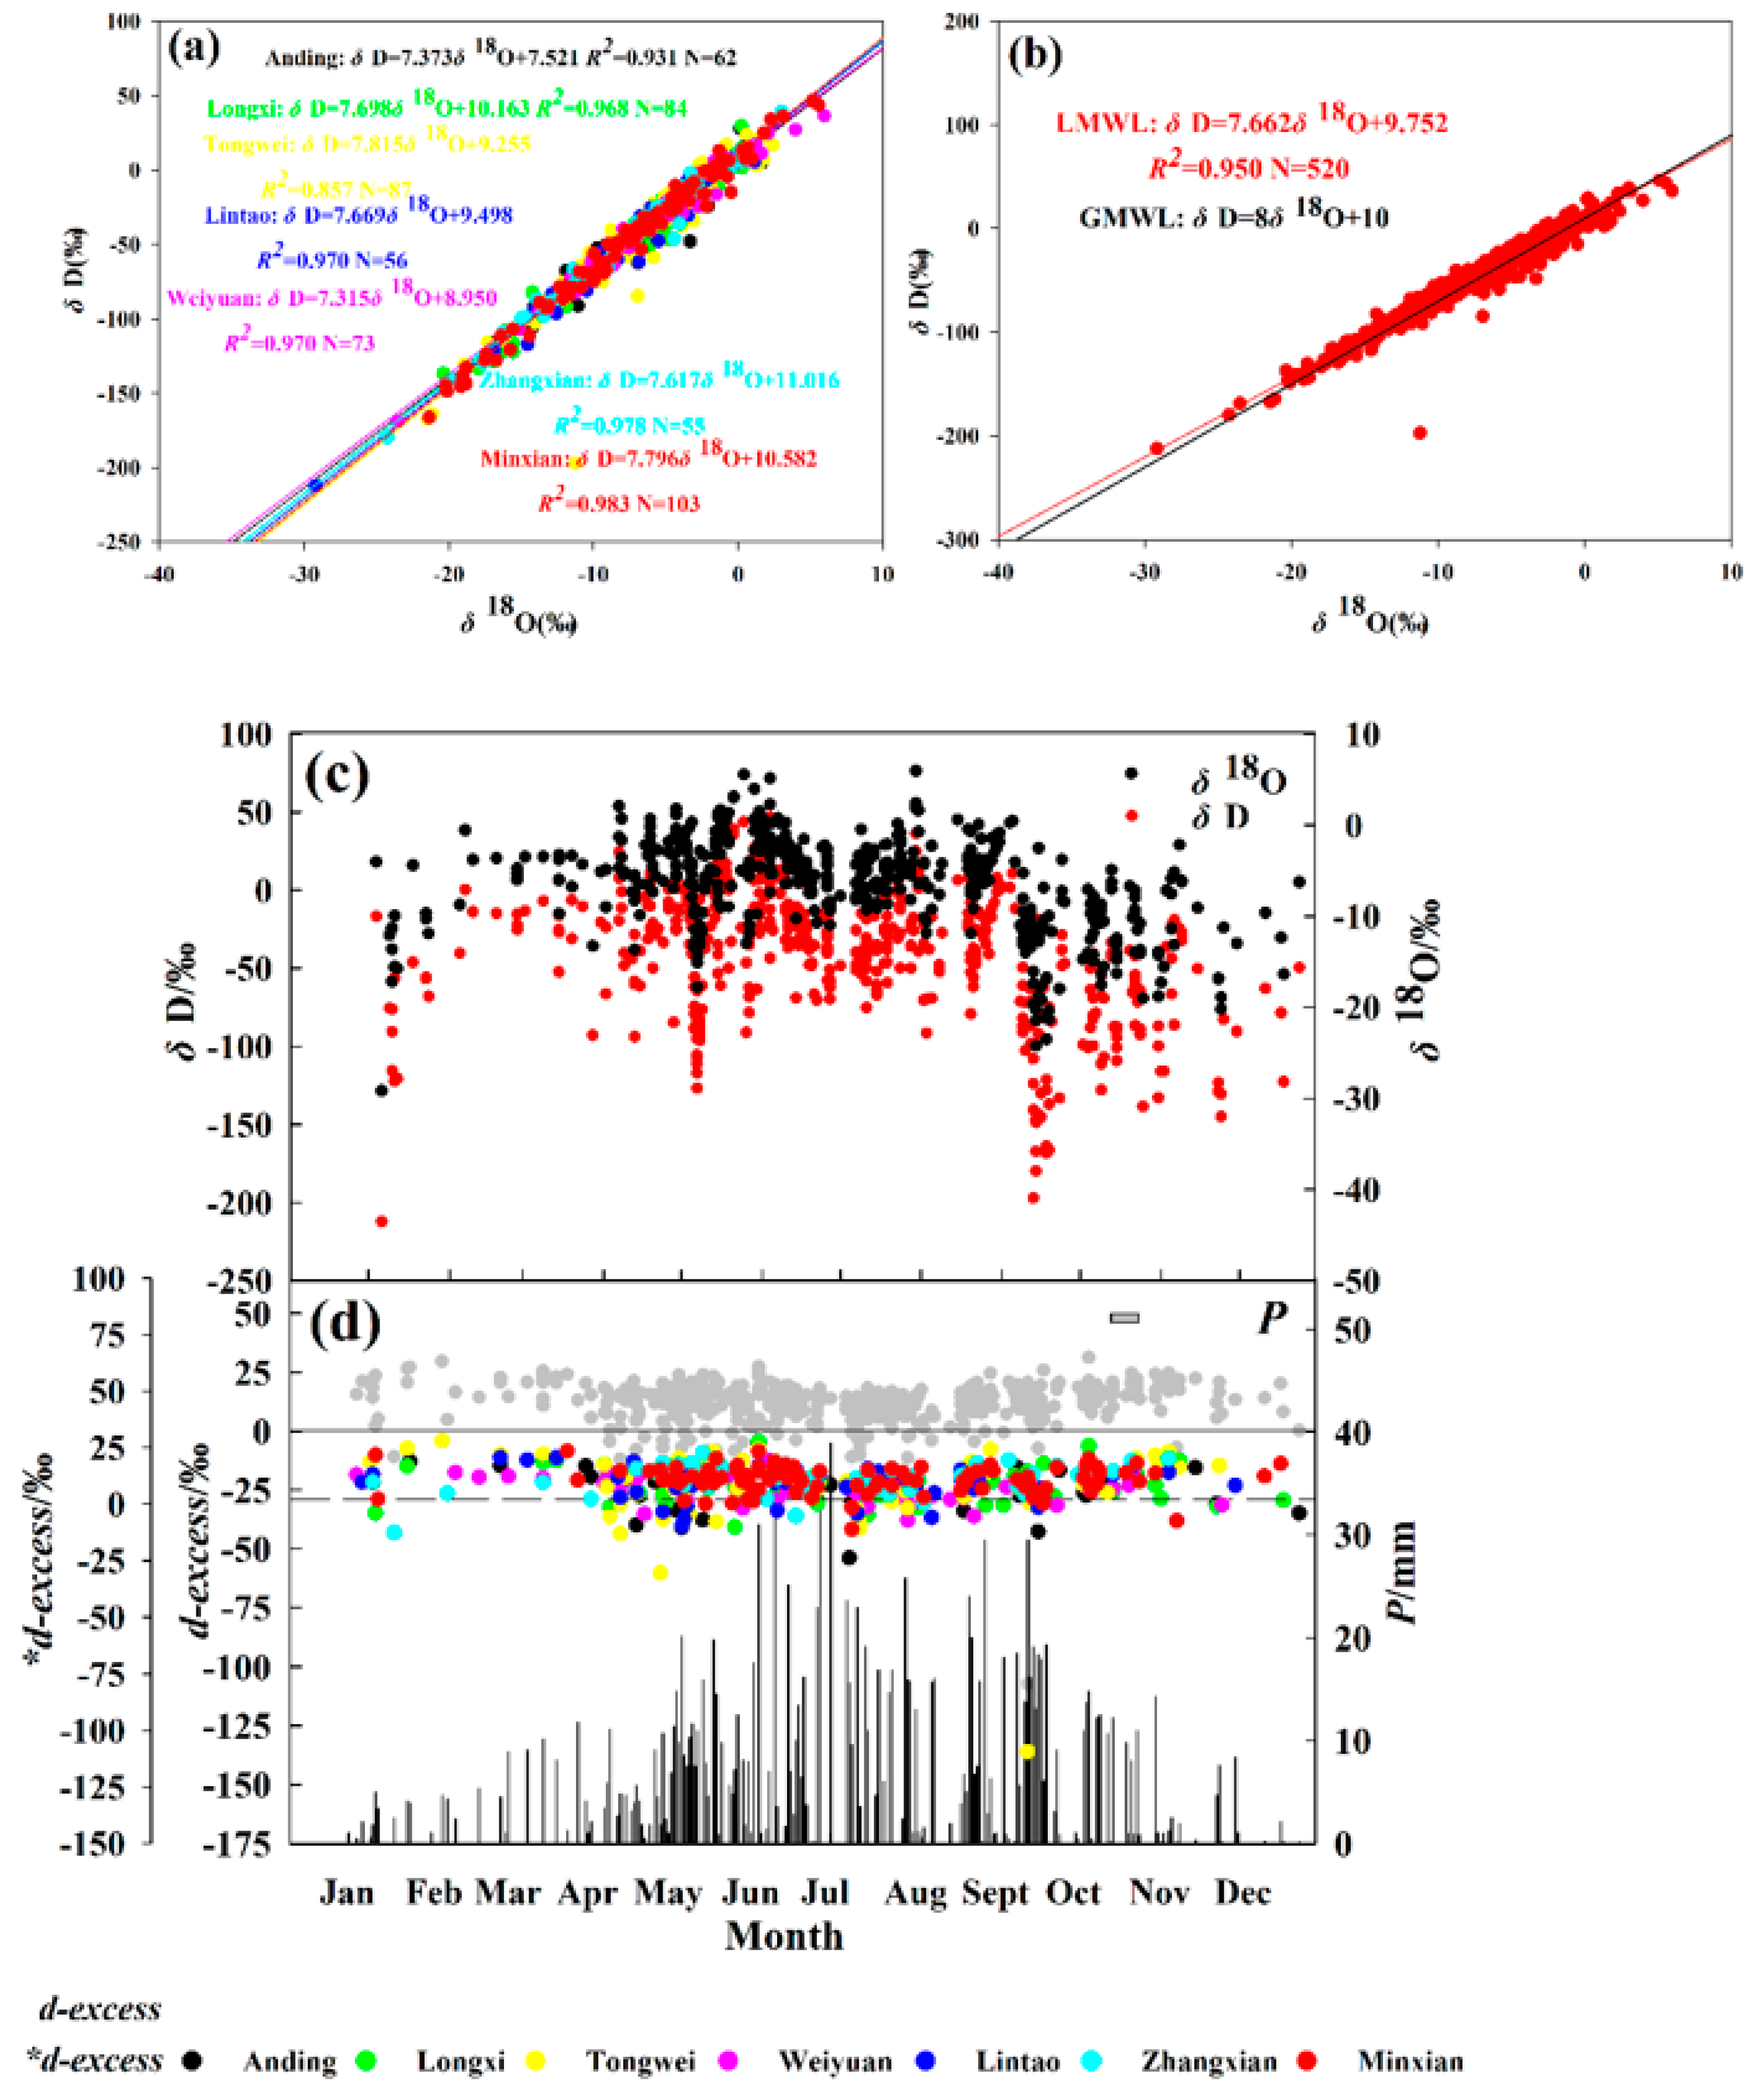
Due to the ability of stable water isotopes to characterize the origin of water [48] and to the differences in water vapor isotopic compositions from different sources, stable isotope technology has gradually become a common method for tracing water vapor sources. Investigations by some scholars have found that δ18O and d-excess in precipitation can be used to determine the origin of water vapor [20,23,49]. The meteoric water line better represents the significant linear relationship between δ18O and δD, and it can be used to analyze climate change and water vapor sources in the study area. At the same time, the d-excess value of the study area (as *d-excess) is calculated according to the local atmospheric waterline to help us indicate the source of water vapor. Craig et al. [11] defined the global meteoric water line (GMWL) based on global GNIP site data, which is δD = 8δ18O + 10. Affected by various factors such as near-surface meteorological conditions, the LMWL varies from region to region. According to the least square method, the LMWL of the study area and each sampling station is obtained. It can be seen from Figure 2a that the LMWL slopes of Anding Station and Weiyuan Station are lower than those of other sampling stations and are close to 7.3. The main reason is that the two sampling sites are located to the north of the Weihe River, the annual precipitation is relatively small, the climate is relatively dry, and they are located in the northwest of the study area, so the degree of isotopic fractionation is relatively high. The slopes of LMWL at other sampling stations have little difference. The slopes of Longxi, Lintao and Zhangxian stations are close to 7.6, and the slopes of Tongwei and Minxian stations are close to 7.8, but they are all lower than the slope of GMWL. Additionally, Figure 2b shows that the slope LMWL in Dingxi (including all sampling stations) is also lower than that of GMWL. Hence, this study calculated the d-excess and *d-excess values of the study area according to Formulas (2)–(4).
Figure 2c,d show the variation of stable isotopes, d-excess, *d-excess, and precipitation in the study area during the sampling period. It can be seen from Figure 2c that δ18O presents a trend of increase-decrease-increase-decrease. The average values of δ18O and δD are −7.80 ‰ and −49.02 ‰, respectively, which are in the stable isotope range of global precipitation (δ18O: 10‰~−50‰; δD: 50‰~−350‰) [50]. Meanwhile, the seasonal variation of the stable isotopes of hydrogen and oxygen shown is relatively small in Figure 2c, which indicates that the water vapor source is relatively stable, but the overall trend of δ18O is high in summer and low in winter, signifying that there are different sources of water vapor to a certain extent. As can be seen from Figure 2c, δ18O increases gradually from spring, especially showing a large value at the end of May and at the beginning of June. However, δ18O should be progressively depleted along the westerly moving path in Northwest China according to Rayleigh fractionation. Therefore, it is speculated that the precipitation is affected by sub-cloud secondary evaporation during rainfall at the end of May and at the beginning of June. Simultaneously, it is strange that δ18O and δD show certain low values in June. Research shows that the isotope fractionation caused by the unbalanced sub-cloud secondary evaporation makes the enrichment of δ18O in the residual rainfall directly proportional to the intensity of sub-cloud secondary evaporation [51]. The precipitation distribution in Figure 2d shows that the precipitation from the end of June to the beginning of July presents a larger value and that the precipitation lasts for about 10 days. Consequently, in the case of heavy or continuous precipitation, the water vapor content in the atmosphere gradually tends to be saturated and the vapor pressure progressively increases, while the sub-cloud secondary evaporation successively weakens. As studies have shown, in this case, the intensity of the secondary evaporation under the cloud is proportional to the enrichment of δ18O, so the degree of enrichment in δ18O gradually weakens. Therefore, δ18O shows a certain negative value at the end of June and at the beginning of July.
The main influencing factors of d-excess in precipitation are sea surface temperature, wind speed, and relative humidity in the water vapor source area, and there is a negative correlation between d-excess and relative humidity [52]. However, as shown in Figure 2d, the difference between the d-excess calculated according to GWML and the *d-excess calculated according to LMWL is small. In addition, some negative values of d-excess and *d-excess are mainly located in the period of abundant precipitation in the study area. During this period, the relative humidity is relatively high and the isotope fractionation is small, so it may appear as a certain negative value. Of course, a certain degree of error in the collection and analysis of samples cannot be ruled out. In short, the trends of d-excess and *d-excess are not obvious but both show a certain low value in summer. Therefore, we guess that there may be relatively humid water vapor in summer. However, Araguás-Araguás et al. [53] found that partial evaporation of raindrops below the cloud base may substantially reduce the d-excess value of raindrops collected at the ground level in arid climates. We consider that the low value of d-excess in summer may be affected by the sub-cloud secondary evaporation or replenishment of surface water vapor.
3.2. Tracing Water Vapor Source with Lagrange Algorithm
3.2.1. Backward Trajectory Analysis
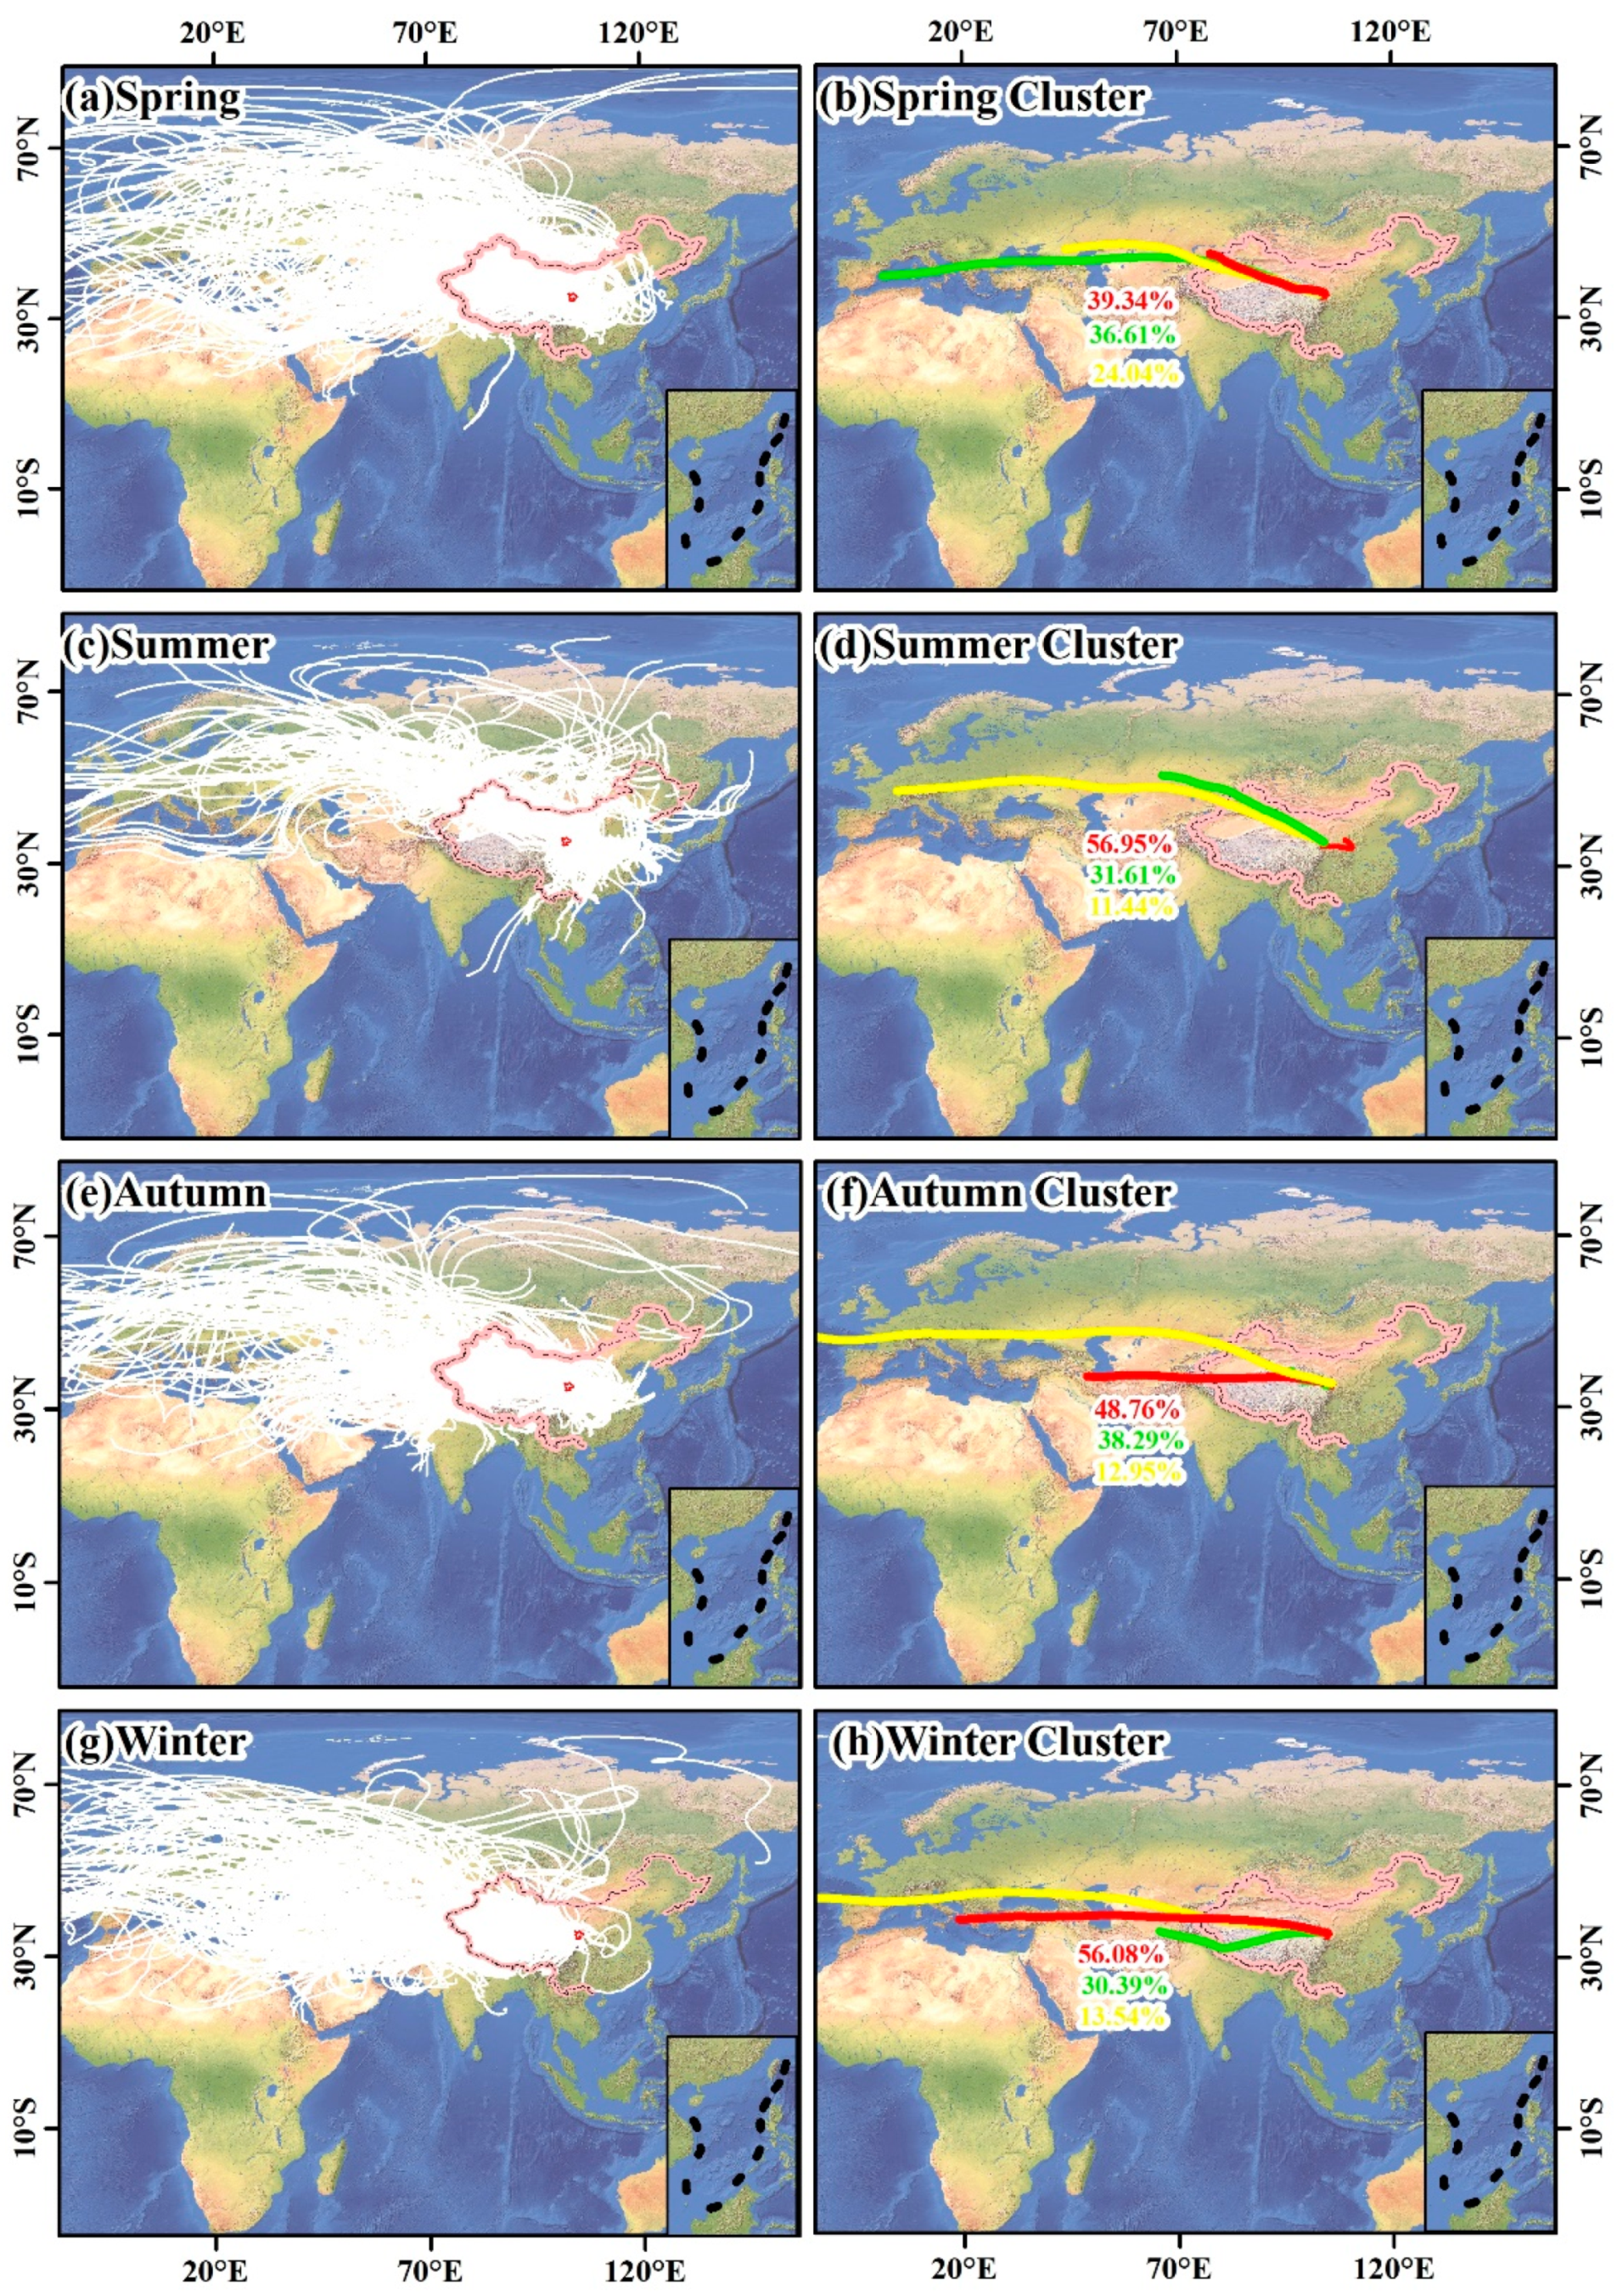
The isotope technique is very limited in tracing water vapor source, and the source area of water vapor can only be guessed based on the seasonal changes of isotope. Therefore, it is necessary to use the backward trajectory analysis method to trace the water vapor path in the study area based on the reanalysis data of precipitation samples. Meanwhile, the previous studies on water vapor sources based on the Lagrange model show the feasibility of the method [54,55,56]. Li et al. [57] tracked the water vapor sources of Urumqi, Zhangye, and Hetian in the arid region of northwest China using HYSPLIT4.9 and identified that there were two moisture sources in the whole year, namely, the Atlantic water vapor in the westerly belt and the polar Arctic water vapor. At the same time, Chen et al. [22] found that the water vapor in the westerly belt played a dominant role in the precipitation of Lanzhou, while the water vapor in the southeast monsoon had limitations and was mainly concentrated in summer. In order to verify the source of water vapor in study area, the reanalysis data during the sampling period (April 2019 to April 2020) were selected to trace the trajectories of 10 days in different seasons and clustered in different directions. Figure 3a shows that most of the water vapor in spring comes from the westerly water vapor in the study area and that there is little water vapor in the Western Pacific and the Indian Ocean. After clustering, it is found that 39.34% of the water vapor comes from the Central Asian continental air mass, 36.61% is from the Mediterranean, and 24.04% is from the Caspian Sea in study area (Figure 3b). Figure 3c, d show the water vapor sources and clustering trajectories of the study area in summer, indicating that the water vapor sources are more complex in summer, which are roughly composed of water vapor in the westerly belt, and water vapor in the Western Pacific and the Indian Ocean. It can be found from the cluster trajectory that 56.95% of the water vapor in summer comes from the local circulation water vapor, which also verifies that the low value of d-excess in summer may be affected by the local evaporation water vapor and that the remaining 43.05% is the Central Asian continental air mass brought by the westerly belt. Meanwhile, Figure 3e shows that the water vapor of autumn is from the westerly belt in the study area. The clustering trajectory shows that 48.76% of the water vapor comes from the Caspian Sea, 38.29% is from near-source local evaporation, and 12.95% is from the Atlantic Ocean (Figure 3f). Figure 3g shows that the water vapor in winter is composed of the westerly belt in the study area. After clustering, it is found that 56.08% of the water vapor comes from the Mediterranean, 30.39% is from the Atlantic Ocean, and 13.54% is from the dry air mass on the mainland (Figure 3f). In short, tracing the backward trajectory manifests that most of the water vapor of the study area comes from the westerly belt except for some local recycle water vapor in summer and autumn and that the Atlantic Ocean, Arctic Ocean, Mediterranean Sea, Black Sea, and Caspian Sea are potential water vapor sources, which is similar to the previous research results.
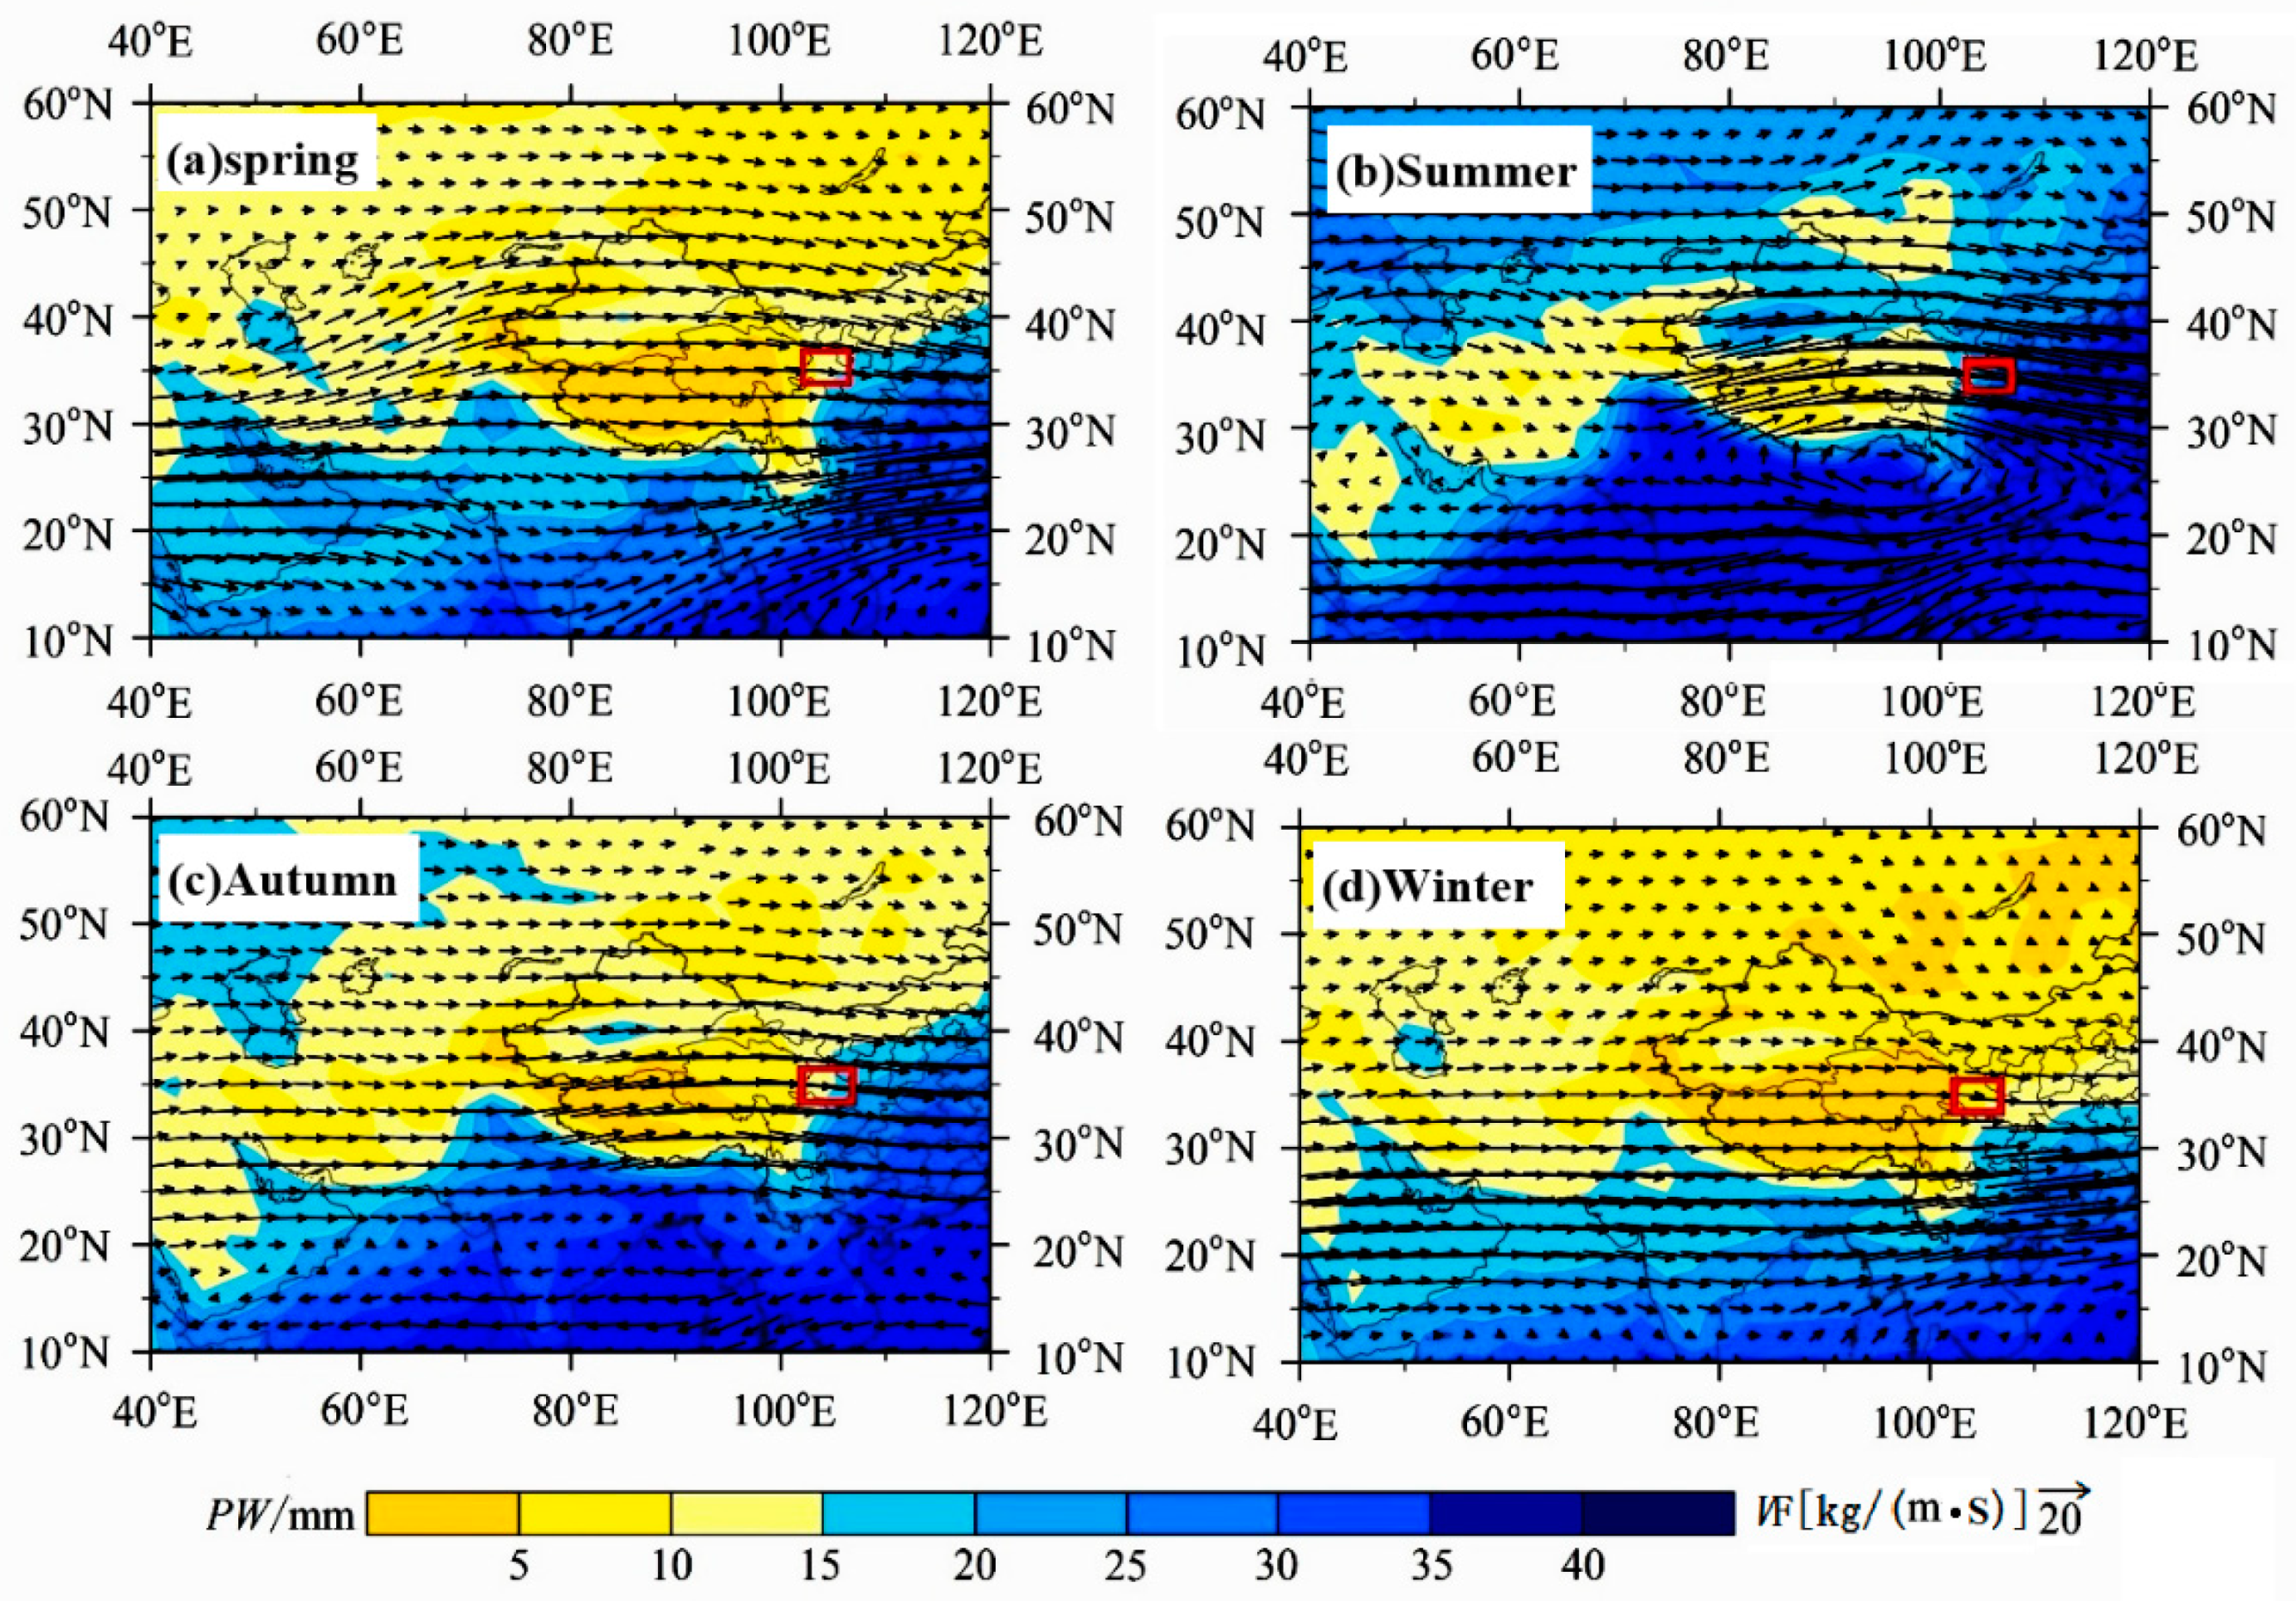
Generally, for the northwest region, the Tibetan Plateau acts as a barrier to most Indian Ocean moisture moving northward, making it difficult for wetter ocean moisture to accumulate. At the same time, the water vapor flux of each season during sampling was analyzed using the reanalysis data. It can be seen from Figure 4 that the water vapor of the westerly belt is dominant in the study area, but there is a certain seasonal difference. The vapor flux in winter is weak, while the contribution of inland lakes is the most abundant in summer. The Caspian Sea, Mediterranean Sea, Indian Ocean, and other large oceans are important sources of summer precipitation. Meanwhile, there is little difference in precipitable water between spring and autumn, but the influence of westerly water vapor is more obvious. Consequently, Dingxi, as an area of extreme water shortage in Gansu Province, has a great relationship with the water vapor from the westerly belt throughout the year.
3.2.2. PSCF
A potential source contribution factor analysis divides the research area into grids based on backward trajectories and then determines the potential source areas that may lead to high concentrations of pollutants and their chemical components through an analysis of the proportion of grid concentrations in which the values are greater than the trajectories with the given threshold to the whole grids. Meng [25] studied the potential evapotranspiration sources in summer in the middle reaches of the Heihe River using the PSCF analysis method, indicating that the combination of the method and d-excess value is feasible in exploring water vapor sources. In addition, through the tracer study of water vapor sources in the Dingxi area presented above, it is found that the contribution of locally recycled water vapor to precipitation in summer and autumn cannot be ignored. Hence, we use the PSCF analysis method to study the potential evaporation source areas of each sampling site.
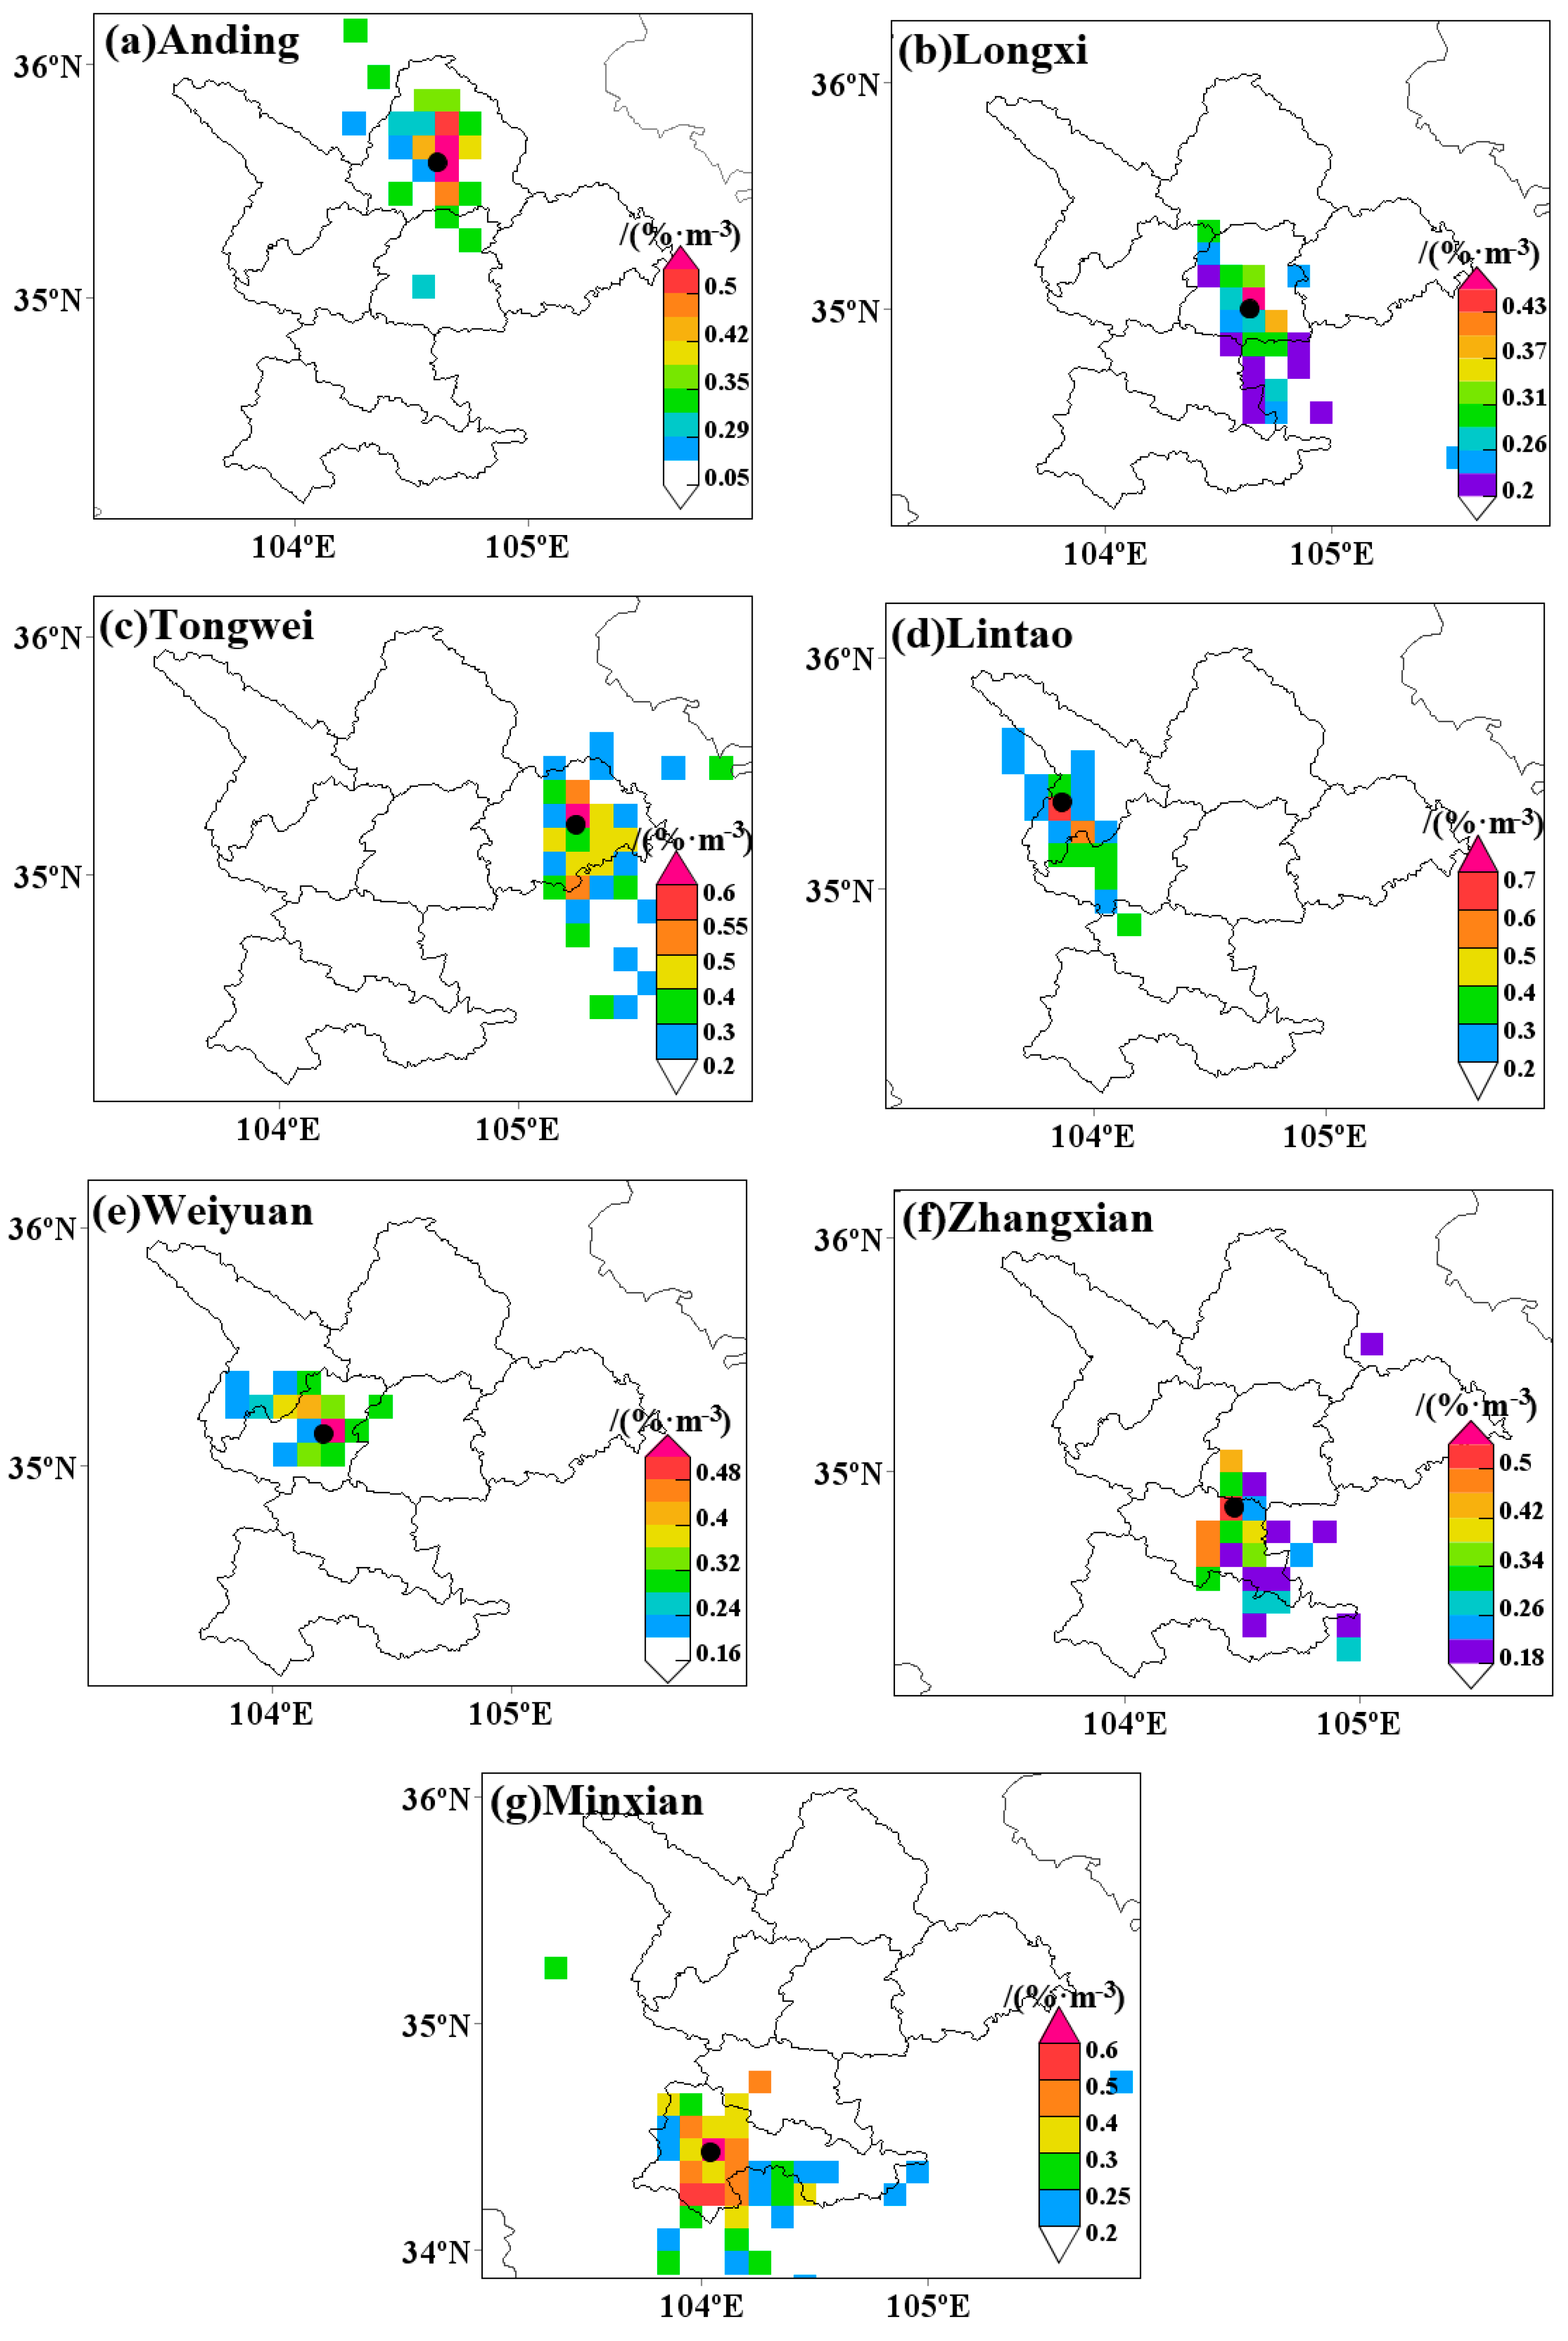
In Northwest China, evaporation mainly occurs in the monsoon period [58]. Therefore, we tracked the monsoon period to analyze the potential evaporation source of each sampling site based on the basic precipitation events. Figure 5a shows the distribution of PSCF values in Anding, in which the high-value area is located to the east of Anding, and Yuzhong to the northwest is also a potential evaporation source area. Furthermore, Yuzhong is located in the west end of the Loess Plateau and in the middle of Gansu Province, with an annual evaporation of 1550 mm [59]. At the same time, Longxi to the south of Anding is also a potential evaporation source area. Figure 5b shows that the high-value areas of PSCF are distributed to the east of Longxi and that Longxi to the northwest and Wushan to the southeast are also potential evaporation source areas. Figure 5c indicates that the potential evaporation source area of Tongwei lies in the south, including Gangu and the northern part of Tongwei. Figure 5d shows the spatial distribution of the PSCF value in Lintao, in which the area around Lintao and its southeast, including Weiyuan in the west, are the high-value areas and that the northwest of Lintao is also a potential evaporation source area. It can be seen from Figure 5e that the potential evaporation source of Weiyuan is its southeast and northwest, including the southern part of Lintao. Concurrently, Figure 5f shows that the high-value area of PSCF in Zhangxian is distributed in the southwest and in Longxi to the north and that the southeast of Zhangxian including Minxian and Wushan to the east are also potential sources of evaporation. Figure 5g shows the spatial distribution of the PSCF values in Minxian, which shows that the high-value area of PSCF is mainly distributed in the eastern and northern areas around Minxian and that its potential evaporation source area also includes Danchang in the south. Generally speaking, the above PSCF analysis illustrates that the northwest and southeast of most sampling sites are the main potential evapotranspiration sources.
3.2.3. CWT
The CWT method is used to distinguish between strong sources from weak ones, considering the limitation of the PSCF method in which grid cells can have the same PSCF value when the d-excess concentrations are either only slightly higher or much higher than the criterion [60]. In addition, Meng’s [41] study showed that the CWT value was related to local recycle water vapor and surface dryness and that the larger local recycled water vapor and evaporated water vapor in the relatively dry surface increase the d-excess value.
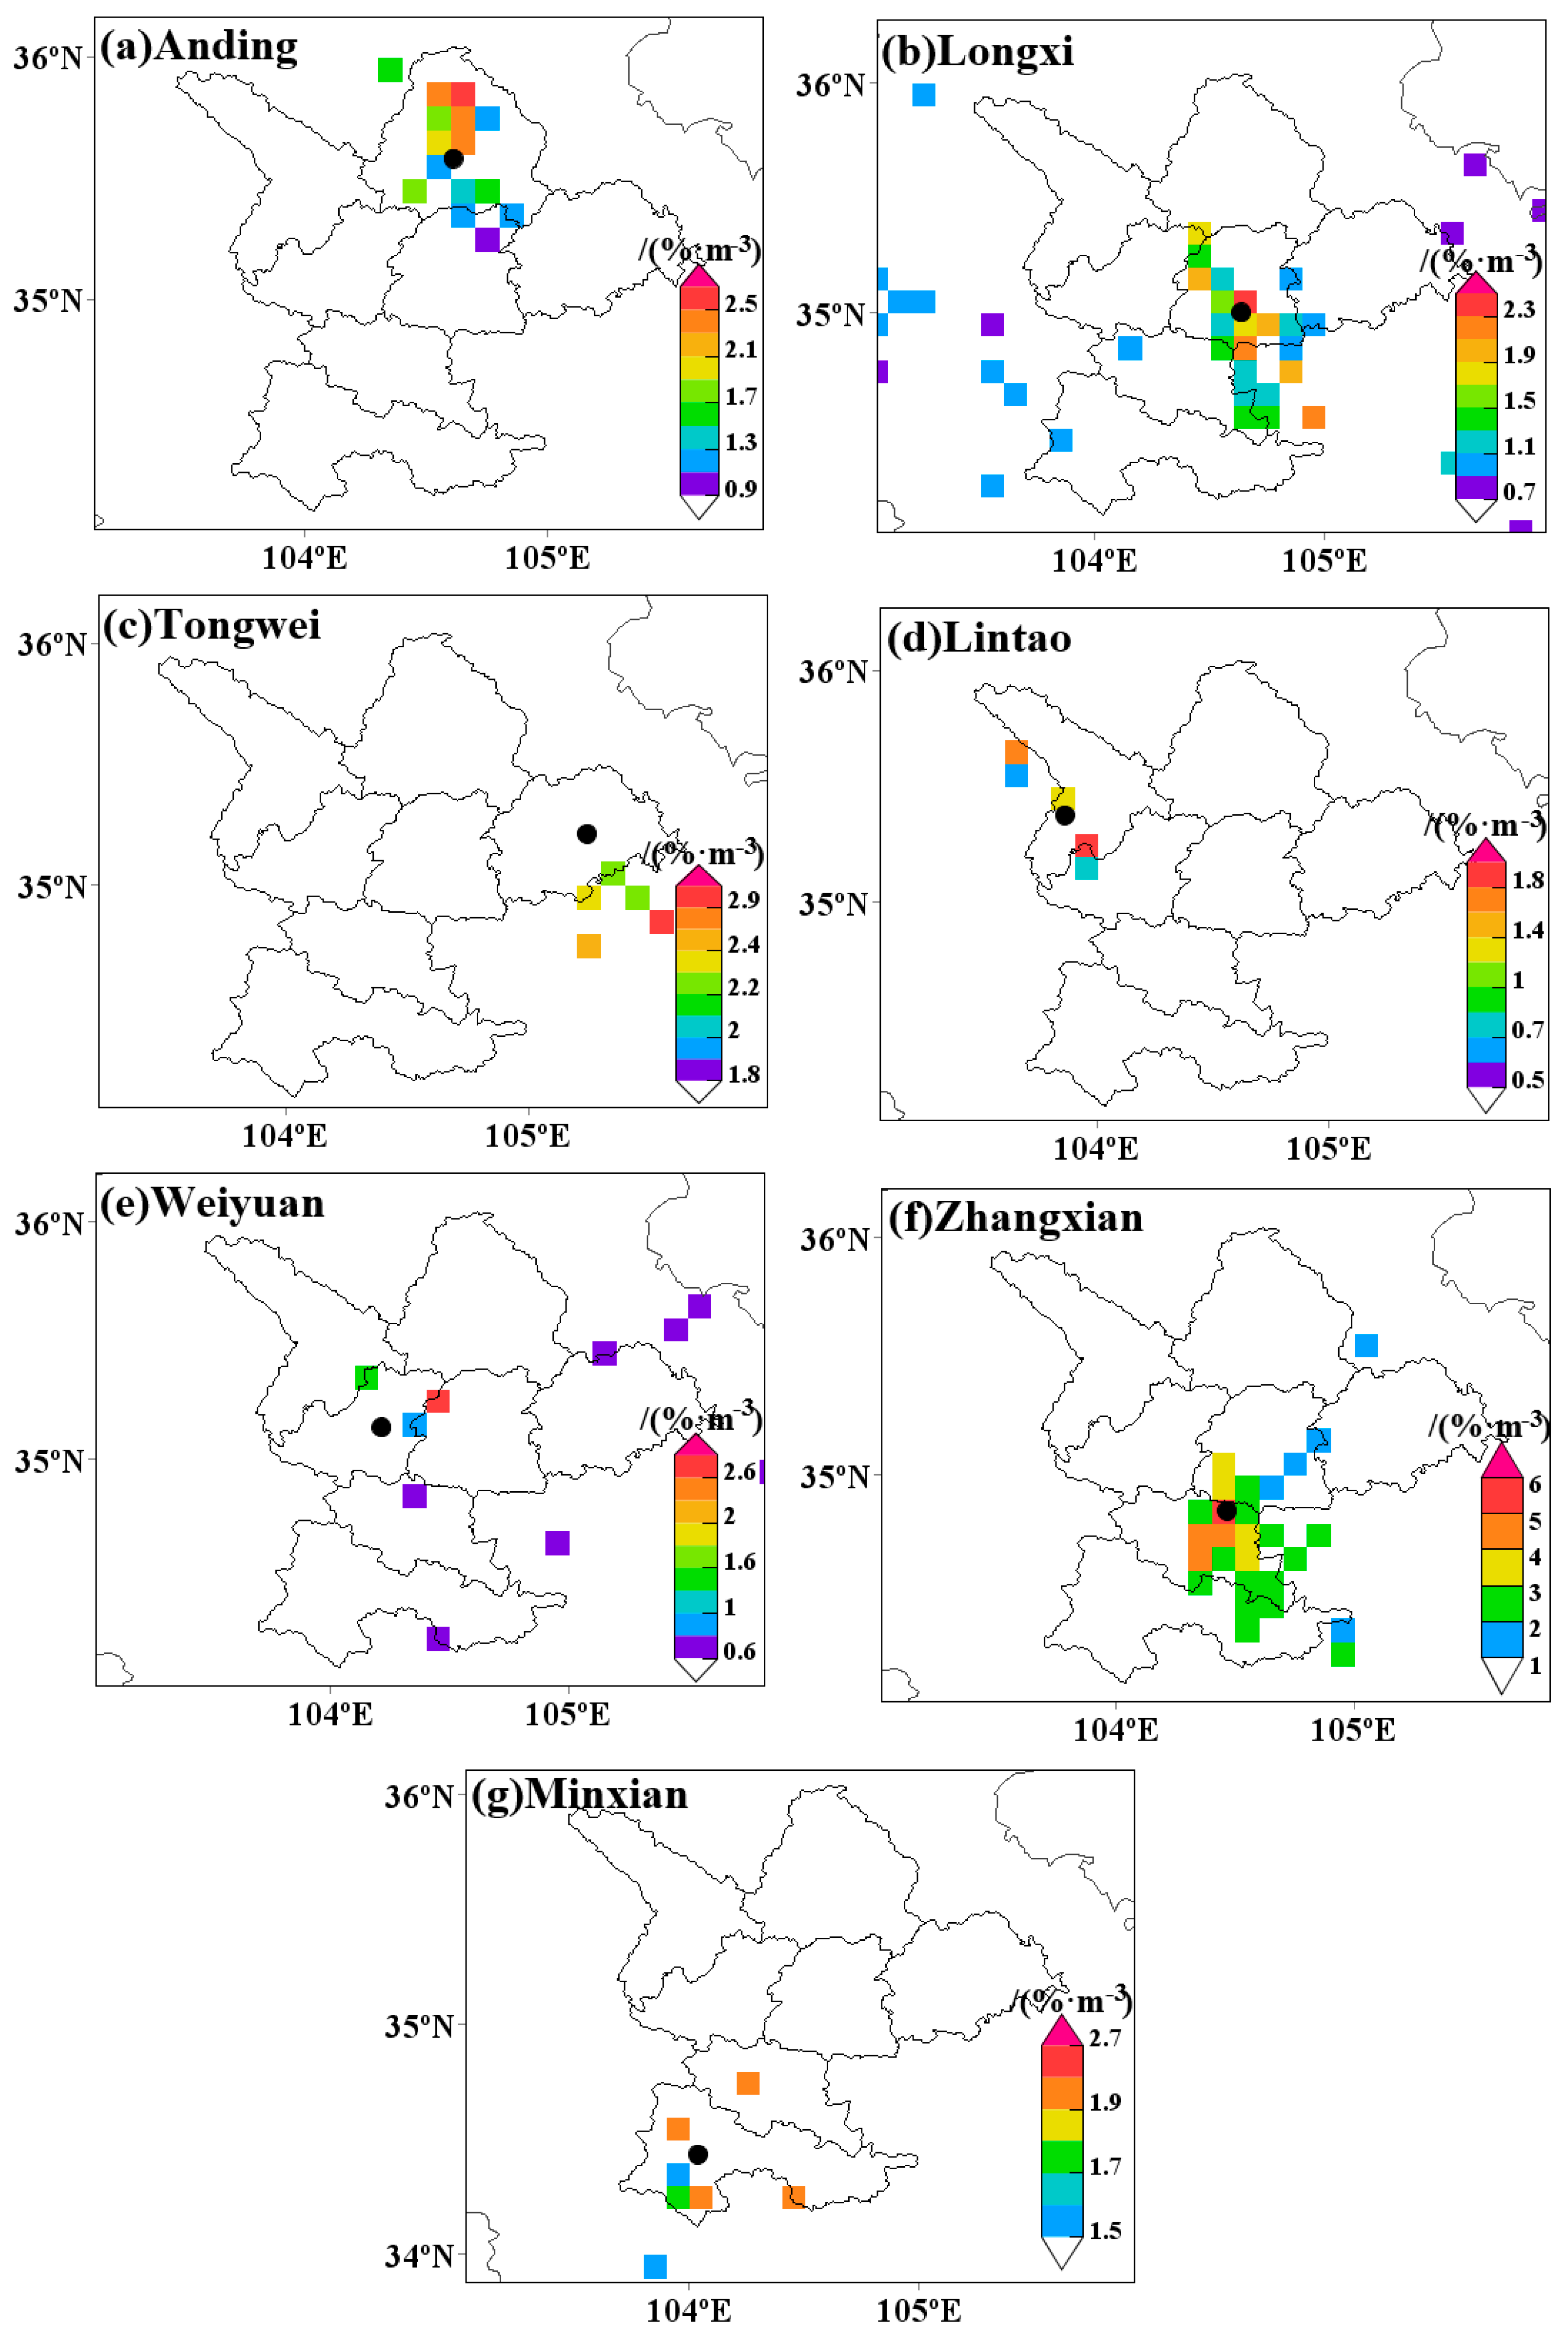
In this study, the basic precipitation events during the monsoon period were also combined with the d-excess in water vapor to analyze the concentration weight of each sampling site. Figure 6a shows the spatial distribution of CWT in Anding. The high-value areas are distributed around the sampling point as well as Yuzhong, which the northwest sampling point, and Longxi, south of the sampling point, demonstrating that these areas have high locally recycled water vapor and are also the supply of precipitation in Anding. The result is consistent with the analysis of PSCF and shows that the surface of Yuzhong and the northern part of Longxi are relatively dry in contrast with other places. It can be seen from Figure 6b that the locally recycled water vapor is relatively high in the vicinity of Longxi and to the northwest (including Wushan). Meanwhile, we found locally recycled water vapor in the Gannan region to the west of the sampling site. For Tongwei, the high value in CWT areas is mainly distributed in Gangu and southeast of the sampling point (Figure 6c). Figure 6d shows that Weiyuan in the south of and Hezheng in the northwest of Lintao are high-value areas of CWT. It can be seen from Figure 6e that the northern part of Weiyuan presents a high value while the southern parts of Huining and Dingxi have relatively high values of locally recycled water vapor. Figure 6f shows that the southern part of Zhangxian is a high-value area of locally recycled water vapor and that Longxi in the northeast part of Zhangxian is a sub high-value area. Figure 6g shows that high-value areas of CWT are around Minxian, including Zhangxian in the northeast of the sample site.
The analysis of CWT shows that to the northwest of each sampling site are high-value areas of CWT except for Tongwei. In other words, the locally recycled water vapor presents high values in these places, which indicates that the westerly water vapor carries more locally circulated water vapor during the monsoon period in the study area.
4. Conclusions
The seasonal variation of δ18O in precipitation in the Dingxi area is relatively small. However, it shows a trend of being higher in summer than in winter, indicating the existence of different sources of water vapor in summer. Nevertheless, the d-excess fluctuation in precipitation is small, which presents a slight seasonal variation, which is lower in summer than that in winter, which illustrates that the water vapor source is mostly from a single source in Dingxi. On this basis, the Lagrangian algorithm was used to trace the water vapor sources in different seasons in Dingxi. Moreover, we found that most of the water vapor comes from the westerly belt except for some local circulation water vapor that appears in summer and autumn. At the same time, the PSCF analysis showed that the northwest and southeast sampling points are the main potential evaporation source areas. Furthermore, the northwest sampling points is proven by CWT analysis to be the main contributor in source area to local circulating water vapor. In summary, this study confirmed that Dingxi area is mainly affected by westerly water vapor, which mixes in more locally recycled water vapor during transmission. Considering that the northwest part of the study area is the main source of locally recycled water vapor, the government should consider water resource allocation in the northwest of Dingxi.
Author Contributions
Conceptualization, F.C.; software, X.W.; validation, X.W.; formal analysis, X.W.; investigation, X.W.; methodology, F.C., X.L. and S.W.; resources, S.W., M.Z. and G.Z.; data curation, X.L., X.Z. and J.C.; writing-original draft preparation, X.W.; writing-review and editing, X.W. and F.C.; supervision, F.C.; funding acquisition, F.C., M.Z. and S.W. All authors have read and agreed to the published version of the manuscript.
Funding
The study was financially supported by the National Natural Science Foundation of China (No. 42161007 and 42071047), the Scientific Research Program of Higher Education Institutions of Gansu Province (No. 2021B-081) and the Foundation for Distinguished Young Scholars of Gansu Province (No. 20JR10RA112).
Institutional Review Board Statement
Not applicable.
Informed Consent Statement
Not applicable.
Data Availability Statement
The data used in this paper are available from F.C. ([email protected]) upon request.
Acknowledgments
Thanks the colleagues at the Northwest Normal University for their help in field work, laboratory analyses, data processing, etc.
Conflicts of Interest
The authors declare no conflict of interest. The work described here has not been submitted elsewhere for publication, in whole or in part, and all the authors listed have approved the manuscript that is enclosed.
References
- Cai, M.Y.; Wang, L.; Parkes, S.D.; Strauss, J.; McCabe, M.F.; Evans, J.P.; Griffiths, A.D. Stable water isotope and surface heat flux simulation using ISOLSM: Evaluation against in-situ measurements. J. Hydrol. 2015, 523, 67–78. [Google Scholar] [CrossRef] [Green Version]
- Zhu, G.F.; Li, J.F.; Shi, P.J.; He, Y.Q.; Cai, A.L.; Tong, H.L. Relationship between sub-cloud secondary evaporation and stable isotope in precipitation indifferent regions of China. Environ. Earth Sci. 2016, 75, 876. [Google Scholar] [CrossRef]
- Li, Z.X.; Qi, F.; Wang, Q.J.; Kong, Y.L.; Cheng, A.F.; Yong, S.; Li, Y.G.; Li, J.G.; Guo, X.Y. Contributions of local terrestrial evaporation and transpiration to precipitation using δ18O and d-excess as a proxy in Shiyang inland river basin in China. Glob. Planet. Chang. 2016, 146, 140–151. [Google Scholar]
- Wang, S.J.; Zhang, M.J.; Che, Y.J.; Chen, F.L.; Qiang, F. Contribution of recycled moisture to precipitation in oases of arid central Asia: A stable isotope approach. Water Resour. Res. 2016, 52, 3246–3257. [Google Scholar] [CrossRef] [Green Version]
- Jean, C.C.H.; Oliver, A.C.; Eugene, F.K.; Samuel, M.S. Oxygen isotopic composition of soil water: Quantifying evaporation and transpiration. Geoderma 1998, 82, 269–293. [Google Scholar]
- Bowen, G.J.; Good, S.P. Incorporating water isoscapes in hydrological and water resource investigations. Wiley Interdisciplinary Reviews Water 2015, 2, 107–119. [Google Scholar] [CrossRef]
- Dansgaard, W. Stable isotopes in precipitation. Tellus 1964, 16, 436–468. [Google Scholar] [CrossRef]
- Peng, H.D.; Mayer, B.; Harris, S.; Krouse, H.R. A 10-year record of stable isotope ratios of hydrogen and oxygen in precipitation at Calgary, Alberta, Canada. Tellus B 2004, 56, 147–159. [Google Scholar] [CrossRef]
- Liu, X.; Song, X.F.; Zhang, Y.H.; Xia, J.; Zhang, X.C.; Yu, J.J.; Long, D.; Li, F.D.; Zhang, B. Spatio-temporal variations of δ2H and δ18O in precipitation and shallow groundwater in the Hilly Loess Region of the Loess Plateau, China. Environ. Earth Sci. 2010, 63, 1105–1118. [Google Scholar] [CrossRef]
- Warrier, C.U.; Babu, M.P. A study on the spatial variations in stable isotopic composition of precipitation in a semiarid region of Southern India. Hydrol. Process. 2012, 26, 3791–3799. [Google Scholar] [CrossRef]
- Craig, H. Isotopic variations in meteoric waters. Science 1961, 133, 1702–1703. [Google Scholar] [CrossRef]
- Gao, Z.J.; Yu, C.; Tian, Y.; Zhang, H.Y. Slope distribution of water vapor and its source in Chinese mainland. Groundwater 2017, 39, 149–152. [Google Scholar]
- Feng, F.; Li, Z.Q.; Zhang, M.J.; Jin, S.; Dong, Z.W. Deuterium and oxygen 18 in precipitation and atmospheric moisture in the upper Urumqi River Basin, eastern Tianshan Mountains. Environ. Earth Sci. 2013, 68, 1199–1209. [Google Scholar] [CrossRef]
- Gimeno, L.; Stohl, A.; Trigo, R.M.; Dominguez, F.; Yoshimura, K.; Yu, L.; Drumond, A.; Durán-Quesada, M.A.; Nieto, R. Oceanic and terrestrial sources of continental precipitation. Rev. Geophys. 2012, 50. [Google Scholar] [CrossRef]
- Chen, J.; Gao, D.Q.; Xu, Q.; Hao, Y.G.; Ma, Y.B.; Zhang, B.B. Hydrogen and oxygen isotope characteristics and water vapor sources of summer precipitation in the desert of Western Ordos. For. Sci. Res. 2016, 29, 911–918. [Google Scholar]
- Voelker, A.H.L.; Colman, A.; Olack, G.; Waniek, J.J.; Hodell, D. Oxygen and hydrogen isotope signatures of Northeast Atlantic water masses. Deep Sea Res. Part II Top. Stud. Oceanogr. 2015, 116, 89–106. [Google Scholar] [CrossRef]
- Tian, L.D.; Yao, T.D.; MacClune, K.; White, J.W.C.; Schilla, A.; Vaughn, B. Stable isotopic variations in west China: A consideration of moisture sources. J. Geophys. Res. Atmos. 2017, 112. [Google Scholar] [CrossRef]
- Li, Z.X.; Gao, Y.; Wang, Y.M.; Pan, Y.H.; Li, J.G.; Chen, A.F.; Wang, T.T.; Han, C.T.; Song, Y.X.; Theakstone, W.H. Can monsoon moisture arrive in the Qilian Mountains in summer? Quat. Int. 2015, 358, 113–125. [Google Scholar]
- Masayoshi, N.; Akiko, S.; Yoshihiro, M. Water isotope variations in the snow pack and summer precipitation at July 1 Glacier, Qilian Mountains in northwest China. Chin. Sci. Bull. 2007, 21, 2963–2972. [Google Scholar]
- Wang, B.J.; Huang, Y.X.; Tao, J.H.; Li, D.L.; Wang, P.X. Regional distribution and variation of atmospheric water vapor in Northwest China. J. Glaciol. Geocryol. 2006, 1, 15–21. [Google Scholar]
- Ma, Q.; Zhang, M.J.; Wang, S.J.; Wang, Q.; Liu, W.L.; Li, F.; Chen, F.L. An investigation of moisture sources and secondary evaporation in Lanzhou, Northwest China. Environ. Earth Sci. 2014, 71, 3375–3385. [Google Scholar] [CrossRef]
- Chen, F.L.; Zhang, M.J.; Argiriou, A.A.; Wang, S.J.; Zhou, X.; Liu, X.Y. Deuterium Excess in Precipitation Reveals Water Vapor Source in the Monsoon Margin Sites in Northwest China. Water 2020, 12, 3315. [Google Scholar] [CrossRef]
- Liu, J.R.; Song, X.F.; Yuan, G.F.; Sun, X.M.; Liu, X.; Chen, F.; Wang, Z.M.; Wang, S.Q. Characteristics of Atmospheric Precipitation δ18O and Water Vapor Sources in Northwest China. Acta Geogr. Sin. 2008, 1, 12–22. [Google Scholar]
- Salamalikis, V.; Argiriou, A.A.; Dotsika, E. Stable isotopic composition of atmospheric water vapor in Patras, Greece: A concentration weighted trajectory approach. Atmos. Res. 2015, 152, 93–104. [Google Scholar] [CrossRef]
- Meng, H.F.; Zhang, M.J.; Wang, S.J.; Qiu, X.; Du, M.X.; Zhang, Y.N.; Yu, X.X.; Zhou, S.E. Analysis of diurnal water vapor isotope characteristics and water vapor sources in summer in the middle reaches of Heihe River. Arid Land Geogr. 2020, 43, 360–370. [Google Scholar]
- Meng, H.F.; Zhang, M.J.; Wang, S.J.; Qiu, X.; Zhou, S.E.; Zhang, Y.N.; Yu, X.X.; Wang, W. Isotopic characteristics of precipitation in the upper reaches of Heihe River and analysis of its water vapor source. J. Glaciol. Geocryol. 2020, 42, 937–951. [Google Scholar]
- Begum, B.A.; Kim, E.; Jeong, C.H.; Lee, D.W.; Hopke, P.K. Evaluation of the potential source contribution function using the 2002 Quebec forest fire episode. Atmos. Environ. 2005, 39, 3719–3724. [Google Scholar] [CrossRef]
- Liu, Y.; He, Y.H.; Zhou, J.H. Study on the impact of Tao River Diversion Project on the ecological carrying capacity of water resources in Dingxi. Water Resour. Dev. Manag. 2020, 12, 33–36. [Google Scholar]
- Su, B.G. Discussion on construction and management of rural safe drinking water project in Anding District of Dingxi City. Agric. Sci. Technol. Inf. 2017, 18, 31–33. [Google Scholar]
- Fang, C.; Gao, J.; Wang, D.; Wang, D.; Wang, J. Optimization of stepwise clustering algorithm in backward trajectory analysis. Neural Comput. Appl. 2018, 32, 109–115. [Google Scholar] [CrossRef]
- Zhang, Z.Y.; Wong, M.S.; Lee, K.H. Estimation of potential source regions of PM2.5 in Beijing using backward trajectories. Atmos. Pollut. Res. 2015, 6, 173–177. [Google Scholar] [CrossRef] [Green Version]
- Hsu, C.Y.; Chiang, H.C.; Lin, S.L.; Chen, M.J.; Lin, T.Y.; Chen, Y.C. Elemental characterization and source apportionment of PM10 and PM2.5 in the western coastal area of central Taiwan. Sci. Total Environ. 2015, 541, 1139. [Google Scholar] [CrossRef]
- Shi, Y.; Jiang, Z.; Liu, Z.; Li, L. A Lagrangian Analysis of Water Vapor Sources and Pathways for Precipitation in East China in Different Stages of the East Asian Summer Monsoon. J. Clim. 2019, 33, 977–992. [Google Scholar] [CrossRef]
- Piao, J.; Chen, W.; Chen, S.; Gone, H.; Zhang, Q. Summer Water Vapor Sources in Northeast Asia and East Siberia Revealed by a Moisture-Tracing Atmospheric Model. J. Clim. 2020, 33, 3883–3899. [Google Scholar] [CrossRef] [Green Version]
- Li, X.F.; Zhang, M.J.; Li, Y.J.; Wang, S.J.; Huang, X.Y.; Ma, Q.; Ma, X.N. Characteristics of δ18O in Precipitation and Moisture Transports over the Arid Region in Northwest China. Environ. Sci. 2012, 33, 711–719. [Google Scholar]
- Draxler, R.R.; Hess, G.D. An overview of the HYSPLIT_4 modelling system for trajectories. Aust. Meteorol. Mag. 1998, 47, 295–308. [Google Scholar]
- Wang, Y.Q.; Zhang, X.Y.; Draxler, R.R. TrajStat: GIS-based software that uses various trajectory statistical analysis methods to identify potential sources from long-term air pollution measurement data. Environ. Model. Softw. 2009, 24, 938–939. [Google Scholar] [CrossRef]
- Zeng, Y.; Hopke, P.K. A study of the sources of acid precipitation in Ontario, Canada. Atmos. Environ. 1989, 23, 1499–1509. [Google Scholar] [CrossRef]
- Gao, N.; Cheng, M.D.; Hopke, P.K. Potential source contribution function analysis and source apportionment of sulfur species measured at Rubidoux, CA during the Southern California Air Quality Study. Anal. Chim. Acta 1987, 277, 369–380. [Google Scholar] [CrossRef]
- Shi, Y.; Wang, S.; Wang, L.; Zhang, M.; Argiriou, A.A.; Song, Y.; Lei, S. Isotopic evidence in modern precipitation for the westerly meridional movement in Central Asia. Atmos. Res. 2021, 259, 105698. [Google Scholar] [CrossRef]
- Meng, H.F. Isotopic characteristics of precipitation and analysis of water vapor sources in the middle Qilian Mountains. China Environ. Sci. 2019. [Google Scholar] [CrossRef]
- Kulshrestha, U.C.; Raman, R.S.; Kulshrestha, M.J.; Rao, T.N.; Hazarika, P.J. Secondary aerosol formation and identification of regional source locations by PSCF analysis in the Indo-Gangetic region of India. J. Atmos. Chem. 2009, 63, 33–47. [Google Scholar] [CrossRef]
- Wang, A.P.; Zhu, B.; Yin, Y.; Jin, L.J.; Zhang, L. Characteristics of aerosol number concentration and its potential source area in summer at the top of Huangshan Mountain. China Environ. Sci. 2014, 34, 852–861. [Google Scholar]
- Polissar, A.V.; Hopke, P.K.; Paatero, P.; Kaufmann, Y.J.; Hall, D.K. Bodhaine, B.A.; Dutton, E.G.; Harris, J.M. The aerosol at Barrow, Alaska: Long-term trends and source locations. Atmos. Environ. 1999, 33, 2441–2458. [Google Scholar] [CrossRef]
- Zhang, L.; Jin, L.J.; Zhu, B.; Yin, Y. Influence of advection transportation on pollutant concentration at the top of Huangshan Mountain from June to August 2011. China Environ. Sci. 2013, 33, 969–978. [Google Scholar]
- Hsu, Y.K.; Holsen, T.M.; Hopke, P.K. Comparison of hybrid receptor models to locate PCB sources in Chicago. Atmos. Environ. 2003, 37, 545–562. [Google Scholar] [CrossRef]
- Meng, H.F.; Zhang, M.J.; Wang, S.J.; Qiu, X.; Du, M.X.; Ma, R. Application of CWT Method in Identifying Water Vapor Sources of Summer Precipitation in China. Arid Area Res. 2018, 35, 872–881. [Google Scholar]
- Strauch, G.; Al-Mashaikhi, K.S.; Bawain, A.; Knöller, K.; Friesen, J.; Müller, T. Stable H and O isotope variations reveal sources of recharge in Dhofar, Sultanate of Oman. Isotopes Environ. Health Stud. 2014, 50, 475–490. [Google Scholar] [CrossRef] [PubMed]
- Akers, P.D.; Kopec, B.G.; Mattingly, K.S.; Klein, E.S.; Welker, J.M. Baffin Bay sea ice extent and synoptic moisture transport drive water vapor isotope (δ18O, δ2H, and deuterium excess) variability in coastal northwest Greenland. Atmos. Chem. Phys. 2020, 20, 13929–13955. [Google Scholar] [CrossRef]
- IAEA/WMO. Global Network for Isotopes in Precipitation (EB/OL). Available online: http://isohis.iaea.org (accessed on 15 June 2021).
- Meng, Y.C.; Liu, G.D. Secondary evaporation effect of stable isotopes of precipitation in the Yangtze River Basin. Adv. Water Sci. 2010, 21, 327–334. [Google Scholar]
- Pang, B.R. Isotope hydrology. Adv. Hydrosci. 1972, 8, 95–138. [Google Scholar]
- Araguás-Araguás, L.; Froehlich, K.; Rozanski, K. Stable isotope composition of precipitation over southeast Asia. J. Geophys. Res. 1998, 103, 28721–28742. [Google Scholar] [CrossRef]
- Nieto, R.; Gimeno, L.; Trigo, R.M. A Lagrangian identification of major sources of Sahel moisture. Geophys. Res. Lett. 2006, 33, 273–274. [Google Scholar] [CrossRef]
- Brimelow, J.C.; Reuter, G.W. Transport of Atmospheric Moisture during Three Extreme Rainfall Events over the Mackenzie River Basin. J. Hydrometeorol. 2005, 6, 423–440. [Google Scholar] [CrossRef]
- Huang, Y.; Cui, X. Moisture sources of an extreme precipitation event in Sichuan, China, based on the Lagrangian method. Atmos. Sci. Lett. 2015, 16, 177–183. [Google Scholar] [CrossRef]
- Li, M.M.; Huang, X.; Zhu, L.; Li, J.F.; Song, Y.; Cai, X.H.; Xie, S.D. Analysis of the transport pathways and potential sources of PM10 in Shanghai based on three methods. Sci. Total Environ. 2012, 414, 525–534. [Google Scholar] [CrossRef]
- Zhu, G.F.; Guo, H.W.; Qin, D.H.; Pan, H.X.; Zhang, Y.; Jia, W.X. Contribution of recycled moisture to precipitation in the monsoon marginal zone: Estimate based on stable isotope data. J. Hydrol. 2018, 569, 423–435. [Google Scholar] [CrossRef]
- Wang, Y.Y.; Yue, S.L.; Ding, S.C.; Liu, S.H.; Ding, S.C. Cultivation technology of broad bean covered with double ridge and full film in semi-arid and two Yin areas. Gansu Agric. Technol. 2007, 12, 43–44. [Google Scholar]
- Kang, N.; Deng, F.R.; Khan, R.; Kumaret, K.R.; Hu, K.; Yu, X.N.; Wang, X.L.; Latha Devi, N.S.M.P. Temporal variations of PM concentrations, and its association with AOD and meteorology observed in Nanjing during the autumn and winter seasons of 2014–2017. J. Atmos. Sol. Terr. Phys. 2020, 203, 105273. [Google Scholar] [CrossRef]
Figure 1.
(a) Map showing the distribution of sampling stations. Spatial distribution of altitude in Dingxi, derived from China 30 Arc-Second Elevation (GDEMV2; http://www.gscloud.cn/ (accessed on 18 June 2021)). The satellite-derived land cover base map is from Natural Earth (http://www.naturalearthdata.com (accessed on 13 June 2021)). (b,c) Monthly mean air temperatures (T) and total precipitation (P) at Weibei and Weinan from April 2019 to April 2020. The line represents air temperature (T) and histogram represents precipitation (P).

Figure 2.
(a) linear relationship between δD and δ18O at each sampling station in Dingxi. (b) linear relationship between δD and δ18O using all samples collected in Dingxi. (c, d) Temporal variations δ18O, δD, d-excess, *d-excess, and local precipitation amount in Dingxi (including all sampling stations).

Figure 3.
Back trajectories simulated by the HYSPLIT model for all sampling stations of Dingxi in spring (a), summer (c), autumn (e), and winter (g). (b,d,f,h) Map showing the three trajectories clustered according to the direction of the backward trajectory of each season. The white lines are the daily precipitation events with vapor trajectories during the preceding five days (240 h) at 1500 m agl (above the ground level). The red, green, and yellow lines represent the trajectories that account for the higher, the middle, and the least after clustering, respectively.

Figure 4.
Monthly mean precipitable water (PW) and vapor flux (VF) from the surface to 300 hPa in the study area and its surrounding areas in spring, summer, autumn, and winter based on National Centers for Environmental Prediction/National Center for Atmospheric Research (NCEP/NCAR) Reanalysis 1. The study region is marked in a red frame.

Figure 5.
(a) Map showing the PSCF analysis of Anding sampling station in the study area during the monsoon period. (b) Map showing the PSCF analysis of Longxi sampling station in the study area during the monsoon period. (c) Map showing the PSCF analysis of Tongwei sampling station in the study area during the monsoon period. (d) Map showing the PSCF analysis of Lintao sampling station in the study area during the monsoon period. (e) Map showing the PSCF analysis of Weiyuan sampling station in the study area during the monsoon period. (f) Map showing the PSCF analysis of Zhangxian sampling station in the study area during the monsoon period. (g) Map showing the PSCF analysis of Minxian sampling station in the study area during the monsoon period.

Figure 6.
C Map showing the CWT analysis of (a) Anding, (b) Longxi, (c) Tongwei, (d) Lintao, (e) Weiyuan, (f) Zhangxian and (g) Minxian stations during the monsoon period.
Figure 6.
C Map showing the CWT analysis of (a) Anding, (b) Longxi, (c) Tongwei, (d) Lintao, (e) Weiyuan, (f) Zhangxian and (g) Minxian stations during the monsoon period.


Table 1.
Latitude, longitude, altitude, and annual climatology (T-air temperature, P-precipitation amount, e-vapor pressure, and h-relative humidity) during 1981–2010 at the sampling stations.
Table 1.
Latitude, longitude, altitude, and annual climatology (T-air temperature, P-precipitation amount, e-vapor pressure, and h-relative humidity) during 1981–2010 at the sampling stations.
| Station | Latitude | Longitude | Alt (m) | Number of Samples | Annual Climatology | |||
|---|---|---|---|---|---|---|---|---|
| T (°C) | P (mm) | e (hPa) | h (%) | |||||
| Anding | 35°58′ | 104°61′ | 1898.83 | 62 | 7.2 | 377 | 8.1 | 63 |
| Longxi | 35°00′ | 104°63′ | 1731.29 | 84 | 8.2 | 414.8 | 8.3 | 68 |
| Weiyuan | 35°14′ | 104°21′ | 2111.34 | 73 | 6.1 | 504.3 | 7.9 | 68 |
| Tongwei | 35°21′ | 105°24′ | 1770.92 | 87 | 7.2 | 390.6 | 8.2 | 70 |
| Lintao | 35°38′ | 103°86′ | 1887.82 | 56 | 7.5 | 493.9 | 8.1 | 67 |
| Zhangxian | 34°85′ | 104°47′ | 1887.53 | 55 | 7.8 | 433.5 | 8.1 | 67 |
| Minxian | 34°43′ | 104°04′ | 2317.85 | 103 | 6.1 | 556.3 | 7.8 | 68 |
Publisher’s Note: MDPI stays neutral with regard to jurisdictional claims in published maps and institutional affiliations. |
© 2021 by the authors. Licensee MDPI, Basel, Switzerland. This article is an open access article distributed under the terms and conditions of the Creative Commons Attribution (CC BY) license (https://creativecommons.org/licenses/by/4.0/).
Share and Cite
MDPI and ACS Style
Wu, X.; Chen, F.; Liu, X.; Wang, S.; Zhang, M.; Zhu, G.; Zhou, X.; Chen, J. The Significance of Hydrogen and Oxygen Stable Isotopes in the Water Vapor Source in Dingxi Area. Water 2021, 13, 2374. https://doi.org/10.3390/w13172374
AMA Style
Wu X, Chen F, Liu X, Wang S, Zhang M, Zhu G, Zhou X, Chen J. The Significance of Hydrogen and Oxygen Stable Isotopes in the Water Vapor Source in Dingxi Area. Water. 2021; 13(17):2374. https://doi.org/10.3390/w13172374
Chicago/Turabian StyleWu, Xixi, Fenli Chen, Xueyuan Liu, Shengjie Wang, Mingjun Zhang, Guofeng Zhu, Xin Zhou, and Jufan Chen. 2021. "The Significance of Hydrogen and Oxygen Stable Isotopes in the Water Vapor Source in Dingxi Area" Water 13, no. 17: 2374. https://doi.org/10.3390/w13172374
Note that from the first issue of 2016, this journal uses article numbers instead of page numbers. See further details here.