
Local Meteoric Water Lines in a Semi-Arid Setting of Northwest China Using Multiple Methods
by
 , ,
, ,
Fenli Chen
1,2, 
Shengjie Wang
1,2,*,
Xixi Wu
1,2,
Mingjun Zhang
1,2,
Athanassios A. Argiriou
3,
Xin Zhou
1,2 and
Jufan Chen
1,2 1
College of Geography and Environmental Science, Northwest Normal University, Lanzhou 730070, China
2
Key Laboratory of Resource Environment and Sustainable Development of Oasis of Gansu Province, Lanzhou 730070, China
3
Laboratory of Atmospheric Physics, Department of Physics, University of Patras, GR-265 00 Patras, Greece
*
Author to whom correspondence should be addressed.
Water 2021, 13(17), 2380; https://doi.org/10.3390/w13172380
Submission received: 9 June 2021
/
Revised: 10 August 2021
/
Accepted: 16 August 2021
/
Published: 30 August 2021
(This article belongs to the Section Hydrology)
Abstract
:The local meteoric water lines (LMWLs) reflect water sources and the degree of sub-cloud evaporation at a specific location. Lanzhou is a semi-arid city located at the margin of the Asian monsoon, and the isotope composition in precipitation around this region has aroused attention in hydrological and paleoclimate studies. Based on an observation network of stable isotopes in precipitation in Lanzhou, LMWLs at four stations (Anning, Yuzhong, Gaolan and Yongdeng) are calculated using the event-based/monthly data and six regression methods (i.e., ordinary least squares, reduced major axis, major axis regressions, and their counterparts weighted using precipitation amount). Compared with the global meteoric water line, the slope and intercept of LMWL in Lanzhou are smaller. The slopes and intercepts calculated using different methods are slightly different. Among these methods, precipitation-weighted least squares regression (PWLSR) usually had the minimum average value of root mean sum of squared error (rmSSEav), indicating that the result of the precipitation weighted method is relatively stable. Higher precipitation amount and lower air temperature result in larger slopes and intercepts on an annual scale, which is out of accordance with the summertime.
1. Introduction
The stable isotope compositions in precipitation are widely investigated in Earth science [1,2,3]. Usually, there are strong linear relationships between stable hydrogen and oxygen compositions (δD and δ18O) in natural water, and the best-fit line (δD = 8 δ18O + 10) at a global scale is termed as the global meteoric water line (GMWL; [4]). Influenced by the evaporation condition at the source area as well as associated meteorological conditions [5], the local correlations between δD and δ18O in precipitation vary. For a specific location, it is necessary to establish a local meteoric water line (LMWL) [6,7], which is potentially useful to assess water sources and the degree of sub-cloud evaporation [8]. Below-cloud secondary evaporation of falling raindrops makes the slopes and intercepts of LMWL lower [9] and deuterium excess (D-excess, defined as d = δD − 8 δ18O) lower [10,11].
In most cases, the LMWL is usually established by an ordinary least squares regression (OLSR) [12], although other regressions are also recommended by IAEA (International Atomic Energy Agency) and other scientists [12,13]. The OLSR method logically gives all data points the same weighting, which may be sensitive for some heavy and small precipitation events [14,15]. When a sampling period is relatively short, great uncertainty of LMWLs may be involved, and the slope and intercepts may be sensitive to air temperature, precipitation amount and relative humidity. In studies where heavy rainfall events play a dominant role, the effect of small precipitation events on hydrological processes may be overestimated if equal weights are applied to each sample [16].
In the past decade, alternative methods considering precipitation amounts have aroused great attention about LMWL determination [14,15,17]. One of the widely-applied weighted methods, precipitation-weighted least squares regression (PWLSR), was introduced by Hughes and Crawford [15], and this method reduces the influence of small amounts. Based on the global data, Crawford et al. [17] indicated the weighted and unweighted regression results are generally similar, except in some coastal and oceanic sites with a poor linear relationship between δD and δ18O. However, some cases in an arid setting [14] indicated the necessity of precipitation weighting when precipitation events are limited.
Situated at the western Loess Plateau and near the Tibetan Plateau, Lanzhou is jointly influenced by westerlies and monsoon moistures [18,19,20,21,22]. The Yellow (Huanghe) River flows from south-west to north-east through the urban area of Lanzhou. Although LMWL in Lanzhou was previously determined using >200 [23] or >400 event-based samples [21,24], the precipitation amount weighted methods were not taken into account until now. In this study, 959 event-based samples at four stations from April 2011 to October 2014 were applied to determine LMWLs using multiple regressions. The objective of this study is (1) to present seasonal variation of LMWL, (2) to consider the differences between precipitation-weighted and unweighted regressions, and (3) to discuss the sensitivity of LMWL to meteorological conditions.
2. Data and Method
2.1. Data and Site Description
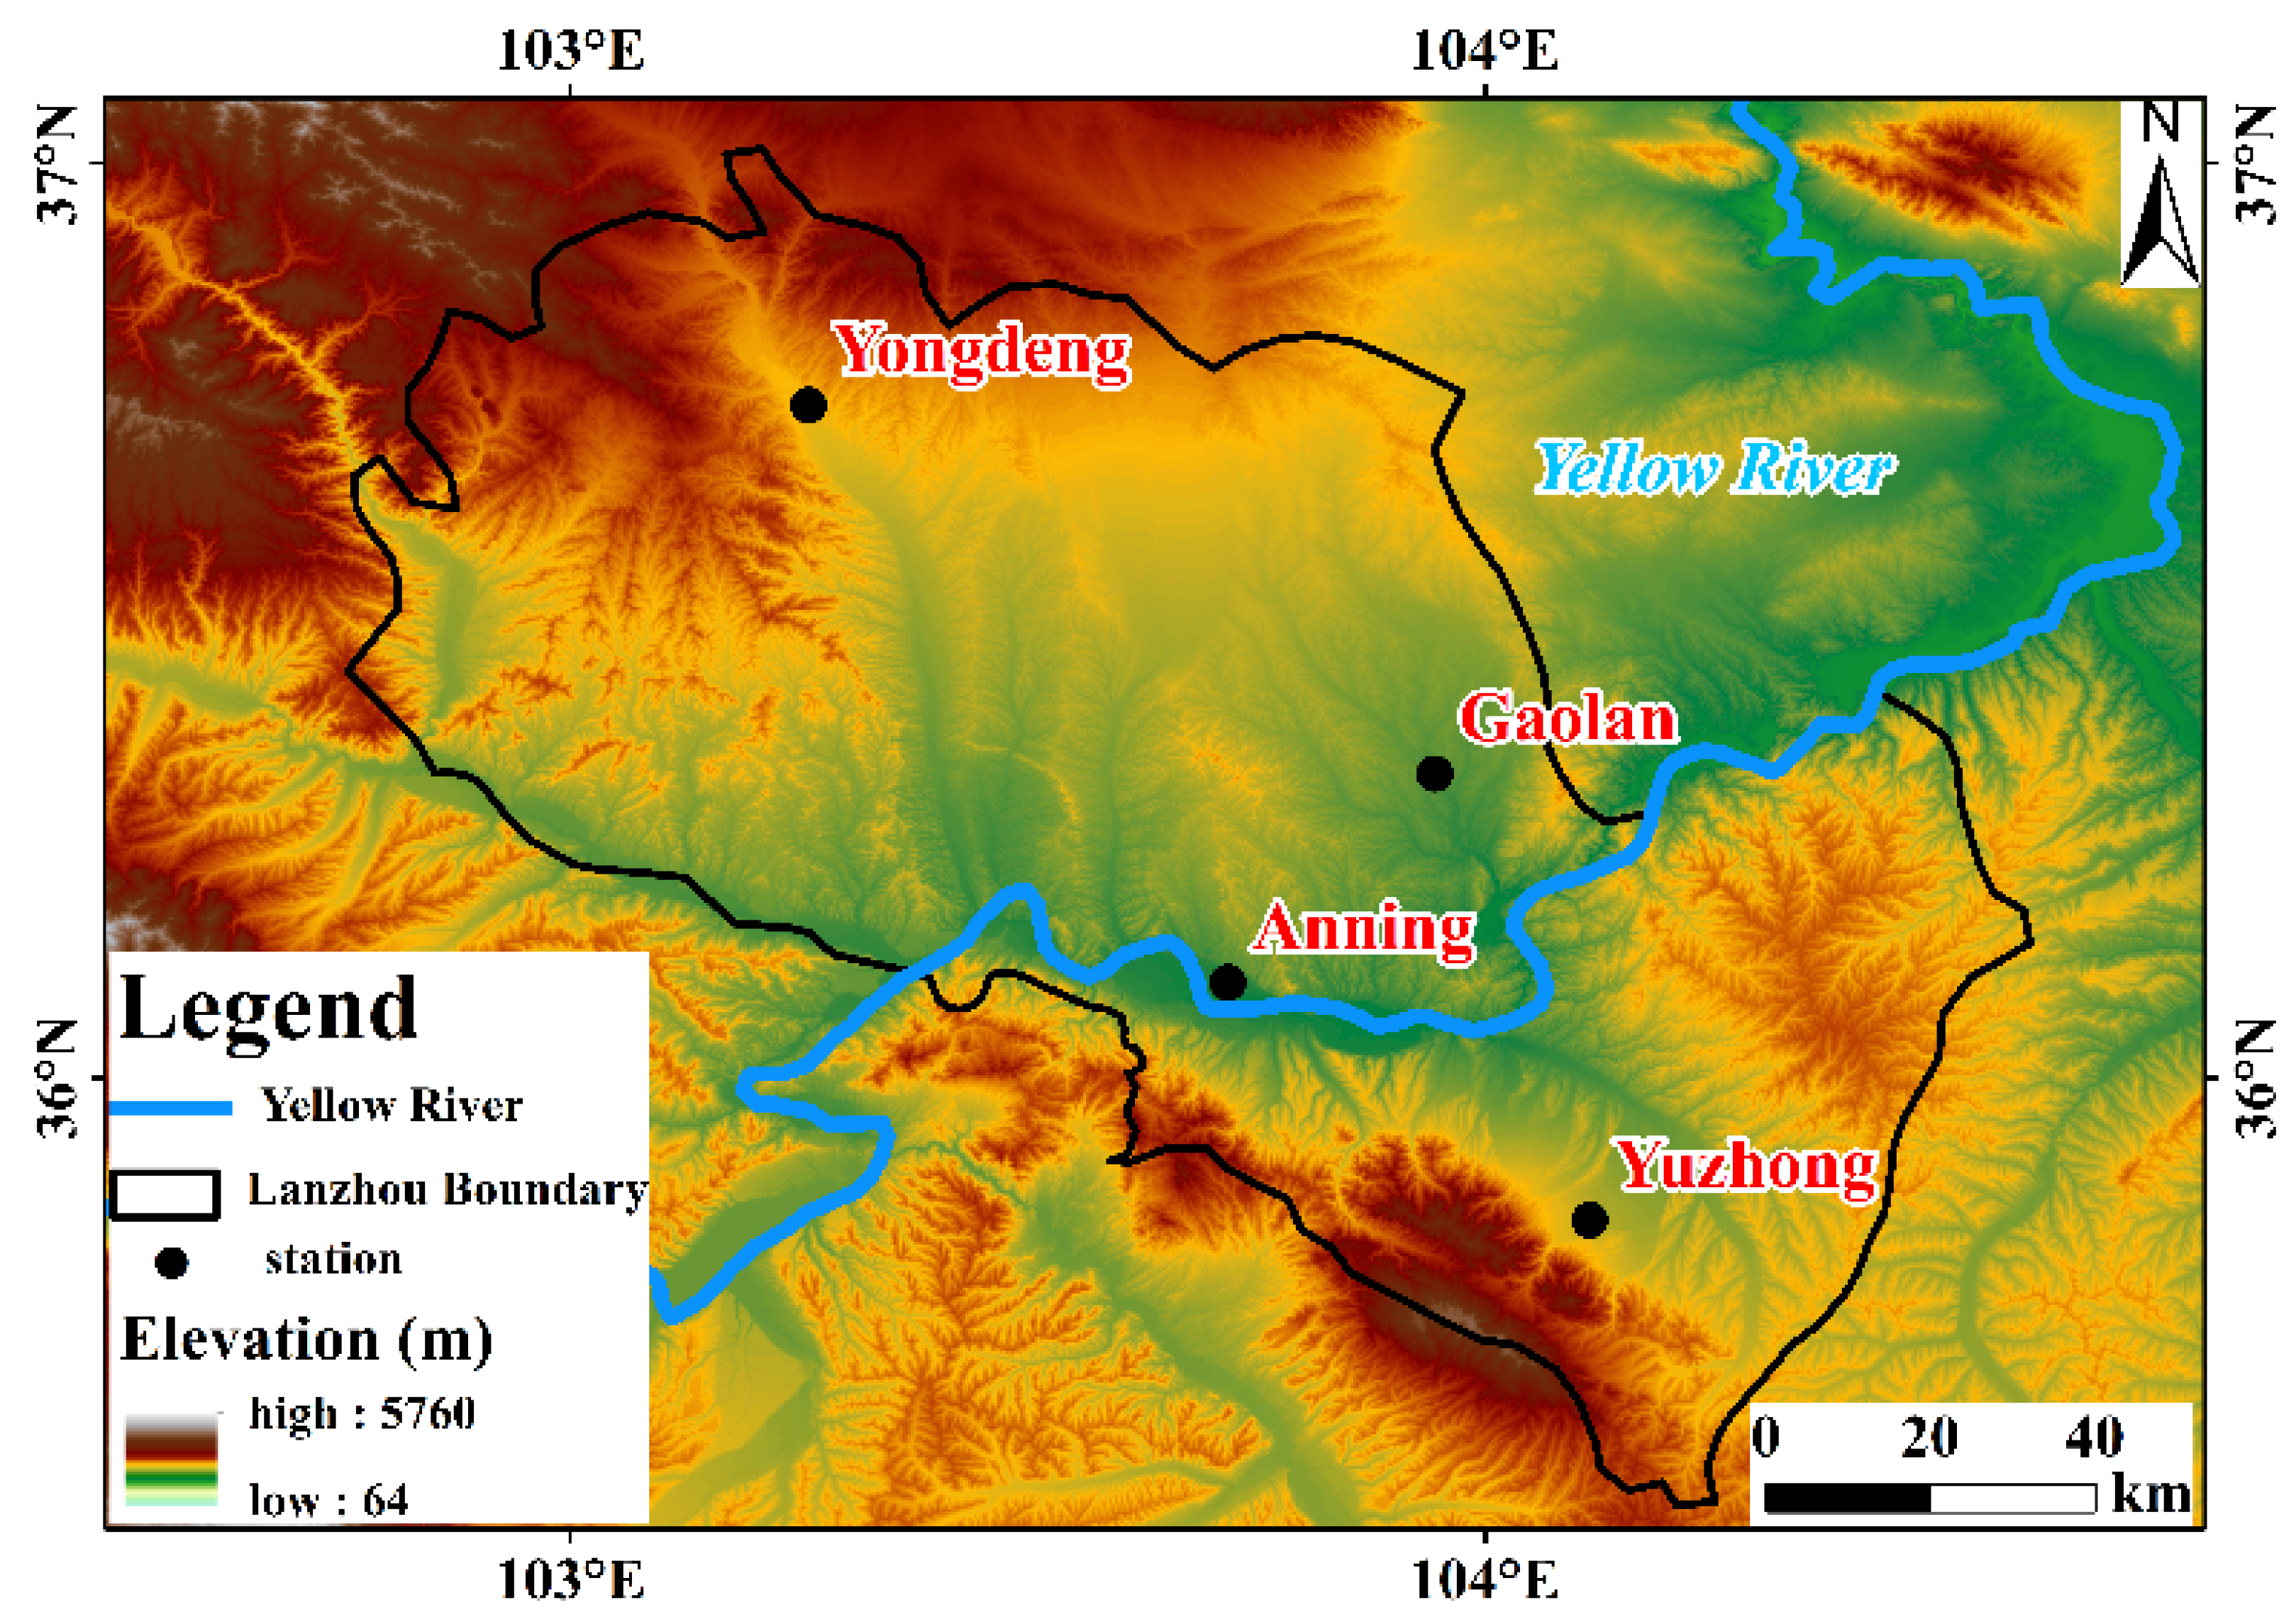
From April 2011 to October 2014, event-based precipitations were sampled at four sites across Lanzhou, i.e., Anning (36°06′ N, 103°44′ E, 1548 m), Yuzhong (35°52′ N, 104°09′ E, 1874 m), Gaolan (36°21′ N, 103°56′ E, 1669 m) and Yongdeng (36°45′ N, 103°15′ E, 2119 m) (Figure 1). The basic isotopic characteristics in precipitation at these sampling sites during this period were analyzed by Chen et al. [22]. A total of 959 event-based precipitation samples were collected then filled into HDPE bottles with waterproof seals. More details of sampling procedure and meteorological parameters compilation were introduced in our previous studies [21,22,23,24]. Stable hydrogen and oxygen isotope compositions in all the precipitation samples were analyzed using liquid water isotope analyzer DLT-100 (Los Gatos Research, Inc., Mountain View, CA, USA) in the Stable Isotope Laboratory, College of Geography and Environmental Science, Northwest Normal University, Lanzhou, with a precision of ±0.6‰ and ±0.2‰, for δD and δ18O, respectively [22].
In addition, the monthly data in Lanzhou (36°03′ N, 103°52′ E, 1517 m) during the 1980s and 1990s were also acquired from the Global Network of Isotopes in Precipitation (GNIP) [13] to investigate the inter-annual variability. In the GNIP database, 42 monthly records were measured in Lanzhou and were concentrated in two periods, i.e., 1985–1987 and 1996–1999.
2.2. Local Meteoric Water Line Calculation
There are six regressions applied in this study, including three unweighted and three precipitation-weighted ones. Ordinary least squares regression (OLSR) reduced major axis regression (RMA) and major axis regression (MA) give equal weighting to each sample [12,17]. Corresponding amount-weighted regressions to these three: precipitation-weighted least squares regression (PWLSR), precipitation-weighted reduced major axis regression (PWRMA) and precipitation-weighted major axis regression (PWMA) were also calculated [15,17]. The Local Meteoric Water Line Freeware (available at http://openscience.ansto.gov.au/collection/879, accessed on 14 May 2021) was used to determinate all the six regressions above-mentioned. The average value of the root mean sum of squared error (rmSSEav) was applied to assess whether this result denotes a close fit (rmSSEav close to 1) [17].
3. Results and Discussion
3.1. Basic Characteristics of LMWL
The LMWL in this study is δD = (7.27 ± 0.06) δ18O + (4.56 ± 0.44), based on 959 event-based samples, showing lower intercepts and slopes than the global mean by using the most common method, OLSR. If PWRMA is used, the LMWL is very close to the GMWL: δD = (7.73 ± 0.05) δ18O+ (9.10 ± 0.44) (Figure 2a and Tables S1–S3 in Supplementary Materials). Based on the amount of weighted monthly samples, the LMWLs for OLSR, δD = (7.53 ± 0.14) δ18O + (7.19 ± 1.19), and PWRMA, δD = (7.73 ± 0.14) δ18O + (8.98 ± 1.03), also show lower intercept and slope values than the GMWL (Figure 2b and Tables S4–S6 in Supplementary Materials). Stable isotopes in falling raindrops are greatly influenced by below-cloud evaporation in arid conditions, which generates the light isotopes (1H and 16O) to be preferentially evaporated, resulting in an enrichment of heavy isotopes (D and 18O) in raindrops [4,25]. Figure 2a,b shows that the samples plotted above the GMWL are influenced by strengthened moisture recycling, while the ones below the GMWL are affected mostly by intense evaporation loss [26,27]. Comparing Figure 2a,b, the slope and intercept values which derives from linear regressions (δD and δ18O) calculated using event-based samples and monthly weighted samples are different. The greater the difference in the slopes and intercepts is, the more obvious the role of below-cloud evaporation is [28]. In this study area, the slopes and the intercepts of the amount weighted monthly data are higher than those of the event-based data, and there are a lot of rain events between 0 and 1 mm (333 out of the 959 events).
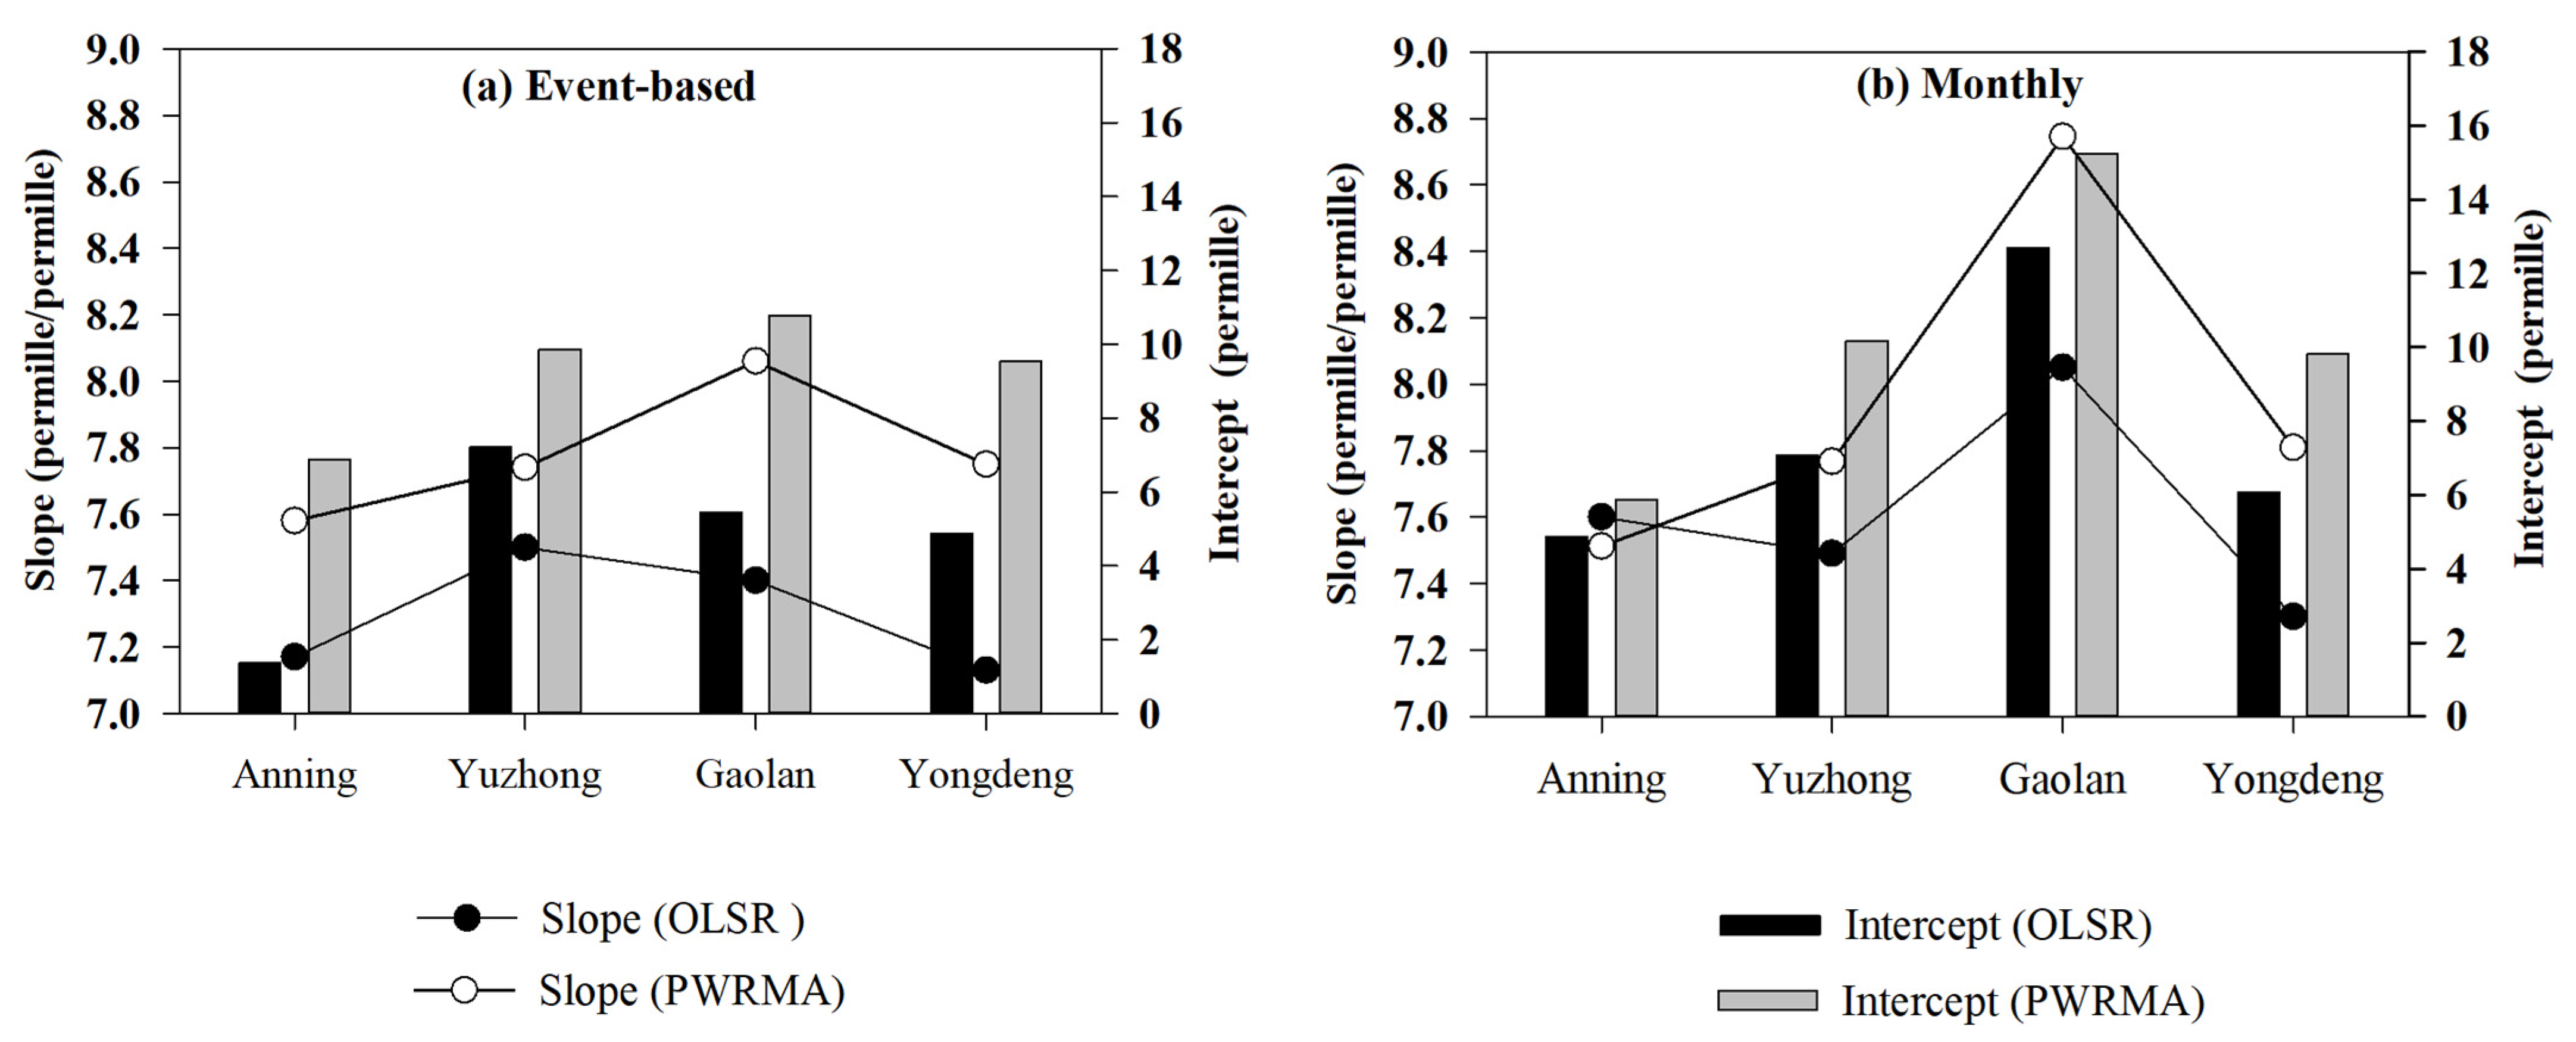
Figure 3 shows that the slopes and the intercepts at Anning, Yuzhong, Gaolan and Yongdeng for event-based samples and monthly weighted samples are different. OLSR slopes range between 7.14 ± 0.01 permille/permille (Yongdeng) to 7.50 ± 0.09 (Yuzhong), and the intercepts change from 1.54 ± 0.83 permille (Anning) to 7.20 ± 0.87 permille (Yuzhong). Differences in the intercept values may be attributable to the different origin and trajectories of precipitation of the sites and the more intense secondary evaporation of raindrops below the cloud base at Anning. Similarly, comparing Figure 3a,b, using the monthly precipitation weighted values from all sampling sites resulted in an OSLR slope and intercept larger than those determined using OLSR with all the event-based data.
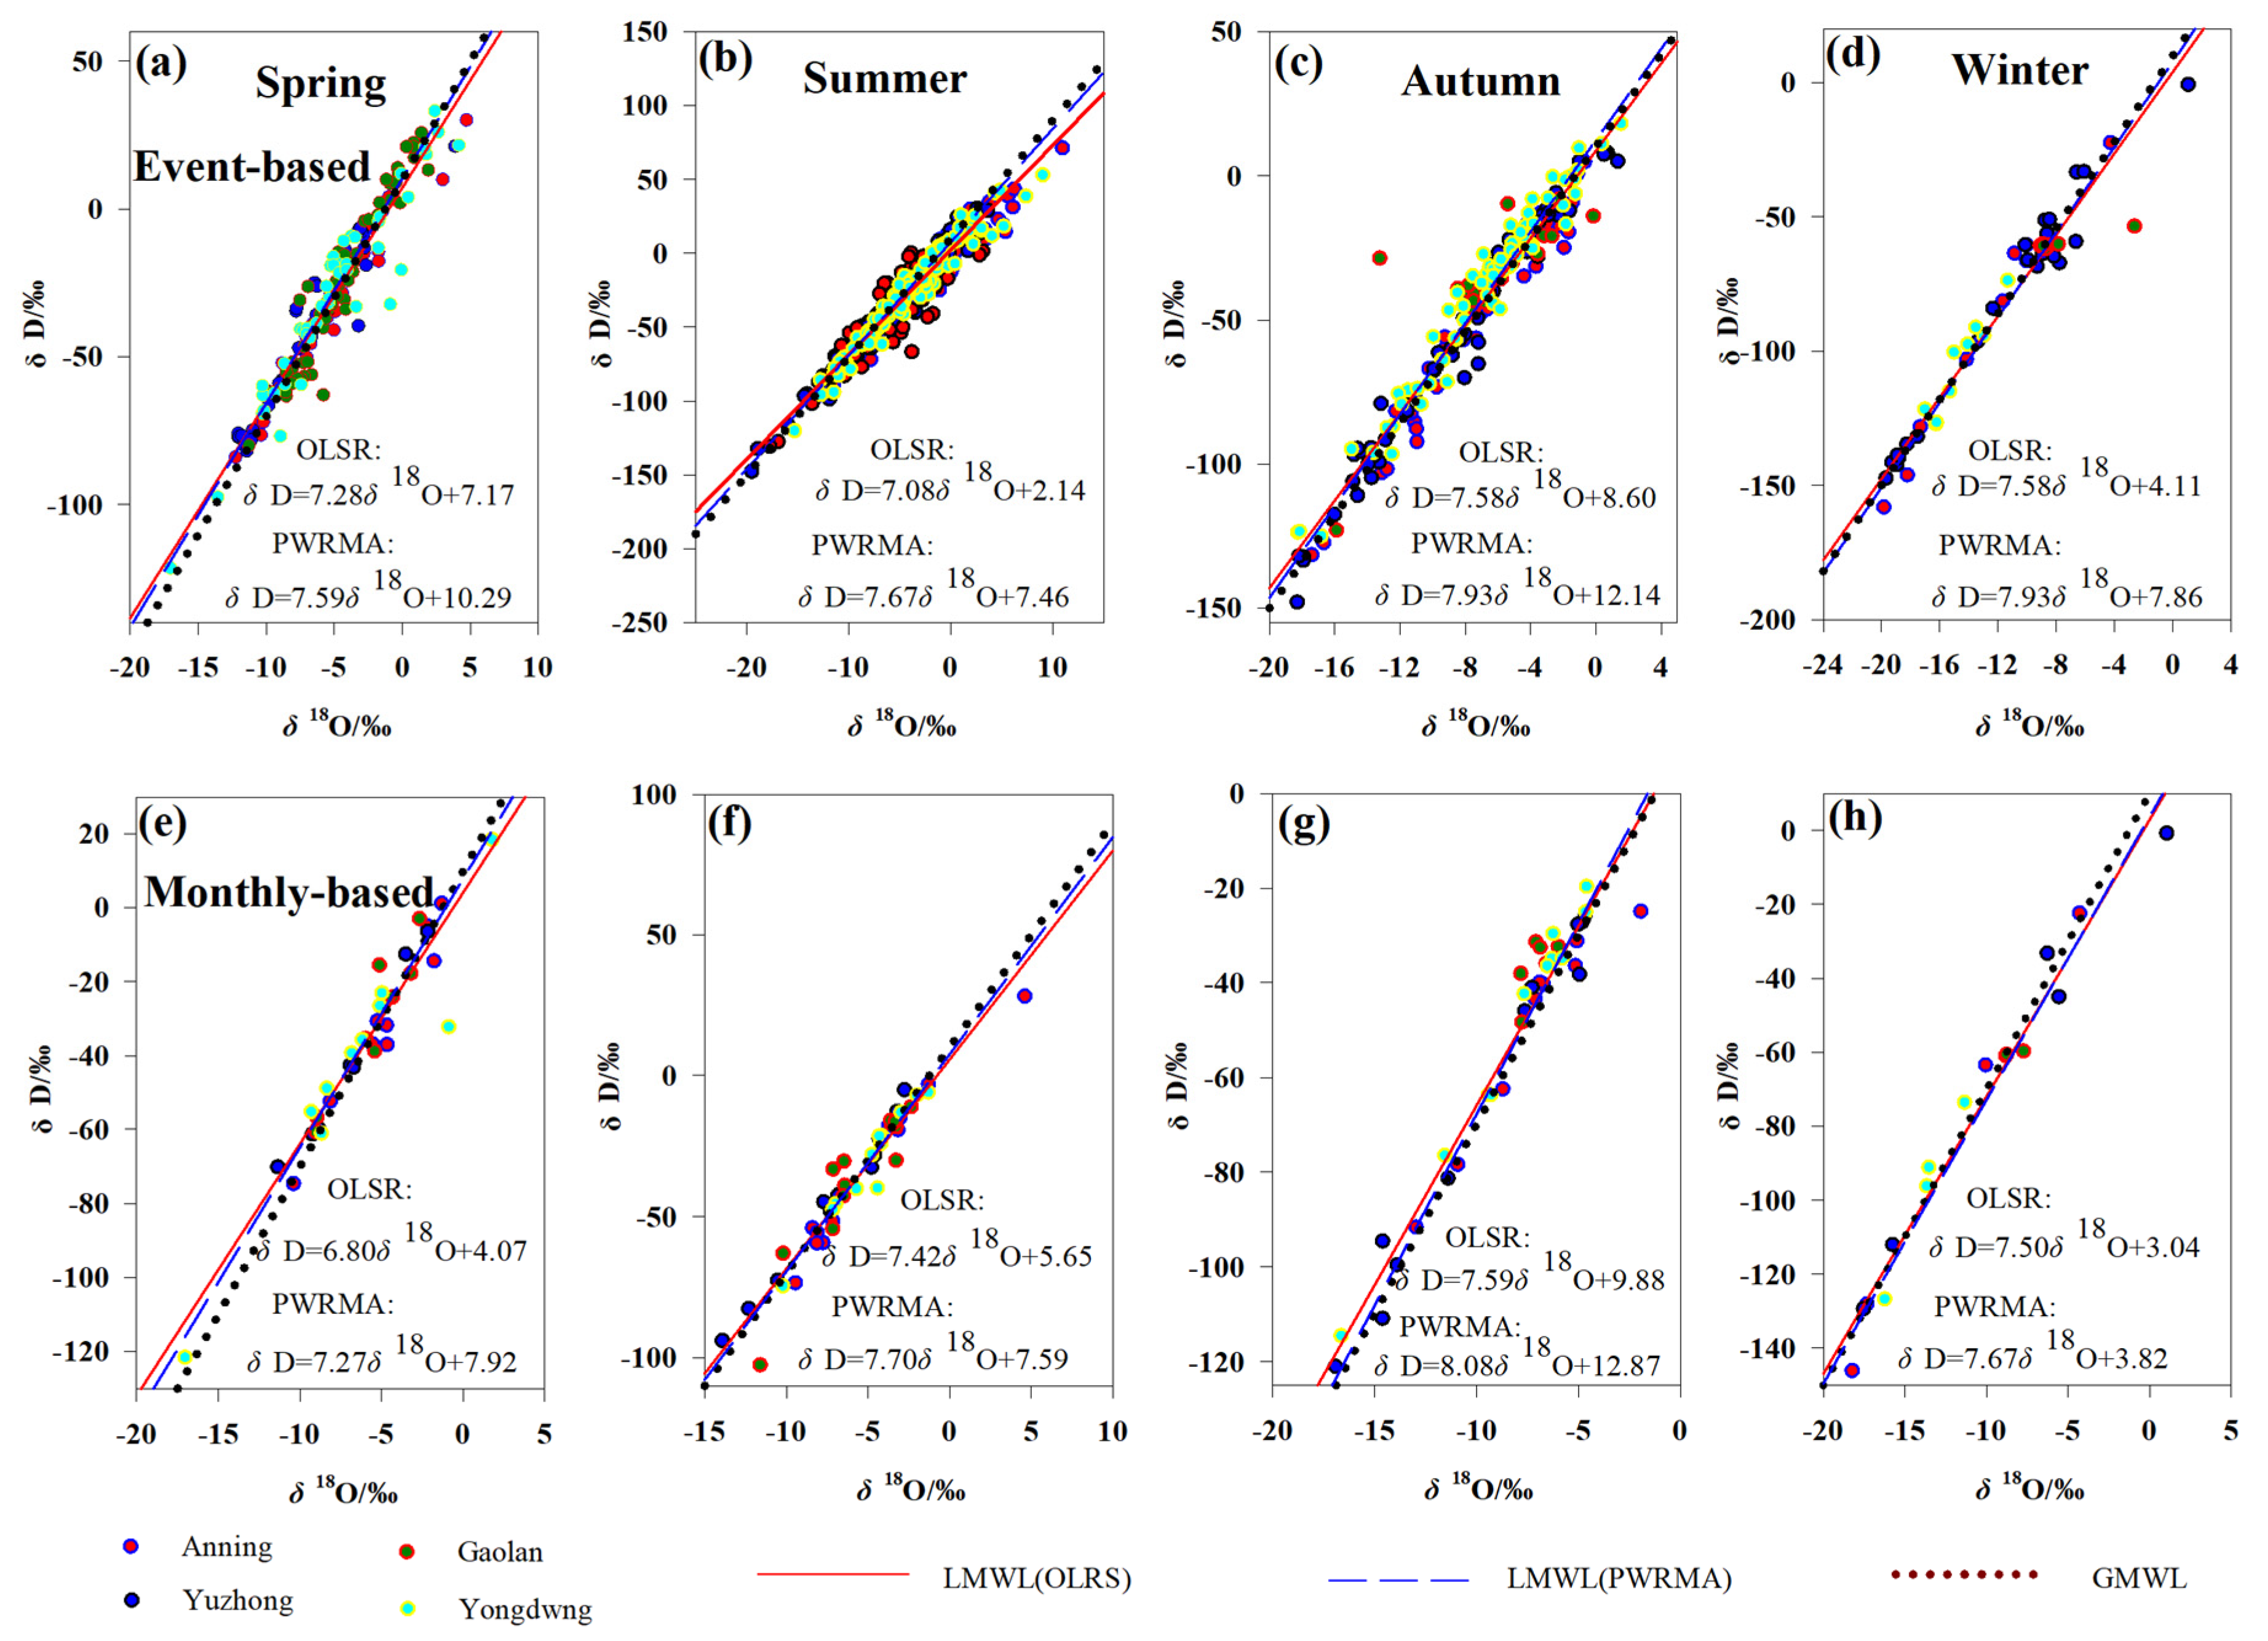
There is a seasonal difference in the LMWL between all the event-based data and the monthly precipitation weighted values from all sampling sites by using OLSR (Figure 4 and Tables S7–S9 in Supplementary Materials). Considering the slopes and intercepts of the event based LMWLs of each season, spring and summer show considerably lower slope values (7.28 ± 0.16 permille/permille and 7.11 ± 0.09 permille/permille, respectively) than the others. This reflects the sensitivity of the precipitated water stable isotopes to the secondary evaporation (not equilibrium fractionation) and kinetic fractionation of isotopes [21]. Precipitation in winter is mainly snowfall, which reduced the isotope fractionation in the process of precipitation caused by secondary evaporation [21]. Similar patterns can also be found for the slopes and the intercepts of LMWLs by using PWRMA as well as the monthly precipitation weighted values from all sampling sites.
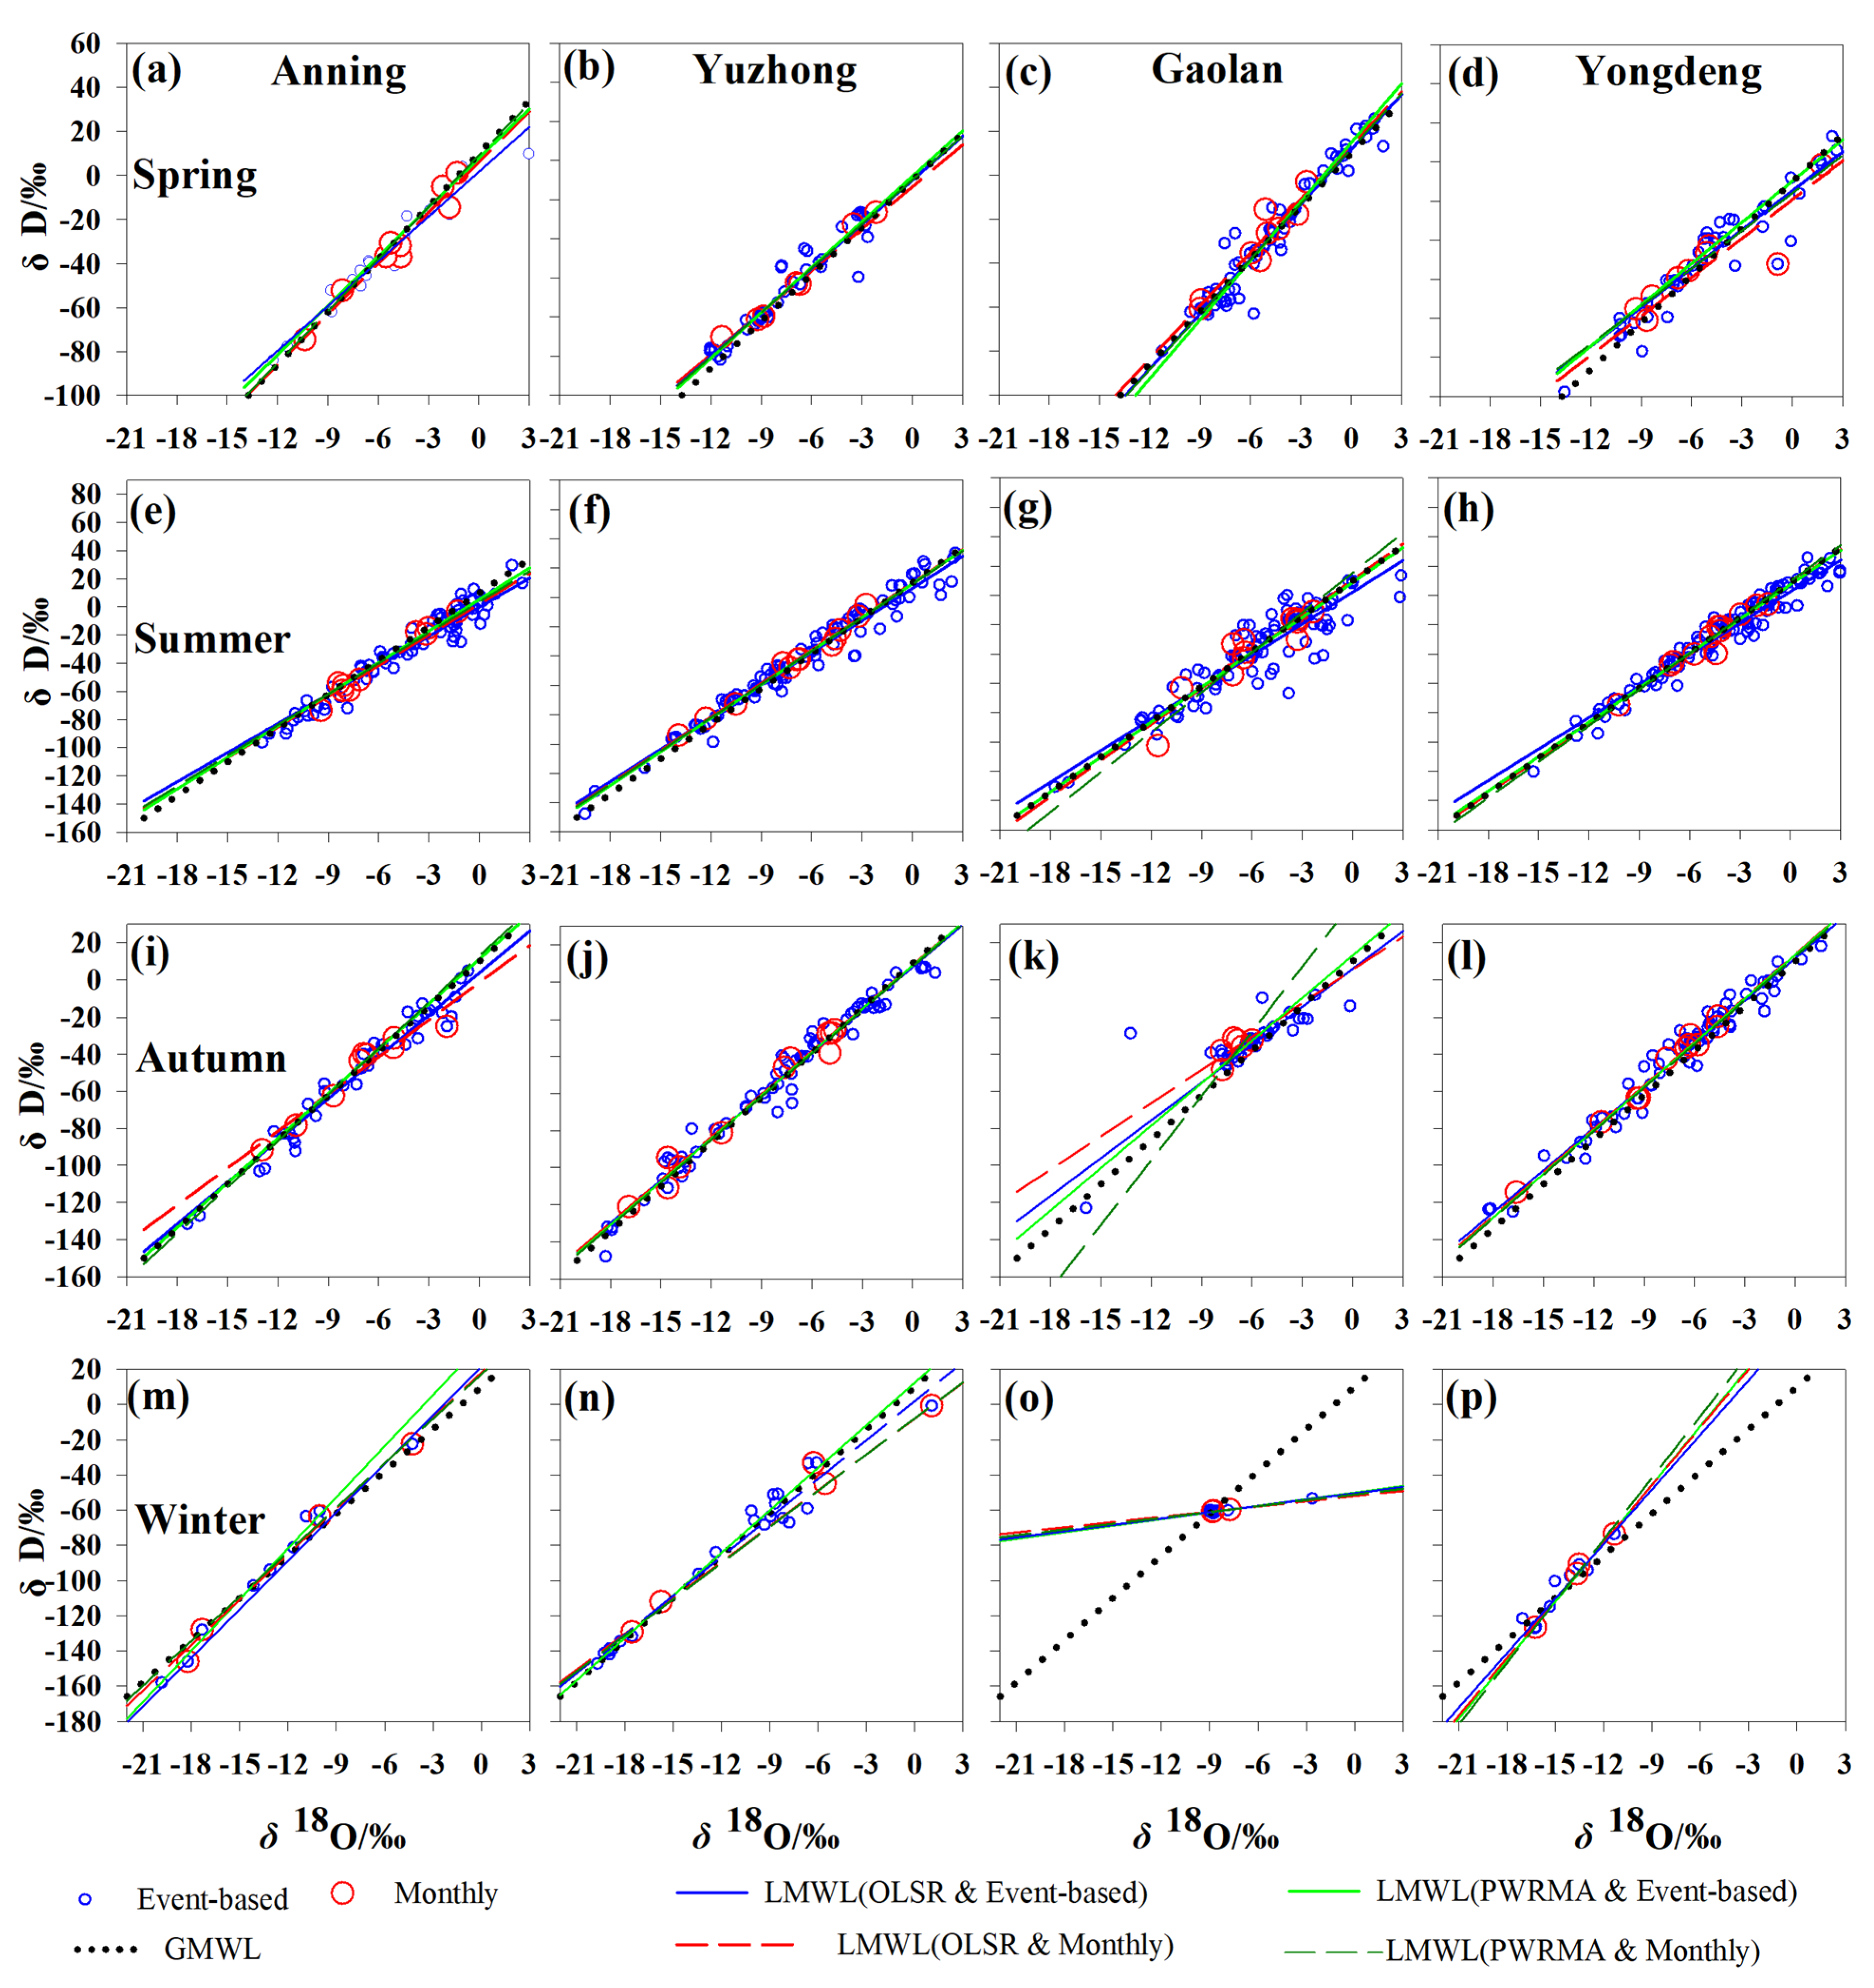
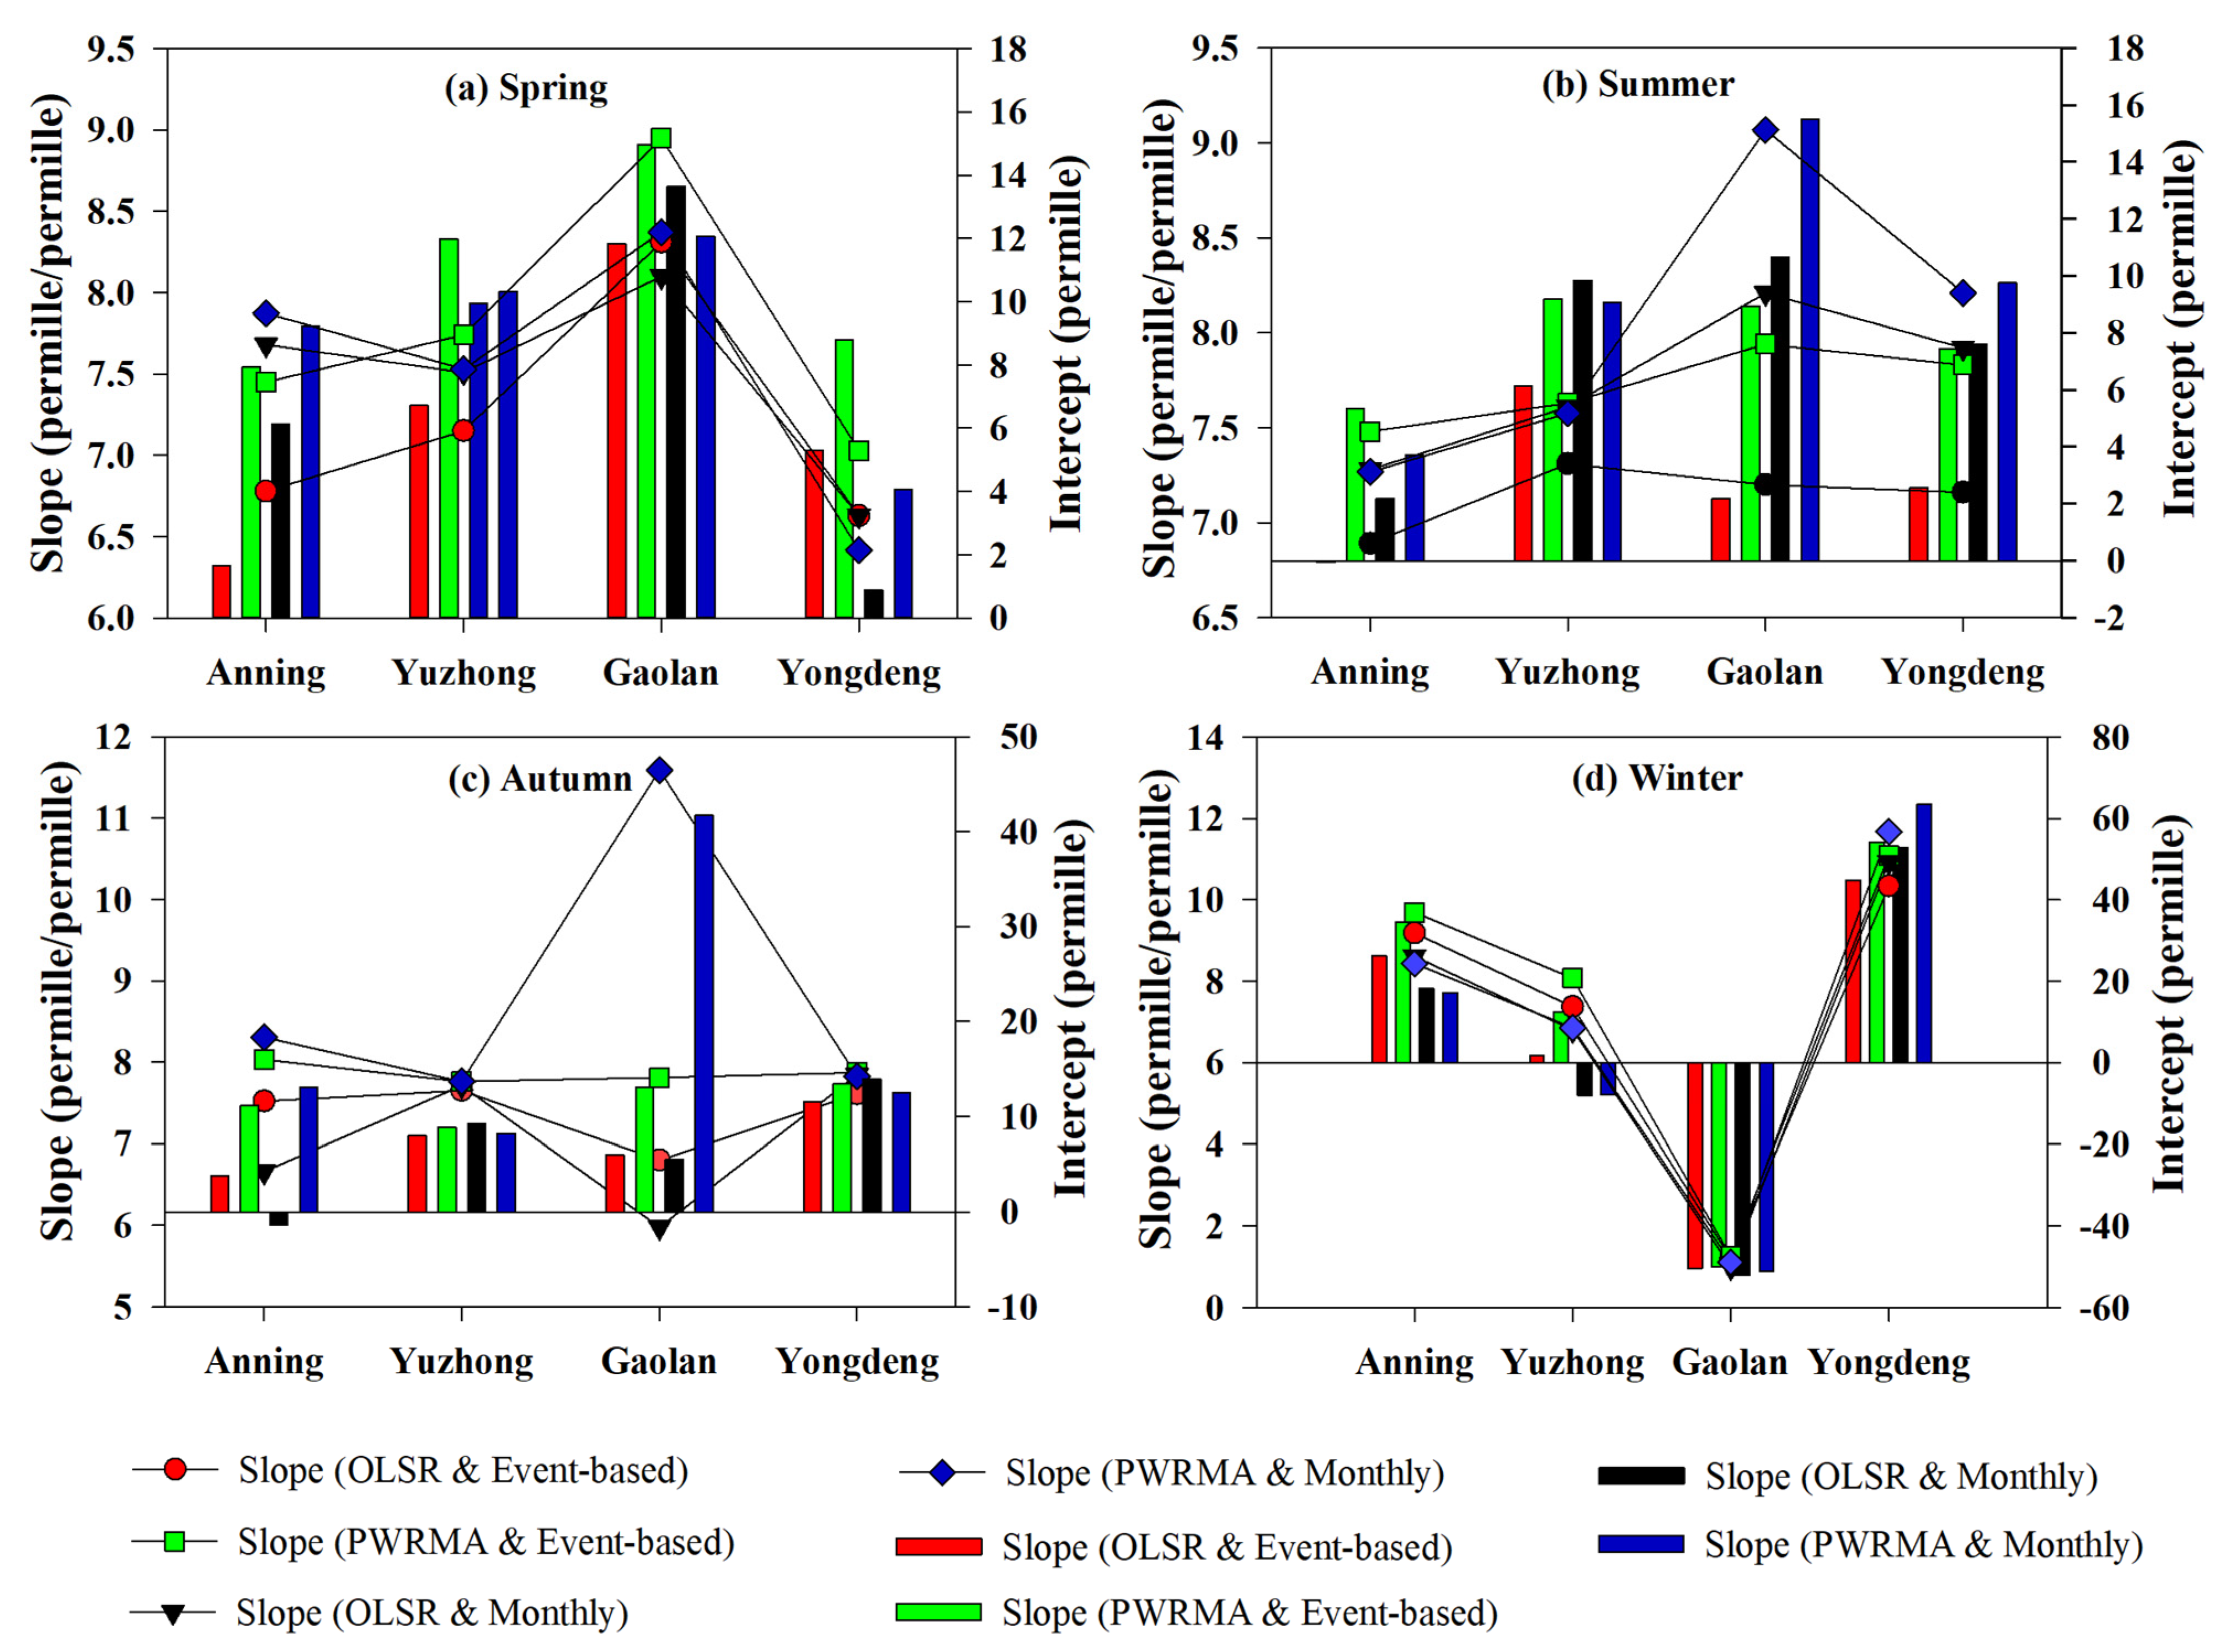
For spring, using the monthly precipitation weighted values from the four sampling sites results in an OLSR meteoric water line (Figure 5a–d and Figure 6a, Tables S7–S9 in Supplementary Materials and Tables S10–S12 in Supplementary Materials), where both the slope and intercept are larger than those determined using OLSR with all the event-based data at Anning and Yuzhong. For summer, the slope and intercept from monthly precipitation weighted values are all higher than those of the event-based data at the four sites (Figure 5e–h and Figure 6b, Tables S7–S9 in Supplementary Materials and Tables S10–S12 in Supplementary Materials). The slope and intercept in autumn and winter at Anning Yuzhong, Gaolan and Yongdeng fail to observe the above-mentioned patterns that exist in spring and summer (Figure 5i–p and Figure 6c,d, Tables S7–S9 in Supplementary Materials and Tables S10–S12 in Supplementary Materials). Compared with OLSR, PWRMA has similar patterns. Note that the LMWL slopes and intercepts using event-based data are closer to the OLSR and PWRMA-based LMWL slopes and intercepts using monthly data at Yuzhong and Yongdeng in autumn, as well as at Gaolan in winter.
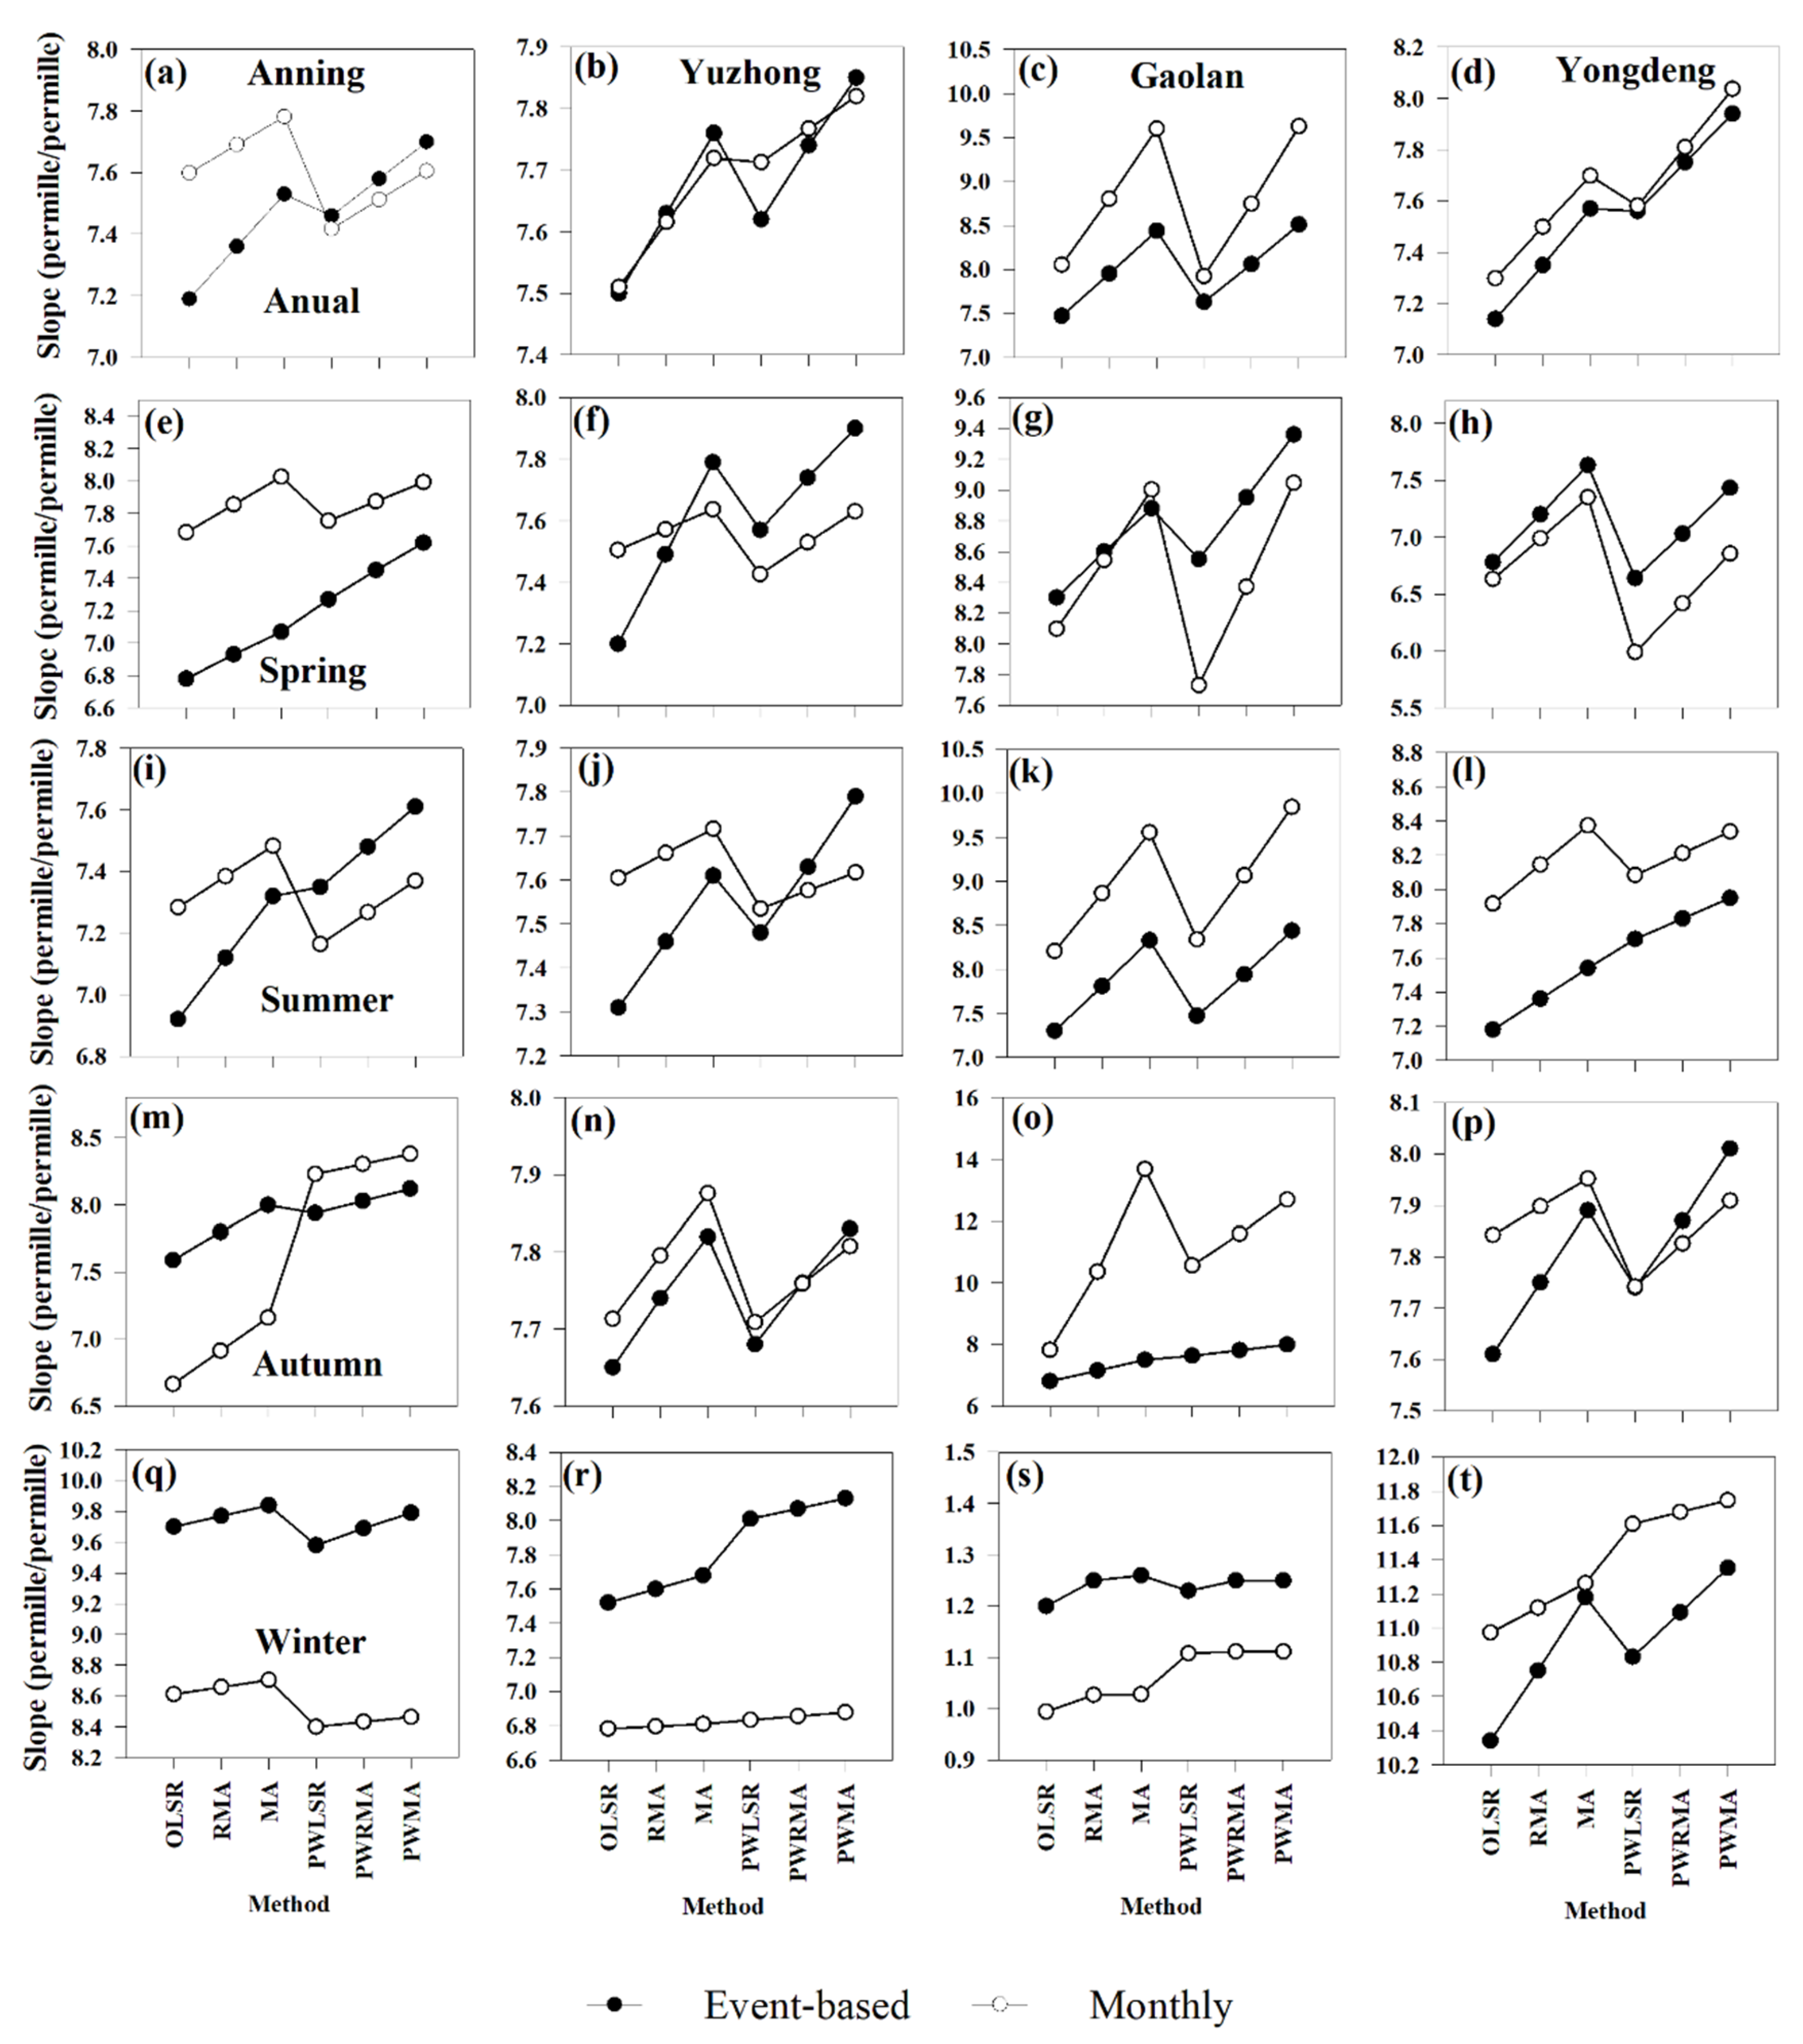
In order to further understand the gap between event-based and monthly data, the LMWLs are calculated using OLSR, RMA, MA, PWLSR, PWRMA and PWMA (Figure 7, Tables S7–S9 in Supplementary Materials and Tables S10–S12 in Supplementary Materials). Comparing the different alternative approaches (Figure 7a–d), the annual OLSR slopes and intercepts with all the event-based data at the four sites are by far the lowest from April 2011 to October 2014. The PWLSR slopes and intercepts at the four sites are higher than the OLSR ones. The PWRMA slopes and intercepts at the four sites are higher than the OLSR ones. The PWRMA slopes and intercepts at the four sites are higher than the RMA ones. The PWMA slopes and intercepts at the four sites are also higher than the MA ones. For instance, OLSR, RMA, MA, PWLSR, PWRMA and PWMA in the slope at Anning are 7.19 ± 0.11 permille/permille, 7.36 ± 0.11 permille/permille, 7.53 ± 0.12 permille/permille, 7.46 ± 0.10 permille/permille, 7.58 ± 0.10 permille/permille and 7.70 ± 0.10 permille/permille, respectively. For the four seasons, compared with the unweighted methods (OLSR, RMA and MA) using event-based data at the four sites, the OLSR-based LMWL slopes and intercepts are the lowest while the MA-based ones are the highest (Figure 7e–t). Similar patterns can also be found for the slopes and intercepts of LMWLs with the weighted methods using event-based samples (Figure 7e–t). The average values of root mean sum of squared error (rmSSEav) with the unweighted and weighted methods are close to 1, especially in the PWLSR method where a value of rmSSEav is by far the lowest, which indicates this method is the most stable method for calculating LMWL. The results in this study are generally consistent with the previous research of Crawford et al. [17], denoting a close fit. The change rules of the unweighted and weighted slopes using event-based data are similar to the unweighted and weighted LMWL slopes using monthly data at four sites. Compared with the unweighted methods, the weighted LMWL slopes using event-based and monthly data are close in most cases.
3.2. Meteorological Factors and LMWL
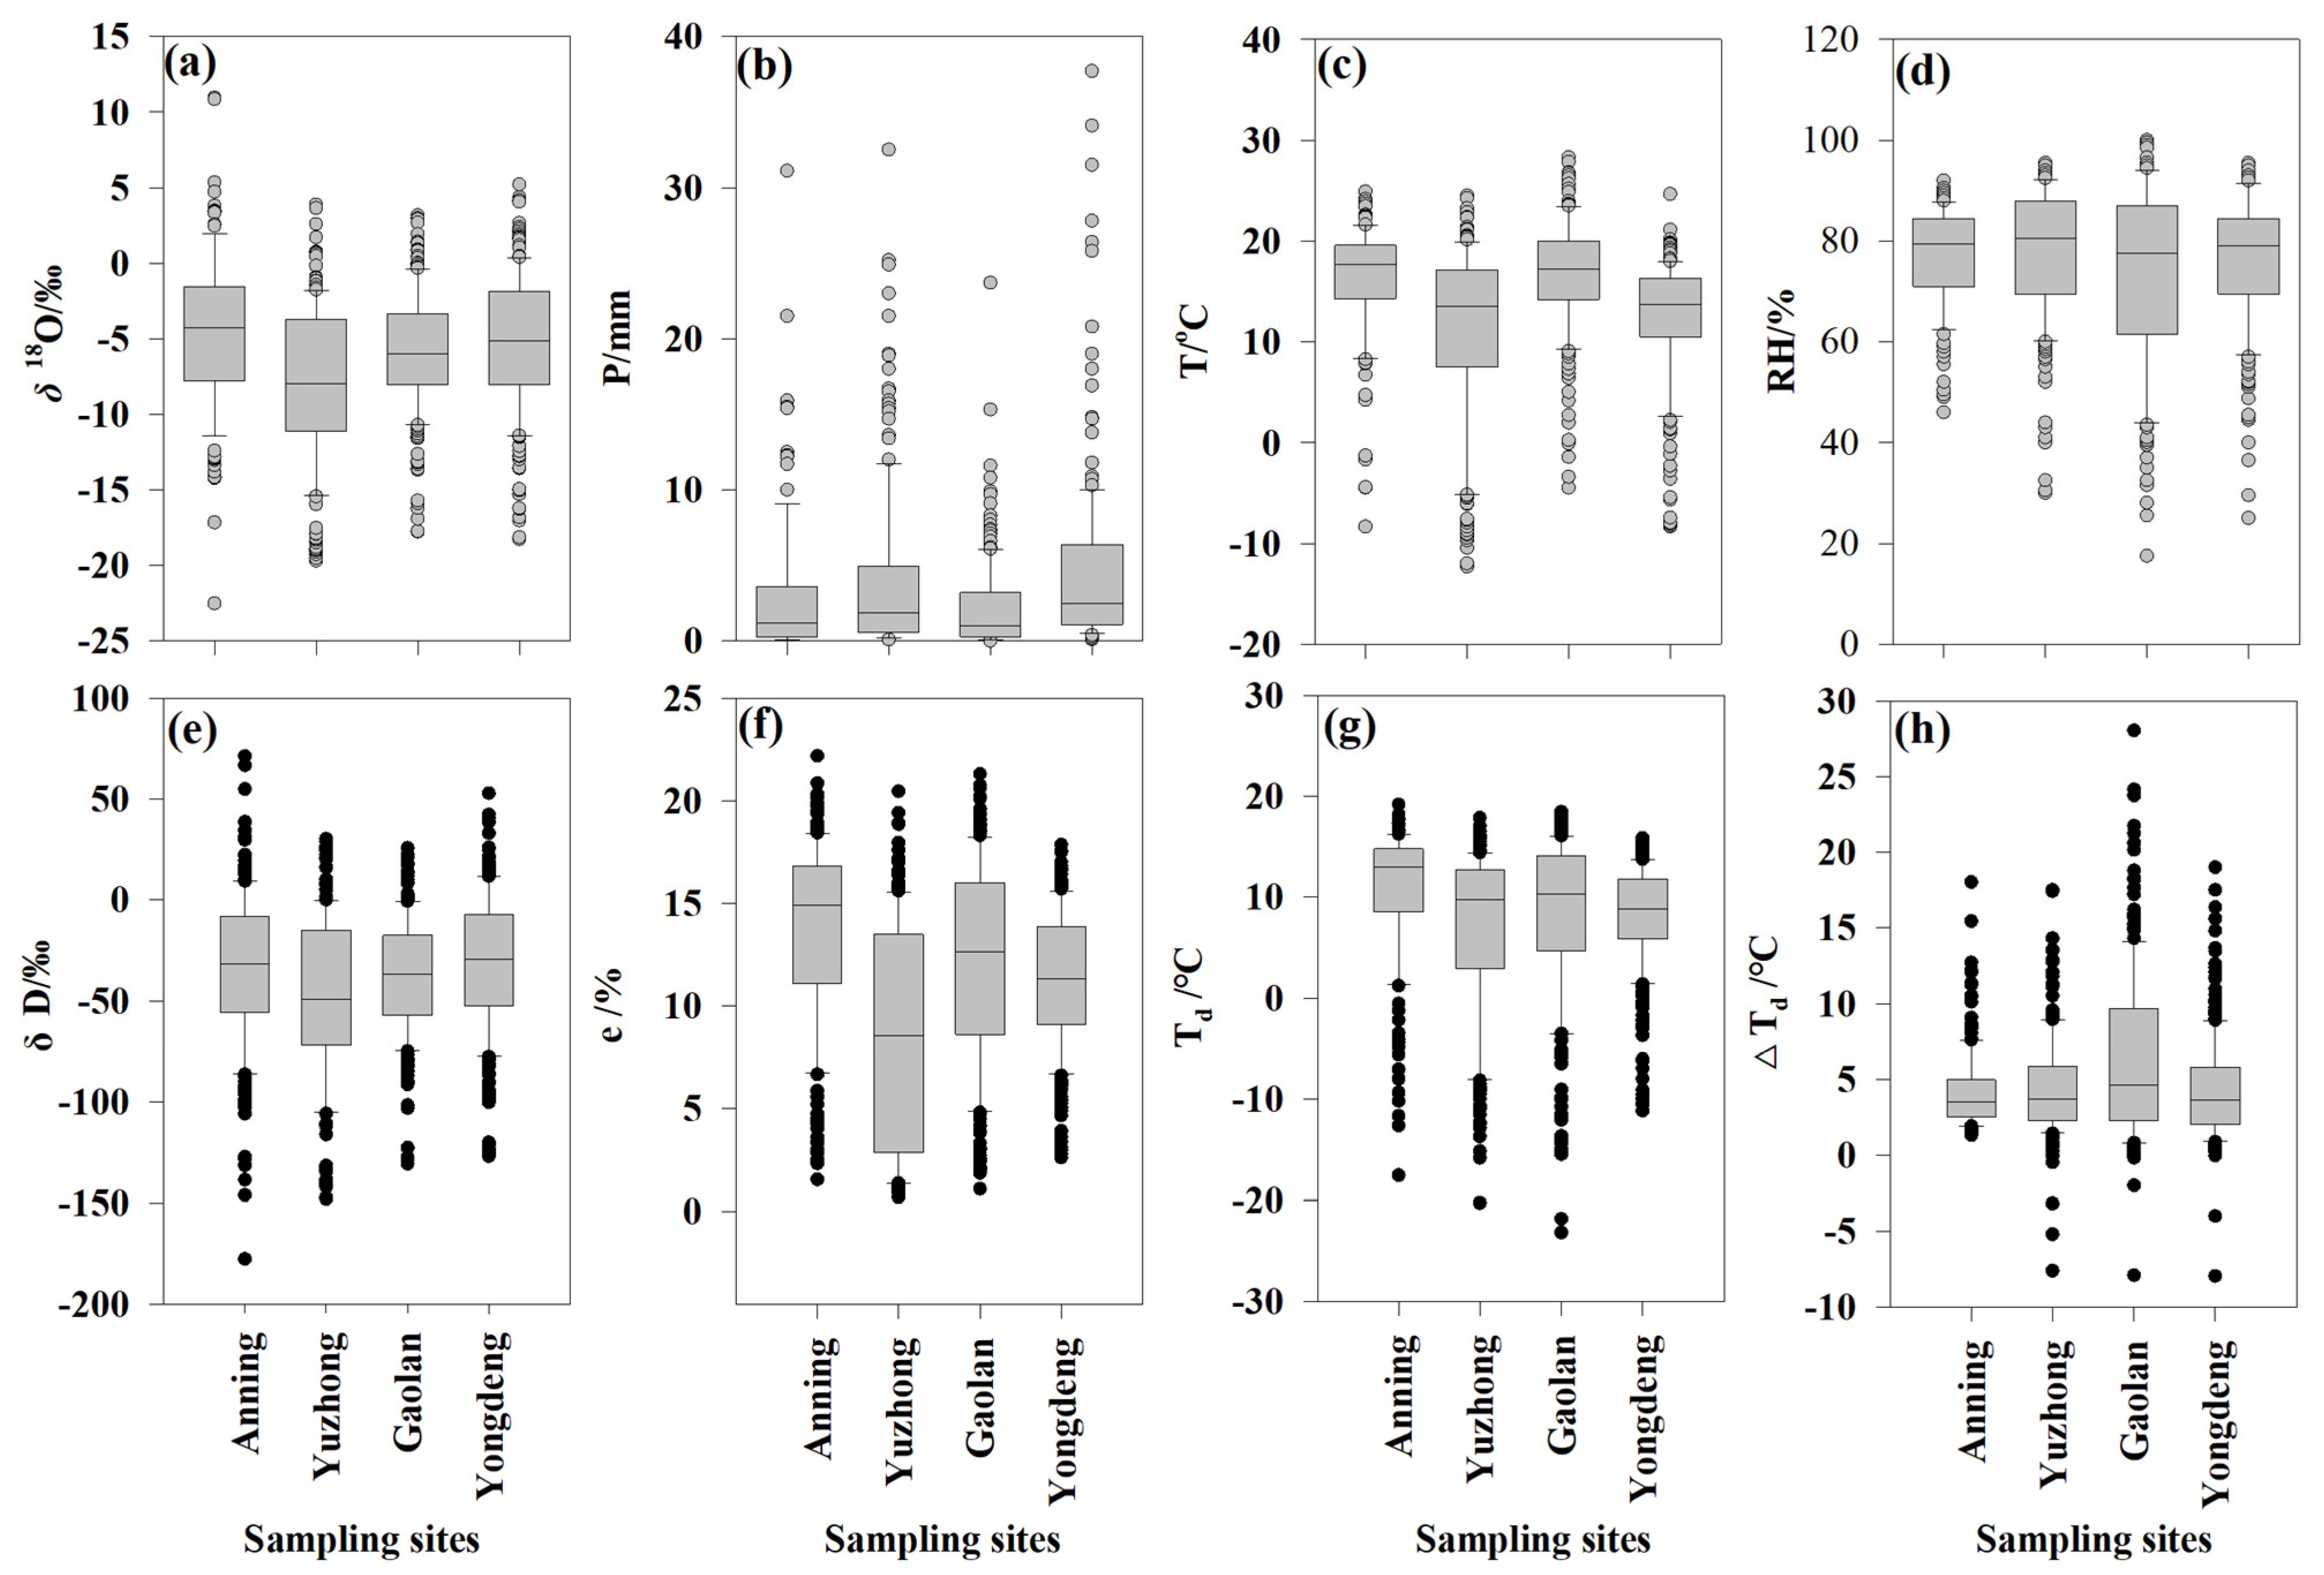
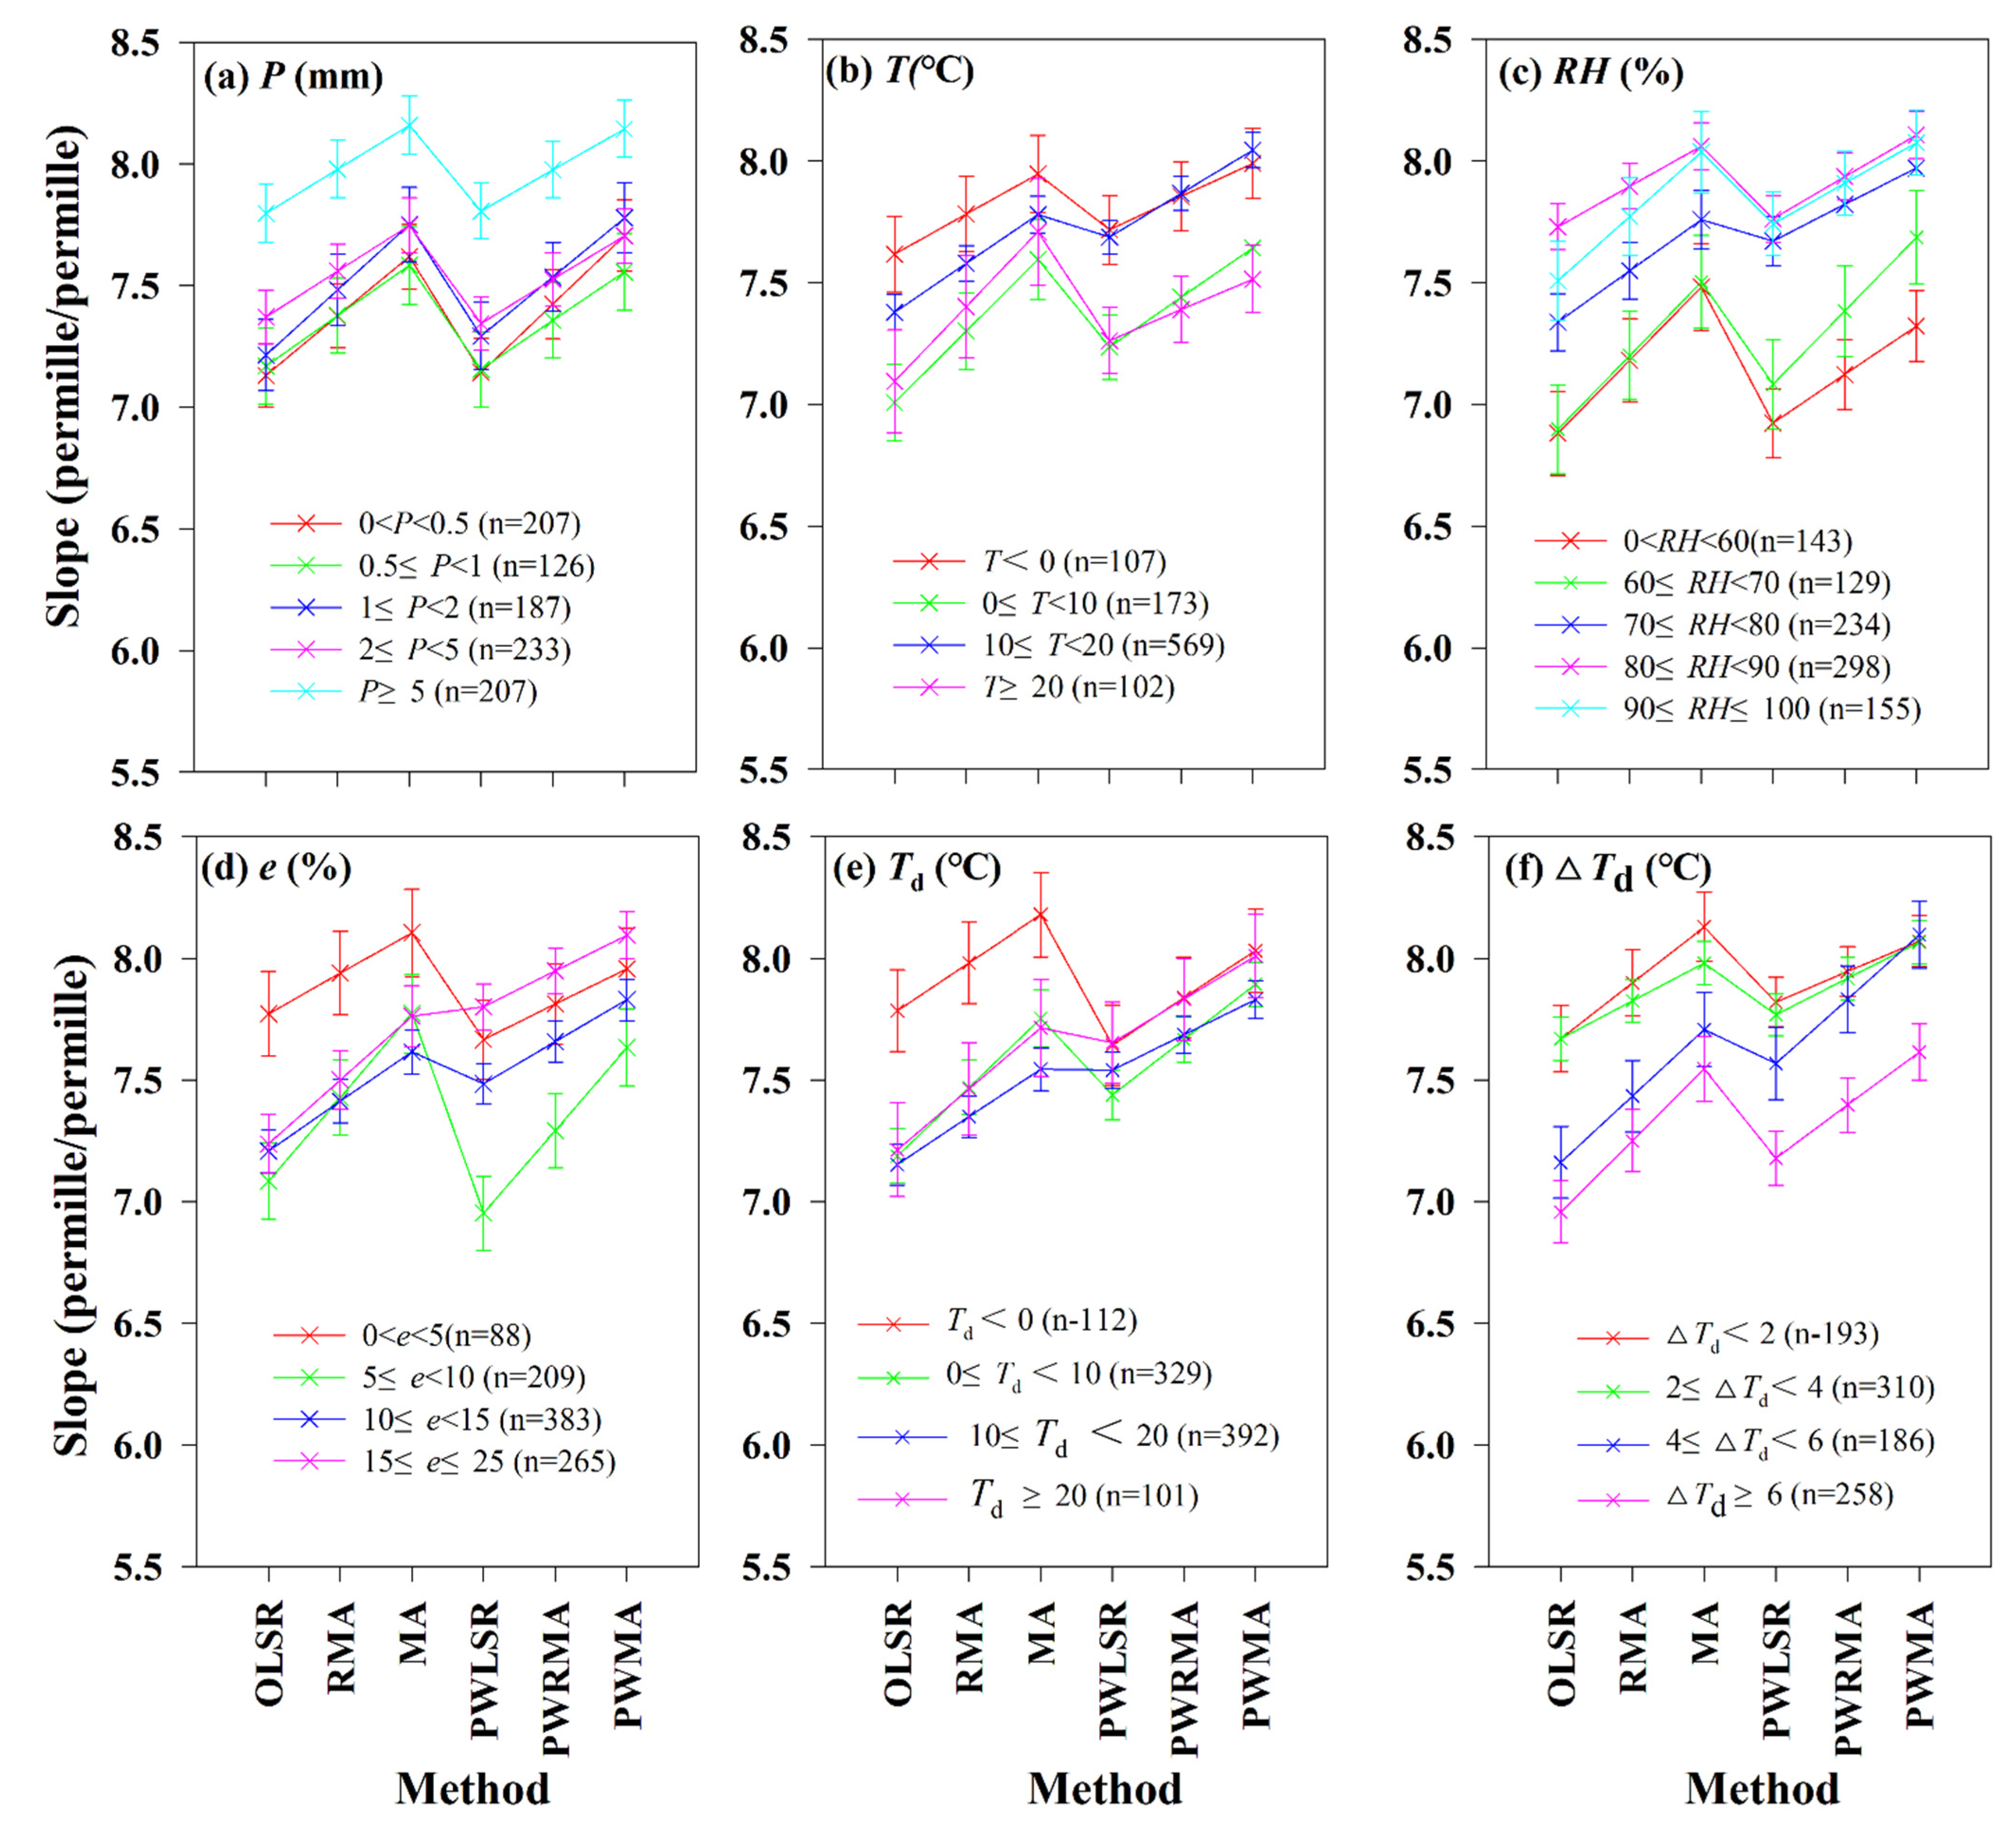
Figure 8 shows the variations of the stable isotope (δD and δ18O) composition of local precipitation and meteorological parameters (precipitation amount, air temperature, relative humidity, water vapor pressure, dew point temperature and depression of dew point) for the four locations in the study region. The variations in LMWLs for the four sites derived using the six regressions are clearly related to precipitation amount (P), air temperature (T) and relative humidity (RH), water vapor pressure (e), dew point temperature (Td) and depression of the dew point (ΔTd). The six LMWL regressions are calculated corresponding to the different meteorological parameter ranges (Figure 9 and Tables S13–S18 in Supplementary Materials). Comparing the different precipitation events from Figure 9a, the lower precipitation amounts are, the lower the LMWL slopes, and conversely. In Figure 9b, the LMWL slopes range from 7 to 7.5 when air temperature is more than 20 °C for events, depending on the regression method, and the slopes for samples are over 7.5 under the condition of less than 0 °C. The variations of LMWL intercept are generally similar to those of slopes (Tables S13–S18 in Supplementary Materials). There is a strong linear correlation between each meteorological parameter variable and the slope of the LMWL for the six methods.
Generally speaking, under the conditions of higher precipitation amount and relative humidity as well as lower air temperature, water vapor pressure, dew point temperature and depression of the dew point, higher slopes and intercepts are seen using the different regression techniques. this reflects that sub-cloud secondary evaporation has a significant effect on isotopes accompanied by low precipitation amounts, high temperature, low relative humidity, high water vapor pressure, high dew point temperature and high depression of the dew point.
3.3. LMWL Sensitivity for Heavy and Small Events
Previous studies show that heavy precipitation events influence the LMWL in proportion to their hydrological importance using the weighted method [15,17]. Comparing the different data from Table 1, the influence of heavy precipitation over 20 mm on LMWL slopes is relatively limited for any method, and that for the unweighted regressions the difference in the slope from removing precipitation over 10 mm was close to zero in this region. The precipitation extremes do exist, but the frequency is actually very low, especially for heavy precipitation events, where they are infrequent.
Table 2 shows that compared with heavy precipitation, the variations of LMWLs are much larger when removing small amount rain events. Larger LMWL slopes can be found when removing small precipitation (0.5 mm, 1 mm or 5 mm). The rain events with amounts <5 mm play a dominant role in this study. The differences in the slope using the unweighted regressions are higher than those using the precipitation-weighted regression, indicating that the unweighted regression is more sensitive to the small precipitation events. For precipitation-weighted regressions the influence of these small rainfall events on LMWL slopes is already minimized. Compared with the unweighted regressions, the weighted regressions are effective to remove any bias due to sample amount. For precipitation >5 mm, little difference in the LMWL slopes between the different regression techniques is seen.
3.4. Comparison between GNIP and Recent Observations
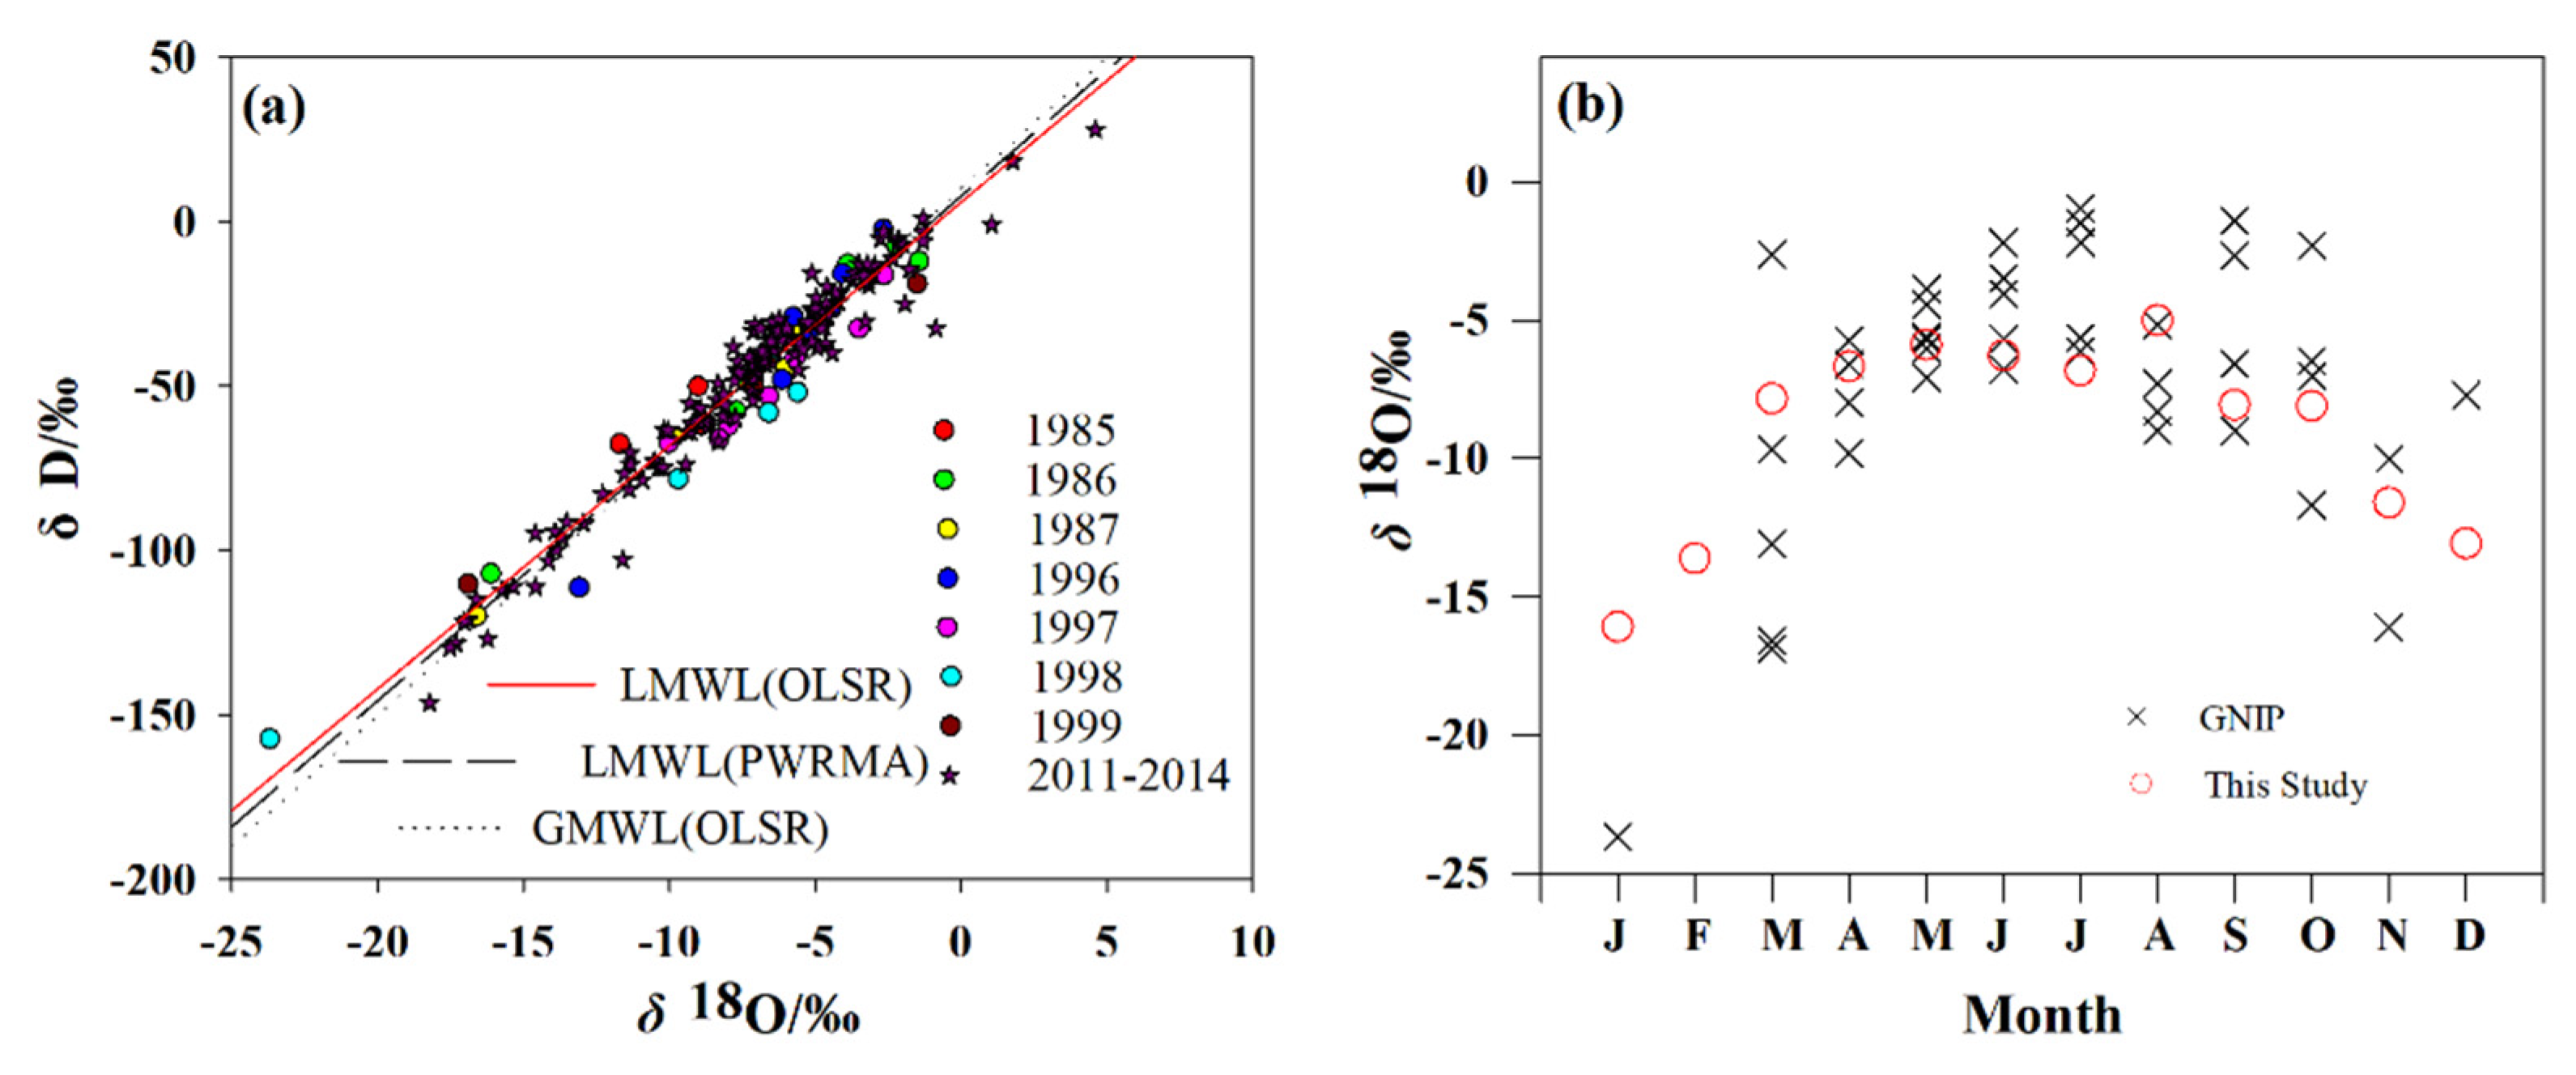
In Figure 10, the δ18O presents a clear seasonal pattern in the GNIP Lanzhou data (1985–1987 and 1996–1999) and the current enhanced network, and so do the previous studies [21,22,23,24]. Due to the GNIP data being from monthly samples, the event-based data from April 2011 to October 2014 at the four sampling stations are precipitation-weighted to monthly series. The monthly data from the current enhanced network together with the GNIP data are used to create a LMWL for each year, which show that the OLSR algorithm has a lower slope and intercept, while the LMWL calculated by PWRMA is closer to GWML. At the same time, OLSR and PWLSR have the smallest rmSSEav value among six algorithms (Figure 10 and Table S19 in Supplementary Materials).
Due to the GNIP data for all the years (1985–1987 and 1996–1999) with >4 months missing data per year, current observations from the four sites are used to discuss the inter-annual variability of LMWLs (Table 2). In 2011, the missing data exist in January, February and March; in 2014 there is also information missing in October, November and December. The missing months correspond to the periods with no precipitation or limited precipitation, which may affect the determination of LMWLs. Hence, we draw a comparison based on 2012 and 2013 data; the higher precipitation amount and lower air temperature give rise to higher slopes and intercepts using the different regression methods.
Although stable isotopes in precipitation are usually related to the temperature or amount effect [3], we observe no significant correlations between LMWL slopes derived by the six regression methods and temperature or precipitation amount at the Anning site in summer from April 2011 to October 2014 (Table 3). The summer result is out of accord with the annual scale, which can be seen at the other three sits (Tables S20–S22 in Supplementary Material). This reflects that other mechanisms make a positive contribution to the variability of LMWLs, including sub-cloud evaporation and recycled moisture attributed to the increasing urban green coverage in the past decades, especially in summer. It’s worth noting that the secondary evaporation is apparent in the summer monsoon period in Lanzhou, and that the potential contribution of recycled moisture has fluctuated during past decades [29,30].
4. Conclusions
In this study, the slope and intercept of the meteoric water line in Lanzhou are smaller than those of global meteoric water lines. The slopes and the intercepts of the amount-weighted monthly data are higher than those of the event-based data. Considering the slopes and intercepts of the event-based regressions for each season, spring and summer show considerably lower slope values than the others. The slope and intercept of LMWL obtained by three non-weighted methods (OLSR, RMA and MA) are compared. The slope calculated by the OLSR method is the smallest at the four sampling points, while the slope calculated by the MA method is the largest. The results are similar to the corresponding precipitation-weighted algorithms PWLSR, PWRMA and PWMA. Meanwhile, among the six algorithms, the rmSSEav of PWLSR reaches the minimum value, indicating that the calculation results of PWLSR are relatively stable.
There is a strong linear relationship between each meteorological parameter variable and the slope of the LMWL for the six methods. Generally, under the conditions of higher precipitation amounts and relative humidity as well as lower air temperature, water vapor pressure, dew point temperature and depression of the dew point, higher slopes and intercepts are seen using the different regression techniques. Compared with heavy precipitation, the variations of LMWLs are much larger when removing small precipitation. Higher precipitation amount and lower air temperature give rise to higher slopes and intercepts using the different regression techniques on an annual scale. The results show there is no significant correlation between LMWL slopes derived by the six regression techniques and temperature or precipitation amount at the Anning site in summer.
The monthly data from the current enhanced network together with the GNIP data are used to create a LMWL for each year, which shows that OLSR and PWLSR have smaller rmSSEav values. Affected by sub-cloud evaporation, the slope of the atmospheric precipitation line is reduced. At the same time, the sources of water vapor in different regions are different, and the meteorological conditions in the transport process and the precipitation process are also different. For a specific area, the meteoric water line can provide a background reference value for the study of the water cycle process. Therefore, compared using GNIP and recent observations, sub-cloud evaporation and recycled moisture may make a positive contribution to variability of LMWLs due to the increasing urban green coverage in the past decades, especially in summer.
Supplementary Materials
The following are available online at https://www.mdpi.com/article/10.3390/w13172380/s1, Table S1: LMWL slope of the δ2H–δ18O linear relationship (in permille/permille) using multiple approaches for each sampling site during 2011–2014, Table S2: LMWL intercept of the δ2H–δ18O linear relationship (in permille) using multiple approaches for each sampling site during 2011–2014, Table S3: Values of rmSSEav using multiple approaches for each sampling site during 2011–2014, Table S4: LMWL slope of the δ2H–δ18O linear relationship (in permille/permille) using multiple approaches for each sampling site based on monthly samples during 2011–2014, Table S5: LMWL intercept of the δ2H–δ18O linear relationship (in permille) using multiple approaches for each sampling site based on monthly samples during 2011–2014, Table S6: Values of rmSSEav using multiple approaches for each sampling site based on monthly samples during 2011–2014, Table S7: Meteoric water line slopes of the δ2H–δ18O linear relationship (in permille/permille) for different seasons and sub regions using multiple approaches based on event-based samples during 2011–2014, Table S8: Meteoric water line intercepts of the δ2H–δ18O linear relationship (in permille) for different seasons and sub regions using multiple approaches based on event-based samples during 2011–2014, Table S9: Values of rmSSEav for different seasons and sub regions using multiple approaches based on event-based samples during 2011–2014, Table S10: Meteoric water line slopes of the δ2H–δ18O linear relationship (in permille/permille) for different seasons and sub regions using multiple approaches based on monthly samples during 2011–2014, Table S11: Meteoric water line intercepts the δ2H–δ18O linear relationship (in permille) for different seasons and sub regions using multiple approaches based on monthly samples during 2011–2014, Table S12: Values of rmSSEav for different seasons and sub regions using multiple approaches based on monthly samples during 2011–2014, Table S13: LMWL slope of the δ2H–δ18O linear relationship (in permille/permille) (a + σa) under the precipitation amount (P in mm) condition using six regressions based on event-based samples in the Lanzhou city from 2011 to 2014, Table S14: LMWL slope of the δ2H–δ18O linear relationship (in permille/permille) (a + σa) under the air temperature (T in °C) condition using six regressions based on event-based samples in the Lanzhou city from 2011 to 2014, Table S15: LMWL slope of the δ2H–δ18O linear relationship (in permille/permille) (a + σa) under the relative humidity (RH in %) condition using six regressions based on event-based samples in the Lanzhou city from 2011 to 2014, Table S16: LMWL slope of the δ2H–δ18O linear relationship (in permille/permille) (a + σa) under the water vapor pressure (e in %) condition using six regressions based on event-based samples in the Lanzhou city from 2011 to 2014, Table S17: LMWL slope of the δ2H–δ18O linear relationship (in permille/permille) (a + σa) under the dew point temperature (Td in ℃) condition using six regressions based on event-based samples in the Lanzhou city from 2011 to 2014, Table S18: LMWL slope of the δ2H–δ18O linear relationship (in permille/permille) (a + σa) under the depression of the dew point (ΔTd in ℃) condition using six regressions based on event-based samples in the Lanzhou city from 2011 to 2014, Table S19: Meteoric water line of monthly-weighted samples for four seasons in Lanzhou City during 2011–2014. The monthly isotopic data during 1985–1987 and 1996–1999 was provided by IAEA/WMO (2017), and the event-based data during 2011–2014 were precipitation-weighted to monthly series, Table S20: Inter-annual variation of slope of the δ2H–δ18O linear relationship (in permille/permille) using the six regression methods, precipitation amount (P in mm) and air temperature (T in °C) based on event-based samples at Yuzhong in summer from 2011 to 2014, Table S21: Inter-annual variation of slope of the δ2H–δ18O linear relationship (in permille/permille) using the six regression methods, precipitation amount (P in mm) and air temperature (T in °C) based on event-based samples at Gaolan in summer from 2011 to 2014, Table S22: Inter-annual variation of slope of the δ2H–δ18O linear relationship (in permille/permille) using the six regression methods, precipitation amount (P in mm) and air temperature (T in °C) based on event-based samples at Yongdeng in summer from 2011 to 2014.
Author Contributions
Conceptualization, F.C.; software, F.C. and X.W.; validation, X.W.; formal analysis, F.C.; investigation, F.C.; methodology, F.C., S.W. and M.Z; resources, M.Z., X.Z. and J.C.; data curation, F.C.; writing—original draft preparation, F.C., S.W., X.W., A.A.A.; writing—review and editing, F.C., S.W. and X.W.; supervision, F.C.; funding acquisition, S.W. and M.Z. All authors have read and agreed to the published version of the manuscript.
Funding
The research is supported by the National Natural Science Foundation of China (No. 42161007, 42071047 and 41771035), the Foundation for Distinguished Young Scholars of Gansu Province (20JR10RA112) and the Scientific Research Program of Higher Education Institutions of Gansu Province (No. 2021B-081 and 2018C-02).
Institutional Review Board Statement
Not applicable.
Informed Consent Statement
Not applicable.
Data Availability Statement
Data sharing not applicable.
Conflicts of Interest
The authors declare no conflict of interest. The work described here has not been submitted.
References
- Chiang, J.C.H.; Herman, M.J.; Yoshimura, K.; Fung, I.Y. Enriched East Asian oxygen isotope of precipitation indicates reduced summer seasonality in regional climate and westerlies. Proc. Natl. Acad. Sci. USA 2020, 117, 14745–14750. [Google Scholar] [CrossRef]
- Putman, A.L.; Bowen, G.J.; Strong, C. Local and Regional Modes of Hydroclimatic Change Expressed in Modern Multidecadal Precipitation Oxygen Isotope Trends. Geophys. Res. Lett. 2021, 48, e2020GL092006. [Google Scholar] [CrossRef]
- Zhang, M.; Wang, S. A review of precipitation isotope studies in China: Basic pattern and hydrological process. J. Geogr. Sci. 2016, 26, 921–938. [Google Scholar] [CrossRef] [Green Version]
- Craig, H. Isotopic Variations in Meteoric Waters. Science 1961, 133, 1702–1703. [Google Scholar] [CrossRef]
- Merlivat, L.; Jouzel, J. Global climatic interpretation of the deuterium-oxygen 18 relationship for precipitation. J. Geophys. Res. Space Phys. 1979, 84, 5029–5033. [Google Scholar] [CrossRef]
- Bedaso, Z.; Wu, S.-Y. Linking precipitation and groundwater isotopes in Ethiopia—Implications from local meteoric water lines and isoscapes. J. Hydrol. 2021, 596, 126074. [Google Scholar] [CrossRef]
- Smith, D.F.; Saelens, E.; Leslie, D.L.; Carey, A.E. Local meteoric water lines describe extratropical precipitation. Hydrol. Process. 2021, 35. [Google Scholar] [CrossRef]
- Putman, A.L.; Fiorella, R.P.; Bowen, G.J.; Cai, Z. A Global Perspective on Local Meteoric Water Lines: Meta-analytic Insight Into Fundamental Controls and Practical Constraints. Water Resour. Res. 2019, 55, 6896–6910. [Google Scholar] [CrossRef]
- Peng, H.; Mayer, B.; Harris, S.; Krouse, H.R. The influence of below-cloud secondary effects on the stable isotope composition of hydrogen and oxygen in precipitation at Calgary, Alberta, Canada. Tellus B Chem. Phys. Meteorol. 2007, 59, 698–704. [Google Scholar] [CrossRef]
- Wang, S.; Zhang, M.; Che, Y.; Zhu, X.; Liu, X. Influence of Below-Cloud Evaporation on Deuterium Excess in Precipitation of Arid Central Asia and Its Meteorological Controls. J. Hydrometeorol. 2016, 17, 1973–1984. [Google Scholar] [CrossRef]
- Wang, S.; Jiao, R.; Zhang, M.; Crawford, J.; Hughes, C.E.; Chen, F. Changes in below-cloud evaporation affect precipitation isotopes during five decades of warming across China. J. Geophys. Res. Atmos. 2021, 126, e2020JD033075. [Google Scholar] [CrossRef]
- IAEA. Statistical Treatment of Data on Environmental Isotopes in Precipitation; IAEA: Vienna, Austria, 1992; pp. 1–781. ISBN 92-0-100892-9. [Google Scholar]
- IAEA/WMO. Global Network of Isotopes in Precipitation. 2021. Available online: http://www.iaea.org/water (accessed on 21 May 2021).
- Wang, S.; Zhang, M.; Hughes, C.; Crawford, J.; Wang, G.; Chen, F.; Du, M.; Qiu, X.; Zhou, S. Meteoric water lines in arid Central Asia using event-based and monthly data. J. Hydrol. 2018, 562, 435–445. [Google Scholar] [CrossRef]
- Hughes, C.; Crawford, J. A new precipitation weighted method for determining the meteoric water line for hydrological applications demonstrated using Australian and global GNIP data. J. Hydrol. 2012, 464–465, 344–351. [Google Scholar] [CrossRef]
- Harvey, F.E. Use of NADP Archive Samples to Determine the Isotope Composition of Precipitation: Characterizing the Meteoric Input Function for Use in Ground Water Studies. Ground Water 2001, 39, 380–390. [Google Scholar] [CrossRef] [PubMed]
- Crawford, J.; Hughes, C.E.; Lykoudis, S. Alternative least squares methods for determining the meteoric water line, demonstrated using GNIP data. J. Hydrol. 2014, 519, 2331–2340. [Google Scholar] [CrossRef]
- Araguás-Araguás, L.; Froehlich, K.; Rozanski, K. Stable isotope composition of precipitation over southeast Asia. J. Geophys. Res. Space Phys. 1998, 103, 28721–28742. [Google Scholar] [CrossRef]
- Tian, L.; Yao, T.; MacClune, K.; White, J.W.C.; Schilla, A.; Vaughn, B.; Vachon, R.; Ichiyanagi, K. Stable isotopic variations in west China: A consideration of moisture sources. J. Geophys. Res. Space Phys. 2007, 112. [Google Scholar] [CrossRef]
- Yao, T.; Masson-Delmotte, V.; Gao, J.; Yu, W.; Yang, X.; Risi, C.; Sturm, C.; Werner, M.; Zhao, H.; He, Y.; et al. A review of climatic controls on δ18O in precipitation over the Tibetan Plateau: Observations and simulations. Rev. Geophys. 2013, 51, 525–548. [Google Scholar] [CrossRef]
- Chen, F.; Zhang, M.; Wang, S.; Ma, Q.; Zhu, X.; Dong, L. Relationship between sub-cloud secondary evaporation and stable isotopes in precipitation of Lanzhou and surrounding area. Quat. Int. 2015, 380-381, 68–74. [Google Scholar] [CrossRef]
- Chen, F.; Zhang, M.; Wang, S.; Qiu, X.; Du, M. Environmental controls on stable isotopes of precipitation in Lanzhou, China: An enhanced network at city scale. Sci. Total. Environ. 2017, 609, 1013–1022. [Google Scholar] [CrossRef]
- Ma, Q.; Zhang, M.; Wang, S.; Wang, Q.; Liu, W.; Li, F.; Chen, F. An investigation of moisture sources and secondary evaporation in Lanzhou, Northwest China. Environ. Earth Sci. 2013, 71, 3375–3385. [Google Scholar] [CrossRef]
- Chen, F.; Zhang, M.; Ma, Q.; Wang, S.; Li, X.; Zhu, X. Stable isotopic characteristics of precipitation in Lanzhou City and its surrounding areas, Northwest China. Environ. Earth Sci. 2015, 73, 4671–4680. [Google Scholar] [CrossRef]
- Wu, J.; Ding, Y.; Ye, B.; Yang, Q.; Zhang, X.; Wang, J. Spatio-temporal variation of stable isotopes in precipitation in the Heihe River Basin, Northwestern China. Environ. Earth Sci. 2010, 61, 1123–1134. [Google Scholar] [CrossRef]
- Pang, Z.; Kong, Y.; Li, J.; Tian, J. An Isotopic Geoindicator in the Hydrological Cycle. Procedia Earth Planet. Sci. 2017, 17, 534–537. [Google Scholar] [CrossRef]
- Wang, S.; Zhang, M.; Hughes, C.; Zhu, X.; Dong, L.; Ren, Z.; Chen, F. Factors controlling stable isotope composition of precipitation in arid conditions: An observation network in the Tianshan Mountains, central Asia. Tellus B Chem. Phys. Meteorol. 2016, 68. [Google Scholar] [CrossRef] [Green Version]
- Vodila, G.; Palcsu, L.; Futó, I.; Szántó, Z. A 9-year record of stable isotope ratios of precipitation in Eastern Hungary: Implications on isotope hydrology and regional palaeoclimatology. J. Hydrol. 2011, 400, 144–153. [Google Scholar] [CrossRef]
- Wu, P.; Ding, Y.; Liu, Y.; Li, X. The characteristics of moisture recycling and its impact on regional precipitation against the background of climate warming over Northwest China. Int. J. Clim. 2019, 39, 5241–5255. [Google Scholar] [CrossRef]
- Li, R.; Wang, C. Precipitation recycling using a new evapotranspiration estimator for Asian-African arid regions. Theor. Appl. Clim. 2020, 140, 1–13. [Google Scholar] [CrossRef]
Figure 1.
Spatial distribution of sampling stations (Anning, Yuzhong, Gaolan and Yongdeng) in Lanzhou, China. The black polygon denotes the administrative boundary of Lanzhou city. The blue curve denotes the Yellow River.
Figure 1.
Spatial distribution of sampling stations (Anning, Yuzhong, Gaolan and Yongdeng) in Lanzhou, China. The black polygon denotes the administrative boundary of Lanzhou city. The blue curve denotes the Yellow River.

Figure 2.
Linear relationship between δD and δ18O using event-based (a) and monthly (b) data for all sampling stations in Lanzhou from 2011 to 2014. OLSR-based and PWRMA-based LMWLs as well as GMWL (δD = 8 δ18O + 10; [4]) are shown.
Figure 2.
Linear relationship between δD and δ18O using event-based (a) and monthly (b) data for all sampling stations in Lanzhou from 2011 to 2014. OLSR-based and PWRMA-based LMWLs as well as GMWL (δD = 8 δ18O + 10; [4]) are shown.

Figure 3.
The slope and intercept of OLSR-based and PWRMA-based LMWL using (a) event-based and (b) monthly data for each sampling station in Lanzhou from 2011 to 2014.
Figure 3.
The slope and intercept of OLSR-based and PWRMA-based LMWL using (a) event-based and (b) monthly data for each sampling station in Lanzhou from 2011 to 2014.

Figure 4.
Linear relationship between δD and δ18O using event-based (a–d) and monthly data (e–h) on a seasonal basis for all sampling stations in Lanzhou from 2011 to 2014. OLSR-based and PWRMA-based LMWLs as well as GMWL (δD = 8 δ18O + 10; [4]) are shown.
Figure 4.
Linear relationship between δD and δ18O using event-based (a–d) and monthly data (e–h) on a seasonal basis for all sampling stations in Lanzhou from 2011 to 2014. OLSR-based and PWRMA-based LMWLs as well as GMWL (δD = 8 δ18O + 10; [4]) are shown.

Figure 5.
Linear relationship between δD and δ18O using event-based and monthly data on a seasonal basis for each sampling station in Lanzhou from 2011 to 2014.
Figure 5.
Linear relationship between δD and δ18O using event-based and monthly data on a seasonal basis for each sampling station in Lanzhou from 2011 to 2014.

Figure 6.
OLSR-based and PWRMA-based LMWL slopes using event-based and monthly data on a seasonal basis for each sampling station in Lanzhou from 2011 to 2014.
Figure 6.
OLSR-based and PWRMA-based LMWL slopes using event-based and monthly data on a seasonal basis for each sampling station in Lanzhou from 2011 to 2014.

Figure 7.
LMWL slopes using event-based and monthly data based on a seasonal basis using six regression methods for each sampling station in Lanzhou from 2011 to 2014.
Figure 7.
LMWL slopes using event-based and monthly data based on a seasonal basis using six regression methods for each sampling station in Lanzhou from 2011 to 2014.

Figure 8.
The variations of oxygen isotopic ratio (a), hydrogen isotopic ratio (e), and meteorological elements (b–d,f–h) (P-precipitation amount, T-air temperature, RH-relative humidity, e-water vapor pressure, Td-dew point temperature, and ΔTd-depression of dew point) for each sampling station in Lanzhou from 2011 to 2014. For the box plots, the bottom of the box indicates the 25th percentile, a line within the box marks the median, and the top of the box indicates the 75th percentile; whiskers indicate the 90th and 10th percentiles; points above and below the whiskers show the outliers.

Figure 9.
The slopes of LMWL under different meteorological conditions ((a) P-precipitation amount, (b) T-air temperature, (c) RH-relative humidity, (d) e-water vapor pressure, (e) Td-dew point temperature, (f) ΔTd-depression of dew point) using six regression methods for all sampling stations in Lanzhou from 2011 to 2014.

Figure 10.
The figure (a) shows OLSR-based and PWRMA-based LMWLs in the Lanzhou city from 1985 to 1987, 1996 to 1999, 2011 to 2014 (n = 179). The monthly isotopic data during 1985–1987 and 1996-1999 was provided by IAEA/WMO (2017), and the event-based data during 2011–2014 were precipitation-weighted to monthly series. The figure (b) shows monthly variation of δ18O in precipitation in the Lanzhou city (GNIP dataset: 16 months during 1985–1987 and 25 months during 1996–1999) and the in situ observations in this study.


Table 1.
Inter-annual variation of the slope of the δD–δ18O linear relationship (in permille/permille) using the six regression methods, as well as the annual, December–January–February (DJF) and June–July–August (JJA) precipitation amount (P in mm) and air temperature (T in °C) using event-based samples for all stations in Lanzhou from 2011 to 2014.
| Year | Slope (Permille/Permille) | P (mm) | T (°C) | |||||||||
|---|---|---|---|---|---|---|---|---|---|---|---|---|
| OLSR | RMA | MA | PWLSR | PWRMA | PWMA | Annual | DJF * | JJA ** | Annual | DJF | JJA | |
| 2011 | 7.33 ± 0.11 | 7.51 ± 0.11 | 7.70 ± 0.12 * | 7.65 ± 0.09 | 7.77 ± 0.09 ** | 7.90 ± 0.09 ** | 192.8 | 0.8 | 107.0 | 14.1 | −5.8 | 17.4 |
| 2012 | 7.38 ± 0.12 | 7.64 ± 0.12 | 7.89 ± 0.13 ** | 7.68 ± 0.12 | 7.91 ± 0.12 ** | 8.14 ± 0.12 ** | 247.0 | 5.7 | 135.5 | 12.4 | −7.4 | 18.9 |
| 2013 | 7.25 ± 0.12 | 7.48 ± 0.12 | 7.72 ± 0.12 ** | 7.29 ± 0.11 | 7.50 ± 0.11 | 7.71 ± 0.12 ** | 181.1 | 1.2 | 96.7 | 13.4 | −6.5 | 18.0 |
| 2014 | 7.13 ± 0.11 | 7.34 ± 0.11 | 7.56 ± 0.12 ** | 7.67 ± 0.11 ** | 7.84 ± 0.11 ** | 8.01 ± 0.11 ** | 229.5 | 5.2 | 116.7 | 12.5 | −5.2 | 16.6 |
Note: * DJF (December, January, February) ** JJA (June, July, August).
Table 2.
LMWL slope without extreme events using six regressions for all stations in Lanzhou from 2011 to 2014.
Table 2.
LMWL slope without extreme events using six regressions for all stations in Lanzhou from 2011 to 2014.
| P (mm) | LMWL Slope (Permille/Permille) | n | |||||
|---|---|---|---|---|---|---|---|
| OLSR | RMA | MA | PWLSR | PWRMA | PWMA | ||
| All | 7.27 ± 0.06 | 7.51 ± 0.06 ** | 7.73 ± 0.06 ** | 7.55 ± 0.05 ** | 7.73 ± 0.05 ** | 7.91 ± 0.05 ** | 959 |
| <30 | 7.29 ± 0.06 | 7.51 ± 0.06 ** | 7.73 ± 0.06 ** | 7.51 ± 0.05 ** | 7.70 ± 0.05 ** | 7.88 ± 0.06 ** | 954 |
| <20 | 7.29 ± 0.06 | 7.51 ± 0.06 ** | 7.73 ± 0.06 ** | 7.53 ± 0.05 ** | 7.71 ± 0.06 ** | 7.90 ± 0.06 ** | 940 |
| <10 | 7.27 ± 0.06 | 7.50 ± 0.06 ** | 7.73 ± 0.06 ** | 7.47 ± 0.06 * | 7.68 ± 0.06 ** | 7.90 ± 0.06 ** | 880 |
| >0.5 | 7.36 ± 0.07 | 7.57 ± 0.07 * | 7.77 ± 0.07 ** | 7.56 ± 0.06 * | 7.74 ± 0.06 ** | 7.92 ± 0.06 ** | 719 |
| >1 | 7.45 ± 0.07 | 7.64 ± 0.07 | 7.83 ± 0.07 ** | 7.59 ± 0.07 | 7.76 ± 0.07 ** | 7.94 ± 0.07 ** | 604 |
| >5 | 7.79 ± 0.12 | 7.97 ± 0.12 | 8.14 ± 0.12 | 7.80 ± 0.11 | 7.97 ± 0.12 | 8.14 ± 0.12 * | 204 |
Note: * Passed the significance test of 0.05 level, ** Passed the significance test of 0.01 level.
Table 3.
Inter-annual variation of the slope of the δD–δ18O linear relationship (in permille/permille) using the six regression methods, precipitation amount (P in mm) and surface temperature (T in °C) based on event-based samples at Anning in summer from 2011 to 2014.
Table 3.
Inter-annual variation of the slope of the δD–δ18O linear relationship (in permille/permille) using the six regression methods, precipitation amount (P in mm) and surface temperature (T in °C) based on event-based samples at Anning in summer from 2011 to 2014.
| Year | Summer Slope (Permille/Permille) | P (mm) | T (°C) | |||||
|---|---|---|---|---|---|---|---|---|
| OLSR | RMA | MA | PWLSR | PWRMA | PWMA | |||
| 2011 | 7.53 ± 0.35 | 7.74 ± 0.34 | 7.95 ± 0.36 | 7.82 ± 0.25 | 7.92 ± 0.25 | 8.03 ± 0.25 | 103 | 19.2 |
| 2012 | 6.90 ± 0.62 | 8.18 ± 0.57 | 8.45 ± 0.64 | 8.54 ± 0.69 | 8.84 ± 0.70 | 9.15 ± 0.72 | 54.4 | 19.5 |
| 2013 | 6.32 ± 0.32 | 6.50 ± 0.31 | 6.67 ± 0.33 | 6.67 ± 0.12 | 6.69 ± 0.12 | 6.71 ± 0.12 | 48 | 19.9 |
| 2014 | 6.70 ± 0.28 | 6.89 ± 0.27 | 7.07 ± 0.28 | 7.35 ± 0.35 | 7.63 ± 0.36 | 7.90 ± 0.37 * | 116 | 17.9 |
Note: * Passed the significance test of 0.05 level.
Publisher’s Note: MDPI stays neutral with regard to jurisdictional claims in published maps and institutional affiliations. |
© 2021 by the authors. Licensee MDPI, Basel, Switzerland. This article is an open access article distributed under the terms and conditions of the Creative Commons Attribution (CC BY) license (https://creativecommons.org/licenses/by/4.0/).
Share and Cite
MDPI and ACS Style
Chen, F.; Wang, S.; Wu, X.; Zhang, M.; Argiriou, A.A.; Zhou, X.; Chen, J. Local Meteoric Water Lines in a Semi-Arid Setting of Northwest China Using Multiple Methods. Water 2021, 13, 2380. https://doi.org/10.3390/w13172380
AMA Style
Chen F, Wang S, Wu X, Zhang M, Argiriou AA, Zhou X, Chen J. Local Meteoric Water Lines in a Semi-Arid Setting of Northwest China Using Multiple Methods. Water. 2021; 13(17):2380. https://doi.org/10.3390/w13172380
Chicago/Turabian StyleChen, Fenli, Shengjie Wang, Xixi Wu, Mingjun Zhang, Athanassios A. Argiriou, Xin Zhou, and Jufan Chen. 2021. "Local Meteoric Water Lines in a Semi-Arid Setting of Northwest China Using Multiple Methods" Water 13, no. 17: 2380. https://doi.org/10.3390/w13172380
Note that from the first issue of 2016, this journal uses article numbers instead of page numbers. See further details here.