Article

The Use of Zooplankton Metrics to Determine the Trophic Status and Ecological Potential: An Approach in a Large Mediterranean Watershed

by
Manuel E. Muñoz-Colmenares
1,2,*,
María D. Sendra
2,
Xavier Sòria-Perpinyà
2,
Juan Miguel Soria
2 and
Eduardo Vicente
2
1
Doctoral Program in Pollution, Toxicology and Environmental Health, Valencia University, 46010 Valencia, Spain
2
Cavanilles Institute of Biodiversity and Evolutionary Biology (ICBiBE), Universitat de València, Calle Catedrático José Beltrán Martínez, 46980 València, Spain
*
Author to whom correspondence should be addressed.
Water 2021, 13(17), 2382; https://doi.org/10.3390/w13172382
Submission received: 7 July 2021 / Revised: 23 August 2021 / Accepted: 26 August 2021 / Published: 30 August 2021

Abstract

:
In the European Water Framework Directive, zooplankton was not included as a Biological Quality Element despite its important place in the aquatic trophic web. In the present study on zooplankton abundances and biomasses, we used several metrics to test their ability to detect differences among trophic statuses and ecological potential levels, and collected a large sum of data in more than 60 reservoirs at Ebro watershed, on more than 300 sampling occasions over 10 years. Our results indicate that most zooplankton metrics are correlated to environmental variables that determine reservoirs’ trophic states, especially chlorophyll a and total phosphorus. The metrics with better sensitivity to differentiate trophic states and ecological potential levels were ZOO (total zooplankton), LZOO (large zooplankton), CLAD (cladocerans), and ZOO:CHLA (zooplankton:chlorophyll a ratio). Microcrustacean metrics such as DAPHN (Daphnia), COP (copepods), CYCLO (cyclopoids), and CALA (calanoids) were good at differentiating between high and low water quality in trophic status (oligotrophic–eutrophic) and ecological potential (good or superior–moderate). Thus, zooplankton can be used as a valuable tool to determine water quality; we believe that zooplankton should be considered a Biological Quality Element within Water Framework Directive monitoring programs for inland waters.

Graphical Abstract

1. Introduction

Water resources such as natural lakes and man-made reservoirs have been vital in supporting the increase in population growth, agricultural productivity, industrial activity, and economic development [1]. Presently, a high pressure on water resources is present around the world due to the previous factors in unison with climate change and freshwater cultural eutrophication [2]. This cultural eutrophication is mainly an input increment of nitrogen and phosphorus into waterbodies or catchment basin areas, and primarily caused by industrial activity [3]. These high inputs and rising temperatures tend to intensify eutrophication and lead to cyanobacterial blooms, floating plant predominance, dissolved oxygen decrement, and, therefore, low water quality [4].
The implementation of the European Water Framework Directive was one response to this situation. This directive presents the requirements and assessments to control the water quality and classify waterbodies into different “Ecological Status” throughout the European Union [5]. The main aim of the Water Framework Directive (WFD) is to achieve a “good ecological status” in all waterbodies. This ecological status is obtained through hydro-morphological and physical–chemical indicators, as well as certain Biological Quality Elements (BQE). Included in the last indicators were phytoplankton, phytobenthos, macrophytes, benthic macroinvertebrates, and fish. However, and, surprisingly, without a scientifically based explanation, zooplankton was not included as a BQE [6,7,8].
Zooplankton organisms have a fundamental position in aquatic food webs [9] and are an important element in the structure and function of aquatic ecosystems. This is because they occupy the role of primary consumers and are the energy link between primary producers such as phytoplankton and higher consumers such as fish [10]. Additionally, zooplankton can respond quickly to changes from trophic cascades, such as phytoplankton blooms, in a bottom-up process or top-down control, controlling and determining algae composition and abundance [11,12,13]. Moreover, the zooplankton community responds to physical–chemical habitat conditions easily, which affects their species’ richness, increasing or decreasing densities, and promoting shifts in their diversity [14,15]. It is because of these characteristics that they can be a suitable indicator of water quality [16,17].
Worldwide, in waterbodies with different environmental conditions, several studies have used the whole zooplankton community as an indicator [7,18,19,20,21] or used only specific zooplankton groups, such as rotifers or microcrustaceans [22,23,24,25]. Recently, within the Iberian Peninsula, the use of zooplankton species as indicators of trophic status in reservoirs has been evaluated in different basins such as Ebro [26,27], Cavado [28], and Jucar [29].
Studies focused on the use of zooplankton biomass, abundance, and ratios to determine trophic state have recently increased in several parts of the European Union [8,9,30,31,32,33]. However, in natural lakes [34,35,36] and man-made reservoirs in the Mediterranean region, there are fewer studies [37,38]. Finally, studies on the use of zooplankton biomass and abundance as indicators of ecological status under the WDF criteria are scarce in scientific research.
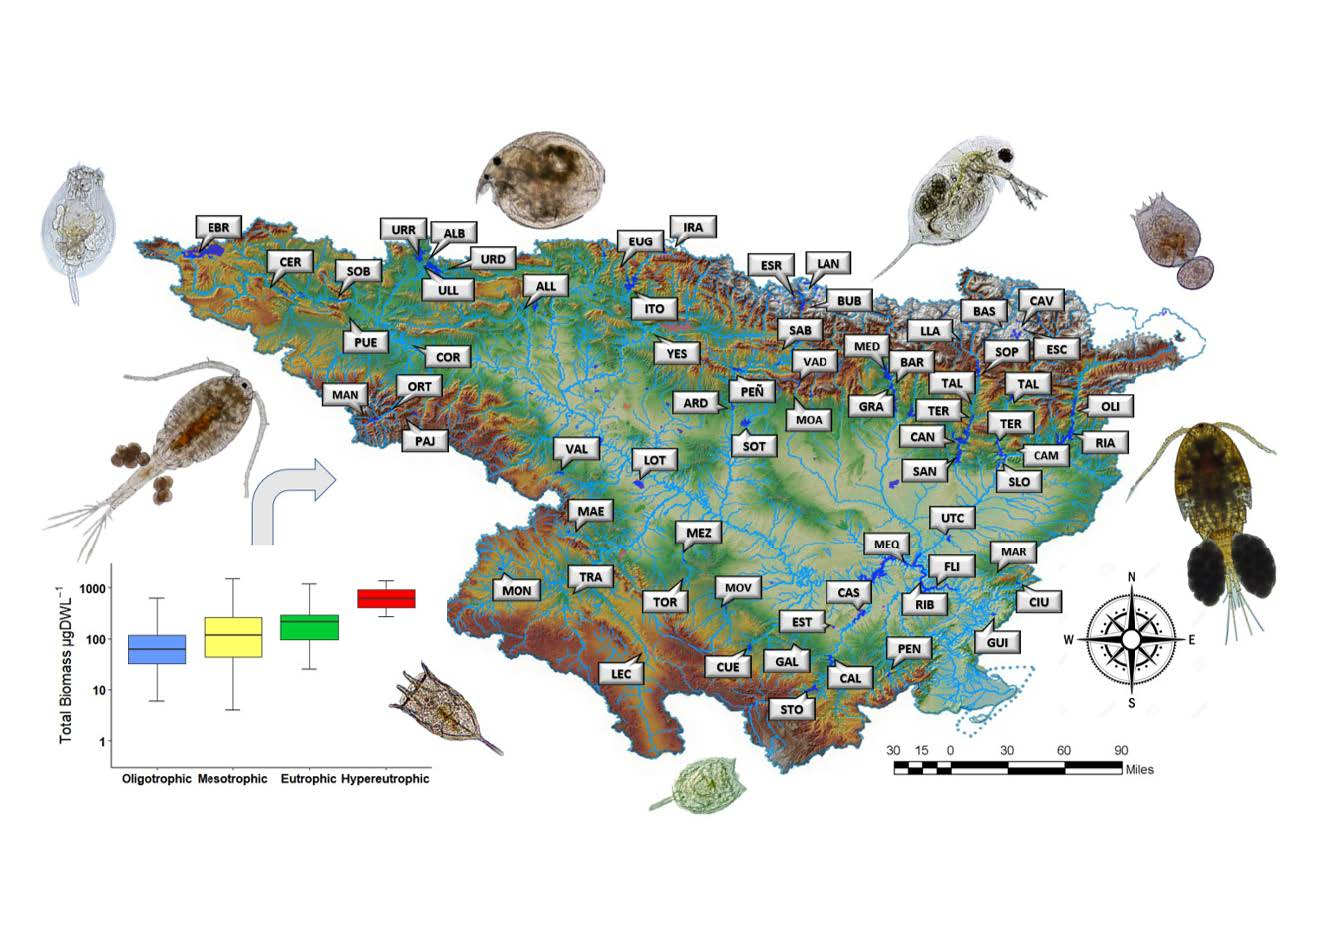
The aim of this study was to establish the value of the zooplankton metrics used in determining the trophic status and ecological potential for lentic waters. In the study, we used a robust data set collected over the last ten years in 66 reservoirs along the Ebro watershed, involving more than 300 sampling events over 10 years. The present research contributes to the research on zooplankton as a useful indicator to determine the trophic state and ecological potential within the context of the WFD requirements.

2. Materials and Methods

2.1. Study Site

The largest river in Spain is the Ebro River; it has a draining area of 86,000 km2, covering a fifth of the Spanish territory, and it is one of the larger Mediterranean watersheds. The Ebro River flows 930 km from the northwest to the southeast and before joining with the Mediterranean Sea at Amposta, which is located approximately 160 km south of Barcelona. The data presented in this work was obtained from 66 different reservoirs across the Ebro watershed (Figure 1). According to WFD methodology, sampling campaigns were conducted during the summers from 2010 to 2019. At each reservoir, a sampling point was established to collect environmental data, water, and plankton samples. This point was set up in each reservoir’s deepest part, at 300–500 m from the dam wall. Some data and characteristics of each reservoir are presented in Appendix A, Table A1, and Supplementary Table S1.

2.2. Environmental Variables

At every sampling point, the following variables were measured in situ along a vertical profile: dissolved oxygen, conductivity, temperature, turbidity, chlorophyll-a, and phycocyanin, among many others, using a multisensory device called Sea-Bird 19 plus V2 (Sea Bird Electronics Inc., Bellevue, WA, USA). The water transparency was determined through the Secchi disk depth (SD). For ex-situ analysis, an integrative water sample was collected from the photic zone of each reservoir using a 25 mm inner diameter ballasted PET tube. The depth of the photic zone was calculated by means of the light penetration using a Li-Cor quantum meter (LI-COR Environmental, Lincoln, NE, USA). When the photic zone was less than 6 m deep, the integrative water sample was collected from the water’s surface down to said depth or to the bottom [39]. We used standard methodology to estimate the total phosphorus (TP), total nitrogen (TN), and chlorophyll a (Chl-a) [40,41].

2.3. Trophic State and Ecological Potential

To determine the trophic state in each reservoir we used the Trophic State Index (TSI’) [42]. To obtain a final trophic state we used the average of the three variables of TSI’ (TP, Chl-a, and Secchi disk). The ecological potential (EP) was calculated according to methodology in “Spanish Legislation RD 817/2015” and WFD [5], using the biological and physicochemical indicators. The biological indices were obtained using the metrics taken from four algal variables (chlorophyll a, biovolume, percentage of cyanobacteria, and the Index of Algae Groups [43]). From these, the classification scheme was: Good or Superior, Moderate, Poor, and Bad. The physicochemical indicator was obtained from the Secchi disk depth, hypolimnetic oxygen concentration, and total phosphorus as variables. From these, the respective classifications were Very Good, Good, Moderate, Poor, and Bad. To establish the representative classification of each biological and physicochemical indicator, we selected the average value of the algae and physicochemical variables. Following the WFD procedure, using the “one-out, all-out” rule, the worst value between both indicators was selected as ecological potential. A detailed methodology to obtain the ecological potential can be found in C.H.E. [44].

2.4. Zooplankton Samples

Zooplankton samples were collected at the beginning of the oxycline, which is reported as the richest zone of zooplankton fauna during the day [45]. Samples were collected using a vertical Ruttner bottle with 2.7 L capacity. For each reservoir, we took two Ruttner bottles to obtain 5.4 L of water sample, which was then filtered through a 30 μm mesh size Nytal. In addition, for taxonomic purposes, a zooplankton vertical tow net of 45 μm mesh size Nytal was towed from either a depth of 30 m, or the bottom of the reservoir, to the surface. Once both samples were obtained, they were fixed with formalin at 4% final concentration and stored in hermetic glass vials.
Zooplankton species were identified using Koste [46], Nogrady and Segers [47], and Ruttner-Kolisko [48] for rotifers; Alonso [49] and Błedzki and Rybak [50] for microcrustacean groups. The samples obtained from the Ruttner bottles, were counted using a 20 mL sedimentation chamber under inverted microscope (Nikon Eclipse Ti-U, objective lens 4 × −60, with differential interference contrast (DIC)). Zooplankton biomass was estimated for each taxon using a minimum of 30 specimens that were measured to calculate their dry weight using biovolume and length–weight relationships [51,52,53].

2.5. Zooplankton Metrics

The selected metrics, used to test the zooplankton viability to determine trophic state and ecological potential, were performed separately with the abundances and biomass of:
(a)
ZOO (zooplankton in total (rotifers, copepods, and cladocerans together) [8,38])
(b)
LZOO (large zooplankton (advanced copepods stages and large cladocerans) (Table 1) [54])
(c)
SZOO (small zooplankton (rotifers, nauplii, and small cladocerans) [54])
(d)
ZOO:CHLA (Zooplankton:chlorophyll a ratio [54])
(e)
ZOO:PHYTO (Zooplankton:phytoplankton ratio [55])
(f)
Zooplankton major groups: ROT (rotifers), CLAD (cladocerans), and COP (copepods) [31,32]
(g)
Selected microcrustacean orders/genera: DAPHN (daphnids), CYCLO (cyclopoids), and CALA (calanoids) [32]

2.6. Statistical Analysis

The relationships between zooplankton metrics and environmental variables (total phosphorus, Chl-a, dissolved oxygen, temperature, and Secchi disk depth) were calculated using Pearson’s correlation. Every correlation was performed individually and not in unison, therefore, a Bonferroni correction was not needed. Multiple regression (stepwise procedure) was performed to identify relationships between zooplankton metrics and environmental parameters (zooplankton variables entered the analysis only if p < 0.05). In order to test the validity of zooplankton metrics and indicate significative differences among different categories within trophic state and ecological potential, metrics’ average values were compared using a t-test (p < 0.05) in each consecutive category. Additionally, the same test was conducted to compare oligotrophic vs. eutrophic, verifying the difference between low and high productive waters. The data used in the statistical analyses were previously normalized log(x + 1) to meet assumptions of homoscedasticity and normal distribution of residuals. Data analyses were performed using R 4.0.0 “Arbor day” version [56] and plots were created with the R package “ggplot2”.

3. Results

3.1. Environmental Data, Trophic State, and Ecological Potential

During the present study, 304 samples were obtained. Each sample was considered as data that corresponded to the reservoir and the year sampled (for example, Mequinenza 2016). The environmental data across the basin reservoirs exhibited a wide range of values. Minimum and maximum values were as follows: chlorophyll a—Sopeira 2019 (0.4 µg/L) and El Val 2019 (51.8 µg/L); total phosphorus—Oliana 2012 (0.65 µg/L) and Mezalocha 2012 (186 µg/L); temperature—Llauset 2017 (10.3 °C) and Guiamets 2012 (28.1 °C); dissolved oxygen–Flix 2011 (2.5 mg/L) and El Val 2015 (14.38 mg/L); Secchi disk depth–Mezalocha 2012 (0.23 m) and Cavallers 2015 (18 m). The reservoirs’ trophic states were classified according to Carlson [42]: 123 oligotrophic, 123 mesotrophic, 55 eutrophic, and 3 hypereutrophic. In the case of ecological potential, using the WFD guidance, the reservoirs were classified thusly: 99 good or superior, 202 moderate, and 3 poor; none were registered as bad. The complete data related to the trophic state and ecological potential of each reservoir can be found in Appendix A.

3.2. Zooplankton Community Description

The total number of zooplankton species identified in the current research was 169, composed mainly of rotifers (115), followed by cladocerans (36), and copepods (17). The complete zooplankton species list can be found in Appendix B Table A2. For different years, the zooplankton density and biomass of the three principal groups varied among reservoirs. The minimum abundance was presented in Flix 2012 (6.76 ind L−1) and the maximum in La Sotonera 2017 (2758 ind L−1). In the case of biomass estimated as dried weight (DW), a minimum was found in Peña 2013 (0.45 µg DW L−1) and a maximum in Gallipuén (1971 µg DW L−1). All these minimums and maximums were recorded in reservoirs with high and low water quality, respectively.
Zooplankton density and biomass averages increased with the trophic and ecological potential (Figure 2). The same pattern can be observed in large zooplankton; however, the small zooplankton did not show this strong increase pattern (Figure 3).
Concurrently, there was a decrease in the ZOO:CHLA ratio; higher ratios were found in reservoirs with high water quality and lower ratios in those with low water quality. The ZOO:PHYTO ratio did not show a strong decrease in trophic state, but in ecological potential, it presented the same pattern as the ZOO:CHLA ratio (Figure 4). Splitting the zooplankton into different groups, the rotifers did not experience large differences in levels of either trophic state or ecological potential. Meanwhile, the microcrustaceans abundance and biomass increased for higher eutrophic levels (Figure 5).
Finally, separating the last microcrustacean group into daphnids, calanoids, and cyclopoids, the copepods presented a slight increase in eutrophicated reservoirs and low-quality waters (Figure 6).

3.3. Statistical Interpretation

Pearson correlations showed that most zooplankton metrics were correlated significantly with variables that mainly determined the water quality of the reservoir (Table 2). All metrics were correlated with chlorophyll a, followed in number by total phosphorus, and Secchi disk. In contrast, the dissolved oxygen parameter had the lower number of significant correlations with metrics; only with copepod density and ZOO:PHYTO biomass ratio. The metrics that were correlated with only one parameter were rotifer density and Daphnia biomass; both were correlated with chlorophyll a. The strongest correlation was between the ZOO:CHLA ratio and TP and Chl-a variables.
The multiple regressions produced through stepwise variable selection indicate that, like in the Pearson correlation, the chlorophyll a was the variable with a greater effect on different zooplankton metrics, being significantly correlated to all variables except for cyclopoids. Total density and biomass were positively correlated to temperature and chlorophyll a only. The metrics of ZOO:PHYTO ratio, density of cladocerans, cyclopoid density and biomass were significantly correlated to TP. Large zooplankton and microcrustacean metrics had highly positive correlations, especially with temperature. On the contrary, dissolved oxygen was not significant to any metric, and Secchi disk was not correlated to anything. The analysis explained between 2% and 54% of the variability in the metrics of zooplankton (Table 3).
According to t-test analysis, several metric means were statistically different in consecutive categories of trophic status and the levels that separate high water quality from low water quality in their ecological potential. Metric significance varied between consecutive levels; some were significant between oligo–mesotrophic and others in meso–eutrophic. However, none of the metrics were statistically different between eutrophic and hypereutrophic (p > 0.05); this was probably due to the low number of samples classified as hypereutrophic. Large zooplankton density and the ZOO:CHLA biomass ratio were significant between moderate and poor (p < 0.05); the rest of the metrics did not show any significance among these levels. Additionally, most of the metrics were statistically different between oligo–eutrophic and good–moderate (p < 0.05), the only metrics that were not significant among these levels were small zooplankton density and the ZOO:PHYTO biomass ratio (Table 4).

4. Discussion

The current study presents data from reservoirs widely distributed at the Ebro watershed, located in the Mediterranean area. It presents high variation of environmental data (most of the different trophic states and ecological potentials were present) indicating the high heterogeneity across the sampled reservoirs. Through the statistical treatment applied in the present research to the large dataset, we were able to define the zooplankton metrics that are related to environmental conditions and could be used to determine trophic status and ecological potential.
Several environmental variables are of a high importance in determining the water quality in lentic waters. One of these is the concentration of TP (a classical bottom-up variable). TP was correlated with a high number of the zooplankton metrics that were proposed in the current study. However, the chlorophyll a was the variable most correlated with metrics, in constrast with dissolved oxygen, which was not related with many metrics. Nevertheless, not only did environmental data vary, zooplankton metrics also showed different patterns through reservoirs and trophic gradients.
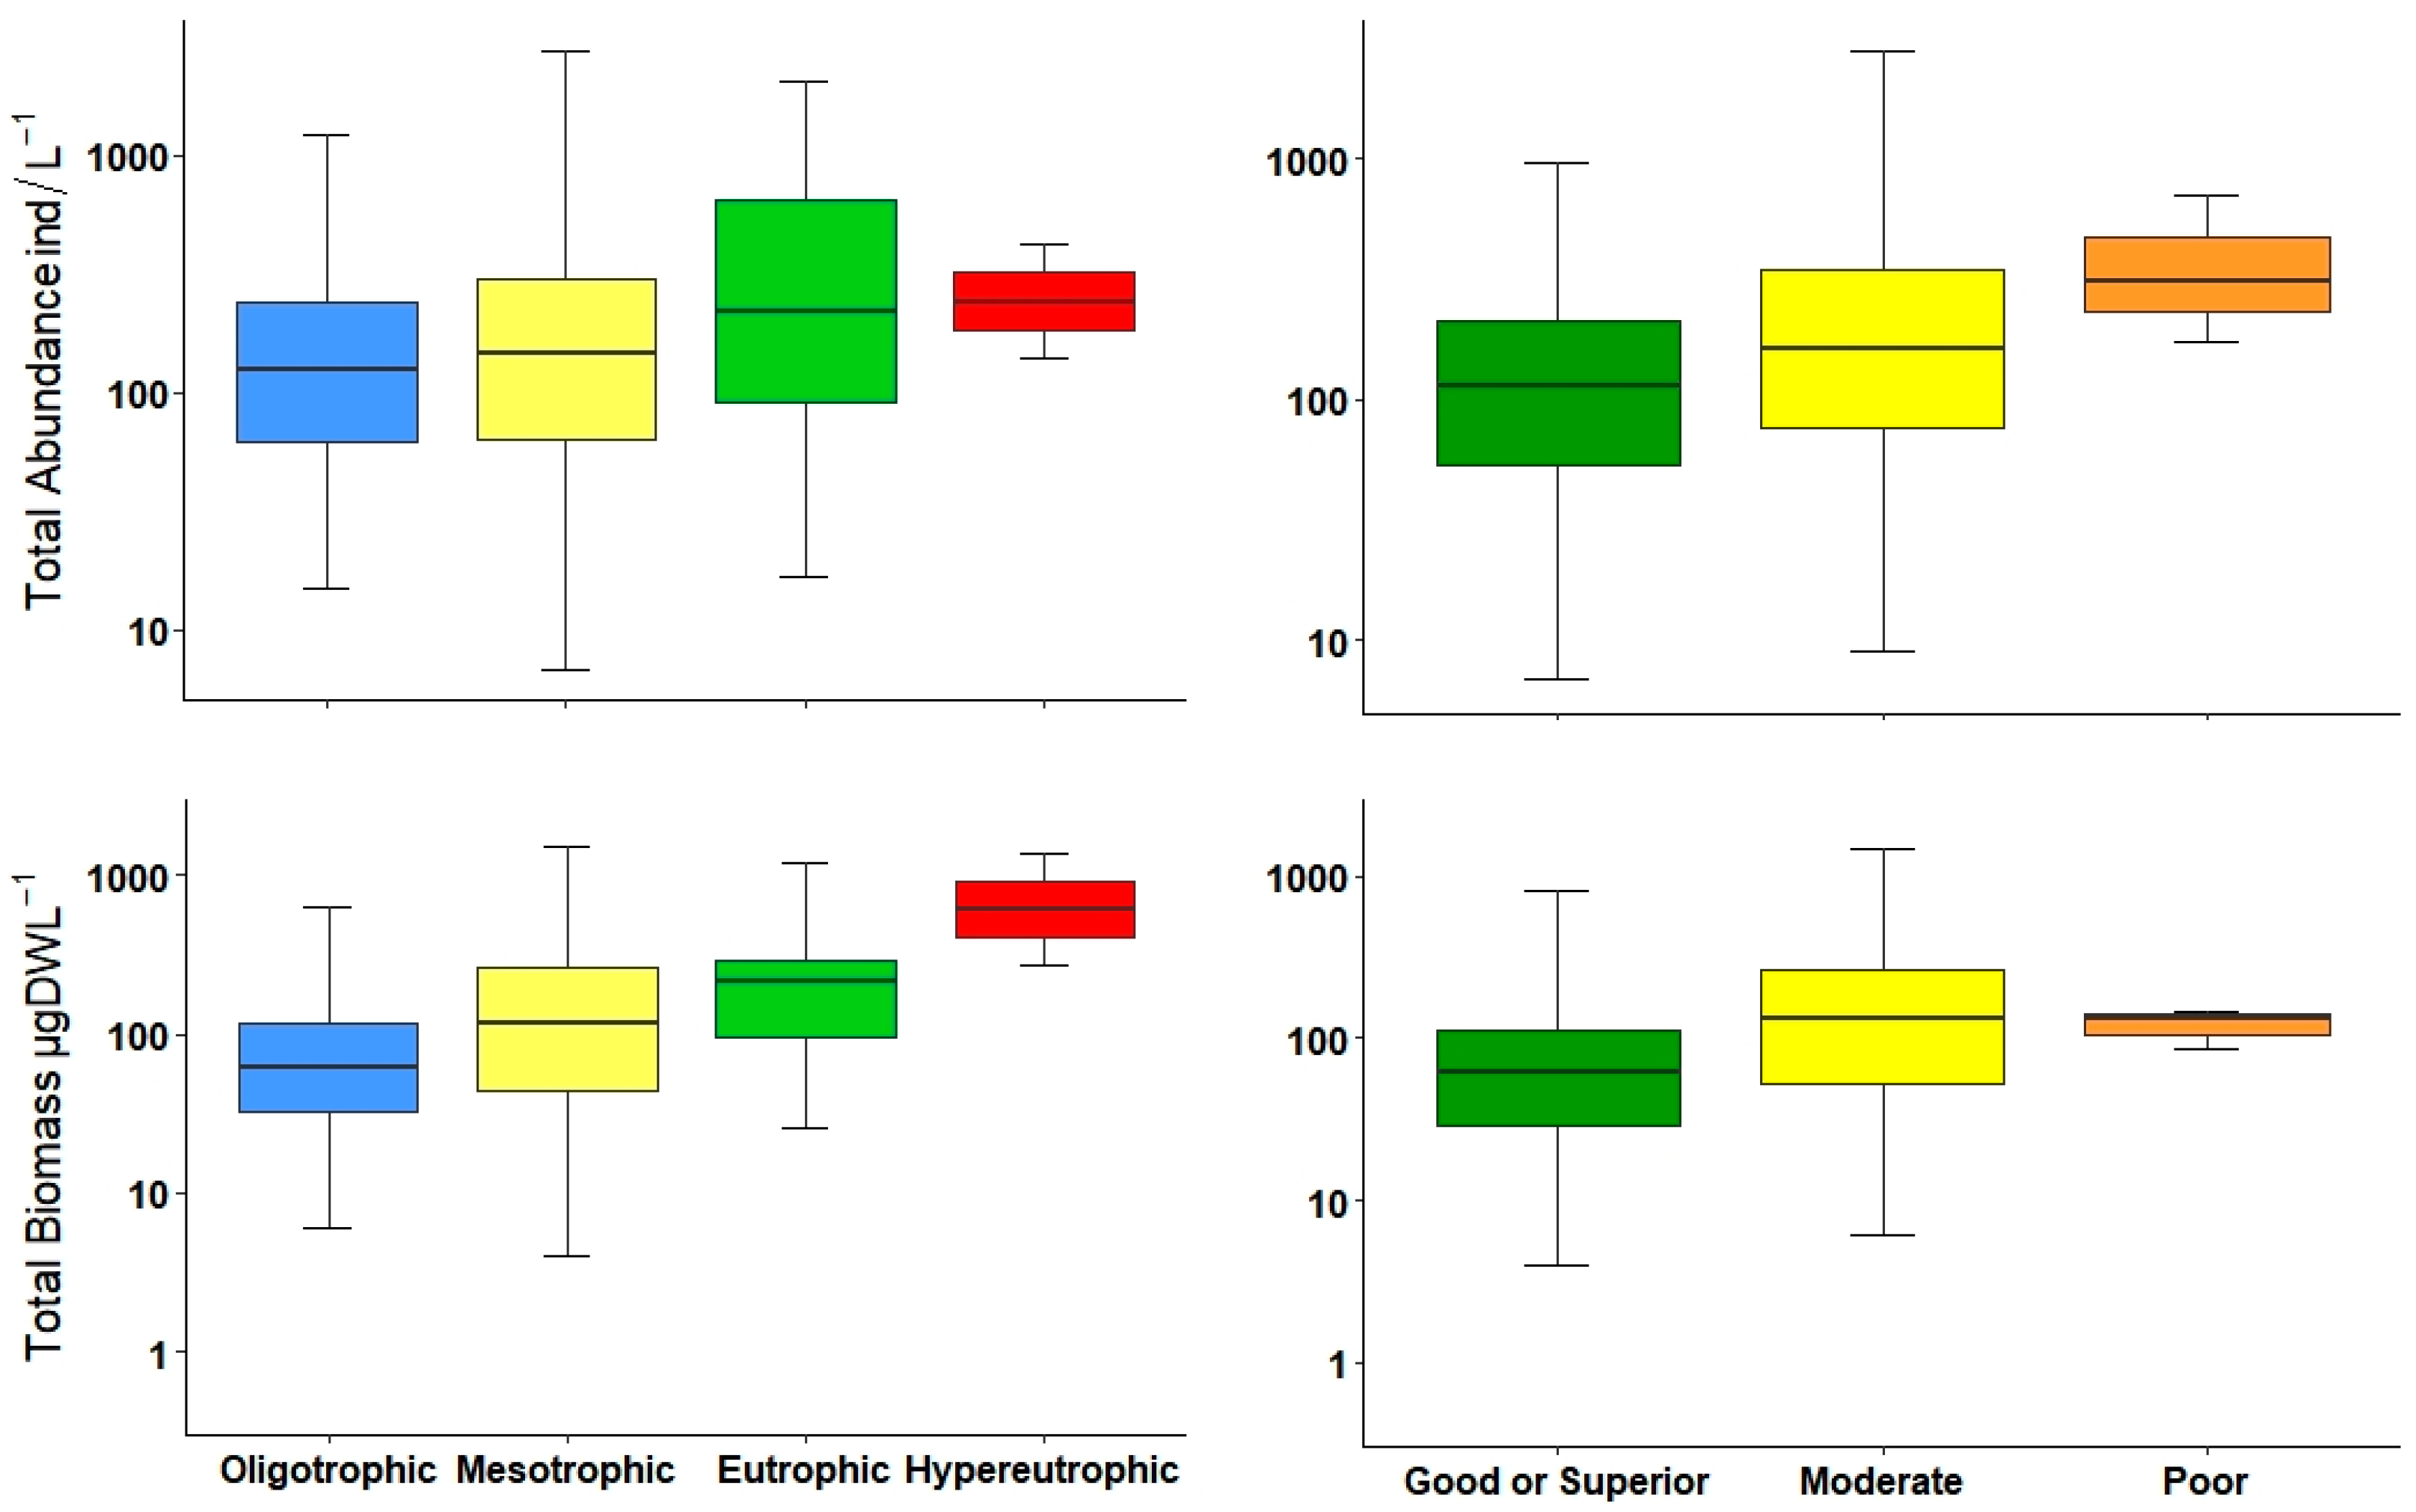
The total abundance of zooplankton as indicator of trophic state has been tested in another Iberian watershed [38], and as a water quality tool in natural Mediterranean lakes [36], both exhibiting an increment in zooplankton density along with both eutrophication and ecological potential increase, similarly to our results. Although biomass is dependent on abundance, it is an interesting metric to consider, because the change in any group dominance can mean high changes in the biomass and an increment in the percentage of microcrustaceans in relation to rotifers and zooplankton biomass has been linked to TP in different climatic zones [54]. Biomass increased along the trophic gradient but showed a strong pattern when compared to abundances, as observed in European lakes [33,36]. Both density as well as biomass were statistically significant in differentiating between almost all water quality classes; however, biomass was slightly better to separate oligotrophic from mesotrophic environments. Nevertheless, both metrics, abundance and biomass could be used to determine bad or good water quality.
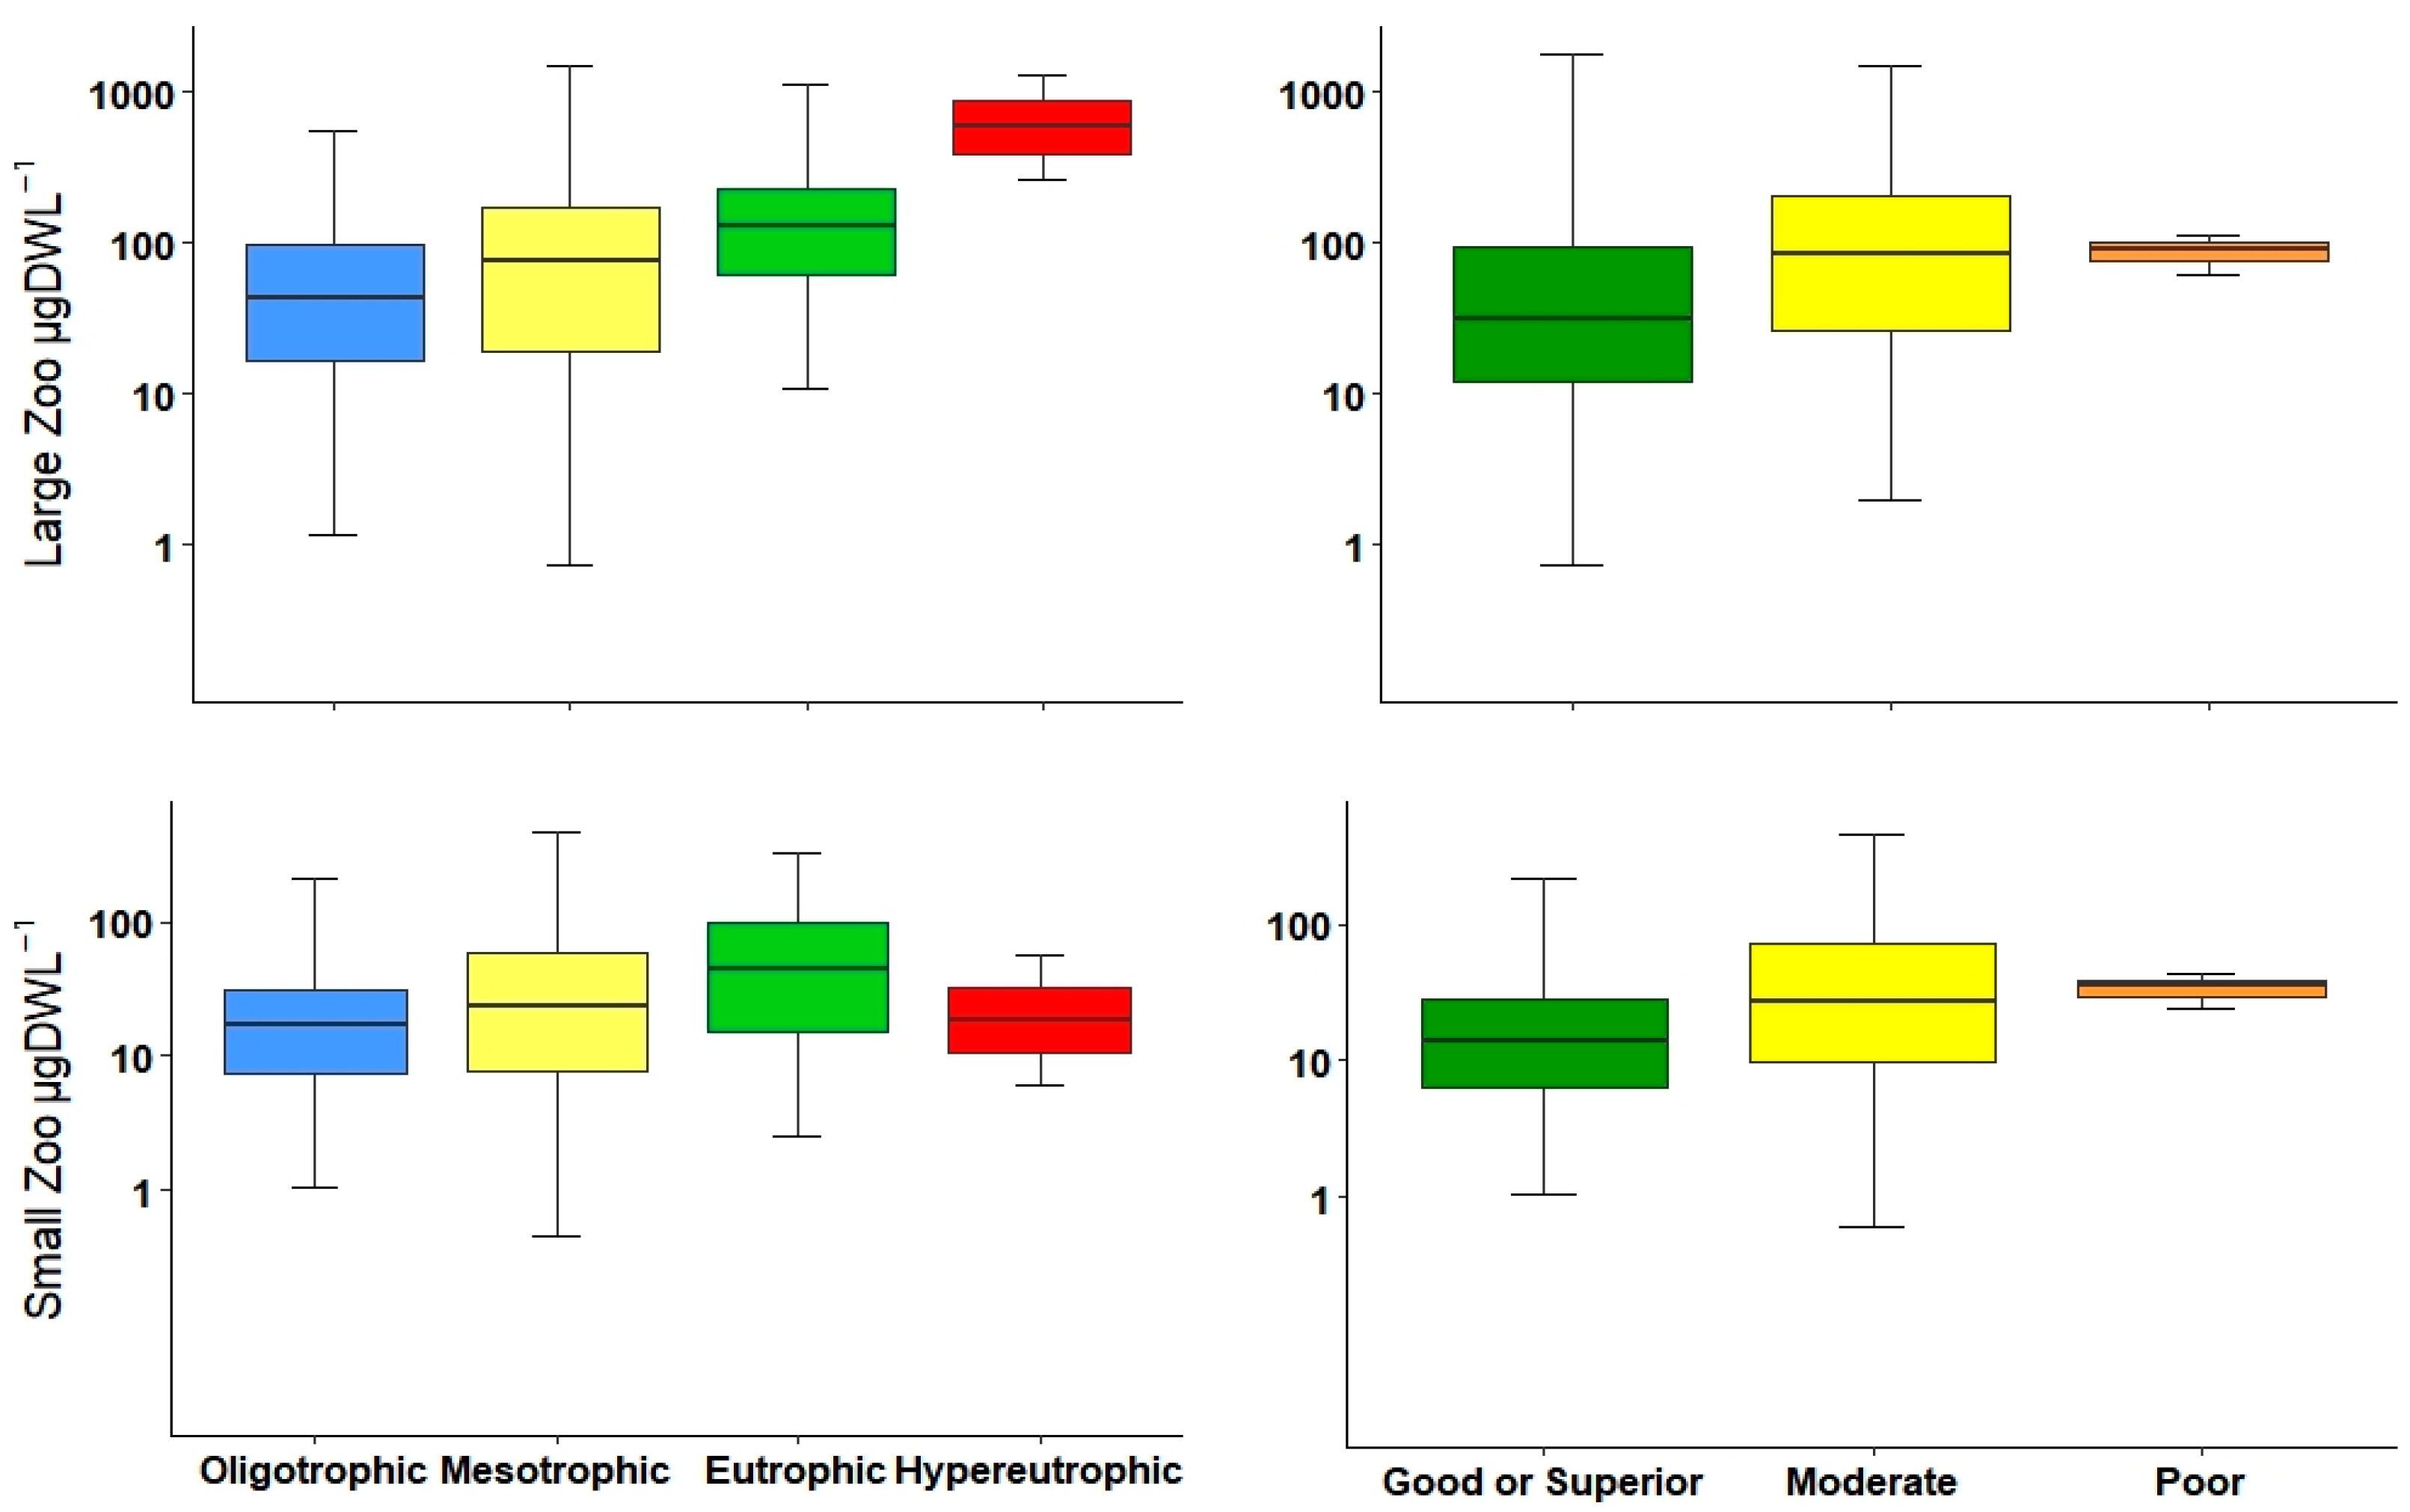
Normally, most of the total biomass is comprised of large-bodied zooplankton (mainly microcrustaceans), and thus, large-bodied biomass is very similar to total biomass. This is unlike total abundance, which may differ in the presence of small-bodied zooplankton. Gyllström et al. [54] reported a positive relationship between the increment of large zooplankton biomass and TP. In the current study, we found a similar tendency along the trophic gradient and ecological potential. Additionally, the density of the large zooplankton presented similar patterns and could distinguish marginally better between ecological potentials than biomasses.
Small-bodied zooplankton, mainly composed of rotifers and small cladocerans, were correlated with variables that determined the trophic status, particularly with Chl-a. These small zooplankton can shape the community in terms of abundance, especially for the high number of rotifer individuals [10,22]. These metrics were effective in distinguishing between low and high productive waters in general, but less sensible than other metrics in differentiating precisely between consecutive levels. A high elevate abundance and biomass could indicate an increment in the trophic gradient or other environmental pressures [54].
An important aspect related to the zooplankton community is the high pressure from planktivorous fish [57], which strongly affect zooplankton abundance, biomass, community composition, and even the size of the structure, especially in low productive waters [58,59,60]. On the other hand, phytoplankton blooms, especially cyanobacterial blooms, can become an additional pressure [61]. Cyanobacteria are a poor-quality food resource [62], produce harmful cyanotoxins [63,64], and can promote zooplankton community shift into small-bodied species [65,66,67]. In comparison to large-bodied species, small species are less mechanically affected (clogging of their filtering apparatus) by the presence of cyanobacterial colonies, mainly of filamentous forms [68] in habitats with a eutrophic increment, where such blooms normally surge [59]. Hence, the use of large and small zooplankton as a metric could provide valuable data about both fish and cyanobacterial pressures.
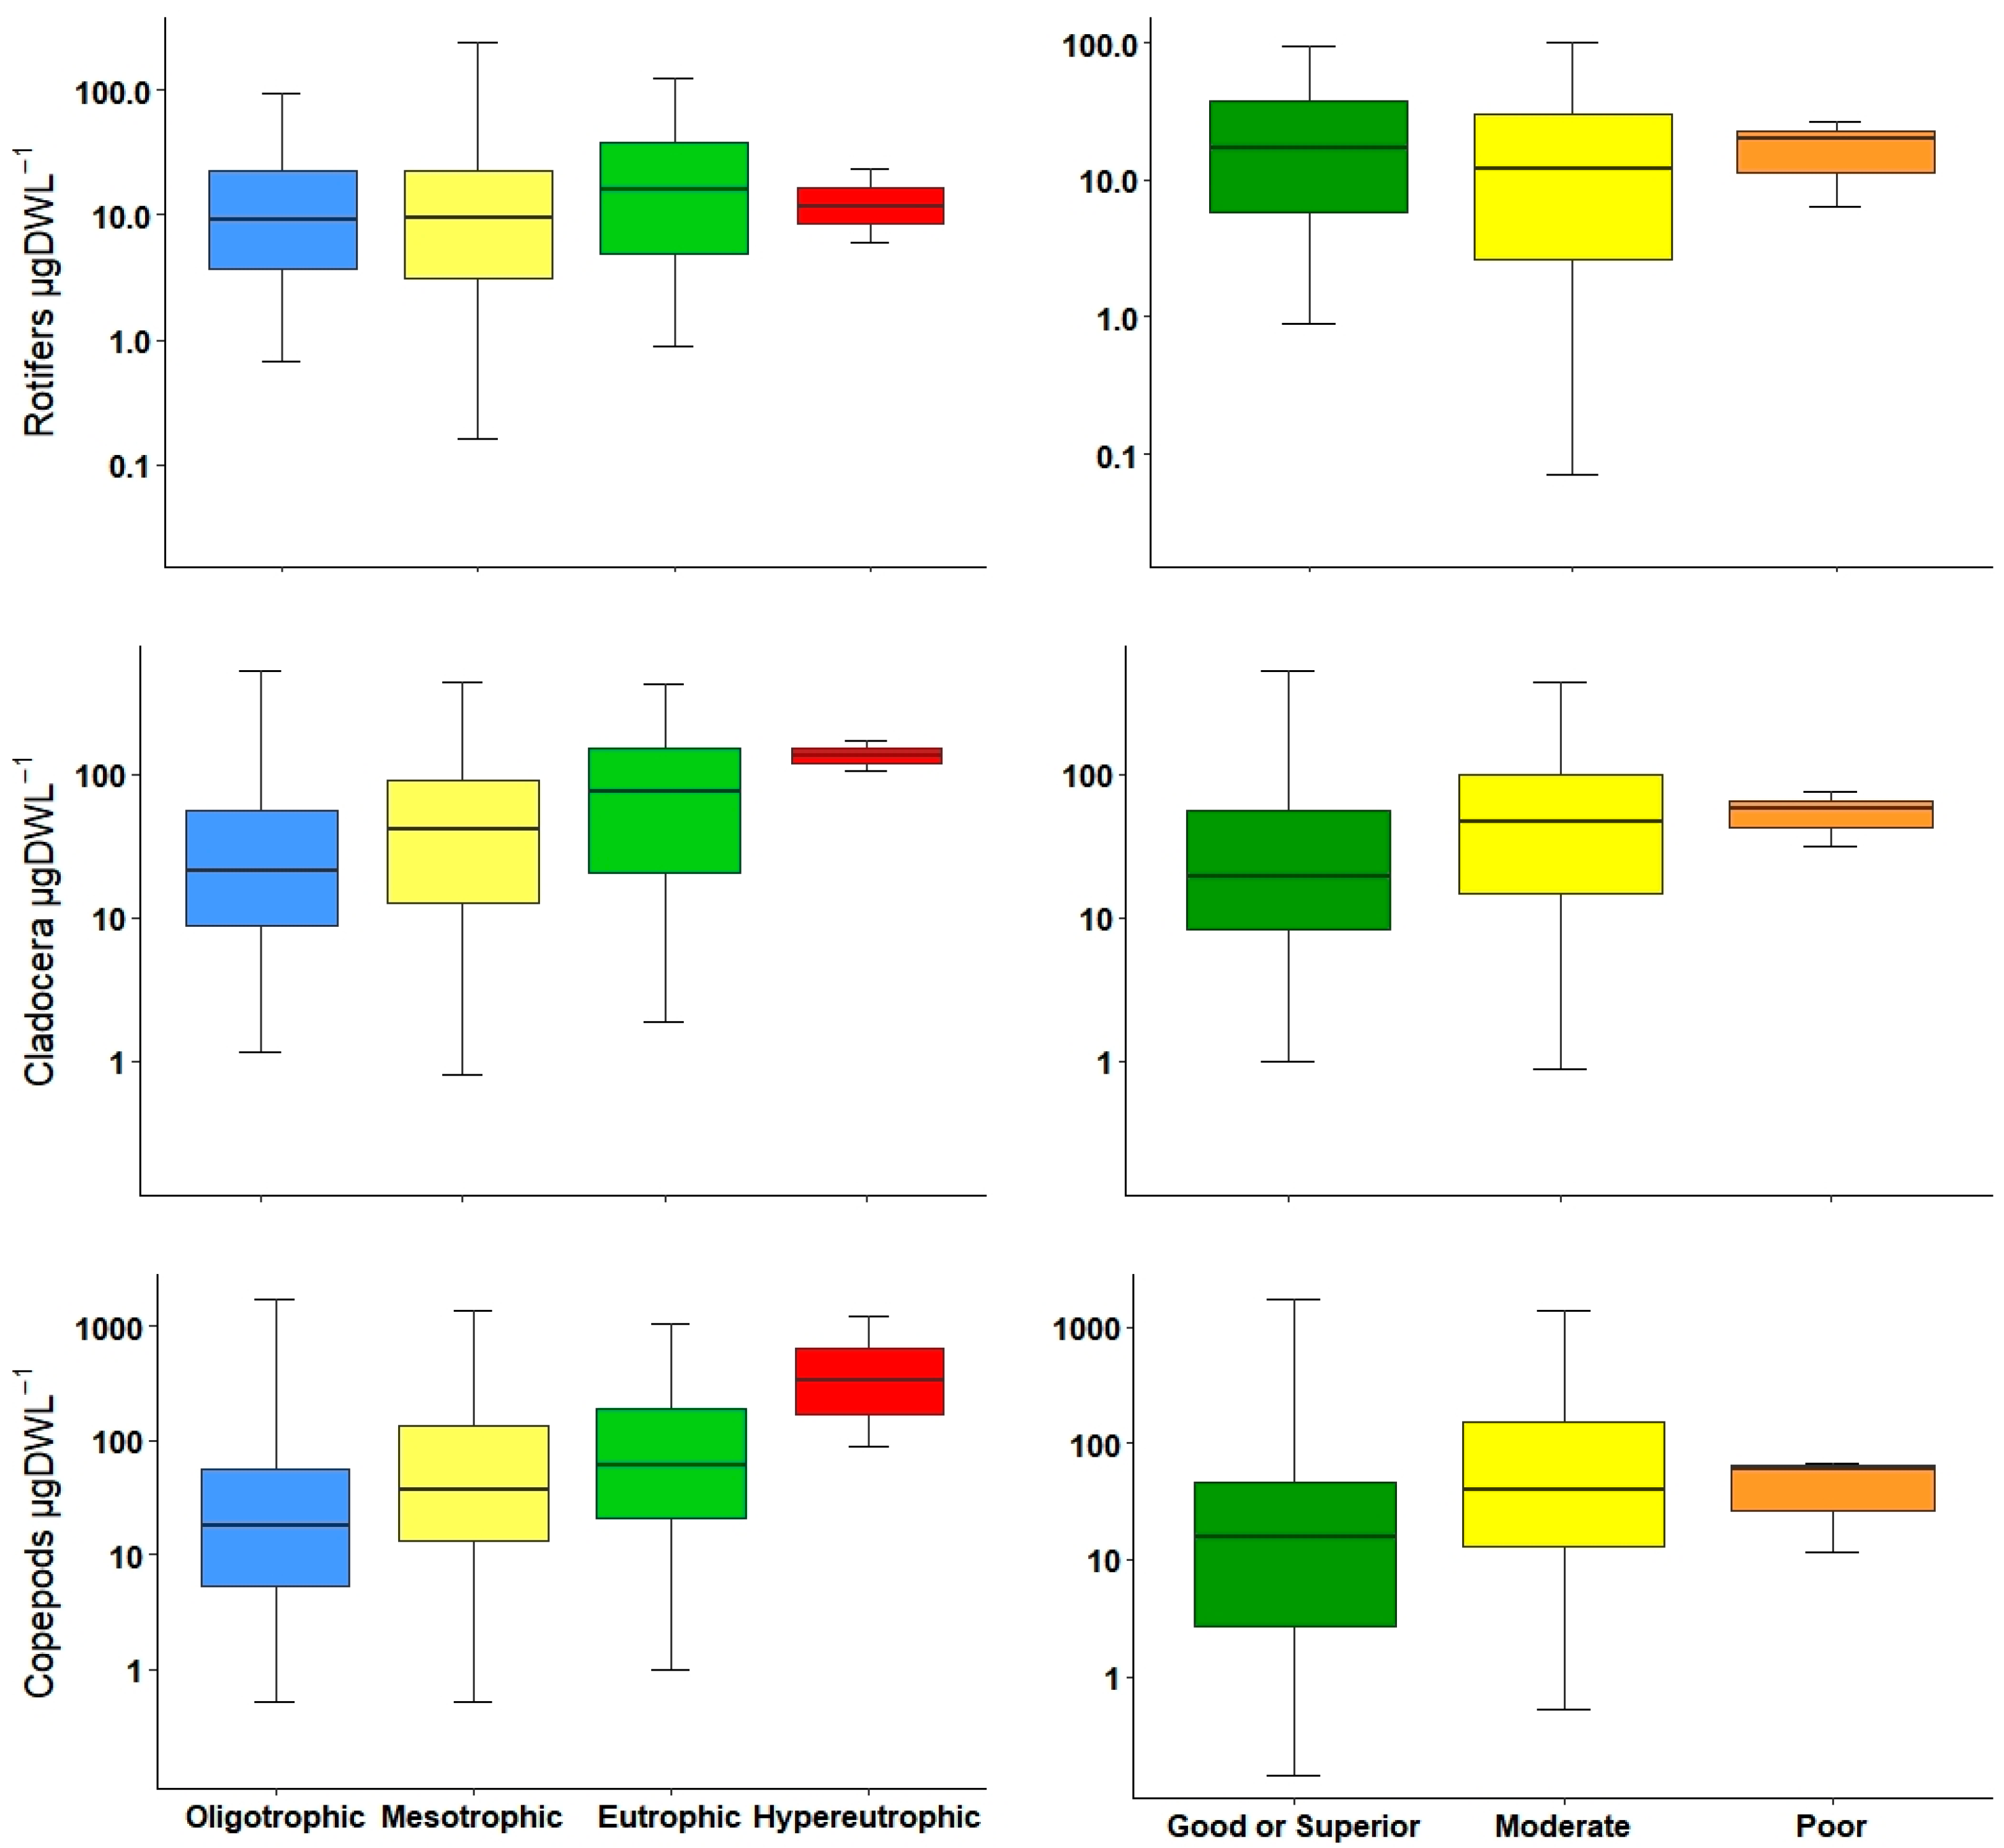
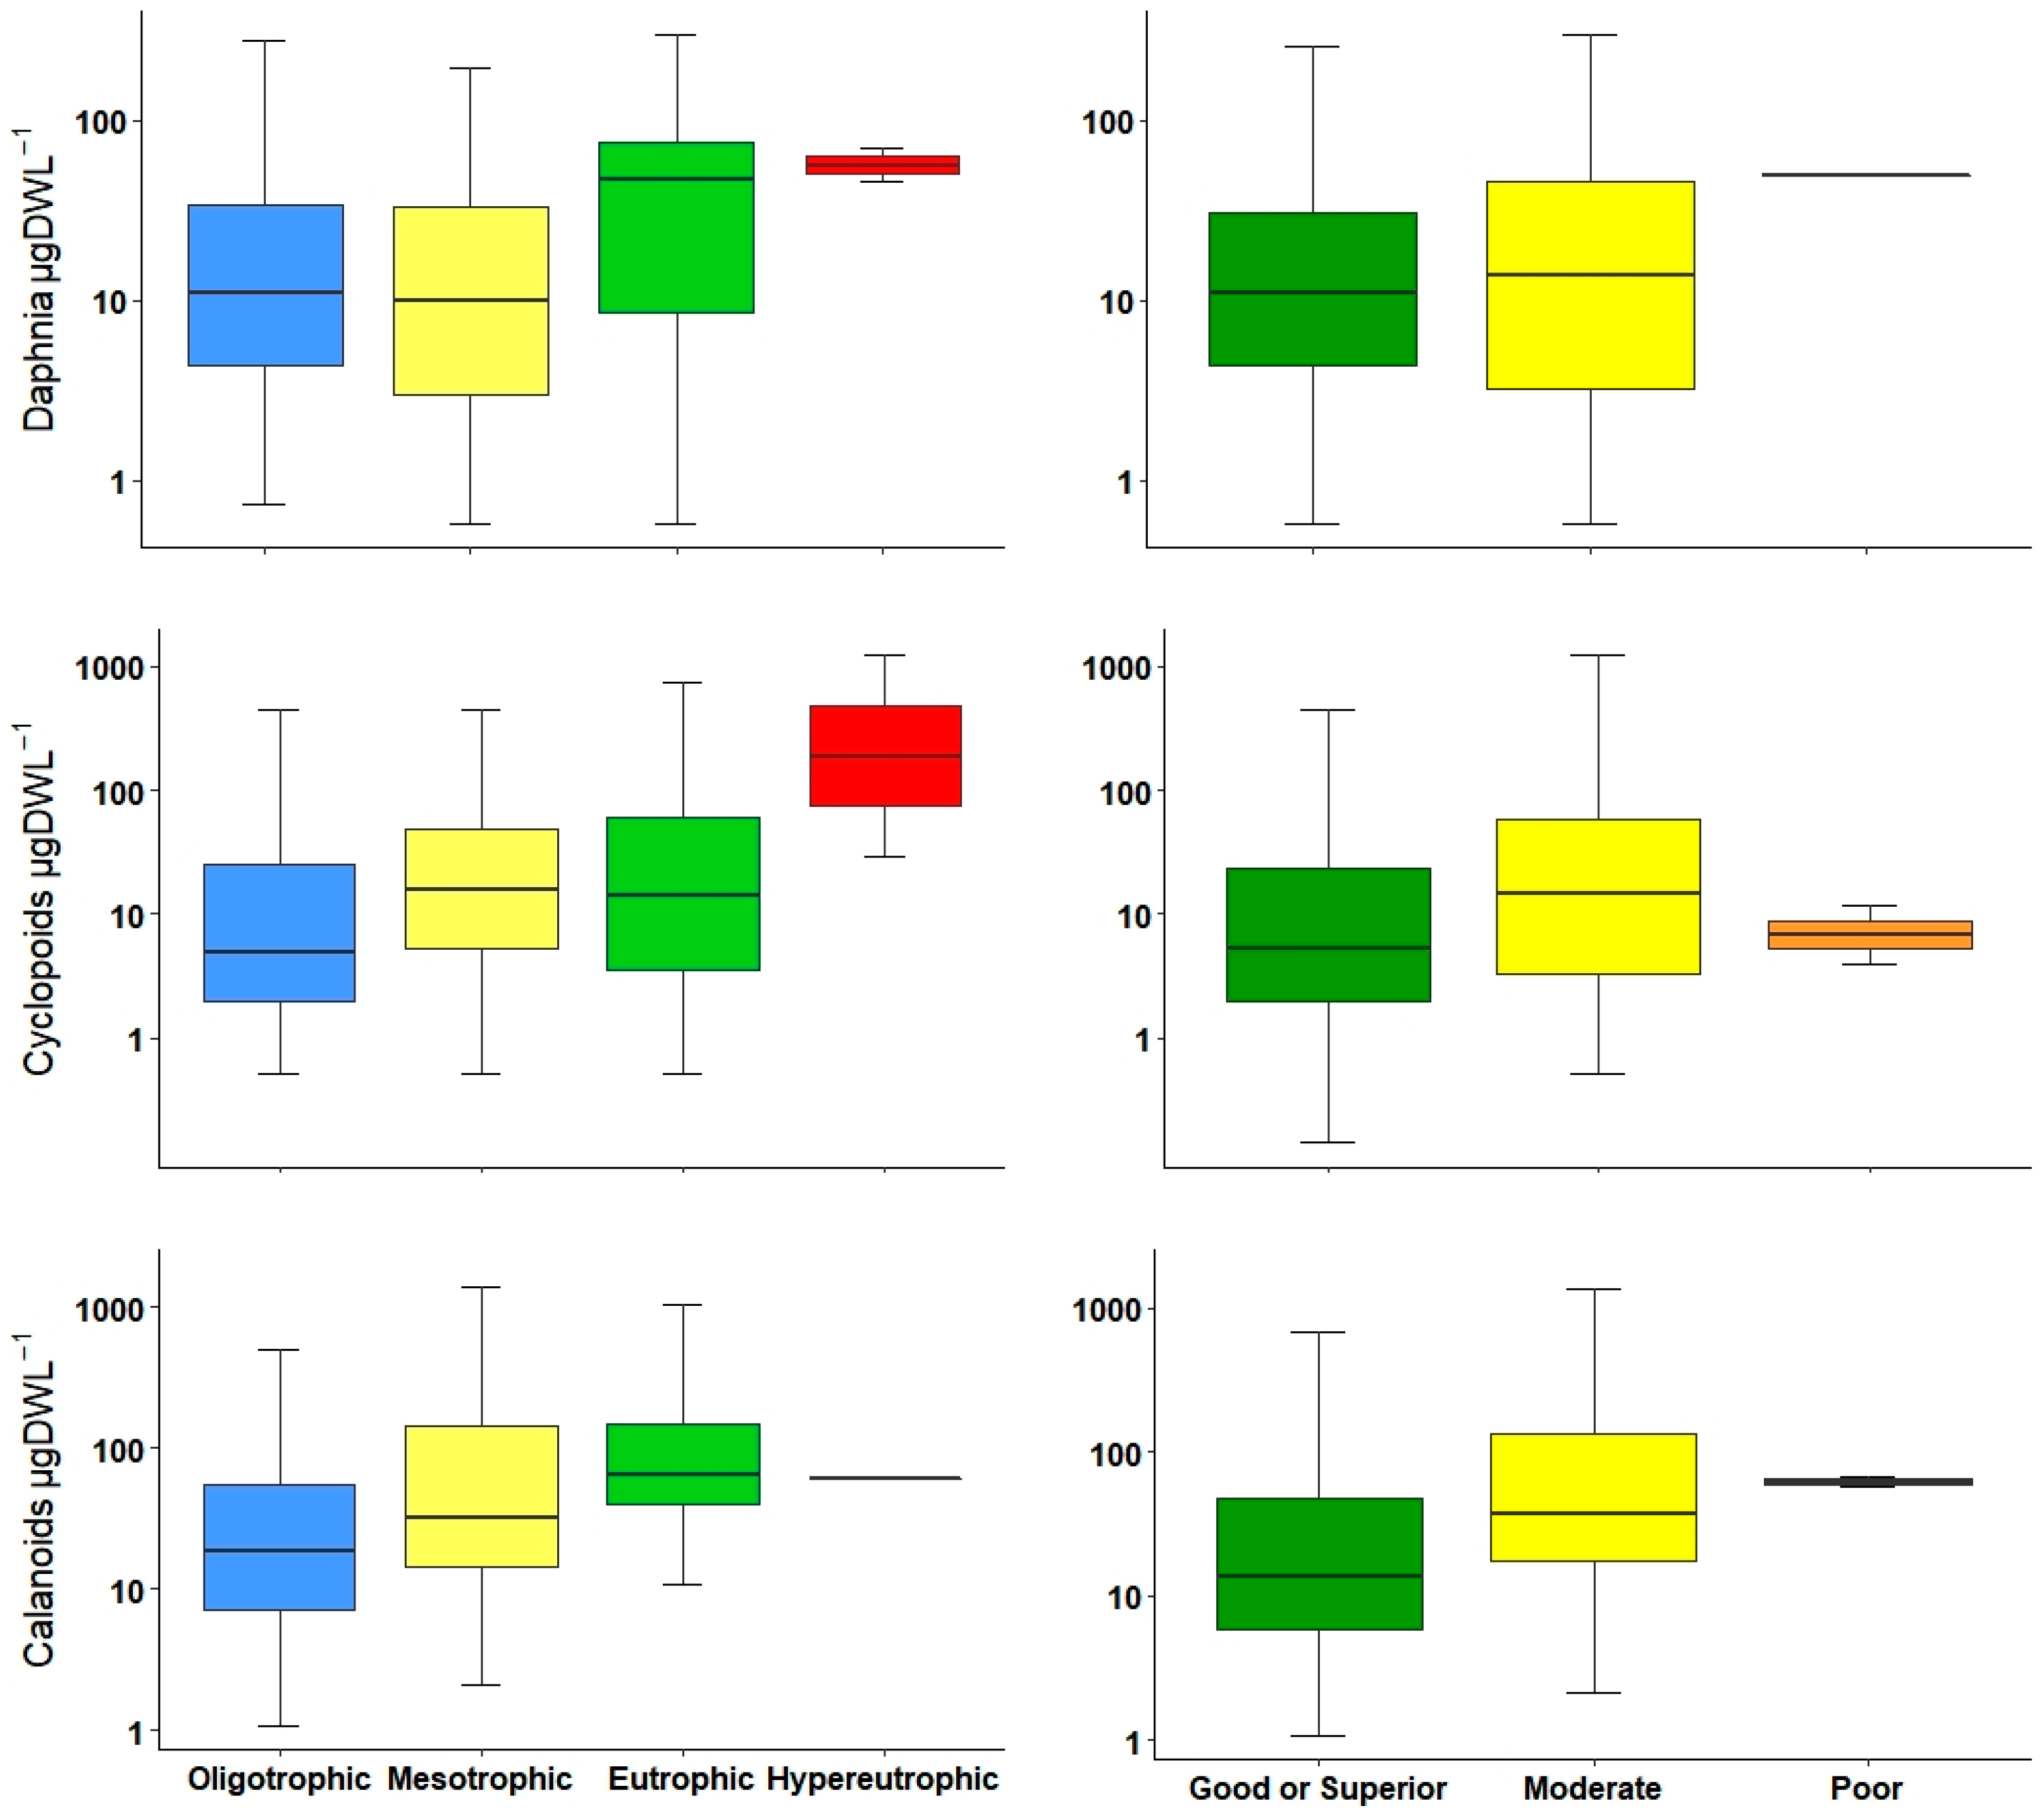
The crustacean index used in Polish lakes is the NCRU [32]; however, it is inclusive of all crustaceans in general. In our study, in order to detect possible variations, we decided to divide them into groups. In our results, calanoid copepod abundances and biomass increased marginally from oligotrophic to eutrophic systems, but normally, at high trophic status, calanoids decreased; for this reason, they are typically considered to be from oligotrophic waters [25,55]. Cyclopoids showed a considerable increment, especially inside eutrophic and hypereutrophic reservoirs; lately, their presence and the occurrence of Acanthocyclops species are used as indicators of eutrophic conditions in Mediterranean waterbodies [26,27,29,34]. For this study in general, the use of copepod metrics, including both calanoids and cyclopoids, resulted in the same correlation between environmental variables, and was a reliable indicator to differentiate between low and high productive waters. However, these metrics combined with the use of an indicator species could lead to a better water quality classification.
The Cladocera and daphnids metrics were very similar in that they were both effective differentiating among the trophic status levels; however, in ecological potential, only the Cladocera metric had the ability to detect between good and moderate levels. This lack of Daphnia sensitivity was probably because most reservoirs were classified as both good or superior and moderate, and had a wide value range in environmental variables such as TP and Chl-a. Another reason for the differences between metrics could be the presence or absence of Diaphanosoma spp. and Holopedium spp. as the dominant Cladocera inside reservoirs.
In several European waterbodies, there was a positive relationship between TP concentration and Daphnia spp. in different waterbodies; at higher TP concentration a biomass increase has been reported [54,59]. This is in accordance with our results: in lower trophic levels, daphnids abundance and biomass were lower, and there was an increase at higher levels. Furthermore, it is important to point out that within this group, there is a species that considered to be an indicator for both low (Daphnia longispina) and high eutrophic levels (Daphnia cucullata) [26,27,37]. These species were present only in reservoirs with low and high trophic status, respectively.
In eutrophic reservoirs, an increase in rotifers was detected in comparison with those of oligotrophic status [69]. These findings were in concurrence with our results; however, rotifer metrics had the lesser correlation with environmental variables, and they were not sensitive enough to indicate separation in trophic status or ecological levels compared to other metrics. Nevertheless, in natural lakes, this group is a useful tool to determine the trophic status using abundances [30,31] or biomass [31,33]. Moreover, not only biomass and abundances are related to trophic gradient, but several studies in natural and man-made waterbodies have pointed to the rotifer species as being good indicators of trophic status and water quality [22,26,27,29,35,37,70]; therefore, this group can provide valuable data and should not be overlooked.
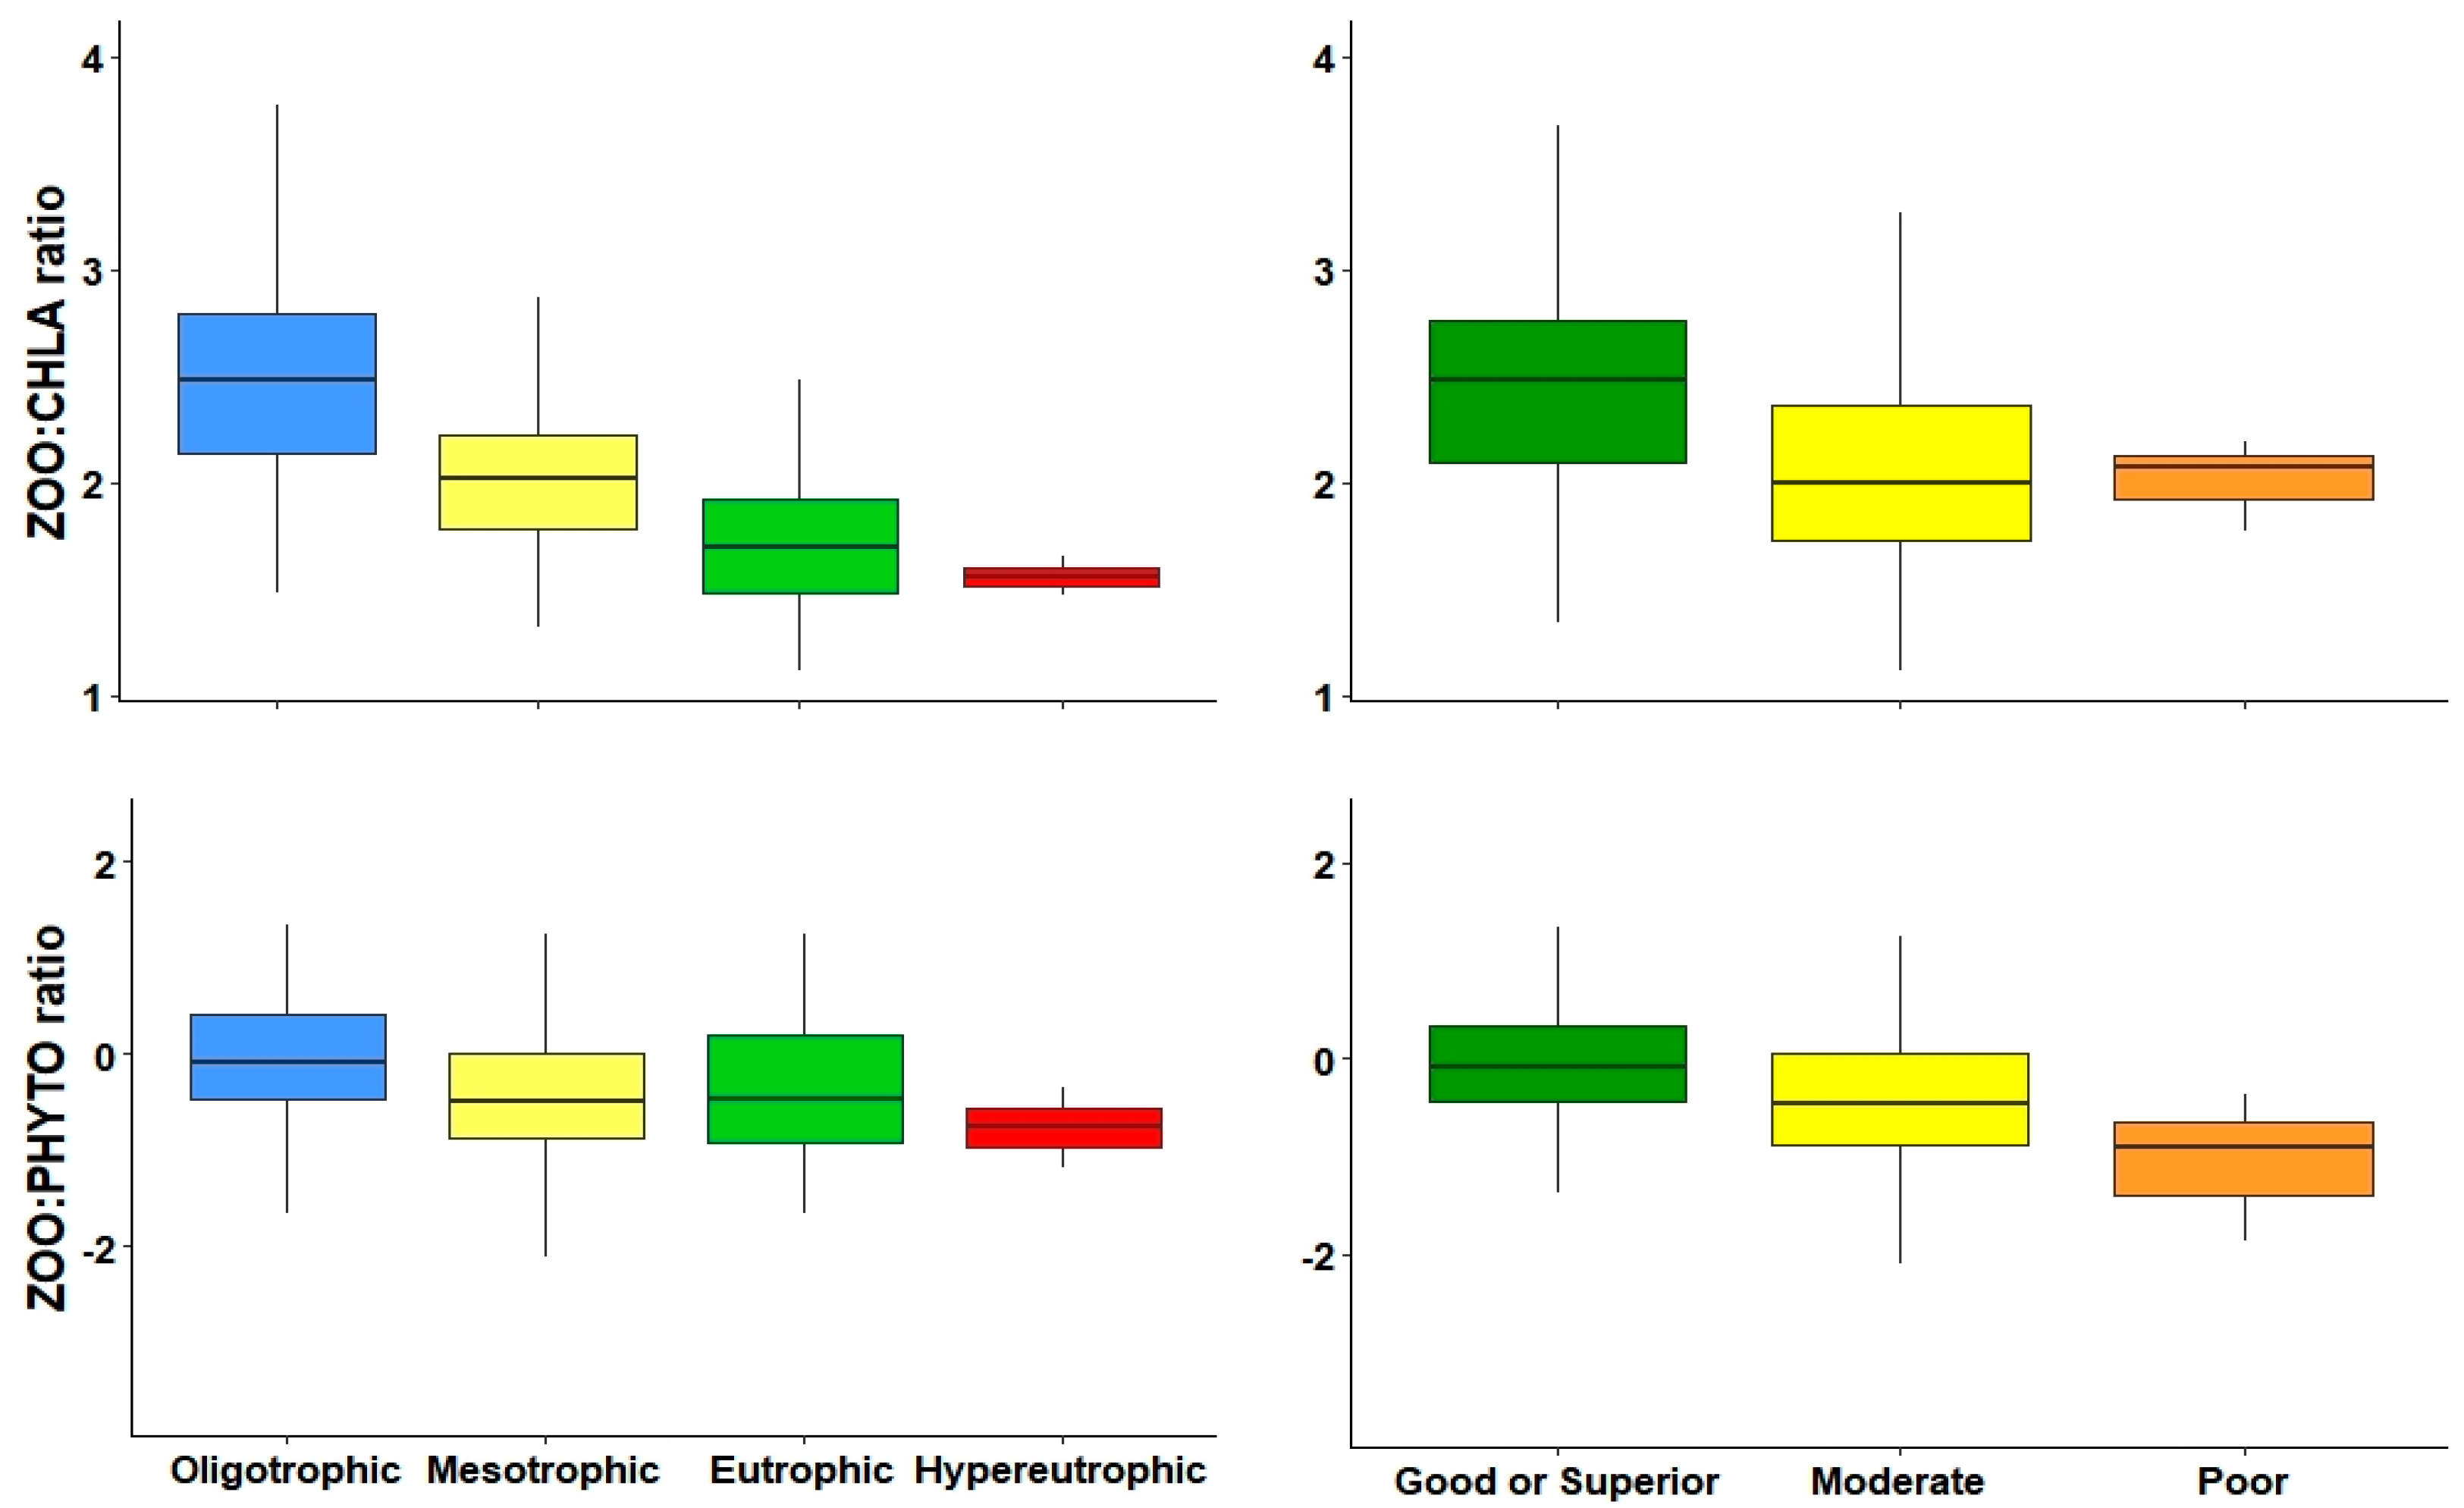
An indicator of the cascading effects that zooplankton have on phytoplankton is the ZOO:PHYTO ratio [8]. Previous studies in Danish lakes [55,59] and shallow sub-tropical lakes [71] indicate that this ratio decrease coincides with an increase in TP. Here, we recorded a slight downward trend in this ratio along TP increase, although, we did not find a significant correlation; this is in accordance with results obtained in the Jucar watershed [38]. These previous studies used the ZOO:PHYTO biomass, but, in our results, the use of biomass was not capable of differentiating between levels in trophic and ecological potential, whereas, the use of abundances could detect between low and high productive reservoirs.
A similar metric is the ZOO:CHLA ratio, using the measurement of phytoplankton production. In our study, the ZOO:CHLA ratio was very sensitive to changes in trophic gradient and, along with ZOO and CLAD, was the most effective metric differentiating most levels of both trophic state and ecological potential. They were also closely related to variables that determine water quality. An advantage of the ZOO:CHLA ratio is that it is not imperative that one be an expert zooplankton taxonomist, since it is only necessary to identify and count the major groups in general without reaching the species level, and Chl-a data can be obtained through any method to apply this metric.
The decrease in both ZOO:CHLA and ZOO:PHYTO metrics along the increase in the trophic gradient could be explained by bottom-up effect [72]; the abundance and biomass of phytoplankton can change due to several variables such as cyanobacterial blooms, typically during summertime in productive waters with high levels of TP, and the replacement of edible phytoplankton with inedible and low quality species. Fish exert an additional pressure on zooplankton, especially in warmer waters [54].
Zooplankton metrics such as density, biomass, large body size, cladocerans, and the ZOO:CHLA ratio can be used as good overall indicators to differentiate between trophic state and ecological potential levels. Metrics related to copepods, as well as their division in their orders, calanoids and cyclopoids, are especially sensible for distinguishing reservoirs with better water quality (such as oligotrophic from mesotrophic), trophic state, and good or higher from moderate in ecological potential.
The aim of the WFD was to bring European waterbodies up to good ecological levels. According to current research, most zooplankton metrics have been shown to be good indicators to differentiate between reservoirs that have good ecological potential and others. The integrative capacity of zooplankton with the environmental factors that determine the trophic state and the ecological potential, can give us a broader picture over time compared to phytoplankton. Due to their shorter lifespan, as well as their community composition, phytoplankton can change in a short time compared to zooplankton [73], and even under specific environmental pressures or blooms, the phytoplankton could not give data as accurate. Thus, the use of the different zooplankton metrics presented here, along with indicator species, can be used as a tool to determine the water’s quality. Zooplankton collection does not present a great impact on budget nor working time because it can be sampled in parallel with phytoplankton. Phytoplankton sampling is included in monitoring programs, hence, the use of both plankton components is reasonable, in addition to being complementary, and could give us more precise water quality information. Finally, as several authors have recently reported, zooplankton can be a good indicator to determine both trophic status and ecological potential. Therefore, we strongly recommend that zooplankton be incorporated as one more BQE within the Water Framework Directive.

Supplementary Materials

The following are available online at https://www.mdpi.com/article/10.3390/w13172382/s1, Table S1: Average physical and chemical data from reservoirs of the Ebro Watershed. Samples = number of years that a reservoir was sampled, Depth = reservoir maximum sampling depth, Volume = reservoir maximum volume, T = temperature, DO = dissolved oxygen, SD = Secchi disk depth, SS = duspend solids, Chl-a = chlorophyll a, TP = total phosphorus.

Author Contributions

Writing—Editing, M.E.M.-C., J.M.S. and E.V.; Conceptualization, methodology, E.V., J.M.S., X.S.-P. and M.D.S.; Investigation, M.E.M.-C., E.V. and J.M.S.; Field Work, X.S.-P., M.D.S., E.V., J.M.S. and M.E.M.-C.; Formal Analysis, M.E.M.-C. All authors have read and agreed to the published version of the manuscript.

Funding

This research was funded by Ebro Basin Authority contracts from 2010 to 2019.

Data Availability Statement

The data presented in this study are available on request from the corresponding author.

Acknowledgments

The first author thanks for doctoral scholarship financial support to CONACyT (447079). We are grateful to Ebro Basin Authority (Ministry of Ecological Transition of Spain Government) for support provided for the continuous sampling campaigns from 2010 to present day, without which it would have been impossible to obtain the data necessary for this study. We thank to Zahra Goodwin for English review. We thank Universitat de Valencia for their laboratory support, and the fieldwork team. Finally, we thank Olga Kramer for the chemical data and the laboratory work. In memoriam Professor Maria Rosa Miracle.

Conflicts of Interest

The authors declare no conflict of interest. The funders had no role in the design of the study; in the collection, analyses, or interpretation of data; in the writing of the manuscript, or in the decision to publish the results.

Appendix A

Table A1. Reservoir code, name, trophic status, ecological potential and location.
CodeReservoirAverage Trophic StatusAverage Ecological PotentialLocation
ALBAlbiñaOligo–MesotrophicModeratePais Vasco
ALLAllozOligotrophicGood–ModerateNavarra
ARDArdisaEutrophicModerateAragón
BALBalaguerMesotrophicGood or superiorCataluña
BARBarasonaOligotrophicGood or superiorAragón
BASBasercaOligotrophicGood or superiorAragón
BUBBúbalOligotrophicGood or superiorAragón
CALCalandaOligotrophicGood–ModerateAragón
CAMCamarasaOligotrophicGood or superiorCataluña
CANCanellesOligotrophicGood or superiorAragón
CASCaspeMesotrophicModerateAragón
CAVCavallersOligotrophicGood or superiorCataluña
CERCerecedaEutrophicModerateCastilla y León
CIUÇiuranaOligotrophicGood or superiorCataluña
COREl CortijoEutrophicModerateLa Rioja
CUEForadadaMesotrophicModerateAragón
EBREbroOligo–MesotrophicModerateCantabria
ESCEscalesOligotrophicGood or superiorAragón
ESREscarraOligotrophicGood or superiorAragón
ESTAlcañizMesotrophicGood–ModerateAragón
EUGEuguiOligotrophicGood or superiorNavarra
FLIFlixMesotrophicModerateCataluña
GALGallipuénMesotrophicModerateAragón
GRAEl GradoOligotrophicGood or superiorAragón
GUIGuiametsMesotrophicModerateCataluña
IRAIrabiaOligotrophicModerateNavarra
ITOItoizOligotrophicGood or superiorNavarra
LANLanuzaOligotrophicGood or superiorAragón
LECLechagoOligo–MesotrophicModerateAragón
LLALlausetOligotrophicGood or superiorAragón
LOTLa LotetaMeso–EutrophicModerateAragón
MAEMaideveraMesotrophicModerateAragón
MANMansillaOligotrophicGood–ModerateLa Rioja
MARMargalefMesotrophicModerateCataluña
MEDMedianoOligotrophicGood or superiorAragón
MEQMequinenzaOligo–MesotrophicModerateAragón
MEZMezalochaMeso–EutrophicModerateAragón
MOAMontearagonOligotrophicGood–ModerateAragón
MONVicaríasMesotrophicModerateCastilla y León
MOVMonevaMeso–EutrophicModerateAragón
OLIOlianaMesotrophicModerateCataluña
ORTOrtigosaOligotrophicGood or superiorLa Rioja
PAJPajaresOligotrophicGood or superiorLa Rioja
PEÑLa PeñaMesotrophicModerateAragón
PENPenaOligotrophicGood or superiorAragón
PUEPuentelarraMesotrophicModerateCastilla y León
RIARialbMesotrophicModerateCataluña
RIBRibarrojaEutrophicModerateCataluña
SABSabiñanigoOligotrophicGood or superiorAragón
SANSanta AnaOligotrophicGood or superiorCataluña
SLOSan LorenzoMesotrophicGood or superiorCataluña
SOBSobrónMeso–EutrophicModerateCastilla y León
SOPSopeiraOligotrophicGood or superiorAragón
SOTSotoneraMesotrophicModerateAragón
STOSantoleaOligotrophicGood or superiorAragón
TALTalarnOligo–MesotrophicGood or superiorCataluña
TERTerradetsMesotrophicModerateCataluña
TORLas TorcasOligo–MesotrophicGood or superiorAragón
TRATranqueraMesotrophicModerateAragón
ULLUllivariOligo–MesotrophicGood–ModeratePais Vasco
URDUrdalurOligotrophicGood or superiorNavarra
URRUrrunagaOligo–MesotrophicModeratePais Vasco
UTCUtexa secaEutrophicModerateCataluña
VADVadielloOligo–MesotrophicGood or superiorAragón
VALValEutrophicModerateAragón
YESYesaOligotrophicGood–ModerateNavarra

Appendix B

Table A2. Zooplankton species present in the Ebro watershed.
Rotifera
Class BdelloideaC. unicornisL. puriformisP. triloba
BdelloidsConochilus sp. L. stenroosiProales sp.
Class MonogonontaDicranophorus sp. L. stichaeaPtygura sp.
Anuraeopsis fissaEncentrum sp. L. tenuisetaSquatinella rostrum
Ascomorpha ecaudisEosphora sp. Lecane sp. Synchaeta grandis
A. ovalisEuchlanis dilatataLepadella acuminataS. kitina
A. saltansFilinia longisetaL. ovalisS. longipes
Ascomorpha sp. F. terminalisL. patellaS. oblonga
Asplanchna girodiGastropus styliferL. rhomboidesS. pectinata
A. priodontaHexarthra fennicaLophocaris salpinaS. stylata
A. sieboldiH. intermediaL. oxysternonS. tremula
Asplanchna sp. H. miraMacrochaetus subquadratusSynchaeta sp.
Brachionus angularisH. oxyurisMonommata appendiculataTestudinella incisa
B. bidentataHexarthra sp. Mytilina mucronataT. mucronata
B. calyciflorusKellicottia longispinaNotholca acuminataT. patina
B. dimidiatusKeratella cochlearisN. squamulaTrichocerca cylindrica
B. havanaensisK. cochlearis tectaNotommata allantoisT. gracilis
B. plicatilisK. hiemalisN. copeusT. inermis
B. quadridentatusK. quadrataPloesoma hudsoniT. insignis
B. urceolarisK. tropicaP. lenticulareT. pusilla
Cephalodella gibbaLecane aculeataP. truncatumT. similis
C. stenroosiL. bullaPolyarthra dolichopteraT. tenuinor
Cephalodella sp. L. claraP. eurypteraT. tigris
Collotheca pelagicaL. closterocercaP. longiremisTrichocerca sp.
Collotheca sp. L. cornutaP. luminosaTrichotria pocillum
Colurella colurusL. flexilisP. majorT. tetractis
C. obtusaL. furcataP. minorTripleuchlanis plicata
C. uncinataL. inermisPolyarthra vulgaris
Conochilus dossuariusL. lunaPolyarthra sp.
C. natansL. lunarisPhompolyx sulcata
Crustacea
Suborder Cladocera
Alona affinisD. parvulaCopepodaOrder Harpacticoida
A. guttataD. pulicariaOrder CyclopoidaHarpacticoids
A. quadrangularisDaphnia roseaAcanthocyclops americanus
A. rectangulaDiaphanosoma brachyurumA. robustusOrder Poecilostomatoida
Alona sp. D. lacustrisCyclops abyssorumErgasilus sieboldi
Alonella exiguaD. mongolianumC. lacustrisNeoergasilus japonicus
A. nanaDiaphanosoma sp. C. vicinus
Bosmina longirostrisHolopedium gibberumCyclops sp. Mollusca
Ceriodaphnia dubiaIlyocryptus sordidusEucyclops serrulatusClass Bivalvia
C. laticaudataLeydigia acanthocercoidesEucyclops sp. Dreissena polymorpha
C. pulchellaL. leydigiMacrocyclops albidus
C. quadrangulaL. quadrangularisThermocyclops dybowskii
Chydorus sphaericusMacrothrix hirsuticornisTropocyclops prasinus
Daphnia cucullataM. laticornis
D. curvirostrisMoina micruraOrder Calanoida
D. galeataOxyurella tenuicaudisCopidodiaptomus numidicus
D. longispinaPhrixura leeiEudiaptomus vulgaris
D. magnaSida crystalinaNeolovenula alluaudi

References

  1. Grantham, T.E.; Figueroa, R.; Prat, N. Water management in mediterranean river basins: A comparison of management frameworks, physical impacts, and ecological responses. Hydrobiologia 2013, 719, 451–482. [Google Scholar] [CrossRef]
  2. Schindler, D.W. The dilemma of controlling cultural eutrophication of lakes. Proc. R. Soc. B 2012, 279, 4322–4333. [Google Scholar] [CrossRef] [Green Version]
  3. Moss, B. Allied attack: Climate change and eutrophication. Inland Waters 2012, 1, 101–105. [Google Scholar] [CrossRef] [Green Version]
  4. Kosten, S.; Huszar, V.M.; Bécares, E.; Costa, S.; van Donk, E.; Hansson, L.; Lurling, M.F.L.L.W. Warmer climates boost cyanobacterial dominance in shallow lakes. Glob. Chang. Biol. 2012, 18, 118–126. [Google Scholar] [CrossRef]
  5. Directive, W.F. Directive 2000/60/EC of the European parliament and of the council of establishing a framework for community action in the field of water policy. Off. J. Eur. Communities 2000, 327, 1–72. [Google Scholar]
  6. Moss, B. Shallow lakes, the water framework directive and life. What should it all be about? Hydrobiologia 2007, 584, 381–394. [Google Scholar] [CrossRef]
  7. Caroni, R.; Irvine, K. The potential of zooplankton communities for ecological assessment of lakes: Redundant concept or political oversight? In Biology and Environment: Proceedings of the Royal Irish Academy; JSTOR: New York, NY, USA, 2010; pp. 35–53. [Google Scholar] [CrossRef]
  8. Jeppesen, E.; Nõges, P.; Davidson, T.A.; Haberman, J.; Nõges, T.; Blank, K.; Torben, L.; Lauridsen, T.L.; Søndergaard, M.; Sazer, C.; et al. Zooplankton as indicators in lakes: A scientific-based plea for including zooplankton in the ecological quality assessment of lakes according to the European Water Framework Directive (WFD). Hydrobiologia 2011, 676, 279–297. [Google Scholar] [CrossRef]
  9. Haberman, J.; Haldna, M. Indices of zooplankton community as valuable tools in assessing the trophic state and water quality of eutrophic lakes: Long term study of Lake Vőrtsjärv. J. Limnol. 2014, 73, 263–273. [Google Scholar] [CrossRef] [Green Version]
  10. Lampert, W.; Sommer, U. Limnoecology. In The Ecology of Lakes and Streams; Oxford University Press: New York, NY, USA, 1997; p. 382. [Google Scholar]
  11. Carpenter, S.R.; Kitchell, J.F.; Hodgson, J.R. Cascading trophic interactions and lake productivity. BioScience 1985, 35, 634–639. [Google Scholar] [CrossRef]
  12. Sommer, U. Trophic cascades in marine and freshwater plankton. Int. Rev. Hydrobiol. 2008, 93, 506–516. [Google Scholar] [CrossRef]
  13. Naselli-Flores, L.; Rossetti, G. Fifty years after the homage to santa rosalia: Old and new paradigms on biodiversity in aquatic ecosystems. In Santa Rosalia 50 Years on Developments in Hydrobiology; Springer: Cham, Switzerland, 2010; Volume 213, p. 246. [Google Scholar]
  14. Dodson, S.I.; Newman, A.L.; Will-Wolf, S.; Alexander, M.L.; Woodford, M.P.; Van Egeren, S. The relationship between zooplankton community structure and lake characteristics in temperate lakes (Northern Wisconsin, USA). J. Plankton Res. 2009, 31, 93–100. [Google Scholar] [CrossRef] [Green Version]
  15. Bonecker, C.; Simões, N.; Minte-Vera, C.; Lansac-Tôha, F.; Velho, L.; Agostinho, A. Temporal changes in zooplankton species diversity in response to environmental changes in an alluvial valley. Limnologica 2013, 43, 114–121. [Google Scholar] [CrossRef]
  16. Anas, M.U.; Scott, K.A.; Wissel, B. Suitability of presence vs. absence indicator species to characterize stress gradients: Lessons from zooplankton species of boreal lakes. Ecol. Ind. 2013, 30, 90–99. [Google Scholar] [CrossRef]
  17. Kuczyńska-Kippen, N.; Špoljar, M.; Zhang, C.; Pronin, M. Zooplankton functional traits as a tool to assess latitudinal variation in the northern-southern temperate European regions during spring and autumn seasons. Ecol. Ind. 2020, 117, 106629. [Google Scholar] [CrossRef]
  18. Čeirāns, A. Zooplankton indicators of trophy in Latvian lakes. Acta Univ. Latv. Biol. 2007, 723, 61–69. [Google Scholar]
  19. Brito, S.L.; Maia-Barbosa, P.M.; Pinto-Coelho, R.M. Zooplankton as an indicator of trophic conditions in two large reservoirs in Brazil. Lakes Reserv. Res. Manag. 2011, 16, 253–264. [Google Scholar] [CrossRef]
  20. Tasevska, O.; Špoljar, M.; Gušeska, D.; Kostoski, G.; Patcheva, S.; Veljanoska, S.E. Zooplankton in ancient and oligotrophic Lake Ohrid (Europe) in association with environmental variables. Croat. J. Fish. 2017, 75, 95–103. [Google Scholar] [CrossRef]
  21. Pociecha, A.; Bielańska-Grajner, I.; Kuciel, H.; Wojtal, A.Z. Is zooplankton an indicator of the water trophic level in dam reservoirs? Oceanol. Hydrobiol. Stud. 2018, 47, 288–295. [Google Scholar] [CrossRef]
  22. Duggan, C.; Green, J.D.; Thomasson, K. Do rotifers have potential as bioindicators of lake trophic state? Int. Ver. Theor. Angew. Limnol. Verh. 2001, 27, 3497–3502. [Google Scholar] [CrossRef]
  23. Boix, D.; Gascón, S.; Sala, J.; Martinoy, M.; Gifre, J.; Quintana, X.D. A new index of water quality assessment in Mediterranean wetlands based on crustacean and insect assemblages: The case of Catalunya (NE Iberian Peninsula). Aquat. Conserv. Mar. Freshw. Ecosyst. 2005, 15, 635–651. [Google Scholar] [CrossRef]
  24. Cheng, G.; Dalton, C.; Taylor, D. Cladocera as indicators of trophic state in Irish lakes. J. Paleolimnol. 2010, 44, 465–481. [Google Scholar] [CrossRef]
  25. Pinto-Coelho, R.M.; Pinel-Alloul, B.; Méthot, G.; Havens, K.E. Crustacean zooplankton in lakes and reservoirs of temperate and tropical regions: Variations with trophic status. Can. J. Fish. Aquat. Sci. 2005, 61, 348–361. [Google Scholar] [CrossRef] [Green Version]
  26. Montagud, D.; Soria, J.M.; Soria-Perpiña, X.; Vicente, E. A comparative study of four indexes based on zooplankton as trophic state indicators in reservoirs. Limnetica 2019, 38, 291–302. [Google Scholar] [CrossRef]
  27. Muñoz-Colmenares, M.E.; Soria, J.M.; Vicente, E. Can zooplankton species be used as indicators of trophic status and ecological potential of reservoirs? Aquat. Ecol. 2021, in press. [Google Scholar] [CrossRef]
  28. Almeida, R.; Formigo, N.E.; Sousa-Pinto, I.; Antunes, S.C. Contribution of zooplankton as a biological element in the assessment of reservoir water quality. Limnetica 2020, 39, 245–261. [Google Scholar] [CrossRef]
  29. García-Chicote, J.; Armengol, X.; Rojo, C. Zooplankton species as indicators of trophic state in reservoirs from Mediterranean river basins. Inland Waters 2019, 9, 113–123. [Google Scholar] [CrossRef]
  30. May, L.; O’Hare, M. Changes in rotifer species composition and abundance along a trophic gradient in Loch Lomond, Scotland, UK. Hydrobiologia 2005, 546, 397–404. [Google Scholar] [CrossRef]
  31. Ejsmont-Karabin, J. The usefulness of zooplankton as lake ecosystem indicators: Rotifer trophic state index. Pol. J. Ecol. 2012, 60, 339–350. [Google Scholar]
  32. Ejsmont-Karabin, J.; Karabin, A. The suitability of zooplankton as lake ecosystem indicators: Crustacean trophic state index. Pol. J. Ecol. 2013, 61, 561–573. [Google Scholar]
  33. Ochocka, A.; Pasztaleniec, A. Sensitivity of plankton indices to lake trophic conditions. Environ. Monit. Assess. 2016, 188, 662. [Google Scholar] [CrossRef] [Green Version]
  34. Kehayias, G.; Doulka, E. Trophic State Evaluation of a Large Mediterranean Lake Utilizing Abiotic and Biotic Elements. J. Environ. Prot. 2014, 5, 17–28. [Google Scholar] [CrossRef] [Green Version]
  35. Stamou, G.; Katsiapi, M.; Moustaka-Gouni, M.; Michaloudi, E. Trophic state assessment based on zooplankton communities in Mediterranean lakes. Hydrobiologia 2019, 844, 83–103. [Google Scholar] [CrossRef]
  36. Stamou, G.; Katsiapi, M.; Moustaka-Gouni, M.; Michaloudi, E. The neglected zooplankton communities as indicators of ecological water quality of Mediterranean lakes. Limnetica 2021, 40, 359–373. [Google Scholar] [CrossRef]
  37. Geraldes, A.M.; Pasupuleti, R. Zooplankton: A valuable environmental indicator tool in reservoir ecological management? Asian J. Environ. Ecol. 2016, 1, 1–9. [Google Scholar] [CrossRef] [Green Version]
  38. García-Chicote, J.; Armengol, X.; Rojo, C. Zooplankton abundance: A neglected key element in the evaluation of reservoir water quality. Limnologica 2018, 69, 46–54. [Google Scholar] [CrossRef]
  39. Vicente, E.; Hoyos, C.; Sánchez, P.; Cambra, J. Protocolo de Muestreo y Análisis para Fitoplancton; Ministerio de Agricultura, Alimentación y Medio Ambiente: Madrid, España, 2005.
  40. Shoaf, W.T.; Lium, B.W. Improved extraction of chlorophyll a and b from algae using dimethyl sulphoxide. Limnol. Oceanogr. 1976, 21, 926–928. [Google Scholar] [CrossRef]
  41. APHA. Standard Methods for the Examination of Water and Wastewater, 20th ed.; American Public Health Association: Washington, DC, USA, 1998. [Google Scholar]
  42. Carlson, R.E. A trophic state index for lakes. Limnol. Oceanogr. 1977, 22, 361–369. [Google Scholar] [CrossRef] [Green Version]
  43. Catalan, J.; Ventura, M. Desenvolupament d´un Índex Integral de Qualitat Ecológica Iregionalizació Ambiental dels Sistemes Lacustres de Catalunya; Agència Catalana de l´Aigua: Barcelona, España, 2003.
  44. Confederación Hidrográfica Del Ebro. Establecimiento de una Metodología para el Seguimiento del Potencial vs. Estado Trófico de la Cuenca del Ebro; Confederación Hidrográfica Del Ebro: Zaragoza, España, 2016; p. 212. [Google Scholar]
  45. Miracle, M.R.; Vicente, E. Vertical distribution and rotifer concentrations in the chemocline of meromictic lakes. Hydrobiologia 1983, 104, 259–267. [Google Scholar] [CrossRef]
  46. Koste, W. Rotatoria. In Die Rädertiere Mitteleuropas; Borntraeger: Berlin, Germany, 1978; p. 672. [Google Scholar]
  47. Nogrady, T.; Segers, H. Rotifera 6: Asplanchnidae, Gastropodidae, Linfiidae, Microcodidae, Synchaetidae, Trochosphaeridae and Filinia. In Guides to the Identification of the Microinvertebrates of the Continental Waters of the World; Dumont, H., Nogrady, T., Eds.; SPB Academic Publishing BV: Amsterdam, The Netherlands, 2002; p. 264. [Google Scholar]
  48. Ruttner-Kolisko, A. Plankton Rotifers: Biology and Taxonomy; Schweizerbart: Stuttgart, Germany, 1974; p. 146. [Google Scholar]
  49. Alonso, M. Crustacea, Branchiopoda. In Serie Fauna Ibérica; Museo Nacional De Ciencias Naturales CSIC: Madrid, Spain, 1996; Volume 7, p. 486. [Google Scholar]
  50. Błedzki, L.A.; Rybak, J.I. Freshwater Crustacean Zooplankton of Europe Cladocera & Copepoda (Calanoida, Cyclopoida). In Key to Species Identification, with Notes on Ecology, Distribution, Methods and Introduction to Data Analysis; Springer International Publishing: New York, NY, USA, 2016; p. 918. [Google Scholar]
  51. Ruttner-Kolisko, A. Suggestions for biomass calculation of plankton rotifers. Arch. Hydrobiol. 1977, 8, 71–76. [Google Scholar]
  52. Dumont, H.J.; Van Der Velde, I.; Dumont, S. The dry weight estimate of biomass in a selection of Cladocera, Copepoda and Rotifera from the plankton, periphyton and benthos of continental waters. Oecologia 1975, 19, 75–97. [Google Scholar] [CrossRef]
  53. Culver, D.A.; Boucherle, M.; Bean, D.J.; Fletcher, J.W. Biomass of freshwater crustacean zooplankton from length- weight regressions. Can. J. Fish. Aquat. Sci. 1985, 42, 1380–1390. [Google Scholar] [CrossRef]
  54. Gyllström, M.; Hansson, L.; Jeppesen, E.; Criado, F.; Gross, E.; Irvine, K.; Kairesalo, T.; Kornijów, R.; Miracle, M.R.; Nykänen, M.; et al. The role of climate in shaping zooplankton communities of shallow lakes. Limnol. Oceanogr. 2005, 50, 2008–2021. [Google Scholar] [CrossRef] [Green Version]
  55. Jeppesen, E.; Jensen, J.P.; Søndergaard, M.; Lauridsen, T.L.; Landkildehus, F. Trophic structure, species richness and biodiversity in Danish Lakes: Changes along a phosphorus gradient. Freshw. Biol. 2000, 45, 201–218. [Google Scholar] [CrossRef]
  56. R Core Team. R: A Language and Environment for Statistical Computing; R Foundation for Statistical Computing: Vienna, Austria, 2020. [Google Scholar]
  57. Kuczyńska-Kippen, N. The distribution of rotifers (Rotifera) within a single Myriophyllum bed. Hydrobiologia 2003, 506, 327–331. [Google Scholar] [CrossRef]
  58. Brucet, S.; Boix, D.; Quintana, X.D.; Jensen, E.; Nathansen, L.W.; Trochine, C.; Meerhoff, M.; Gascón, S.; Jeppesena, E. Factors influencing zooplankton size structure at contrasting temperatures in coastal shallow lakes: Implications for effects of climate change. Limnol. Oceanogr. 2010, 55, 1697–1711. [Google Scholar] [CrossRef] [Green Version]
  59. Jeppesen, E.; Jensen, J.P.; Jensen, C.; Faafeng, B.; Hessen, D.O.; Søndergaard, M.; Lauridsen, T.; Brettum, P.; Christoffersen, K. The Impact of Nutrient State and Lake Depth on Top-down Control in the Pelagic Zone of Lakes: A Study of 466 Lakes from the Temperate Zone to the Arctic. Ecosystems 2003, 6, 313–325. [Google Scholar] [CrossRef]
  60. Jeppesen, E.; Jensen, J.P.; Sondergaard, M.; Fenger-Gron, M.; Bramm, M.E.; Sandby, K.; Møller, P.H.; Rasmussen, H.U. Impact of fish predation on cladoceran body weight distribution and zooplankton grazing in lakes during winter. Freshw. Biol. 2004, 49, 432–447. [Google Scholar] [CrossRef]
  61. Moreno-Ostos, E.; Palomino-Torres, R.L.; Escot, C.; Blanco, J.M. Planktonic metabolism in a Mediterranean reservoir during a near-surface cyanobacterial bloom. Limnetica 2016, 35, 117–130. [Google Scholar] [CrossRef]
  62. Engström, J.; Viherluoto, M.; Viitasalo, M. Effects of toxic and nontoxic cyanobacteria on grazing, zooplanktivory and survival of the mysid shrimp Mysis mixta. J. Exp. Mar. Biol. Ecol. 2001, 257, 269–280. [Google Scholar] [CrossRef]
  63. Lampert, W. Laboratory studies on zooplankton–cyanobacterial interactions. N. Z. J. Mar. Freshw. Res. 1987, 21, 483–490. [Google Scholar] [CrossRef]
  64. Nandini, S.; Zamora-Barrios, C.A.; Sarma, S.S.S. A Long-Term Study on the Effect of Cyanobacterial Crude Extracts from Lake Chapultepec (Mexico City) on Selected Zooplankton Species. Environ. Toxicol. Chem. 2020, 39, 2409–2414. [Google Scholar] [CrossRef]
  65. Langeland, A. Biomanipulation development in Norway. Hydrobiologia 1990, 200, 535–540. [Google Scholar] [CrossRef]
  66. Ger, K.A.; Hansson, L.-A.; Lürling, M. Understanding cyanobacteria–zooplankton interactions in a more eutrophic world. Freshw. Biol. 2014, 59, 1783–1798. [Google Scholar] [CrossRef] [Green Version]
  67. Sun, X.X.; Tao, M.; Qin, B.Q.; Qi, M.; Niu, Y.; Zhang, J.; Ma, Z.; Xie, P. Large-scale field evidence on the enhancement of small-sized cladocerans by Microcystis blooms in Lake Taihu, China. J. Plankton Res. 2012, 34, 853–863. [Google Scholar] [CrossRef]
  68. De Bernardi, R.; Giussani, G. Are blue-green algae a suitable food for zooplankton? An overview. Hydrobiologia 1990, 200, 29–41. [Google Scholar] [CrossRef]
  69. Galir, B.A.; Ternjej, I.; Špoljar, M. Hydrology driven changes in the rotifer trophic structure and implications for food web interactions. Ecohydrology 2018, 11, e1917. [Google Scholar] [CrossRef]
  70. Muñoz-Colmenares, M.E.; Vicente, E.; Soria, J.M.; Miracle, M.R. Zooplankton changes at six reservoirs in the Ebro watershed, Spain. Limnetica 2021, 40, 279–294. [Google Scholar] [CrossRef]
  71. Havens, K.E.; Beaver, J.B. Composition, size, and biomass of zooplankton in large productive Florida lakes. Hydrobiologia 2011, 668, 49–60. [Google Scholar] [CrossRef]
  72. Vakkilainen, K.; Kairesalo, T.; Hietala, J.; Balayla, D.M.; Bécares, E.; Van de Bund, W.J.; Van Donk, E.; Fernandez-Alaez, M.; Gyllström, M.; Hansson, L.-A.; et al. Response of zooplankton to nutrient enrichment and fish in shallow lakes: A pan-European mesocosm experiment. Freshw. Biol. 2004, 49, 1619–1632. [Google Scholar] [CrossRef] [Green Version]
  73. Reynolds, C. The Ecology of Phytoplankton (Ecology, Biodiversity and Conservation); Cambridge University Press: Cambridge, UK, 2006. [Google Scholar] [CrossRef]
Figure 1. Map of Ebro watershed with approximate location of the studied reservoirs. Reservoir codes are listed in Appendix A.
Water 13 02382 g001
Figure 2. Boxplots of total abundance and biomass of zooplankton; (left side) trophic status, (right side) ecological potential. The box bounds the interquartile range (IQR; 25–75 percentile), the horizontal line inside the box indicates the median, and whiskers (error bars) indicate the 90th above and 10th below percentiles.
Water 13 02382 g002
Figure 3. Boxplots of large and small zooplankton biomass; (left side) trophic status, (right side) ecological potential.
Water 13 02382 g003
Figure 4. Boxplots of zooplankton:Chl-a and zooplankton:phytoplankton ratios; (left side) trophic status, (right side) ecological potential. Data was previously normalized (log(x + 1)).
Water 13 02382 g004
Figure 5. Zooplankton biomass of major groups; (left side) trophic status, (right side) ecological potential.
Water 13 02382 g005
Figure 6. Zooplankton biomass divided into orders or genera, (left side) trophic status, (right side) ecological potential.
Water 13 02382 g006
Table 1. Zooplankton large and small bodied genera found in the present study.
LargeSmall
CladoceraCopepodaCladocera Rotifera
DaphniaAcanthocyclopsAlonaAnuraeopsisGastropusPloesoma
DiaphanosomaCyclopsAlonellaAscomorphaHexarthraPolyarthra
HolopediumEucyclopsBosminaAsplanchnaHexarthraPhompolyx
IlyocryptusMacrocyclopsCeriodaphniaBrachionusKellicottiaProales
LeydigiaThermocyclopsChydorusCephalodellaKeratellaPtygura
MacrothrixTropocyclopsMoinaCollothecaLecaneSquatinella
SidaCopidodiaptomusOxyurellaColurellaLepadellaSynchaeta
Eudiaptomus ConochilusLophocarisTestudinella
Neolovenula DicranophorusMacrochaetusTrichocerca
Ergasilus EncentrumMonommataTrichotria
Neoergasilus EosphoraMytilinaTripleuchlanis
EuchlanisNotholca
Harpacticoids FiliniaNotommataBdelloids
Table 2. Pearson’s correlations between environmental variables and zooplankton metrics. TP—total phosphorus, CHLA—chlorophyll a, Temp—temperature, DO—dissolved oxygen, SD—Secchi disk. ZOO—total zooplankton, LZOO—large zooplankton, SZOO—small zooplankton, ZOO:CHLA—zooplankton:chlorophyll a ratio, ZOO:PHYTO—zooplankton:phytoplankton ratio, ROT—rotifers, CLAD—cladocerans, COP—copepods, DAPHN—Daphnia, CYCLO—cyclopoids, CALA—calanoids. Significance: * p < 0.05, ** p < 0.01, *** p < 0.001.
MetricCoefficients
TPCHLATempDOSD
Density
ZOO0.18 ***0.33 ***0.24 *** −0.14 *
LZOO0.26 ***0.29 ***0.30 *** 0.16 **
SZOO0.14 *0.24 ***0.29 **
ZOO:CHLA−0.37 ***−0.64 ***−0.14 * 0.32 ***
ZOO:PHYTO −0.33 ***−0.22 ***
ROT 0.18**
CLAD0.16 **0.39 ***0.36 *** −0.16 **
COP0.25 ***0.28 ***0.28 ***−0.12 *−0.17 **
DAPHN0.14 *0.19 **
CYCLO0.27 ***0.20 **0.18 ** −0.20 **
CALA0.25 **0.27 **0.27 ** −0.24 **
Biomass
ZOO0.24 ***0.37 ***0.32 *** −0.17 **
LZOO0.24 ***0.26 ***0.27 *** 0.16 **
SZOO0.21 **0.36 ***0.22 *** −0.12 *
ZOO:CHLA−0.37 ***0.64 ***−0.14 * 0.32 ***
ZOO:PHYTO −0.23 *** −0.16 **
ROT0.13 *0.23 ***
CLAD0.13 *0.34 ***0.32 ***
COP0.19 **0.24 ***0.26 *** −0.13 *
DAPHN 0.16 *
CYCLO0.24 **0.17 *0.15 * −0.18 **
CALA0.26 **0.28 **0.27 ** −0.25 **
Table 3. Results of multiple regression analysis (stepwise procedure) between environmental variables and zooplankton metrics. Independent variables: TP—total phosphorus, CHLA—chlorophyll a, Temp—temperature, DO—dissolved oxygen, SD—Secchi disk. Dependent variables: zooplankton metrics. Variable names are as denoted in Table 2. Significance: * p < 0.05, ** p < 0.01, *** p < 0.001 and ns—no significant.
VariableCoefficientsRegression Statistics
TPChlaDOTSD pr2n
Density
ZOO 0.40 *** 1.04 * F2 = 40.410.00010.1166292
LZOO 0.40 ** 2.15 *** F2 = 20.600.00010.122280
SZOO 0.35 **0.57 ns0.91 ns F3 = 7.4330.00010.06291
ZOO:CHLA −1.11 ***0.45 ns F2 = 178.80.00010.5474292
ZOO:PHYTO0.32 **−0.80 *** −1.51 * F3 = 16.460.00010.13288
ROT 0.35 ** F1 = 9.880.00180.02293
CLAD−0.25 *0.76 *** 2.82 *** F3 = 27.230.00010.2112291
DAPHN 0.36 ** F1 = 8.5570.00370.032227
COP 0.57 **−0.91 ns2.40 ** F3 = 13.620.00010.1141291
CYCLO0.46 ** 1.16 ns F2 = 9.6050.00010.07213
CALA 0.45 **−0.8304 ns1.74 ns F3 = 6.7830.00020.1043146
Biomass
ZOO 0.47 *** 1.88 *** F2 = 31.280.00010.1708292
LZOO0.18 ns0.26 ns 1.97 ** F3 = 11.430.00010.0999279
SZOO 0.61 *** 0.98 ns F2 = 24.170.00010.1361292
ZOO:CHLA −1.03 *** 0.92 * F2 = 108.60.00010.4226292
ZOO:PHYTO −0.48 ***−0.70 ns1.27 * F3 = 10.120.00010.08288
ROT 0.42 *** F1 = 16.620.00010.05293
CLAD−0.30 *0.74 ***−0.63 ns2.31 ** F4 = 15.760.00010.1672290
COP 0.53 ** 3.47 ** F2 = 15.070.00010.08292
DAPHN 0.29 * F1 = 5.670.01890.02227
CYCLO0.48 ** F1 = 13.450.00030.054214
CALA 0.46 **−0.8304 ns1.80 ns F2 = 6.9720.00020.1073146
Table 4. t-Student test between zooplankton metrics, trophic status, and ecological potential levels. (Oligo—oligotrophic, Meso—mesotrophic, Eutro—eutrophic, Hyper—hypereutrophic, Good—Good or Superior). Significance: * p < 0.05, ** p < 0.01, *** p < 0.001.
MetricTrophic StatusEcological Potential
Oligo–MesoMeso–EutroEutro–HyperOligo–EutroGood–ModerateModerate–Poor
Density
ZOO * *****
LZOO ** ********
SZOO *
ZOO:CHLA****** ******
ZOO:PHYTO*** ****
ROT
CLAD *********
DAPHN ****
COP** *****
CYCLO*** ******
CALA* ****
Biomass
ZOO*** ******
LZOO * ******
SZOO * ******
ZOO:CHLA***** *********
ZOO:PHYTO
ROT *
CLAD *******
DAPHN ***
COP* ******
CYCLO*** ***
CALA* ****
Publisher’s Note: MDPI stays neutral with regard to jurisdictional claims in published maps and institutional affiliations.

