
Analysis of Characteristics of Dry–Wet Events Abrupt Alternation in Northern Shaanxi, China


1
State Environmental Protection Key Laboratory of Wetland Ecology and Vegetation Restoration, School of Environment, Northeast Normal University, Changchun 130024, China
2
Key Laboratory for Vegetation Ecology, Ministry of Education, School of Environment, Northeast Normal University, Changchun 130117, China
*
Author to whom correspondence should be addressed.
Water 2021, 13(17), 2384; https://doi.org/10.3390/w13172384
Submission received: 8 August 2021
/
Revised: 22 August 2021
/
Accepted: 26 August 2021
/
Published: 30 August 2021
(This article belongs to the Section Hydrology)
Abstract
:In this study, Yulin city and Yan’an city in northern Shaanxi Province were taken as the study area. Based on the diurnal dry–wet events abrupt alternation index DWAAI, the joint probability distribution of two characteristic variables of “urgency” and “alternation” of dry–wet events abrupt alternation was established by using copula function, and the characteristics of dry–wet events abrupt alternation were analyzed. DWAAI was calculated from daily precipitation data and the applicability of the index was verified. On this basis, the two characteristic variables of “urgency” and “alternation” were separated, and the appropriate marginal distribution function was selected to fit them, and the correlation between the two variables was evaluated. Finally, the appropriate copula function was selected to fit the bivariate of each station, and the joint cumulative probability and recurrence period of the two variables were calculated. The results show that the DWAAI index is suitable for the identification of dry–wet events abrupt alternation in the study area. Light and moderate dry–wet events abrupt alternation occurs more frequently, while severe events rarely occur in the study area. The frequency of severe dry–wet events abrupt alternation in Jingbian station and its northern area is greater than that in the southern area, and the risk of dry–wet events abrupt alternation of disasters in the northern area is higher. The greater the degree of “urgency” and “alternation”, the greater the joint cumulative probability and the greater the return period. The return period of severe dry–wet events abrupt alternation was more than five years, while the return period of light and moderate dry–wet events abrupt alternation was less than five years.
1. Introduction
Under the influence of global climate warming and human activities, the water cycle of the ecosystem speeds up and its stability decreases, leading to a sharp increase in the occurrence frequency of abnormal precipitation disasters, such as rainstorm disaster, drought disaster, flood disaster and snow disaster [1,2,3,4]. Dryness/wetness are the most common natural disasters in the world, which occur frequently, cause great losses and affect a wide range of areas [5,6,7,8,9,10]. Dryness/wetness disasters will damage the regional ecological environment, endanger the safety of human life and property, hinder social and economic development, and have a great impact on agricultural production in particular [11,12,13]. Therefore, more and more domestic and foreign scholars have studied dryness/wetness disasters. Among them, a large number of studies have been conducted on the time–series change law of dryness/wetness disasters [14,15], the formation mechanism of dryness/wetness disasters [16,17], the loss estimation of dryness/wetness disasters [18] and the impact mechanism of dryness/wetness disasters on crops [19,20]. However, most of the studies are solely focused on dryness/wetness [21,22], or a simple combination of dryness/wetness [23], and there are relatively few studies on such abnormal events as dry–wet events abrupt alternation. In this study, the characteristics and rules of dry–wet events abrupt alternation in meteorological level were studied from the perspective of meteorological dryness and wetness, which are generally defined as the deficient (abundant) amount of normal precipitation in a period of time [24].
Dry–wet events abrupt alternation refers to the phenomenon that dryness and wetness alternate in a short period of time within a certain region or basin [25]. In recent years, under the influence of global climate change and abnormal atmospheric circulation, dry–wet events abrupt alternation have frequently occurred [26]. In 2011, the extreme dry–wet events abrupt alternation occurred in the middle and lower reaches of the Yangtze River [27,28], which was listed as one of the top ten weather and climate events in China in 2011, causing huge economic losses and ecological environment destruction in the middle and lower reaches of the Yangtze River. The frequency of dry–wet events abrupt alternation in Huaihe River Basin is increasing [29]. The wide and frequent occurrence of dry–wet events abrupt alternation have seriously hindered regional agricultural production and economic development, and directly affected the presence, chemical characteristics, migration, transformation and accumulation process of pollutants in the environment of the basin, leading to the deterioration of water quality [30]. Therefore, domestic and foreign scholars have gradually increased their research on dry–wet events abrupt alternation. The research on the dry–wet events abrupt alternation began in 2006 [31], and then entered the development period. Many scholars conducted extensive and in-depth studies on the discrimination method of dry–wet events abrupt alternation, the cause of its formation, evolution characteristics and disaster damage [25,32,33,34,35,36].
Dry–wet events abrupt alternation index is an evaluation index used to distinguish dry–wet events abrupt alternation and is also the basis of studying the law of their occurrence and development [26,31]. However, some scholars define dry–wet events abrupt alternation and study the evolution characteristics of dry–wet events abrupt alternation by using the standardized precipitation index (SPI), precipitation anomaly (PA), palmer drought degree model, continuous rainless days and other meteorological drought indexes [37,38,39]. Although these studies have a good effect on macroscopic law identification and evolution characteristics analysis, they cannot describe the occurrence process and intensity of dry–wet events abrupt alternation completely and quantitatively. The dry–wet events abrupt alternation index can quantitatively evaluate the dry–wet events abrupt alternation. Wu Zhiwei et al. (2006) proposed the long/short period drought–flood abrupt alternation index LDFAI/SDFAI to study the basic characteristics of atmospheric circulation anomalies and summer dry–wet events abrupt alternation in the middle and lower Yangtze River regions [31]. This index lays a foundation for quantitative study of dry–wet events abrupt alternation, but it cannot identify the specific time of occurrence of dry–wet events abrupt alternation, and cannot describe the occurrence process of dry–wet events abrupt alternation. The problem of large time scale of LDFAI/SDFAI Index was improved by Lijie Shan et al. (2018), the daily Dry–Wet Abrupt Alternation Index (DWAAI) was constructed [26]. The index considered dry spell, wet spell and abrupt alternation degree at the same time, making it more accurate to identify dry–wet events abrupt alternation. It can comprehensively describe the “urgency” and “alternation” of the dry–wet transition process.
Copula function is often used in the study of drought disasters, which can combine drought characteristic variables, so as to more accurately analyze the complex and changeable drought events, and determine the multivariable joint probability distribution and joint return period of drought [1,4,40,41]. In the research of dry–wet events abrupt alternation, few people use Copula function to analyze dry–wet events abrupt alternation.
The aim of the research is to modify the dryness/wetness degree items in the calculation method of the index before and after the period of dry–wet events abrupt alternation according to the meteorological and hydrological characteristics in northern Shaanxi, and take the “urgency” and “alternation” of dry–wet events abrupt alternation as its characteristic variables, the occurrence probability and the combined return period of the abrupt alternation of dryness/wetness are obtained. In order to provide scientific basis for monitoring, early warning, dryness/wetness control and management of dry–wet events abrupt alternation in northern Shaanxi.
2. Study Area and Data
The study areas are Yulin City and Yan’an City of Shaanxi Province, located in the northern part of Shaanxi Province. It has a temperate continental monsoon climate, with an annual average temperature of 7–11 °C and an annual average precipitation of about 300–700 mm. The precipitation has obvious seasonal variations, mainly concentrated in June to August, accounting for 39–64% of the whole year. Precipitation from September to November is the second, accounting for 20–34% of the whole year. The precipitation from March to May is less than that from September to November, accounting for 13–24% of the annual precipitation. Precipitation in winter is rare, accounting for only 1–4% of the whole year. The Loess Plateau in Northern Shaanxi is the central part of the Loess Plateau in China. The terrain is higher in the northwest and lower in the southeast, with an elevation of 800–1300 m, accounting for about 45% of the total area of the province. Its north is sandstorm area, the south is a hilly gully area. It was formed by running water cutting and soil erosion on the basis of the ancient terrain formed by Mesozoic bedrock and covered with Cenozoic red soil and thick loess soil. The basic geomorphic types are loess tableland, beam, ridge, gully and tableland, which is the plateau surface retained after modern gully division of the loess plateau. Further, there were three types of land use in the study area, including cultivated land, grassland and woodland, accounting for 19.4%, 14% and 54.3% of the total land area, respectively.
The data in this paper came from the National Meteorological Information Center of China Meteorological Administration (http://data.cma.cn, accessed on 9 March 2021). The daily precipitation data of 10 meteorological stations in Northern Shaanxi during 1960–2019 were used to quality collate the original data and make up the difference. The spatial distribution of meteorological stations in the study area is shown in Figure 1.
3. Methodology
3.1. Daily Dry–Wet Events Abrupt Alternation Index DWAAI
The daily dry–wet events abrupt alternation index DWAAI can better reflect the “urgency” and “alternation” degree of dry–wet events abrupt alternation, and at the same time, the daily scale index can identify the occurrence time of dry–wet events abrupt alternation more accurately, which is suitable for studying the characteristics of regional dry–wet events abrupt alternation. Dry–wet events abrupt alternation can be divided into two situations: “dryness to wetness” and “wetness to dryness”. In this paper, only the “dryness to wetness” situation is studied. Lijie Shan et al. constructed the DWAAI index, and its calculation formula is as follows [26]:
where, ,
—standardized precipitation anomalies in dry spells and wet spells; ,
, ,
—SAPI (Standard Antecedent Precipitation Index) value on day i of wet spell and the last day of dry spell, the calculation method is to standardize the Antecedent Precipitation Index (API); n—days of dryness; α—weighting coefficient. The recommended value range in literature [26] is 1 < α ≤ 1.4. According to the actual situation in northern Shaanxi and the comparison of various value calculation results of α and its rationality analysis, α = 1.1 is determined.
There are two stages in the dry–wet events abrupt alternation process, namely, the early dry spell and the late wet spell. The formation mechanism of these two stages is different, so the calculation methods are also different when calculating the standardized precipitation anomaly values in the dry spell and the wet spell. In the calculation of SPA value in dry spell, it is necessary to consider that the formation of dryness events is the result of the accumulation of dryness conditions in the earlier period, and the influence of daily precipitation in the earlier period on the dryness of the same day shows an exponential decline trend, and the influence of the 44th day in the earlier period on the dryness of the same day decreases to 0.1%, so the dry spell is determined as 44 days. In the calculation of SPA value in the wet spell, considering the short-term formation of wetness events, and combining with the climatic characteristics in Northern Shaanxi and the actual calculation results, the wet spell was determined to be five days. Further, a wet spell of 5 days is obtained through checking calculation in the calculation process, when n values greater than 5, it will cause “dryness and wetness neutralization” in some dry–wet events abrupt alternation, which cannot accurately identify the event, when n is less than 5, it cannot completely reflect the continuous precipitation process. In the study area precipitation sequence of 10 weather stations, n = 5 is the best. Therefore, the calculation formulas of and in this paper are as follows [42]:
where, m—the number of days in dry spell, m = 44; However, Northern Shaanxi is the Loess Plateau, with loose soil and developed vertical joints. The southern part of the study area is a sandstorm area with weak water-holding capacity, while the northern part is a hilly and gully area with large attenuation degree. Based on the parameter optimization of the actual situation, k = 0.86 is selected in this study. n—days of wet spell, n = 5. Combined with the calculation results, by referring to China Meteorological Disaster Dictionary and comparing the actual occurrence of dryness/wetness disasters, the classification of dry–wet events abrupt alternation based on DWAAI index is obtained, as shown in Table 1.
3.2. Identification of Characteristic Variables of Dry–Wet Events Abrupt Alternation
In the definition of DWAAI index, represents the degree of “alternation” of dry–wet events abrupt alternation, which is expressed by DWa. represents the degree of “urgency” of dry–wet events abrupt alternation, which is expressed by DWu. The DWAAI value was calculated, and the dry–wet events abrupt alternation were screened out according to the threshold value of the classification of dry–wet events abrupt alternation. In other words, when DWAAI > 10, it is determined that the dry–wet events abrupt alternation event occurs, and the day with the maximum DWAAI in adjacent days is selected as the abrupt alternation point of this dry–wet events abrupt alternation event, and the obviously unreasonable abrupt alternation point was deleted according to the rainfall data.
3.3. Construct the Marginal Distribution Function of Characteristic Variables
The marginal distribution function was used to fit the characteristic variables DWa and DWu of dry–wet events abrupt alternation. In this study, 6 commonly used probability distribution functions are selected to fit the variables.
In this study, Pearson product-moment was used to test the correlation between the characteristic variables of dry–wet events abrupt alternation, and the Chi-square test was used to evaluate the fitting of marginal distributions to variables.
3.4. Determination of Copula Function
In this study, two-dimensional copula function was used to fit the joint distribution of DWu and DWa, and the joint distribution probability and joint return period were obtained. The copula function is essentially the multivariate joint distribution function of the random variable X1, X2,…, XN with an edge distribution of FX1(x1), FX2(x2),…, FXN(xN). The two-dimensional copula function can combine DWu and DWa, and the formula is as follows:
where is the bivariate probability distribution, and are edge distributions, u and a are related variables, and C is the copula function.
Since there are few previous studies on the joint distribution of characteristic variables of dry–wet events abrupt alternation, we cannot determine which copula function is suitable for such analysis. Therefore, when we use MatlabR2020A to calculate, all the 25 copula functions in MVCAT software package were selected, and the Root Mean Square Error (RMSE) and Nash-Sutcliffe Efficiency coefficient (NSE) were calculated to determine the optimal copula function of each site. The function formula of the optimal copula determined later are listed, as shown in Table 2.
3.5. Calculation of Return Periods
The univariate return periods of “urgency” and “alternation” of dry–wet events abrupt alternation are as follows:
where, T(u) is the recurrence interval of “urgency”, T(a) is the recurrence interval of “alternation”, n is number of years in the study period, and N is the number of dry–wet events abrupt alternation in the study period. When D ≥ d or S ≥ s., the joint return period of characteristic variables is:
4. Results
4.1. DWAAI Index Applicability Verification
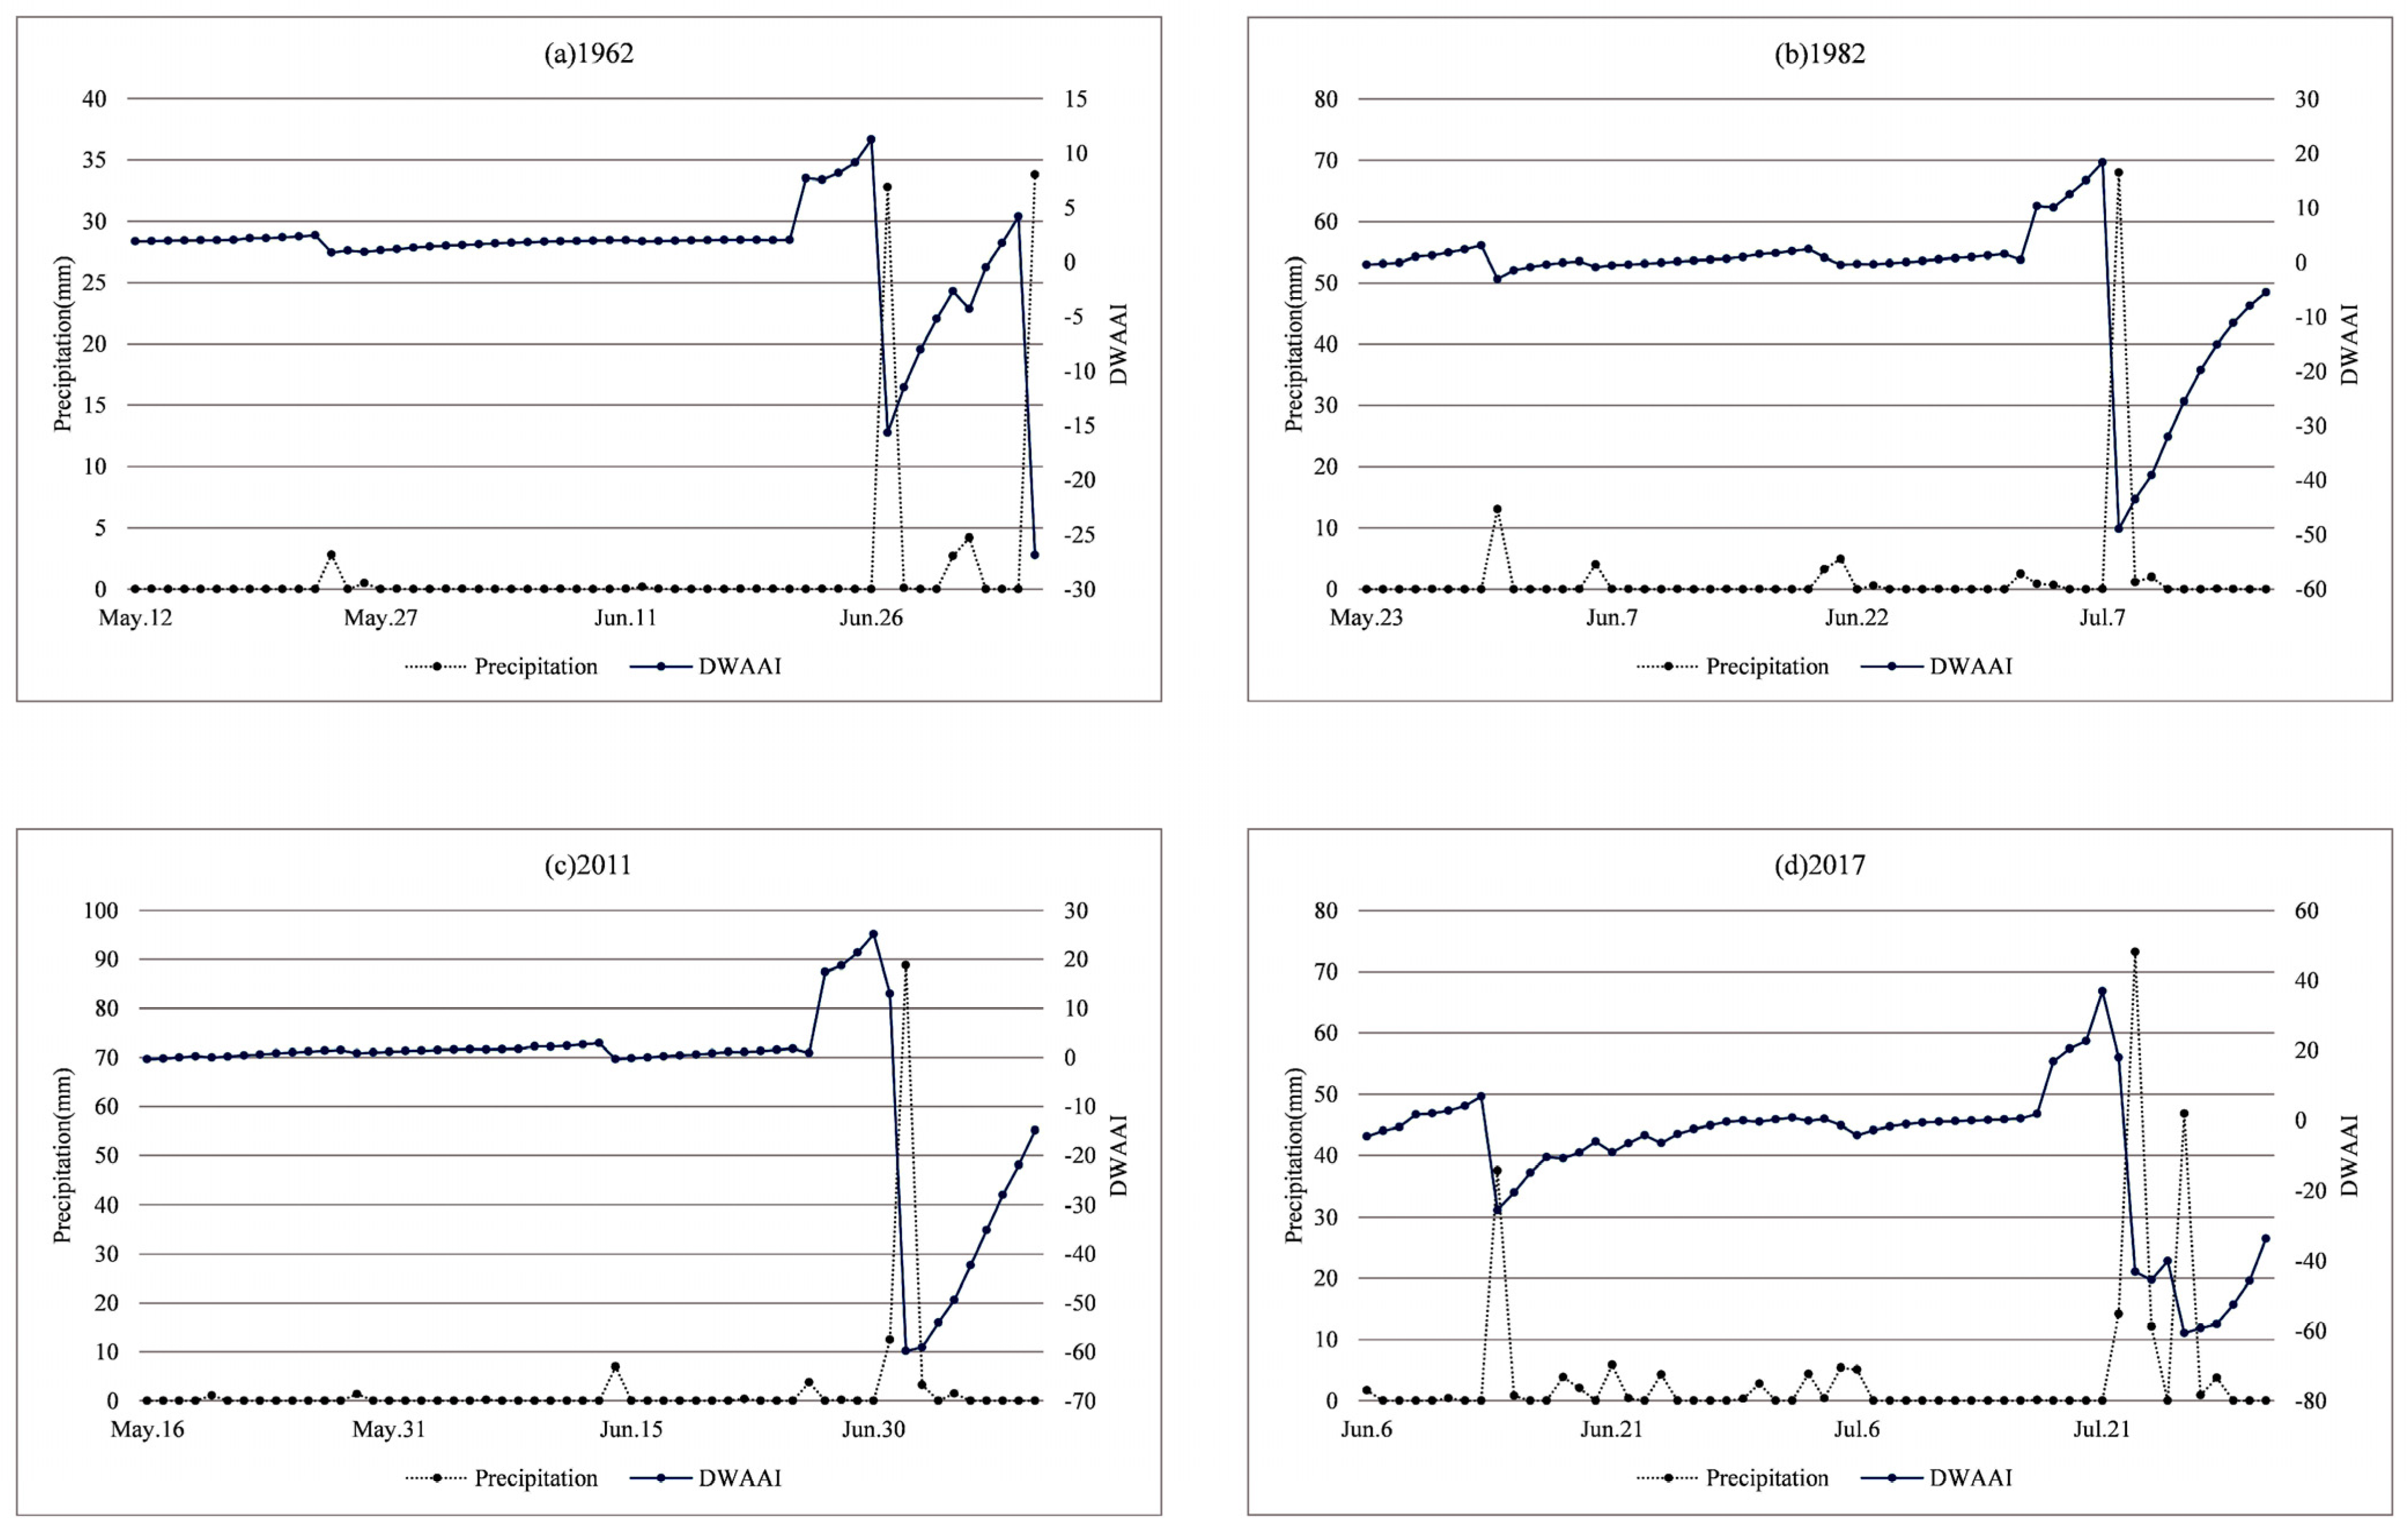
In order to discuss the applicability of dry–wet events abrupt alternation index in northern Shaanxi, this study took Yulin station as an example to verify. According to the historical disaster data, different degrees of dry–wet events abrupt alternation in 1962, 1982, 2011 and 2017 were selected in northern Shaanxi, and the precipitation process and DWAAI values in dry spells and wet spells were verified by comparing the four dry–wet events abrupt alternation in Yulin city. As can be seen from Figure 2a, in the dry–wet events abrupt alternation in 1962, the cumulative precipitation in the dry spell was 3.98 mm, and the cumulative precipitation in the wet spell was 35.6 mm. 26 June was the occurrence date of the dry–wet events abrupt alternation, the DWAAI value was 11.3, and the grade was light. In Figure 2b, before 7 July 1982, the cumulative precipitation in the dry spell was 30.22 mm, and the cumulative precipitation in the wet spell was 71.24 mm. In addition, on 8 July, the daily precipitation reached 68mm. The degree of “urgency” was high, and the DWAAI value reached 18.3. Figure 2c,d show the dry–wet events abrupt alternation on 30 June 2011, and 21 July 2017, respectively. The DWAAI values of these two events are 25.15 and 36.95, respectively, and their levels are both severe. By comparing Figure 2c,d, it can be seen that the cumulative precipitation in the first two days of the wet spell in 2011 reached 101.3 mm, and the cumulative precipitation in the first two days of the wet spell in 2017 was 87.4 mm, and the precipitation in the last day of the wet spell was 46.8 mm. The degree of “urgency” of the two events is similar. Compared with the calculated results, DWu in 2011 is 6.44, and DWu in 2017 is 6.3, which is similar. In 2011, the cumulative precipitation in dry spell was 14.3mm, and the cumulative precipitation in wet spell was 106.1 mm. In 2017, the cumulative precipitation in the dry spell was 75.6 mm, and the cumulative precipitation in the wet spell was 146.3 mm. However, since the precipitation in the dry spell in 2017 mostly concentrated before 6 July and had little impact on the dryness on that day, the “alternation” degree of events in 2017 was much greater than that in 2011, and the DWAAI values were significantly different. Through the above comparison and verification, it is indicated that DWAAI index is suitable for the study of dry–wet events abrupt alternation in northern Shaanxi.
4.2. Spatial Distribution Characteristics of Dry–Wet Events Abrupt Alternation
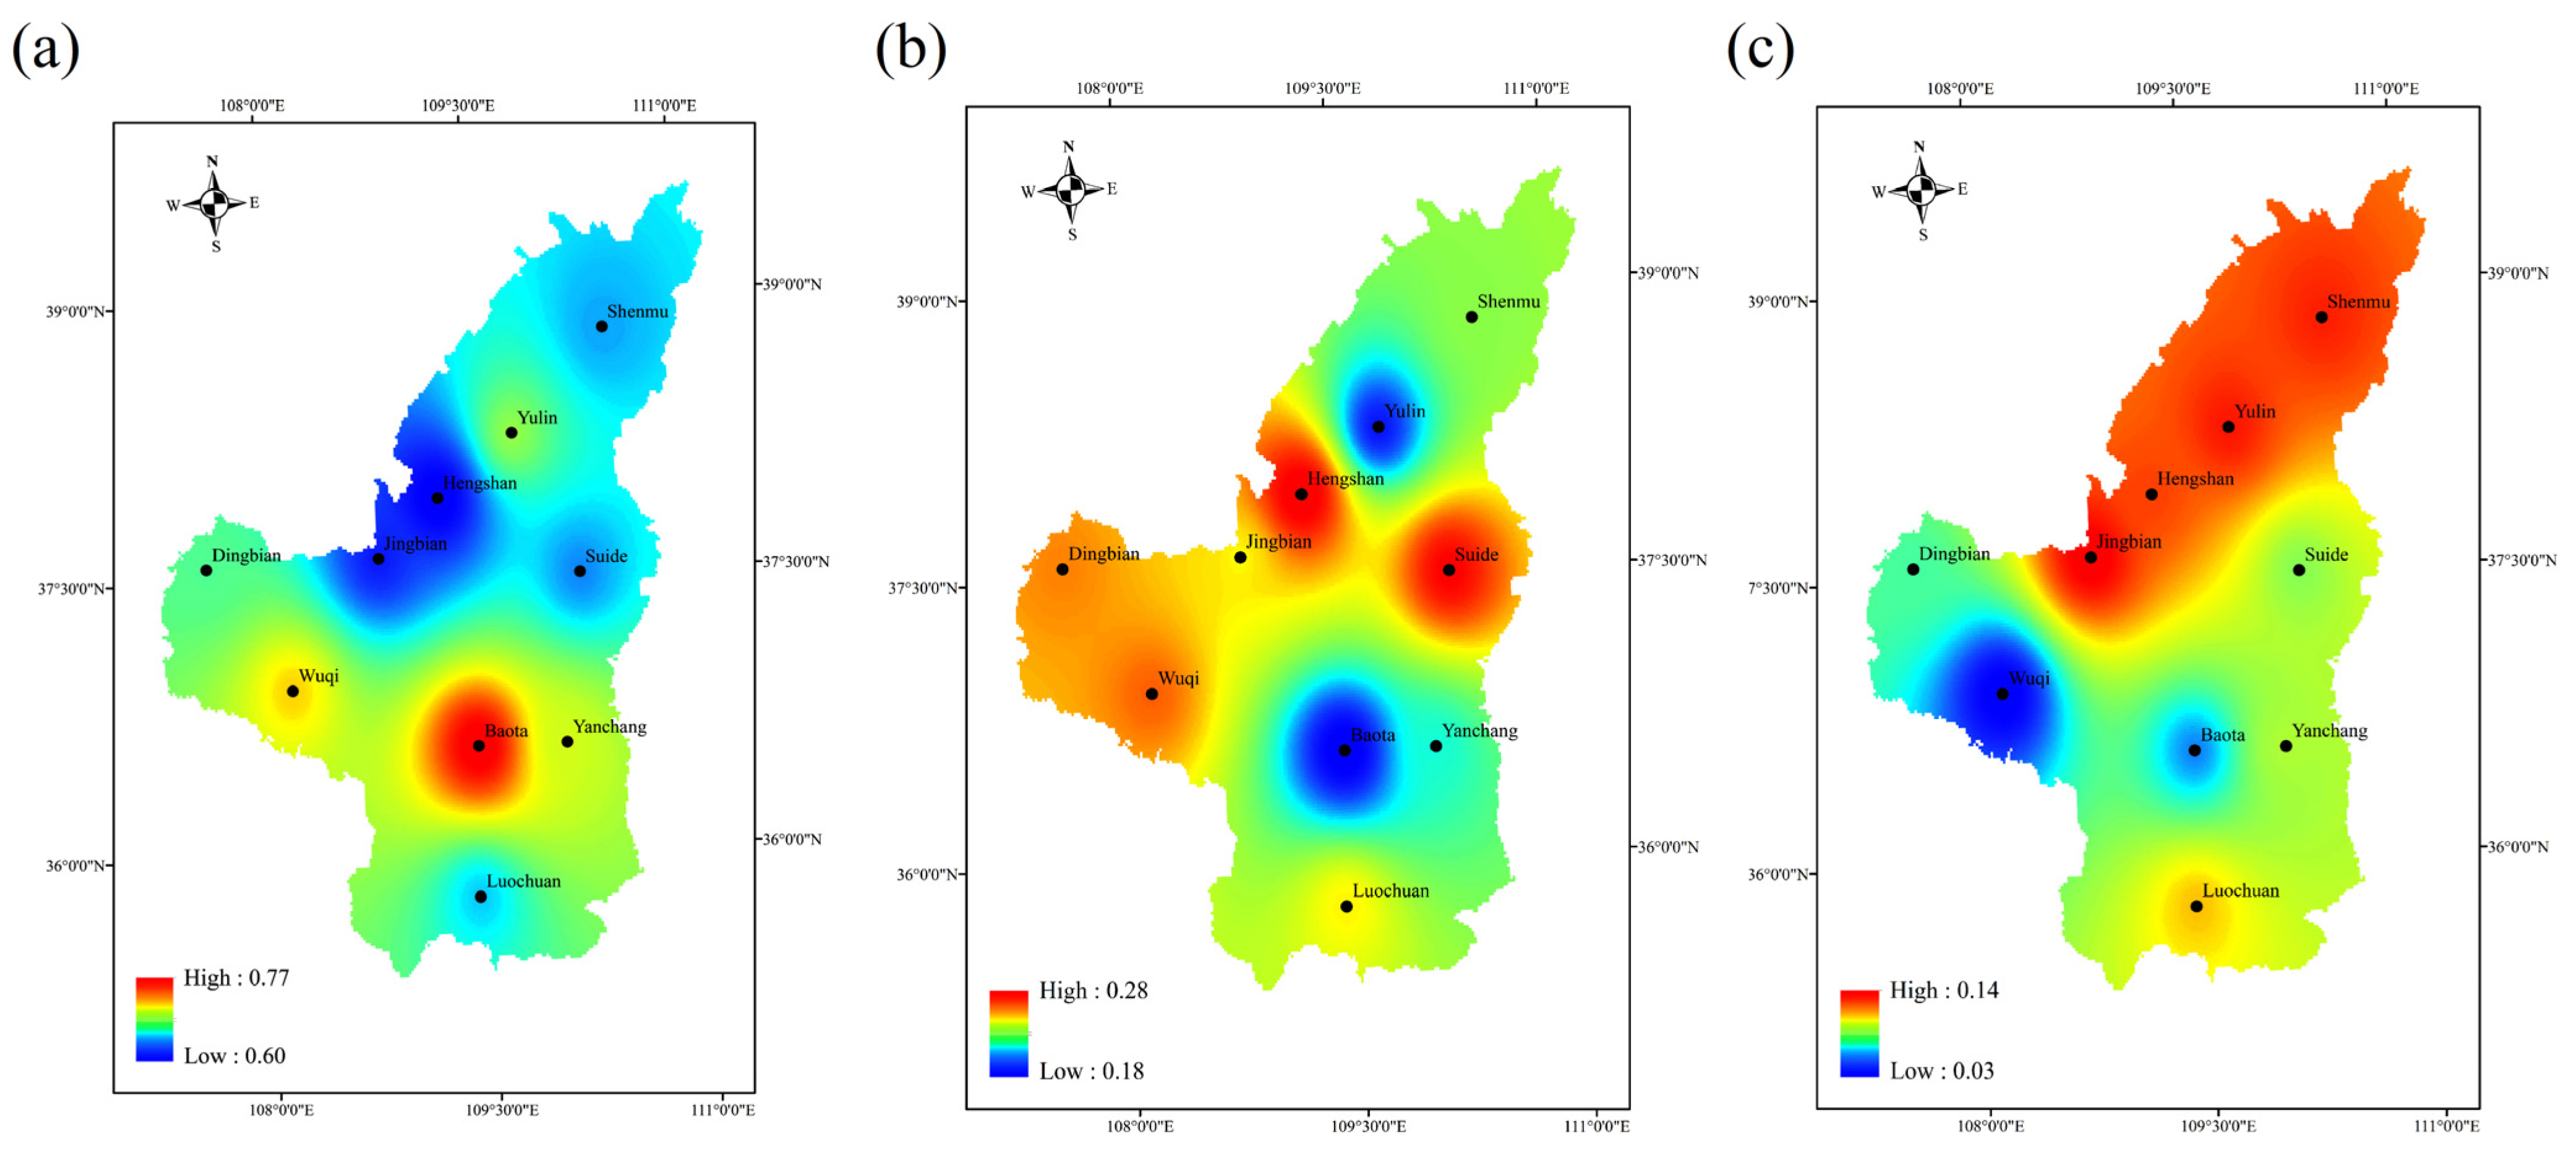
The DWAAI index was used to identify and classify the dry–wet events abrupt alternation of 10 meteorological stations in the study area, and the occurrence frequency of light, moderate and severe dry–wet events abrupt alternation of each station was calculated. The spatial distribution of the occurrence frequency of dry–wet events abrupt alternation was obtained by using the inverse distance weight interpolation method. As can be seen from the Figure 3, the occurrence frequency of light dry–wet events abrupt alternation fluctuated between 60% and 77%, among which the most frequent station was Baota Station, followed by the surrounding Wuqi station and Yanchang Station. In contrast, they occur less frequently in the north than in the south. The occurrence frequency of moderate dry–wet events abrupt alternation was between 18% and 28%. The occurrence frequency of moderate dry–wet events abrupt alternation was high in Dingbian, Jingbian, Hengshan and Suide stations in the central part of the study area, while the occurrence frequency of moderate events was low in the northern and southern parts of the study area. The frequency of severe dry–wet events abrupt alternation was the lowest in 3% of stations, and the highest in 14%. The frequency of severe dry–wet events abrupt alternation was higher in the north of Jingbian station, but lower in the south, and the lowest in Baota station and Wuqi station.
The difference of spatial distribution characteristics of dry–wet events abrupt alternation in the study area is mainly caused by the spatial difference of climate types. In the north of Jingbian station, the climate is semi-arid in temperate zone, with low precipitation and long sunshine duration, which is prone to severe dryness. Therefore, the probability of severe dry–wet events abrupt alternation is higher. However, most of the areas south of Jingbian station have temperate monsoon climate, with more precipitation and less dryness than the northern area, so the probability of severe dry–wet events abrupt alternation is low.
4.3. Determination of Copula
4.3.1. Correlation Analysis of Dry–Wet Events Abrupt Alternation Characteristic Variables
In this study, the correlation between “urgency” and “alternation”, the characteristic variables of dry–wet events abrupt alternation, was evaluated by calculating the Pearson product-moment and conducting significance tests on the correlation coefficient. The calculation results are shown in Table 3. It can be seen from the table that although the calculated value of Pearson phase relation is relatively small, it ranges from 0.27 to 0.53. However, the P value of all sites is less than 0.05, indicating that there is correlation between the two characteristic variables at the 95% confidence level. Therefore, this study can construct the joint distribution function of the characteristic variables “urgency” and “alternation” of dry–wet events abrupt alternation through the copula function.
4.3.2. Determine the Appropriate Marginal Distribution Function
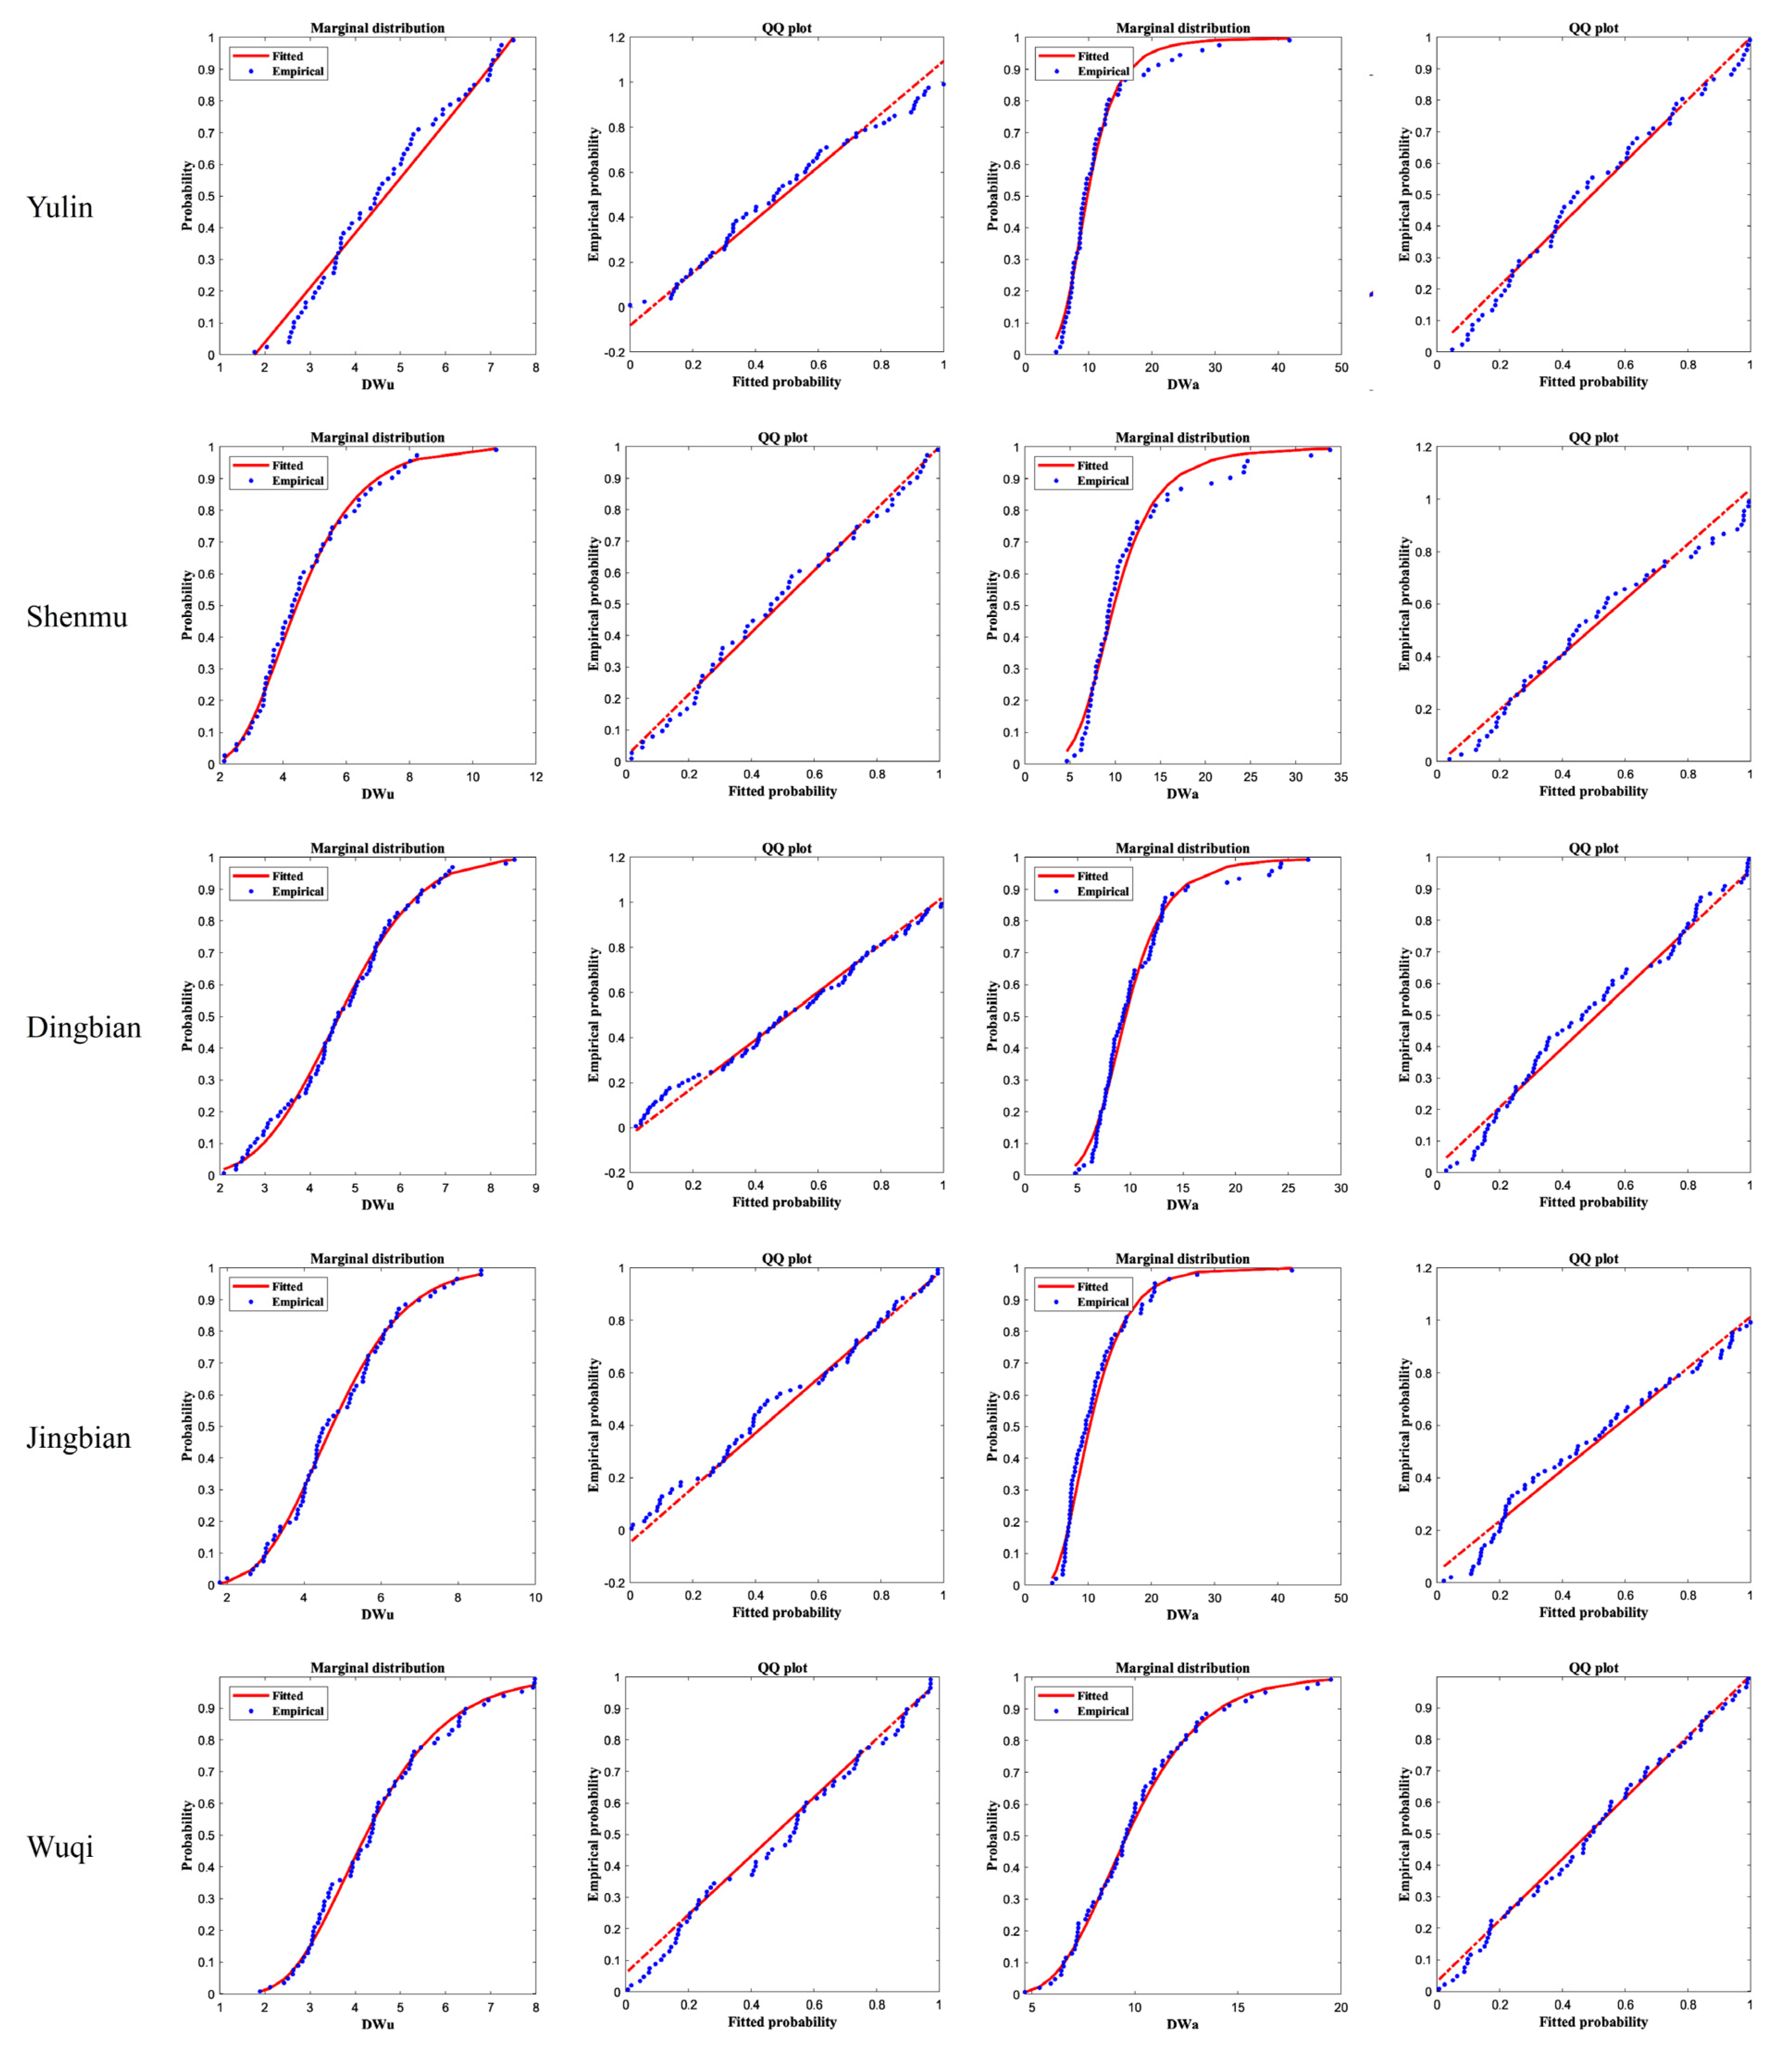
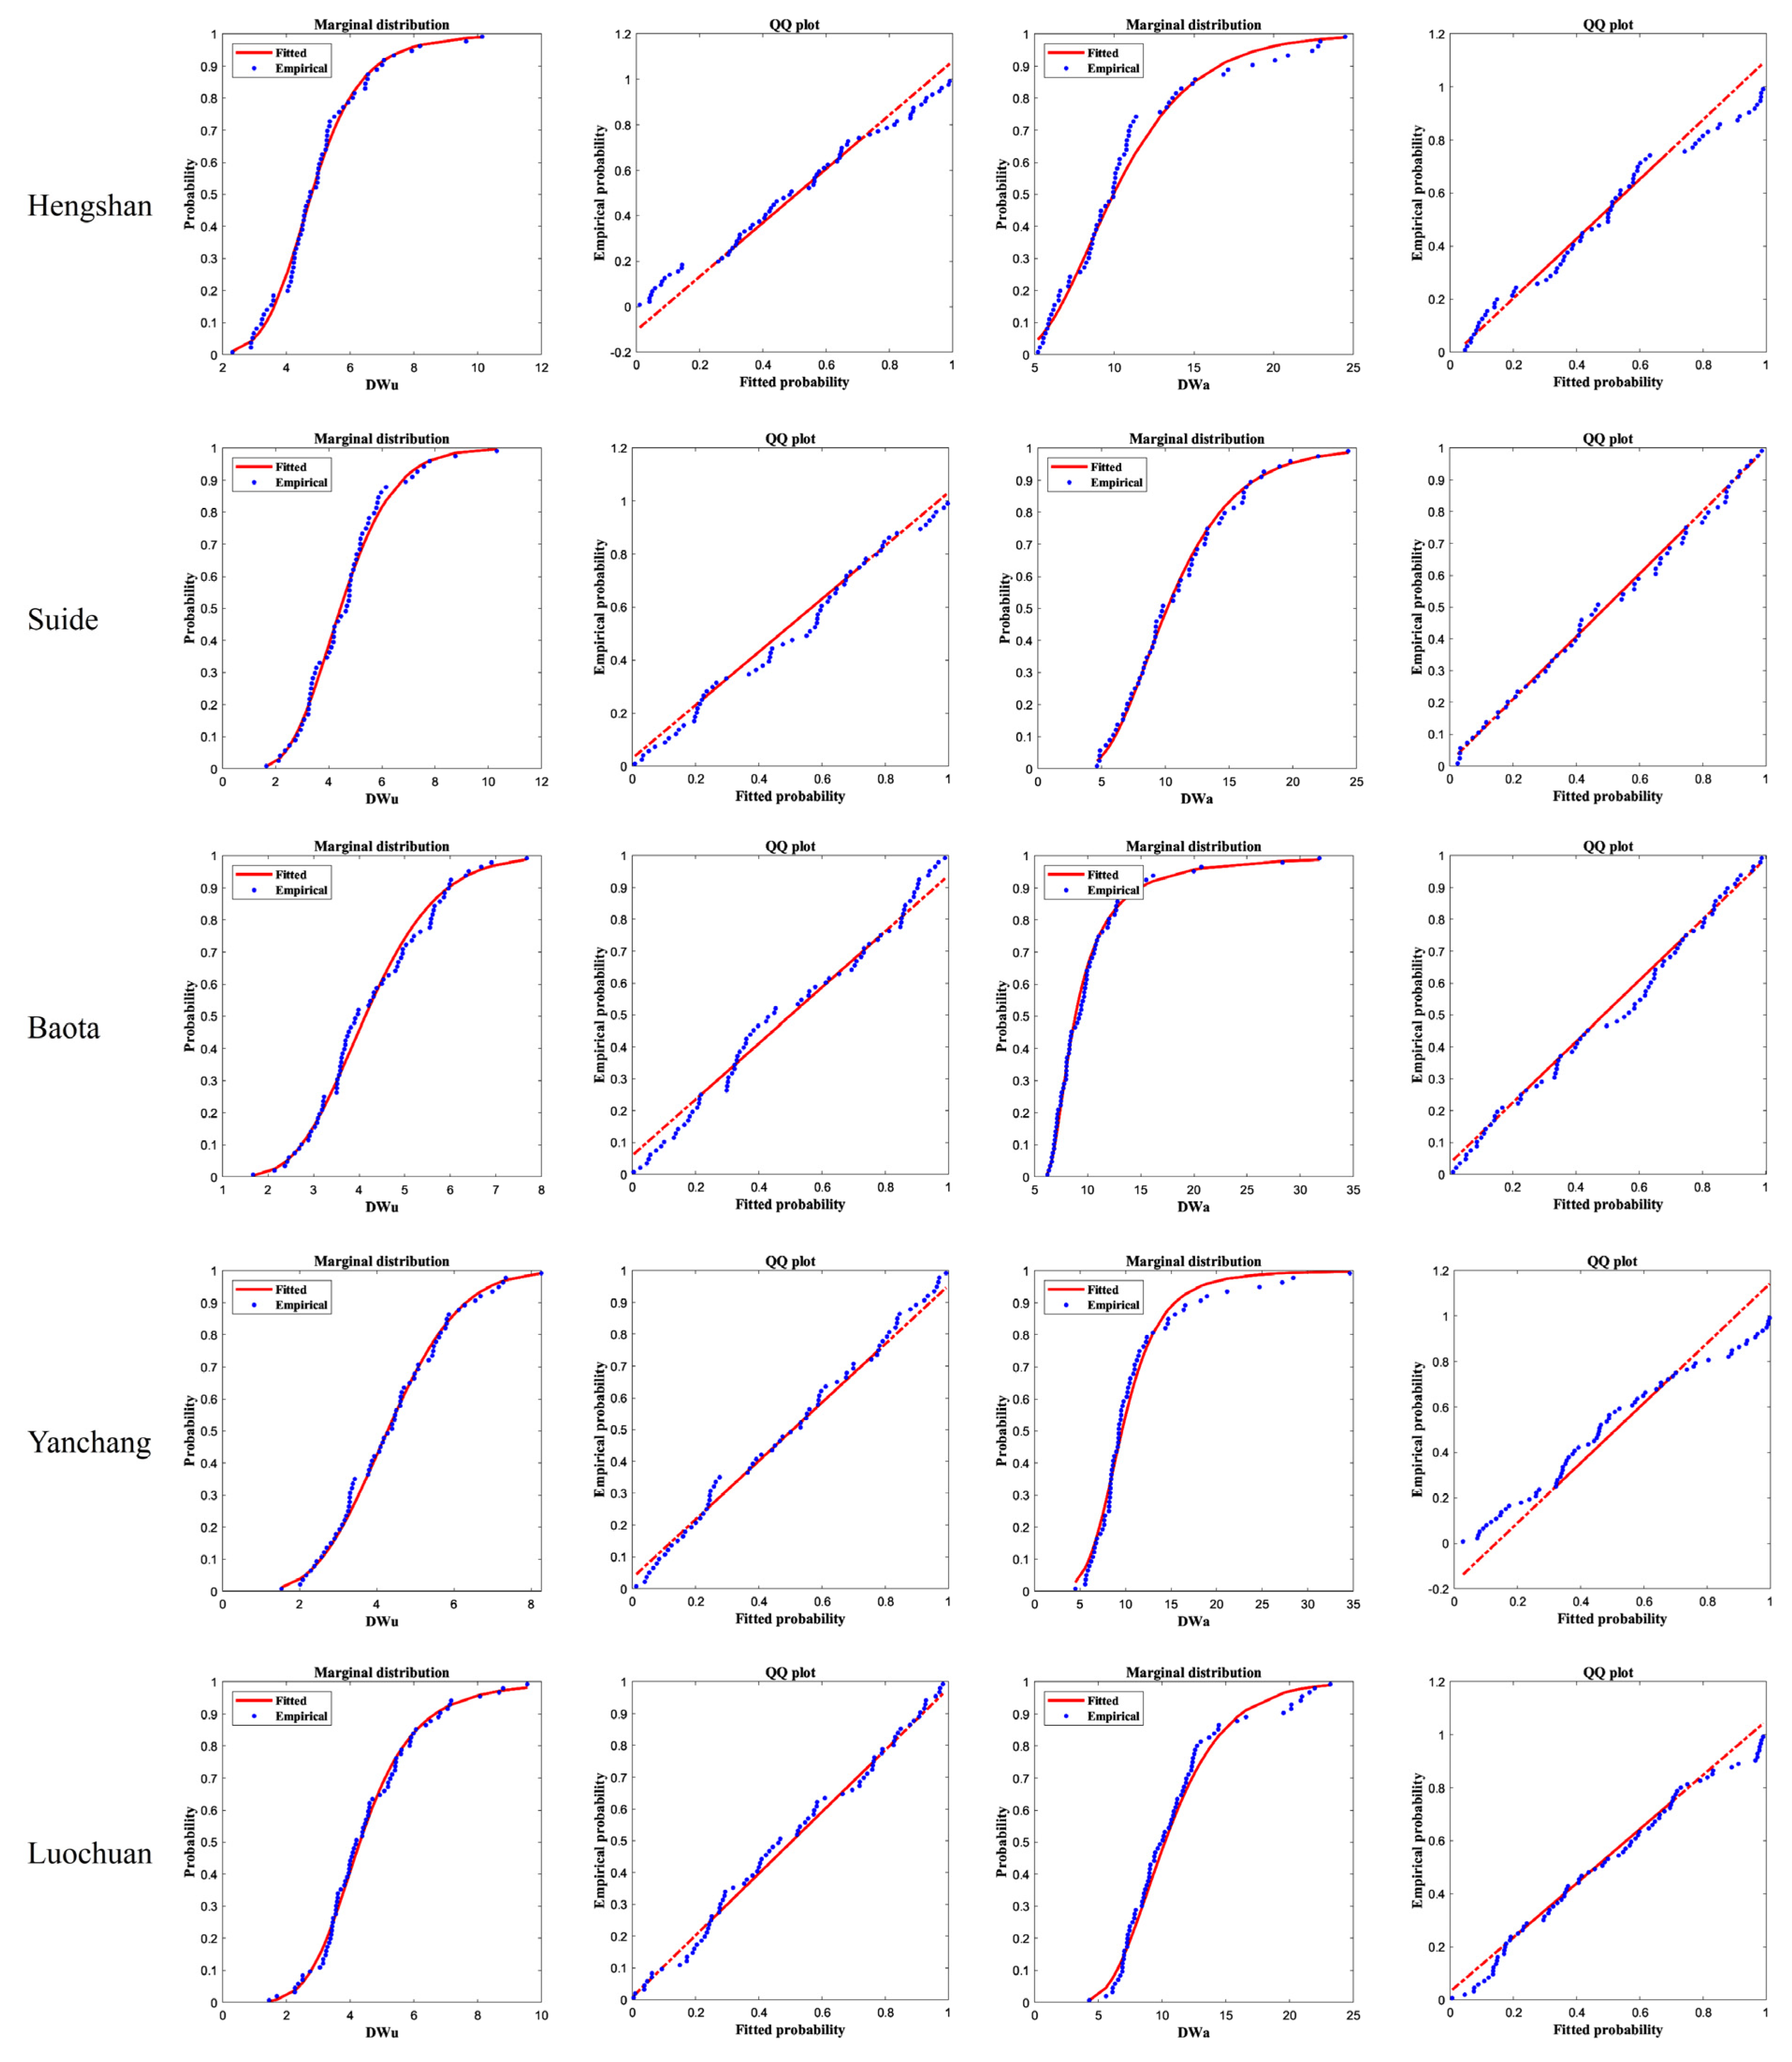
After determining the correlation of dry–wet events abrupt alternation characteristic variables, the variables need to be fitted to determine their respective marginal distribution functions. In this study, matlabR2020a was used to fit the two variables of DWu and DWa of 10 meteorological stations, respectively, to determine the optimal edge distribution function of each set of data, and to obtain its parameter value, probability graph and Q-Q graph, as shown in Table 4 and Figure 4. Table 4 shows that the edge distribution of DWu and DWa at different stations is inconsistent. In DWu, the Gamma distribution has the largest number of stations with four stations, while the DWa is dominated by four stations in the generalized extreme value distribution and three stations in the generalized Pareto distribution. Figure 4 shows the edge distribution fitting of DWu and DWa of 10 stations, and it can be intuitively seen that the fitting effect is good. The distribution of actual and theoretical data is consistent at the significance level of 0.05.
4.3.3. Determine the Appropriate Copula
In this study, MVCAT software package in matlabR2020a was used for calculation, and 25 copula functions in the program were selected for fitting. The three copula functions with the best goodness of fit are selected and listed in descending order of goodness, as shown in Table 5. As can be seen from the table, except for Baota station, the optimal copula functions of the remaining nine stations are Roch-Alegre Copula, Fischer-Hinzmann Copula, Joe Copula and Burr Copula. The root mean square error (RMSE) and Nash-Sutcliffe efficiency coefficient (NSE) values and the standard deviation (SD) of observed values are also shown to evaluate the goodness of fit of the Copula function. When the NSE value is in the range of 0~1, the model performance is considered acceptable, when the NSE value is less than 0, the model performance is considered unacceptable, and when the NSE value is greater than or equal to 0.55, the model performance is good. The range of RMSE value is greater than or equal to 0 [43]. The closer the RMSE value is to 0, the better the model fitting effect is. Moreover, when the RMSE value is less than half of the SD value, it could also be considered as low and the model performance is acceptable [44,45]. As you can see from Table 5, the NSE values are high and acceptable; RMSE values are all less than half of the SD values and are acceptable. Further, the smaller the RMSE value and the larger the NSE value are, the better the fitting effect of the Copula function is. It should be noted that in The Jingbian station and Hengshan station, although the RMSE and NSE values of the Fischer-Hinzmann Copula indicate that it is the optimal copula function, nonetheless, one of the parameters of the calculated Fischer-Hinzmann Copula and Roch-Alegre Copula converge to the parameter boundary, they may not be a good fit, so the optimal copula function of Jingbian station and Hengshan station is selected Joe Copula.
4.4. Joint Probability Distribution
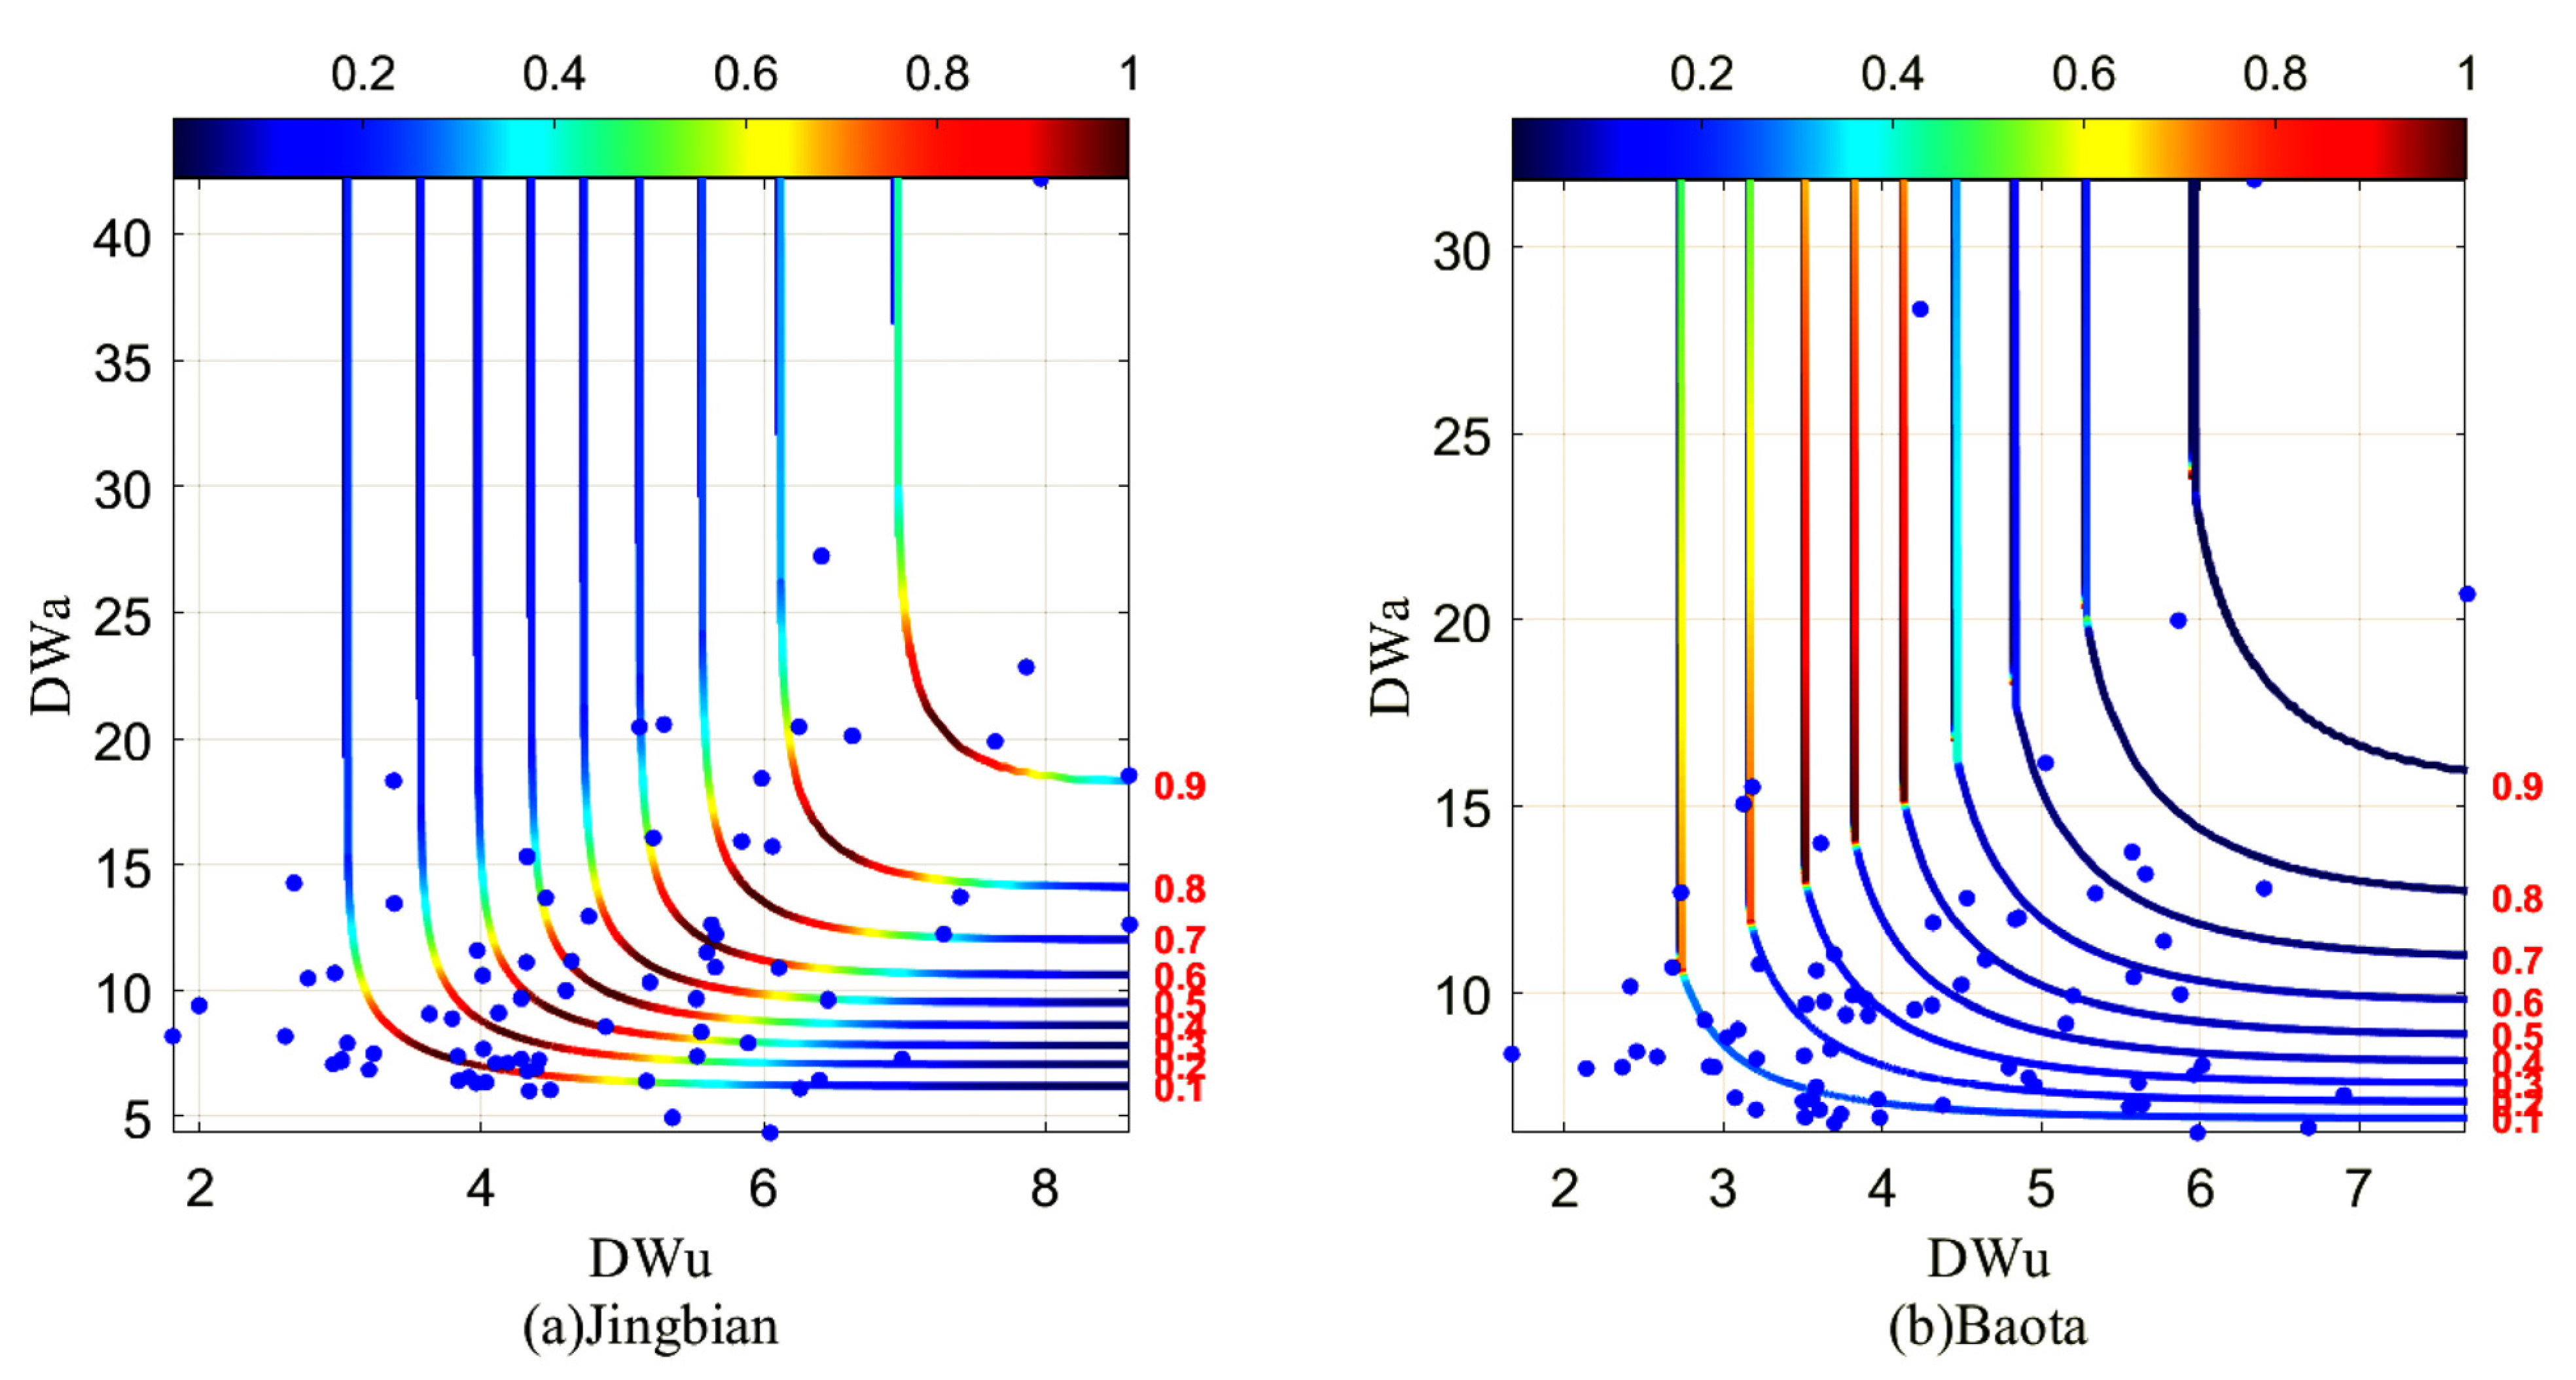
Taking Jingbian station with the highest occurrence frequency of severe dry–wet events abrupt alternation and Baota station with the highest occurrence frequency of mild dry–wet events abrupt alternation as examples, the joint probability distribution of “urgency” and “alternation” of dry–wet events abrupt alternation was analyzed. Figure 5 shows the combined cumulative probability of dry–wet events abrupt alternation at Jingbian station and Baota Station. In general, the joint probability distribution of the two stations increases with the degree of “urgency” and “alternation” of dry–wet events abrupt alternation. As can be seen from the Figure 5, the density of the combined probability isoline of Baota station is higher than that of Jingbian station, indicating that Baota station is more prone to light and moderate dry–wet events abrupt alternation. In Jingbian station, the events with the degree of “urgency” less than 5 and the degree of “alternation” less than 11 accounted for 60% of the total events, while the events with the degree of “urgency” less than 6 and the degree of “alternation” less than 18 accounted for 85% of the total events, and the events with the degree of “urgency” more than 6 and the degree of “ alternation “ more than 18 were more than the Baota station. At Baota station, the events with the degree of “urgency” less than 5 and the degree of “alternation” less than 11 accounted for 70% of the total events, while the events with the degree of “urgency” less than 6 and the degree of “alternation” less than 18 accounted for 95% of the total events, and the events with the degree of “urgency” more than 6 and the degree of “alternation” more than 18 were very few. This result is consistent with the spatial distribution of different levels of dry–wet events abrupt alternation in 4.2, which verifies that light and moderate dry–wet events abrupt alternations mainly occur at Baota station, while severe dry–wet events abrupt alternations occur more at Jingbian station. As can be seen from Figure 5, the combined cumulative probability of dry–wet events abrupt alternation of events reaching the severity degree at Jingbian Station is about 0.8, while that at Baota Station is about 0.9. On 26 July 1997, the most serious dry–wet events abrupt alternation of events occurred, the degree of the “urgency” was 8, and the degree of “alternation” reached 42. The combined probability distribution of “urgency” and “alternation” of dry–wet events abrupt alternation at the other 8 stations was similar to that at Jingbian station and Baota station.
4.5. Joint Return Period
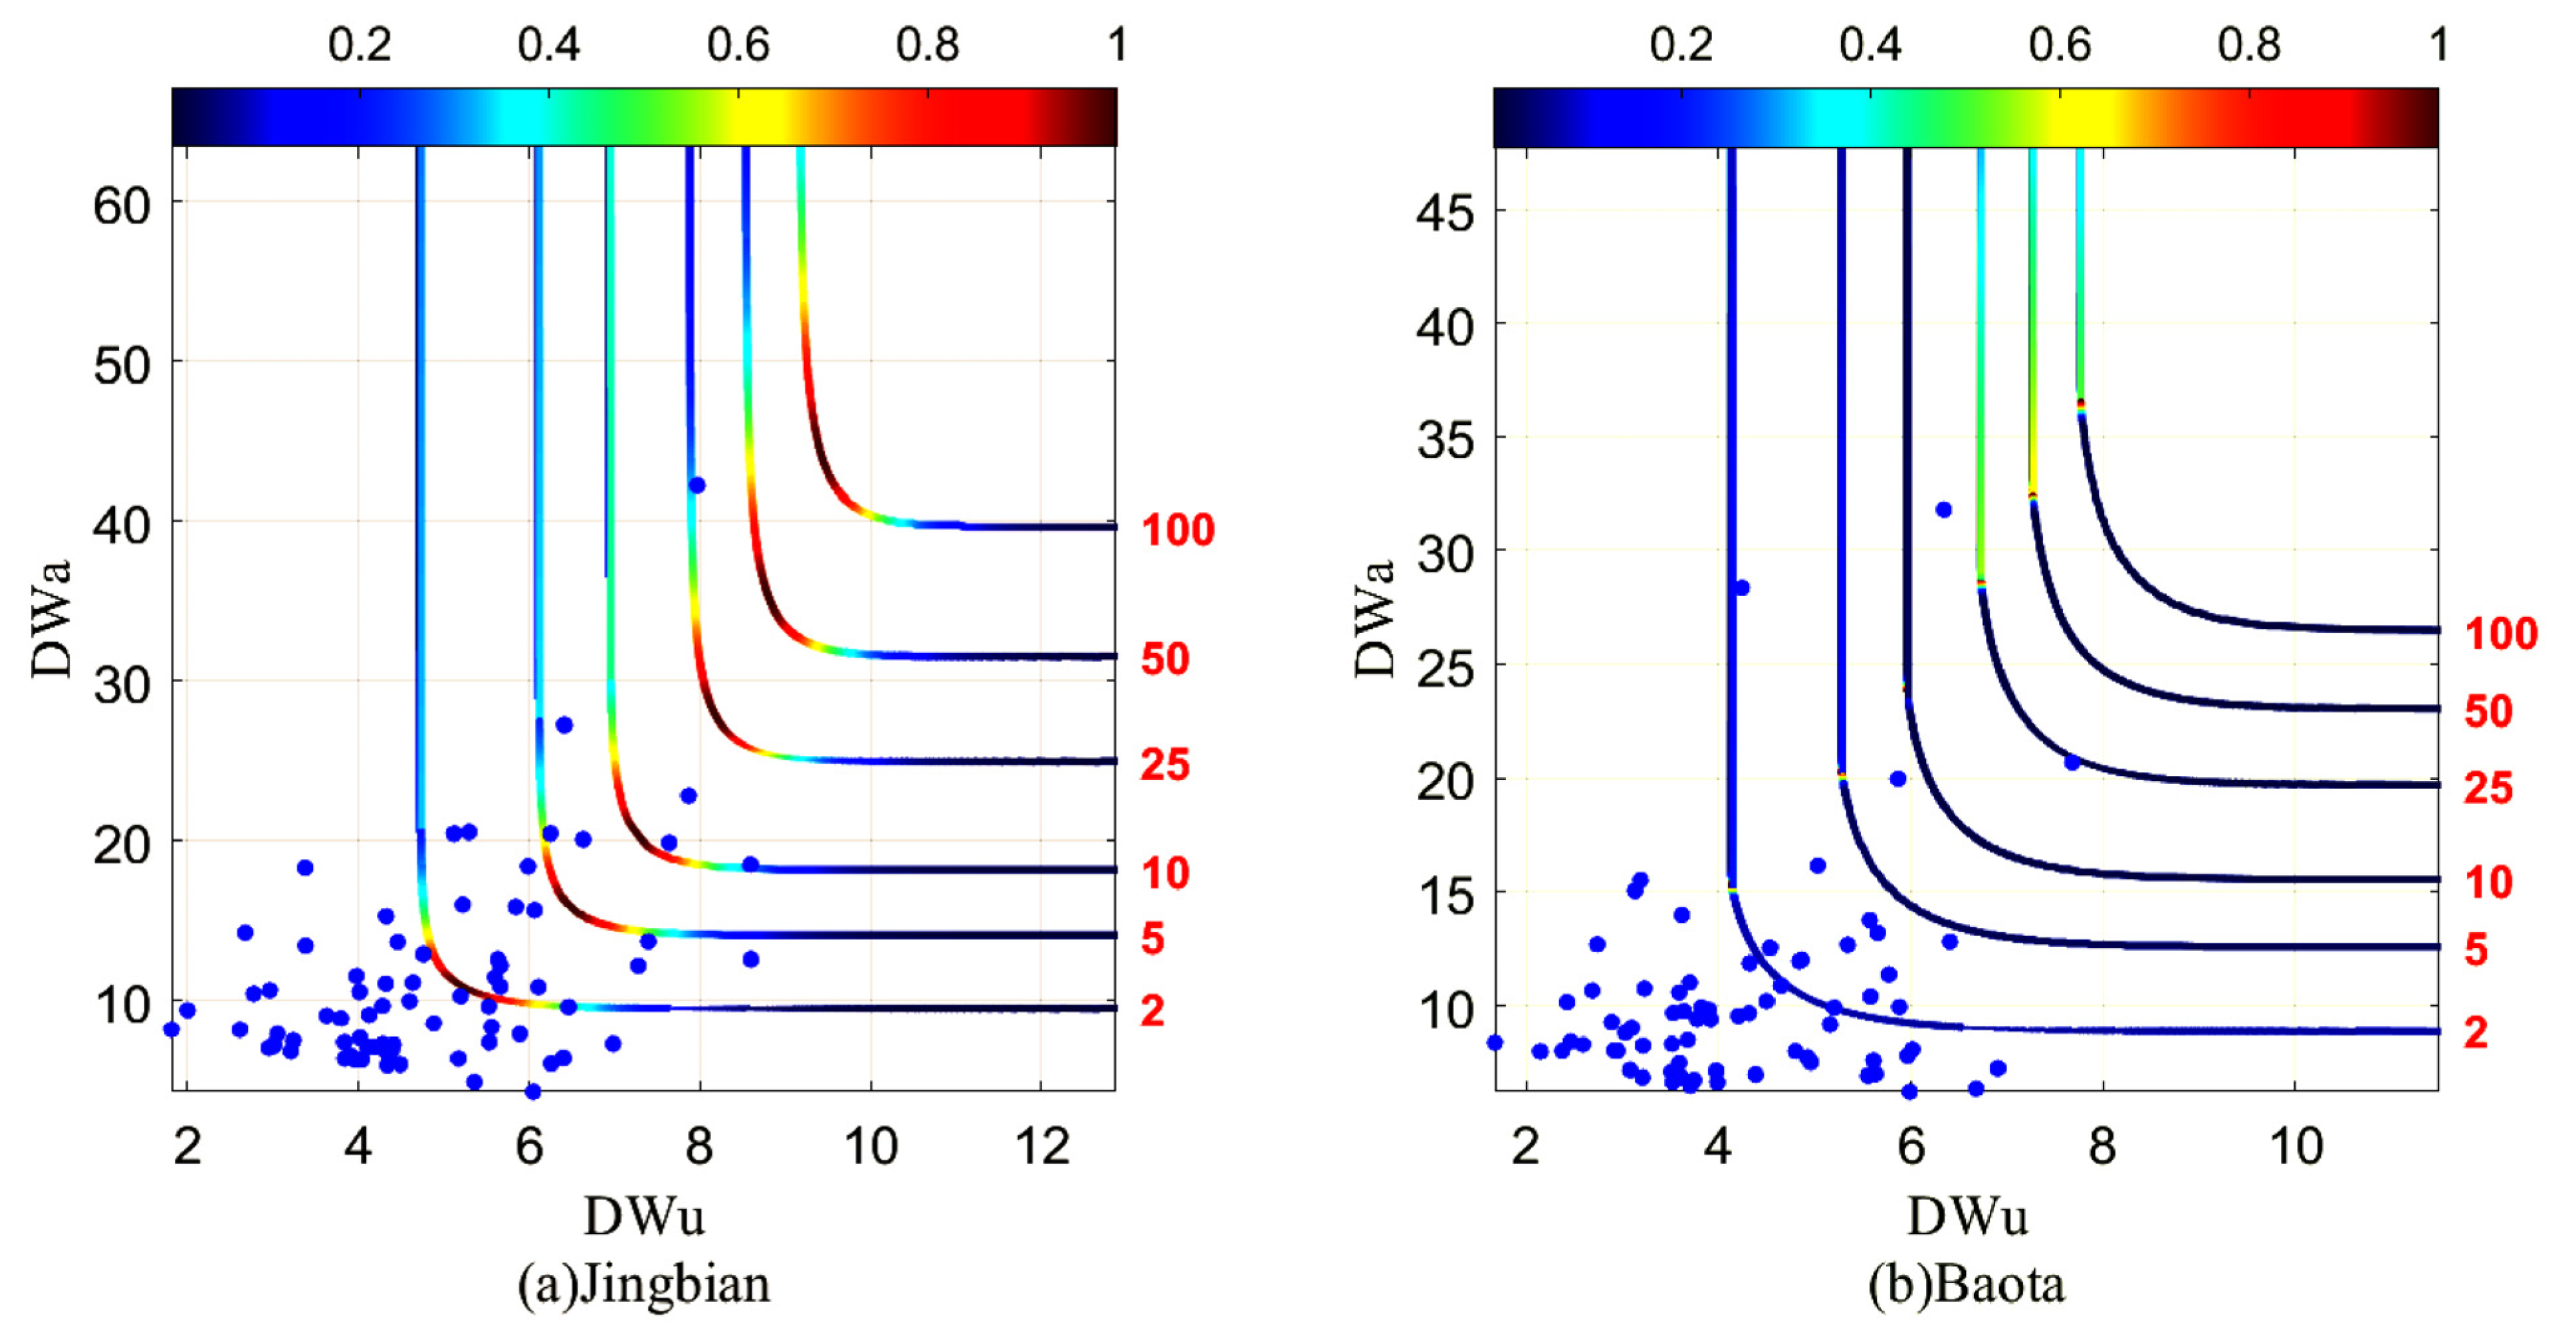
Taking Jingbian station and Baota station as examples, this study calculates the return periods of dry–wet events abrupt alternation. As can be seen from Figure 6, as the degree of “urgency” and “alternation” of the dry–wet events abrupt alternation increased, the return periods of the dry–wet events abrupt alternation at the two stations also increased. In Figure 6a, in Jingbian Station, 70% of the dry–wet events abrupt alternation had a return period less than 2 years, and 20% of the dry–wet events abrupt alternation had a return period between 2 years and 5 years. There were 7 dry–wet events abrupt alternation with a return period greater than 5 years, all of which were severe dry–wet events abrupt alternation. In Figure 6b, in Baota Station, 80% of dry–wet events abrupt alternation had a return period less than 2 years, and 15% of dry–wet events abrupt alternation had a return period between 2 years and 5 years. There were three dry–wet events abrupt alternation with a return period greater than 5 years, all of which were severe dry–wet events abrupt alternation. Therefore, it can be seen that Jingbian station is more prone to the occurrence of dry–wet events abrupt alternation with a large degree of “urgency” and “alternation.” The light dry–wet events abrupt alternation is more likely to occur at Baota station. The distribution of dry–wet events abrupt alternation in the other eight stations was similar to that in Jingbian station and Baota station.
5. Discussion and Conclusions
Based on the diurnal dry–wet events abrupt alternation index DWAAI, the dry–wet events abrupt alternation were identified and classified, and the spatial distribution of the occurrence frequency of different grades of dry–wet events abrupt alternation, the joint probability distribution of the degree of “urgency” and “alternation” of dry–wet events abrupt alternation and their recurrence period were obtained. On the basis of previous studies, the characteristics of dry–wet events abrupt alternation are further analyzed. The results show that the occurrence probability of severe dry–wet events abrupt alternation in northern Shaanxi is low, while the occurrence probability of moderate and light dry–wet events abrupt alternation is high, and the risk of dry–wet events abrupt alternation disasters in northern Jingbian is higher. At the same time, it is verified that the improved DWAAI index is suitable for the analysis of dry–wet abrupt turn events in northern Shaanxi, and the Copula function is also suitable for establishing the joint probability distribution of the two characteristic variables “urgency” and “alternation”.
This study used daily dry–wet events abrupt alternation index to identify dry–wet events abrupt alternation, only from the precipitation conditions into dryness and wetness, and dry–wet events abrupt alternation occur mainly in April to October, with the local main food crops and cash crops in the growth period of time, not considering soil conditions and irrigation situation, future research can optimize the dry–wet events abrupt alternation index, study of agricultural drought and flood. Moreover, only the spatial distribution and characteristics of dry–wet events abrupt alternations are discussed in this study, but the causes of dry–wet events abrupt alternation are not discussed in depth.
At present, the dry–wet events abrupt alternation has gradually become the research focus and hot spot of domestic and foreign scholars, and the country and region also pay more and more attention to the threat of dry–wet events abrupt alternation to crops and people’s life and property safety. The research on the characteristics and the occurrence and development law of dry–wet events abrupt alternation disaster can provide some reference for the Government’s decision-making and disaster prevention and reduction. In this study, the Copula function is applied to the analysis of the characteristics of dry–wet events abrupt alternation, which is innovative to some extent. This method can be applied to the analysis of the characteristics of dry–wet events abrupt alternation in other regions of the world, and our research results can also have certain reference value for regions with similar climate and topography. The analysis results of this paper are as follows:
(1) The daily dry–wet events abrupt alternation index is suitable for the identification of dry–wet events abrupt alternation in northern Shaanxi, which can more accurately identify different levels of dry–wet events abrupt alternation, and better describe the characteristics of “urgency” and “alternation” of dry–wet events abrupt alternation.
(2) During the period 1960–2019, dry–wet events abrupt alternation occurred more frequently in the study area, and light and moderate dry–wet events abrupt alternation occurred more frequently. The frequency of severe dry–wet events abrupt alternation is less. The station with the least number of occurrences had two severe events, and the stations with the most severe drought events had ten severe events. The frequency of severe events was more than 10% in the north of Jingbian, but less than 10% in the south.
(3) There is a certain correlation between the degree of “urgency” and “alternation” of dry–wet events abrupt alternation events, and the two characteristic variables can be connected by the copula function, and finally their joint probability distribution and return period can be obtained. When the degree of “urgency” and “alternation” of dry–wet events abrupt alternation increases, the joint cumulative probability increases as well. The number of events with the degree of “urgency” greater than 6 and the degree of “alternation” n greater than 18 is less. The combined cumulative probability of severe dry–wet events abrupt alternation at Jingbian station is 0.8, which is smaller than that at Baota station, indicating that severe events are more likely to occur at Jingbian station. The return periods of light and moderate dry–wet events abrupt alternation was less than five years, while the return periods of severe dry–wet events abrupt alternation were more than five years.
Author Contributions
Conceptualization, J.W. and G.R.; data curation, J.W. and K.L.; Funding acquisition, J.Z.; methodology, J.W.; writing—original draft, J.W.; writing—review and editing, G.R. and J.Z. All authors have read and agreed to the published version of the manuscript.
Funding
This work was supported by National Key R&D Program of China (2018YFC1508804); The Key Scientific and Technology Program of Jilin Province (20170204035SF); The Key Scientific and Technology Research and Development Program of Jilin Province (20180201033SF); and The Key Scientific and Technology Research and Development Program of Jilin Province (20180201035SF).
Data Availability Statement
The data presented in this study are available on request from the corresponding author.
Acknowledgments
We appreciate the editors and the reviewers for their constructive suggestions and insightful comments, which helped greatly to improve this manuscript.
Conflicts of Interest
The authors declare no conflict of interest.
References
- Amirataee, B.; Montaseri, M.; Rezaie, H. Regional analysis and derivation of copula-based drought Severity-Area-Frequency curve in Lake Urmia basin, Iran. J. Environ. Manag. 2018, 206, 134–144. [Google Scholar] [CrossRef] [PubMed]
- Feng, Y.; Li, Y.; Zhang, Z.; Gong, S.; Liu, M.; Peng, F. Multi-factor joint return period of rainstorms and its agricultural risk analysis in Liaoning Province, China. Geomat. Nat. Hazards Risk 2019, 10, 1988–2008. [Google Scholar] [CrossRef] [Green Version]
- Liu, Y.; Li, Y.; Li, L.; Chen, C. Spatiotemporal Variability of Monthly and Annual Snow Depths in Xinjiang, China over 1961–2015 and the Potential Effects. Water 2019, 11, 1666. [Google Scholar] [CrossRef] [Green Version]
- Tosunoglu, F.; Gürbüz, F.; İspirli, M.N. Multivariate modeling of flood characteristics using Vine copulas. Environ. Earth Sci. 2020, 79, 182–198. [Google Scholar] [CrossRef]
- Gaume, E.; Bain, V.; Bernardara, P.; Newinger, O.; Barbuc, M.; Bateman, A.; Blaskovicova, L.; Bloschl, G.; Borga, M.; Dumitrescu, A.; et al. A compilation of data on European flash floods. J. Hydrol. 2009, 367, 70–78. [Google Scholar] [CrossRef] [Green Version]
- Lesk, C.; Rowhani, P.; Ramankutty, N. Influence of extreme weather disasters on global crop production. Nature 2016, 529, 84–87. [Google Scholar] [CrossRef] [PubMed]
- Liao, Q.; Yu, G.; Jiang, W.S.; Lu, C.X.; Ma, Y.; Liu, K.X.; Lin, Q.; Wang, Y.P. Research on the Risk Assessment of Qingdao Marine Disaster Based on Flooding. Sustainability 2019, 11, 468. [Google Scholar] [CrossRef] [Green Version]
- Spinoni, J.; Naumann, G.; Carrao, H.; Barbosa, P.; Vogt, J. World drought frequency, duration, and severity for 1951–2010. Int J Clim. 2014, 34, 2792–2804. [Google Scholar] [CrossRef] [Green Version]
- Trenberth, K.E.; Dai, A.G.; Van Der Schrier, G.; Jones, P.D.; Barichivich, J.; Briffa, K.R.; Sheffield, J. Global warming and changes in drought. Nat. Clim. Chang. 2014, 4, 17–22. [Google Scholar] [CrossRef]
- Kastridis, A.; Stathis, D. Evaluation of Hydrological and Hydraulic Models Applied in Typical Mediterranean Ungauged Watersheds Using Post-Flash-Flood Measurements. Hydrology 2020, 7, 12. [Google Scholar] [CrossRef] [Green Version]
- Aitkenhead, I.; Kuleshov, Y.; Watkins, A.B.; Bhardwaj, J.; Asghari, A. Assessing agricultural drought management strategies in the Northern Murray–Darling Basin. Nat. Hazards 2021, 34, 1–31. [Google Scholar]
- Mohammadi, M.; Darabi, H.; Mirchooli, F.; Bakhshaee, A.; Haghighi, A.T. Flood risk mapping and crop-water loss modeling using water footprint analysis in agricultural watershed, northern Iran. Nat. Hazards 2020, 33, 1–19. [Google Scholar] [CrossRef]
- Zarei, A.R.; Moghimi, M.M.; Koohi, E. Sensitivity Assessment to the Occurrence of Different Types of Droughts Using GIS and AHP Techniques. Water Resour. Manag 2021, 35, 1–23. [Google Scholar]
- Chang, X.; Xu, Z.; Zhao, G.; Cheng, T.; Song, S. Spatial and temporal variations of precipitation during 1979–2015 in Jinan City, China. J. Water Clim. Chang. 2018, 9, 540–554. [Google Scholar] [CrossRef]
- Zhang, J.; Sun, F.; Liu, W.; Liu, J.; Wang, H. Spatio-temporal patterns of drought evolution over the Beijing-Tianjin-Hebei region, China. J. Geogr. Sci. 2019, 29, 863–876. [Google Scholar] [CrossRef] [Green Version]
- Li, K.; Tong, Z.; Liu, X.; Zhang, J.; Tong, S. Quantitative assessment and driving force analysis of vegetation drought risk to climate change: Methodology and application in Northeast China. Agric. For. Meteorol. 2020, 282–283, 107865. [Google Scholar]
- Rui, Z.; Guo, C.Q.; Fu, Q.J.; Pan, L.Y. Study on the Drought and Flood Disasters Formation Mechanism in Karst Regions of Middle Guangxi. Procedia Eng. 2012, 28, 277–281. [Google Scholar] [CrossRef] [Green Version]
- Gall, M. The suitability of disaster loss databases to measure loss and damage from climate change. Int. J. Glob. Warm. 2015, 8, 170–190. [Google Scholar] [CrossRef]
- Rzepka-Plevneš, D.; Krupa-Małkiewicz, M.; Kurek, J.; Smolik, M. Effects of water deficits on development and yield of rye varieties differing in tolerance to drought at seedling stage. J. Food Agric. Environ. 2009, 7, 492–495. [Google Scholar]
- Yu, J.; Jiang, M.; Guo, C. Crop Pollen Development under Drought: From the Phenotype to the Mechanism. Int J Mol Sci. 2019, 20, 1550. [Google Scholar] [CrossRef] [Green Version]
- Shi, Y.; Zhai, G.; Zhou, S.; Lu, Y.; Chen, W.; Deng, J. How Can Cities Respond to Flood Disaster Risks under Multi-Scenario Simulation? A Case Study of Xiamen, China. Int. J. Environ. Res. Public Health 2019, 16, 618. [Google Scholar] [CrossRef] [PubMed] [Green Version]
- Zhu, Y.; Li, L.; Zhao, Y.; Liang, Z.; Li, H.; Wang, L.; Wang, Q. Regional comprehensive drought disaster risk dynamic evaluation based on projection pursuit clustering. Water Policy 2018, 20, 410–428. [Google Scholar] [CrossRef]
- Yan, D.; Han, D.; Wang, G.; Yuan, Y.; Hu, Y.; Fang, H. The evolution analysis of flood and drought in Huai River Basin of China based on monthly precipitation characteristics. Nat. Hazards 2014, 73, 849–858. [Google Scholar] [CrossRef]
- Li, C.; Wang, R.H.; Xu, J.X.; Luo, Y.J.; Tan, M.L.; Jiang, Y.L. Analysis of meteorological dryness/wetness features for spring wheat production in the Ili River basin, China. Int. J. Biometeorol. 2018, 62, 2197–2204. [Google Scholar] [CrossRef]
- Shi, W.Z.; Huang, S.Z.; Liu, D.F.; Huang, Q.; Han, Z.M.; Leng, G.Y.; Wang, H.; Liang, H.; Li, P.; Wei, X.T. Drought-flood abrupt alternation dynamics and their potential driving forces in a changing environment. J. Hydrol. 2021, 597, 126179. [Google Scholar] [CrossRef]
- Shan, L.J.; Zhang, L.P.; Song, J.Y.; Zhang, Y.J.; She, D.X.; Xia, J. Characteristics of dry-wet abrupt alternation events in the middle and lower reaches of the Yangtze River Basin and the relationship with ENSO. J. Geogr. Sci. 2018, 28, 1039–1058. [Google Scholar] [CrossRef] [Green Version]
- Shen, B.Z.; Zhang, S.X.; Yang, H.W.; Wang, K.; Feng, G.L. Analysis of characteristics of a sharp turn from drought to flood in the middle and lower reaches of the Yangtze River in spring and summer in 2011. Acta Phys. Sin. 2012, 61, 109202. [Google Scholar]
- Wang, C.H.; Li, K.C.; Santisirisomboon, J. Wave activities characteristics during a sudden sharp drought-flood turn event in 2011 in East China. Int. J. Clim. 2021, 41, 3469–3480. [Google Scholar] [CrossRef]
- Ji, Z.H.; Li, N.; Wu, X.H. Threshold determination and hazard evaluation of the disaster about drought/flood sudden alternation in Huaihe River basin, China. Theor. Appl. Climatol. 2018, 133, 1279–1289. [Google Scholar] [CrossRef]
- Yang, Y.H.; Weng, B.S.; Bi, W.X.; Xu, T.; Yan, D.M.; Ma, J. Climate Change Impacts on Drought-Flood Abrupt Alternation and Water Quality in the Hetao Area, China. Water 2019, 11, 652. [Google Scholar] [CrossRef] [Green Version]
- Wu, Z.W.; Li, J.P.; He, J.H.; Jiang, Z.H. Large-scale atmospheric singularities and summer long-cycle droughts-floods abrupt alternation in the middle and lower reaches of the Yangtze River. Chin. Sci. Bull. 2006, 51, 2027–2034. [Google Scholar] [CrossRef]
- Gao, Y.; Hu, T.S.; Wang, Q.; Yuan, H.W.; Yang, J.W. Effect of Drought-Flood Abrupt Alternation on Rice Yield and Yield Components. Crop Sci. 2019, 59, 280–292. [Google Scholar] [CrossRef]
- Xiong, Q.Q.; Deng, Y.; Zhong, L.; He, H.H.; Chen, X.R. Effects of Drought-Flood Abrupt Alternation on Yield and Physiological Characteristics of Rice. Int. J. Agric. Biol. 2018, 20, 1107–1116. [Google Scholar]
- Yang, S.Y.; Wu, B.Y.; Zhang, R.H.; Zhou, S.W. Relationship between an abrupt drought-flood transition over mid-low reaches of the Yangtze River in 2011 and the intraseasonal oscillation over mid-high latitudes of East Asia. Acta Meteorol. Sin. 2013, 27, 129–143. [Google Scholar] [CrossRef]
- Zhang, Z.Z.; Yuan, Y.J.; Shen, D.F.; Fan, H. Analysis of drought-flood abrupt alternation of tobacco based on precipitation and soil ponding in siuwen china. Appl. Ecol. Environ. Res. 2019, 17, 12271–12286. [Google Scholar] [CrossRef]
- Zhao, Y.; Weng, Z.H.; Chen, H.; Yang, J.W. Analysis of the Evolution of Drought, Flood, and Drought-Flood Abrupt Alternation Events under Climate Change Using the Daily SWAP Index. Water 2020, 12, 1969. [Google Scholar] [CrossRef]
- Cao, Y.; Liu, J.; Wang, X.; Wang, Q. Drought-and-flood period, mutation point and trend analysis in Huang-Huai-Hai River Basin. Arid Land Geogr. 2016, 39, 275–284. [Google Scholar]
- Cheng, Z.; Xu, M.; Luo, L.; Ding, X. Climate Characteristics of Drought–flood Abrupt Change Events in Huaihe River Basin. J. China Hydrol. 2012, 32, 73–79. [Google Scholar]
- Liu, Y.; Chen, S.J.; Sun, H.W.; Gui, D.W.; Xue, J.; Lei, J.Q.; Zeng, X.F.; Lv, G.H. Does the long-term precipitation variations and dry-wet conditions exist in the arid areas? A case study from China. Quat. Int. 2019, 519, 3–9. [Google Scholar] [CrossRef]
- Hui-Mean, F.; Yusof, F.; Yusop, Z.; Suhaila, J. Trivariate copula in drought analysis: A case study in peninsular Malaysia. Theor. Appl. Climatol. 2019, 138, 657–671. [Google Scholar] [CrossRef]
- Sina, N.; Ahmad, S.; Mundher, Y.Z.; Shamsuddin, S. Copula based assessment of meteorological drought characteristics: Regional investigation of Iran. Agric. For. Meteorol. 2019, 276–277, 107611. [Google Scholar]
- Fan, H.; Zhang, Z.Z.; Wu, F.; Xu, J.X.; Shen, D.F.; Yuan, Y.J. Spatial and temporal evolution characteristics of drought-flood abrupt alternation in guizhou province in recent 50 years based on dwaai index. Appl. Ecol. Environ. Res. 2019, 17, 12227–12244. [Google Scholar] [CrossRef]
- Kastridis, A.; Kirkenidis, C.; Sapountzis, M. An integrated approach of flash flood analysis in ungauged Mediterranean watersheds using post-flood surveys and unmanned aerial vehicles. Hydrol. Process. 2020, 34, 4920–4939. [Google Scholar] [CrossRef]
- Moriasi, D.N.; Arnold, J.G.; Van Liew, M.W.; Bingner, R.L.; Harmel, R.D.; Veith, T.L. Model evaluation guidelines for systematic quantification of accuracy in watershed simulations. Trans. ASABE 2007, 50, 885–900. [Google Scholar] [CrossRef]
- Singh, J.; Knapp, H.V.; Arnold, J.G.; Demissie, M. Hydrological modeling of the iroquois river watershed using HSPF and SWAT. J. Am. Water Resour. 2005, 41, 343–360. [Google Scholar] [CrossRef]
Figure 1.
The spatial distribution of 10 meteorological stations in Northern Shaanxi.

Figure 2.
Changes of rainfall and DWAAI before and after four typical dry–wet events abrupt alternation at Yulin Station.
Figure 2.
Changes of rainfall and DWAAI before and after four typical dry–wet events abrupt alternation at Yulin Station.

Figure 3.
The frequency distribution of dry–wet events abrupt alternation of different grades in northern Shaanxi during 1960–2019: (a) light; (b) moderate; (c) severe.
Figure 3.
The frequency distribution of dry–wet events abrupt alternation of different grades in northern Shaanxi during 1960–2019: (a) light; (b) moderate; (c) severe.

Figure 4.
The marginal distribution fitting and quantile–quantile(Q–Q) plots of 10 stations dry–wet events abrupt alternation variables from 1960 to 2019.
Figure 4.
The marginal distribution fitting and quantile–quantile(Q–Q) plots of 10 stations dry–wet events abrupt alternation variables from 1960 to 2019.


Figure 5.
The joint probability Jingbian (a) and Baota (b) dry–wet events abrupt alternation variables from 1960 to 2019.
Figure 5.
The joint probability Jingbian (a) and Baota (b) dry–wet events abrupt alternation variables from 1960 to 2019.

Figure 6.
Joint return period contour line of dry–wet events abrupt alternation in Jingbian (a) and Baota (b).
Figure 6.
Joint return period contour line of dry–wet events abrupt alternation in Jingbian (a) and Baota (b).


Table 1.
Dry–wet events abrupt alternation classification standard.
| DWAAI | DWAA Level |
|---|---|
| >0~10 | None |
| >10~16 | Light |
| >16~24 | Moderate |
| >24 | Severe |
Table 2.
Copulas and their Mathematical Description.
| Copula Type | Copula Formula | Parameter Range |
|---|---|---|
| Joe | ||
| Farlie-Gumbel-Morgenstern (FGM) | ||
| Burr | ||
| Marshall-Olkin | ||
| Fischer-Hinzmann | ||
| Roch-Alegre | ||
| Tawn |
Note: u, v are marginal distribution functions of “urgency” and “alternation”.
Table 3.
Pearson correlation coefficient and P value of each station.
| Station | Pearson | p Value |
|---|---|---|
| Yulin | 0.4858 | 0.0000 |
| Shenmu | 0.5310 | 0.0000 |
| Dingbian | 0.2501 | 0.0226 |
| Jingbian | 0.4803 | 0.0000 |
| Wuqi | 0.2751 | 0.0043 |
| Hengshan | 0.3570 | 0.0028 |
| Suide | 0.3509 | 0.0052 |
| Baota | 0.2696 | 0.0202 |
| Yanchang | 0.4046 | 0.0005 |
| Luochuan | 0.3280 | 0.0034 |
Table 4.
The marginal distribution function and parameter values corresponding to dry–wet events abrupt alternation variables of meteorological stations in northern Shaanxi.
Table 4.
The marginal distribution function and parameter values corresponding to dry–wet events abrupt alternation variables of meteorological stations in northern Shaanxi.
| Station | Variable | Function | Parameter | Value |
|---|---|---|---|---|
| Yulin | DWu | Generalized Pareto | k | −1.0184 |
| sigma | 5.8354 | |||
| theta | 1.7711 | |||
| DWa | Generalized Extreme Value | k | 0.3638 | |
| sigma | 2.8110 | |||
| mu | 8.3674 | |||
| Shenmu | DWu | Inverse Gaussian | mu | 4.7247 |
| lambda | 36.1879 | |||
| DWa | Generalized Extreme Value | k | 0.3392 | |
| sigma | 2.8688 | |||
| mu | 8.5185 | |||
| Dingbian | DWu | Gamma | a | 9.5575 |
| b | 0.4582 | |||
| DWa | Loglogistic | mu | 2.0924 | |
| sigma | 0.2440 | |||
| Jingbian | DWu | Gamma | a | 10.0449 |
| b | 0.4859 | |||
| DWa | Generalized Extreme Value | k | 0.3192 | |
| sigma | 2.9900 | |||
| mu | 8.3685 | |||
| Wuqi | DWu | Inverse Gussian | mu | 4.3756 |
| lambda | 39.5976 | |||
| DWa | Inverse Gussian | mu | 9.6819 | |
| lambda | 97.3290 | |||
| Hengshan | DWu | Loglogistic | mu | 1.5660 |
| sigma | 0.1611 | |||
| DWa | Generalized Pareto | k | −0.2260 | |
| sigma | 6.8166 | |||
| theta | 5.2102 | |||
| Suide | DWu | Gamma | a | 8.2977 |
| b | 0.5568 | |||
| DWa | Generalized Pareto | k | −0.4034 | |
| sigma | 8.8193 | |||
| theta | 4.6478 | |||
| Baota | DWu | Gamma | a | 11.1731 |
| b | 0.3811 | |||
| DWa | Generalized Pareto | k | 0.0697 | |
| sigma | 3.7401 | |||
| theta | 6.2085 | |||
| Yanchang | DWu | Nakagami | mu | 2.3438 |
| omega | 21.1845 | |||
| DWa | Generalized Extreme Value | k | 0.2636 | |
| sigma | 2.7252 | |||
| mu | 8.3915 | |||
| Luochuan | DWu | Loglogistic | mu | 1.4604 |
| sigma | 0.1986 | |||
| DWa | Inverse Gussian | mu | 10.8882 | |
| lambda | 80.5783 |
Table 5.
The selection of the Copula function.
| Station | Copula | RMSE | NSE | SD |
|---|---|---|---|---|
| Yulin | Fischer-Hinzmann | 0.3212 | 0.9820 | 4.7266 |
| Roch-Alegre | 0.3515 | 0.9784 | ||
| Joe | 0.3677 | 0.9764 | ||
| Shenmu | Fischer-Hinzmann | 0.2658 | 0.9858 | 4.5622 |
| Joe | 0.2920 | 0.9829 | ||
| Burr | 0.2966 | 0.9824 | ||
| Dingbian | Roch-Alegre | 0.2741 | 0.9879 | 3.3515 |
| Joe | 0.3042 | 0.9851 | ||
| Burr | 0.3071 | 0.9848 | ||
| Jingbian | Joe | 0.2911 | 0.9863 | 4.3874 |
| Fischer-Hinzmann | 0.2833 | 0.9871 | ||
| Roch-Alegre | 0.2843 | 0.9870 | ||
| Wuqi | Burr | 0.2123 | 0.9913 | 2.4379 |
| Joe | 0.2145 | 0.9911 | ||
| Roch-Alegre | 0.2139 | 0.9912 | ||
| Hengshan | Joe | 0.2356 | 0.9884 | 3.4591 |
| Burr | 0.2372 | 0.9883 | ||
| Fischer-Hinzmann | 0.2316 | 0.9888 | ||
| Suide | Roch-Alegre | 0.1879 | 0.9931 | 3.3441 |
| Fischer-Hinzmann | 0.2033 | 0.9919 | ||
| Joe | 0.2327 | 0.9894 | ||
| Baota | Tawn | 0.1906 | 0.9927 | 3.2504 |
| Marshal-Olkin | 0.1969 | 0.9922 | ||
| FGM | 0.2208 | 0.9902 | ||
| Yanchang | Fischer-Hinzmann | 0.3342 | 0.9816 | 4.0443 |
| Joe | 0.3565 | 0.9790 | ||
| Burr | 0.3605 | 0.9786 | ||
| Luochuan | Roch-Alegre | 0.2293 | 0.9907 | 3.2095 |
| Joe | 0.2511 | 0.9889 | ||
| Burr | 0.2552 | 0.9885 |
Publisher’s Note: MDPI stays neutral with regard to jurisdictional claims in published maps and institutional affiliations. |
© 2021 by the authors. Licensee MDPI, Basel, Switzerland. This article is an open access article distributed under the terms and conditions of the Creative Commons Attribution (CC BY) license (https://creativecommons.org/licenses/by/4.0/).
Share and Cite
MDPI and ACS Style
Wang, J.; Rong, G.; Li, K.; Zhang, J. Analysis of Characteristics of Dry–Wet Events Abrupt Alternation in Northern Shaanxi, China. Water 2021, 13, 2384. https://doi.org/10.3390/w13172384
AMA Style
Wang J, Rong G, Li K, Zhang J. Analysis of Characteristics of Dry–Wet Events Abrupt Alternation in Northern Shaanxi, China. Water. 2021; 13(17):2384. https://doi.org/10.3390/w13172384
Chicago/Turabian StyleWang, Junhui, Guangzhi Rong, Kaiwei Li, and Jiquan Zhang. 2021. "Analysis of Characteristics of Dry–Wet Events Abrupt Alternation in Northern Shaanxi, China" Water 13, no. 17: 2384. https://doi.org/10.3390/w13172384
Note that from the first issue of 2016, this journal uses article numbers instead of page numbers. See further details here.