
The Cost of Brine Dilution in the Desalination Plants of Alicante


1
Mancomunidad de los Canales del Taibilla, Cartagena 30201, Colombia
2
Departamento de Ingeniería Química, Universidad de Alicante, P.O. Box 99, 03080 Alicante, Spain
3
Departamento de Ciencias del Mar y Biología Aplicada, Universidad de Alicante, P.O. Box 99, 03080 Alicante, Spain
*
Author to whom correspondence should be addressed.
Water 2021, 13(17), 2386; https://doi.org/10.3390/w13172386
Submission received: 12 July 2021
/
Revised: 27 August 2021
/
Accepted: 29 August 2021
/
Published: 30 August 2021
(This article belongs to the Special Issue Management and Evaluation of Environmental Impacts in the Marine Environment)
Abstract
:To reduce the environmental impact of desalination plants, a good dilution of the brine is needed. Brine dilution may be carried out using diffusers, by mixing the concentrate with other effluents, or with seawater bypassing. Seawater bypassing increases the energy consumption of the plant but, thus far, this energy consumption has not been estimated. The environmental impact statement (EIS) of desalination plants in Alicante establishes a system of seawater bypassing for diluting brine and protecting the Posidonia oceanica seagrass meadows. The aim of this paper is to quantify the energy consumption of brine dilution, which was necessary for meeting the environmental requirements from 2012 to 2018. During the research period, the plants’ operation was variable, as it depended on the supply needs. The results indicate that the energy consumption of the dilution systems fluctuated between 2,135,315 kWh in 2012 and 685,988 kWh in 2013, with an average consumption of 1,205,952 kWh for the selected period. The energy cost in 2012 was EUR 179,556, while that for 2013 was EUR 60,787, with an average annual cost of EUR 91,690. This interannual variability is due to the difference in the production values of the plants and in the dilution ratio, which oscillated between 2.5 and 7.5 seawater:brine. In addition, the dilution showed an additional cost of the energy consumed by the desalination plants of around 1.7% on average. However, it also allowed the fulfillment of the established requirements in the EIS and the protection of the Posidonia oceanica seagrass from the discharge of the desalination plants.
1. Introduction
One major concern regarding the development of seawater desalination is the impact of brine on the marine environment [1]. Concentrate discharge may affect sensitive species [2,3,4,5], thus reducing the biodiversity in marine environments [6,7,8,9]. It has been demonstrated that, in order to reduce or minimize these impacts, it is necessary to maximize the mixing of brine with seawater [10,11]. The natural dispersion of effluent mainly depends on site-specific conditions—such as bathymetry (slope of the seafloor and water depth), geomorphology (bottom relief and roughness or rugosity), and hydrodynamics (waves, currents, and tides) [12,13])—but it also depends on the disposal methods, which may include the use of single or multiport diffusers [13,14]. In some cases, the salinity of the discharge may be reduced by mixing the brine with cooling water from a co-located power plant, or with treated wastewater effluent [15,16]. When these possibilities are not available, the mixing behavior can also be improved by bypassing seawater and mixing it with brine to reduce its salinity before its discharge to the marine environment [17]. In the Javea desalination plant (Alicante, Spain), a constant seawater-to-brine ratio of 4:1 is used to reduce the discharge salinity to below 44 psu, and a similar strategy is used for the Alcudia plant (Balearic Islands, Spain) [18,19,20]. Seawater bypassing increases the energy consumption of desalination plants; however, to this day, its energy consumption has not been quantified in detail. Only in the desalination plant of Javea, Sola et al. [20] indicate that the dilution system represents less than 3% of the cost of the plant’s energy consumption.
The SWRO desalination plant of Alicante I began operations in September 2003. Initially, it had a maximum capacity of 50,000 m3 d−1. The discharge was produced in a previously degraded area, 2 km away from the closest seagrass meadows. Later, the environmental monitoring program observed a lower dilution of brine than predicted by the models [21]. Moreover, some impacts on the discharge area were observed, including a sublethal effect on seagrass meadows, the disappearance of echinoderms [22], and a reduction in the abundance and diversity of soft-bottom infauna [6,7]. In January 2006, the plant was enlarged to produce up to 57,500 m3 d−1, and in 2008, Alicante II started to operate, with a capacity of up to 65,000 m3 d−1. The environmental impact statements of the enlargement of both the Alicante I and Alicante II plants establish the condition of seawater bypassing to comply with the environmental threshold limits so as to protect the Posidonia oceanica seagrass meadows [23,24]. The objective of this work is to describe the dilution system of the Alicante desalination plants and quantify their energy consumption costs between 2012 and 2019.
2. Materials and Methods
2.1. Description of the Dilution Facility
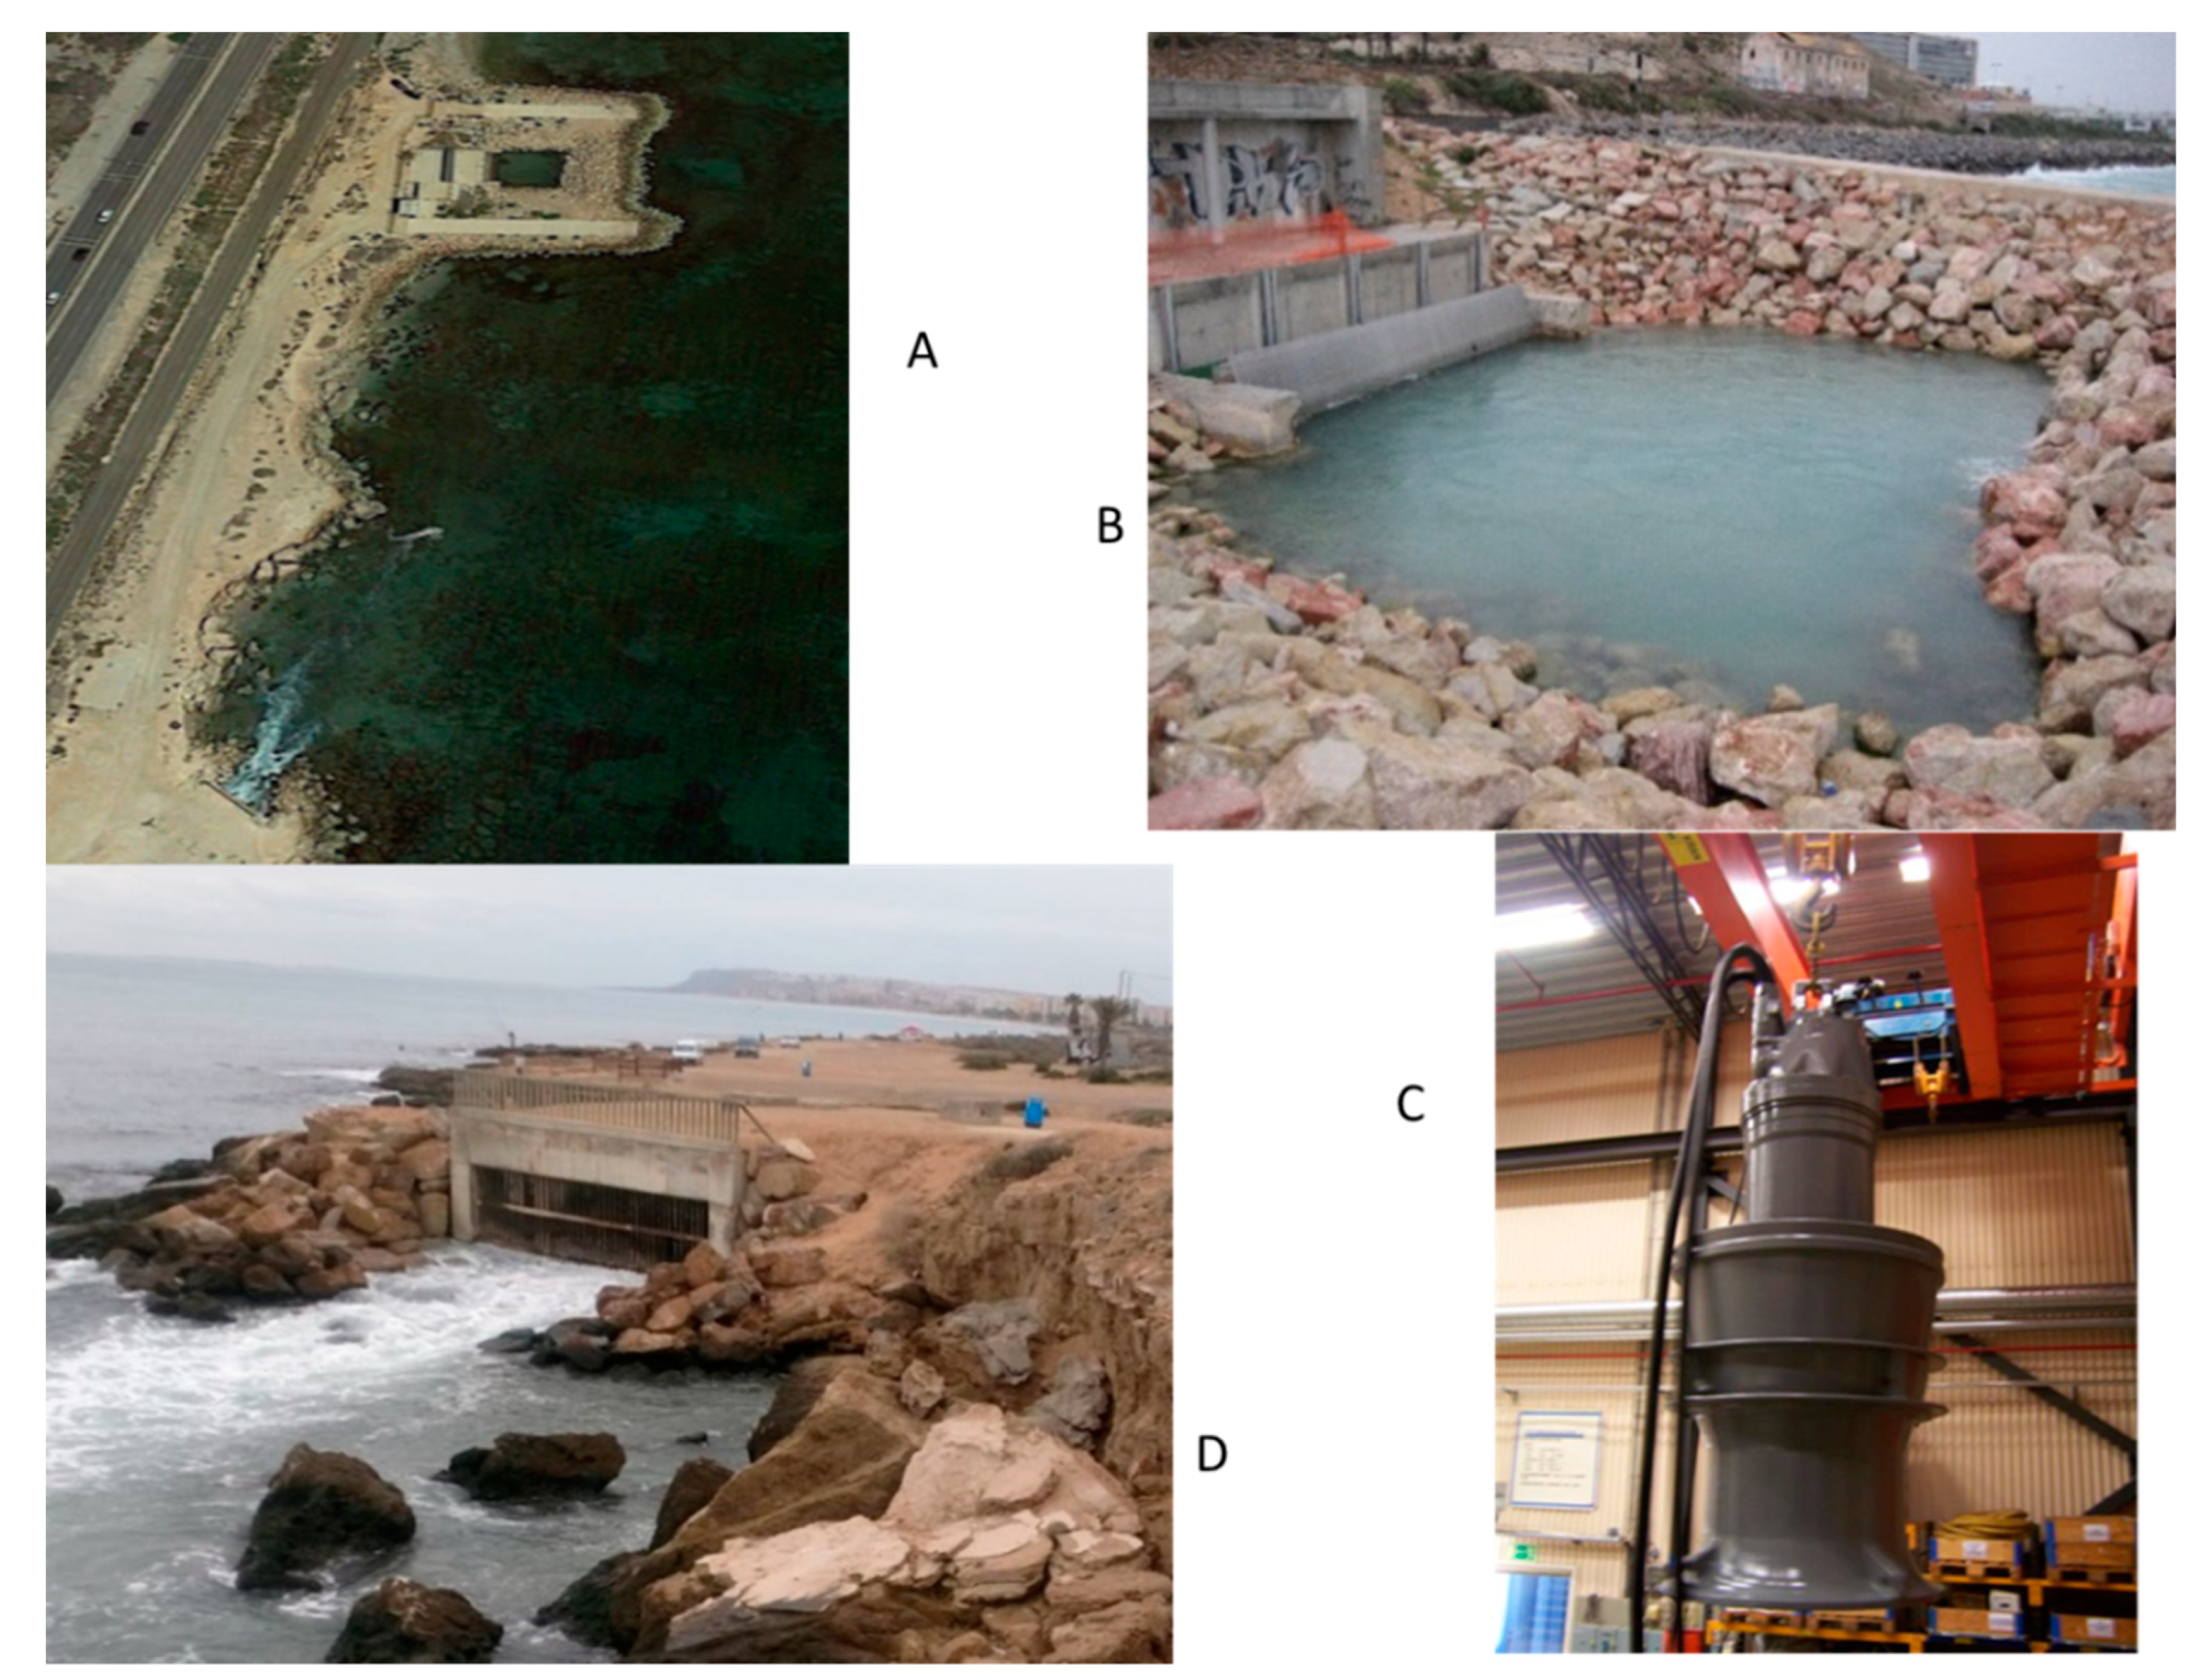
The seawater pumping facility (SWPF) for brine dilution is located approximately 200 m north of the discharge point (Figure 1 and Figure 2A); it consists of a combined water inlet that utilizes six 1.5 m diameter pipes with a length of 17.5 m, allowing a total inlet flow of 8640 m3/h. These tubes are located under a breakwater with a lower longitudinal axis of approximately 2.3 m below the sea surface. The water passing through the pipes arrives at a calming pond to finally reach the catchment tank of the seawater pumps. The dimensions of the calming pond are approximately 10 m in length and 12 m in width, with an average depth of approximately 2.5 m (Figure 2B); it must be periodically dredged to remove the accumulated sand inside it.
The seawater pumping group consists of four submersible pumps, one of which is for reserve. Each pump has a maximum operating flow of 2600 L/s, a nominal intensity of 475 A, a voltage of 400 V, and a rated power of 230 kWh. Figure 2C displays a dilution pump removed from its housing case for inspection and maintenance. Each of these pumps is housed in a compartment built according to the pump manufacturer’s instructions to improve the pump’s performance, allowing seawater to be efficiently channeled to the helix with the vortex plates, which are installed in each housing case. They are made of carbon steel and coated with epoxy paint to retard the effects of corrosion. In addition, each of the four pumps is located inside a steel jacket that has a triple function: containing the pump, making it solidary to the installation, and channeling water for better operational performance. A variable speed drive is coupled with two of the seawater pumps to regulate the rotational speed of the electric motor and guarantee that it works according to the dilution needs, thus reducing the pumps’ energy consumption. The other pumps have an automatic voltage regulator.
The seawater, driven by the pumps, is conducted through a class V ASTM C-76 concrete pipe to the discharge point of the brine. The seawater is perpendicularly injected into the brine from the desalination plants so as to generate enough turbulence to reach the desired mixing speed. Thus, the salinity of the final effluent can be made adequate, which is necessary to meet the environmental objectives for which this installation was planned. The discharge of the final effluent can be observed in Figure 2D.
2.2. Annual Electricity Consumption
The energy consumption of the dilution installation was ascertained using a network analyzer (model PM710) located in the engine control center (CCM). This equipment allows the measurement of the power, intensity, voltage, and consumed energy. The consumed energy was recorded daily. In addition to these parameters, the network analyzer detects the excess power consumption and analyzes the loading curves to check the points of the maximum energy load in the installation so as to optimize it.
The electricity consumption of the dilution installation was recorded from 2012 to 2018, and the total dilution cost was estimated monthly by multiplying the electricity consumption by the price of the supplied energy.
It must be taken into account that the cost estimates only include the costs corresponding to the electrical energy consumption. The costs of the maintenance, conservation, and operation personnel of each desalination plant were not considered.
3. Results
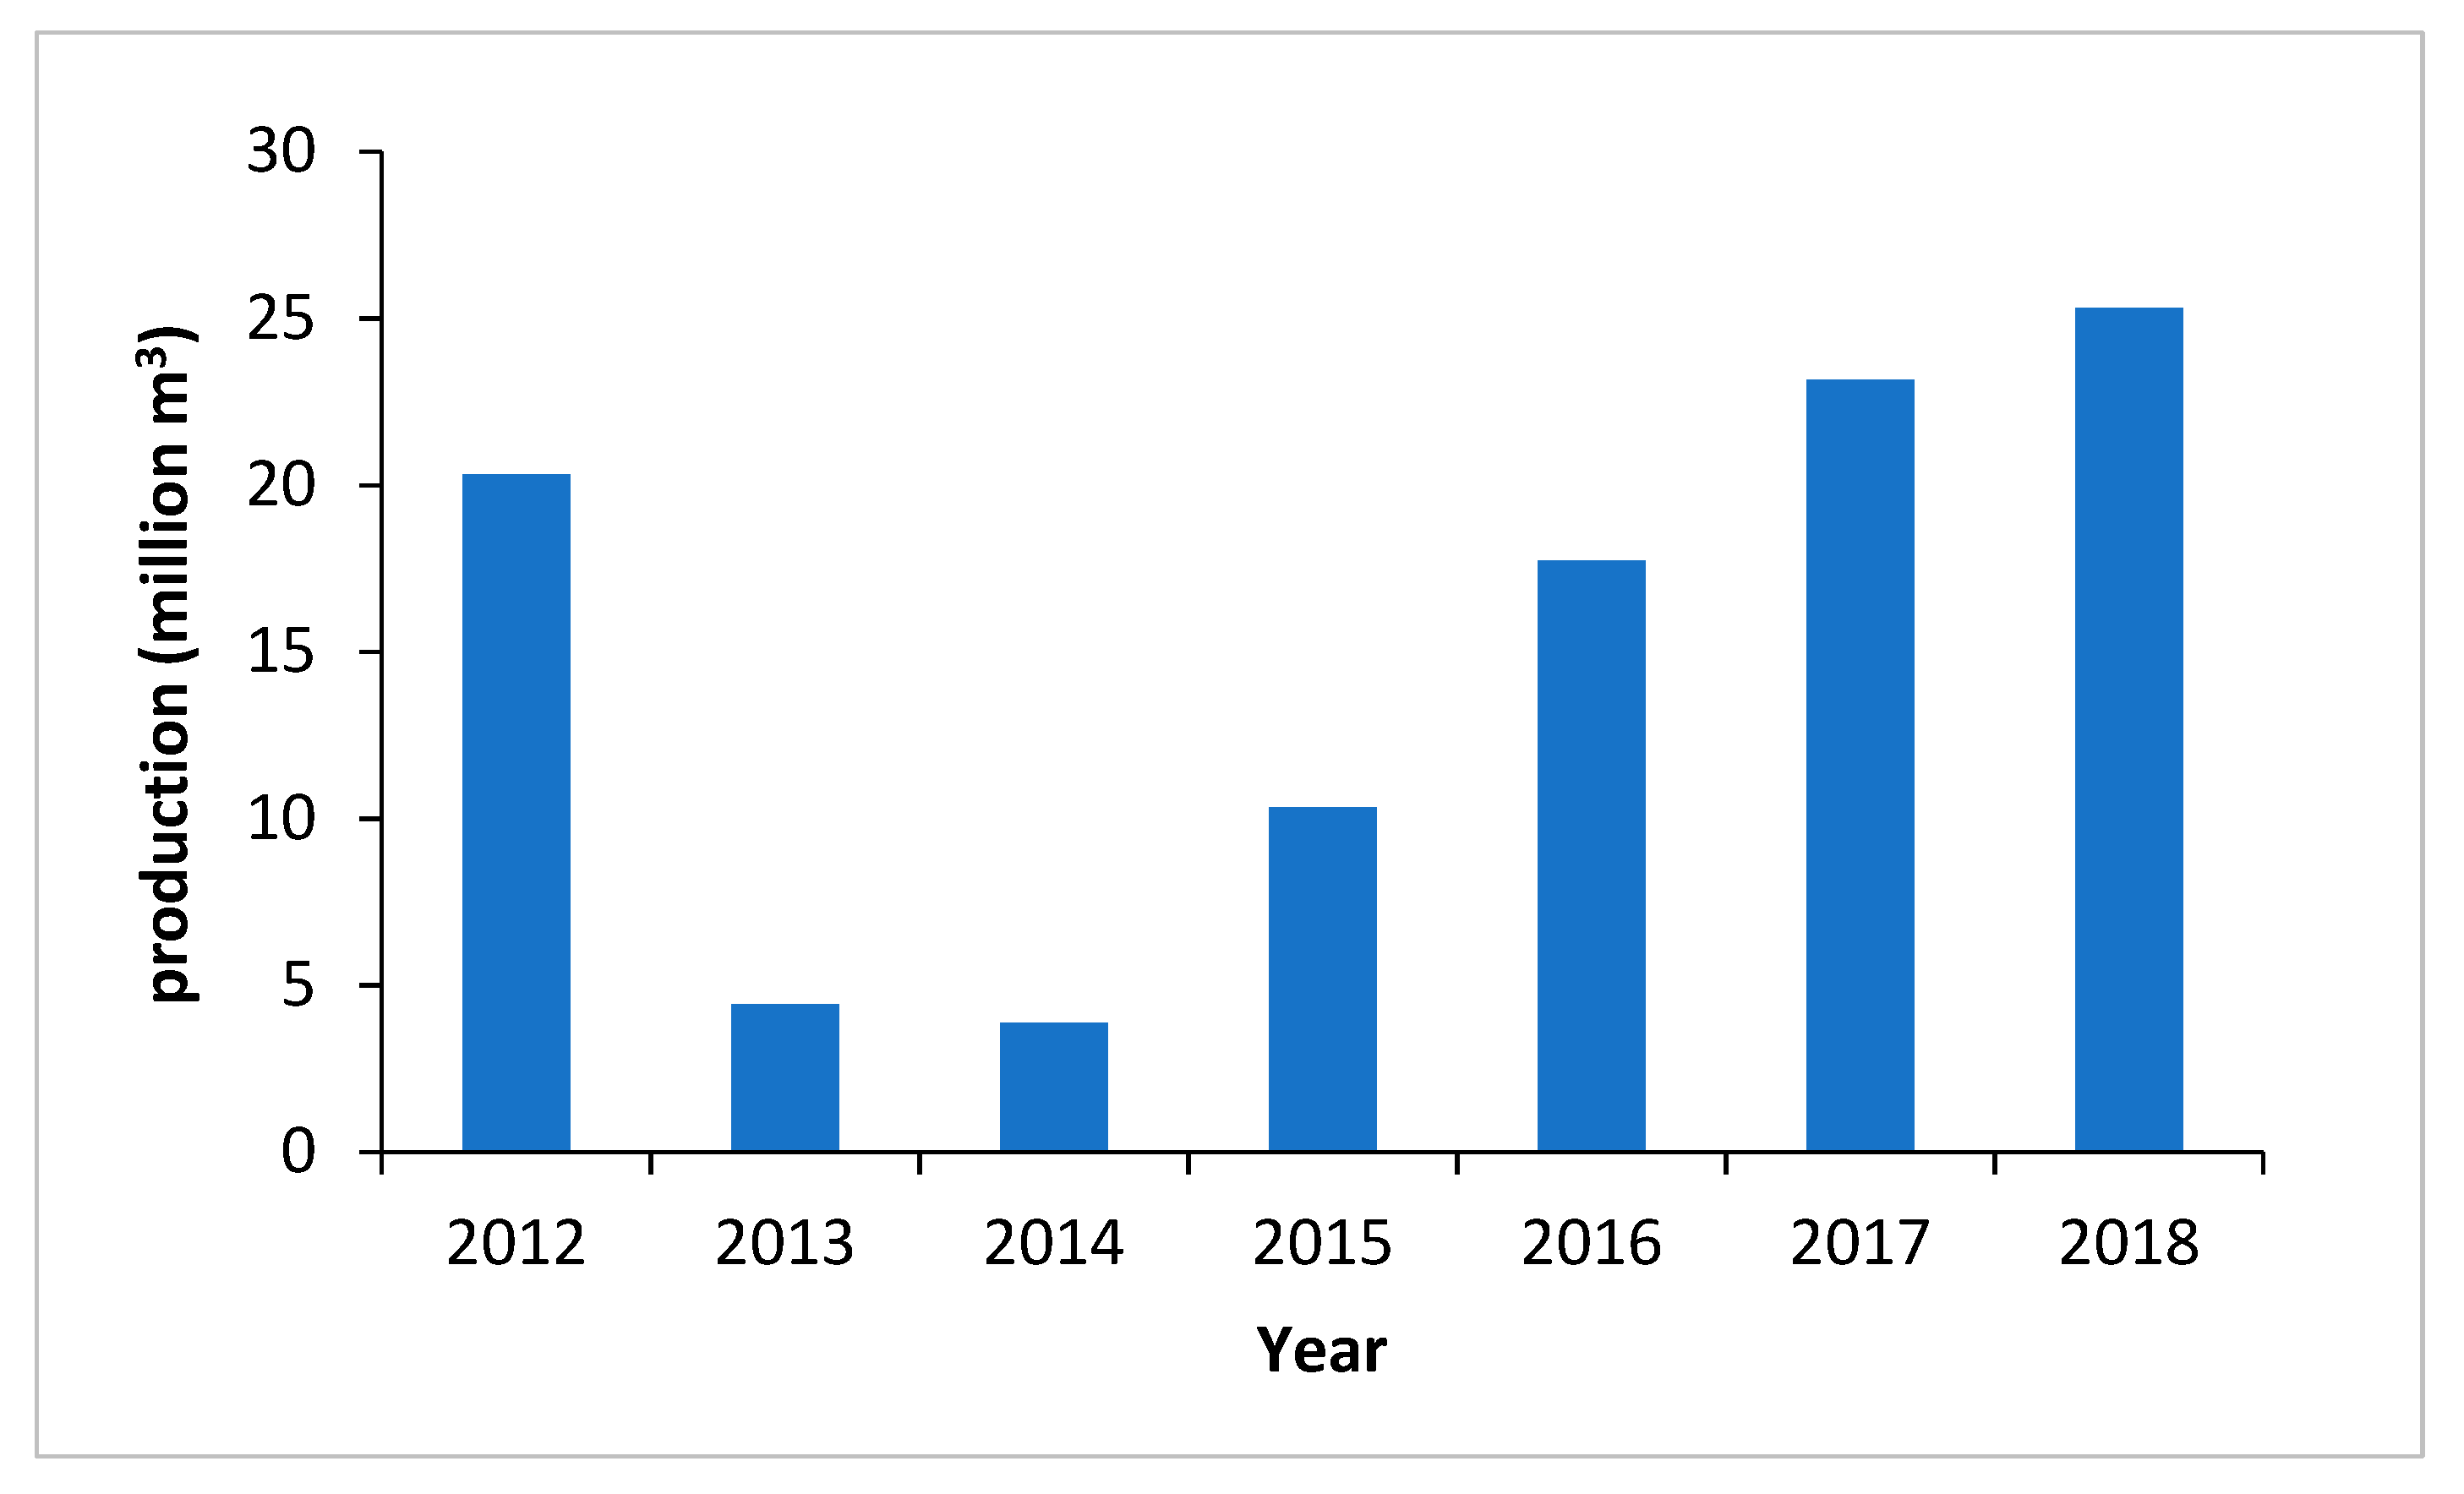
Figure 3 displays the annual desalinated water production (m3) from 2012 to 2018. The production was around 20 million cubic meters in 2012, but it decreased in 2013 and 2014, and then progressively increased up to 25 million cubic meters in 2018. In the Supplementary Materials a table has been included showing the volumes of seawater used for desalination, brine production, seawater used for dilution, and final effluent (in m3/day), as well as their respective conductivities (Table S1).
Table 1 displays the annual trend of the energy consumption of the brine dilution in the studied period, along with its economic cost. The highest amount of energy was consumed in 2012, while the lowest amount was consumed in 2013. From 2013 to 2018, a progressive increase in energy consumption for dilution was observed. However, the lowest cost was observed in 2014, due to the lower average cost of the used energy and the low water production. The water production in 2017 and 2018 was higher than in 2012, but the energy consumption for dilution in 2012 was higher than in 2017 and 2018, and had a higher cost (Table 1). Energy consumed for production was lowest in the year with the lowest production (2014), and highest in 2018 (Table 1).
The dilution ratio has not remained constant throughout the studied period (Figure 4); it has been highest in the years of lower production (2013 and 2014), and has decreased in the more recent years. In spite of this interannual variation in the dilution ratio, the consumed energy of dilution was directly related to the water production, since a minimum dilution of 2:1 was established in the environmental license.
Dilution versus Desalination Costs
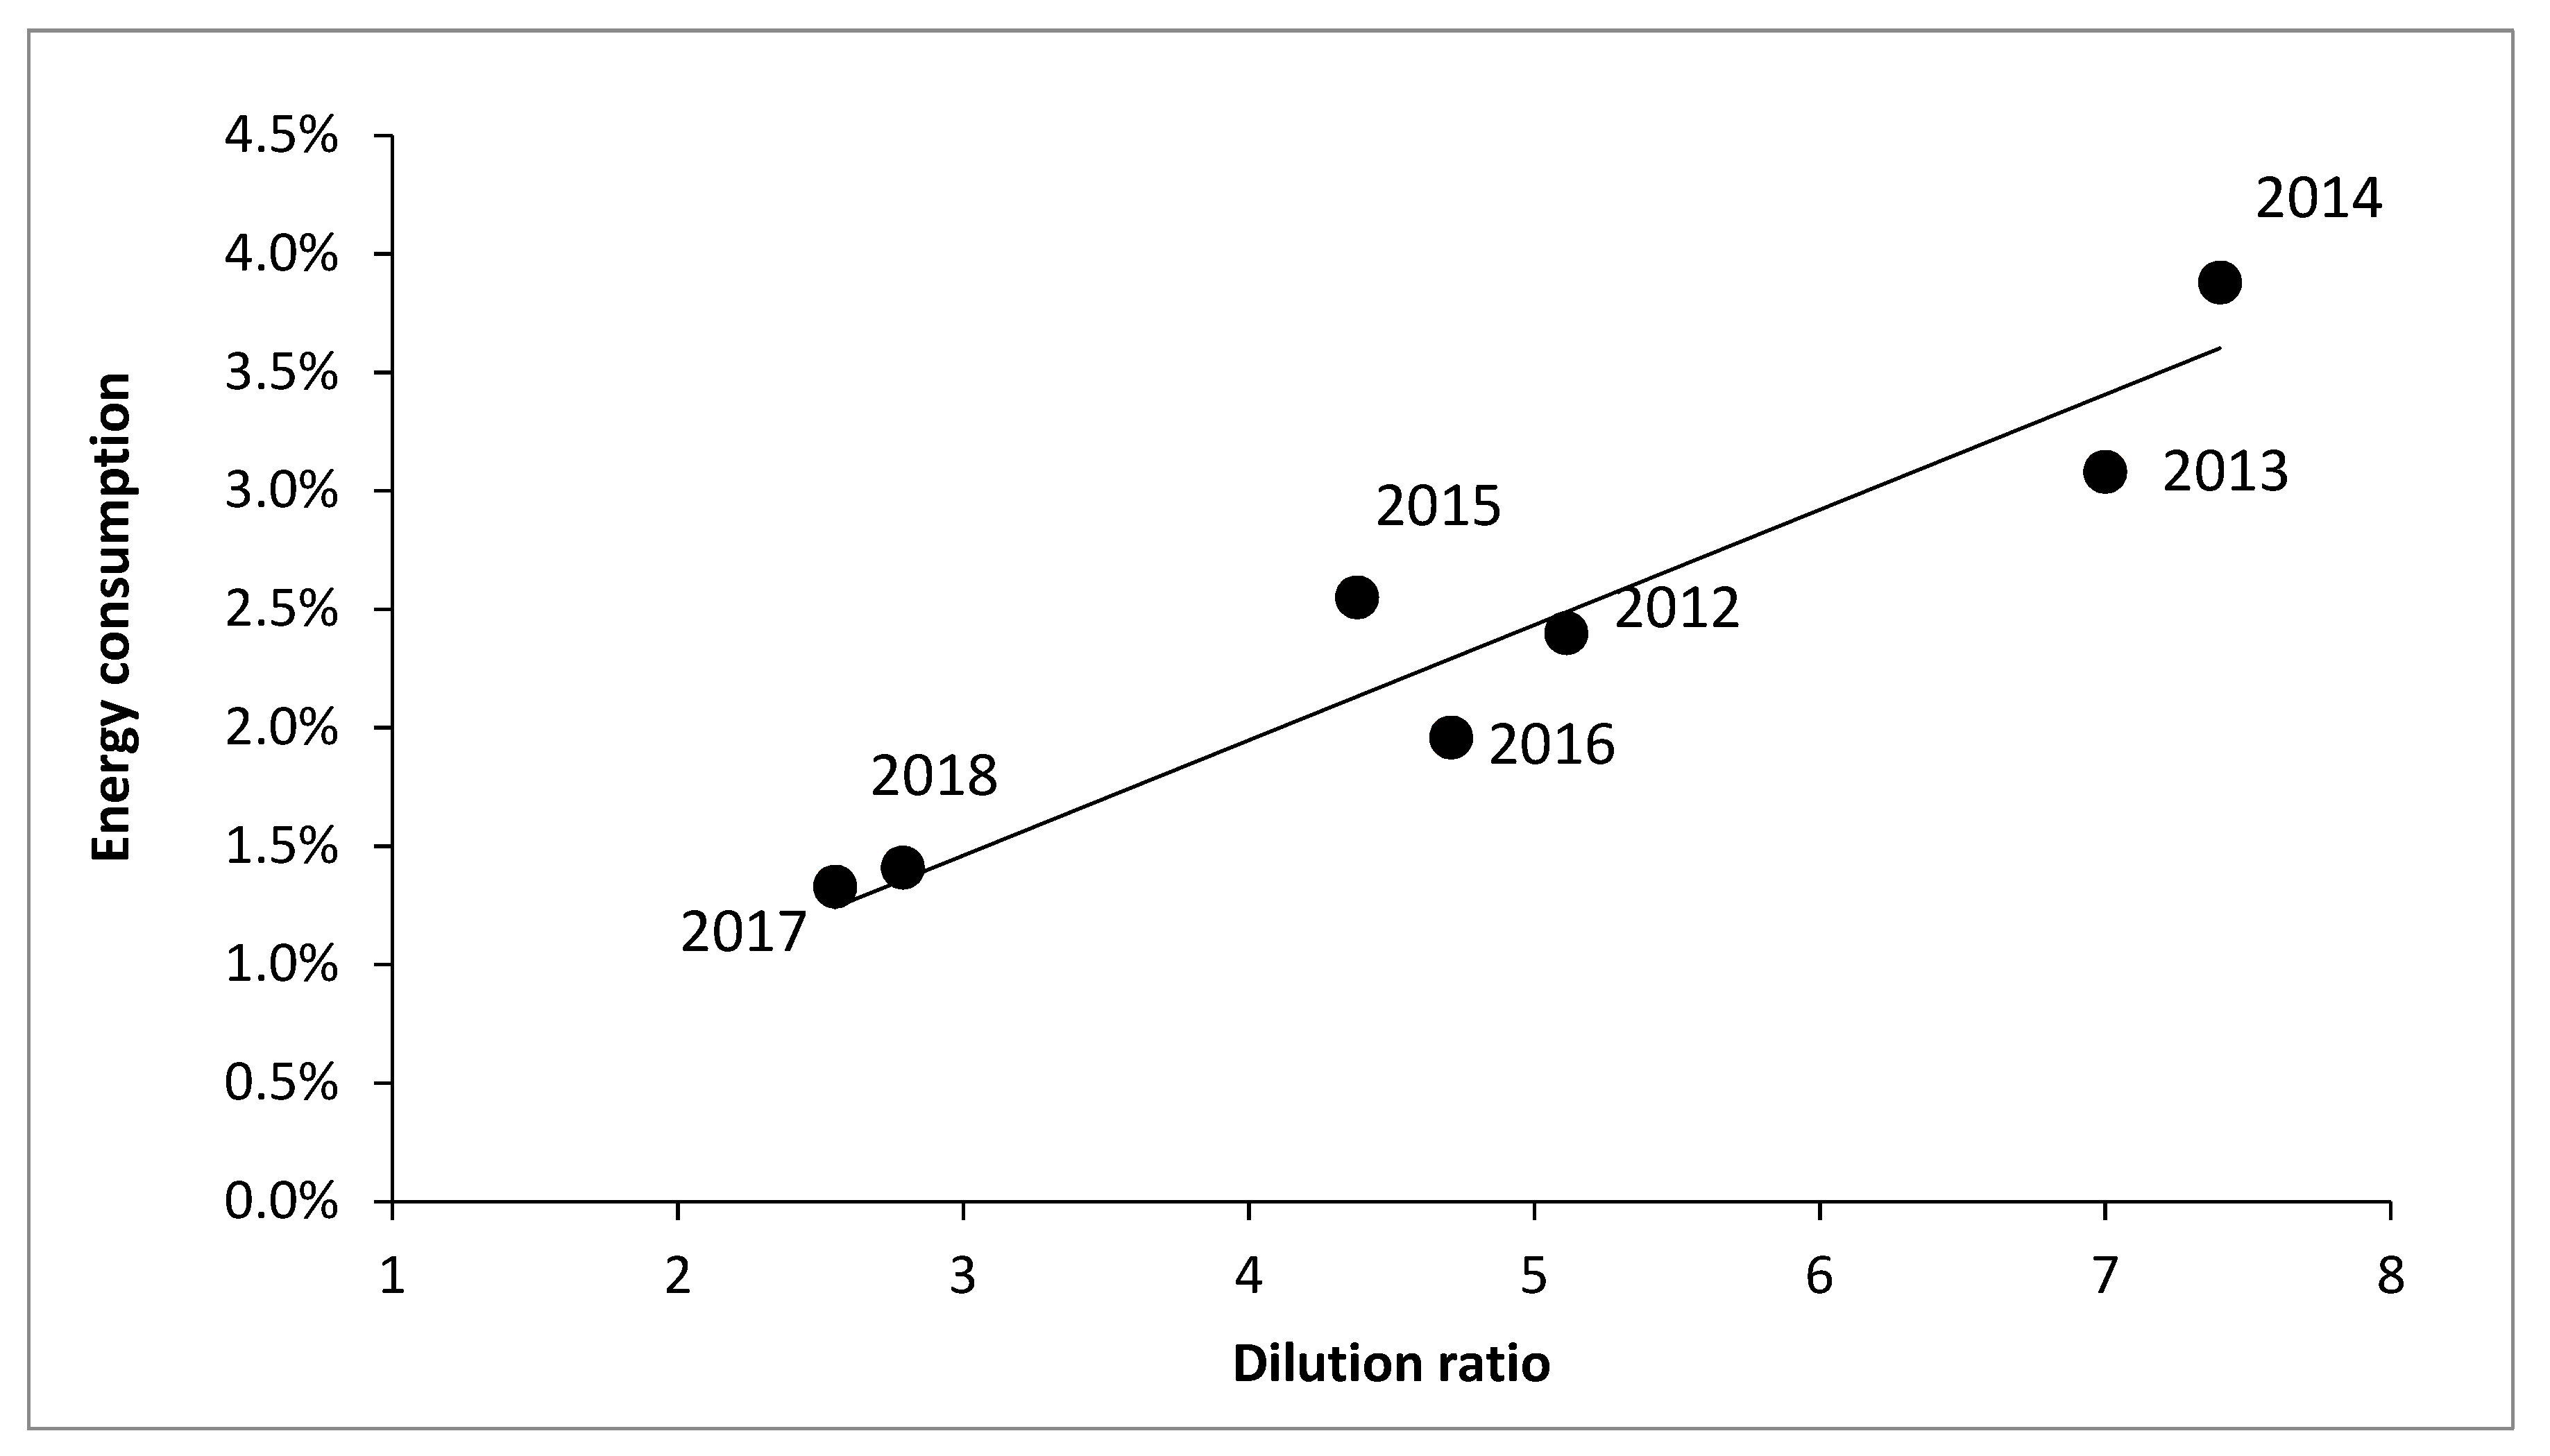
The average energy consumption for dilution was around 2% of the energy consumption of both plants (Table 2), with a maximum value of 3.9% in 2014 and a minimum value of 1.33% in 2017. The average cost of dilution was lower: 1.7% of the energy cost of the plants on average, with a maximum value of 2.7% in 2014 and a minimum value of 1.25% in 2018, is the latter being due to the lower energy cost in that year. On average, dilution increases the cost of each cubic meter of produced water by EUR 0.0065, with a maximum value of EUR 0.014/m3 in 2013 and a minimum value of EUR 0.005/m3 in 2016–2018. This interannual variability is due to the differences in the dilution ratio. From Figure 5, it can be observed that the higher the dilution ratio, the higher the percentage of energy consumption due to dilution. The optimization of the dilution ratio in 2017 and 2018 reduced the energy consumption percentage to 1.3–1.4%. However, in 2013–2014, the reduction in production increased the dilution to more than 7:1, and the consumption was close to 4%.
4. Discussion
To minimize the impact on the environment, an adequate mixing of the brine with seawater is needed. The most common method is the use of single or multiport diffusers [11,13,14], but dilution with seawater has also been proven effective to achieve sustainable desalination [20]. In Alicante, seawater bypassing had an energy consumption that ranged from 1.33 to 3.88% of the total consumption of both plants—approximately 0.055–0.190 kWh/m3 of water produced during the studied period—which implies a cost between EUR 0.0043/m3 and EUR 0.0137/m3. These interannual differences are mainly due to the variation in the dilution ratio during the studied period. To illustrate, during 2013 and 2014, the reduction in production in both plants did not result in a similar reduction in seawater bypassing, and the dilution ratio was over 7:1, so the relative energy consumption and relative costs were increased. This variability is due to the fact that MCT has several sources of water supply, where the optimization of the water supply is usually performed according to the cost of the available resources [25]. The availability of conventional resources in 2013 and 2014 was higher and, consequently, a reduction in the production of desalinated water was observed. In recent years, the production has increased, and the dilution ratio has been adjusted to the minimum ratio of the environmental license. This implies that compliance with the environmental protection conditions can be achieved with lower energy costs. In the Javea desalination plant, which has a constant dilution ratio of 4:1, the cost of dilution has been estimated to be 3% of the energy costs of the plant [20], which is in line with the cost that we obtain for a similar dilution ratio. Pre-dilution of the brine could be carried out with cooling water from a co-located power plant, or with treated wastewater effluent from a treatment plant, with the advantage of no additional energy consumption [15,16], but this solution is dependent on plant location, and not all desalination plants have this possibility.
The installation of the dilution system prior to the discharge of the Alicante desalination plants allowed the reduction in the area of influence of the discharge and the recovery of the benthic communities that were initially affected by the discharge. In this sense, a greater mix was observed [17]. Moreover, we could observe the recovery of the echinoderms at the upper limit of the meadow [26], as well as that of of the benthic organisms in the area closer to the discharge, both of which were previously impacted [6,7,27,28]. Similar results were observed when a higher mixing of the effluent was obtained with diffusers, which does not necessary imply additional energy consumption [10,11,14,29], but this solution cannot be applied to the Alicante plants, since a minimum depth is required and the discharge would be inside or too close to the meadow.
It must also considered that the conditions established in the environmental protection license of the Alicante plants are stricter than those considered necessary for protecting the Posidonia oceanica meadows [24]. While the scientific recommendations establish that “It should not be allowed to exceed 38.5 psu of salinity in any point of the meadow for more than 25% of the observations on an annual basis” [23,24], the environmental license for the Alicante plants reduces this threshold to 38.3 psu, which under certain oceanographic conditions implies a more frequent increase in the dilution ratio [30].
Moreover, during the summer months in Alicante, the brine plume remains at the thermocline level, preventing it from affecting the Posidonia oceanica meadows [17,22], which makes dilution unnecessary in several months of the year. This implies greater energy consumption than needed for protecting the meadows. In this sense, it is recommended to unify the established criteria in the environmental licenses for desalination plants in Spain [24], and in other countries [31], according to the best current scientific knowledge, avoiding aspects that do not contribute to environmental protection.
In addition to the seawater bypassing, in order to prevent the lowering of the ground water level due to the intake systems, the environmental licenses of Alicante desalination plants include an irrigation program to protect a saltmarsh. The energy cost of the irrigation program represents, on average, EUR 0.52 for each 1000 m3 [32], which is much lower than the brine dilution cost to protect Posidonia oceanica meadows estimated in this manuscript.
Seagrasses in the area are affected by other factors, including sewage discharge, harbor-associated impacts, and trawling (CITA); however, the brine dilution system avoided an increase in the pressure on the meadows.
5. Conclusions
Seawater bypassing has allowed the fulfillment of the established requirements in the EIS of the Alicante desalination plants and the protection of the Posidonia oceanica seagrass from their discharge. Energy consumption depends on the dilution ratio, and it has oscillated in the studied period between 1.3% and 3.9% of the total consumption. Dilution increases the cost of each cubic meter of water by EUR 0.0065 on average. The dilution ratio was higher than necessary at the beginning of the studied period, but it has been optimized in recent years, reducing the energy consumption.
Supplementary Materials
The following are available online at https://www.mdpi.com/article/10.3390/w13172386/s1, Table S1: Volumes of seawater used for desalination, brine production, seawater used for dilution and final effluent (in m3/day) and their respective conductivities (μS/cm−1). Monthly average values from 2012 to 2018.
Author Contributions
Conceptualization, R.N. and J.L.S.L.; methodology, R.N. and A.C.; investigation, R.N.; writing—original draft preparation, R.N.; writing—review and editing, A.C. and J.L.S.L.; supervision, J.L.S.L. All authors have read and agreed to the published version of the manuscript.
Funding
This research received no external funding.
Institutional Review Board Statement
Not applicable.
Informed Consent Statement
Not applicable.
Data Availability Statement
Data have been included in the manuscript.
Conflicts of Interest
The authors declare no conflict of interest.
References
- Jones, E.; Qadir, M.; van Vliet, M.T.; Smakhtin, V.; Kang, S.-M. The state of desalination and brine production: A global outlook. Sci. Total Environ. 2018, 657, 1343–1356. [Google Scholar] [CrossRef]
- Fernández-Torquemada, Y.; Sánchez-Lizaso, J.L. Responses of two Mediterranean seagrasses to experimental changes in salinity. Hydrobiologia 2011, 669, 21–33. [Google Scholar] [CrossRef] [Green Version]
- Fernández-Torquemada, Y.; Lizaso, J.L.S. Effects of salinity on seed germination and early seedling growth of the Mediterranean seagrass Posidonia oceanica (L.) Delile. Estuar. Coast. Shelf Sci. 2013, 119, 64–70. [Google Scholar] [CrossRef] [Green Version]
- Marín-Guirao, L.; Sandoval-Gil, J.M.; Bernardeau-Esteller, J.; Ruíz, J.M.; Sánchez-Lizaso, J.L. Responses of the Mediterranean seagrass Posidonia oceanica to hypersaline stress duration and recovery. Mar. Environ. Res. 2013, 84, 60–75. [Google Scholar] [CrossRef]
- Sandoval-Gil, J.M.; Ruiz, J.M.; Marín-Guirao, L.; Esteller, J.B.; Sánchez-Lizaso, J.L. Ecophysiological plasticity of shallow and deep populations of the Mediterranean seagrasses Posidonia oceanica and Cymodocea nodosa in response to hypersaline stress. Mar. Environ. Res. 2014, 95, 39–61. [Google Scholar] [CrossRef]
- Ruso, Y.D.P.; Carretero, J.D.L.O.; Casalduero, F.G.; Lizaso, J.L.S. Spatial and temporal changes in infaunal communities inhabiting soft-bottoms affected by brine discharge. Mar. Environ. Res. 2007, 64, 492–503. [Google Scholar] [CrossRef] [Green Version]
- Del-Pilar-Ruso, Y.; De-La-Ossa-Carretero, J.A.; Giménez-Casalduero, F.; Sánchez-Lizaso, J.L. Effects of a brine discharge over soft bottom Polychaeta assemblage. Environ. Pollut. 2008, 156, 240–250. [Google Scholar] [CrossRef] [PubMed]
- Yoana, D.-P.; Antonio, D.-L.J.; Angel, L.-F.; Miguel, F.-V.L.; Francisca, G.-C.; Luis, S.-L.J. Assessment of soft-bottom Polychaeta assemblage affected by a spatial confluence of impacts: Sewage and brine discharges. Mar. Pollut. Bull. 2009, 58, 776–782. [Google Scholar] [CrossRef]
- De-La-Ossa-Carretero, J.A.; Del-Pilar-Ruso, Y.; Loya-Fernández, A.; Ferrero-Vicente, L.M.; Marco-Méndez, C.; Martinez-Garcia, E.; Casalduero, F.G.; Lizaso, J.L.S. Bioindicators as metrics for environmental monitoring of desalination plant discharges. Mar. Pollut. Bull. 2016, 103, 313–318. [Google Scholar] [CrossRef]
- Del-Pilar-Ruso, Y.; Martínez-García, E.; Giménez-Casalduero, F.; Loya-Fernández, A.; Ferrero-Vicente, L.M.; Marco-Méndez, C.; De-La-Ossa-Carretero, J.A.; Sánchez-Lizaso, J.L.; Yoana, D.-P. Benthic community recovery from brine impact after the implementation of mitigation measures. Water Res. 2015, 70, 325–336. [Google Scholar] [CrossRef] [PubMed] [Green Version]
- Belatoui, A.; Bouabessalam, H.; Hacene, O.R.; De-La-Ossa-Carretero, J.A.; Martinez-Garcia, E.; Sanchez-Lizaso, J.L. Environmental effects of brine discharge from two desalinations plants in Algeria (South Western Mediterranean). Desalin. Water Treat. 2017, 76, 311–318. [Google Scholar] [CrossRef]
- Bleninger, T.; Jirka, G.H. Modelling and environmentally sound management of brine discharges from desalination plants. Desalination 2008, 221, 585–597. [Google Scholar] [CrossRef]
- Fernández-Torquemada, Y.; Carratalá, A.; Lizaso, J.L.S. Impact of brine on the marine environment and how it can be reduced. Desalin. Water Treat. 2019, 167, 27–37. [Google Scholar] [CrossRef] [Green Version]
- Loya-Fernández, A.; Ferrero-Vicente, L.M.; Marco-Méndez, C.; Martínez-García, E.; Vallejo, J.J.Z.; Lizaso, J.L.S. Quantifying the efficiency of a mono-port diffuser in the dispersion of brine discharges. Desalination 2018, 431, 27–34. [Google Scholar] [CrossRef]
- Einav, R.; Lokiec, F. Environmental aspects of a desalination plant in Ashkelon. Desalination 2003, 156, 79–85. [Google Scholar] [CrossRef]
- Shrivastava, I.; Adams, E.E. Pre-dilution of desalination reject brine: Impact on outfall dilution in different water depths. J. Hydro-Environ. Res. 2019, 24, 28–35. [Google Scholar] [CrossRef]
- Fernández-Torquemada, Y.; Gónzalez-Correa, J.M.; Loya, A.; Ferrero, L.M.; Díaz-Valdés, M.; Lizaso, J.L.S. Dispersion of brine discharge from seawater reverse osmosis desalination plants. Desalin. Water Treat. 2009, 5, 137–145. [Google Scholar] [CrossRef] [Green Version]
- Malfeito, J.; Díaz-Caneja, J.; Fariñas, M.; Fernández-Torquemada, Y.; González-Correa, J.M.; Carratalá-Giménez, A.; Lizaso, J.L.S. Brine discharge from the Javea desalination plant. Desalination 2005, 185, 87–94. [Google Scholar] [CrossRef]
- Zarzo, D.; García, C.; Sánchez Lizaso, J.L.; Deudero, S.; Box, A. Environmental Protection Strategies in the Bahia de Alcudia Project (Spain), Desalination for the Environment: Clean Water and Energy, Baden-Baden. 2009. Available online: http://www.repositorio.ieo.es/e-ieo/bitstream/handle/10508/5979/Zarzo_etal_2009.pdf?sequence=1&isAllowed=y (accessed on 28 August 2021).
- Sola, I.; Fernández-Torquemada, Y.; Forcada, A.; Valle, C.; Del Pilar-Ruso, Y.; González-Correa, J.M.; Sánchez-Lizaso, J.L. Sustainable desalination: Long-term monitoring of brine discharge in the marine environment. Mar. Pollut. Bull. 2020, 161, 111813. [Google Scholar] [CrossRef] [PubMed]
- CEDEX. Estudio de la Dispersión del Vertido al mar a Través de una Rambla de las aguas de Rechazo Procedentes de una Planta Desaladora de Agua Marina del Canal de Alicante; CEDEX: Madrid, Spain, 2001.
- Fernández-Torquemada, Y.; Lizaso, J.L.S.; González-Correa, J. Preliminary results of the monitoring of the brine discharge produced by the SWRO desalination plant of Alicante (SE Spain). Desalination 2005, 182, 395–402. [Google Scholar] [CrossRef]
- Sánchez-Lizaso, J.L.; Romero, J.; Ruiz, J.; Gacia, E.; Buceta, J.L.; Invers, O.; Torquemada, Y.F.; Mas, J.; Ruiz-Mateo, A.; Manzanera, M. Salinity tolerance of the Mediterranean seagrass Posidonia oceanica: Recommendations to minimize the impact of brine discharges from desalination plants. Desalination 2008, 221, 602–607. [Google Scholar] [CrossRef]
- Sola, I.; Zarzo, D.; Sánchez-Lizaso, J.L. Evaluating environmental requirements for the management of brine discharges in Spain. Desalination 2019, 471, 114132. [Google Scholar] [CrossRef] [Green Version]
- Hernández-Sánchez, J.; Boluda-Botella, N.; Sánchez-Lizaso, J. The role of desalination in water management in southeast Spain. Desalin. Water Treat. 2017, 76, 71–76. [Google Scholar] [CrossRef] [Green Version]
- Fernández-Torquemada, Y.; González-Correa, J.M.; Sánchez-Lizaso, J.L. Echinoderms as indicators of brine discharge impacts. Desalin. Water Treat. 2013, 51, 567–573. [Google Scholar] [CrossRef] [Green Version]
- Garrote-Moreno, A.; Fernández-Torquemada, Y.; Sánchez-Lizaso, J. Salinity fluctuation of the brine discharge affects growth and survival of the seagrass Cymodocea nodosa. Mar. Pollut. Bull. 2014, 81, 61–68. [Google Scholar] [CrossRef]
- De-La-Ossa-Carretero, J.; Del-Pilar-Ruso, Y.; Loya-Fernández, A.; Ferrero-Vicente, L.; Marco-Méndez, C.; Martinez-Garcia, E.; Sánchez-Lizaso, J. Response of amphipod assemblages to desalination brine discharge: Impact and recovery. Estuar. Coast. Shelf Sci. 2016, 172, 13–23. [Google Scholar] [CrossRef] [Green Version]
- Loya, Á.; Ferrero-Vicente, L.M.; Marco-Méndez, C.; Martínez-García, E.; Zubcoff, J.J.; Sánchez-Lizaso, J.L. Comparing four mixing zone models with brine discharge measurements from a reverse osmosis desalination plant in Spain. Desalination 2012, 286, 217–224. [Google Scholar] [CrossRef]
- Barrio, R.N.; Sola, I.; Blanco-Murillo, F.; Del-Pilar-Ruso, Y.; Fernández-Torquemada, Y.; Sánchez-Lizaso, J.L. Application of salinity thresholds in Spanish brine discharge regulations: Energetic and environmental implications. Desalination 2021, 501, 114901. [Google Scholar] [CrossRef]
- Sola, I.; Sánchez-Lizaso, J.L.; Muñoz, P.T.; García-Bartolomei, E.; Sáez, C.A.; Zarzo, D. Assessment of the Requirements within the Environmental Monitoring Plans Used to Evaluate the Environmental Impacts of Desalination Plants in Chile. Water 2019, 11, 2085. [Google Scholar] [CrossRef] [Green Version]
- Navarro, R.; Sánchez Lizaso, J.L. Mitigation cost of desalination intake impact on coastal wetlands. Desalin. Water Treat. 2021, 224, 136–143. [Google Scholar] [CrossRef]
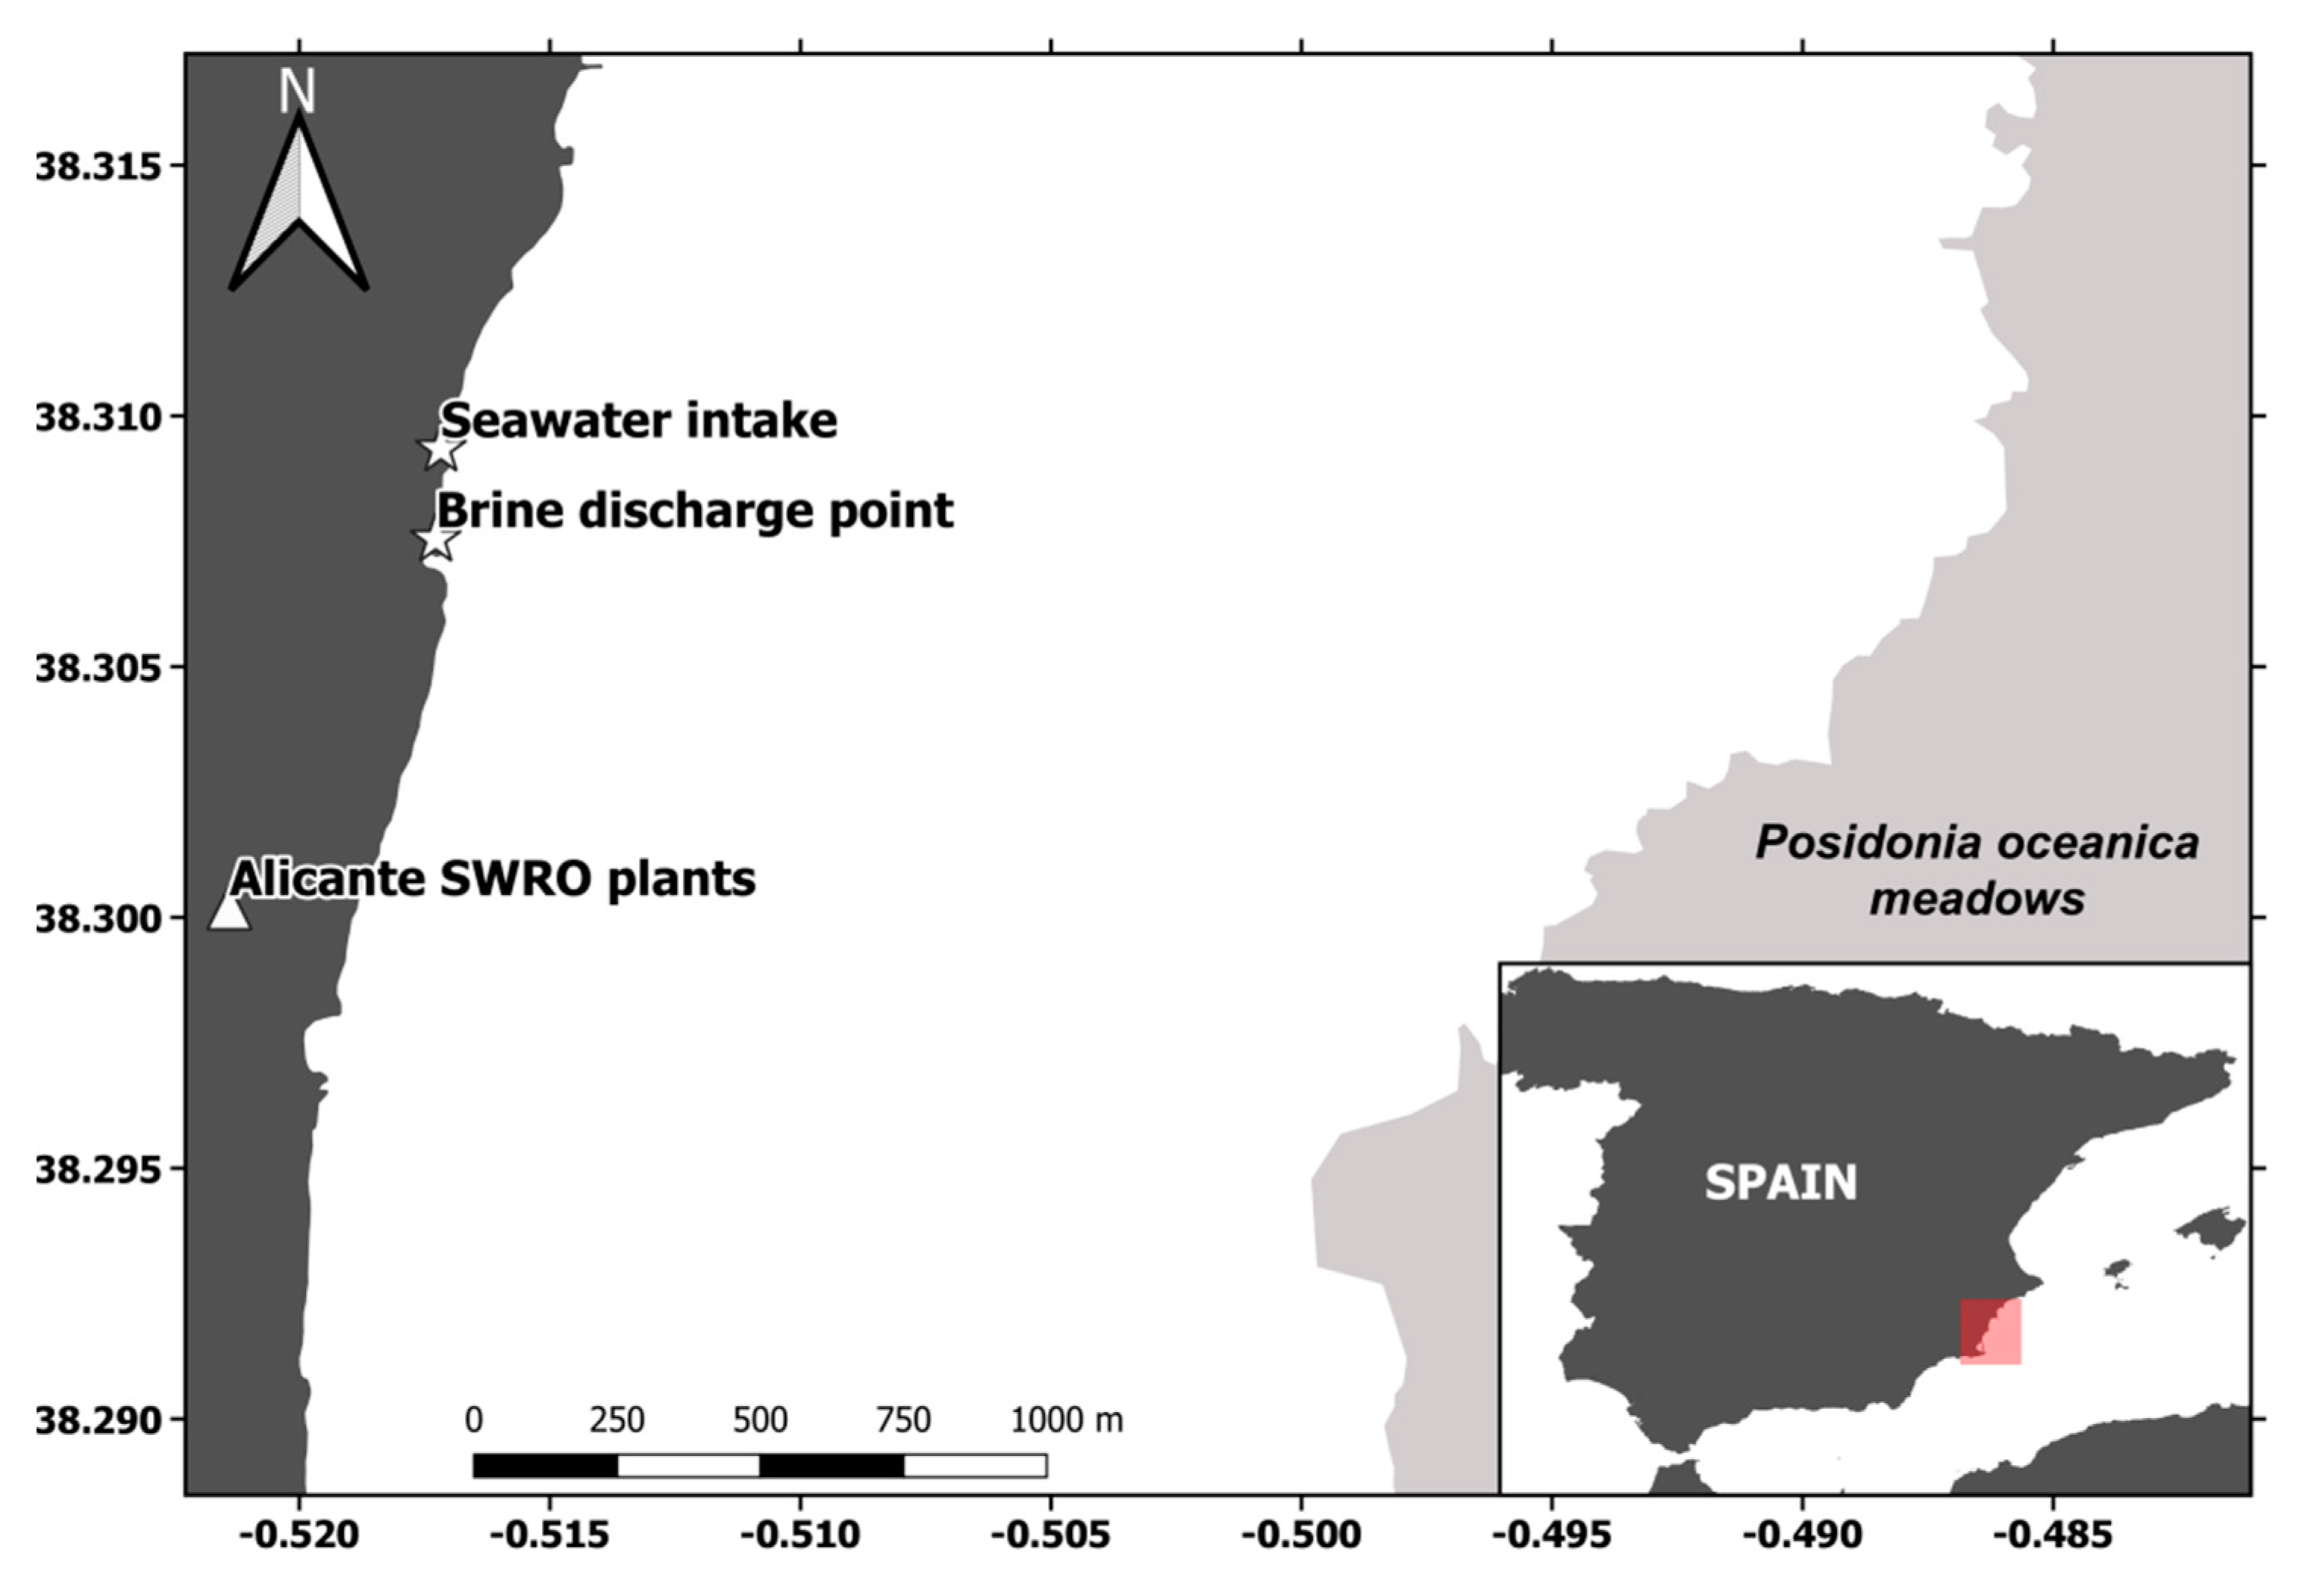
Figure 1.
Location of the desalination plant, seawater intake for dilution, and diluted brine discharge point. The upper limit of the seagrass meadow is also indicated.
Figure 1.
Location of the desalination plant, seawater intake for dilution, and diluted brine discharge point. The upper limit of the seagrass meadow is also indicated.

Figure 2.
(A) Dilution seawater pumping facility (upper part) and discharge point (lower part). (B) View of the calming pond and catchment area. (C) Seawater pump. (D) Discharge of the final effluent in Cala de los Borrachos (Alicante).
Figure 2.
(A) Dilution seawater pumping facility (upper part) and discharge point (lower part). (B) View of the calming pond and catchment area. (C) Seawater pump. (D) Discharge of the final effluent in Cala de los Borrachos (Alicante).

Figure 3.
Annual desalinated water production (million m3) from 2012 to 2018.

Figure 4.
Evolution of the dilution ratio in the studied period. Vertical bars indicate standard deviation.
Figure 4.
Evolution of the dilution ratio in the studied period. Vertical bars indicate standard deviation.

Figure 5.
Percentage of the energy consumption of the plants in relation to the dilution ratio.


Table 1.
Energy consumed for dilution and production, total dilution cost, and annual mean price of energy supplied or used for dilution.
Table 1.
Energy consumed for dilution and production, total dilution cost, and annual mean price of energy supplied or used for dilution.
| Year | Consumed Energy for Dilution (Million kWh) | Consumed Energy for Production (Million kWh) | Total Cost (Thousand EUR) | Average Cost (EUR/kWh) |
|---|---|---|---|---|
| 2012 | 2.1 | 88.9 | 180 | 0.084 |
| 2013 | 0.7 | 22.3 | 61 | 0.089 |
| 2014 | 0.7 | 18.9 | 52 | 0.070 |
| 2015 | 1.2 | 45.6 | 86 | 0.074 |
| 2016 | 1.4 | 73.2 | 88 | 0.061 |
| 2017 | 1.3 | 96.4 | 109 | 0.085 |
| 2018 | 1.6 | 114.2 | 117 | 0.072 |
Table 2.
Ratios between the energy consumption and dilution costs and between the total energy consumption and cost for both plants; K1 = kWh dilution versus total (kWh) electrical consumption in both plants (%); K2 = dilution cost (EUR) versus total electrical cost (EUR) in both plants (%); K3 = ratio between the consumed kWh dilution and the total water production of both plants (kWh/m3); K4 = dilution cost (EUR) versus the total water production (EUR/m3) (The maximum and minimum values are underlined.).
| Year | K1
kWh Dilution/100 kWh Production | K2
EUR Dilution/100 EUR Production | K3 (kWh/m3) | K4 (EUR/m3) |
|---|---|---|---|---|
| 2012 | 2.40% | 2.11% | 0.105 | 0.009 |
| 2013 | 3.08% | 2.09% | 0.155 | 0.014 |
| 2014 | 3.88% | 2.69% | 0.190 | 0.013 |
| 2015 | 2.55% | 2.08% | 0.113 | 0.008 |
| 2016 | 1.96% | 1.61% | 0.081 | 0.005 |
| 2017 | 1.33% | 1.30% | 0.055 | 0.005 |
| 2018 | 1.41% | 1.25% | 0.064 | 0.005 |
| Average | 1.97% | 1.70% | 0.085 | 0.007 |
Publisher’s Note: MDPI stays neutral with regard to jurisdictional claims in published maps and institutional affiliations. |
© 2021 by the authors. Licensee MDPI, Basel, Switzerland. This article is an open access article distributed under the terms and conditions of the Creative Commons Attribution (CC BY) license (https://creativecommons.org/licenses/by/4.0/).
Share and Cite
MDPI and ACS Style
Navarro, R.; Carratalá, A.; Sánchez Lizaso, J.L. The Cost of Brine Dilution in the Desalination Plants of Alicante. Water 2021, 13, 2386. https://doi.org/10.3390/w13172386
AMA Style
Navarro R, Carratalá A, Sánchez Lizaso JL. The Cost of Brine Dilution in the Desalination Plants of Alicante. Water. 2021; 13(17):2386. https://doi.org/10.3390/w13172386
Chicago/Turabian StyleNavarro, Rubén, Adoración Carratalá, and José Luis Sánchez Lizaso. 2021. "The Cost of Brine Dilution in the Desalination Plants of Alicante" Water 13, no. 17: 2386. https://doi.org/10.3390/w13172386
Note that from the first issue of 2016, this journal uses article numbers instead of page numbers. See further details here.