
Aquifer Response to Stream-Stage Fluctuations: Field Tests and Analytical Solution for a Case Study of the Yangtze River in Wuhan, China


1
Faculty of Engineering, China University of Geosciences, Wuhan 430074, China
2
Wuhan Geotechnical Engineering and Surveying Co., Ltd., Wuhan 430022, China
*
Author to whom correspondence should be addressed.
Water 2021, 13(17), 2388; https://doi.org/10.3390/w13172388
Submission received: 7 July 2021
/
Revised: 21 August 2021
/
Accepted: 25 August 2021
/
Published: 30 August 2021
(This article belongs to the Section Hydrology)
Abstract
:In this paper, field hydrological monitoring tests and an analytical solution for the aquifer response (i.e., the groundwater head) to stream-stage fluctuations are presented through a case study of the Yangtze River in Wuhan, China. A sinusoidal equation for the stream water level over time is proposed and is verified by the monitoring results. Based on the classical 1-D solution of ground water flow equations, a new flow model was proposed to analyze the confined aquifer response to stream-stage fluctuations. The groundwater head of the confined aquifer can then be calculated by embedding the proposed sinusoidal equation of the stream-stage fluctuation into the new flow model. Field monitoring data of the three hydrological years from 2017 to 2019 were compiled to evaluate the proposed model. The results show that the predicted groundwater head of the confined aquifer matches well with the monitoring data. The prediction error of the proposed model (about 8%) is much lower than that of the previous model (about 26%). This paper presents an improved analytical model with a satisfying capability to predict the response of the groundwater head of the confined aquifer to stream-stage fluctuation. This model can be applied into groundwater flow models (such as MODFLOW, FEFLOW, etc.). The results of this study provide a valuable hydrological resource for underground practical engineering in the riverside area, especially in the first terrace of the Yangtze River, and for the dewatering design of a foundation pit in a riverside area.
1. Introduction
Surface water and groundwater do not exist in isolation in the hydrologic cycle; rather, all surface water is often hydraulically connected to groundwater. Over the past few decades, with population growth, human water demand has grown, and the importance of water utilization and conservation has been gradually realized. Simultaneously, many scientists have come to recognize that the effective management of limited water resources cannot be implemented without realistically quantifying the interaction between surface water and groundwater [1,2,3].
Similarly, hydrological units such as rivers, lakes, wetlands, and streams are not isolated. Groundwater is inextricably linked to river development, with the flow of rivers being the result of a complex process that relies on the interaction of hydrological, geological, ecological, and human factors. The river–aquifer interface represents a vital location for the exchange of mass, energy, and chemicals between surface water and groundwater. The reciprocal flow of water and the interaction pattern of water flow depend mainly on rainfall inputs, water head changes, and the permeability of the underlying layer [4]. Most studies focus more on the interaction of adjacent aquifers with rivers in arid and semi-arid regions, where streams are often disconnected from underlying aquifers [5,6]. For high-quality and abundant water, groundwater extraction wells are often located near rivers, and the reduction in groundwater flow to rivers due to extraction has led to river depletion. A recent study has shown that increased groundwater withdrawals across the United States over the past 100 years have had a significant impact on the hydrologic cycle through reductions in flow and evapotranspiration at the watershed scale [7,8].
Analytical [9,10,11,12] and numerical [13,14,15,16,17] methods have been used to model river– aquifer interactions for a long time. Intaraprasong and Zhan [18] grouped current research on river–aquifer interactions into two parts: (1) study on the flow–aquifer flow rate caused by pumping wells [9,10,19,20,21] and (2) study of aquifer response to flow-level fluctuations, not involving any pumping wells [20,22,23,24]. For group one, Sophocleous et al. [15] compared stream–aquifer flow rates induced by fully permeable wells in the vicinity of a fully permeable stream without a streambed. For group two, Moench and Barlow [25] and Barlow et al. [26] proposed several solutions for transient hydraulic interactions occurring between a fully permeable river and a confined, leaky, or subsurface aquifer to calculate the aquifer head, riparian infiltration rate, and riparian storage as a response to river stage fluctuations and basin-wide recharge or evapotranspiration. However, most models perform poorly when dealing with local-scale hydraulic processes at the interface of rivers and aquifers [27].
However, for areas with abundant rainfall, the impact of river flooding on adjacent aquifers cannot be ignored. The Yangtze River, the third-largest river in the world, has the world’s largest amount of hydroelectric energy. Located in a subtropical monsoon climate zone, the Yangtze River flows through three major morphological terraces from the western plateau to the eastern coast, with an altitude difference of over 6000 m [28,29,30]. Influenced by the monsoon climate, the Yangtze River basin produces excessive rainfall and frequent floods every summer, causing huge economic losses [31,32]. Wuhan is located on the first terrace of the Yangtze River, and the surface water–groundwater interaction process in its riverine area is accompanied by material and energy exchange between the external boundary and the aquifer. Due to the strong dynamic changes in the hydraulic gradient, the surface water–groundwater interaction pattern in the riverine region of the first terrace is dominated by a local groundwater flow system, which is driven by the hydraulic gradient, and the characteristics of the water-bearing medium affect the intensity of the interaction [33]. In terms of the river–aquifer interactions for the Yangtze River in the Wuhan area, most related studies focus on the hydraulic properties of sediments; the conditions of groundwater storage; the groundwater seepage path; the trends and dynamics of groundwater level changes; and the stages, periodic patterns, and sudden changes in water level experienced by the Yangtze River in different periods [34,35,36,37,38,39,40,41,42].
From the above analyses, it should be noted that most models perform poorly when dealing with local-scale processes at the interface of rivers and aquifers. Thus, this paper aims to propose a new water-level fluctuation model for the Yangtze River and to modify the common analytical formula used to predict the variation law of confined water levels in the riverside area more accurately. In the following sections, we describe the field hydrological monitoring tests we conducted, including an overview of the site, the monitoring plan, and the results in Section 2. In Section 3, a new equation for stream-stage fluctuations is proposed on the basis of monitoring data from the Yangtze River. We derive a theoretical flow model to predict the confined groundwater head and verify the proposed model in Section 4. Summaries and the main conclusions are drawn in the last part of the paper.
2. Field Hydrological Monitoring Tests
2.1. Hydrological Monitoring Area
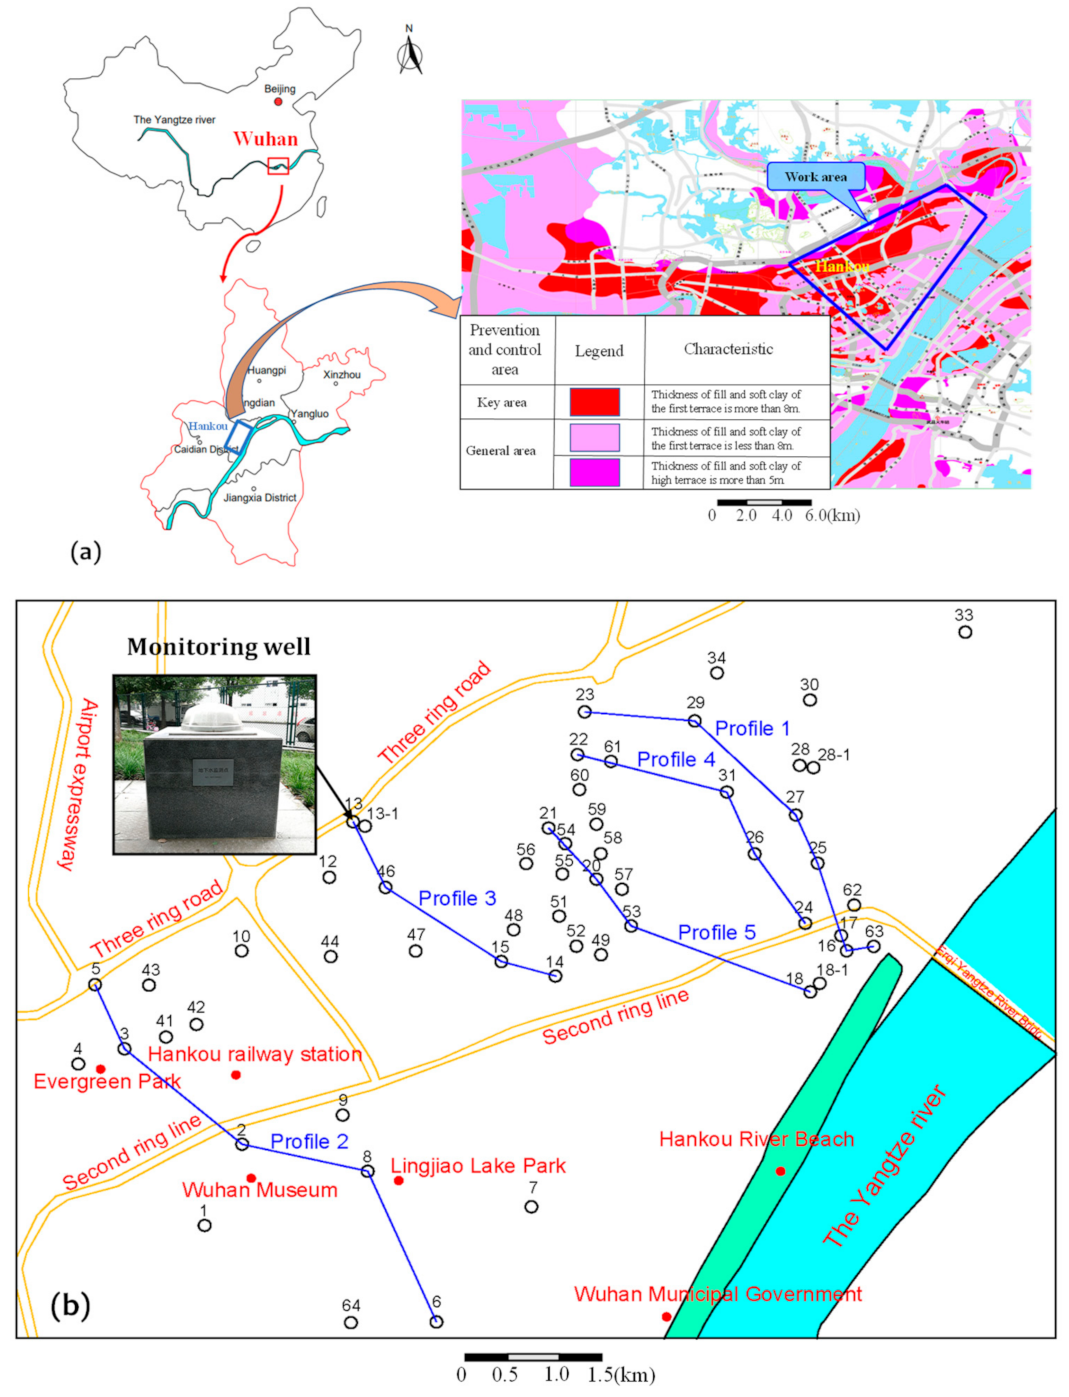
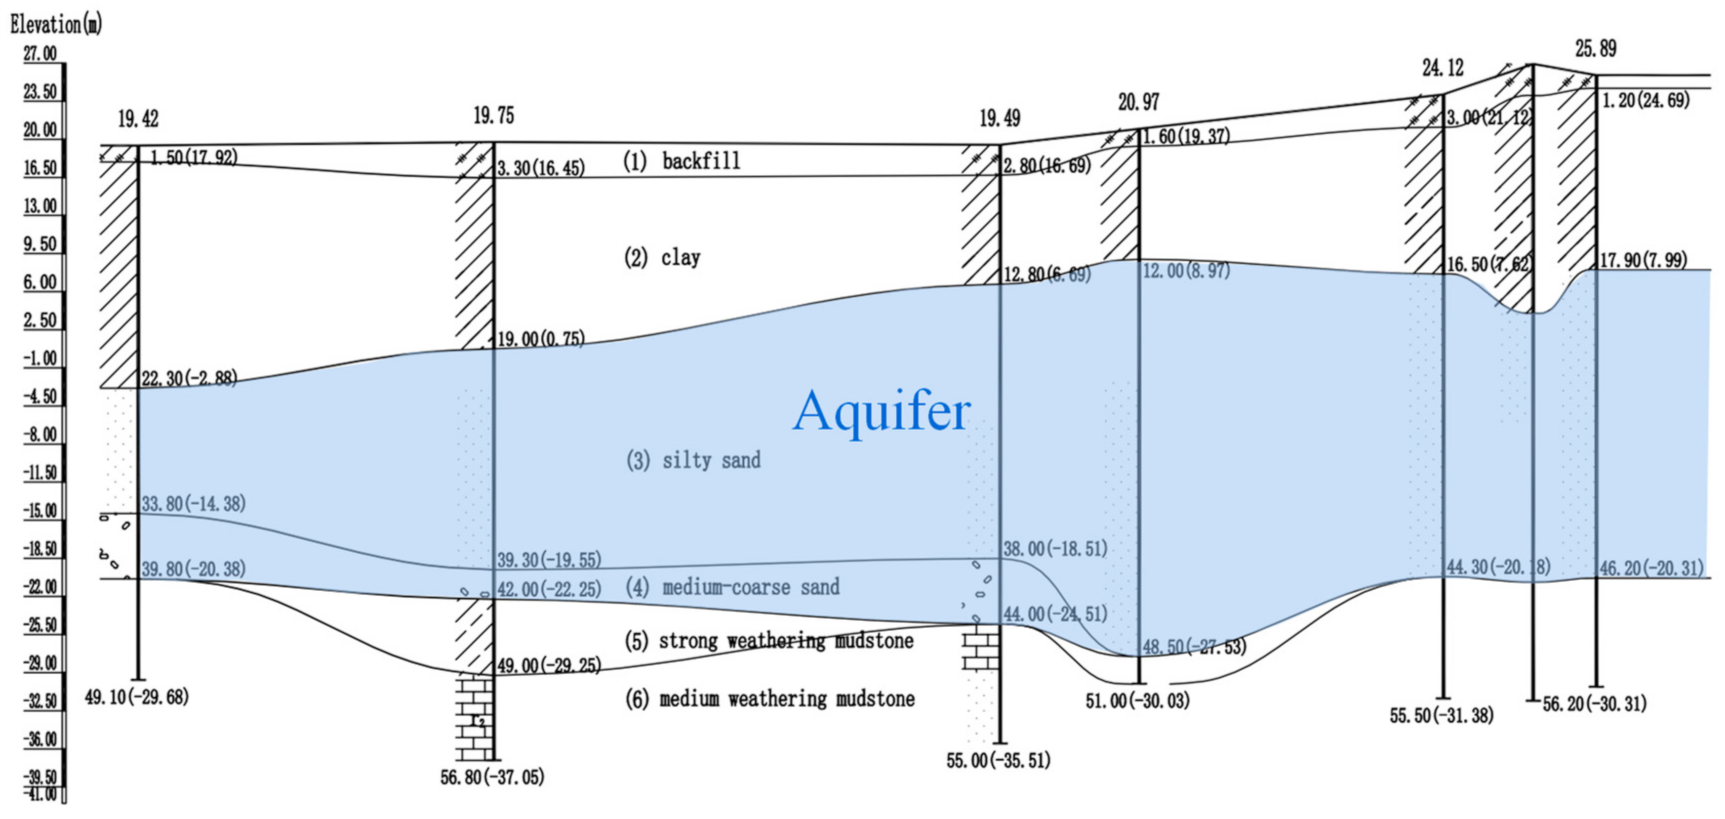
The groundwater monitoring system in this study was mainly arranged in the Houhu area of Wuhan, with a work area of about 65 km2, as shown in Figure 1a. The geomorphological unit in the working area is mainly the first and second terrace accumulation plains of the Yangtze River. The first terrace is mainly located along the Yangtze River, with elevations of 18 to 22 m. The second terrace is mainly located around the third annular urban road, with elevations of 22 m to 26 m. The bedrock in the study area is deeply buried, and the upper overburden layer is composed of quaternary sediment. Due to the potential flow heterogeneity, the overburden layer presents a typical “binary structure”, with the stratigraphic characteristics being fine at the top and coarse at the bottom [43]. The stratum of the site from top to bottom is a mixture of backfill (Qml), clay (Q4al), silty sand (Q4al), medium–coarse sand (Q4al), strong weathering mudstone, and medium weathering mudstone (S). Figure 2 showed the typical geological engineering profile of the study area.
The main types of groundwater in the region are perched water, phreatic water, and confined water. Our actual monitoring objects were mainly perched water and confined water.
2.2. Hydrological Monitoring Plan
The groundwater monitoring system in this study was arranged with 60 water-level-monitoring wells, including 30 points for perched groundwater and 30 points for confined water. The total length of hydrogeological drilling was 3734 m. The monitoring points were mainly selected in urban public green areas, parks, residential areas, and other open areas. In the key monitoring area for land subsidence prevention and control, the drilling density was increased and the regional control monitoring wells were arranged. As the secondary key monitoring area, the wells’ density of the comprehensive prevention and control area of land subsidence was relatively small. The distribution of the monitoring points is shown in Figure 1b.
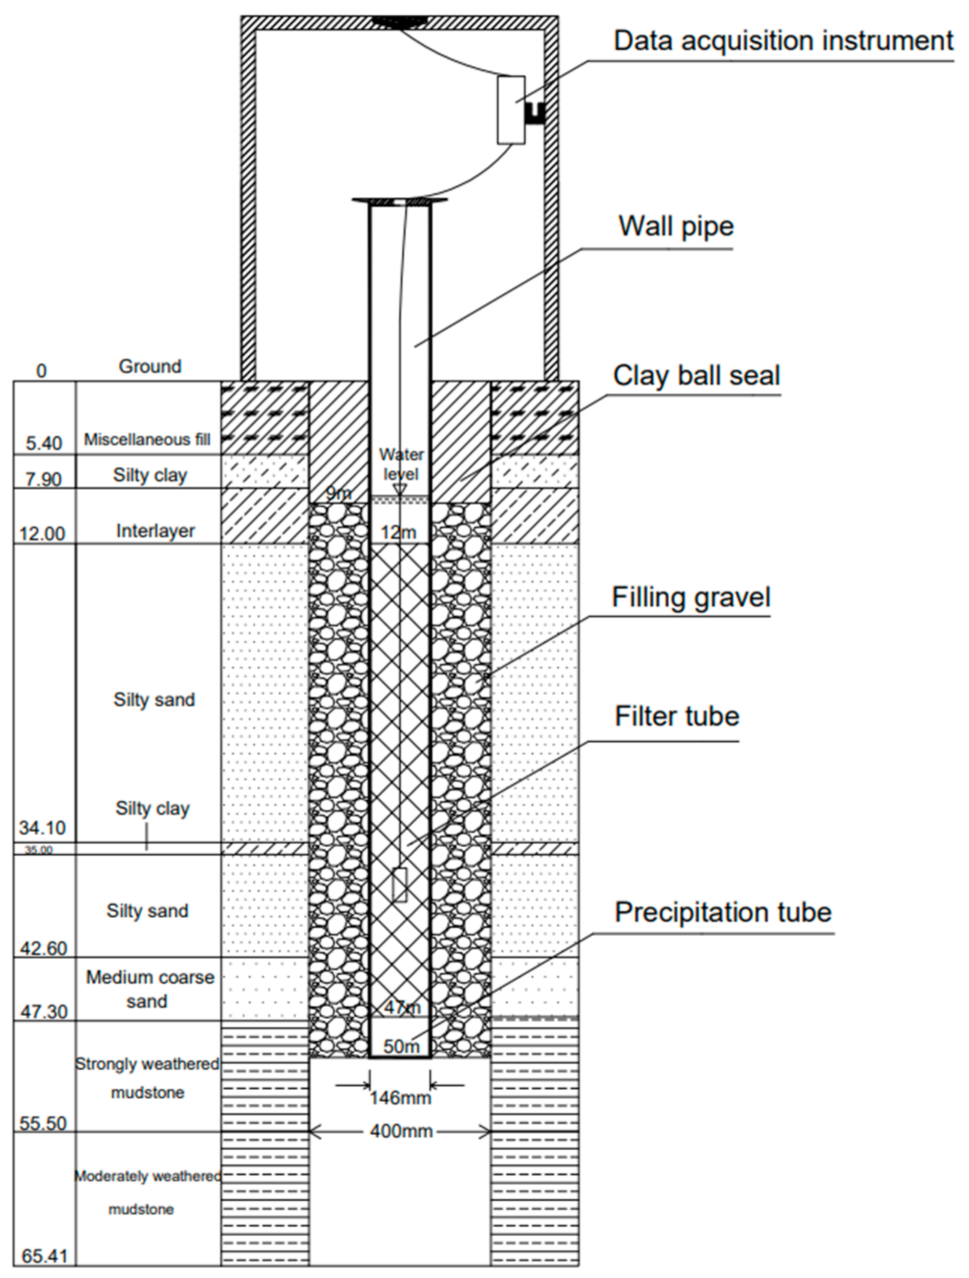
A reasonable well depth is a basic requirement for monitoring well design. It is designed mainly based on hydrogeological conditions and the dynamic changes om the target aquifer. According to the design specification, when the target aquifer for groundwater monitoring is the pore confined water from a quaternary system, the monitoring wells are constructed in accordance with the complete well, drilled through the aquifer and into the bedrock for 3 m; when the target aquifer is the perched groundwater, it should be drilled through the whole fill layer and into the lower water-insulating clay layer for 5 m. Take the monitoring well WH-SW001 in Wangjiadun Park, Jianghan District, Wuhan City, as an example. This well was a confined water level monitoring well. Based on the hydrogeological conditions at the point, the designed hole depth was 50 m, and the structural design of the monitoring well is shown in Figure 3. Borehole protection facilities need to be designed appropriately according to the actual site conditions and the surrounding environment.
The monitoring methods were divided into automatic monitoring and manual monitoring. After the construction of monitoring wells was completed, manual monitoring was carried out in the early stage. The monitoring results were obtained every five days. After the installation of automatic monitoring equipment (YLN—Z1301 groundwater level monitor), automatic monitoring was carried out. The monitoring frequency at this time was every four hours, and the monitored data about the water level and water temperature were automatically transferred to the equipment server at 8:00 every morning.
2.3. Hydrological Monitoring Results
In order to analyze the dynamic changes in the Yangtze River water level and the first terrace confined water level, five profiles on the vertical river side were selected for this study (as shown in Figure 3). The hydrological monitoring wells involved in each profile were as shown in Table 1.
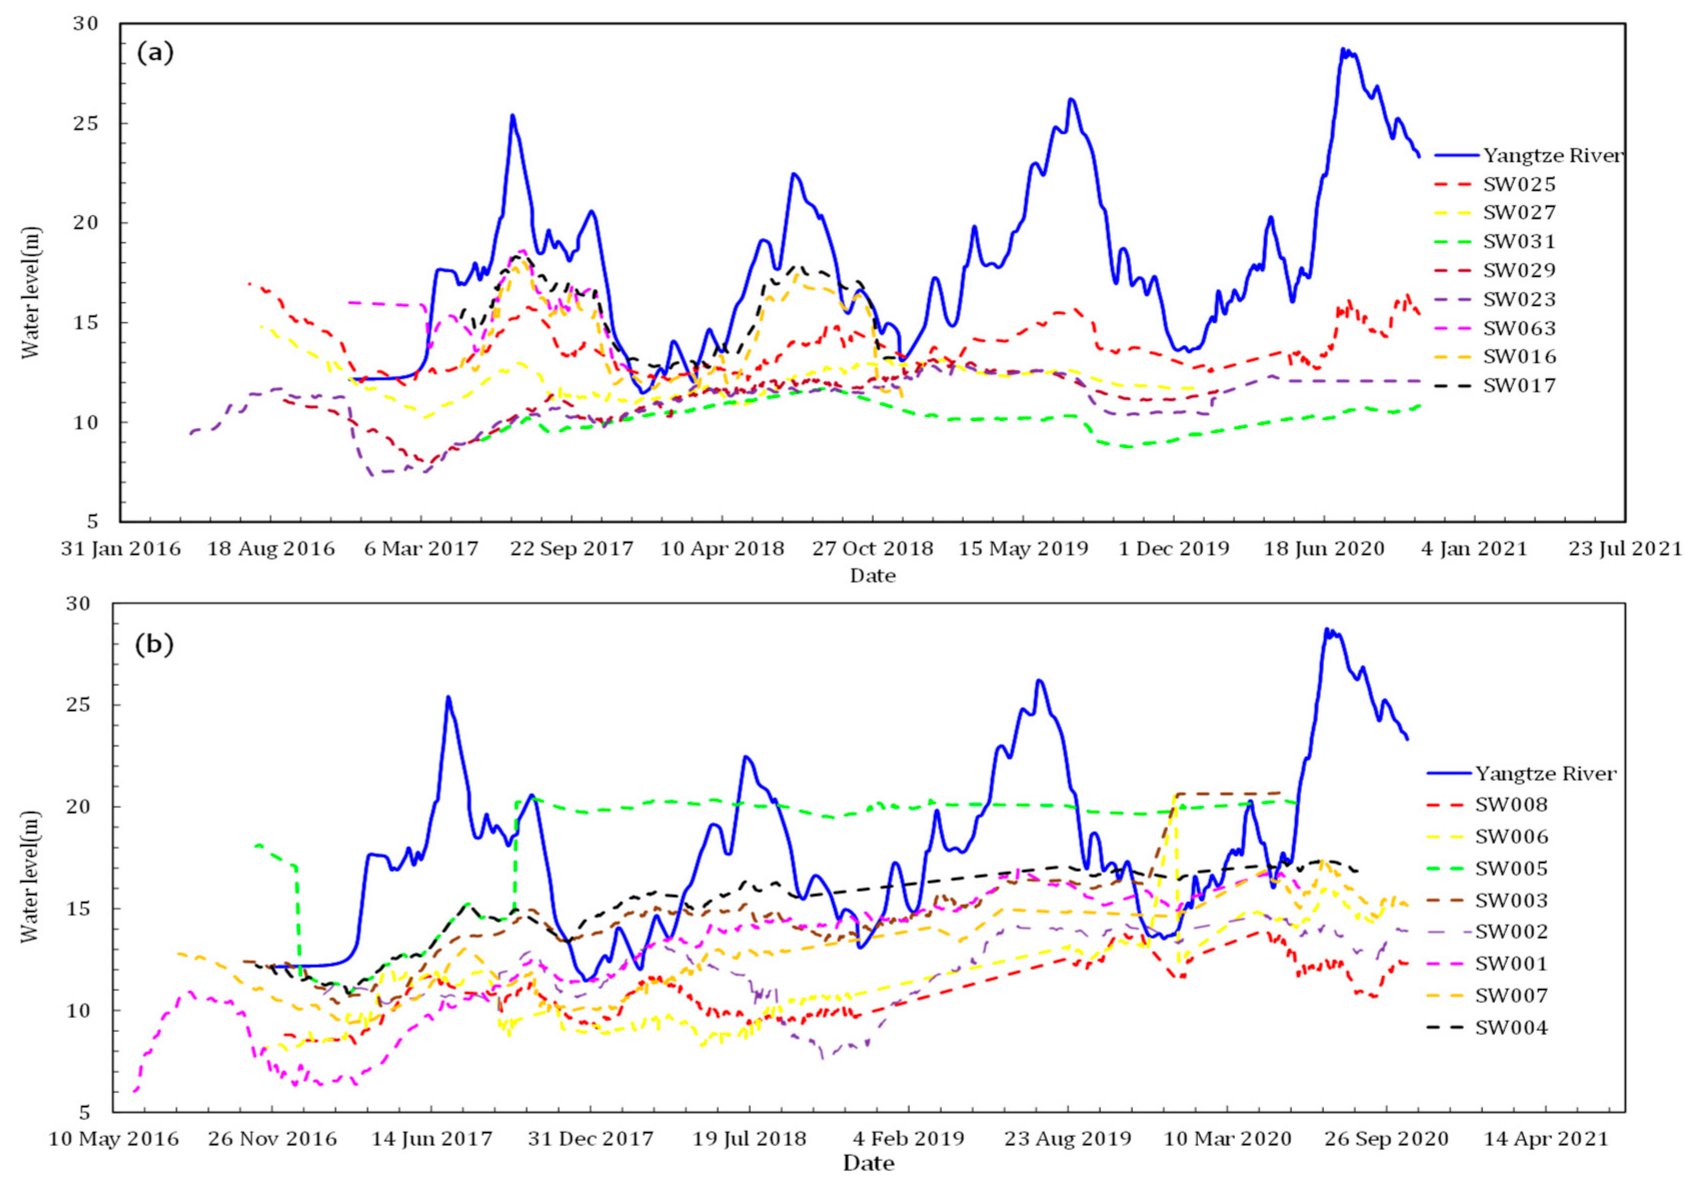
Profile 1 and Profile 2 were used as examples to analyze the dynamic changes of the confined water level of the first terrace with the distance and the fluctuation of the Yangtze River water level. The distances between the monitoring wells and the Yangtze River are shown in Table 2. The fluctuation curves of the measured 2016–2020 Yangtze River water level and the confined water level on the two profiles are shown in Figure 4.
As can be seen from Figure 4, the fluctuation of the confined water levels in the riverside area had a clear correlation with the change in the Yangtze River water level. When the river level reached its peak, the confined water level was also roughly at peak. In this study, the data of three hydrological years from 2017 to 2019 in Figure 4a were selected for analysis, and the variation in the river water level and the predicted confined water level at different distances from the river were obtained. The results were used to study the fluctuation pattern and correlation between the Yangtze River water level and the confined water level.
3. Yangtze River Water Level Fluctuation Model
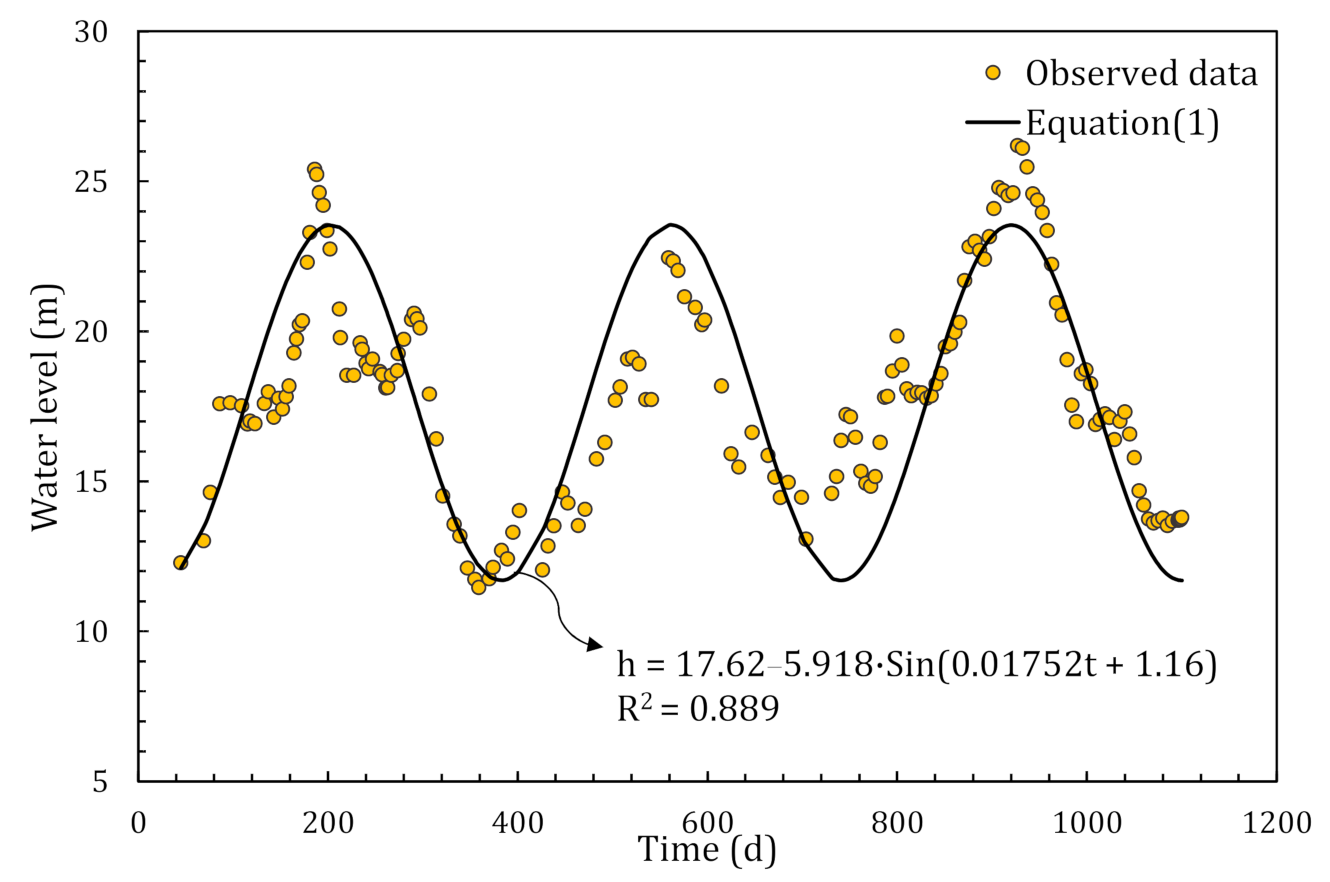
From Figure 4a, it can be observed that the Yangtze River water level was of a periodic fluctuation pattern. To study the fluctuation pattern and the correlation between Yangtze River water levels and the confined water level, the observed data of three hydrological years, 2017, 2018, and 2019, were selected and fitted to the Yangtze River water level to derive the function model of the river water level. After various comparisons, the function form was chosen as follows:
where a is the perennial average water level of the Yangtze River in the Wuhan section (m); b is the increase in the Yangtze River water level during the abundant water period or the decrease during the dry water period, both of which are generally related to the rainfall; c is the advance or lag of the flood season; ω is the period, a hydrological year; g is the calculated water level of Yangtze River (m); and t is the time (d), calculated from 1st January of each year.
The results were shown in Figure 5, where a = 17.62, b = −5.918, c = 1.16, and w = 0.01752. Empirically, the relative error was 8.4%, R2 = 0.889, and T = 2π/ω = 359 days. The period was consistent with the length of a hydrological year in the observation data, which indicated that the fitting result of the function is reliable.
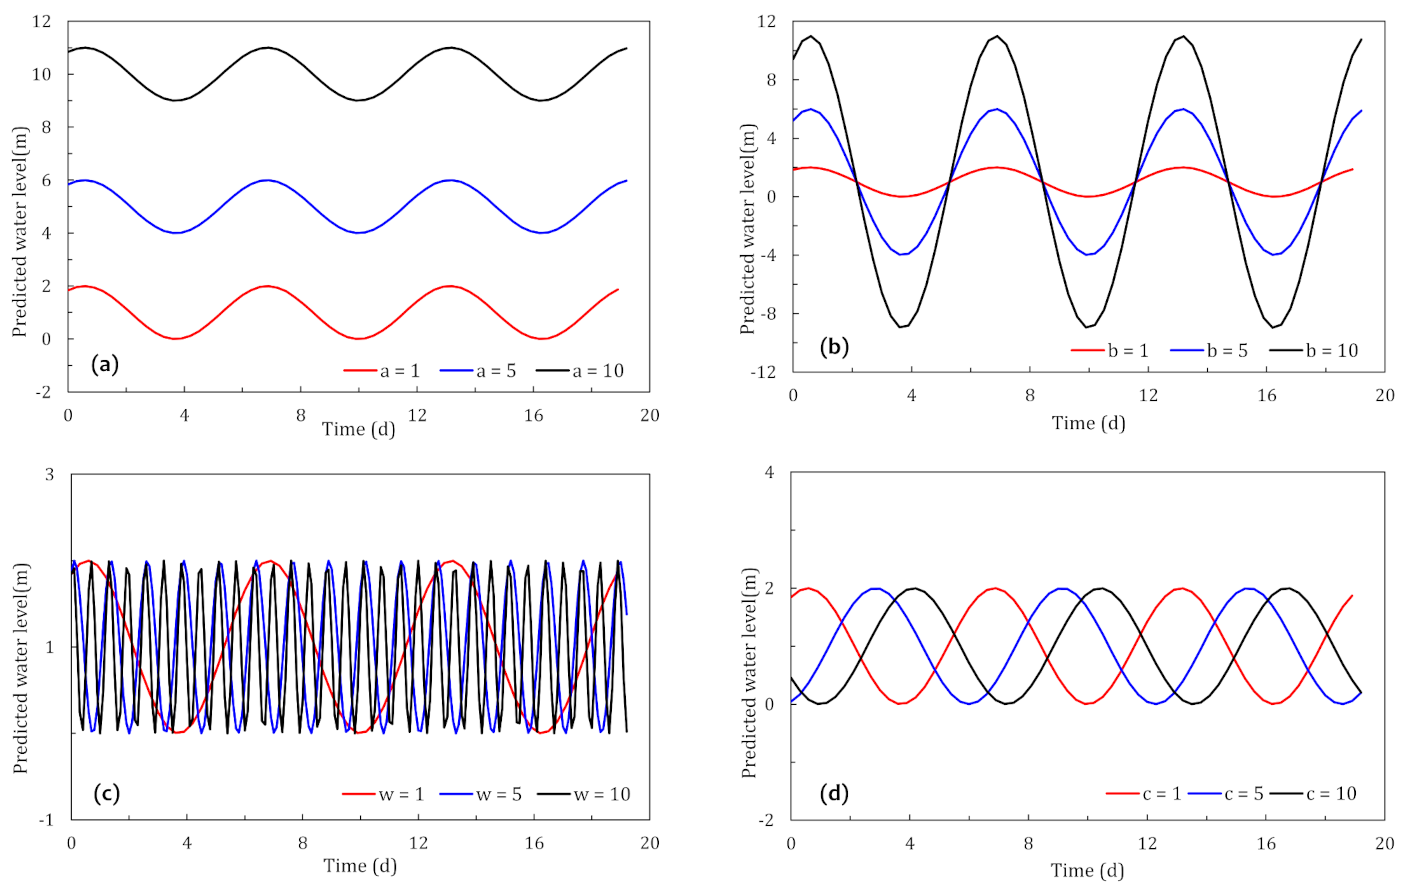
To comprehensively understand the proposed equation, its parameters were selected with different values, as shown in Figure 6. Figure 6a presented different values for the perennial average water level of the Yangtze River in the Wuhan section. The position of the curve shifts upward with increasing values of a, indicating a higher water level of the Yangtze River. According to the change of b value in the Yangtze River model, water levels were illustrated in Figure 6b. The slope of the curve becomes larger with increasing values of b, which were always controlled by external factors (rainfall and dam release, etc.). The results of different values of the advance or lag of the flood season are shown in Figure 6c. The curve becomes denser as the value of ω increases, but it is basically set at nearly one year. Figure 6d presents different values of c. The position of the curve shifted to the right as the value of c increased. It demonstrated that the time of the flood season was a key point in determining the timing of water level changes.
4. Prediction of Confined Water Head
4.1. Analytical Derivation of Stream–Aquifer Interactions: Solution of the Ground Water Flow Equations
The essence of the dynamic relationship between the Yangtze River water level and the confined water level in the first terrace is the fluctuation of the groundwater level in the confined aquifer under the action of variable head, which is also the interaction pattern of surface water and groundwater. According to the seepage characteristics, the surface water–groundwater interaction pattern can generally be divided into unsaturated and saturated flow [44], of which the confined aquifer is always dominated by the saturated flow process. The Boussinesq equation was used to describe the process of groundwater seepage movement and treated the surface water–groundwater interaction process as being continuous. The solution conditions were generally determined by the initial conditions and the Dirichlet or Neumann boundary conditions [45]. The existing studies usually treated river water level as a stochastic process and then used numerical simulations to describe the driving process of groundwater fluctuation using the change in river water level.
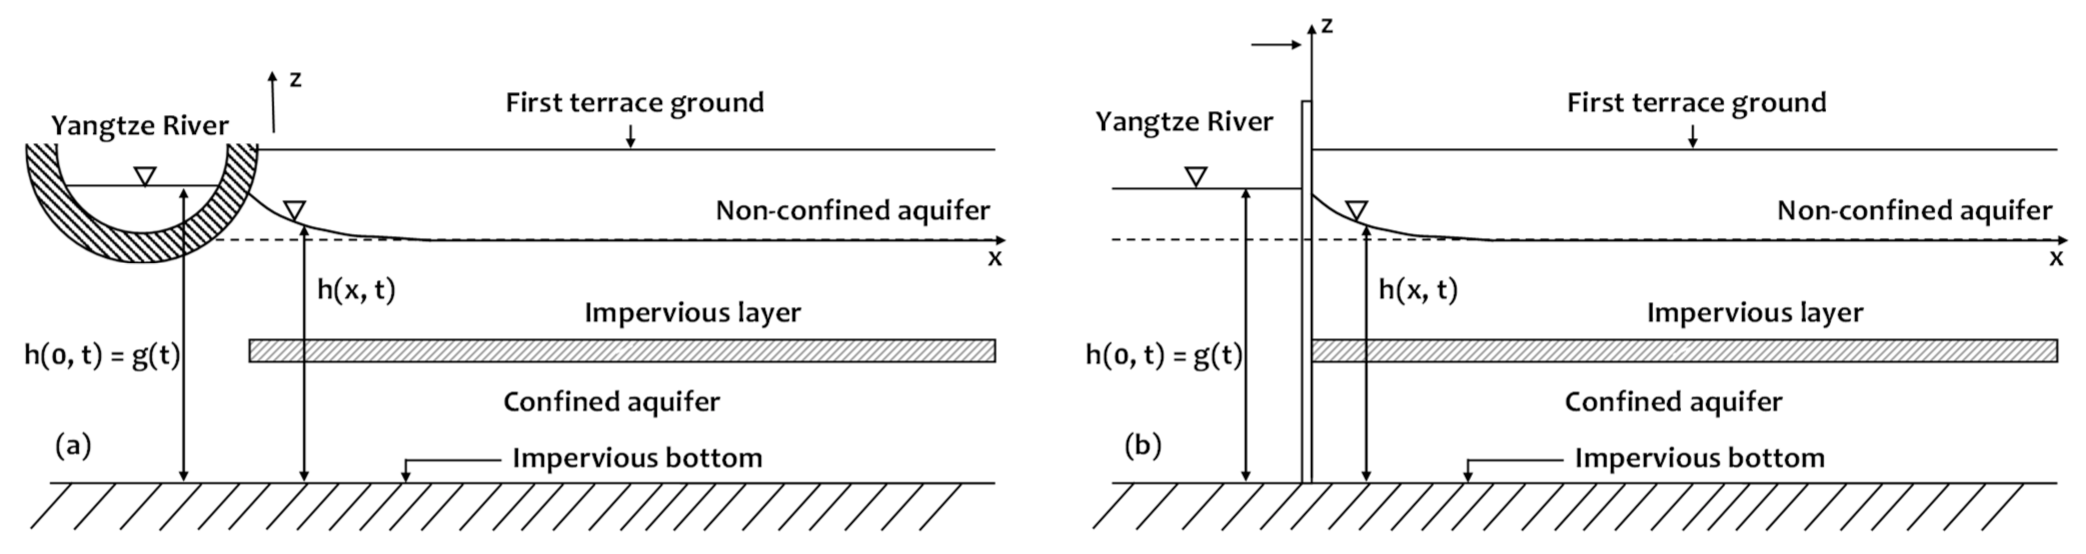
As shown in Figure 7, in order to facilitate theoretical derivation and calculation, the hydrogeological model of the Hankou first terrace riverine area could be simplified to a subsurface aquifer system consisting of a confined aquifer, an unconfined aquifer, and an impermeable layer. That is, the clay layer is an impermeable layer, the sand layer is a confined aquifer, and the mudstone is an impermeable bottom [43]. They also extend indefinitely inland from the river shoreline. The thickness of the underwater aquifer is much greater than the magnitude of external water variability. The specific yield degree in underwater aquifers is much larger than the elastic storage coefficient in confined aquifers, which can effectively suppress the propagation of external water level fluctuations in submerged aquifers. Groundwater fluctuations in the underwater aquifer can be neglected compared with those in the confined aquifer. Therefore, we assumed that the head in the submerged aquifer was a constant.
The X-axis coincided with the midline of the impermeable layer and was oriented inland; the Z-axis was the plumb direction of the shoreline and was oriented upward, as shown in Figure 7. The water level of the external water body was a variable head condition and was expressed as a function of water level with time. The groundwater head, boundary conditions, and initial conditions in the confined aquifer were presented as follows:
where h(x, t) is the groundwater head in the confined aquifer at time t and location x; g(t) is the water level of the external water body as a function of time; T is the transmissivity of the confined aquifer (m2/h); S is a dimensionless coefficient representing water storage.
If the groundwater head in the pressurized aquifer was assumed to be constant at 0 at infinity inland, it could be expressed as follows:
After performing the Fourier sine transform on the variable x and substituting Equations (3), (4) and (6) into Equations (2) and (5), Equations (2) and (5) could be transformed into the following:
where ω is the frequency variable; , where D is the diffusion coefficient of the confined aquifer (m2/h).
Solving for Equations (7) and (8), the expression for could be derived as
The Fourier inversion of led to the following analytical solution:
where exp is an exponential function with a natural constant base.
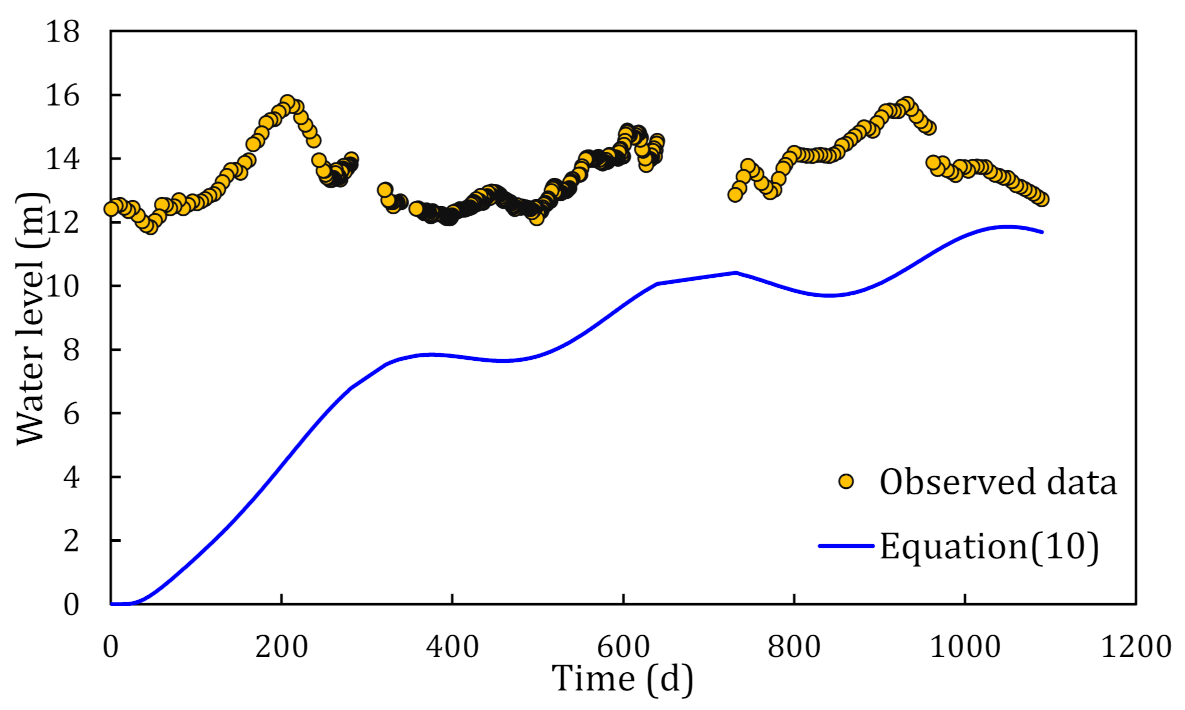
The above Equation (10) is a common 1-D solution for the confined aquifer response to stream-stage fluctuations [46]. With the use of Equation (10), the confined water head at x from the river could be calculated when the river level change function was known for a given time t. However, there are still some defects in Equation (10) when it is used to predict the “real” groundwater head instead of the variation of groundwater head. For example, when t approaches 0, the confined water level calculated by Equation (10) approaches 0, which is much smaller than the monitoring value, as shown in the Figure 8. The farther away from the river (i.e., the greater the x), the larger the error. The reason is that Equation (10) does not consider the damping effect of pressure conduction caused by the increase in distance. This is why, as can be seen from Figure 4, the farther away from the river, the lower the confined water level and the smaller the change range.
According to the above analysis, both the confined water head and the Yangtze water level have their own stable water level, and the main influence on the variation of the confined water level is the fluctuation of the Yangtze water level . It is assumed that the variation of the confined water level is inversely proportional to the distance x. When x approaches infinity, is close to zero. Therefore, the confined water level can be divided into the stable water level and the variable water level as the following equation:
where is the stable value of the confined water level far from the river side x, which reflects the damping effect of pressure conduction with distance. It is difficult to obtain this value theoretically at present, but it can be obtained from monitoring data.
Based on Equation (10), the variation of confined water level can be expressed as the following equation:
where the variation of stream-stage fluctuation is .
By substituting Equation (13) into Equation (12), the confined water level for a given time t and location can be obtained.
4.2. Calculation and Validation
The time function of the Yangtze water level’s change g(t) (Equation (1)) was employed into the analytical solution (Equation (13)) to calculate the fluctuation of the confined water level at different distances to the river. Due to the limited number and location of confined water monitoring wells in the study area and the missing data due to damage to the equipment during monitoring, after comparing the integrity of the observed data, the SW063, SW016, and SW025 monitoring wells on Profile 1 were finally selected, which were 600 m, 800 m, and 1700 m away from the river, respectively. The parameters assigned for calculation are shown in Table 3.
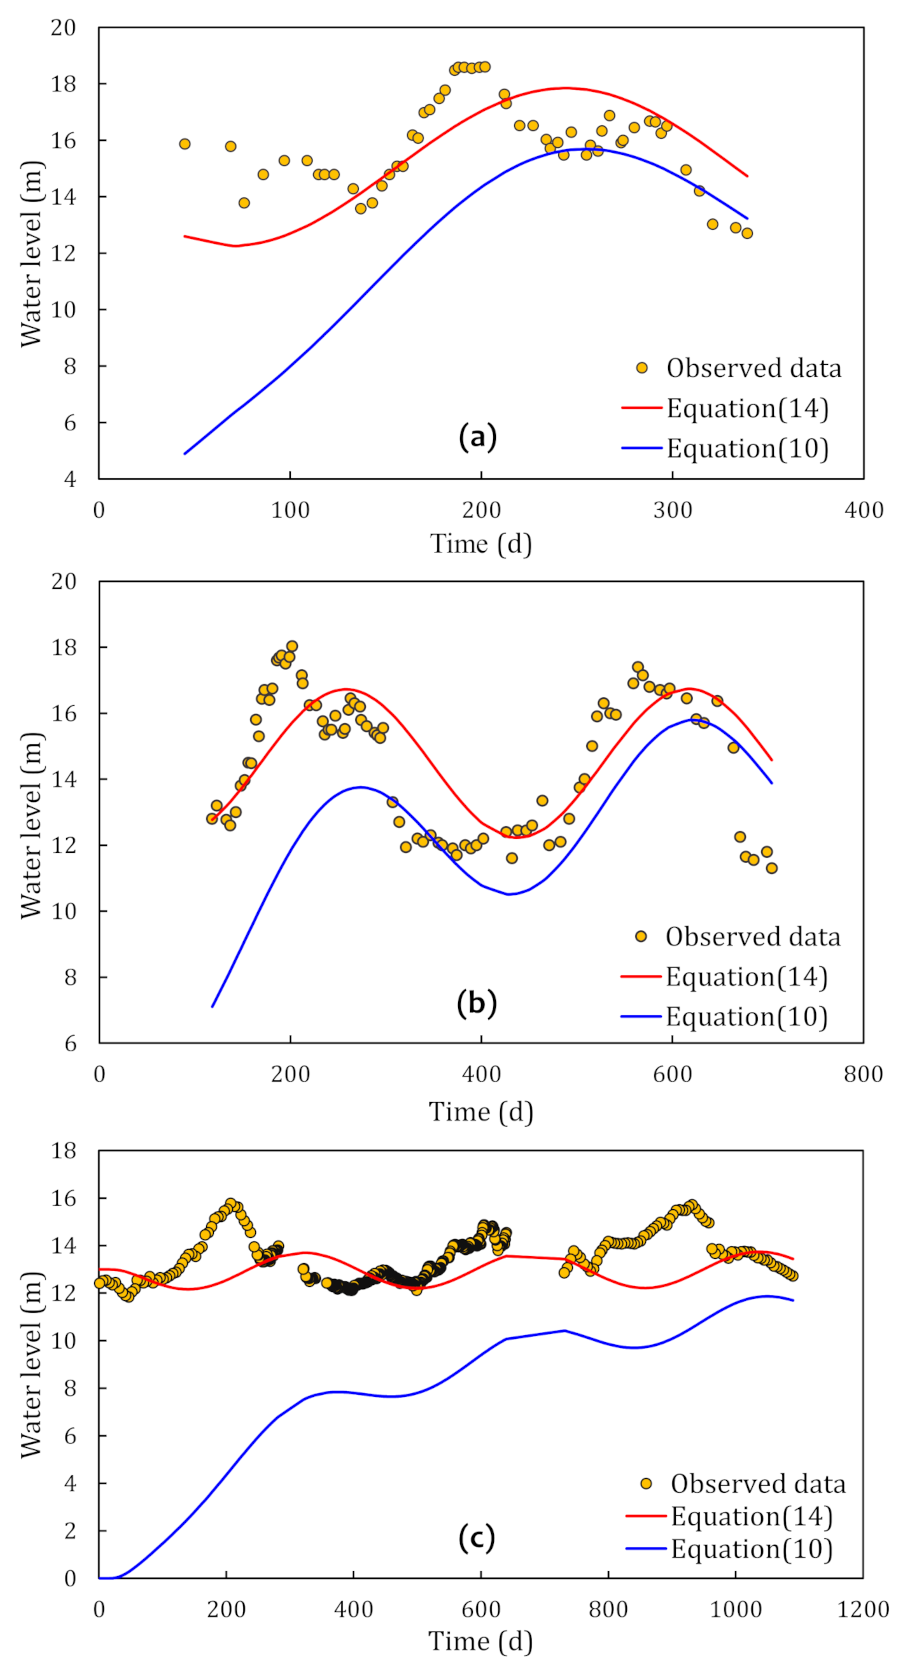
The calculated results are shown in Figure 9, where (a), (b), and (c) present the results of comparison between the calculated results and observed data at 600 m, 800 m, and 1700 m, respectively. The values of h0 for are 15 m, 14.5 m, and 13 m, respectively. The blue line represents the results calculated by the classical Equation (10), and the red line represents the results calculated by the proposed Equation (14). As can be seen in Figure 9, the results computed by Equation (14) match better with the monitoring data than those computed by Equation (10). The relative errors (calculated value minus monitored value, the result is taken as absolute value and divided by monitored value) of Equation (14) for are 8.88%, 8.71%, and 6.14%, which are much smaller than those of Equation (10), which are 19.15%, 17.67%, and 41.33%, respectively. The prediction error has been greatly reduced (by about 18%) from 26% to 8%. This indicates that the proposed Equation (14) is valid for predicting the response of the groundwater head of the confined aquifer to stream-stage fluctuation.
5. Summary and Conclusions
In combination with field hydrological monitoring tests and theoretical analysis, the response of the confined groundwater head to stream-stage fluctuations was studied at the Yangtze River in Wuhan, China. The data for stream-stage fluctuation of the Yangtze River and the confined groundwater head measured by 60 hydrological monitoring wells for three years were compiled. Based on the analysis of measured data, the stream-stage fluctuation of the Yangtze River can be expressed by a sinusoidal equation with four parameters (a, b, ω, and c). These four parameters are physically sound and easily determined.
Since the common 1-D ground water flow equation failed to predict the confined groundwater head, we derived a new flow model to improve prediction accuracy. This model can be used to predict the confined groundwater head in combination with the proposed sinusoidal equation for stream-stage fluctuation. The model was evaluated by field monitoring data of three hydrological years from 2017 to 2019. The evaluation results showed that the predicted groundwater head of the confined aquifer matched well with the monitoring data. The prediction error of the proposed model (about 8%) is much lower than that of the previous model (by about 26%).
Overall, the most important contributions of this study are (1) to present a large number of measured hydrological data that provides a solid base to evaluate the theoretical models or numerical simulations for stream–aquifer interaction problems and (2) to provide a new expression to describe stream-stage fluctuation and an improved analytical model of stream–aquifer interactions, which can be applied into groundwater flow models (such as MODFLOW, FEFLOW, etc.). The results of this study provide valuable hydrological reference for underground practical engineering in the riverside area, especially in the first terrace of the Yangtze River.
Author Contributions
Conceptualization, Y.L. and X.R.; methodology, Y.L.; software, Y.L.; validation, Y.L., H.W. and Y.W.; formal analysis, H.W.; investigation, Y.Z.; resources, Y.L.; data curation, H.W.; writing—original draft preparation, Y.L.; writing—review and editing, X.R.; visualization, Y.W.; supervision, Y.L.; project administration, X.R.; funding acquisition, X.R. All authors have read and agreed to the published version of the manuscript.
Funding
This research was funded by the National Natural Science Foundation of China (No. 51708526) and by the Wuhan Geotechnical Engineering and Surveying Co., Ltd. (No. 2020056355).
Data Availability Statement
The Yangtze River water level data used in this paper can be found from the Changjiang Maritime Safety Administration, which is publicly available. The confined water level data used in this paper comes from the Houhu groundwater monitoring system built by Wuhan Geotechnical Engineering and Surveying Co., Ltd., which is protected by company procedures and not publicly available.
Acknowledgments
All individuals included in this section have consented to the acknowledgement.
Conflicts of Interest
The authors declare no conflict of interest.
References
- Spanoudaki, K.; Nanou-Giannarou, A.; Paschalinos, Y.; Memos, C.D.; Stamou, A.I. Analytical solutions to the stream-aquifer interaction problem: A critical review. Glob. Nest J. 2010, 12, 126–139. [Google Scholar] [CrossRef]
- Courbis, A.L.; Vayassade, B.; Martin, C.; Didon-Lescot, J.F. Modelling and simulation of a catchment in order to evaluate water resources. Glob. Nest J. 2008, 10, 301–309. [Google Scholar]
- Ma, S.l.; Kassinos, S.C.; Kassinos, D.F.; Akylas, E. Modeling the impact of water withdrawal schemes on the transport of pesticides in the Kouris Dam (Cyprus). Glob. Nest J. 2008, 10, 350–358. [Google Scholar]
- Castro, N.M.; Hornberger, G.M. Surface-subsurface water interactions in an alluviated mountain stream channel. Water Resour. Res. 1991, 27, 1613–1621. [Google Scholar] [CrossRef]
- Brunner, P.; Cook, P.G.; Simmons, C.T. Disconnected surface water and groundwater: From theory to practice. Ground Water 2011, 49, 460–467. [Google Scholar] [CrossRef] [Green Version]
- Medici, G.; Engdahl, N.B.; Langman, J.B. A basin-scale groundwater flow model of the columbia plateau regional aquifer system in the palouse (USA): Insights for aquifer vulnerability assessment. Int. J. Environ. Res. 2021, 15, 299–312. [Google Scholar] [CrossRef]
- Condon, L.E.; Maxwell, R.M. Simulating the sensitivity of evapotranspiration and streamflow to large-scale groundwater depletion. Sci. Adv. 2019, 5, 4574. [Google Scholar] [CrossRef] [Green Version]
- Konikow, L.F.; Kendy, E. Groundwater depletion: A global problem. Hydrogeol. J. 2005, 13, 317–320. [Google Scholar] [CrossRef]
- Hantush, M.S. Wells near streams with semipervious beds. J. Geophy. 1965, 70, 2829–2838. [Google Scholar] [CrossRef]
- Hunt, B. Unsteady stream depletion from groundwater pumping. Ground Water 1999, 37, 98–102. [Google Scholar] [CrossRef]
- Schmitz, G.H.; Edenhofer, J. Exact closed-form solution of the two-dimensional Laplace equation for steady groundwater flow with nonlinearized free-surface boundary condition. Water Resour. 2000, 36, 1975–1980. [Google Scholar] [CrossRef]
- Hantush, M.M. Modeling steam-aquifer interactions with linear response functions. J. Hydrol. 2005, 311, 59–79. [Google Scholar] [CrossRef]
- Dillon, P.J.; Liggett, A. An ephemeral steam- aquifer interaction model. Water Resour. 1983, 19, 621–626. [Google Scholar] [CrossRef]
- Chin, D.A. Leakage of clogged channels that partically penetrate surficial aquifers. J. Hydraul. 1991, 117, 467–488. [Google Scholar] [CrossRef]
- Sophocleous, M.A.; Koussis, A.; Martion, J.L.; Perkins, S.P. Evaluation of simplified stream-aquifer depletion models for water rights administration. Ground Water 1995, 33, 579–588. [Google Scholar] [CrossRef]
- Carabin, G.; Dassargues, A. Modeling ground water with ocean and river interaction. Water Resour. 1999, 35, 2347–2358. [Google Scholar] [CrossRef]
- Chen, X.H.; Yin, Y. Streamflow depletion: Modeling of reduced baseflow and induced stream infiltration from seasonally pumped wells. J. Am. Water Resour. 2001, 37, 185–195. [Google Scholar] [CrossRef]
- Intaraprasong, T.; Zhan, H. A general framework of stream-aquifer interaction caused by variable stream stages. J. Hydrol. 2009, 373, 112–121. [Google Scholar] [CrossRef]
- Sun, D.; Zhan, H. Flow to a horizontal well in an aquifer–aquitard system. J. Hydrol. 2006, 321, 364–376. [Google Scholar] [CrossRef]
- Sun, D.; Zhan, H. Pumping induced depletion from two streams. Water Resour. 2007, 30, 1016–1026. [Google Scholar] [CrossRef]
- Zhan, H.; Park, E. Horizontal well hydraulics in leaky aquifers. J. Hydrol. 2003, 281, 129–146. [Google Scholar] [CrossRef]
- Cooper, H.H., Jr.; Rorabaugh, M.I. Groundwater movements and bank storage due to flood stages in surface streams. USGS Water Supply Paper 1963, 1536, 343–366. [Google Scholar]
- Chen, X.; Chen, X.H. Stream water infiltration, bank storage, and storage zone changes due to stream-stage fluctuations. J. Hydrol. 2003, 280, 246–264. [Google Scholar] [CrossRef]
- Singh, S.K. Ramp kernels for aquifer responses to arbitrary stream stage. J. Irrig. Drain. 2004, 130, 460–467. [Google Scholar] [CrossRef]
- Moench, A.F.; Barlow, P.M. Aquifer response to stream-stage and recharge variations. I. Analytical step-response functions. J. Hydrol. 2000, 230, 192–210. [Google Scholar] [CrossRef]
- Barlow, P.M.; DeSimone, L.A.; Moench, A.F. Aquifer response to stream-stage and recharge variations. II. Convolution method and applications. J. Hydrol. 2000, 230, 211–229. [Google Scholar] [CrossRef]
- Sophocleous, M. Interactions between groundwater and surface water: The state of the science. Hydrogeol. J. 2002, 10, 52–67. [Google Scholar] [CrossRef]
- Chen, Z.; Yu, L.Z.; Gupta, A. Yangtze River, China: Introduction. Geomorphol. Spec. Issue 2001, 41, 248. [Google Scholar]
- Chen, Z.; Li, J.F.; Shen, H.T. Yangtze River, China, historical analysis of discharge variability and sediment flux. Geomorphology 2001, 41, 77–91. [Google Scholar] [CrossRef]
- Chen, Z.; Gupta, A.; Yin, H.F. Large monsoon rivers of Asia. Geomorphol. Spec. Issue 2007, 85, 316. [Google Scholar]
- Xiang, Y.; Bao, C. The Weather in the Middle and Lower Reaches of Yangtze River; Meteorological Press: Beijing, China, 1981; pp. 21–136. [Google Scholar]
- Zhang, Q.; Xu, C.Y.; Zhang, Z.; Chen, Y.D.; Liu, C.; Lin, H. Spatial and temporal variability of precipitation maxima during 1960–2005 in the Yangtze River Basin and possible association with large-scale circulation. J. Hydrol. 2008, 353, 215–227. [Google Scholar] [CrossRef]
- Zhang, Z.; Sun, B.; Xu, H. Effect of characteristics of ground water distribution and seepage on anti-uplift analysis of building foundations. China Civ. Eng. J. 2001, 1, 73–78. [Google Scholar]
- Liu, Y.; Wang, X. Analysis about influence of confined water level change near river on underground structures. Site Investig. Sci. Technol. 2009, 3, 39–41. [Google Scholar]
- Li, S.; Han, H. Method for getting the value of anti-uplift water level for construction—An exemplified project in Beijing. China Saf. Sci. J. 2005, 7, 58–62. [Google Scholar]
- Ren, X.; Santamarina, J.C. The hydraulic conductivity of sediments: A pore size perspective. Eng. Geol. 2018, 233, 48–54. [Google Scholar] [CrossRef] [Green Version]
- Ren, X.; Hong, N.; Li, L.; Kang, J.; Li, J. Effect of infiltration rate changes in urban soils on stormwater runoff process. Geoderma 2020, 363, 1–11. [Google Scholar] [CrossRef]
- Kamel, S.; Younes, H.; Chkir, N.; Zouari, K. The hydro geochemical characterization of ground waters in Tunisian Chott’s region. Environ. Geol. 2008, 54, 843–854. [Google Scholar] [CrossRef]
- Barzegar, R.; Moghaddam, A.A.; Najib, M.; Kazemian, N.; Adamowski, J. Characterization of hydrogeologic properties of the Tabriz plain multilayer aquifer system, NW Iran. Arab. J. Geosci. 2016, 9, 147. [Google Scholar] [CrossRef]
- Mao, Y.; Zhao, X.H. New characteristics of water level and discharge relationship at Jianli section in middle reaches of Yangtze River in past 10 years. Yangtze River 2020, 5, 89–93. [Google Scholar]
- Ren, X.; Zhao, Y.; Deng, Q.; Kang, J.; Li, D.; Wang, D. A relation of hydraulic conductivity-void ratio for soils based on Kozeny-Carman equation. Eng. Geol. 2016, 213, 89–97. [Google Scholar] [CrossRef]
- Shi, A.L.; Qin, J.; Chen, Z.H. Analysis of the long-term variation characteristics of water level in the upper reaches of Yangtze River. Resour. Environ. Yangtze Basin 2021, 2, 361–368. [Google Scholar]
- Colombera, L.; Mountney, N.P.; Medici, G.; West, L.J. The geometry of fluvial channel bodies: Empirical characterization and implications for object-based models of the subsurface. AAPG Bull. 2019, 103, 905–929. [Google Scholar] [CrossRef]
- Liu, Y.Z.; Zhang, X.Y. Groundwater value for the buoyancy design in the first terrace of Yangtze River in Wuhan. Soil Found. 2015, 29, 54–58. [Google Scholar]
- Rao, Q. Water level of anti-floating design and buoyancy reduction analysis for underground buildings in Wuhan area. Wuhan Surv. Des. 2012, 2, 36–38. [Google Scholar]
- Dong, L.; Luo, X.; Lin, Q.; Hu, B. Analytical solution to evaluate aquifer response to arbitrary water level variation. Eng. J. Wuhan Univ. 2019, 52, 847–853. [Google Scholar]
Figure 1.
Diagram of the working groundwater monitoring area (a) and a distribution map of the groundwater monitoring wells (b).
Figure 1.
Diagram of the working groundwater monitoring area (a) and a distribution map of the groundwater monitoring wells (b).

Figure 2.
Typical engineering geological profile (Profile 1 in Figure 1).
Figure 2.
Typical engineering geological profile (Profile 1 in Figure 1).

Figure 3.
Structural design of a monitoring well.

Figure 4.
Diagram of the Profile 1 (a) and Profile 2 (b) river level and confined water level fluctuations.
Figure 4.
Diagram of the Profile 1 (a) and Profile 2 (b) river level and confined water level fluctuations.

Figure 5.
Comparison of calculation results and observed data of the water level of the Yangtze River.
Figure 5.
Comparison of calculation results and observed data of the water level of the Yangtze River.

Figure 6.
Different values of the parameters in Equation (1): (a) a = 1, a = 5, and a = 10; (b) b = 1, b = 5, and b = 10; (c) ω = 1, ω = 5, and ω = 10; and (d) c = 1, c = 5, and c = 10.
Figure 6.
Different values of the parameters in Equation (1): (a) a = 1, a = 5, and a = 10; (b) b = 1, b = 5, and b = 10; (c) ω = 1, ω = 5, and ω = 10; and (d) c = 1, c = 5, and c = 10.

Figure 7.
Generalized hydrogeological model of the riverine area on the Hankou first terrace: (a) actual situation; (b) idealized assumption.
Figure 7.
Generalized hydrogeological model of the riverine area on the Hankou first terrace: (a) actual situation; (b) idealized assumption.

Figure 8.
Comparison of calculated values and observed data (x = 1700 m).

Figure 9.
The comparison of calculation results and observed data (monitoring data in (a–c) are respectively obtained from SW063, SW016, and SW025).
Figure 9.
The comparison of calculation results and observed data (monitoring data in (a–c) are respectively obtained from SW063, SW016, and SW025).


Table 1.
Distribution of monitoring wells on each profile.
| Profile | Monitoring Well |
|---|---|
| Profile 1 | SW023- SW029- SW027- SW025- SW017- SW016- SW063- Yangtze River |
| Profile 2 | SW005- SW003- SW002- SW008- SW006- Yangtze River |
| Profile 3 | SW013- SW046- SW015- SW014- Yangtze River |
| Profile 4 | SW022- SW031- SW026- SW024- Yangtze River |
| Profile 5 | SW021- SW020- SW053- SW018- Yangtze River |
Table 2.
Distance of monitoring wells from the Yangtze River.
| Monitoring Wells | |||||||
|---|---|---|---|---|---|---|---|
| Profile 1 | SW063 | SW016 | SW017 | SW025 | SW027 | SW029 | SW023 |
| Distance/km | 0.6 | 0.8 | 0.9 | 1.7 | 2.2 | 3.8 | 4.8 |
| Profile 2 | SW06 | SW08 | SW02 | SW03 | SW05 | ||
| Distance/km | 2.6 | 4.1 | 5.5 | 7.2 | 8.0 | ||
Table 3.
Calculation parameters of water level fluctuation of confined water.
| Parameter | Value | Unit |
|---|---|---|
| T | 30 | m2/d |
| S | 0.005 | Dimensionless |
| D | 6000 | m2/d |
| K | 1 | m/d |
Publisher’s Note: MDPI stays neutral with regard to jurisdictional claims in published maps and institutional affiliations. |
© 2021 by the authors. Licensee MDPI, Basel, Switzerland. This article is an open access article distributed under the terms and conditions of the Creative Commons Attribution (CC BY) license (https://creativecommons.org/licenses/by/4.0/).
Share and Cite
MDPI and ACS Style
Liu, Y.; Wang, H.; Wu, Y.; Zhao, Y.; Ren, X. Aquifer Response to Stream-Stage Fluctuations: Field Tests and Analytical Solution for a Case Study of the Yangtze River in Wuhan, China. Water 2021, 13, 2388. https://doi.org/10.3390/w13172388
AMA Style
Liu Y, Wang H, Wu Y, Zhao Y, Ren X. Aquifer Response to Stream-Stage Fluctuations: Field Tests and Analytical Solution for a Case Study of the Yangtze River in Wuhan, China. Water. 2021; 13(17):2388. https://doi.org/10.3390/w13172388
Chicago/Turabian StyleLiu, Yanmin, Hao Wang, Yungang Wu, Yuan Zhao, and Xingwei Ren. 2021. "Aquifer Response to Stream-Stage Fluctuations: Field Tests and Analytical Solution for a Case Study of the Yangtze River in Wuhan, China" Water 13, no. 17: 2388. https://doi.org/10.3390/w13172388
Note that from the first issue of 2016, this journal uses article numbers instead of page numbers. See further details here.