
Prediction of Surface Water Quality by Artificial Neural Network Model Using Probabilistic Weather Forecasting


1
Department of Environmental Engineering, Inje University, 197 Inje-ro, Gimhae 50834, Korea
2
Department of Safety and Environmental Research, The Seoul Institute, 57 Nambusunhwan-ro, 340-gil, Seoul 06756, Korea
3
Department of Civil & Environmental Engineering, Myongji University, 116 Myongji-ro, Yongin-si 17058, Korea
*
Author to whom correspondence should be addressed.
Water 2021, 13(17), 2392; https://doi.org/10.3390/w13172392
Submission received: 7 July 2021
/
Revised: 23 August 2021
/
Accepted: 26 August 2021
/
Published: 30 August 2021
(This article belongs to the Section Water Quality and Contamination)
Abstract
:We developed an artificial neural network (ANN)-based water quality prediction model and evaluated the applicability of the model using regional probability forecasts provided by the Korea Meteorological Administration as the input data of the model. The ANN-based water quality prediction model was constructed by reflecting the actual meteorological observation data and the water quality factors classified using an exploratory factor analysis (EFA) for each unit watershed in Nam River. To apply spatial refinement of meteorological factors for each unit watershed, we used the data of the Sancheong meteorological station for Namgang A and B, and the data of the Jinju meteorological station for Namgang C, D, and E. The predicted water quality variables were dissolved oxygen (DO), biochemical oxygen demand (BOD), chemical oxygen demand (COD), total organic carbon (TOC), total phosphorus (T-P), and suspended solids (SS). The ANN evaluation results reveal that the Namgang E unit watershed has a higher model accuracy than the other unit watersheds. Furthermore, compared with Namgang C and D, Namgang E has a high correlation with water quality due to meteorological effects. The results of this study will help establish a water quality forecasting system based on probabilistic weather forecasting in the long term.
1. Introduction
Water supply demands are increasing with environmental changes in river watersheds and developments due to urbanization. As a result, the effective environmental management of watersheds has become a necessity. Lee et al. [1] and Freeman et al. [2] reported that water pollution due to rainfall runoff resulting from land use changes by urbanization is serious and methods to evaluate these environmental effects are required. As a result of these environmental changes, water quality prediction for maintaining and managing rivers is directly related to ecology and the environment, and improvement directions and analysis of long-term water quality such as maintenance of the water supply are imperative.
Rainfall is a basic element required to maintain water resources. Rainfall causes runoff in watersheds, which directly affects the environmental changes in water quality. The runoff that flows into the watershed affects the water quality as well. Furthermore, river surface water is highly sensitive to climate change because it is exposed to sunlight and is directly affected by temperature. Because these water quality factors have nonlinear relationships with meteorological factors such as rainwater and temperature, it is difficult to define the correlations between them. The weather and water quality variations in a watershed have large spatiotemporal variability. In particular, water quality data are generated by very complex physical, chemical, and biological reaction mechanisms of the ecosystem, and have strong nonlinear characteristics. Therefore, various water quality models are being applied for the prediction, analytical study, and management of water quality. Wellen et al. [3] evaluated the latest status of watershed models based on a spatially distributed process and reported that 257 papers on watershed models had been published between 1992 and 2010. Ji [4] explained that great developments have been made in mathematical modeling for numerical simulation of water quality and that modeling is a powerful decision-making tool. However, it takes a considerable amount of time and effort to develop a water quality prediction model that considers the complex environments of watersheds, including artificial factors in natural rivers and the physical characteristics of water quality factors. For this reason, active research on prediction models has been conducted using the data-based ANN model as well as a physics-based model to predict water quality variations.
Wu et al. [5] reported that the applications of ANNs have become popular since the early 1990s in the environment and water resource modeling fields. Kim et al. [6] explains that an ANN is a powerful data-based model that can consider and express the linear and nonlinear relationships between input and output data. Furthermore, an ANN has been widely used for predicting water quality variables and processing the uncertainty of pollutants, and the nonlinearity of water quality data. They developed an ANN ensemble model to predict the water quality at the Sangdong point in the Nakdong River, South Korea. Palani [7] proposed a method of applying an ANN modeling technique for dynamic prediction of seawater quality. Palani [7] explained that the ANN model exhibited enormous potential as a prediction tool for seawater quality variables with low cost and acceptable accuracy by optimizing the water-quality monitoring network. Patki et al. [8] revealed that the ANN model outperforms the multiple regression technique for the prediction of water quality in the distribution system and it is a robust tool for understanding the poorly defined relations between water quality variables and the Water Quality Index (WQI) in a municipal distribution system. Even though many studies have been conducted on the water quality prediction model, no study, to the best of the authors’ knowledge, has considered the meteorological factors that have significant effects on water quality together with water quality factors. Chang et al. [9] proposed a promising approach for reliable modeling of spatial NH3-N concentrations only based on hydrologic data but did not consider water quality variation characteristics through the reaction mechanism in water bodies. Water quality is sensitive to runoff owing to rainfall flowing into the watershed as well as to changes in the water environment. Dunn et al. [10] stated that rainfall runoff affected an increase in the concentration of heavy metals in water bodies and can occur in both pervious and impervious surfaces in urban areas. Jeong et al. [11] analyzed the correlations between phytoplankton biomass (chlorophyll a concentration) and rainfall and explained that dam operation management must be performed effectively according to the rainfall received for water quality management. Meteorological factors as well as water quality factors should be considered when developing a water quality prediction model.
In this study, we developed an ANN-based water quality prediction model that considers meteorological factors that affect water quality as well as various water quality factors. Kim et al. [12] analyzed water quality variation characteristics using exploratory factor analysis (EFA) and proposed a systematic evaluation method. The present study also developed a prediction model for water quality factors with high prediction accuracy using EFA and by considering the water quality variation characteristics. The developed model was verified by comparing its predictions with actual measurements. In addition, the applicability of the ANN-based water quality prediction model was evaluated using the probability forecasts of temperature and precipitation from 2014 provided by the Korea Meteorological Administration as input data. This study attempted to provide the foundation for a river water quality forecast system that considers the meteorological factors of water quality according to weather forecasts.
2. Materials and Methods
2.1. Study Area and Data Description
The Nam River is the first tributary of the Nakdong River in South Korea. The Nam River watershed consists of five unit watersheds, whose water quality is managed through the total maximum daily load (TMDL). The upstream unit watersheds from the Namgang Dam are Namgang A, Namgang B, and Namgang C. It is characterized by a high proportion of mountainous areas and a steep river slope. The downstream unit watersheds from the Namgang Dam are Namgang D and Namgang E. Non-point pollution sources in the surrounding small and medium-sized cities and industrial areas are scattered, and the slope of the riverbed is very gradual as it goes downstream. As shown in Figure 1, there is an 8-day interval water quality monitoring station at the end of each unit watershed, and there are two meteorological stations in the Namgang Watershed: The Sancheong meteorological station and the Jinju meteorological station. Table 1 and Table 2 list the data collection variables at each monitoring point and the collection period.
2.2. Methodology
2.2.1. Probability Forecast System
The Korean Meteorological Administration provides two weather forecasts: Probability long-term forecasts and quantitative weather forecasts. Long-term forecasts refer to forecasts obtained over a period of 11 days or more and include weekly and monthly barometer trends and prospects, and temperature and precipitation forecasts. The forecast area comprises 12 regions of the Korean Peninsula. In this study, we used the probability forecasts of the Busan, Ulsan, and Gyeongsangnam-do regions as the input variables of the ANN model. For the probability forecast, the simulation results of a climate model for various conditions were statistically analyzed, and the precipitations during the forecast period were classified into low, similar, and large relative to the average year and are provided as probabilities. Probability forecasts provide forecast information that contains uncertainty about the future as quantitative probability values. They have the advantage of allowing for various decisions regarding the establishment of response policies for abnormal weather and long-term plans for water resources. With the rising frequency and intensity of extreme events (flood and drought) that we have not experienced before due to climate change, higher accuracy and practicality of long-term forecasts are required. In this situation, probability forecasts, unlike the conclusive forecasts of the past, will allow for more flexible responses.
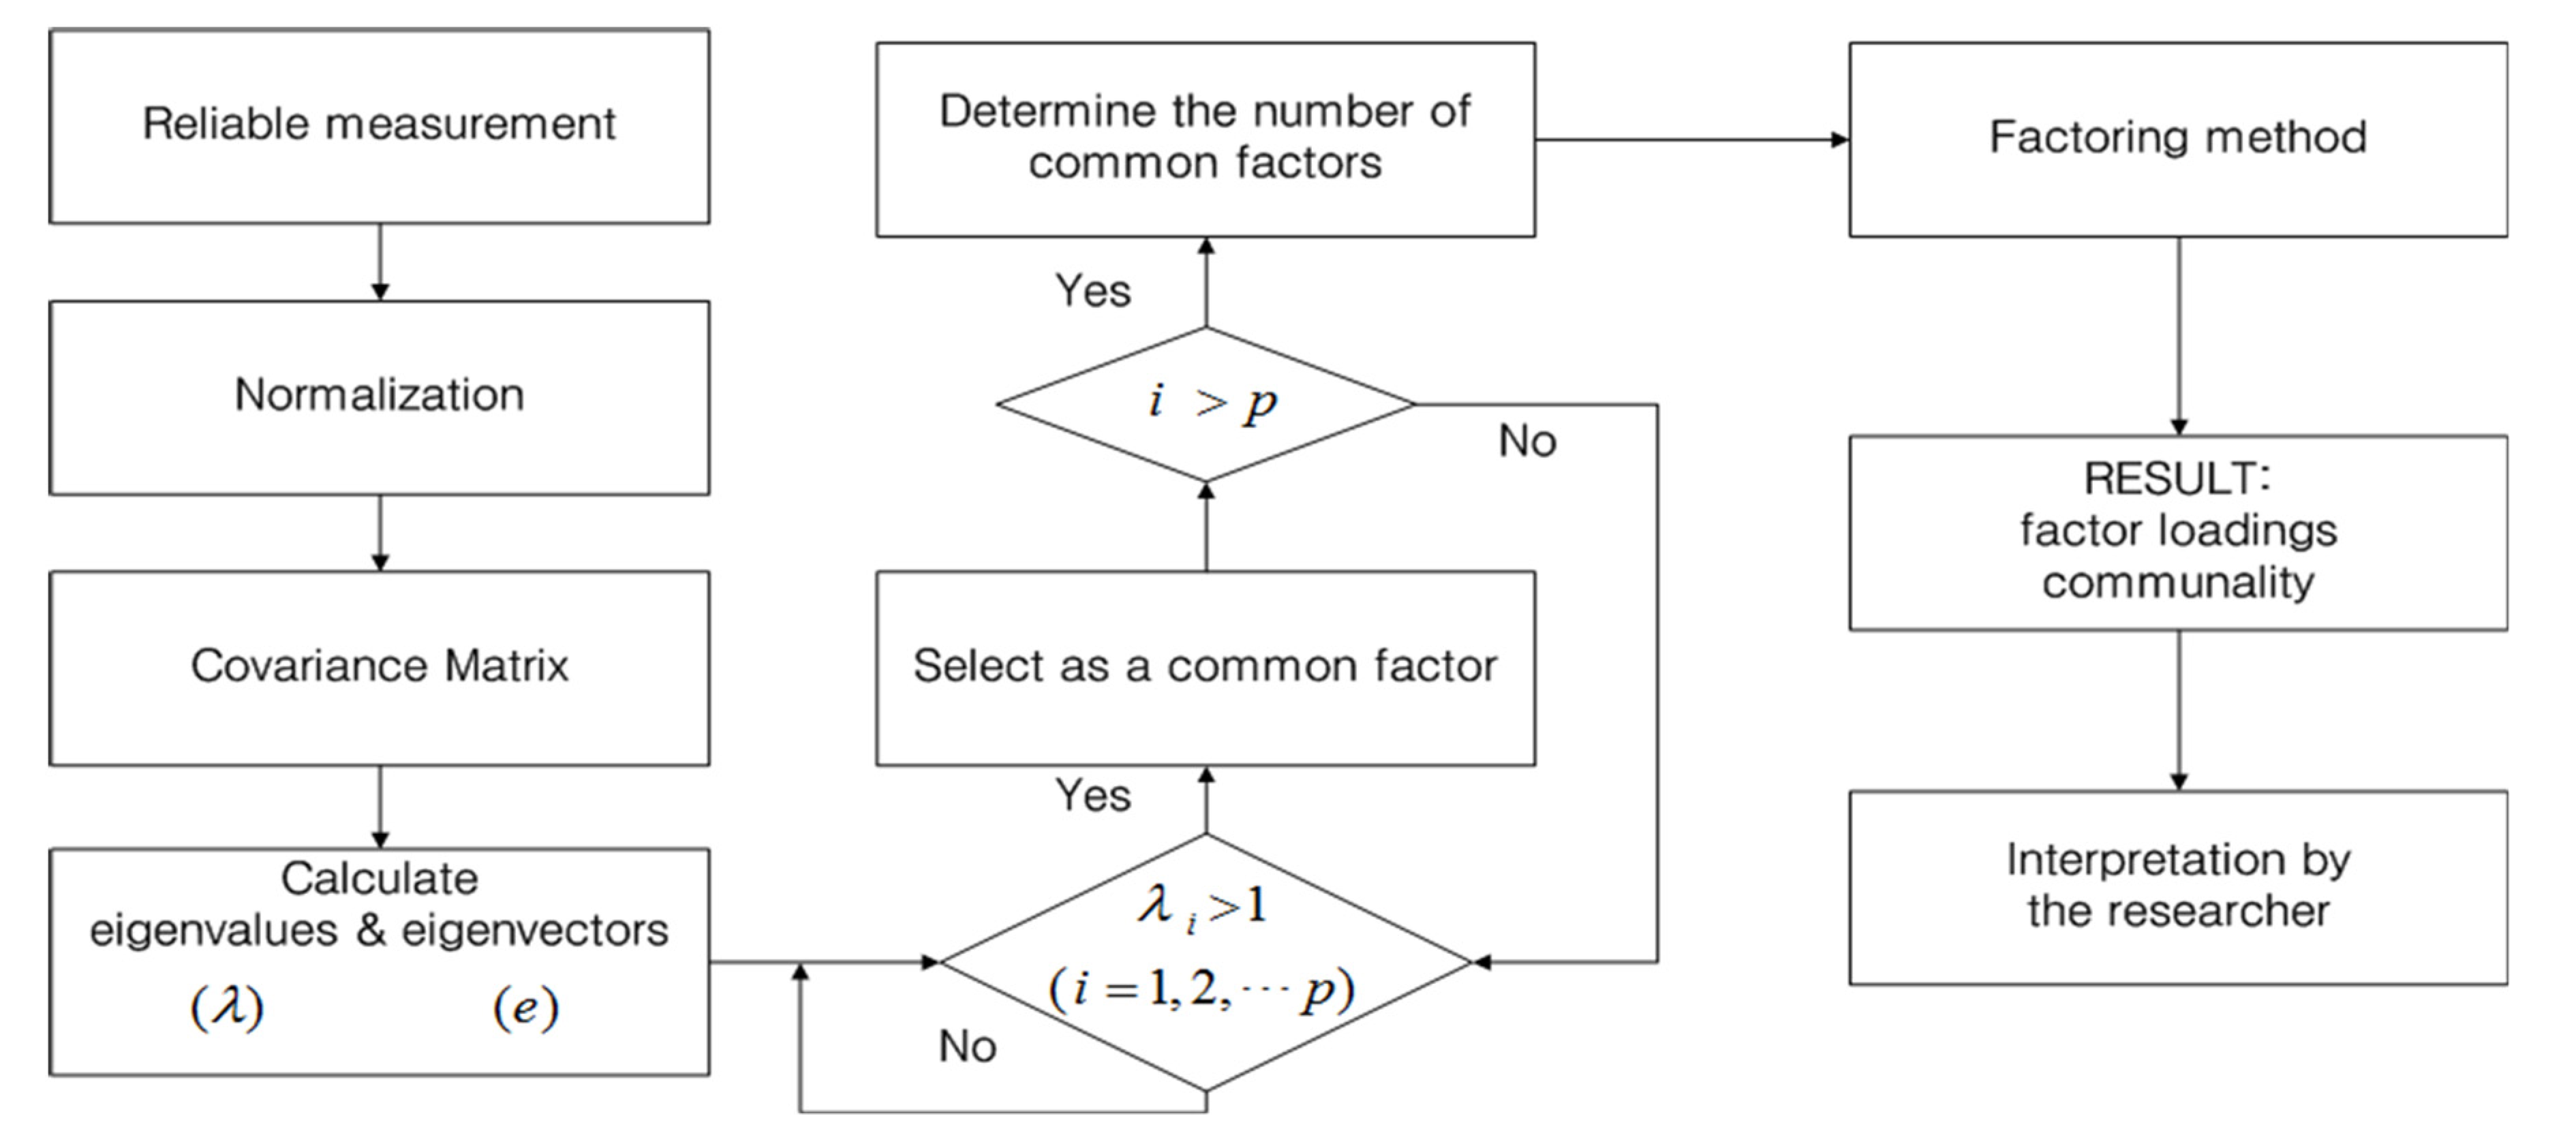
2.2.2. Exploratory Factor Analysis (EFA)
EFA is an analysis technique for analyzing the correlations among variables that uses the covariance and correlations among many variables, identifying the correlation and structure between items and variables based on the analysis results, and grouping the information of many variables into a small number of factors. EFA condenses the information about many variables into a few key intrinsic factors, making the information easier to understand and easier to use in additional analyses. However, EFA can become difficult if the determined factors have randomness. Hence, attention should be paid to the validity and reliability tests of the condensed analysis results. Figure 2 shows a flowchart of EFA, which is a process of deciding the number of factors and the common factors through the eigenvalues and eigenvectors derived from the factor matrix. Based on the result of EFA, the input variables that have a significant effect on the variability of the prediction factors in the ANN model were distinguished. The variables classified as the same factor exhibited the same variation trend. The eigenvalue is the total variance of variables that can be described by each factor and is calculated by summing the squares of the factor loading of every variable for each factor. In other words, it is a ratio that indicates how much the information contained in a variable can be expressed by a factor. The eigenvalue of a previously extracted factor is always larger than the eigenvalue of the factor that is extracted next. In this study, the input data of the model were constructed using factors whose eigenvalues were larger than 1. The cumulative value is the cumulative number of variances accounted for by the classified factors and indicates the explanatory power of the factor. When each factor is added one by one, when the cumulative variance ratio reaches a sufficiently high value, the addition of factors is terminated. That is, if there are N index variables, the last cumulative variance ratio calculated as the Nth is 1.0.
Water quality is affected by the characteristics of the watershed; therefore, the characteristics of the unit watershed that affect water quality need to be examined. Customized water quality prediction for watershed management is therefore required after determining which factors cause variations in water quality characteristics. Therefore, this study aimed to analyze the water quality characteristics of each unit watershed through EFA and build input data to improve the prediction accuracy of the water quality prediction model. EFA was performed using the water quality variables, flow variables, and meteorological variables for each location using the five water quality stations located in the Namgang unit watershed.
2.2.3. Artificial Neural Network (ANN)
An ANN is a parallel information processing system developed to generalize the perception process of neurons, the basic units of the human brain, into a mathematical model as a statistical refinement technique. ANNs can be largely categorized by the hierarchical structure of the neural network into single layer neural networks, which only have input and output layers, and multilayer neural networks, which have an input layer, one or more intermediate layers (hidden layers), and an output layer. The multi-layer neural networks that have one or more hidden layers are used often. Figure 3 shows the general structure of the multilayer neural network. The neurons are interconnected and play the role of synapses in the biological neurons, which are called connection strength or weight vectors in the ANN. In an ANN model, the numbers of input and hidden neurons, and the number of cases to be learned have a critical effect on learning performance. In this study, the backpropagation algorithm, which calculates weights using the differences between output and target values, was used as the ANN learning method. The backpropagation algorithm determines the size of the weight by finding the minimum of the error function through a gradient descent using a differentiable activation function [13].
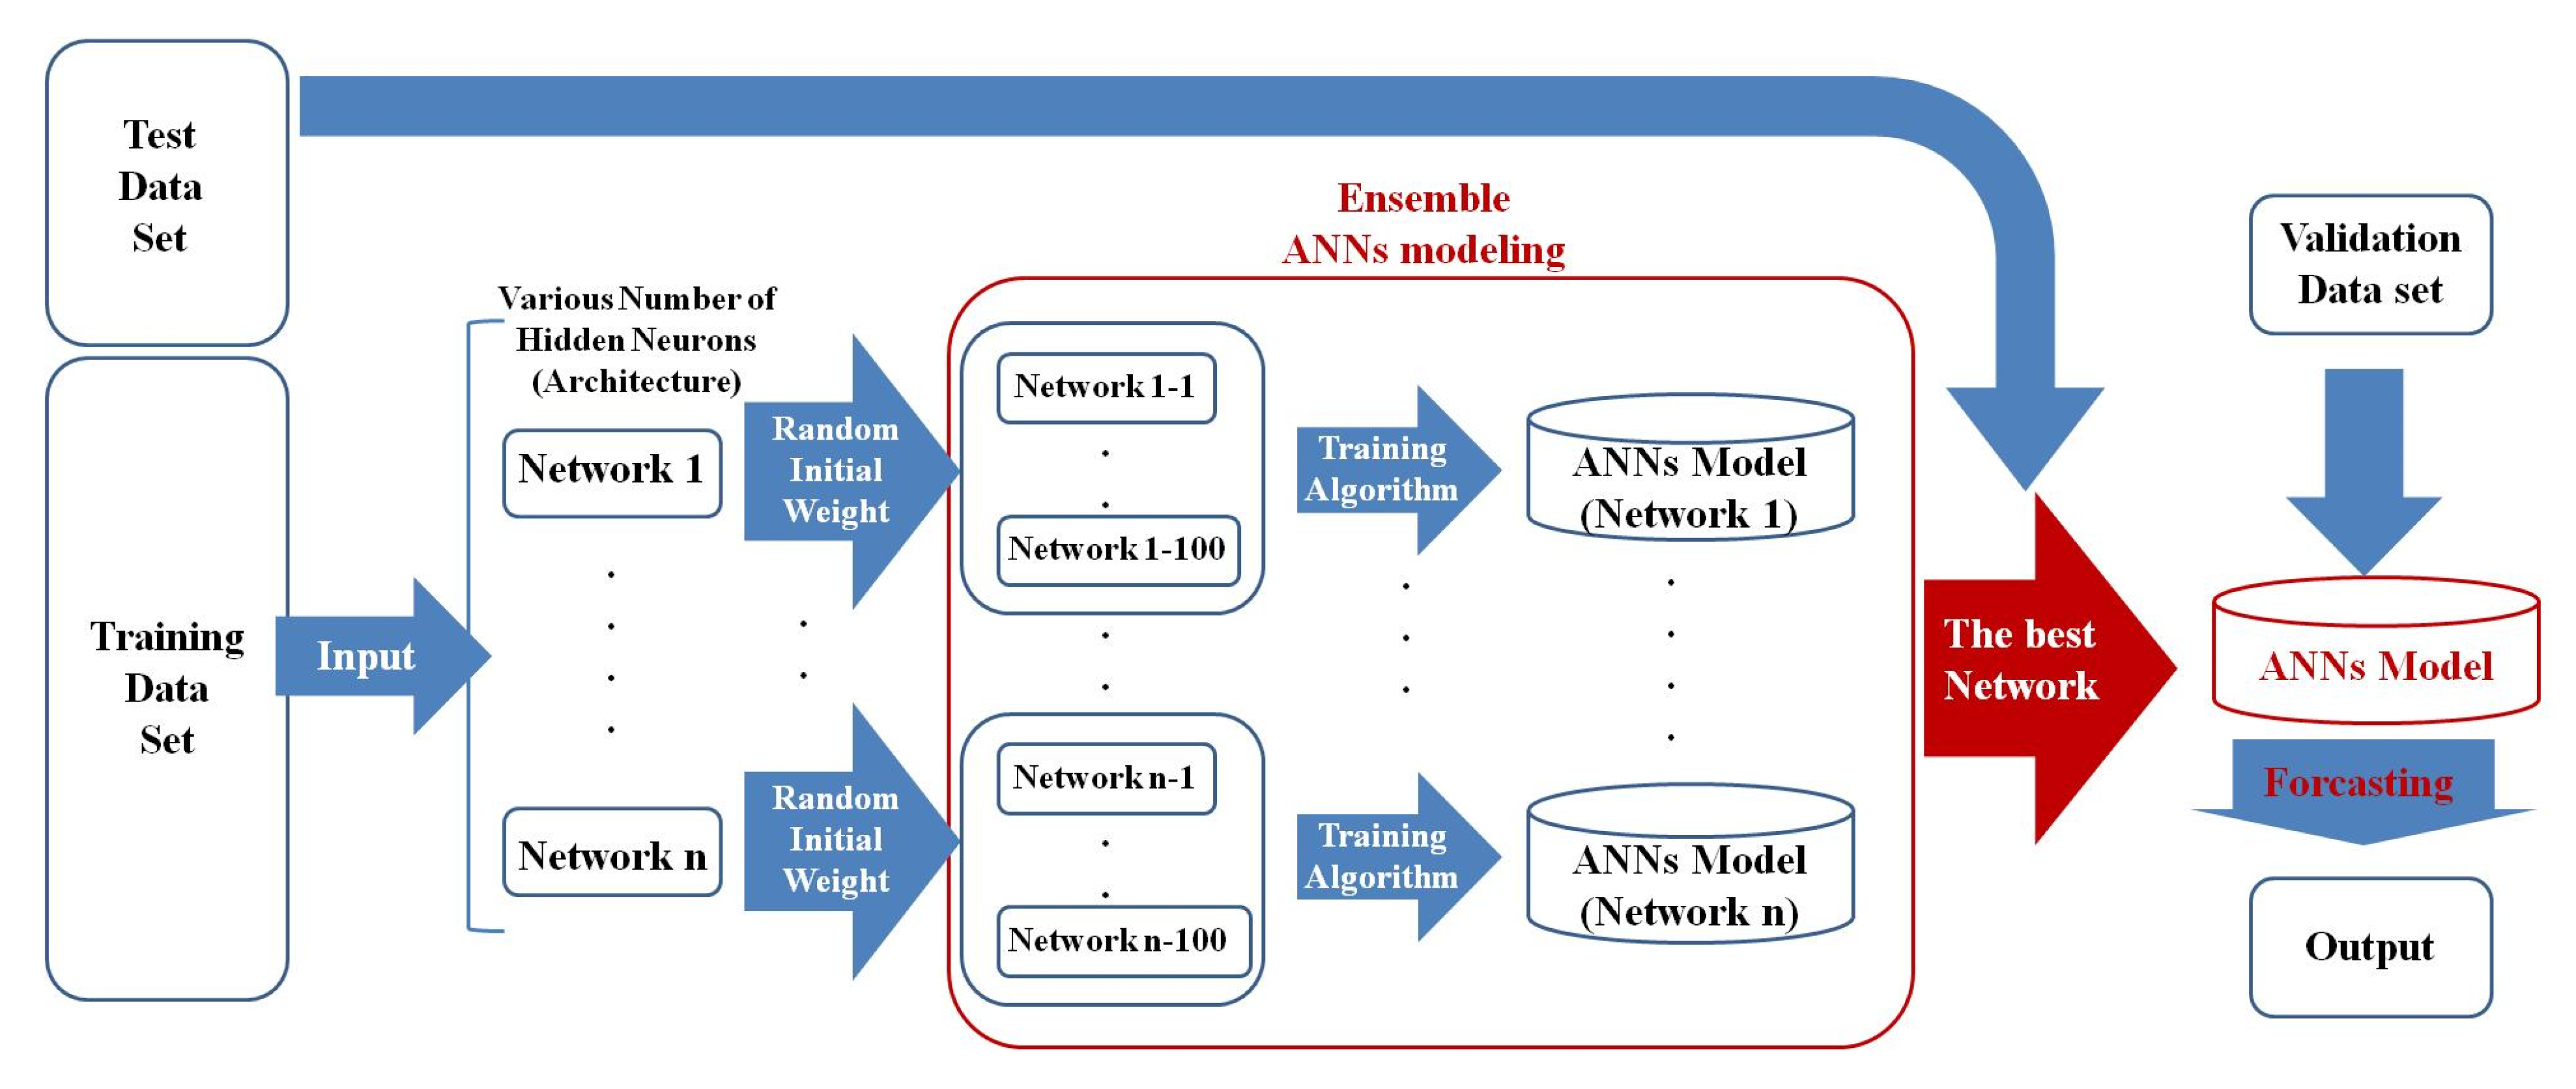
In this study, the water quality factors selected through EFA, a multivariate statistical method, and the precipitation and average temperature of meteorological observation were used as input data. The model performance, excluding the effect of initial weights, was evaluated using the ensemble modeling technique, which statistically evaluates the results of multiple ANN models with different initial weights. Figure 4 shows the structure of an ANN model that uses the ensemble modeling technique. To evaluate the results of the ANN model, considering the variability of the ANN results according to the initial weights, an optimal model was derived through ensemble modeling for the initial weights.
2.2.4. Model Evaluation
Table 3 shows the model evaluation method used in this study. The coefficient of determination (R2), which is widely used in various fields, including water quality modeling, is a quantitative measure of the linear relationship between measurements and simulation values. The range of the coefficient value is between 0 and 1; the more linear the relationship, the closer the coefficient is to 1. The NSE is a statistical measure that is most widely used in the water quality modeling field. It is recommended by the ASCE [14], Legates and McCabe [15], and Moriasi et al. [16]. It is still being used by researchers who perform water quality modeling. A value closer to 1.0 means that the simulation values reflect the tendency of the measurements more accurately. The root mean square error (RMSE) is a statistical measure that includes a unit for simulation items and can quantitatively indicate errors. However, it is difficult for non-experts to evaluate it because it only represents the absolute degree of error. Care should be taken as the equation takes a square form and is greatly affected by high values or outliers.
3. Results
3.1. Exploratory Factor Analysis (EFA) Results
The EFA results are outlined in Table 4. Based on the EFA results, for Namgang A, which is located upstream from the Namgang Dam, water temperature (W.T), air temperature (T), T-N, and DO were classified as Factor 1 (F1), and discharge (Q) and SS as Factor 2 (F2). Thus, SS was found to be significantly affected by discharge. For Namgang B, W.T, T, T-N, and DO were also classified as F1, and COD, BOD, TOC, SS, and T-P as F2. In the case of Namgang D, which is located downstream of the Namgang Dam, BOD, COD, TOC, and T-P were classified as the same factor. The EFA results revealed that W.T, T, and DO had negative correlations at most locations, thus indicating that the W.T reflects the characteristics of the decreasing dissolution rate of gas (oxygen) well. For Namgang D and E, which are immediately downstream of the Namgang Dam, water quality variables such as COD and nutrients were classified as the same factor. For Namgang E, BOD and Chl-a were classified as the same factor. As it joins with the Nakdong River, the main stream, a hydraulically stagnant flow occurs at the measurement point. Therefore, it can be considered that the effect of native BOD due to an increase in Chl-a in the stagnant river appeared as the same factor.
Most of the meteorological variables were not classified with water quality variables. The duration of sunshine (Sun) and solar radiation quantity (Rad) exhibited negative correlations with relative humidity (R.H.). This suggests that large variability did not appear because meteorological variables do not directly influence water quality variables, but indirect factors related to W.T or saturation do. The variables grouped together in the same factor are changed simultaneously by a certain factor. Even though variables that belong to different factors also vibrate together, the values are small. Thus, only variables with large variability were classified as the same factor.
In this study, the water quality variation characteristics of each watershed were examined through EFA, and the classified factors were used as the input variables for learning the ANN-based water quality prediction model for each water quality variable of the unit watershed. Furthermore, even though the correlation between meteorological factors and water quality factors could not be revealed statistically through EFA, we tried to implement the nonlinear correlations between meteorological factors and water quality factors through ANN model learning. Because the weather already includes the characteristics that determine water quality, the water quality prediction direction was set through the weather forecasts of the future.
3.2. ANN Model Leaning
3.2.1. ANN Learning System
ANN model learning for water quality prediction of each unit watershed was performed using the meteorological observation data, which is the input variable used to reflect actual meteorological phenomena. To apply the spatial refinement of meteorological factors for each unit watershed, the data of the Sancheong meteorological station were used for Namgang A and B, and the data of the Jinju meteorological station for Namgang C, D, and E. The six water quality variables of the model were DO, BOD, COD, TOC, T-P, and SS. A total of 30 data were collected from five unit watersheds to build the ANN-based water quality prediction model.
The factors that have dominant influence on the variability of the prediction factors were selected as input variables of the model by using EFA. For the ANN model, the ensemble modeling technique was applied, which statistically evaluates the results of multiple ANN models with different initial weights to evaluate the model’s performance, excluding the effects of initial weights. Figure 5 shows the input variables used to construct the ANN model and the total flowchart.
The input variables for ANN model learning of each unit watershed were selected using the EFA results.
The water quality variables grouped as the same common factor were selected for input variables. The past measurements (t-1 and t-2) were not considered for water quality variables grouped as the same factor. This is because the effects of the present (t) water quality must be considered instead of the past (t-1 and t-2) water quality considering the temporal relationship characteristics of the water quality variables to be predicted (t+1). Table 5 lists the input variables for ANN model learning for each unit watershed.
3.2.2. ANN Learning Results
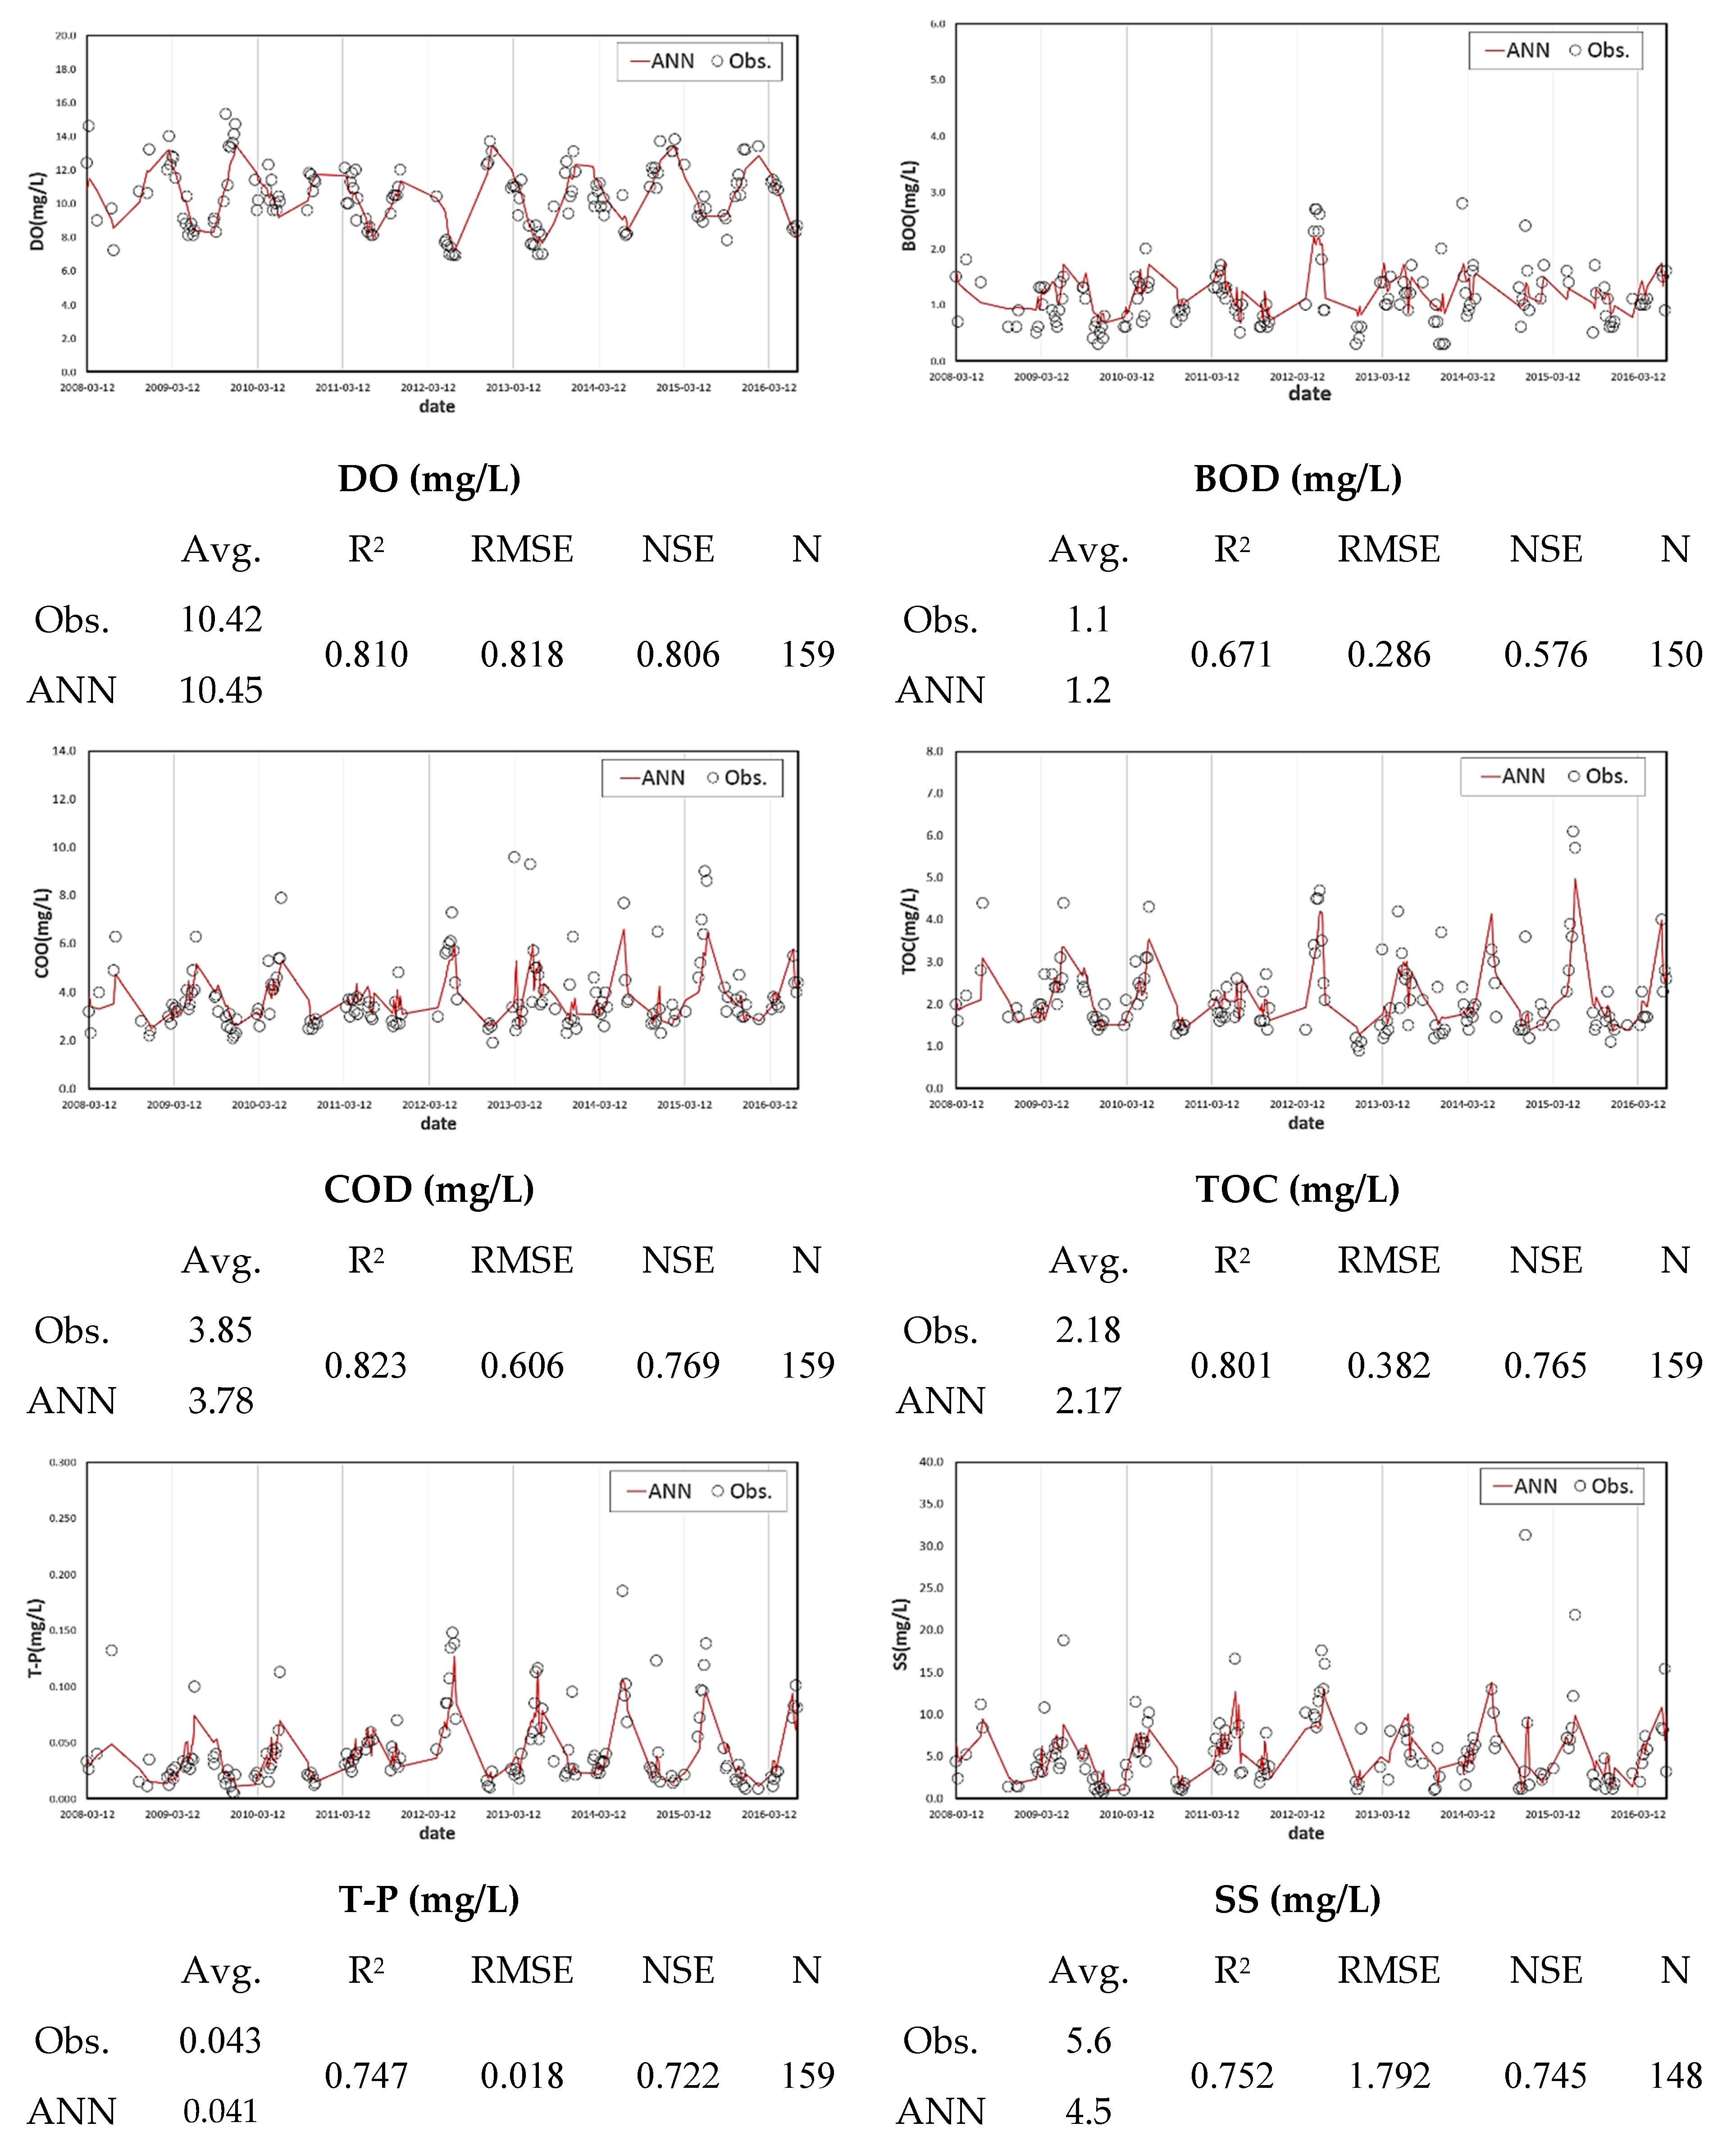
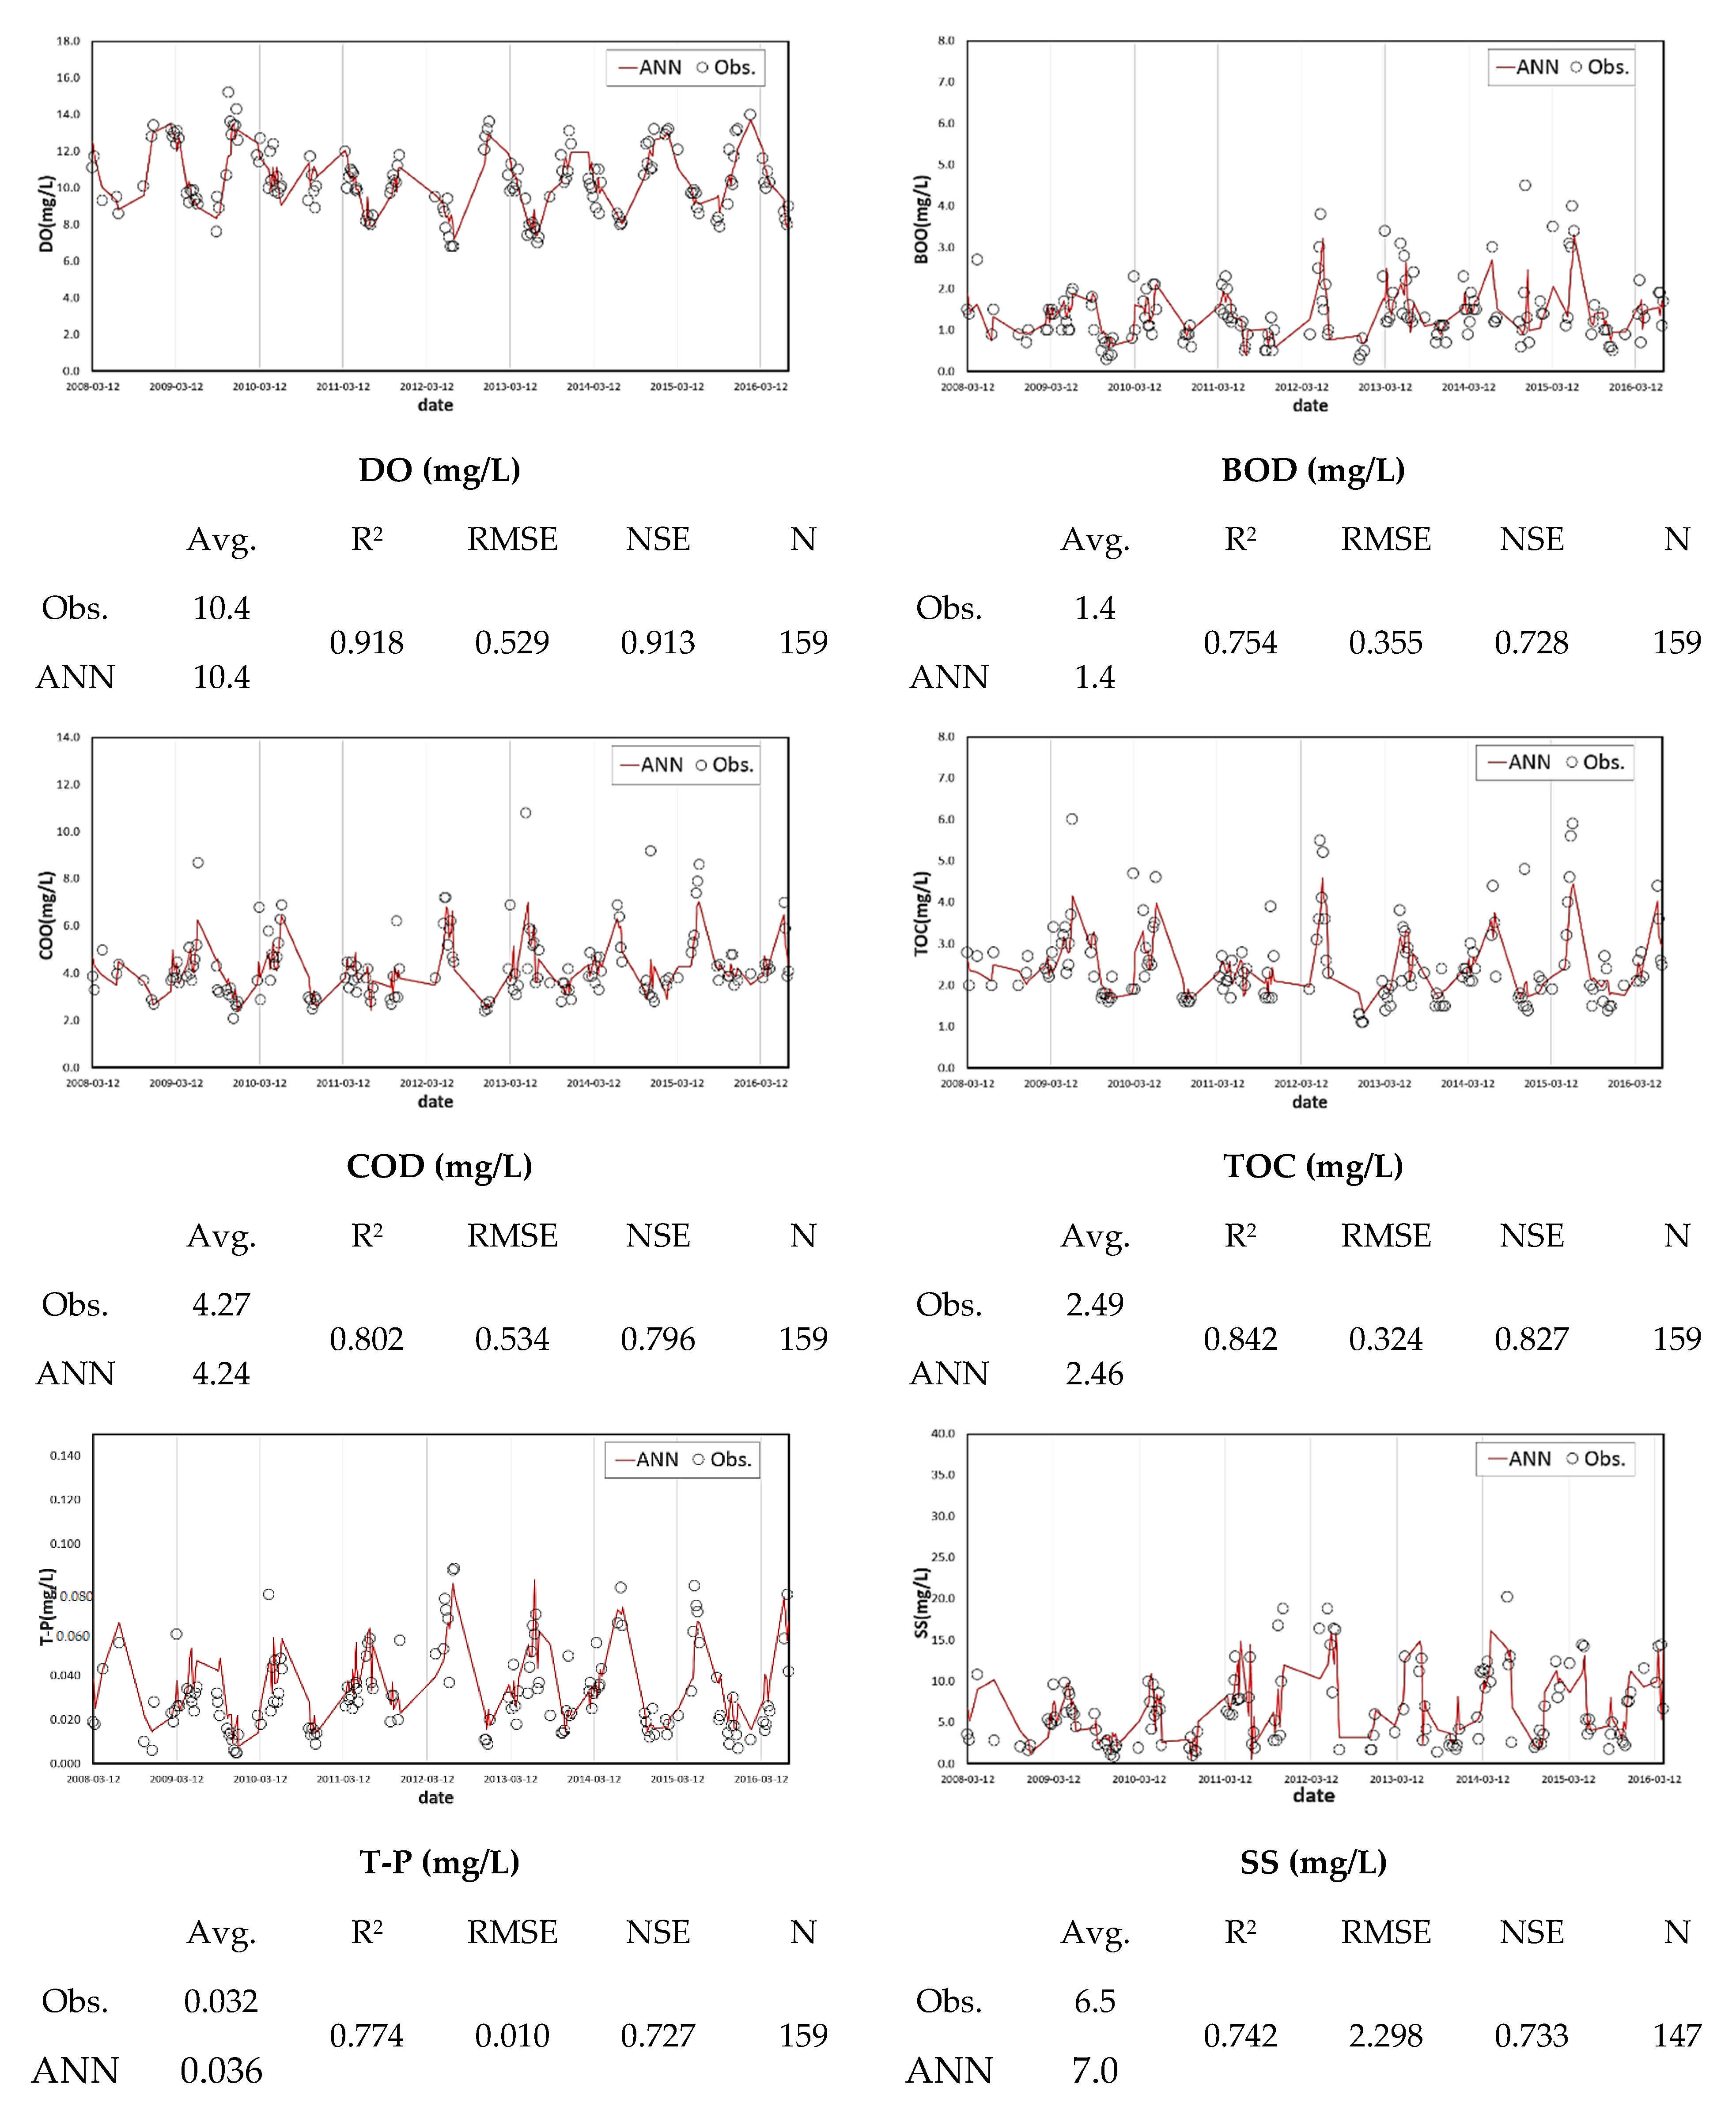
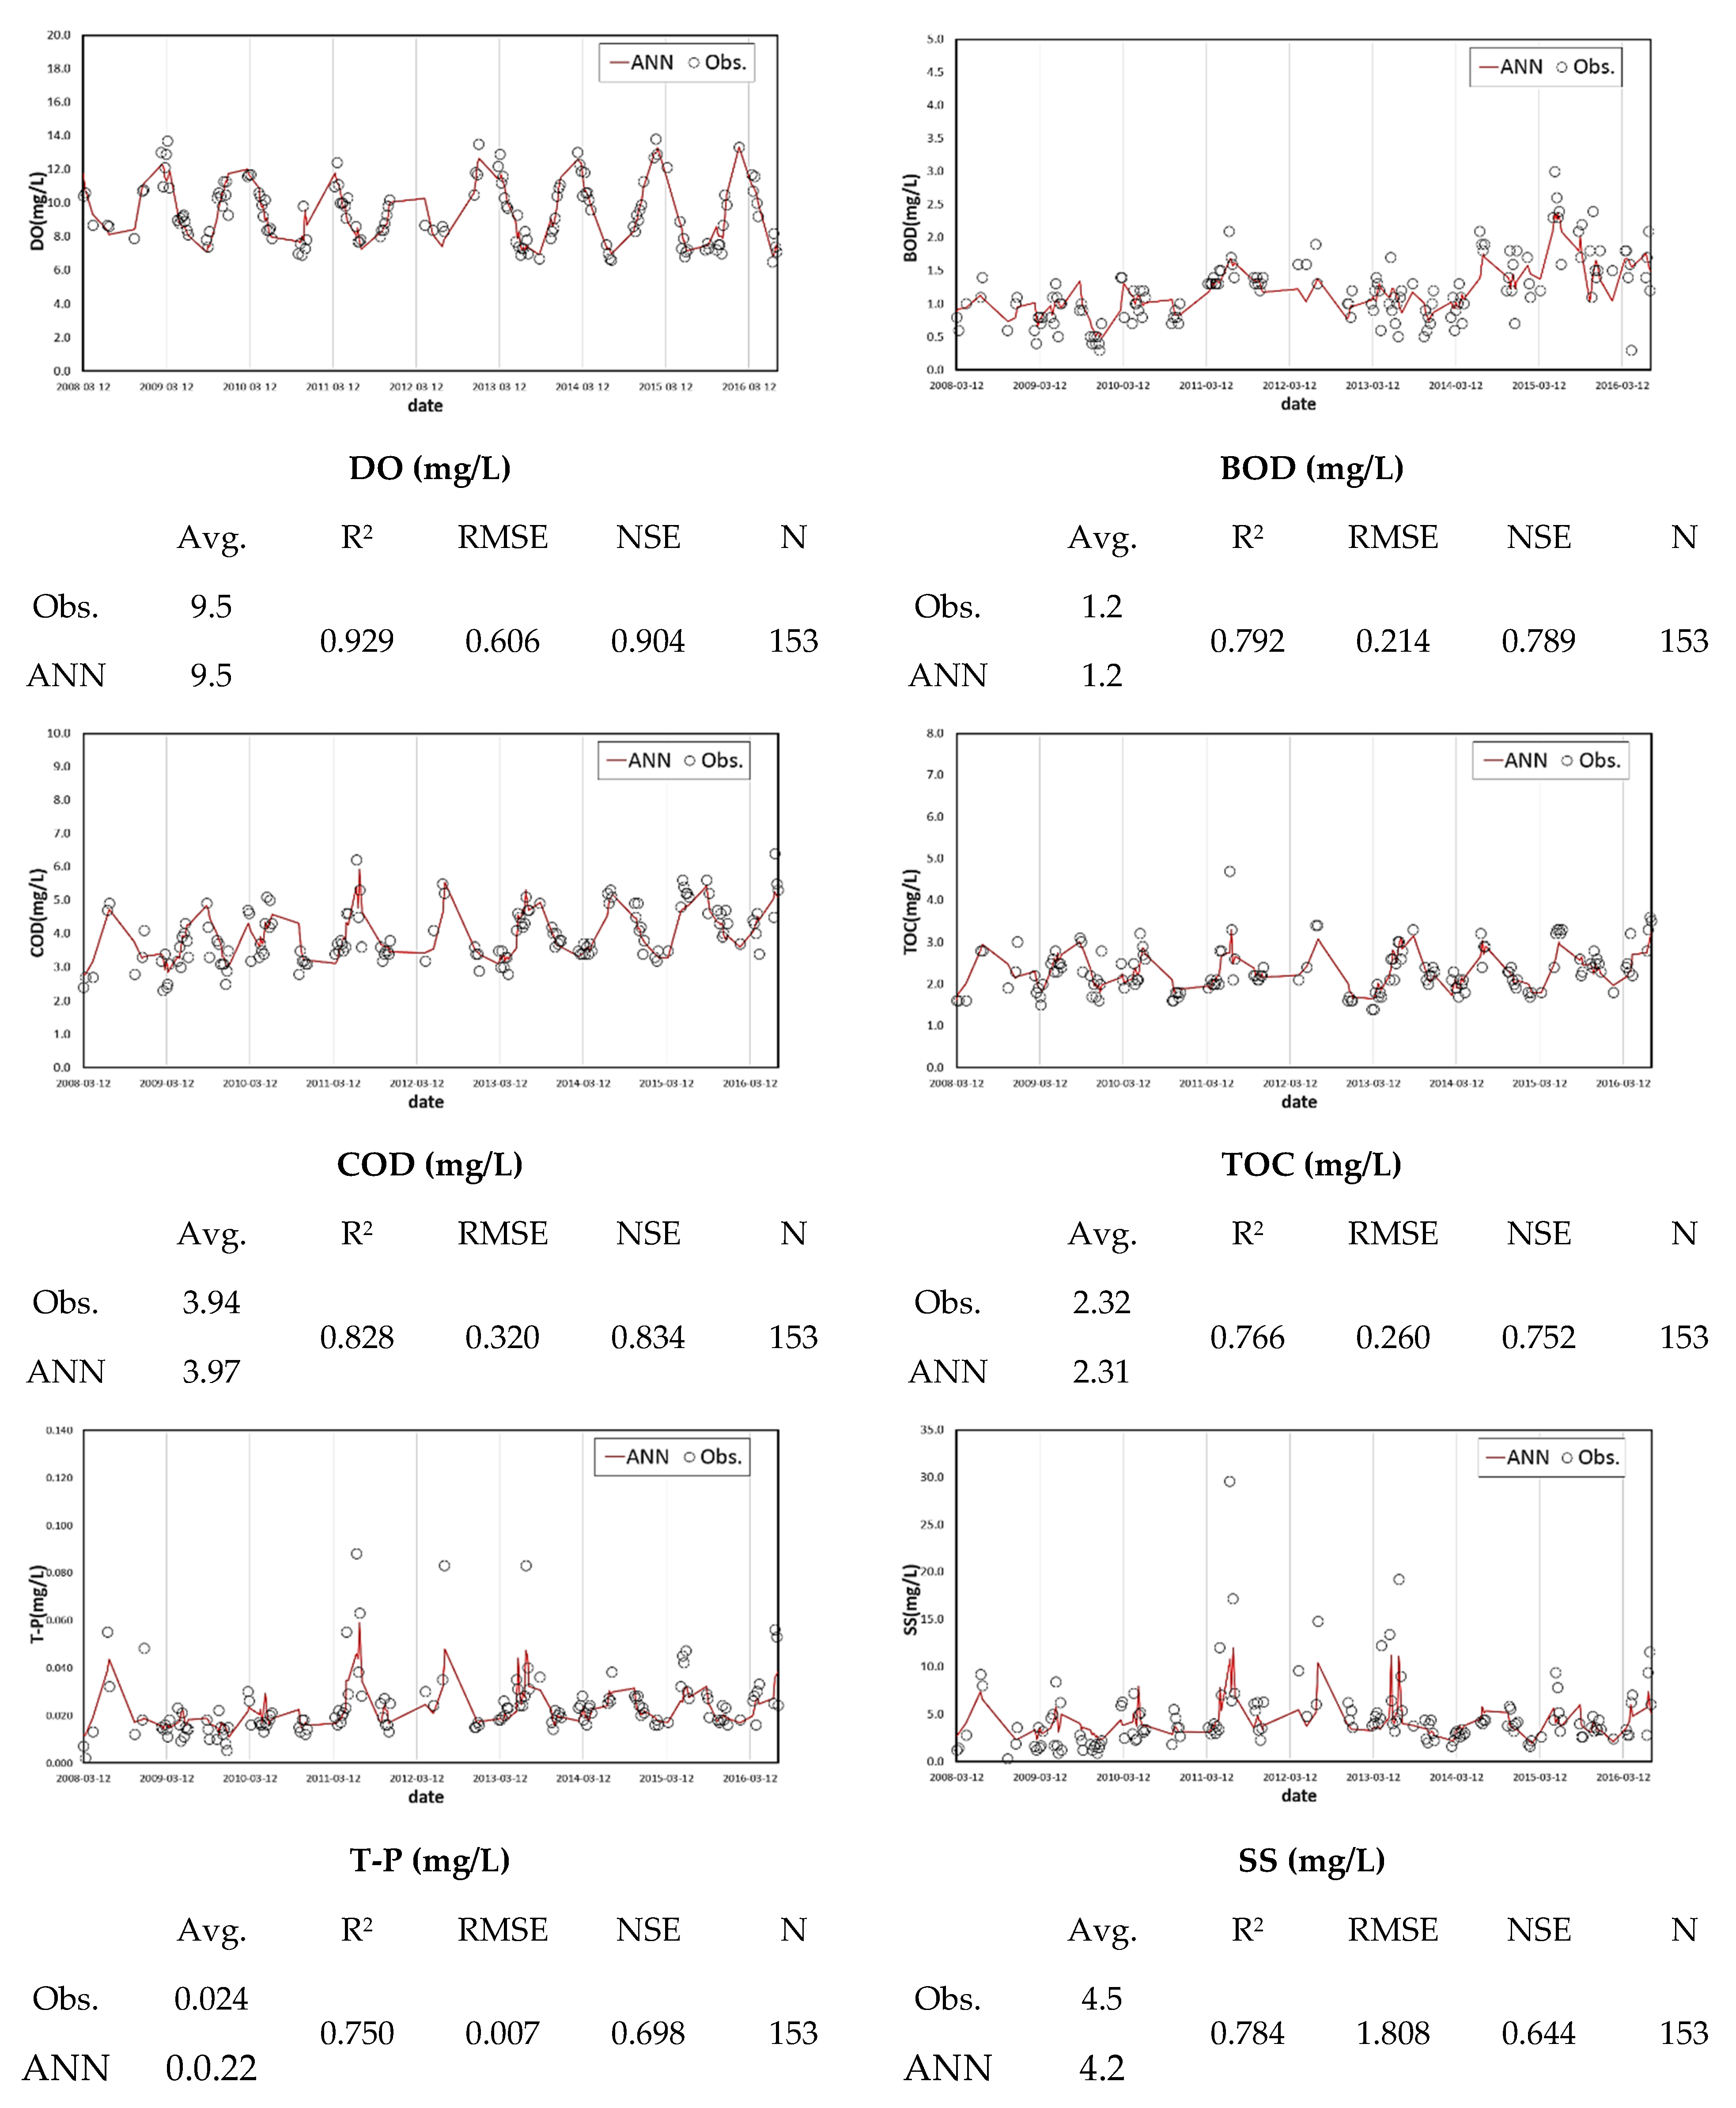
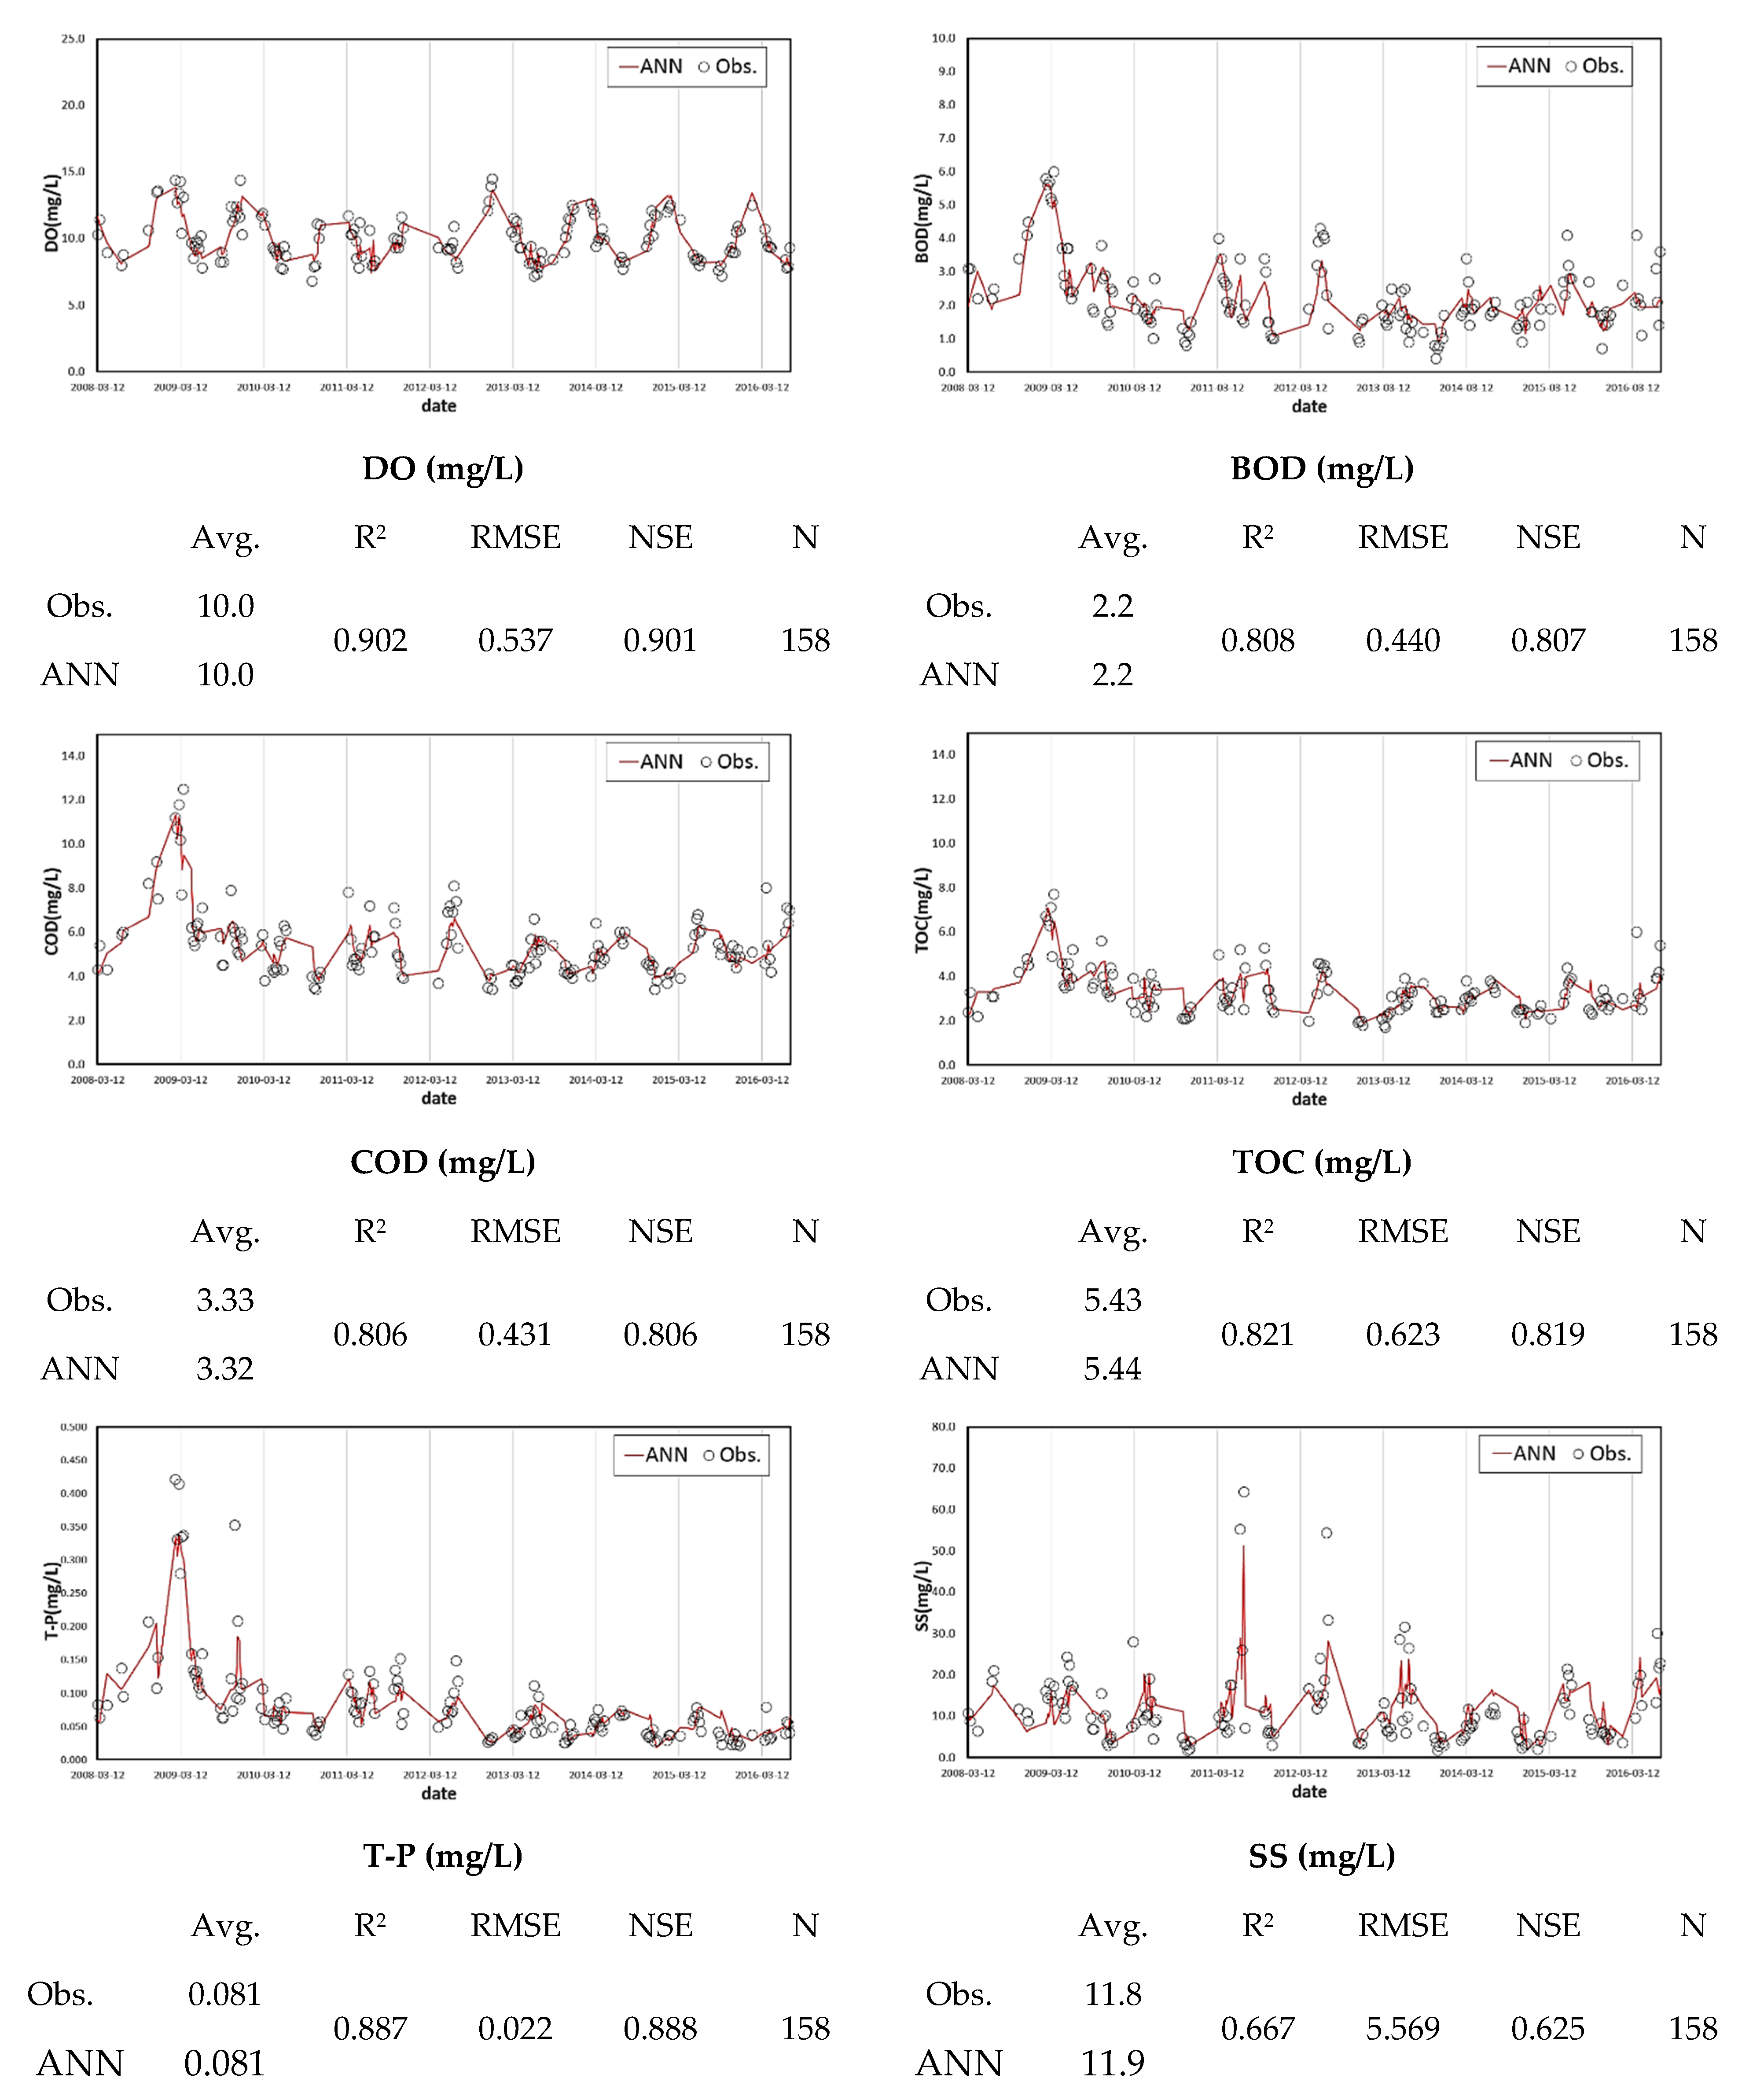
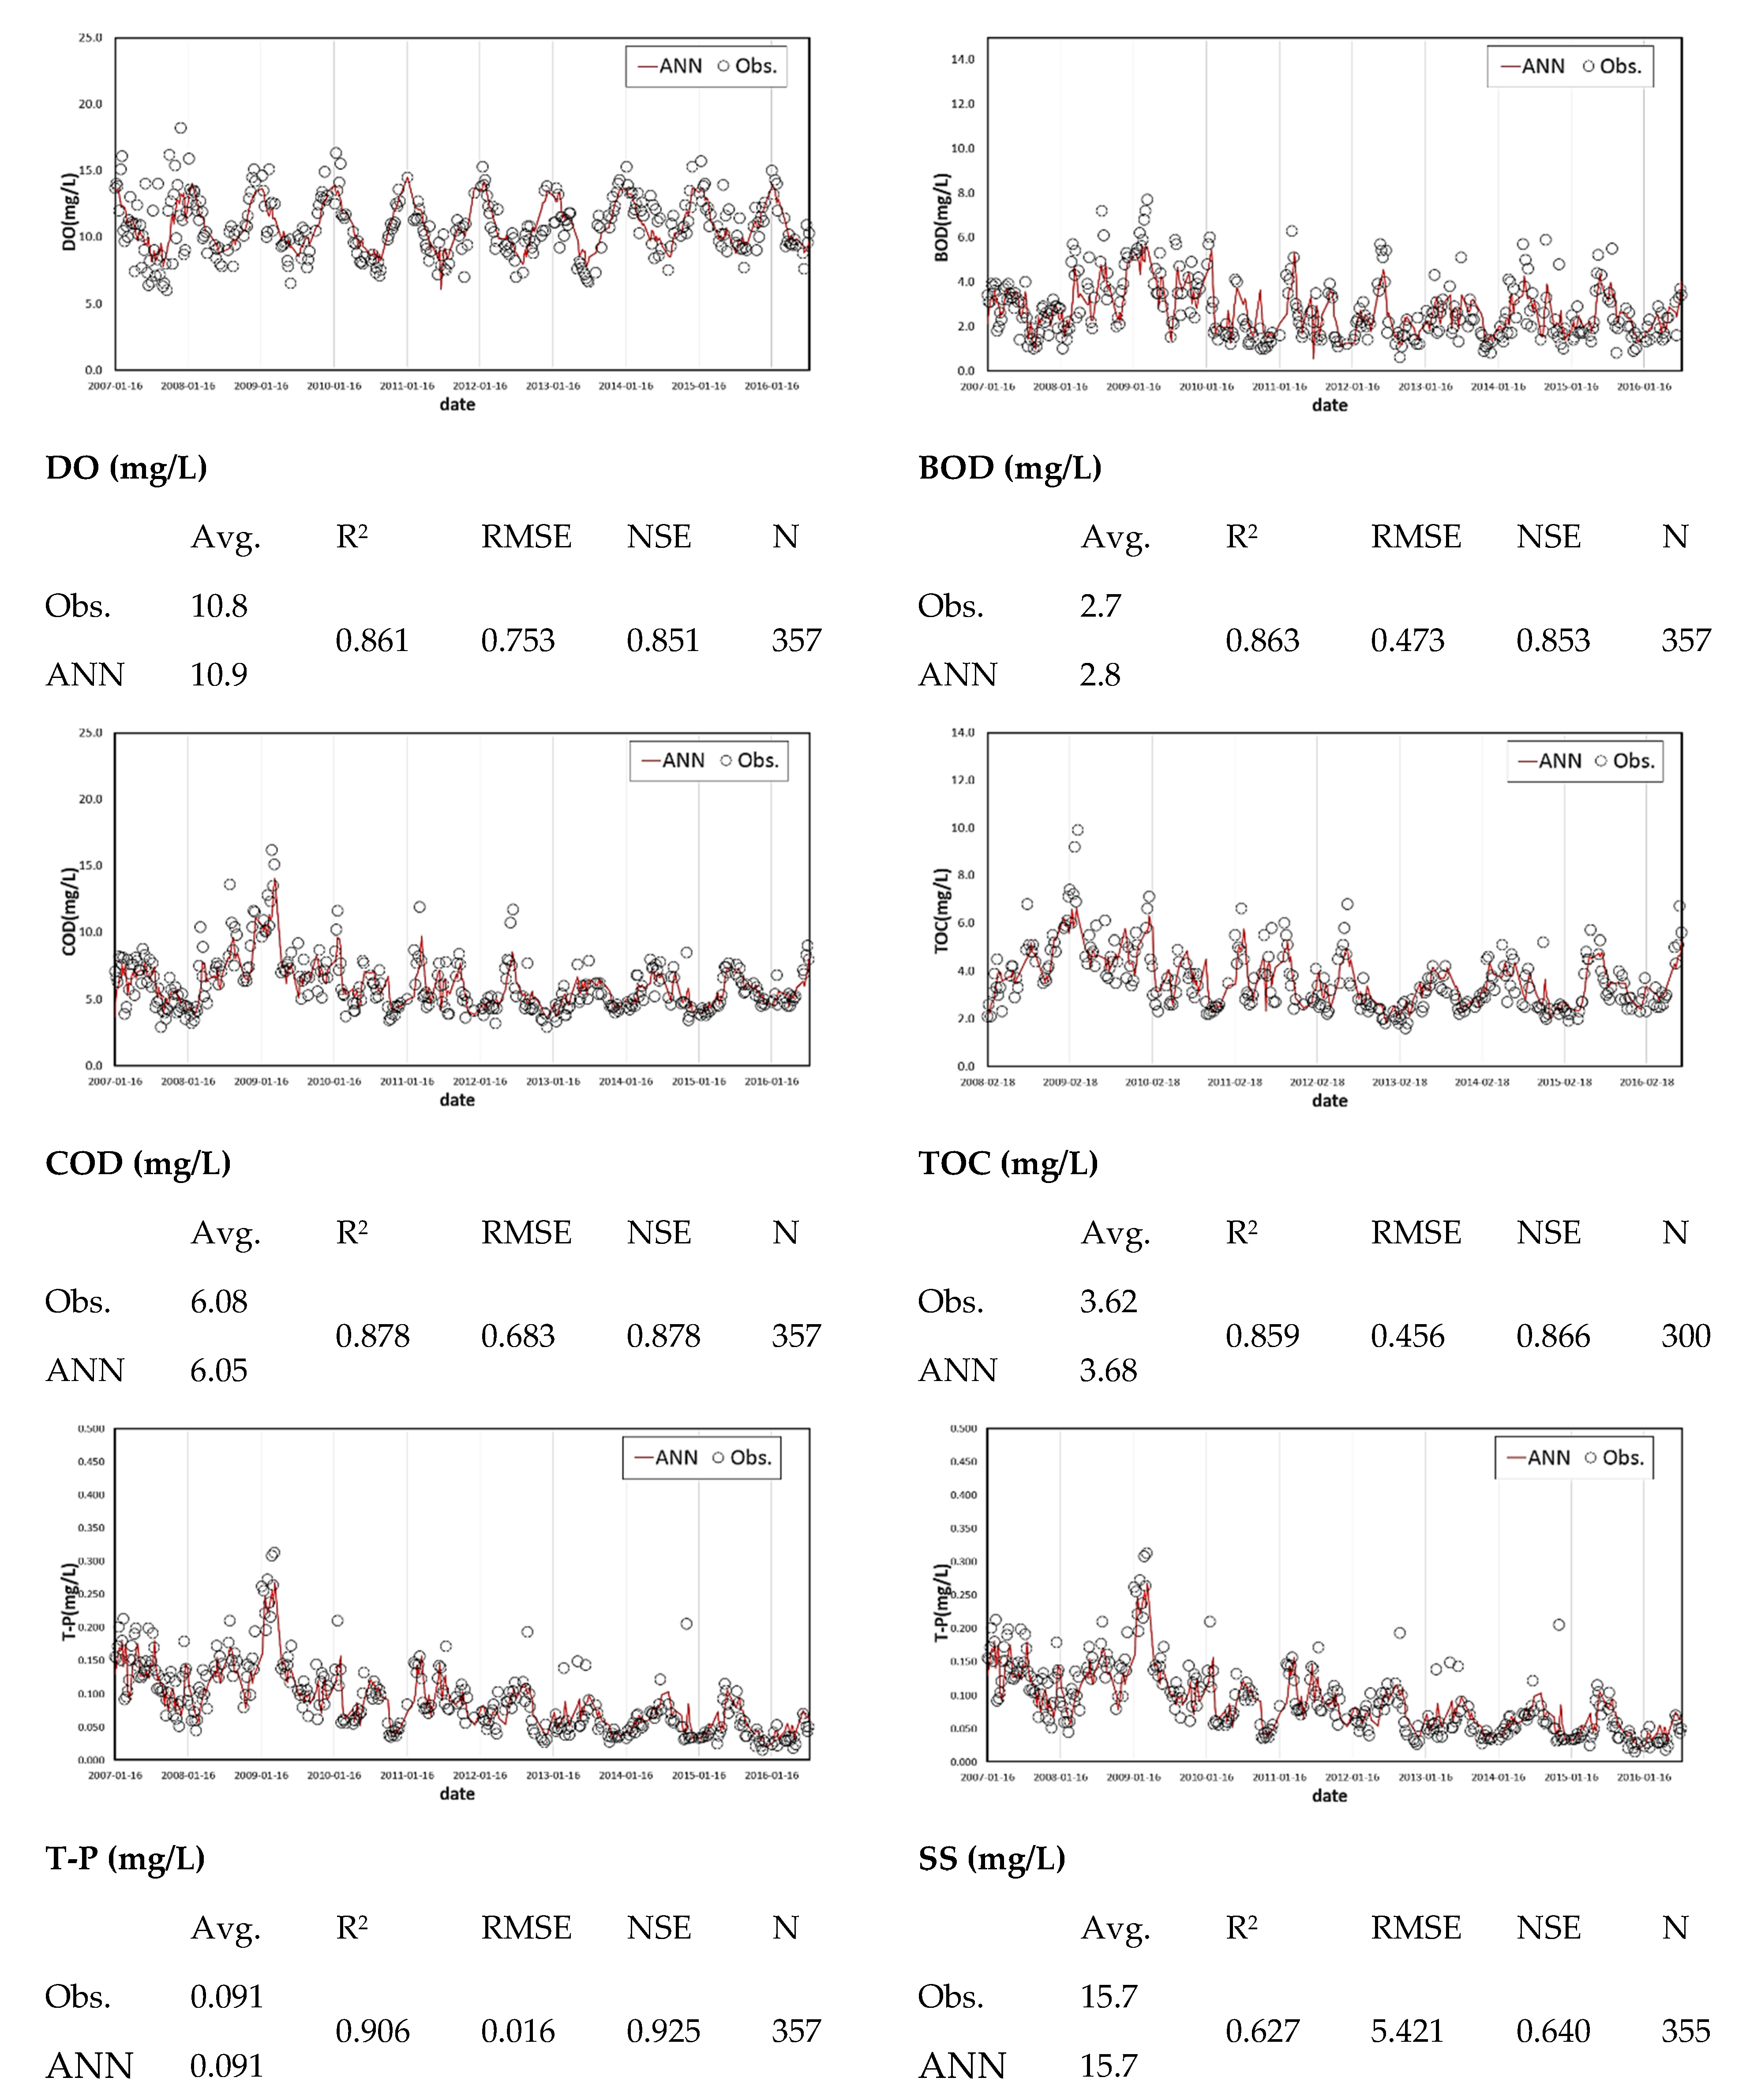
Figure 6, Figure 7, Figure 8, Figure 9 and Figure 10 show the learning results of the water quality prediction model for each unit watershed. Table 6 shows the coefficients of determination and the model evaluation method.
Based on the ANN learning results, R2 was 0.810–0.929 for DO, 0.671–0.863 for BOD5, 0.802–0.878 for COD, 0.766–0.842 for TOC, 0.747–0.906 for T-P, and 0.627–0.784 for SS. The NSE was 0.806–0.913 for DO, 0.576–0.853 for BOD5, 0.769–0.878 for COD, 0.766–0.859 for TOC, 0.698–0.925 for T-P, and 0.315–0.673 for SS. The RMSE was 0.529–0.818 for DO, 0.214–0.473 for BOD5, 0.320–0.683 for COD, 0.260–0.673 for TOC, 0.007–0.022 for T-P, and 1.792–5.569 for SS. R2 was found to be above 0.8 on average in six water quality variables at five unit watersheds. It showed a high model explanatory coefficient. The model evaluation results of water quality variables were generally good, except for the SS. Because the SS exhibits large variations in measurement values and the variation characteristics for precipitation events are dominant, the ANN model could be improved by reflecting the hydrological elements as much as possible. Furthermore, the model learning results of the Namgang E unit watershed were generally excellent.
3.3. Evaluation of the ANN Model That Utilizes Probability Forecasts
The model was evaluated by comparing the water quality prediction results obtained using the weather forecasts of the learned model as input data of the model with the actual measurement values. For the weather probability forecasting, the forecasts from July 2014 to June 2016 were used as input data.
Table 6 shows the evaluation results of the five unit watersheds. R2 was 0.673–0.866 for DO, 0.315–0.673 for BOD5, 0.570–0.926 for COD, 0.512–0.809 for TOC, 0.391–0.785 for T-P, and 0.471–0.602 for SS. The NSE was 0.658–0.865 for DO, 0.401–0.658 for BOD5, 0.496–0.864 for COD, 0.507–0.749 for TOC, 0.341–0.705 for T-P, and 0.338–0.587 for SS. The RMSE was 0.675–1.012 for DO, 0.310–0.578 for BOD5, 0.381–0.903 for COD, 0.283–0.718 for TOC, 0.009–0.032 for T-P, and 3.214–6.187 for SS.
In general, the Namgang E unit watershed showed higher model accuracy than the other unit watersheds. This is because the Namgang E unit watershed has many samples with cumulative water quality measurement points. Moreover, its characteristics have a higher correlation with water quality characteristics that vary with meteorological effects than the Namgang C and D watersheds, which are affected by artificial flow from the discharge of the Namgang Dam. As a result, the watershed characteristics were reflected well in the ANN learning. Significant quantitative model evaluation is difficult owing to the insufficient data of the probability forecasts that started in 2014 and the irregular water quality measurement dates. As Palani [7] found, lack of consistency between the observed and estimated data indicates that new patterns should be incorporated into the model; hence, the model needs to be readjusted and reconfirmed when more data are collected. Even though the amount of available data was small, reasonable results were obtained for water quality predictions using the validation dataset that were not visible in separate locations from the training data set station. Palani [7] reported that better predictions can be provided if more data are available. Moreover, additional data would improve the accuracy of the ANN-based water quality prediction model.
4. Conclusions
Many studies have been conducted on water quality prediction models that use ANNs. However, there has been no study on a water quality prediction model that considers meteorological factors that have significant effects on water quality. Water quality is sensitive to rainfall runoff to watersheds and the changing water environment. Moreover, surface water directly affects water temperature because it is exposed to sunlight. Therefore, research on the development of a water quality prediction model needs to consider meteorological factors as well as water quality factors. The water quality variation characteristics of each watershed were examined through EFA, and the classified factors were used as the input variables for learning the ANN-based water quality prediction model for each water quality variable of the unit watershed. In the present study, we developed and evaluated an ANN-based water quality prediction model considering various water quality variation characteristics. Through this study, it will be possible to refer to the selection of input data for constructing an ANN. It will also be able to provide information on meteorological correlations for water quality prediction.
- Based on the EFA results, the water temperature (W.T), temperature (T), and dissolved oxygen (DO) showed negative correlations at most locations and were classified as the same factor. This indicates that the characteristic of the decreasing dissolution rate of gas (oxygen) with decreasing W.T is reflected well. Immediately downstream of the Namgang Dam, water quality variables such as COD and nutrients were classified as the same factor. In Namgang E, BOD and Chl-a were classified as the same factor. This suggests that the native Chl-a and BOD have a high correlation owing to the hydraulically stagnant flow at the junction of the main stream and tributary.
- Most of the meteorological variables were not classified together with the water quality variables. This is because the meteorological variables did not exhibit large variability as they are not direct influencing factors for the water quality variables, but indirect factors related to the W.T or saturation. In other words, the nonlinear relationship between meteorological variables and water quality variables could not be statistically examined through EFA. However, we attempted to build a model that embodies the nonlinear correlation between the meteorological factors and water quality factors through ANN model learning.
- The coefficient of determination was determined, and the model was evaluated by building a water quality prediction model for each unit watershed, and the results were good for all water quality variables except for the SS. This seems to be attributable to the large changes in observation values due to changes in the watershed runoff characteristics caused by rainfall; moreover, the number of observations is extremely small to reflect the variation characteristics. It is expected that an enhanced model could be constructed if detailed ANN learning were performed through continuous accumulation of the water quality data of the existing water quality monitoring network. Significant quantitative model evaluation is difficult owing to the insufficient data of probabilistic weather forecasting, which started in 2014, and irregular water quality measurement dates. However, the improvement of accuracy through data accumulation in the future can be expected.
- The meteorological and water quality changes in the watershed have large spatiotemporal variability. Water quality data have strong nonlinear characteristics of the ecosystem due to very complex reaction mechanisms. Because the meteorological effects already contain some of the characteristics of water quality, the probabilistic forecasting of water quality will be possible through the ANN-based water quality forecast model in the future.
Author Contributions
Conceptualization, W.S.J. and Y.D.K.; methodology, W.S.J. and S.E.K.; model simulation, W.S.J. and S.E.K.; validation, W.S.J.; formal analysis, W.S.J. and Y.D.K.; investigation, S.E.K.; writing-review and editing, W.S.J. and Y.D.K. All authors have read and agreed to the published version of the manuscript.
Funding
This research was funded by Korea Agency for Infrastructure Technology Advancement (KAIA), grant number 1615012318.
Institutional Review Board Statement
Not applicable.
Data Availability Statement
Not applicable.
Acknowledgments
This work is supported by the Korea Agency for Infrastructure Technology Advancement (KAIA) grant funded by the Ministry of Land, Infrastructure and Transport (Grant 1615012318).
Conflicts of Interest
The authors declare no conflict of interest.
References
- Lee, S.Y.; Dunn, R.J.K.; Young, R.A.; Connolly, R.M.; Dale, P.E.R.; Dehayr, R.; Lemckert, C.J.; McKinnon, S.; Powell, B.; Teasdale, P.R.; et al. Impact of urbanization on coastal wetland structure and function. Austral. Ecol. 2006, 312, 149–163. [Google Scholar] [CrossRef]
- Freeman, L.A.; Corbett, D.R.; Fitzgerald, A.M.; Lemley, D.A.; Quigg, A.; Stepe, C.N. Impacts of Urbanization and Development on Estuarine Ecosystems and Water Quality. Estuaries Coasts 2019, 42, 1821–1838. [Google Scholar] [CrossRef]
- Wellen, C.; Kamran-Disfani, A.R.; Arhonditsis, G.B. Evaluation of the current state of distributed watershed nutrient water quality modeling. Environ. Sci. Technol. 2015, 49, 3278–3290. [Google Scholar] [CrossRef] [PubMed]
- Ji, Z.G. Hydrodynamics and Water Quality: Modeling Rivers, Lakes, and Estuaries; John Wiley & Sons: Hoboken, NJ, USA, 2017. [Google Scholar]
- Wenyan, W.; Graeme, C.D.; Holger, R.M. Protocol for developing ANN models and its application to the assessment of the quality of the ANN model development process in drinking water quality modelling. Environ. Model. Softw. 2014, 54, 108–127. [Google Scholar]
- Kim, S.E.; Seo, I.W. Artificial Neural Network ensemble modeling with conjunctive data clustering for water quality prediction in rivers. J. Hydro-Environ. Res. 2015, 9, 325–339. [Google Scholar] [CrossRef]
- Palani, S.; Liong, S.Y.; Tkalich, P. An ANN application for water quality forecasting. Mar. Pollut. Bull. 2008, 56, 1586–1597. [Google Scholar] [CrossRef] [PubMed]
- Patki, V.K.; Jahagirdar, S.; Patil, Y.M.; Karale, R.; Nadagouda, A. Prediction of water quality in municipal distribution system. Mater. Today Proc. 2021, in press. [Google Scholar] [CrossRef]
- Chang, F.J.; Tsai, Y.H.; Chen, P.A.; Alexandra, C.; Georges, V. Modeling water quality in an urban river using hydrological factors e Data driven approaches. J. Environ. Manag. 2015, 151, 87–96. [Google Scholar] [CrossRef] [PubMed]
- Dunn, R.J.K.; Teasdale, P.R.; Warnken, J.; Jordan, M.A.; Arthur, J.M. Evaluation of the in situ, time-integrated DGT technique by monitoring changes in heavy metal concentrations in estuarine waters. Environ. Pollut. 2007, 148, 213–220. [Google Scholar] [CrossRef] [PubMed] [Green Version]
- Jeong, K.S.; Kim, D.K.; Shin, H.S.; Yoon, J.D.; Kim, H.W.; Joo, G.J. Impact of summer rainfall on the seasonal water quality variation (chlorophyll a) in the regulated Nakdong River. KSCE J. Civil. Eng. 2011, 15, 983–994. [Google Scholar] [CrossRef]
- Kim, S.E.; Seo, I.W.; Choi, S.Y. Assessment of water quality variation of a monitoring network using exploratory factor analysis and empirical orthogonal function. Environ. Model. Softw. 2017, 94, 21–35. [Google Scholar] [CrossRef]
- Rojas, R. The Backpropagation Algorithm. In Neural Networks; Springer: Berlin/Heidelberg, Germany, 1996; pp. 149–182. [Google Scholar] [CrossRef]
- ASCE. Criteria for evaluation of watershed models. J. Irrig. Drianage Eng. ASCE 1993, 119, 429–442. [Google Scholar] [CrossRef]
- Legates, D.R.; McCabe, G.J. Evaluating the use of “goodness-of-fit” measures in hydrologic and hydro climatic model validation. Water Resour. Res. 1999, 35, 233–241. [Google Scholar] [CrossRef]
- Moriasi, D.N.; Arnold, J.G.; Van Liew, M.W.; Bingner, R.L.; Harmel, R.D.; Veith, T.L. Model evaluation guidelines for systematic quantification of accuracy in watershed simulations. Trans. ASABE 2007, 50, 885–900. [Google Scholar] [CrossRef]
Figure 1.
Geographic information of the Namgang Watersheds.

Figure 2.
Research process of exploratory factor analysis (EFA).

Figure 3.
Input and output structure of an artificial neural network.

Figure 4.
Development of the ANN model using the ensemble modeling technique.

Figure 5.
Flowchart for the development of the ANN-based water quality prediction model that applies the probability forecasts.
Figure 5.
Flowchart for the development of the ANN-based water quality prediction model that applies the probability forecasts.

Figure 6.
Learning results of the ANN-based water quality prediction model in the Namgang A unit watershed.
Figure 6.
Learning results of the ANN-based water quality prediction model in the Namgang A unit watershed.

Figure 7.
Learning results of the ANN-based water quality prediction model in the Namgang B unit watershed.
Figure 7.
Learning results of the ANN-based water quality prediction model in the Namgang B unit watershed.

Figure 8.
Learning results of the ANN-based water quality prediction model in the Namgang C unit watershed.
Figure 8.
Learning results of the ANN-based water quality prediction model in the Namgang C unit watershed.

Figure 9.
Learning results of the ANN-based water quality prediction model in the Namgang D unit watershed.
Figure 9.
Learning results of the ANN-based water quality prediction model in the Namgang D unit watershed.

Figure 10.
Learning results of the ANN-based water quality prediction model in the Namgang E unit watershed.
Figure 10.
Learning results of the ANN-based water quality prediction model in the Namgang E unit watershed.


Table 1.
Weather stations and available meteorological variables.
| Weather Station | Input Variables | Collection Period | Reference |
|---|---|---|---|
| Sancheong | Precipitation, Relative Humidity, Temperature, Solar Radiation, Wind Speed | 2007–2016 | KMA * |
| Jinju |
Note: * Korea Meteorological Administration.
Table 2.
Water quality station and water quality and flow variables.
| Gauging Station | Input Variables | Collection Period | Reference |
|---|---|---|---|
| Namgang A | Water Temperature, EC, pH, DO, BOD, COD, SS, T-N, NH3-N, NO3-N, T-P, PO4-P, Chl-a, TOC, Flow | 2007–2016 | KWIS ** |
| Namgang B | |||
| Namgang C | |||
| Namgang D | |||
| Namgang E |
Note: ** Korea Water Information System.
Table 3.
Model performance function for estimating ANN-based water quality prediction models.
| Method | Basic Equation | Description of Variables |
|---|---|---|
| RMSE | = observed value, = simulated value, = mean observed value n = number of data | |
| NSE | ||
| R2 |
Table 4.
Exploratory Factor Analysis (EFA) results by unit watershed.
| Unit Watershed | Factor 1 | Factor 2 | Factor 3 | Factor 4 | ||||||||
|---|---|---|---|---|---|---|---|---|---|---|---|---|
| Factor | Eigenvalue | Cumulative | Factor | Eigenvalue | Cumulative | Factor | Eigenvalue | Cumulative | Factor | Eigenvalue | Cumulative | |
| Namgang A | W.T, T, DO, T-N, NO3-N | 4.713 | 0.295 | Q, SS, Qs, COD, P | 2.671 | 0.462 | T-P, TOC, pH, BOD, Chl-a | 2.557 | 0.621 | Sun, R.H. | 1.534 | 0.717 |
| Namgang B | W.T, T, DO, T-N, NO3-N | 5.366 | 0.335 | COD, BOD, TOC, SS, T-P, Chl-a | 2.555 | 0.495 | Q, Qs, pH | 2.150 | 0.630 | Sun, R.H. | 1.455 | 0.720 |
| Namgang C | W.T, T, DO, EC | 6.246 | 0.347 | SS, COD, TOC, T-P, Q | 2.755 | 0.500 | Sun, Rad, R.H., P | 2.262 | 0.626 | pH, BOD, Chl-a | 1.266 | 0.696 |
| Namgang D | BOD, COD, TOC, T-P, Chl-a | 5.492 | 0.305 | W.T, T, EC, DO, T-N | 3.965 | 0.525 | Sun, R.H., P, Rad | 2.510 | 0.665 | pH, SS, Q. | 1.907 | 0.771 |
| Namgang E | W.T, T, EC, DO, T-N, NO3-N, NH3-N | 5.159 | 0.287 | BOD, COD, TOC, T-P, Chl-a | 4.008 | 0.509 | SS, Q, Qn, pH, PO4-P | 2.505 | 0.649 | Rad, R.H., Sun | 2.010 | 0.760 |
Note: Water Temperature (W.T), Air Temperature (T), Daily Precipitation (P), Electric Conductivity (EC), Discharge (Q), Solar Radiation Quantity (Rad), Duration of Sunshine (Sun), and Relative Humidity (R.H.). Negative correlations have been underlined.
Table 5.
Input variables of the ANN-based water quality prediction model.
| Unit watershed | Water Quality Prediction Variable | Common Input Variable | Input Variable |
|---|---|---|---|
| Namgang A | DOt+1 | Temperaturet−1, Temperaturet, Temperaturet+1, Precipitationt−1, Precipitationt, Precipitationt+1 | DOt, DOt−1, DOt−2, T-Nt |
| BOOt+1 | BODt, BODt−1, BODt−2, TOCt, T-Pt, Chl-at | ||
| COOt+1 | CODt, CODt−1, CODt−2, SSt | ||
| TOCt+1 | TOCt, TOCt−1, TOCt−2, BODt, T-Pt, Chl-at | ||
| T-Pt+1 | T-Pt, T-Pt−1, T-Pt−2, BODt, TOCt, Chl-at | ||
| SSt+1 | SSt, SSt−1, SSt−2, CODt | ||
| Namgang B | DOt+1 | DOt, DOt−1, DOt−2, T-Nt | |
| BOOt+1 | BODt, BODt−1, BODt−2, TOCt, T-Pt, CODt, SSt, Chl-at | ||
| COOt+1 | CODt, CODt−1, CODt−2, BODt, TOCt, T-Pt, SSt, Chl-at | ||
| TOCt+1 | TOCt, TOCt−1, TOCt−2, BODt, T-Pt, CODt, SSt, Chl-at | ||
| T-Pt+1 | T-Pt, T-Pt−1, T-Pt−2, BODt, TOCt, CODt, SSt, Chl-at | ||
| SSt+1 | SSt, SSt−1, SSt−2, BODt, TOCt, T-Pt, CODt, Chl-at | ||
| Namgang C | DOt+1 | DOt, DOt−1, DOt−2 | |
| BOOt+1 | BODt, BODt−1, BODt−2, Chl-at | ||
| COOt+1 | CODt, CODt−1, CODt−2, TOCt, T-Pt, SSt | ||
| TOCt+1 | TOCt, TOCt−1, TOCt−2, CODt, T-Pt, SSt | ||
| T-Pt+1 | T-Pt, T-Pt−1, T-Pt−2, CODt, TOCt, SSt | ||
| SSt+1 | SSt, SSt−1, SSt−2, CODt, TOCt, T-P | ||
| Namgang D | DOt+1 | DOt, DOt−1, DOt−2, T-Nt | |
| BOOt+1 | BODt, BODt−1, BODt−2, TOCt, T-Pt, CODt, Chl-at | ||
| COOt+1 | CODt, CODt−1, CODt−2 BODt, TOCt, T-Pt, Chl-at | ||
| TOCt+1 | TOCt, TOCt−1, TOCt−2 BODt, T-Pt, CODt, Chl-at | ||
| T-Pt+1 | T-Pt, T-Pt−1, T-Pt−2 BODt, TOCt, CODt, Chl-at | ||
| SSt+1 | SSt, SSt−1, SSt−2 | ||
| Namgang E | DOt+1 | DOt, DOt−1, DOt−2, T-Nt | |
| BOOt+1 | BODt, BODt−1, BODt−2, TOCt, T-Pt, CODt, Chl-at | ||
| COOt+1 | CODt, CODt−1, CODt−2 BODt, TOCt, T-Pt, Chl-at | ||
| TOCt+1 | TOCt, TOCt−1, TOCt−2 BODt, T-Pt, CODt, Chl-at | ||
| T-Pt+1 | T-Pt, T-Pt−1, T-Pt−2 BODt, TOCt, CODt, Chl-at | ||
| SSt+1 | SSt, SSt−1, SSt−2, |
Note: (t−2): 2 weeks before, (t−1): 1 week before, (t): present, (t + 1): 1 week later.
Table 6.
Evaluation results for the ANN-based water quality prediction model that utilizes probability forecasts.
Table 6.
Evaluation results for the ANN-based water quality prediction model that utilizes probability forecasts.
| Unit Watershed | R2 | RMSE | NSE | |||||||||||||||
|---|---|---|---|---|---|---|---|---|---|---|---|---|---|---|---|---|---|---|
| DO | BOD5 | COD | TOC | T-P | SS | DO | BOD5 | COD | TOC | T-P | SS | DO | BOD5 | COD | TOC | T-P | SS | |
| Namgang A | 0.793 | 0.602 | 0.612 | 0.512 | 0.561 | 0.598 | 0.872 | 0.420 | 0.801 | 0.718 | 0.032 | 3.889 | 0.798 | 0.597 | 0.525 | 0.507 | 0.409 | 0.587 |
| Namgang B | 0.796 | 0.505 | 0.570 | 0.601 | 0.571 | 0.471 | 0.896 | 0.578 | 0.903 | 0.614 | 0.020 | 6.187 | 0.789 | 0.589 | 0.496 | 0.584 | 0.350 | 0.426 |
| Namgang C | 0.866 | 0.315 | 0.761 | 0.730 | 0.629 | 0.529 | 0.807 | 0.448 | 0.405 | 0.283 | 0.009 | 4.761 | 0.865 | 0.401 | 0.764 | 0.730 | 0.595 | 0.504 |
| Namgang D | 0.673 | 0.663 | 0.620 | 0.554 | 0.391 | 0.533 | 1.012 | 0.310 | 0.502 | 0.376 | 0.017 | 3.223 | 0.658 | 0.605 | 0.606 | 0.551 | 0.341 | 0.338 |
| Namgang E | 0.854 | 0.673 | 0.926 | 0.809 | 0.785 | 0.602 | 0.675 | 0.472 | 0.381 | 0.424 | 0.012 | 3.214 | 0.847 | 0.658 | 0.864 | 0.749 | 0.705 | 0.561 |
Publisher’s Note: MDPI stays neutral with regard to jurisdictional claims in published maps and institutional affiliations. |
© 2021 by the authors. Licensee MDPI, Basel, Switzerland. This article is an open access article distributed under the terms and conditions of the Creative Commons Attribution (CC BY) license (https://creativecommons.org/licenses/by/4.0/).
Share and Cite
MDPI and ACS Style
Jung, W.S.; Kim, S.E.; Kim, Y.D. Prediction of Surface Water Quality by Artificial Neural Network Model Using Probabilistic Weather Forecasting. Water 2021, 13, 2392. https://doi.org/10.3390/w13172392
AMA Style
Jung WS, Kim SE, Kim YD. Prediction of Surface Water Quality by Artificial Neural Network Model Using Probabilistic Weather Forecasting. Water. 2021; 13(17):2392. https://doi.org/10.3390/w13172392
Chicago/Turabian StyleJung, Woo Suk, Sung Eun Kim, and Young Do Kim. 2021. "Prediction of Surface Water Quality by Artificial Neural Network Model Using Probabilistic Weather Forecasting" Water 13, no. 17: 2392. https://doi.org/10.3390/w13172392
Note that from the first issue of 2016, this journal uses article numbers instead of page numbers. See further details here.