
Targeting Irrigation Expansion to Address Sustainable Development Objectives: A Regional Farm Typology Approach


1
Department of Geography, The University of Alabama, Tuscaloosa, AL 35487, USA
2
The Center for Global Change and Earth Observation, Michigan State University, East Lansing, MI 48824, USA
3
Laboratorio de Análisis Geo-Espacial (LAGE), Instituto de Geografía, Universidad Nacional Autónoma de México (UNAM), Circuito Exterior, Ciudad Universitaria, Del. Coyoacán, Apdo Postal 20850, Mexico City 04510, Mexico
4
Research Center for Complexity Science, Centro de Ciencias de la Complejidad, C3, UNAM, Mexico City 04510, Mexico
*
Author to whom correspondence should be addressed.
Water 2021, 13(17), 2393; https://doi.org/10.3390/w13172393
Submission received: 29 July 2021
/
Revised: 27 August 2021
/
Accepted: 29 August 2021
/
Published: 30 August 2021
(This article belongs to the Section Water, Agriculture and Aquaculture)
Abstract
:Sustainable water management is a core sustainable development goal (SDG) that also contributes to other SDGs, including food and water security, ecosystem health, and climate adaptation. To achieve these synergies, policies must target efforts to regions that best correspond with development objectives. This study designs a targeting strategy for irrigation expansion in southern Mexico—a region long considered to have strong potential for sustainable irrigation development. We use an integrated farm typology and decision tree approach to identify priority municipalities for irrigation expansion. We use multivariate statistics to examine the relationships among farm characteristics in 933 municipalities, classifying each according to four farm types: lowland, midland, midland-irrigated, and highland. We then partition municipalities into 11 farm-type subgroups, each ranked by priority level for receiving irrigation interventions following Mexico’s National Water Program guidelines. Results identify a ‘highest-priority’ subgroup of 73 municipalities comprised mostly of midland and highland farm types. These types are characterized by low irrigation use, small farmland areas, high vulnerability to climate, high marginalization (poverty), strong representation from indigenous communities, low maize yield, and high rates of subsistence production. Findings provide a crucial first approximation of where irrigation expansion would best address water policy priorities and sustainable development objectives in southern Mexico. This study also provides a useful framework for scaling organizations tasked with targeting development efforts across large spatial scales.
1. Introduction
Expansion of supplemental irrigation to rainfed farms will probably be necessary to close yield gaps, meet future demands for food, and enhance food and water security [1,2,3]. Current irrigation practices are unsustainable in many highly productive regions [4] and crop water demand is likely to increase due to population and economic growth [5,6]. While improving water use efficiency remains crucial to sustainable intensification, there are conceptual and practical limits to producing ‘more crop per drop’ [7,8,9]. Under improved efficiency scenarios, groundwater (blue water) abstraction rates will remain unsustainable in many regions [10], even after considering the potential recycling of this water [11]. Improved precipitation (green water) management enhances water use efficiency, but rainfed systems will remain vulnerable to climatic variability without supplemental irrigation [12]. It remains unclear if virtual water transfers could significantly impact blue water supply [13,14] without massive shifts in food policy and consumer attitudes (e.g., marketing of food from ‘sustainably-sourced aquifers’) [15]. Physical water transfers, on the other hand, often involve costly infrastructure investments and raise additional concerns about sustainability [16]. Physical water exports from source areas often have high environmental costs [17], as does agricultural expansion in these areas [18]. In sum, where and how agricultural water is sourced and managed remains a central sustainability concern. Coupled with improvements in crop water efficiency and productivity, some shifting of irrigation burdens from water-stressed regions to those with more sustainable resources will be necessary [19].
In rainfed farming regions, sustainable irrigation expansion has the potential to produce positive synergies with other sustainable development goals (SDGs) [20,21]. In low-income regions exposed to green water scarcity, supplemental irrigation can enhance productivity, even when water inputs are below full crop water requirements (deficit irrigation) [22,23]. Unlocking the productivity potential of such regions through sustainable water management (SDG 6) is a longstanding development goal and potential pathway to food security (SDG 2) [24]. Increasingly, expanding access to irrigation is viewed in relation to water equity and governance issues and the human right to water (SDG 16) [25,26]. Enhanced access to supplemental irrigation also serves as a climate adaptation strategy and a means of mitigating drought, building resilient farm systems, and addressing rural poverty (SDG 1) [27]. It is crucial to prioritize irrigation expansion to existing farmlands (intensification), rather than expanding into natural areas (extensification). This reduces pressure to convert natural areas to agriculture, which ultimately enhances the conservation of aquatic and terrestrial ecosystems (e.g., SDGs 14 and 15) [3]. On existing farmlands, policies that promote ecologically based, integrated approaches to irrigation can enhance productivity while still maintaining environmental flow requirements [21,28].
Key to realizing these SDGs, and to managing potential tradeoffs [29], is the effective spatial targeting of irrigation interventions [30,31]. Farm structural (e.g., land, labor, productivity, farm size, income) and functional (e.g., farmer behavior, values, adaptive strategies) characteristics play important roles in crop water management. Understanding the relationships among these factors is crucial to the effective design and implementation of policy interventions [32,33,34]. Without integrated understanding of agricultural contexts, assessment of any synergistic effects of interventions, positive or negative, is problematic [35,36].
Targeting strategies face numerous methodological and practical challenges, especially when attempting to address multiple objectives. For agricultural water policy, integrated assessment of farm systems over large spatial scales is complicated by the heterogeneity of agricultural landscapes and the challenges of characterizing farm diversity [37]. Too often, scaling efforts adopt ‘one-size-fits-all’ approaches to management [38] or base targeting decisions on singular farm indicators rather than groups of indicators [39]. In early stages of the scaling pathway, there are at least two fundamental challenges: (1) how to integrate farm system complexity into a coherent and manageable framework, and (2) how to use that framework to effectively target policy interventions.
Farm typologies offer a practical way to address both challenges. Typology studies use multivariate statistics to integrate farm complexity and diversity into a coherent and manageable framework. This framework is then used to stratify farms into broadly homogenous groups based on structural and functional characteristics. Careful selection of characteristics of interest (indicator variables) allows typologies to be oriented around specific themes or policy goals, while maintaining a degree of generalizability that is necessary for addressing multiple objectives [40,41]. As a subfield of agricultural systems research, typology use has grown in recent decades with advances in multivariate statistics, the rise of exploratory data analysis, and improved access to agricultural ‘big data’ [42]. Typologies have generated important insights into the diversity, complexity, and underlying structures of agricultural systems [43]. However, recent studies stress the need to move beyond characterization and towards making typologies more topic- or hypothesis-driven, policy-relevant, and actionable [40,44,45].
This paper develops a typology-based framework for targeting irrigation interventions in southern Mexico, a region long considered to have strong potential for sustainable irrigation development. We use municipality-level data from Mexico’s National Agricultural Census [46] to build a regional farm typology of 14 farm characteristics. We then incorporate the typology into a decision-tree (classification and regression tree) model and use the combined approach to derive 11 farm-type subgroups, each ranked by priority level for irrigation interventions. Priority designations are based on the degree to which municipalities correspond with the priority objectives of the National Water Program (2020–2024), the guiding framework for water policy in Mexico [47]. Discussion of results centers on the potential for sustainable irrigation expansion in southern Mexico and, specifically, where targeted irrigation interventions would best address sustainable water management and other development objectives.
To investigate how targeted irrigation expansion would best address the sustainable development priorities of Mexico’s National Water Program (2020–2024) [47], this paper has two primary objectives:
Objective 1: to develop a farm typology that reflects the structural and functional characteristics of farms in the study area. The typology will serve two main purposes: (1) to illustrate the underlying structure of agricultural systems in the study area, and (2) to provide a conceptual framework for classifying municipalities into relatively homogenous groups based on system characteristics.
Objective 2: to build a typology-based decision tree model that partitions municipalities into ranked priority subgroups for irrigation expansion. The decision-tree will serve two main purposes: (1) to determine which municipalities should receive interventions based on National Water Program objectives, and (2) to provide a useful decision support tool for scaling organizations tasked with targeting development efforts effectively.
2. Materials and Methods
2.1. Study Area
In Mexico, irrigated agriculture is crucial to domestic food security and trade with the United States. Mexico is the seventh largest consumer of freshwater in the world [48] and irrigated agriculture accounts for ~76 percent of all water withdrawals [49]. Mexico also has the 7th largest irrigated land surface in the world (6.5 million hectares), which accounts for ~25 percent of Mexican territory [49]. About two-thirds of the territory is arid or semi-arid with the driest regions in the North. Here, large-scale hydraulic infrastructure and commercial agriculture define a landscape dominated by large (15–50 ha) and very large (>50 ha) farms. The region has the highest maize and wheat yields in the country, which largely result from intensive irrigation practices [49,50].
Irrigation management in northern regions is unsustainable. Much of the infrastructure is outdated and deteriorated, which has led to chronically low water use efficiency and some of the highest rates of water stress and groundwater depletion in the country [49,51]. Improving irrigation efficiency in northern regions is a central goal of national water policy, as is the sustainable development of more replenishable water sources [47,51].
In contrast, Mexico’s southern agricultural regions are characterized by abundant blue water resources, but little irrigation infrastructure. Farms in southern regions tend to be small (2–5 ha) or very small (0–2 ha), though less than 13 percent of farmland areas receives irrigation [50]. Low access to supplemental irrigation during drought is a major driver of maize yield gaps in southern regions [50,52,53]. Here, poverty rates are among the highest in the country and most municipalities score poorly on indices of human and rural development [49,50]. The region is also home to Mexico’s largest and most diverse indigenous communities, who depend primarily on traditional or indigenously developed forms of subsistence agriculture. Though climatically diverse, most of the territory falls in tropical zones. On average, precipitation rates are the highest in the country, reaching over 4000 mm year−1 in some areas. Large bodies of water exist, including the Usumacinta River, one of the largest in the world [49,51,54].
Several studies have pointed to the potential benefits of expanding irrigation development in southern Mexico. Early field-based studies found that supplemental irrigation could dramatically increase maize productivity, enhance agro-diversity and food security in vulnerable and marginalized communities [52,53]. More recently, studies have revisited the idea in response to growing concern over groundwater depletion and general water stress in central and northern irrigation districts [49,51,55,56].
Irrigation expansion in southern farm regions would be managed though the National Water Commission (CONAGUA, [49]). The Commission coordinates with states to control agricultural water supply through 13 hydrologic administrative regions (HARs). The spatial organization of HARs reflects both municipality divisions and hydrologic basins, a design intended to facilitate integration of socioeconomic and hydrologic factors in water resources management [47]. The southern region is comprised of three HARs: the Southern Pacific, Southern Border, and Central Gulf HARs [49]. Together, these HARs have the largest stocks of replenishable water in Mexico and the lowest rates of water stress, defined as the percent of replenishable water resources consumed annually [47,49]. This status comprises a central rationale behind previous calls for irrigation expansion in the region [51]. We selected these three HARs as the study area for this research.
2.2. Data Sources and Variable Selection
Data for this study came from three principal sources. First, we used data from Mexico’s most recent (2007) National Agricultural Census (NAC), the most comprehensive record of farm-level activities in the country. The NAC includes field survey and interview responses from over 9 million farms across the country, which are georeferenced and aggregated to the municipality level (n = 2455) [46] (for methodology and survey template details, see https://www.inegi.org.mx/programas/cagf/2007/, (accessed on 5 July 2020)). Second, we used crop productivity data from Mexico’s Agriculture and Fisheries Information Service (SIAP) (2002–2006). SIAP is an online resource managed by the Secretary of Agriculture and Rural Development that provides yearly productivity totals in each municipality [57] (for reporting details, see https://www.gob.mx/siap/es/#1410, accessed on 8 August 2020). Finally, we used data from the National Population Council (2005), which provides municipality-level data on a range of socioeconomic indicators used to develop Mexico’s composite marginality index [58] (for methodology details, see http://www.conapo.gob.mx/es/CONAPO/Indices_de_Marginacion_Publicaciones, accessed on 10 October 2020). The municipality was chosen as the unit of analysis, which was the smallest administrative unit common to all variables.
Variable selection followed standard procedures of farm typology studies [41,44,59]. Topically relevant farm structural and functional characteristics were first considered. Relevance was based on existing literature and the priority objectives of Mexico’s National Water Program [47]. We initially considered 24 potential variables, though data availability limited this to 14 variables belonging to five general categories.
Land. Three land use variables were derived from the NAC dataset: mean farm area, chemical fertilizer intensity, and irrigation rate. Mean farm area was calculated by dividing the total cultivated area in each municipality by the total number of farms following established practice [50,60]. Chemical fertilizer intensity was calculated as the percent of the total cultivated area in each municipality receiving chemical fertilizers. Irrigation rate was assessed by calculating the percent of farms in each municipality that use some form of irrigation.
Labor. Three labor variables were derived from the NAC dataset: use of hand tools, draft animals, and mechanized labor. Each variable was calculated as the percent of farms in each municipality to use these forms of labor. For all variables in the study, multiple farm responses were included in the survey dataset.
Production. Four crop production variables were derived from NAC and SIAP data. From NAC data, we calculated the percent of farms in each municipality engaged in subsistence agriculture, commercial food production, or feedstock production. From SIAP data, the average maize yield (t ha−1) of each municipality was calculated using the five-year (2002–2006) productivity averages leading up to the NAC (2007).
Production challenges. Two variables representing challenges to crop production were derived from the NAC dataset. The first was calculated as the percent of farms in each municipality that viewed financing issues as a major challenge to production. The second was calculated as the percent of farms that viewed climate factors as a major challenge to production.
Socioeconomic factors. Two socioeconomic variables were derived from the NAC and National Population Council datasets. From NAC data, the percent of farms in each municipality that included members of an indigenous community was calculated. We used Mexico’s Marginality Index [58] as an indicator of municipality level poverty. The Index is a broadly used measure of poverty and deprivation comprised of 10 socioeconomic indicators, including household income and educational levels, access to running water, sanitation, electricity, refrigeration, and other needs-based components unique to Mexico [61,62,63]. Marginality scores were published in standardized (z-scored) format (mean = 0, SD = 1) [58].
Based on these 14 variables, we first assessed differences between municipalities in the study area (n = 941) and those in the rest of the country (n = 1514). Comparisons between the two groups were made using t-tests for parametric data, Mann–Whitney’s tests for non-parametric data, and Chi-square and Fischer’s tests for proportions data. A 95 percent threshold for significance was used for all statistical analyses in the study.
2.3. Principal Component and Cluster Analysis
Focusing on municipalities in the study area (the three southern region HARs), principal component analysis (PCA) was used to reduce the dataset to a series of non-correlated principal components (PCs). To avoid distortions in the analyses, multivariate outlier detection was performed using Hotelling’s T-squared statistic as the upper-limit distance threshold. Municipalities below the threshold were retained and the resulting PCs were illustrated with factor loading plots and biplots. All PCs with eigenvalues >1 were retained for further analysis following the Kaiser rule [64].
K-means clustering was used to group municipalities with similar characteristics as defined by the PC loadings. K-means clustering was chosen over agglomerative (hierarchical) clustering due to the high sphericity of the PC loadings and the relatively large sample size. The K-means algorithm was run over an interval of 2 to 6 clusters to determine the optimal (k) number of clusters. K was determined using the cubic clustering criterion (CCC), which assigns scores based on the minimization of within-cluster variance (distance from centroid). We then validated and tested the clusters for significant differences using ANOVA and Tukey post-hoc tests (normal distribution, homogenous variance), Kruskal–Wallis and Dunn’s post-hoc tests (non-parametric), and Pearson’s Chi-squared and Fischer tests (proportional). Based on the results of these tests and exploratory mapping, we labeled clusters according to four distinct farm types.
2.4. Decision Tree Modeling
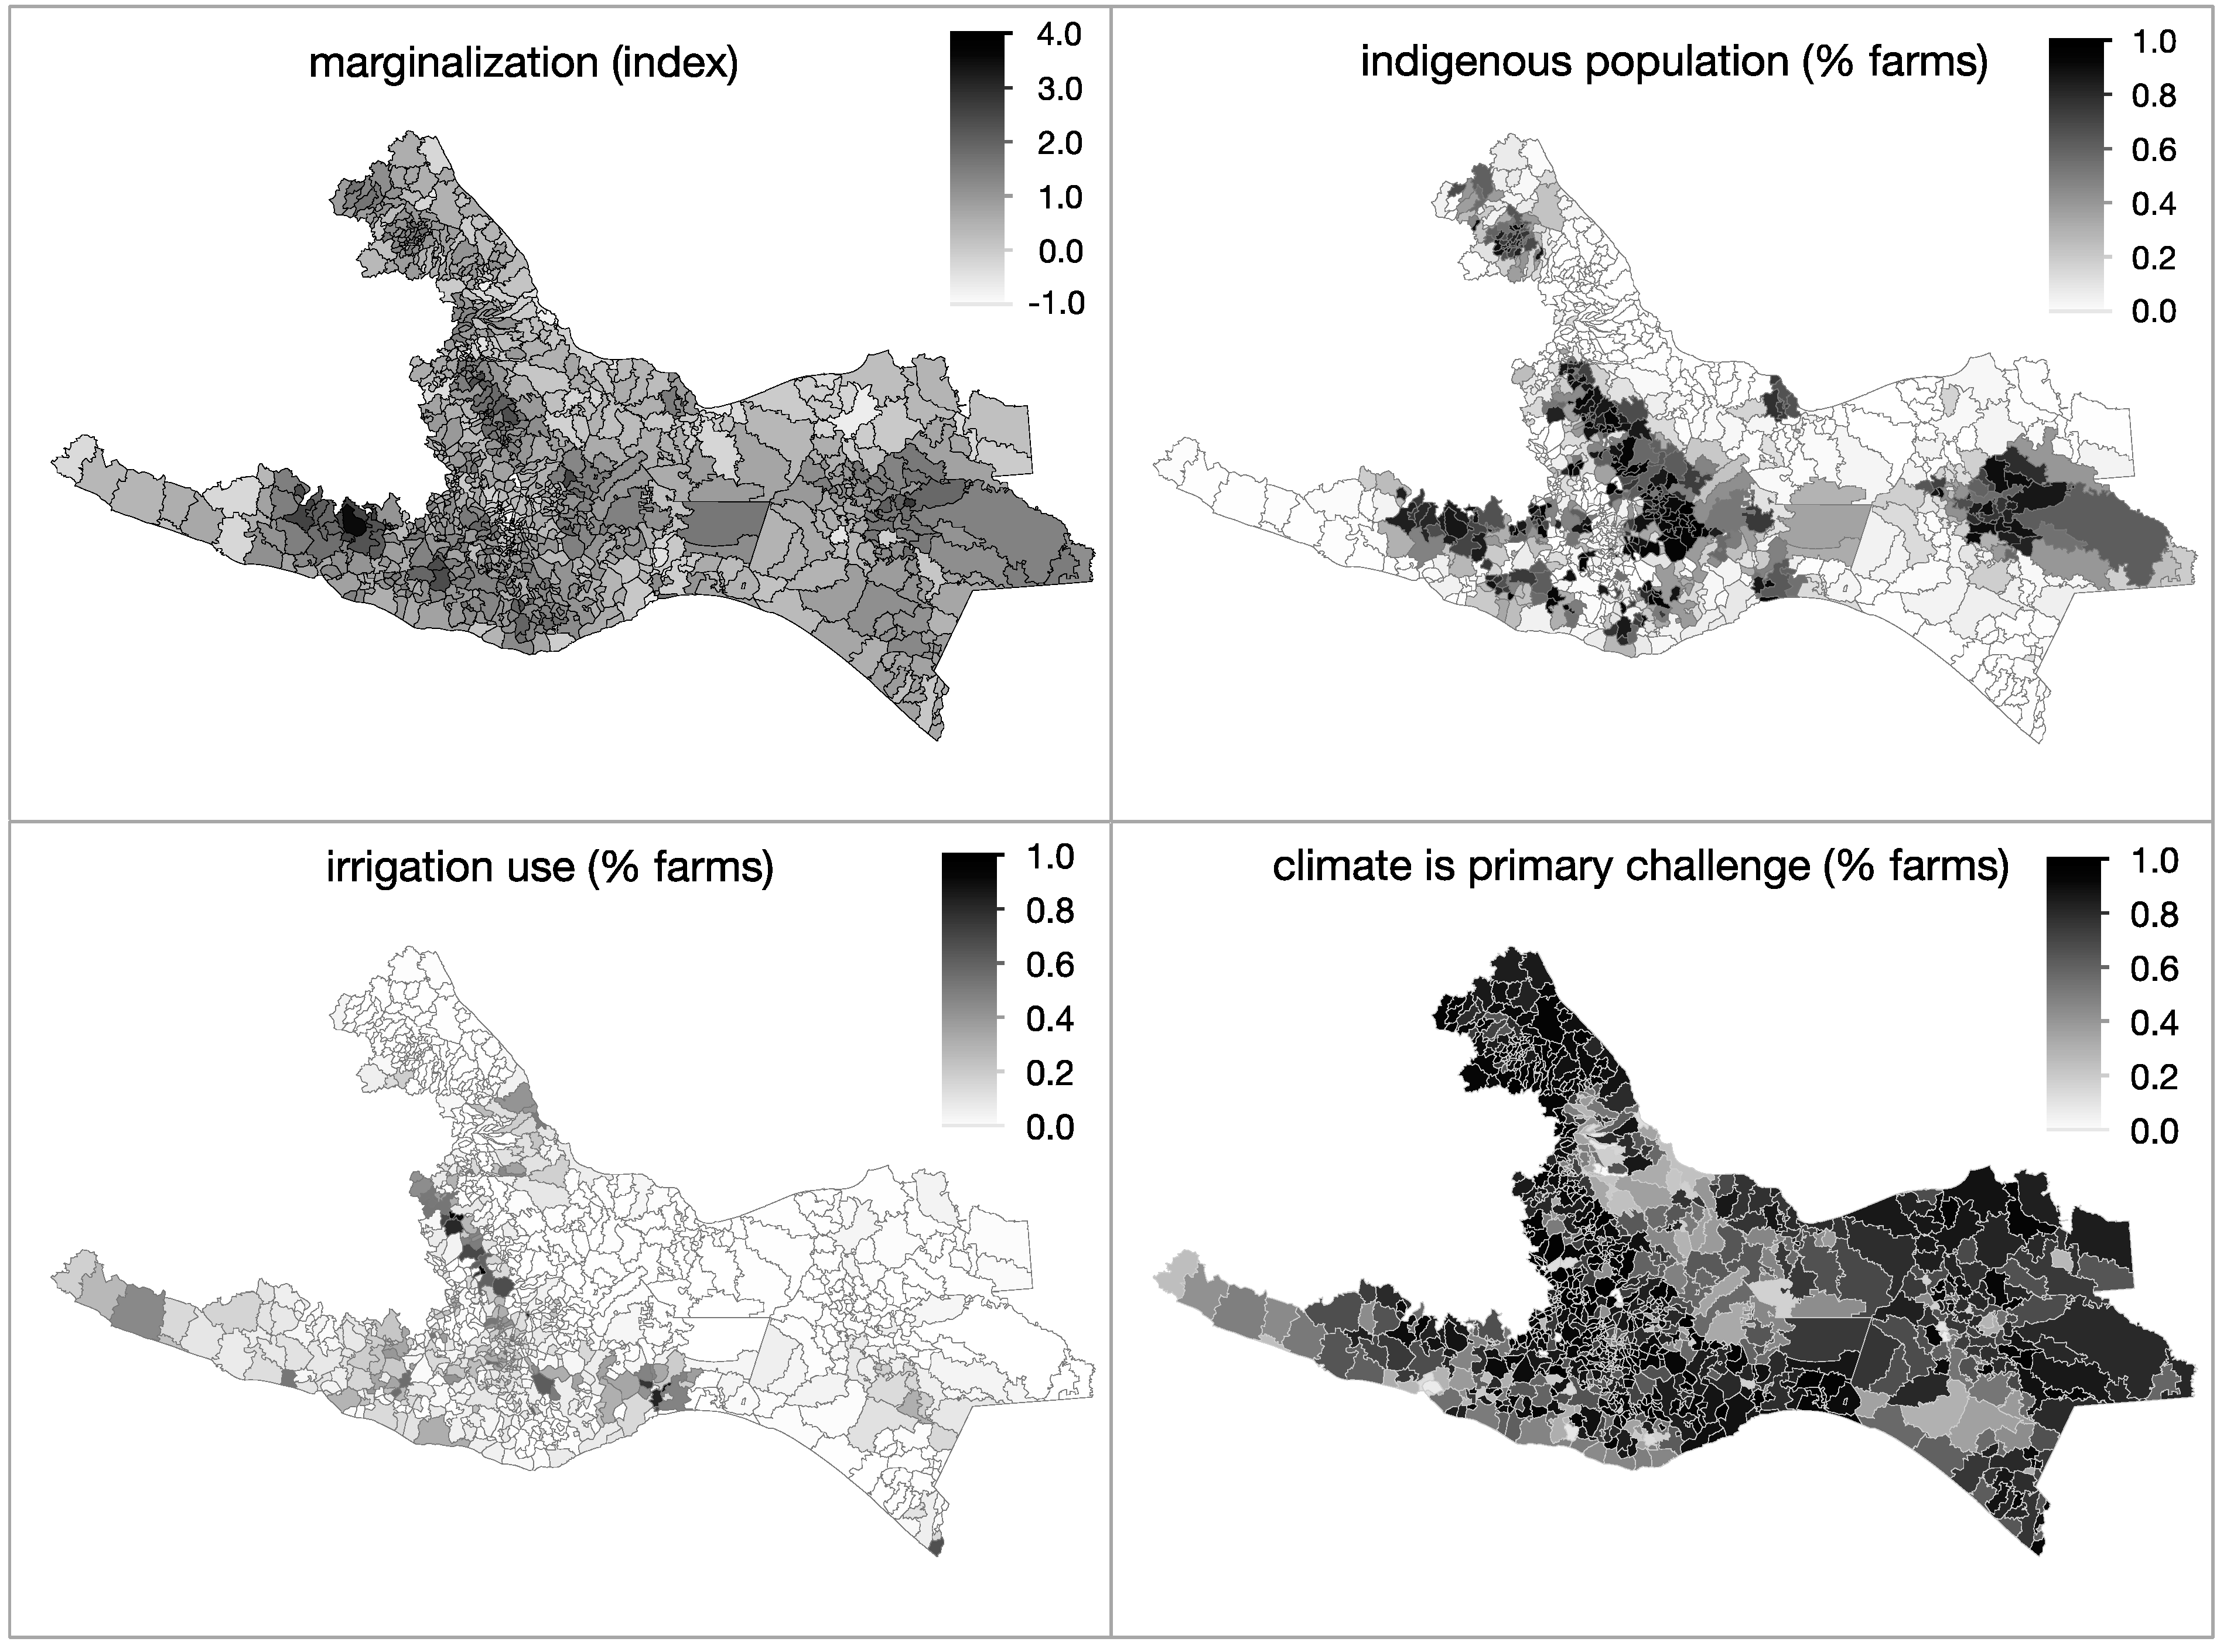
A decision-tree model was used to select subgroups of municipalities according to their priority levels for irrigation intervention. Priority levels were determined based on the degree to which each subgroup corresponded to the four priority objectives of the National Water Program [47]. These objectives include prioritizing regions with (1) low water access, (2) high marginality, (3) high vulnerability to climate factors, and (4) large indigenous populations.
Decision-tree approaches have been used in farm typology studies to illustrate the sequential development of typology pathways [59] or to identify subgroups within typologies based on specific input or decision-criteria variables [40]. This study followed the second approach, developing a model that assigns priority rankings to subgroups based on how well each corresponds with the four priority objectives.
Four typology variables were used as indicators of the priority objectives (marginalization index, climate challenges, percent irrigation, and indigenous membership). Together, these formed the decision-criteria basis of the decision tree. The model considered the four variables in a set of 80% randomly selected municipalities (n = 746) for training. All combinations of splitting order were considered and the order that maximized separability (sequential best fit) was retained. We then used the trained model to partition all municipalities recursively until two stopping rules were implemented: (1) once all four priority objectives had been used in the partitions, and (2) once the full pathway of the highest-priority subgroup was formed. After stopping rules were implemented, the end nodes (leaves) of each pathway were organized to represent ranked priority subgroups. All statistical and spatial analyses were performed in JMP Pro 15.1 (SAS Institute, Cary, NC) and ArcGIS Pro (ESRI).
3. Results
3.1. Farm Characteristics in the Study Area
The farm characteristics of municipalities in the study area (SA) differed significantly from those outside the study area (OSA) (Table 1). The mean farm area of the SA group (4.93 ha) was below the five-hectare threshold for classifying smallholder farms [50] and was significantly smaller than the mean farm area of the OSA group (15.43 ha). The percent of farms with irrigation was significantly smaller in the SA group than in the OSA group (8% to 26%), as was the percent of the cultivated areas receiving chemical fertilizers (20% to 35%). More farms in the SA group depended on subsistence agriculture than in the OSA group (84% to 65%), though differences in commercial agriculture and feedstock production were not statistically significant. Climate factors were a significant challenge to production for a larger percentage of farms in the SA group (78% to 73%), while a slightly smaller percent found that financing issues posed a significant challenge to production (20% to 22%). A slightly higher percent of farms in the SA group depended on draft animals (19% to 18%); a much higher percent utilized hand tools (46% to 19%); and a much smaller percent utilized machine labor (13% to 43%). Average maize yield was significantly lower in the SA group (1.88 t ha−1 to 3.05 t ha−1), while the percent of farms with members of an indigenous community was much higher (30% to 8%). Finally, the average marginality score of the SA group (0.60) was much higher than both the OSA group (−0.38) and the national average (0).
3.2. Farm Typology
Multivariate outlier detection identified eight of the 941 municipalities in the study area as statistical outliers (T2 = 0.80, α = 0.05). These were omitted from further analysis. A PCA of the remaining 933 municipalities found that 65 percent of the variance was explained by the first four PCs. The first two (PC1 and PC2) explained almost 50 percent (26.4% and 21.9%, respectively). A score plot and a loading plot of PC1 and PC2 (Figure 1a,b) illustrate the relationships among farm characteristic variables. The first four PCs had eigenvalues >1 and were retained for further analysis.
K-means clustering identified four distinct groups of municipalities (k = 4) according to the cubic clustering criteria score (CCC = 3.40). Cluster groups were assigned labels based on two variables: mean elevation and the percent of farms with irrigation. Elevation was chosen as a descriptive variable after exploratory mapping suggested that differences in elevation might distinguish the cluster groups (Figure 2). To test this, we compared the centroid elevations of municipalities in each cluster using non-parametric Kruskal–Wallis and Dunn’s post-hoc tests (Figure 3). Among the four groups we found three statistically significant elevation classes, which we labeled lowland (n = 1), midland (n = 2), and highland (n = 1) classes. With the same statistical tests, we also found significant differences between the two midland groups in the percent of farms with irrigation. Therefore, according to the two variables, we labeled the clusters: lowland, midland, midland-irrigated, and highland farm types. Among each type, we found significant differences for each of the 14 farm characteristic variables.
Lowland municipalities (n = 246). Lowland farm municipalities had the largest mean farmland area (9.16 ha) and highest rates of commercial agriculture (71%), feedstock production (48%), and mechanized labor (23%). Finance-based production challenges were significantly higher (38%) than among other farm types. Lowland farms had the lowest mean marginalization score (0.04), only slightly above the national average (0). Lowland municipalities also had the lowest percent of farms with members of an indigenous community (7%), the lowest rates of subsistence production (67%), draft animal use (4%), and percent of farms in which climate factors posed a significant challenge to production (62%). A small percent (5%) of lowland farms received irrigation.
Midland municipalities (n = 308). Midland farm municipalities had high rates of subsistence agriculture (91%) and the highest marginalization score (1.23), rates of feedstock production (51%), hand tool use (80%), and indigenous community membership (50%). Midland farms had the lowest rates of irrigation (3%), mechanized labor (2%), and chemical fertilizer use (4%). Midland farms also had low draft animal use (6%) and low maize yield (1.48 t ha−1).
Midland-irrigated municipalities (n = 134). Midland-irrigated farm municipalities had the highest rates of irrigation (34%) and mechanized labor (28%), and the highest maize yield (4.01 t ha−1). Midland irrigated farms had a low marginalization score (0.08), low rate of hand tool use (17%), and small mean farmland area (3.06 ha).
Highland municipalities (n = 245). Highland farm municipalities had high rates of marginalization (0.66) and the highest rates of subsistence agriculture (93%), chemical fertilizer use (39%), draft animal use (51%), and rate of climate factors posing a significant challenge to production (89%). Highland farms had the smallest mean farmland area (2.47 ha), lowest maize yield (2.47 t ha−1), and lowest rates of commercial agriculture (25%), feedstock production (16%), use of hand tools (14%), and rates of farms that found financing issues posed a significant challenge to production (10%). A relatively small percent (6%) of highland farms received irrigation (Table 2).
3.3. Priority Targeting with Decision Tree
The decision tree model partitioned municipalities into progressively smaller and more homogenous subgroups using the four priority objectives as splitting criteria (Figure A1). Because the National Water Program provided no value ordering for the criteria [47], we allowed the model to determine the splitting order based on best fit. At each step, the criterion was chosen that maximized explanatory power and the separation of municipalities into distinct subgroups. Numerical decision threshold values were determined in the same way. These represented the optimal cutoff points for the Yes/No pathway decision at each step. The recursive partitioning of municipalities continued until the stopping rules were implemented.
The decision tree produced 11 subgroups of municipalities, each consisting of different combinations of farm types and priority targeting levels (Figure 4). The model identified marginalization score as the initial splitting criterion. All municipalities with scores above 0.65 were channeled to the upper pathway while those below this value were channeled to the lower pathway. Because program objectives specified that efforts should be targeted to regions with higher marginality, the upper pathway was designated as the higher-priority path while the lower pathway as the lower-priority path. Each pathway node was then further partitioned by the next three criteria until the highest-priority path formed. The highest-priority path reflected municipalities with higher marginality rates (>0.65), higher rates of climate challenges (>77%), lower rates of irrigation (<15%), and higher rates of farms with members of indigenous communities (>82%).
Subgroups were ordered vertically according to priority ranking, so that the highest-priority subgroup (P1) was on top, followed by the second (P2) and third (P3) highest subgroups. In addition to priority ranking, this vertical alignment illustrated the change in farm-type composition among the subgroups, from lowest to highest priority.
Priority subgroups by farm type. In general, higher priority subgroups were comprised of midland (red) and highland (yellow) farm municipalities, while lower priority subgroups were comprised largely of lowland (blue) and midland-irrigated (green) farm municipalities. The P1 subgroup included 73 municipalities, distributed almost evenly between midland (n = 36) and highland (n = 35) farm types, along with two midland-irrigated types. The P2 subgroup was significantly larger (n = 207), with midland (n = 178) and highland (n = 52) farm types again comprising the lion’s share, along with several lowland farm types (n = 7). The P3 subgroup was smaller (n = 29) and was comprised of highland (n = 16), midland-irrigated (n = 8), and midland (n = 5) farm types.
Overall, the model explained the lowland and midland-irrigated farm types with 90 and 91 percent accuracy, respectively, and the midland and highland types with 85 and 76 percent accuracy as determined by area under the curve measures from receiver operating characteristics curves (Figure A2). As defined by the typology, the total misclassification rate for municipalities was 34 percent. Underfitting derived from the two model constraints. First, stopping rules allowed only 10 partition steps, which was insufficient to classify all 933 municipalities by farm type. Second, misclassification resulted from model constraints on decision criteria, which were limited to the four priority criteria, rather than the 14 that comprised the typology.
4. Discussion
4.1. Sustainable Irrigation Expansion in Southern Mexico
The structural and functional characteristics of farms in southern Mexico differ significantly from those in the rest of the country. In the South, farms are generally characterized by low rates of irrigation, small land areas, low maize yield, high vulnerability to climate factors, high rates of subsistence agriculture, large indigenous populations, and high marginalization rates. These characteristics generally align with the development priorities of the National Water Program [47], the guiding framework for water policy in Mexico. This includes prioritizing water resources management and development in areas with low irrigation rates and high marginalization, especially in indigenous communities with high vulnerability to climate stressors.
In general, our findings confirm previous research pointing to the strong potential for sustainable irrigation development in the study area. The rationale for irrigation development here includes socioeconomic, environmental, and productivity-based components. First, enhanced access to supplemental irrigation could help close chronic gaps in maize yield, which are largely driven by crop water deficits [50,53]. In turn, enhanced productivity could reduce food insecurity, generate economic development, and reduce poverty in the region [51,65,66]. The potential benefits of southern irrigation expansion have come into greater focus due to two factors. First, from growing concern over the unsustainable irrigation practices and general water stresses in arid and semi-arid northern and central regions. Second, from growing recognition that southern regions—where poor smallholder farms experience chronic productivity gaps due largely to crop water scarcity—also hold Mexico’s most abundant stocks of replenishable water resources [48,49,50].
Mexico has well-developed institutional and legal frameworks for sustainable water management (SDG 6) and a strong policy emphasis on integrated water management [38,47]. Comprehensive water resources management is one of Mexico’s Nationally Determined Contributions (NDCs) to achieve SDG targets [67]. In addition, the National Water Law (1992) prioritizes socioeconomic, technical, and environmental aspects of achieving food and water security [51], while the Sustainable Rural Development Law (2001) requires that agricultural policies explicitly address issues of sustainability and equity [68,69]. As an extension of these laws, Mexico’s Congress also is discussing plans for a General Water Law that would broaden policy objectives to explicitly include the human right to water [70,71].
In the context of these institutional factors, our findings highlight the strong potential for sustainable irrigation expansion in southern Mexico. Water policy priorities are expanding to become increasingly integrated with sustainable development objectives. With this diversification, the effective targeting of interventions will be essential to designing effective water policy, and to closing the gaps between stated policy priorities and development outcomes [30].
4.2. Integrated Targeting of Midland and Highland Farms
Within the southern region, we found that midland and highland municipalities best correspond with the priorities of the National Water Program. On average, midland and highland types have lower irrigation rates and higher marginalization, higher climate stress on productivity, and higher rates of membership in indigenous communities than do lowland and midland-irrigated types. Based on water policy priorities, midland and highland farm municipalities generally should be targeted for irrigation development.
The four water policy priorities also overlap with and contribute to several SDGs. First, the policy focus on agricultural regions exposed to climate stress contributes to strengthening climate resilience and adaptive capacity (SDG 13.1). Second, addressing the water needs of Mexico’s most marginalized communities corresponds with decreasing vulnerability and rural poverty (SDG 1) and enhancing economic growth (SDG 8). Third, the policy focus on regions with large indigenous communities corresponds with enhancing equity and justice among historically marginalized communities (SDGs 10 and 16). Finally, the general focus on southern regions with low irrigation rates corresponds with sustainable water resources development and management (SDG 6). In addition to the four priority objectives and corresponding farm characteristics, the potential to contribute to other SDGs is illustrated through the typology approach.
For example, midland and highland municipalities also had the highest rates of subsistence agriculture (91% and 93% respectively) and the lowest average maize yields (1.48 t ha−1 year−1 and 1.41 t ha−1 year−1, respectively) in the study area. While not explicitly included as water policy objectives, these typology components indicate strong potential for addressing food insecurity (SDG 2). Indeed, a recent analysis using NAC data found highland smallholder farms have strong potential for strengthening rural food security in Mexico [72]. In another example, a secondary farm characteristic such as chemical fertilizer use could serve as a target indicator for addressing land and water conservation (SDGs 14 and 15). We found a large difference between midland and highland municipalities in the mean percent of farms that use chemical fertilizers (4% and 36%, respectively). Including this characteristic as a decision criterion in the tree model, would help further distinguish priority subgroups of midland and highland farm types, thereby creating a more meaningful ranking of priority subgroups.
In sum, the integrative approach to farm characterization and priority targeting in this study illustrates multiple pathways to sustainable irrigation development and, potentially, to addressing other SDGs. The model structure can be easily adapted to include different farm characteristics and priority objectives. Based on the structure used in this study, irrigation development in 71 midland and highland municipalities offers the best pathway to sustainable water management in southern regions.
4.3. Extending the Scaling Pathway: Opportunities and Challenges
Investment in irrigated agriculture is a critical pathway to achieving zero hunger and sustainably managing water resources (SDGs 2 and 6). Climate change, population growth, and changes in dietary preferences are placing enormous pressure on global agricultural systems. It is estimated that agricultural production will need to increase by 60–70% to meet increased food demand by 2050 [73]. On average, irrigated agriculture is twice as productive as rainfed agriculture and allows for greater crop diversification [74]. However, to be sustainable and effective, spatial targeting of irrigation interventions to regions that best correspond to development objectives is imperative. Importantly, however, this approach is generalizable to other geographic regions, with different farm characteristics and other policy objectives.
In addition, the integrated farm typology and decision tree approach could be used to target irrigation interventions further along the scaling pathway. Here, we focused on the early stage targeting of municipalities. At a finer scale, the approach also could be used to tailor specific irrigation interventions to match farm-level needs or subregional-level sustainability objectives. For example, using the 71 midland and highland municipalities in the P1 subgroup as the target population, a new typology could be developed based on the specific irrigation needs and water resources found in this subgroup. A revised decision-tree could then identify the most appropriate (highest priority) forms of interventions within each type. Ultimately, the new decision criteria for tailoring interventions should be determined based on collaborations among researchers, scaling organizations, and local farm communities.
At this level, irrigation planning and management often require integrative and mixed soft- and hard-path approaches to infrastructure [75]. Soft-path approaches refer to small-scale, low-cost infrastructure focused on water resource efficiency, conservation, and local-level management [76]. These contrast with hard-path approaches, which typically involve large-scale hydrologic infrastructure, deep groundwater extraction, dam projects, and centralized management. Hard-path approaches characterize much of the hydrologic infrastructure and water resources management during the 20th century. Despite producing enormous benefits, studies also recognize the potential for hard-path approaches to be ecologically damaging, expensive, overly bureaucratic, and unsustainable [77]. Current research on sustainable water management generally stresses the benefits of soft-path approaches [22,78] or combined hard- and soft-path approaches tailored to specific circumstances [75,79,80].
In the current study area, soft-path approaches offer many benefits over hard-path approaches. Soft-path infrastructure is less costly, more conservation-based, and more adaptable to changing socio-environmental circumstances [1]. Strong similarities exist between soft-path approaches and integrated water management [76,81,82]. Specifically, integrated soft-path approaches facilitate community-level decision-making over water management, which helps to build resilience and adaptive capacity [83,84]. To be effective, however, soft-path interventions must be carefully tailored to community or farm-level irrigation needs and capacities. The typology-based approach used in this study offers a powerful and flexible tool for addressing these needs and capacities.
4.4. Limitations
As currently structured, there are several limitations to our study. First, water resources availability is assumed in the study area and is not differentiated at the subregional level. The assumption is based on earlier classifications [47,49] that also use this assumption to highlight the potential for irrigation expansion in the area, which has the most plentiful supplies of freshwater resources in Mexico [51]. However, we recognize the importance of accounting for differences in subregional water availability. This includes the potential relationships between water availability and other factors such as the costs and feasibility of different irrigation approaches and the willingness of farmers to adopt interventions [40,56]. Although beyond the scope of this study, incorporation of these factors, especially at later stages of the scaling pathway (e.g., farm-level tailoring of interventions), could potentially improve targeting effectiveness.
Additional spatial analysis of municipality clusters also is needed. This would allow for further investigation of the relationships between elevation and farm type. As we illustrate in this study, elevational zonation partially explains the distribution of farm characteristics. We suspect it also may partially explain differences in water availability, which is, as mentioned above, a potentially important factor in targeting and tailoring interventions effectively. Relatedly, spatial analysis of municipality clusters and of the geographical distances between clusters and water resources could provide important information for targeting. Such information would help inform the tradeoff analyses and feasibility assessments of specific irrigation interventions. In turn, the cost estimates and feasibility indicators derived from these analyses could then be integrated into a revised decision-tree model as priority objectives, each weighted according to institutional preferences. Critically, these preferences require the input and collaboration of farmer and community groups, who must be engaged with researchers and scaling organizations at all stages of model design, validation, and implementation [40,41,45,85]. Finally, although data used in this study reflect the most recent national agricultural census in Mexico, more recent data would improve the usefulness of our results going forward.
5. Conclusions
This study used a farm typology and decision-tree approach to identify priority municipalities for irrigation expansion in southern Mexico. Generally, we conclude that two types of municipalities should be targeted for interventions: midland and highland farm municipalities. Among these, a subgroup of 71 municipalities offers the optimal pathway to sustainable irrigation expansion and development in the study area. This group: (1) best aligns with the development objectives of Mexico’s National Water Program, and (2) has strong potential to generate synergies with other sustainable development objectives. These findings provide a crucial first approximation of where irrigation expansion would best address water policy priorities and sustainable development objectives in southern Mexico. This study approach also serves as a useful framework for scaling organizations tasked with targeting and tailoring policy interventions across large spatial scales.
Author Contributions
Conceptualization, M.C.L.; methodology, M.C.L. and S.C.; formal analysis, M.C.L.; investigation, M.C.L.; writing—original draft preparation, M.C.L. and A.N.F.; writing—review and editing, M.C.L., A.N.F. and S.C.; visualization, M.C.L. and A.N.F. All authors have read and agreed to the published version of the manuscript.
Funding
This research received no external funding.
Institutional Review Board Statement
Not applicable.
Informed Consent Statement
Not applicable.
Data Availability Statement
All data used in this study are available publicly.
Acknowledgments
We thank Sandra Nashif and Monica Cervantes-Jimenez for helpful comments on early drafts of this paper. We also thank two anonymous reviewers for their comments and suggestions.
Conflicts of Interest
The authors declare no conflict of interest.
Appendix A
Figure A1.
Maps of the four priority indicators by municipalities in the study area.

Figure A2.
Receiver operating characteristic curves for the decision tree model. Areas under the curves show model partition accuracy using the four priority indicators after 10 decision steps.
Figure A2.
Receiver operating characteristic curves for the decision tree model. Areas under the curves show model partition accuracy using the four priority indicators after 10 decision steps.

References
- Rosa, L.; Chiarelli, D.D.; Rulli, M.C.; Dell’Angelo, J.; D’Odorico, P. Global Agricultural Economic Water Scarcity. Sci. Adv. 2020, 6, eaaz6031. [Google Scholar] [CrossRef] [PubMed]
- Puy, A.; Lo Piano, S.; Saltelli, A. Current Models Underestimate Future Irrigated Areas. Geophys. Res. Lett. 2020, 47, e2020GL087360. [Google Scholar] [CrossRef]
- McCartney, M.P.; Whiting, L.; Makin, I.; Lankford, B.A.; Ringler, C.; McCartney, M.P.; Whiting, L.; Makin, I.; Lankford, B.A.; Ringler, C. Rethinking Irrigation Modernisation: Realising Multiple Objectives through the Integration of Fisheries. Mar. Freshw. Res. 2019, 70, 1201–1210. [Google Scholar] [CrossRef] [Green Version]
- Dalin, C.; Taniguchi, M.; Green, T.R. Unsustainable Groundwater Use for Global Food Production and Related International Trade. Glob. Sustain. 2019, 2, e12. [Google Scholar] [CrossRef] [Green Version]
- Boretti, A.; Rosa, L. Reassessing the Projections of the World Water Development Report. NPJ Clean Water 2019, 2, 1–6. [Google Scholar] [CrossRef]
- Flörke, M.; Schneider, C.; McDonald, R.I. Water Competition between Cities and Agriculture Driven by Climate Change and Urban Growth. Nat. Sustain. 2018, 1, 51–58. [Google Scholar] [CrossRef]
- Giordano, M.; Scheierling, S.M.; Tréguer, D.O.; Turral, H.; McCornick, P.G. Moving beyond ‘More Crop per Drop’: Insights from Two Decades of Research on Agricultural Water Productivity. Null 2021, 37, 137–161. [Google Scholar] [CrossRef]
- MacDonald, G.K.; D’Odorico, P.; Seekell, D.A. Pathways to Sustainable Intensification through Crop Water Management. Environ. Res. Lett. 2016, 11, 091001. [Google Scholar] [CrossRef]
- Grassini, P.; Eskridge, K.M.; Cassman, K.G. Distinguishing between Yield Advances and Yield Plateaus in Historical Crop Production Trends. Nat. Commun. 2013, 4, 2918. [Google Scholar] [CrossRef]
- Davis, K.F.; Rulli, M.C.; Garrassino, F.; Chiarelli, D.; Seveso, A.; D’Odorico, P. Water Limits to Closing Yield Gaps. Adv. Water Resour. 2017, 99, 67–75. [Google Scholar] [CrossRef] [Green Version]
- Grogan, D.S.; Wisser, D.; Prusevich, A.; Lammers, R.B.; Frolking, S. The Use and Re-Use of Unsustainable Groundwater for Irrigation: A Global Budget. Environ. Res. Lett. 2017, 12, 034017. [Google Scholar] [CrossRef]
- Jaramillo, S.; Graterol, E.; Pulver, E. Sustainable Transformation of Rainfed to Irrigated Agriculture Through Water Harvesting and Smart Crop Management Practices. Front. Sustain. Food Syst. 2020, 4, 193. [Google Scholar] [CrossRef]
- Zhao, X.; Liu, J.; Liu, Q.; Tillotson, M.R.; Guan, D.; Hubacek, K. Physical and Virtual Water Transfers for Regional Water Stress Alleviation in China. Proc. Natl. Acad. Sci. USA 2015, 112, 1031–1035. [Google Scholar] [CrossRef] [PubMed] [Green Version]
- Seekell, D.A.; D’Odorico, P.; Pace, M.L. Virtual Water Transfers Unlikely to Redress Inequality in Global Water Use. Environ. Res. Lett. 2011, 6, 024017. [Google Scholar] [CrossRef]
- Ray, C.; McInnes, D.; Sanderson, M. Virtual Water: Its Implications on Agriculture and Trade. Water Int. 2018, 43, 717–730. [Google Scholar] [CrossRef] [Green Version]
- Rogers, S.; Chen, D.; Jiang, H.; Rutherfurd, I.; Wang, M.; Webber, M.; Crow-Miller, B.; Barnett, J.; Finlayson, B.; Jiang, M.; et al. An Integrated Assessment of China’s South—North Water Transfer Project. Geogr. Res. 2020, 58, 49–63. [Google Scholar] [CrossRef]
- Dong, H.; Geng, Y.; Hao, D.; Yu, Y.; Chen, Y. Virtual Water Flow Feature of Water-Rich Province and the Enlightenments: Case of Yunnan in China. J. Clean. Prod. 2019, 235, 328–336. [Google Scholar] [CrossRef]
- Zabel, F.; Delzeit, R.; Schneider, J.M.; Seppelt, R.; Mauser, W.; Václavík, T. Global Impacts of Future Cropland Expansion and Intensification on Agricultural Markets and Biodiversity. Nat. Commun. 2019, 10, 2844. [Google Scholar] [CrossRef] [Green Version]
- Zhao, X.; Liu, J.; Yang, H.; Duarte, R.; Tillotson, M.R.; Hubacek, K. Burden Shifting of Water Quantity and Quality Stress from Megacity Shanghai. Water Resour. Res. 2016, 52, 6916–6927. [Google Scholar] [CrossRef]
- Palazzo, A.; Valin, H.J.P.; Batka, M.; Havlík, P. Investment Needs for Irrigation Infrastructure along Different Socioeconomic Pathways. In Policy Research Working Papers; The World Bank: Washington, DC, USA, 2019. [Google Scholar]
- Jägermeyr, J.; Pastor, A.; Biemans, H.; Gerten, D. Reconciling Irrigated Food Production with Environmental Flows for Sustainable Development Goals Implementation. Nat. Commun. 2017, 8, 15900. [Google Scholar] [CrossRef] [Green Version]
- Rosa, L.; Chiarelli, D.D.; Sangiorgio, M.; Beltran-Peña, A.A.; Rulli, M.C.; D’Odorico, P.; Fung, I. Potential for Sustainable Irrigation Expansion in a 3 °C Warmer Climate. Proc. Natl. Acad. Sci. USA 2020, 117, 29526–29534. [Google Scholar] [CrossRef]
- Kemeze, F.H. Economic Valuation of Supplemental Irrigation via Small-Scale Water Harvesting. Water Resour. Econ. 2020, 31, 100160. [Google Scholar] [CrossRef]
- Wani, S.P.; Rockström, J.; Oweis, T.Y. International Crops Research Institute for the Semi-Arid Tropics; International Water Management Institute. In Rainfed Agriculture: Unlocking the Potential; CABI: Wallingford, UK; Cambridge, MA, USA, 2009; ISBN 978-1-84593-389-0. [Google Scholar]
- Bigelow, D.P.; Zhang, H. Supplemental Irrigation Water Rights and Climate Change Adaptation. Ecol. Econ. 2018, 154, 156–167. [Google Scholar] [CrossRef]
- Dell’Angelo, J.; Rulli, M.C.; D’Odorico, P. The Global Water Grabbing Syndrome. Ecol. Econ. 2018, 143, 276–285. [Google Scholar] [CrossRef]
- Hussain, I.; Hanjra, M.A. Irrigation and Poverty Alleviation: Review of the Empirical Evidence. Irrig. Drain. 2004, 53, 1–15. [Google Scholar] [CrossRef]
- Jägermeyr, J.; Gerten, D.; Schaphoff, S.; Heinke, J.; Lucht, W.; Rockström, J. Integrated Crop Water Management Might Sustainably Halve the Global Food Gap. Environ. Res. Lett. 2016, 11, 025002. [Google Scholar] [CrossRef]
- Kroll, C.; Warchold, A.; Pradhan, P. Sustainable Development Goals (SDGs): Are We Successful in Turning Trade-Offs into Synergies? Palgrave Commun 2019, 5, 1–11. [Google Scholar] [CrossRef] [Green Version]
- LaFevor, M.C.; Ponette-González, A.G.; Larson, R.; Mungai, L.M. Spatial Targeting of Agricultural Support Measures: Indicator-Based Assessment of Coverages and Leakages. Land 2021, 10, 740. [Google Scholar] [CrossRef]
- Wood, S.; Sebastian, K.; Nachtergaele, F.; Nielsen, D.; Dai, A. Spatial Aspects of the Design and Targeting of Agricultural Development Strategies; International Food Policy Research Institute (IFPRI): Washginton, DC, USA, 1999; p. 85. [Google Scholar]
- Allain, S.; Ndong, G.O.; Lardy, R.; Leenhardt, D. Integrated Assessment of Four Strategies for Solving Water Imbalance in an Agricultural Landscape. Agron. Sustain. Dev. 2018, 38, 60. [Google Scholar] [CrossRef] [Green Version]
- Pereira, L.S. Water, Agriculture and Food: Challenges and Issues. Water Resour. Manag. 2017, 31, 2985–2999. [Google Scholar] [CrossRef]
- Blanco-Gutiérrez, I.; Varela-Ortega, C.; Purkey, D.R. Integrated Assessment of Policy Interventions for Promoting Sustainable Irrigation in Semi-Arid Environments: A Hydro-Economic Modeling Approach. J. Environ. Manag. 2013, 128, 144–160. [Google Scholar] [CrossRef] [Green Version]
- Vallino, E.; Ridolfi, L.; Laio, F. Measuring Economic Water Scarcity in Agriculture: A Cross-Country Empirical Investigation. Environ. Sci. Policy 2020, 114, 73–85. [Google Scholar] [CrossRef]
- Giordano, M.; Barron, J.; Ünver, O. Water Scarcity and Challenges for Smallholder Agriculture. In Sustainable Food and Agriculture; Elsevier: Amsterdam, The Netherlands, 2019; pp. 75–94. ISBN 978-0-12-812134-4. [Google Scholar]
- Wingfield, S.; Martínez-Moscoso, A.; Quiroga, D.; Ochoa-Herrera, V. Challenges to Water Management in Ecuador: Legal Authorization, Quality Parameters, and Socio-Political Responses. Water 2021, 13, 1017. [Google Scholar] [CrossRef]
- Cervantes-Jiménez, M.; Mastachi-Loza, C.A.; Díaz-Delgado, C.; Gómez-Albores, M.Á.; González-Sosa, E. Socio-Ecological Regionalization of the Urban Sub-Basins in Mexico. Water 2017, 9, 14. [Google Scholar] [CrossRef] [Green Version]
- Lançon, J.; Wery, J.; Rapidel, B.; Angokaye, M.; Gérardeaux, E.; Gaborel, C.; Ballo, D.; Fadegnon, B. An Improved Methodology for Integrated Crop Management Systems. Agron. Sustain. Dev. 2007, 27, 101–110. [Google Scholar] [CrossRef]
- Hammond, J.; Rosenblum, N.; Breseman, D.; Gorman, L.; Manners, R.; van Wijk, M.T.; Sibomana, M.; Remans, R.; Vanlauwe, B.; Schut, M. Towards Actionable Farm Typologies: Scaling Adoption of Agricultural Inputs in Rwanda. Agric. Syst. 2020, 183, 102857. [Google Scholar] [CrossRef]
- Kuivanen, K.S.; Alvarez, S.; Michalscheck, M.; Adjei-Nsiah, S.; Descheemaeker, K.; Mellon-Bedi, S.; Groot, J.C.J. Characterising the Diversity of Smallholder Farming Systems and Their Constraints and Opportunities for Innovation: A Case Study from the Northern Region, Ghana. NJAS Wagening. J. Life Sci. 2016, 78, 153–166. [Google Scholar] [CrossRef]
- Frelat, R.; Lopez-Ridaura, S.; Giller, K.E.; Herrero, M.; Douxchamps, S.; Djurfeldt, A.A.; Erenstein, O.; Henderson, B.; Kassie, M.; Paul, B.K.; et al. Drivers of Household Food Availability in Sub-Saharan Africa Based on Big Data from Small Farms. Proc. Natl. Acad. Sci. USA 2016, 113, 458–463. [Google Scholar] [CrossRef] [Green Version]
- Guarín, A.; Rivera, M.; Pinto-Correia, T.; Guiomar, N.; Šūmane, S.; Moreno-Pérez, O.M. A New Typology of Small Farms in Europe. Glob. Food Secur. 2020, 26, 100389. [Google Scholar] [CrossRef]
- Tittonell, P.; Bruzzone, O.; Solano-Hernández, A.; López-Ridaura, S.; Easdale, M.H. Functional Farm Household Typologies through Archetypal Responses to Disturbances. Agric. Syst. 2020, 178, 102714. [Google Scholar] [CrossRef]
- Alvarez, S.; Timler, C.J.; Michalscheck, M.; Paas, W.; Descheemaeker, K.; Tittonell, P.; Andersson, J.A.; Groot, J.C.J. Capturing Farm Diversity with Hypothesis-Based Typologies: An Innovative Methodological Framework for Farming System Typology Development. PLoS ONE 2018, 13, e0194757. [Google Scholar] [CrossRef] [Green Version]
- INEGI, (Instituto Nacional de Estadística y Geografía El VIII Censo Agrícola, Ganadero y Forestal 2007: Aspectors Metodológicos y Principales Resultados. Available online: https://www.inegi.org.mx/programas/cagf/2007/ (accessed on 27 March 2020).
- DOF. Programa Nacional Hidrico, 2020–2024; Diario Oficial de la Federación (DOF): Ciudad de México, Mexico, 2020. [Google Scholar]
- FAO AQUASTAT-FAO’s Global Information System on Water and Agriculture. Available online: http://www.fao.org/aquastat/en/ (accessed on 4 July 2021).
- CONAGUA. Estadísticas de agua en México, edición 2018; Comisión Nacional de Agua: Ciudad de México, Mexico, 2018. [Google Scholar]
- LaFevor, M.C.; Magliocca, N.R. Farmland Size, Chemical Fertilizers, and Irrigation Management Effects on Maize and Wheat Yield in Mexico. J. Land Use Sci. 2020, 15, 532–546. [Google Scholar] [CrossRef]
- Arreguín-Cortes, F.I.A.; Villanueva, N.H.G.; Casillas, A.G.; Gonzalez, J.A.G. Reforms in the Administration of Irrigation Systems: Mexican Experiences. Irrig. Drain. 2019, 68, 6–19. [Google Scholar] [CrossRef]
- Turrent-Fernández, A. El Potencial Productivo Del Maíz. Ciencias 2009, 92, 126–129. [Google Scholar]
- Turrent-Fernández, A.T.; Gómez, R.C.; Luna, A.L.; Almaguer, M.C.; Silva, J.R.; Méndez, J.M.; Caballero, A.P. Producción de Maíz Bajo Riego En El Sur-Sureste de México: I. Análisis Agronómico. Agric. Técnica En México 2004, 30, 153–167. [Google Scholar]
- Neri, C.; Magaña, V. Estimation of Vulnerability and Risk to Meteorological Drought in Mexico. Weather Clim. Soc. 2016, 8, 95–110. [Google Scholar] [CrossRef]
- Turrent-Fernández, A.; Cortés-Flores, J.I.; Espinosa-Calderón, A.; Turrent-Thompson, C.; Mejía-Andrade, H. Cambio Climático y Algunas Estrategias Agrícolas Para Fortalecer La Seguridad Alimentaria de México. Rev. Mex. De Cienc. Agrícolas 2016, 7, 1727–1739. [Google Scholar] [CrossRef] [Green Version]
- López-Morales, C.; Duchin, F. Policies and Technologies for a Sustainable Use of Water in Mexico: A Scenario Analysis. Econ. Syst. Res. 2011, 23, 387–407. [Google Scholar] [CrossRef]
- SIAP. Estadística de la Producción Agrícola (2002–2006); Servicio de Información Agroalimentaría y Pesquera; Secretaría de Agricultura y Desarrollo Rural: Mexico City, Mexico, 2020. [Google Scholar]
- CONAPO. Indice de Marginación por Município 2005; Consejo Nacional de Población: Ciudad de México (CDMX), Mexico, 2020. [Google Scholar]
- Teixeira, H.M.; Van den Berg, L.; Cardoso, I.M.; Vermue, A.J.; Bianchi, F.J.J.A.; Peña-Claros, M.; Tittonell, P. Understanding Farm Diversity to Promote Agroecological Transitions. Sustainability 2018, 10, 4337. [Google Scholar] [CrossRef] [Green Version]
- Samberg, L.H.; Gerber, J.S.; Ramankutty, N.; Herrero, M.; West, P.C. Subnational Distribution of Average Farm Size and Smallholder Contributions to Global Food Production. Environ. Res. Lett. 2016, 11, 124010. [Google Scholar] [CrossRef]
- Pinzón Florez, C.E.; Reveiz, L.; Idrovo, A.J.; Reyes Morales, H. Gasto en salud, la desigualdad en el ingreso y el índice de marginación en el sistema de salud de México. Rev. Panam. Salud. Publica 2014, 35, 1–7. [Google Scholar] [PubMed]
- Cortés, F.; Vargas, D. Marginación En México a Través Del Tiempo: A Propósito Del Índice de Conapo. Estud. Sociológicos 2011, 29, 361–387. [Google Scholar]
- García Chong, N.R.; Salvatierra Izaba, B.; Trujillo Olivera, L.E.; Zúñiga Cabrera, M. Mortalidad infantil, pobreza y marginación en indígenas de los altos de Chiapas, México. Ra Ximhai 2010, 115–130. [Google Scholar] [CrossRef]
- Kaiser, H.F. The Application of Electronic Computers to Factor Analysis. Educ. Psychol. Meas. 1960, 20, 141–151. [Google Scholar] [CrossRef]
- Otazo-Sánchez, E.M.; Navarro-Frómeta, A.E. Water at a Glance in Mexico. In Water Availability and Management in Mexico; Available online: https://doi-org.libdata.lib.ua.edu/10.1007/978-3-030-24962-5_1 (accessed on 27 March 2020).
- Turrent-Fernández, A.; Wise, T.A.; Garvey, E. Achieving Mexico’s Maize Potential; Global Development and Environment Institute of Tufts University: Medford, MA, USA, 2012; p. 40. [Google Scholar]
- SEMARNAT. Nationally Determined Contributions. 2020 Update; Government of Mexico, Ministry of Environment and Natural Resources (SEMARNAT): Mexico City, Mexico, 2020; p. 42. [Google Scholar]
- Ríos-Carmenado, I.D.; Díaz-Puente, J.M.; Cadena-Iñiguez, J. La iniciativa LEADER como modelo de desarrollo rural: Aplicación a algunos territorios de México. Agrociencia 2011, 45, 609–624. [Google Scholar]
- DOF. Ley de Desarrollo Rural Sostenible. Secretaría de Agricultura, Ganadería, Pesca y Alimenta (SAGARPA); Diario Oficial de la Federación (DOF): Ciudad de México, Mexico, 2001. [Google Scholar]
- Morgera, E.; Webster, E.; Hamley, G.; Sindico, F.; Robbie, J.; Switzer, S.; Berger, T.; Silva Sànchez, P.P.; Lennan, M.; Martin-Nagle, R. The Right to Water for Food and Agriculture; FAO Legislative Studies; Food and Agriculture Organization of the United Nations (FAO): Rome, Italy, 2020; ISBN 92-5-132301-1. [Google Scholar]
- Wilder, M.; Austria, P.F.M.; Romero, P.H.; Ayala, M.B.C. The Human Right to Water in Mexico: Challenges and Opportunities. Water Altern. 2020, 13, 28–48. [Google Scholar]
- Galeana-Pizaña, J.M.; Couturier, S.; Figueroa, D.; Jiménez, A.D. Is rural food security primarily associated with smallholder agriculture or with commercial agriculture?: An approach to the case of Mexico using structural equation modeling. Agric. Syst. 2021, 290, 103091. [Google Scholar] [CrossRef]
- Silva, G. Feeding the World in 2050 and Beyond-Part 1: Productivity Challenges. Mich. State Univ. Ext. –3 Dec. 2018. Available online: https://www.canr.msu.edu/news/feeding-the-world-in-2050-and-beyond-part-1 (accessed on 29 August 2021).
- WBG. Water in Agriculture. Available online: https://www.worldbank.org/en/topic/water-in-agriculture (accessed on 21 July 2021).
- Kampas, A.; Rozakis, S. On the Scarcity Value of Irrigation Water: Juxtaposing Two Market Estimating Approaches. Water Resour. Manag. 2017, 31, 1257–1269. [Google Scholar] [CrossRef]
- Lee, H.N. Access Regimes and Irrigation Technology: Where Does the Water Soft Path for Agriculture Lead? Ph.D. Thesis, Texas A&M University, College Station, TX, USA, 2016. [Google Scholar]
- Gleick, P.H. Global Freshwater Resources: Soft-Path Solutions for the 21st Century. Science 2003, 302, 1524–1528. [Google Scholar] [CrossRef] [Green Version]
- Wolfe, S.E.; Brooks, D.B. Mortality Awareness and Water Decisions: A Social Psychological Analysis of Supply-Management, Demand-Management and Soft-Path Paradigms. Water Int. 2017, 42, 1–17. [Google Scholar] [CrossRef]
- Rosa, L.; Chiarelli, D.D.; Tu, C.; Rulli, M.C.; D’Odorico, P. Global Unsustainable Virtual Water Flows in Agricultural Trade. Environ. Res. Lett. 2019, 14, 114001. [Google Scholar] [CrossRef]
- Crow-Miller, B.; Webber, M.; Molle, F. The (Re)Turn to Infrastructure for Water Management? Water Altern. 2017, 10, 13. [Google Scholar]
- Brooks, D.B.; Brandes, O.M. Why a Water Soft Path, Why Now and What Then? Int. J. Water Resour. Dev. 2011, 27, 315–344. [Google Scholar] [CrossRef]
- Katsiardi, P.; Manoli, E.; Karavitis, C.; Assimacopoulos, D. Scenario-Based Strategy Development for Integrated Water Management. Glob. NEST J. 2005, 7, 360–368. [Google Scholar]
- Wada, Y.; Gleeson, T.; Esnault, L. Wedge Approach to Water Stress. Nat. Geosci. 2014, 7, 615–617. [Google Scholar] [CrossRef]
- Sovacool, B.K. Hard and Soft Paths for Climate Change Adaptation. Clim. Policy 2011, 11, 1177–1183. [Google Scholar] [CrossRef]
- Hammond, J.; van Wijk, M.T.; Smajgl, A.; Ward, J.; Pagella, T.; Xu, J.; Su, Y.; Yi, Z.; Harrison, R.D. Farm Types and Farmer Motivations to Adapt: Implications for Design of Sustainable Agricultural Interventions in the Rubber Plantations of South West China. Agric. Syst. 2017, 154, 1–12. [Google Scholar] [CrossRef] [Green Version]
Figure 1.
(a) Score plot of first two principal components colored by farm type clusters (see also Figure 2 and Figure 3); (b) Loading plot of first two principal components illustrating relationships among farm characteristic variables. Colors refer to the four clusters (see also Figure 2, Figure 3 and Figure 4).

Figure 2.
Mexican municipalities in the study area colored by farm type clusters (K-means).

Figure 3.
Farm type clusters (K-means) in the study area by the mean percent of farms in each municipality with irrigation and the mean elevation (centroid) of municipalities. Boxed areas represent 95% means confidence intervals. Letters (a,b,c) for significant differences were determined using Kruskal–Wallis and Dunn’s post-hoc tests (non-parametric), and Pearson’s Chi-squared tests (proportional) (α = 0.05).

Figure 4.
Decision tree (CART) model illustrating the recursive partitioning (binary) of municipalities into ranked priority subgroups for targeting. Splitting criteria reflect four priority objectives of Mexico’s National Water Program. Splitting order and decision threshold values (Yes/No) follow sequential best fit (maximum separation between groups). Pathways to priority subgroups are ordered vertically to reflect priority ranking.


Table 1.
Farm characteristics of municipalities in the study area (SA) and outside the study area (OSA) in hectares (ha), percent cultivated area (%ha), percent of all farms (%fs), and yield (t ha−1). Abbreviations are used in figures/tables that follow. Letters (a,b) show significant difference comparisons between the groups using t-tests for parametric data, Mann–Whitney’s tests for non-parametric data, and Chi-square tests for proportions data (α = 0.05).
| Farm Characteristics | Mexico (Municipalities) | |||||||
|---|---|---|---|---|---|---|---|---|
| SA (n = 941) | OSA (n = 1514) | All (n = 2455) | ||||||
| Mean | SD | Mean | SD | Mean | SD | |||
| Land | ||||||||
| mean farm area (ha) (farmsz) | 4.93 | 5.76 | b | 15.43 | 37.41 | a | 11.39 | 29.99 |
| chemical fertilizer use (%ha) (chemfertz) | 0.20 | 0.22 | b | 0.35 | 0.28 | a | 0.29 | 0.27 |
| irrigation use (%fs) (irrign) | 0.08 | 0.15 | b | 0.26 | 0.28 | a | 0.19 | 0.25 |
| Labor | ||||||||
| hand tools (%fs) (hndtls) | 0.46 | 0.35 | a | 0.19 | 0.29 | b | 0.29 | 0.35 |
| mechanized (%fs) (mechn) | 0.13 | 0.21 | b | 0.43 | 0.30 | a | 0.32 | 0.31 |
| draft animals (%fs) (drftanims) | 0.19 | 0.26 | a | 0.18 | 0.20 | b | 0.19 | 0.23 |
| Production | ||||||||
| subsistence (%fs) (subsist) | 0.84 | 0.17 | a | 0.65 | 0.27 | b | 0.72 | 0.25 |
| commercial (%fs) (comm) | 0.55 | 0.27 | a | 0.54 | 0.24 | a | 0.54 | 0.25 |
| feedstock (%fs) (feedstk) | 0.39 | 0.23 | a | 0.39 | 0.22 | a | 0.39 | 0.22 |
| maize yield (t ha−1) (maizyld) | 1.88 | 1.46 | b | 3.05 | 2.39 | a | 2.60 | 2.16 |
| Challenges to production | ||||||||
| financial (%fs) (finan.ch) | 0.20 | 0.21 | b | 0.22 | 0.19 | a | 0.22 | 0.20 |
| climate (%fs) (clim.ch) | 0.78 | 0.23 | a | 0.73 | 0.23 | b | 0.75 | 0.23 |
| Socioeconomic | ||||||||
| Indigenous membership (%fs) (indign) | 0.30 | 0.33 | a | 0.08 | 0.19 | b | 0.17 | 0.28 |
| marginalization index (margnl) | 0.60 | 0.90 | a | −0.38 | 0.87 | b | 0.00 | 1.00 |
Table 2.
Farm characteristics of municipalities in the study area stratified by farm type. Highest means appear in boldface and lowest means appear italicized. Letters (a,b,c,d) for significant differences were determined using ANOVA and Tukey post-hoc tests (normal distribution, homogenous variance), Kruskal–Wallis and Dunn’s post-hoc tests (non-parametric), and Pearson’s Chi-squared tests (proportional) (α = 0.05).
| Municipalities (n = 933) | ||||||||||||
|---|---|---|---|---|---|---|---|---|---|---|---|---|
| Lowlands | Midlands | Midlands (irr.) | Highlands | |||||||||
| (n = 246) | (n = 308) | (n = 134) | (n = 245) | |||||||||
| Mean | SD | Mean | SD | Mean | SD | Mean | SD | |||||
| hndtls | 0.53 | b | 0.27 | 0.80 | a | 0.18 | 0.17 | c | 0.24 | 0.14 | c | 0.19 |
| drftanims | 0.04 | c | 0.06 | 0.06 | c | 0.10 | 0.19 | b | 0.21 | 0.51 | a | 0.26 |
| comm. | 0.71 | a | 0.18 | 0.67 | a | 0.19 | 0.54 | b | 0.25 | 0.25 | c | 0.18 |
| irrign | 0.05 | bc | 0.08 | 0.03 | c | 0.05 | 0.34 | c | 0.24 | 0.06 | b | 0.09 |
| feedstk. | 0.48 | a | 0.18 | 0.51 | a | 0.19 | 0.34 | b | 0.20 | 0.16 | c | 0.13 |
| chemfertz | 0.14 | c | 0.16 | 0.04 | d | 0.07 | 0.29 | b | 0.23 | 0.39 | a | 0.23 |
| subsist | 0.67 | c | 0.18 | 0.91 | a | 0.11 | 0.81 | b | 0.18 | 0.93 | a | 0.09 |
| maizyld | 1.64 | b | 0.75 | 1.48 | c | 0.79 | 4.01 | a | 2.30 | 1.41 | c | 0.84 |
| farmsz | 9.16 | a | 6.28 | 3.97 | b | 2.60 | 3.06 | c | 2.09 | 2.47 | c | 1.33 |
| margnl | 0.04 | c | 0.72 | 1.25 | a | 0.74 | 0.08 | c | 0.76 | 0.66 | b | 0.73 |
| finan.ch | 0.38 | a | 0.20 | 0.16 | b | 0.16 | 0.17 | b | 0.21 | 0.10 | c | 0.15 |
| indign. | 0.07 | c | 0.14 | 0.50 | a | 0.33 | 0.22 | b | 0.28 | 0.33 | b | 0.35 |
| mechn | 0.23 | a | 0.24 | 0.02 | c | 0.07 | 0.28 | a | 0.28 | 0.10 | b | 0.16 |
| clim.ch | 0.62 | d | 0.25 | 0.83 | b | 0.18 | 0.73 | c | 0.25 | 0.89 | a | 0.15 |
Publisher’s Note: MDPI stays neutral with regard to jurisdictional claims in published maps and institutional affiliations. |
© 2021 by the authors. Licensee MDPI, Basel, Switzerland. This article is an open access article distributed under the terms and conditions of the Creative Commons Attribution (CC BY) license (https://creativecommons.org/licenses/by/4.0/).
Share and Cite
MDPI and ACS Style
LaFevor, M.C.; Frake, A.N.; Couturier, S. Targeting Irrigation Expansion to Address Sustainable Development Objectives: A Regional Farm Typology Approach. Water 2021, 13, 2393. https://doi.org/10.3390/w13172393
AMA Style
LaFevor MC, Frake AN, Couturier S. Targeting Irrigation Expansion to Address Sustainable Development Objectives: A Regional Farm Typology Approach. Water. 2021; 13(17):2393. https://doi.org/10.3390/w13172393
Chicago/Turabian StyleLaFevor, Matthew C., April N. Frake, and Stéphane Couturier. 2021. "Targeting Irrigation Expansion to Address Sustainable Development Objectives: A Regional Farm Typology Approach" Water 13, no. 17: 2393. https://doi.org/10.3390/w13172393
Note that from the first issue of 2016, this journal uses article numbers instead of page numbers. See further details here.