
Effects of Wildfires and Ash Leaching on Stream Chemistry in the Santa Ynez Mountains of Southern California
by
Carl Swindle
1,2, 
Parker Shankin-Clarke
3,
Matthew Meyerhof
4,
Jean Carlson
3,* and
John Melack
5,6 1
Department of Earth Science, University of California, Santa Barbara, CA 93106, USA
2
Geological and Planetary Sciences, California Institute of Technology, Pasadena, CA 91125, USA
3
Department of Physics, University of California, Santa Barbara, CA 93106, USA
4
Marine Science Institute, University of California, Santa Barbara, CA 93106, USA
5
Bren School of Environmental Science and Management, University of California, Santa Barbara, CA 93106, USA
6
Department of Ecology, Evolution, and Marine Biology, University of California, Santa Barbara, CA 93106, USA
*
Author to whom correspondence should be addressed.
Water 2021, 13(17), 2402; https://doi.org/10.3390/w13172402
Submission received: 8 July 2021
/
Revised: 25 August 2021
/
Accepted: 28 August 2021
/
Published: 31 August 2021
(This article belongs to the Section Water Quality and Contamination)
Abstract
:Wildfires can change ecosystems by altering solutes in streams. We examined major cations in streams draining a chaparral-dominated watershed in the Santa Ynez Mountains (California, USA) following a wildfire that burned 75 km2 from July 8 to October 5, 2017. We identified changes in solute concentrations, and postulated a relation between these changes and ash leached by rainwater following the wildfire. Collectively, K+ leached from ash samples exceeded that of all other major cations combined. After the wildfire, the concentrations of all major cations increased in stream water sampled near the fire perimeter following the first storm of the season: K+ increased 12-fold, Na+ and Ca2+ increased 1.4-fold, and Mg2+ increased 1.6-fold. Our results suggested that the 12-fold increase in K+ in stream water resulted from K+ leached from ash in the fire scar. Both C and N were measured in the ash samples. The low N content of the ash indicated either high volatilization of N relative to C occurred, or burned material contained less N.
1. Introduction
Depending on the ecosystem and climate [1,2], wildfires occur with varying frequency and severity, and have the potential to perturb the cycling of major cations (Mg2+, Ca2+, K+, and Na+) [1,3] and other elements that are essential for metabolic processes in plants [4,5,6,7,8,9,10], animals [11], fungi [12], and microbes [13]. Major cations can be introduced into a watershed by mineral weathering or atmospheric deposition [14,15]. Excesses and deficiencies in major cation content in soils can limit biological activity and growth [16].
When ecosystems burn, major cations and other nutrients can be volatilized during combustion, or removed from fire scars via erosion or leaching after burning [17]. Destruction of vegetation during burning enables the removal of nutrients from topsoil that were formerly held in place by plant coverage and shallow roots [18,19] and reduces biological uptake. Fire can reduce microbial populations in soil [20], diminishing nitrogen fixation [21]. After fires, ash remains on the soil surface. Water-soluble components can leach into the soil and be transported through runoff, and particulate residues can be transported via runoff and erosion [22,23] following precipitation.
Major cations released by combustion follow several pathways to streams: (1) dissolution of smoke and fine ash in precipitation, (2) erosion of ash and topsoil by wind and water from hillslopes to streams, and (3) leaching of major cations in ash on the soil surface by precipitation and by transport over or through the soil column by storm runoff or groundwater [17]. Fire can influence the extractability of major cations in surficial material such as ash and charred soil before and after a burn [23,24], and cause changes in major cations in stream water [25,26,27,28].
Previous studies found considerable variability in the impact of burning on major cation dynamics in stream water. Influences such as groundwater flushed by rainwater percolating through the soil column, solutes leached from burned material by surface waters, and elements extracted by weathering reactions in bedrock and sediment all contribute to major cation signatures observed in streams after burning. Determining which factors are responsible for changes in major cation concentrations in stream water after burning remains challenging. Additionally, while major cation concentrations may be considerably higher in runoff on burned slopes compared to unburned slopes, impacts on downstream concentrations may be masked by dilution from contributions to the stream water from unburned areas [29].
In this study, we examined major cations in post-wildfire conditions via a field study of montane watersheds in southern California, USA, a region with frequent wildfires. Significantly, this investigation collected and analyzed data shortly following a naturally occurring wildfire in a region, rather than designing an experiment to coincide with a pre-planned, controlled burn. Our focus was the 2017 Whittier Fire, one of numerous wildfires in the watersheds of the Santa Ynez Mountains sharing similar ecological, geological, atmospheric, and climatic characteristics [30]. Fire had not occurred in the study location for at least two decades prior to the Whittier Fire. Between 2007 and 2019, 10 major wildfires burned through the greater Santa Barbara area, where the fire season stretches from May through October or later, then is terminated by the onset of the rainy season, which typically is from November to April. Runoff from mountain slopes reaches the Pacific Ocean or inland reservoirs. The flows transport ash, litter, solutes, and, in some cases, large volumes of debris. The 2017 Thomas Fire was the largest fire in California history at the time, and occurred ~30 km from the Whittier Fire later in the same year. The first rain storm after the Thomas Fire triggered large debris flows in Montecito, California, from the fire scar. This led to numerous fatalities, destruction of property, and changes in ocean chemistry [31].
We measured the extractability of major cations in ash samples by rain water and major cation concentrations in stream water collected near the fire perimeter in El Capitan Creek before and after the first rain of the season. The upper section of the El Capitan Creek watershed was burned by the Whittier Fire. Additionally, we measured major cation concentrations sampled along a transect following the stream near and away from the fire perimeter to gauge the dilution effects on major cation signatures. These data were used to address three questions:
- To what extent is ash a factor in determining the major cation concentrations in nearby streams after wildfires following the first precipitation events?
- How do wildfires influence major cation concentrations in streams after storms?
- Downstream from the fire scar, are major cation concentrations lower than near the burn perimeter?
To address the first question, we assessed the relationship between ash and stream chemistry where rainfall, wind, or natural erosion would transport the ash to creeks. To determine the extent to which wildfires influence major cation concentrations in stream water after storms and whether ash is a factor in determining the major cation content in stream water after wildfires, samples of a transect of El Capitan Creek were collected downstream from a fire scar. In addition, we investigated the carbon and nitrogen content in the ash, and compared this content to extractable cations present in the samples.
Our findings suggested that wildfires increase the concentrations of all major cations in streams. We further propose a chief pathway for K+ outflux from the fire scar associated with leaching of ash and export via stream discharge.
2. Materials and Methods
2.1. Study Site
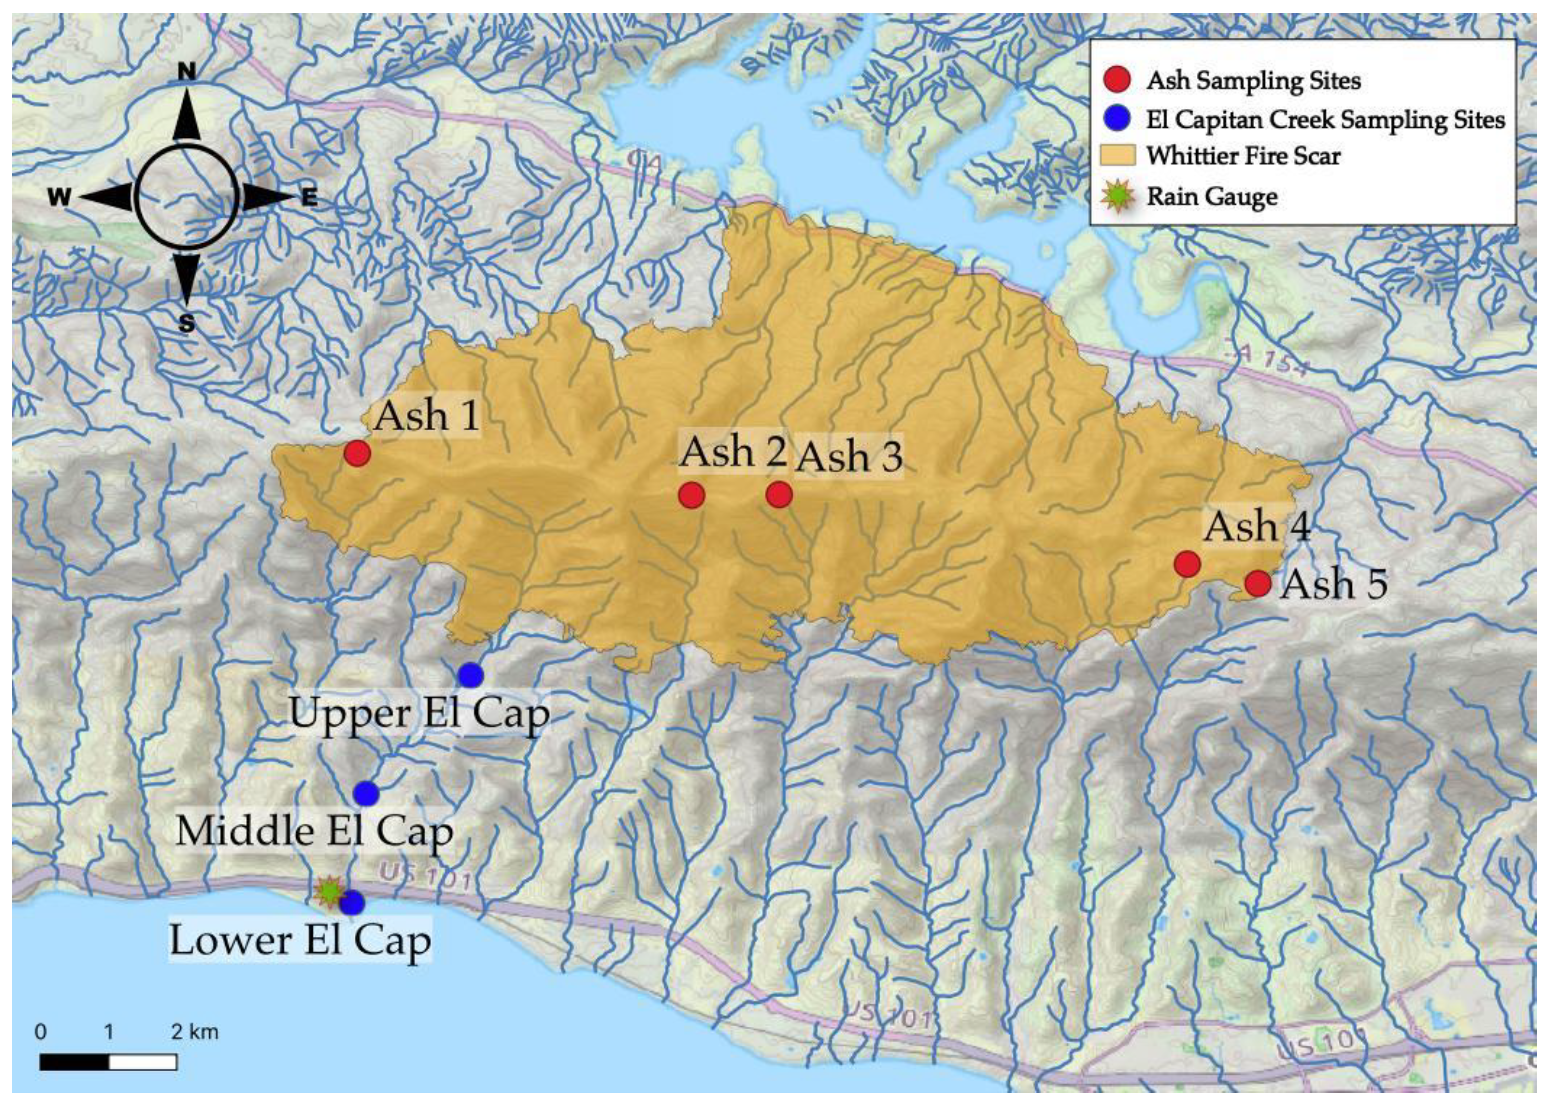
The study site was located in Santa Barbara County, California, along and below the south facing slopes of the Santa Ynez Mountains in chaparral-dominated watersheds that partially burned from 8 July to 5 October 2017, in the 75 km2 Whitter Fire [32] (Figure 1). Based on historical records, the typical fire cycle is 40–60 years [33]. In drier seasons, chaparral foliage with flammable resins and oils [34] are especially vulnerable to wind-driven wildfires.
El Capitan Creek originates on the south-facing slopes of the Santa Ynez Mountains, where the Whittier Fire burn scar overlaps its upper catchment. The stream is typical of those draining from mountainous headwaters to mildly sloping, narrow coastal plains and into the Santa Barbara Channel [37]. Solute transport from coastal watersheds is characterized by pulses driven by seasonal storms [38]. Approximately 3 km upstream from the coast, El Capitan Creek splits into an east fork and a west fork, each of which continue ~5 km to the ridge crest of the Santa Ynez Mountains. Prior to the first storm, no base flow was observed in the west fork, while discharge was perennial in the east fork.
The bedrock geology of the El Capitan Creek watershed consists of Cenozoic, arkosic sandstone, and shale units [39]. The creek forms channels in highly resistant bedrock, mixed channels with coarse alluvium including boulders in moderately resistant bedrock, and soft channels where no coarse alluvium or boulders are present with less-resistant bedrock [38,40]. The watershed is predominantly chaparral and shrublands in the headwaters to the north, and transitions to mostly grasslands downstream to the south, with riparian zones along stream channels throughout the watershed [31,41]. The region experiences a semiarid Mediterranean climate with cool, wet winters and warm, dry summers, and high interannual rainfall variability [37,38].
2.2. Ash Sampling
Post-fire and pre-storm ash samples were collected at five sites (Figure 1). No precipitation occurred between the fire and the time of the sampling. Ash samples were between <0.3 cm and 4 cm thick. Ash 1 to 3 were sampled on 1 October 2017, Ash 4 was sampled on 5 October 2017, and Ash 5 was sampled on 23 September 2017. Samples, which included ash and minor amounts of the underlying charred soil, were collected both at approximately regular spacings (Ash 1 to 4) and along transects (Ash 5).
When possible, samples were collected along line transects at evenly spaced intervals radiating from a point. Sampling along line transects has been shown to obtain optimal results for collections of heterogeneous material [42]. When ash coverage was limited or the terrain was too steep to set a transect, multiple grab samples were collected at approximately regular spacings. In each case, 5–15 samples, each consisting of 20–100 cm3 of ash, were collected and combined in a one-gallon bag. Samples were later transferred to polyethylene bottles, and subsamples were drawn from each sample for testing, 10 subsamples for the CN analysis and one from each site for the ash-leaching experiments.
2.3. Stream Water Sampling
Three sampling sites were selected based on their proximity to the fire scar (0.7 km, 3 km, and 5 km downstream from the burn perimeter; Figure 1). Upstream sampling at the upper site was conducted on the east fork of El Capitan Creek due to the presence of consistent base-flow throughout the dry season. Pre-storm sampling began at the Upper El Cap site on 21 October 2017 and continued on a weekly to biweekly basis. We did not sample during the storm, as debris flows would render the conditions hazardous. The first post-storm sample collected at the upper site was obtained ~1 week after the first major storm. Pre- and post-storm conditions of the Upper El Cap site are illustrated in Figure S1. The middle and lower sites were sampled once on 2 February 2018, and weekly from 11 March 2018 to 8 April 2018 following the beginning of the second major storm of the season. The upper site was sampled throughout the study (from 21 October 2017 to 8 April 2018).
Rainfall totals were obtained from the El Capitan precipitation gauge [43] located at 34°27′45″ N, 120°01′33″ W (~5 km from the upper site), ~1.6 km from the middle site, and ~0.4 km from the lower site. The total measured precipitation for the two major storms considered in this paper were 5.6 cm of precipitation from 3 January 2018 to 9 January 2018 (first storm, short-lived), and 18.3 cm of precipitation from 1 March 2018 to 22 March 2018 (second storm, long-lived) [43]. Discharge measurements were not made in El Capitan Creek and could not be estimated based on data from neighboring creeks because those with gauges had not burned.
Unfiltered stream water samples were collected in 250 mL polyethylene bottles that were rinsed with stream water three times at the sampling sites prior to collection. Following collection, bottles were stored at 4 °C prior to analysis.
2.4. Water and Ash Analyses
In order to simulate ash leaching into streams by precipitation, 500 mL of rainwater was used to leach ash samples. One ash sample from each of the five sites was analyzed. For each, a 10 g subsample was placed in a 500 mL polyethylene bottle, 500 mL of rainwater was added to each, and the bottles were shaken at 150 rpm for 24 h, and then left unshaken for another day. The major cation concentrations in the rainwater were all <0.10 ppm, which was substantially below levels measured in the leachate. The leaching measurements were designed to represent rainwater interacting with ash over the course of rainfall in one day. We could not validate that our leaching procedure replicated the natural conditions.
Major cation concentrations in stream water and ash-generated water samples were determined using a Thermo iCAP 6300 inductively coupled plasma (ICP) atomic emission spectrometer. Prior to measurement, samples were passed through a 1 μm filter and acidified with nitric acid. The sample uptake rate was set to 1.5 mL/min. The carrier gas flow was set to 0.5 L/min. A Burgener PTFE (polytetrafluoroethylene) Mira Mist nebulizer with hydrophilic coating was employed. The torch was set to radial view with a viewing height of 13 mm, and the RF power was set to 1150 W.
The total carbon (C) and nitrogen (N) weight percent (wt %) of the Ash 1 to 5 samples were determined using a CDC 440HA elemental analyzer with an atropine standard. The instrument determined total C and N by means of high-temperature (800–1000 °C) combustion (Dumas method) of approximately 8 to 16 milligrams of each sample in a helium-rich environment with bursts of O2 for combustion. For each of the five ash sites, 10 subsamples were analyzed. The combustion products CO2, NOX (reduced to N2), and H2O were separated by means of sequential, selective chemical traps, and measured with three pairs of high-precision thermal conductivity detectors. Interfering gases of halogens, as well as phosphorus, were removed in the combustion reactor using a quartz insert. Samples, which were precisely weighed in small aluminum capsules and loaded into a sealed carousel autosampler, were introduced into the combustion furnace. When combustion was complete, the residue was deposited in a waste chamber (also sealed under helium during the run), thus avoiding buildup of sample residue in the combustion tube. Results are reported in weight percent of the element. Uncertainties were estimated using the coefficient of variation determined from the atropine standard.
2.5. Precipitation Data
Precipitation data collected near the study site were obtained from an automated rain gauge, located at 34°27′45″ N, 120°1′32.9″ W, 38 m above sea-level [43].
3. Results
3.1. Field Observations
Within the fire scar, along the Santa Ynez Mountain ridgeline and in the El Capitan Creek watershed, ash was observed in ~1–100 m2 pockets and patchy blankets that ranged in depth from <0.3 cm to ~4 cm. Estimates from a 50 m transect indicated that ash covered ~60% of the surface area at the Ash 5 site. However, large portions of the fire scar had <1% ash cover. Ash accumulation was prevalent in small gullies on hillslopes, and was mostly observed in small patches around crevices between boulders and topsoil, small <1 m2 pockets on the soil surface, and large patches along hillslopes (Figure S2).
Precipitation events clustered in two major storms, referred to as the first major storm (inclusive of 6 January 2018) and the second major storm (inclusive of 10 March 2018) of the season. Observations at the Upper El Cap sampling site before and after the first storm suggested that erosion and channeling occurred at the Upper El Cap site, with substantial removal of rubble and vegetation after the first rainfall.
3.2. Carbon and Nitrogen in Ash Samples
Total nitrogen was low (0.0013–0.065 wt % when detectable; most of the measurements were below detection limits; Figure S3) relative to total carbon (~1–7 wt %; Figure S4) [44] (Table 1). Ash collected from site Ash 1 yielded the most nitrogen (0.0013–0.065 wt % when detectible) with 9 out of 10 subsamples yielding detectable nitrogen. Only 2 of the 10 ash subsamples from Ash 3 yielded detectable nitrogen, and 5 of the 10 ash subsamples from Ash 5 yielded detectable N. No nitrogen was detected in ash from Ash 2 and Ash 4 [44]. At site Ash 1, where carbon and nitrogen were both consistently present within detection limits, a moderate correlation (R2 = 0.49) was observed (Figure S5).
3.3. Major Cations
3.3.1. Major Cations Extracted from Ash
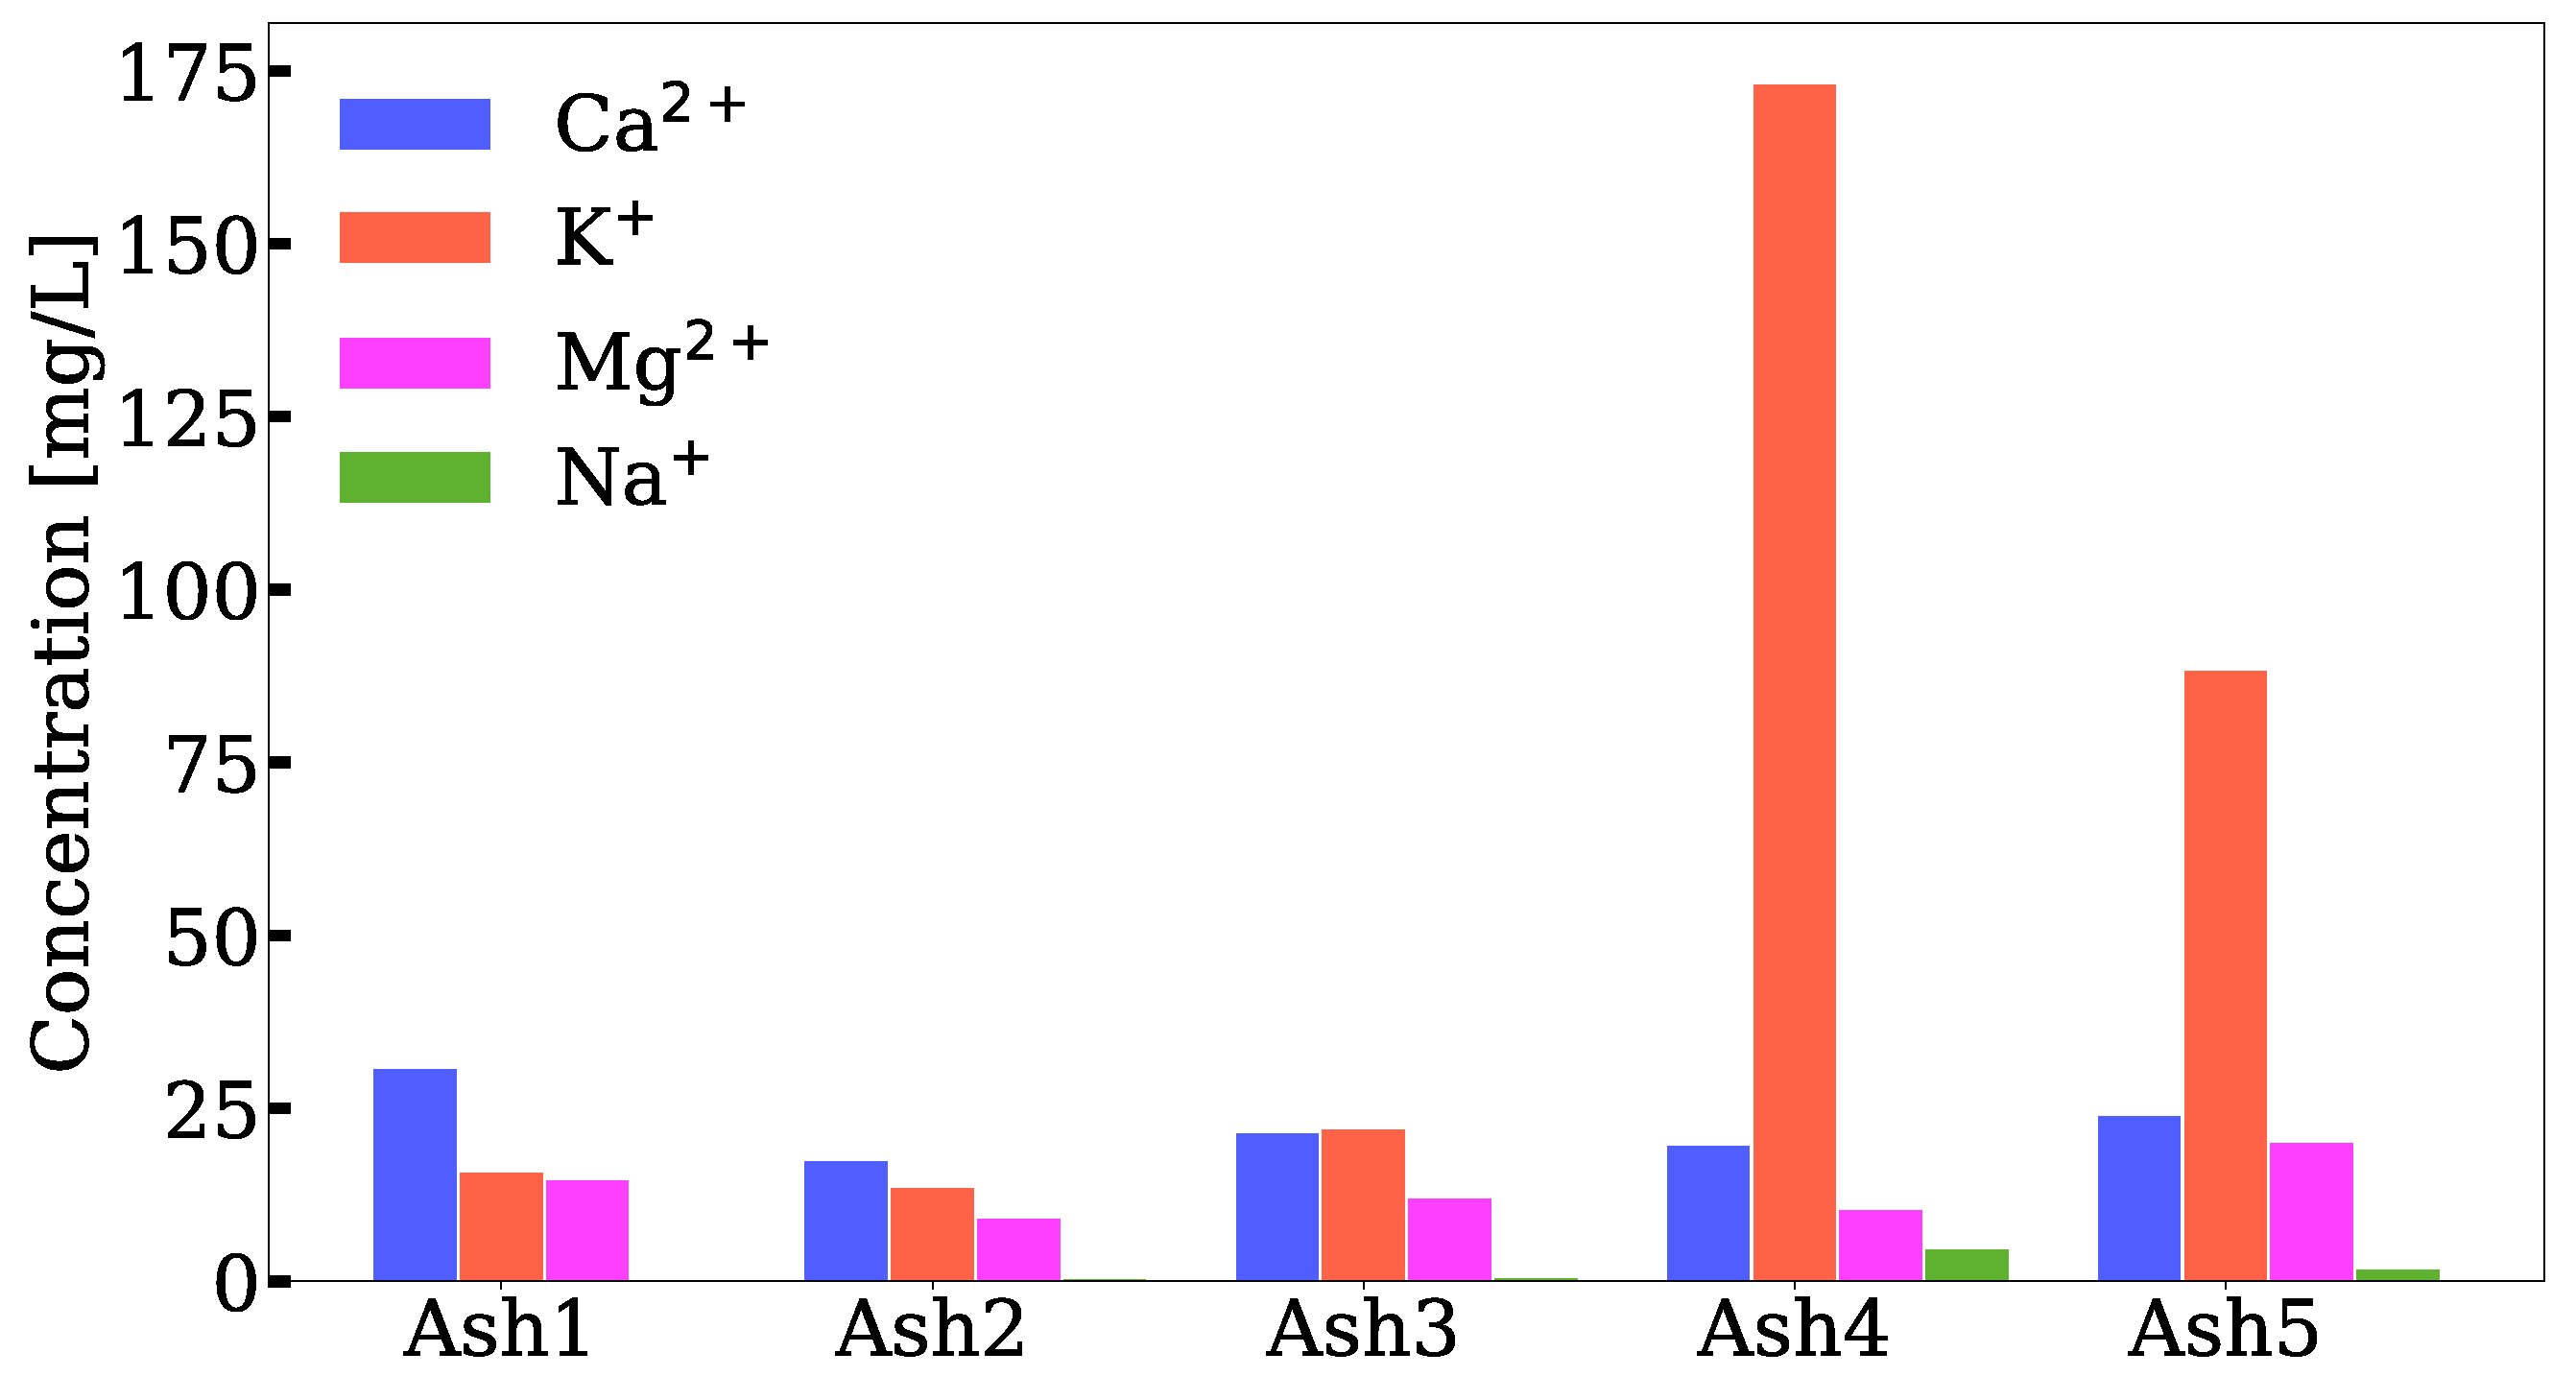
The amount of K+ extracted from sites Ash 4 and Ash 5 exceeded all other major cation measurements. More K+ was extracted from the Ash 4 and Ash 5 samples (173 mg/L and 89 mg/L, respectively) than the sum of all other major cations from Ash 4 and Ash 5 and all major cations extracted from Ash 1, Ash 2, and Ash 3 (Figure 2) [45]. Higher concentrations of K+ and Ca2+ were leached from the ash samples compared to Mg2+, and higher concentrations of K+, Ca2+, and Mg2+ were leached compared to Na+. Concentrations of K+ and Na+ leached from ash were correlated (R2 = 0.98, p < 0.0001; Figure S6). Twice the amount of Ca2+ was leached relative to Mg2+, with the exception of the Ash 5 site, where the amounts of leached Ca2+ and Mg2+ were approximately equal. Across all ash samples, the correlation between carbon and major cations extracted from ash was insignificant, with the exception of Mg2+ which exhibited a moderate correlation (R2 = 0.98; Figure S7).
3.3.2. Major Cations in El Capitan Creek
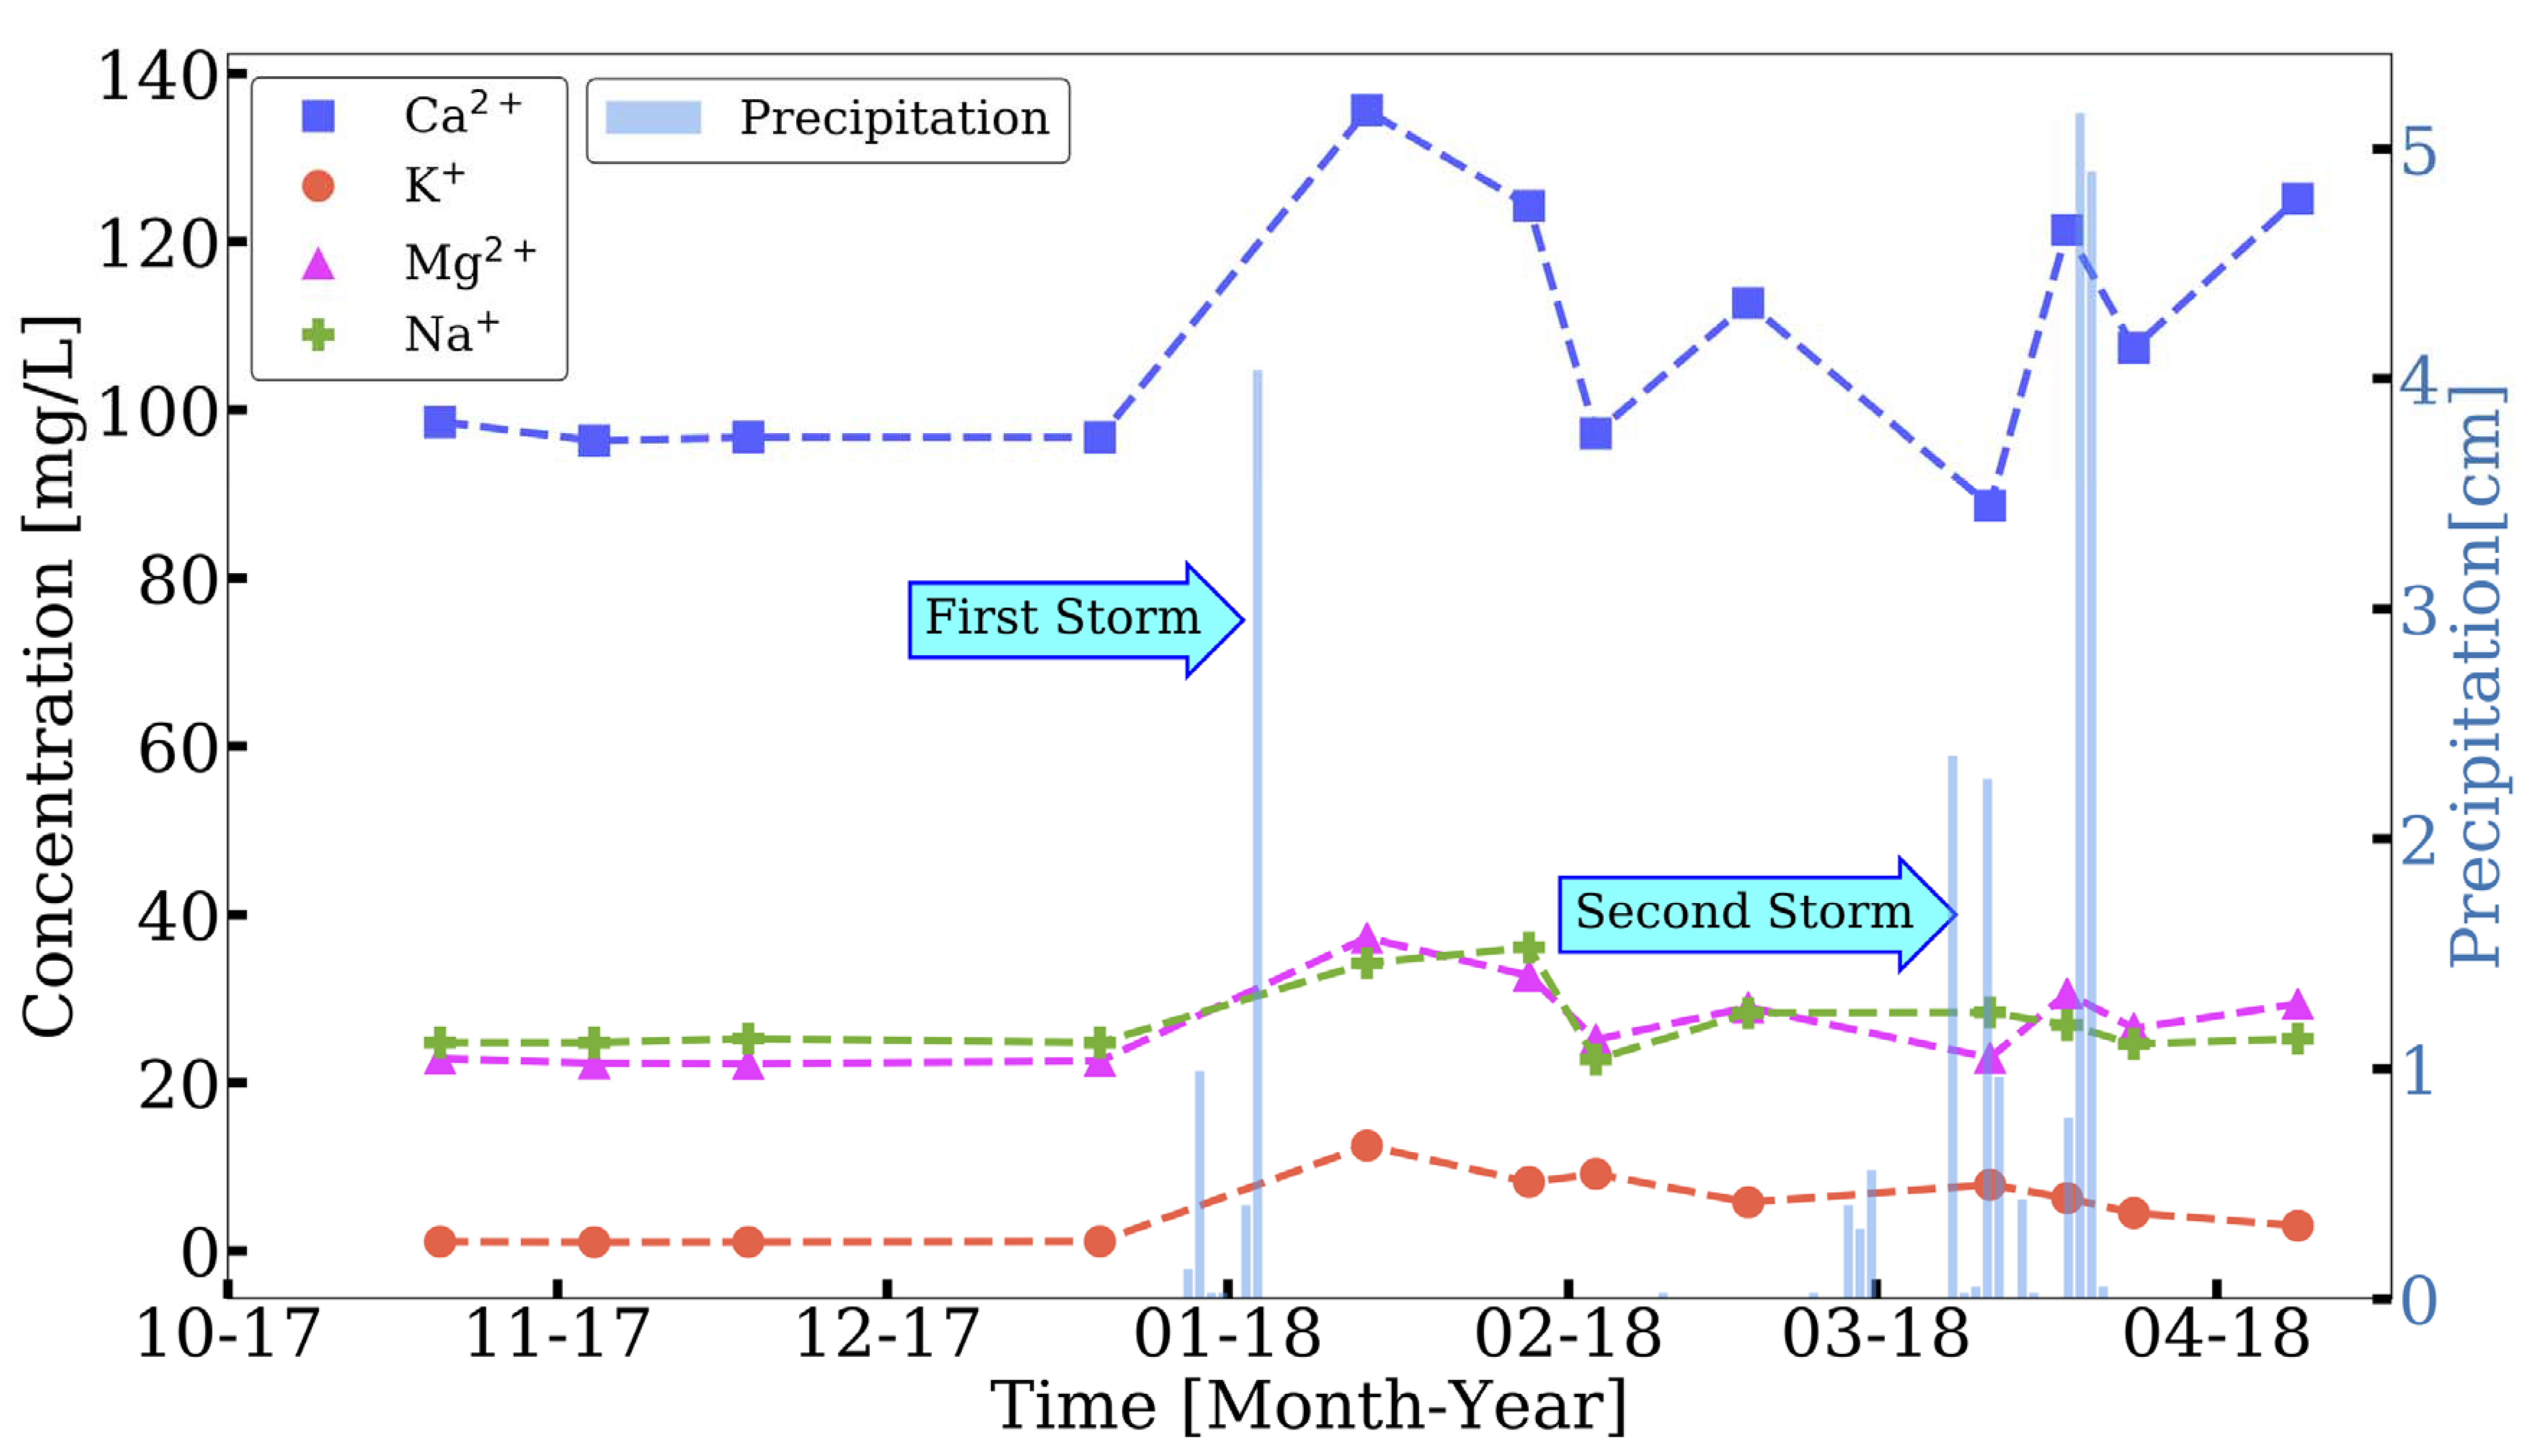
Pre-storm major cation concentrations were based on stream samples collected at the Upper El Cap site prior to the first major storm on four sampling dates: 21 October 2017, 4 November 2017, 18 November 2017, and 20 December 2017 [46] (Figure 3). Baseline major cation concentrations were obtained from the average of these measurements: Ca2+: 97 ± 1 mg/L; K+: 1.1 ± 0.1 mg/L; Mg2+: 22.5 ± 0.3 mg/L; and Na+: 24.8 ± 0.2 mg/L, expressed as the mean and standard deviation.
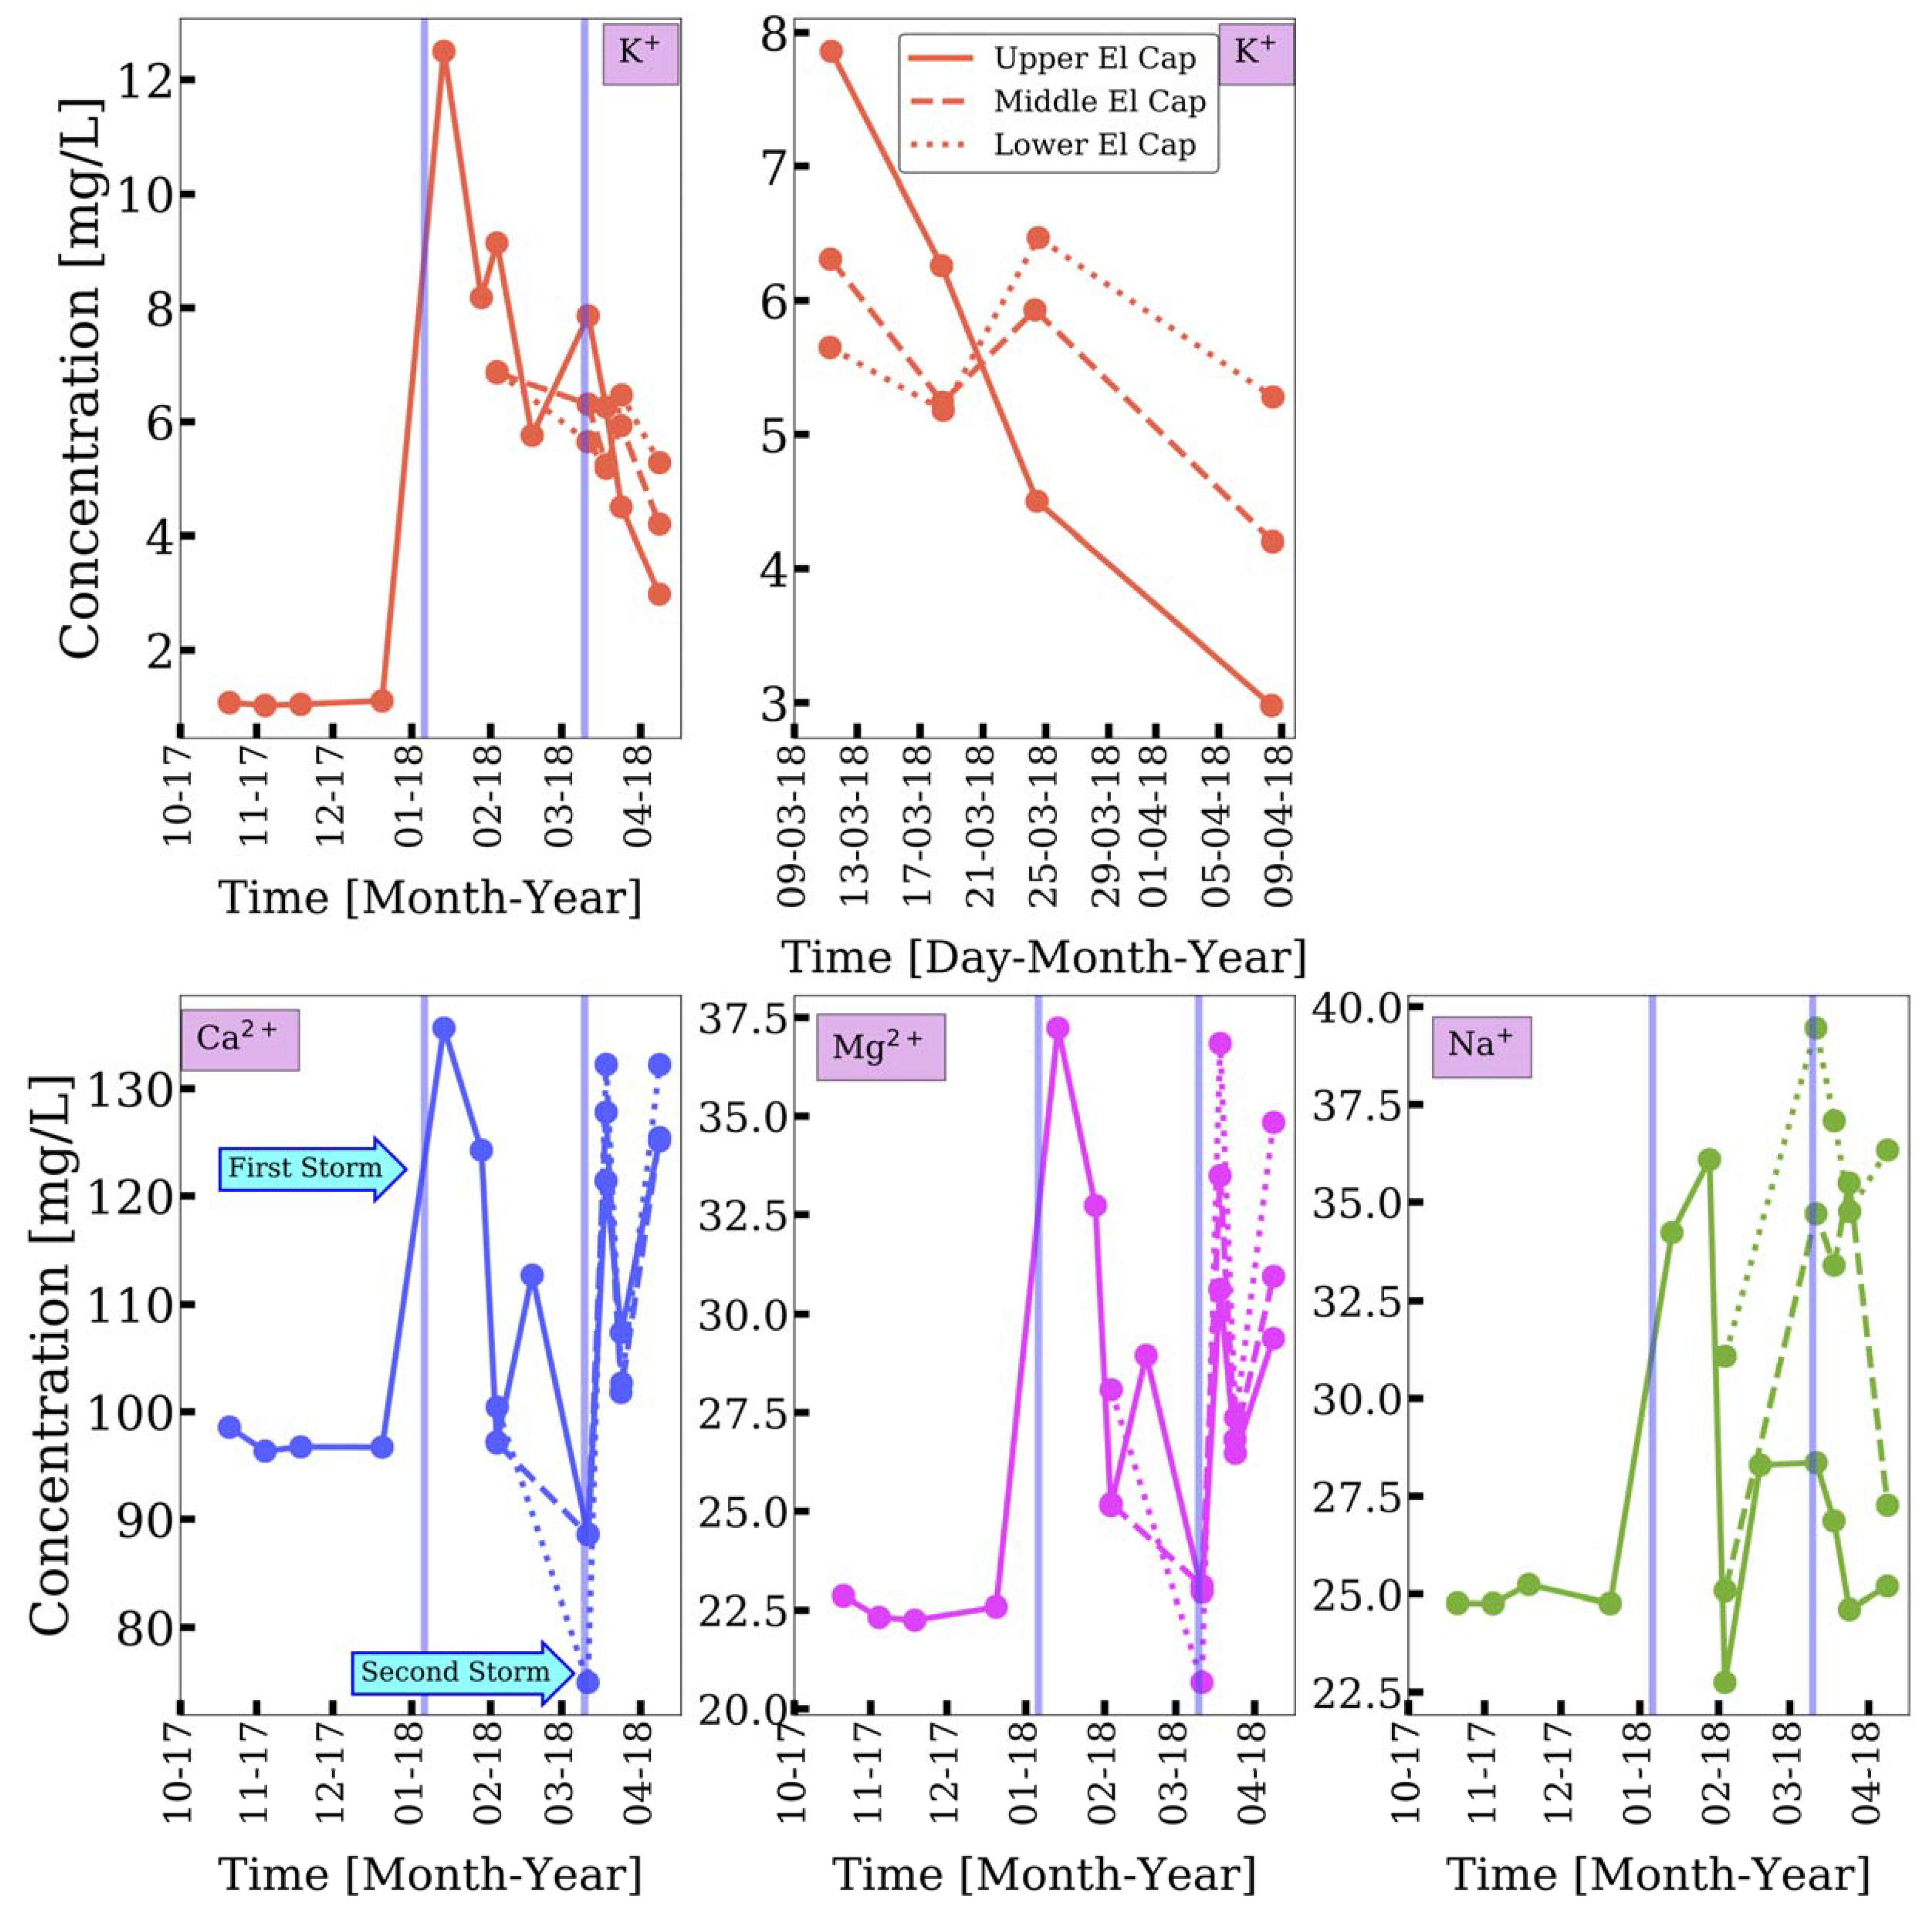
Concentrations of all major cations increased at the Upper El Cap site between 20 December 2017 and 13 January 2018, which corresponded to before and after the first major precipitation event of the season (Figure 3). Comparing measurements from 20 December 2017 and 13 January 2018, concentrations of Ca2+ increased from 96.7 mg/L to 135.6 mg/L, K+ increased from 1.1 mg/L to 12.5 mg/L, Mg2+ increased from 22.6 mg/L to 37.2 mg/L, and Na+ increased from 24.8 mg/L to 34.2 mg/L. After the second major storm at the Upper El Cap site, some major cation concentrations again increased relative to values just before that storm, but no increases in major cation concentrations beyond the peak values obtained on 13 January 2018 (after the first storm) were observed. After the first storm, the variability of Ca2+ concentrations remained high for the duration of the study (Figure S8). Mg2+ and Na+ reverted to concentrations similar to the pre-storm values several weeks after the first storm. In comparison, K+ levels remained elevated and declined gradually through the duration of our study.
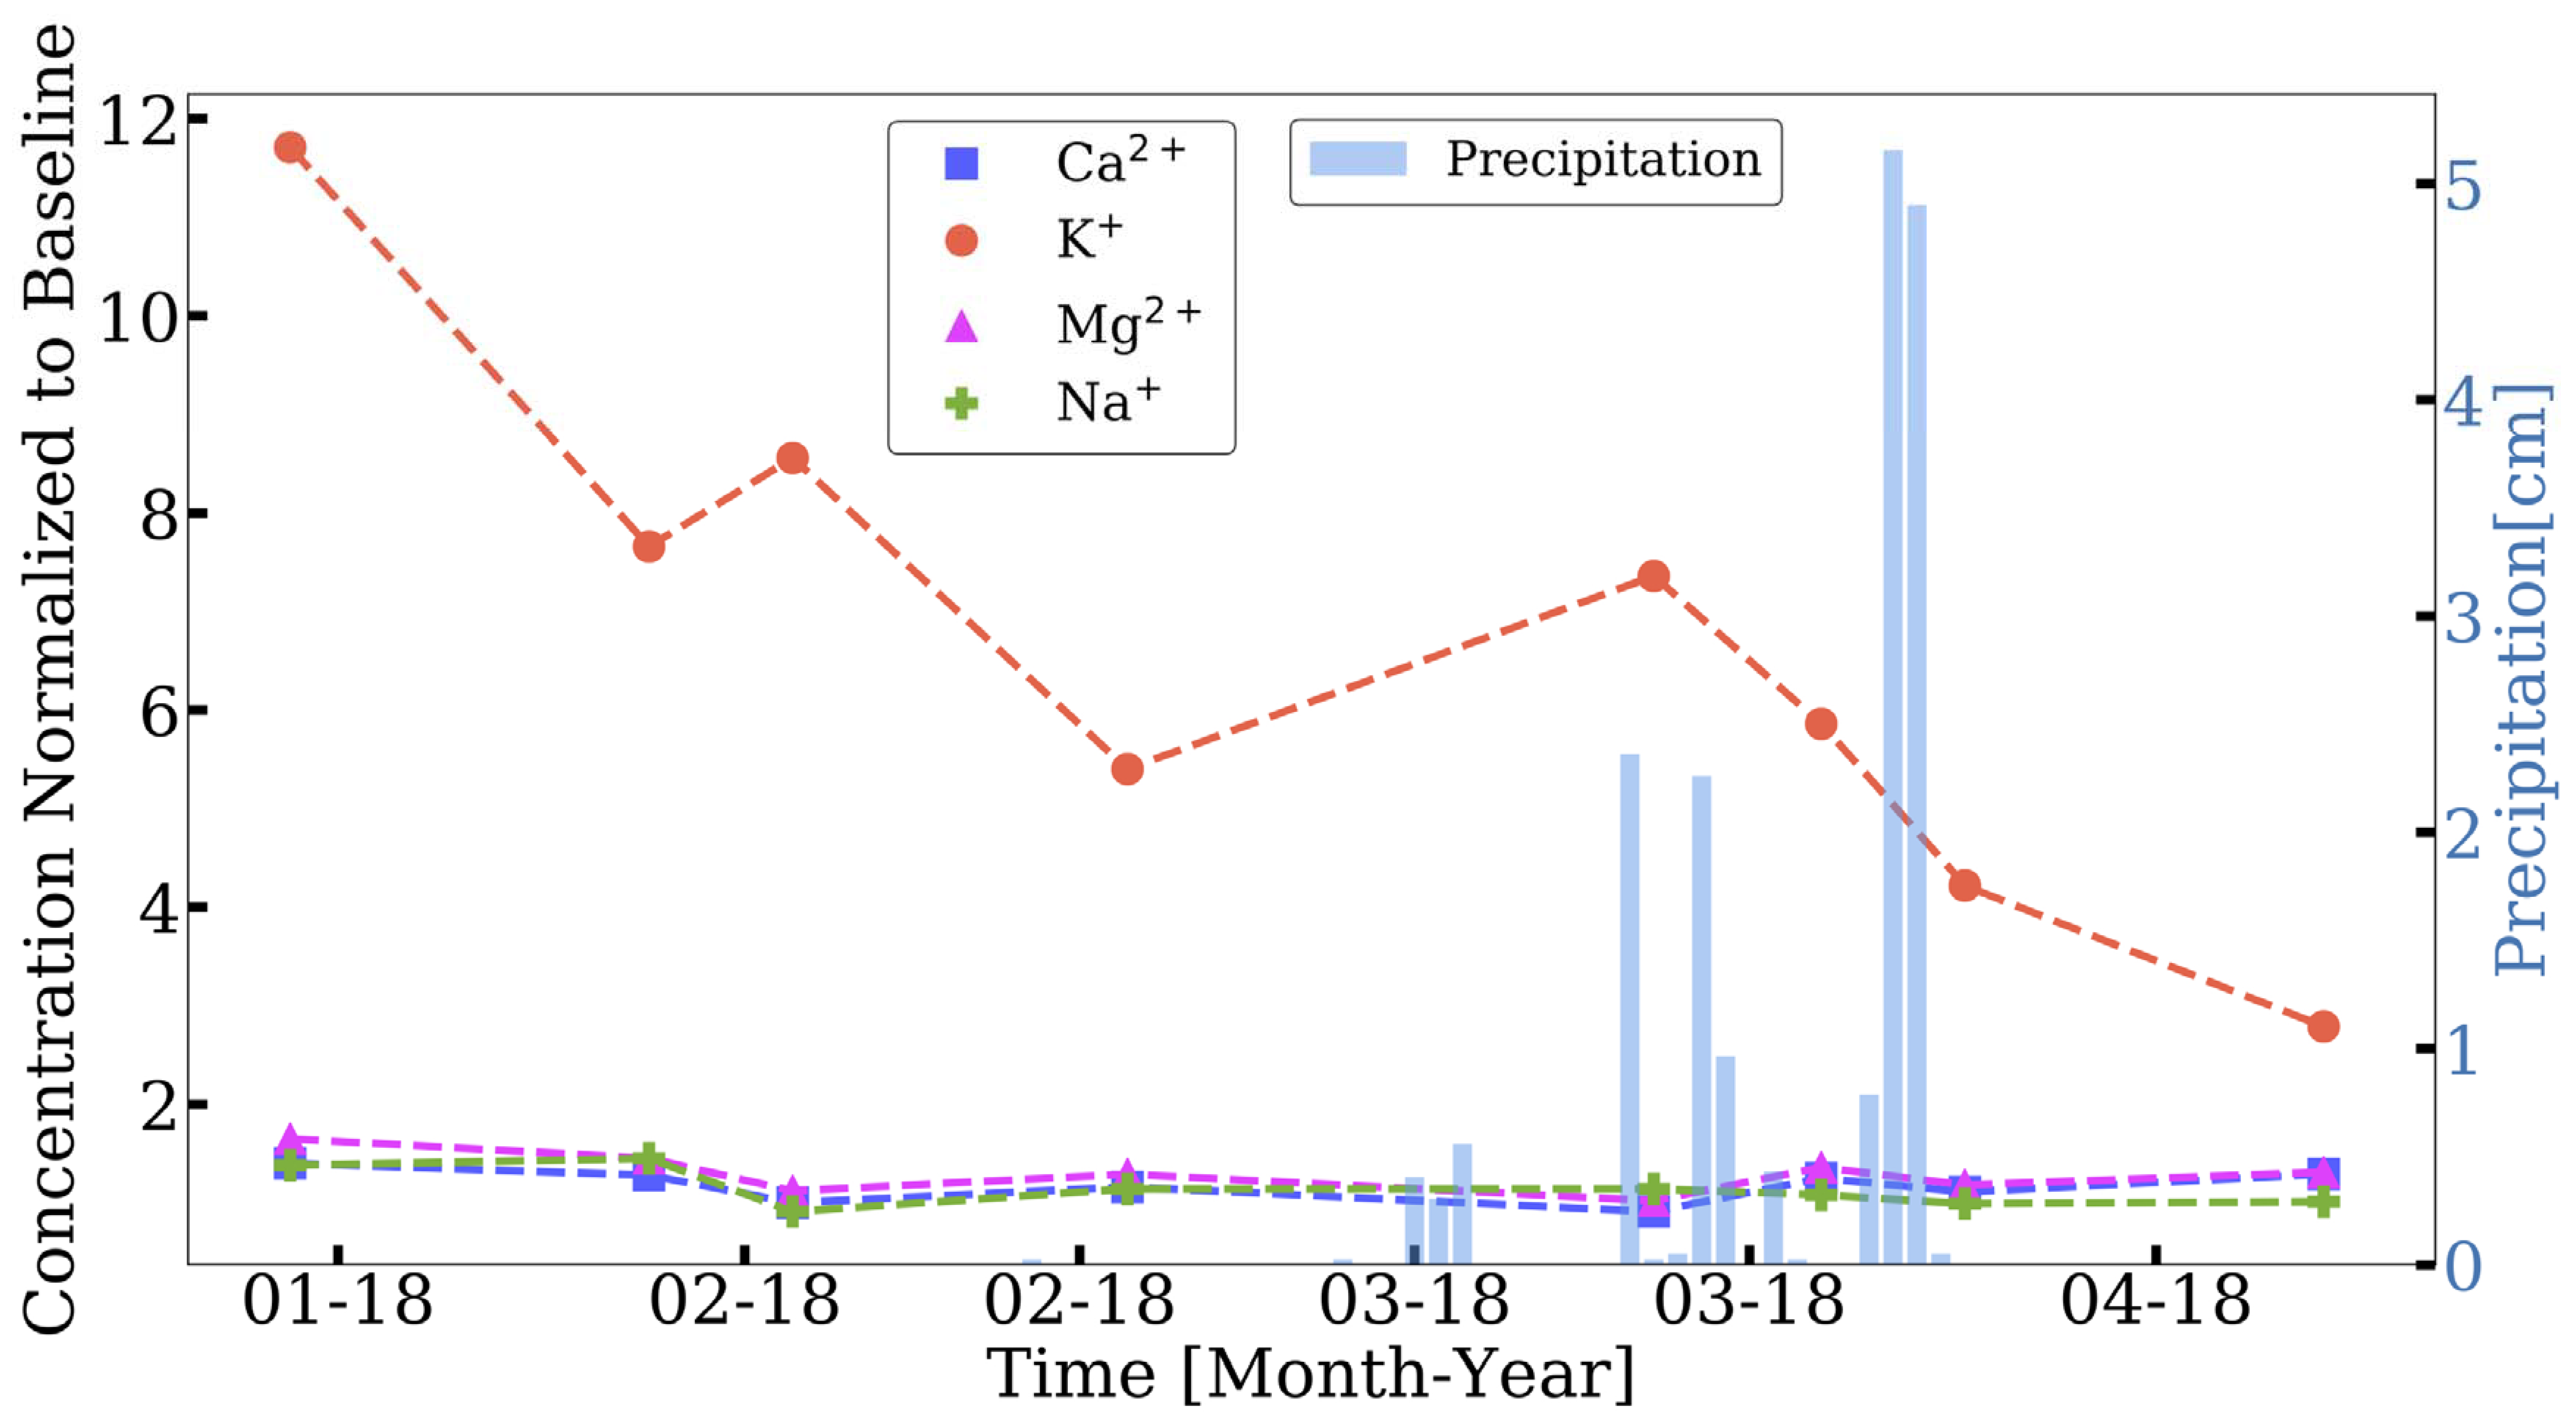
To better quantify storm-induced changes in major cation concentrations, the values were normalized to the pre-storm baselines [47]. At the Upper El Cap site, K+ concentrations increased by more than one order of magnitude, and remained above baseline from 13 January 2018 through the end of the study; K+ concentrations were 6–7 times that of the pre-storm concentration ~1 month following the first storm, decreasing to 2.8 times that of the pre-storm value on the final sampling date ~3 months later (Figure 4).
In the period following the first major storm, major cation concentrations at the Middle and Lower El Cap sites were elevated compared to baseline values at the Upper El Cap site, with the exception of Ca2+ and Mg2+ at the Lower El Cap site just prior to the second storm. Compared to the first storm, the second major storm had a smaller effect on major cation concentrations at the Upper El Cap site (Figure 4) [46].
Overall, concentrations of K+ were the lowest, ranging from 1.0–12.5 mg/L, and concentrations of Ca2+ were highest, ranging from 74.9 mg/L to 135.6 mg/L. Mg2+ and Na+ concentrations were intermediate, with a similar range: Mg2+ between 20.7 mg/L and 36.8 mg/L, and Na+ between 22.8 mg/L and 39.9 mg/L. Concentrations of divalent cations Ca2+ and Mg2+ were linearly correlated (R2 = 0.89; p < 0.00001; Figure S9).
Variations in Ca2+ and Mg2+ were negatively correlated (at Lower El Cap, m = −0.033, R2 = 0.70; m = −0.0087, R2 = 0.27) to variations in K+ in the Lower El Cap and Middle El Cap sites. K+ concentration at the Upper El Cap site decreased from 11 March 2018 to 8 April 2018 following the second storm of the season. Na+ concentrations in the Upper El Cap site during this interval were lower than those measured at the Middle El Cap and Lower El Cap sites downstream (Figure 5).
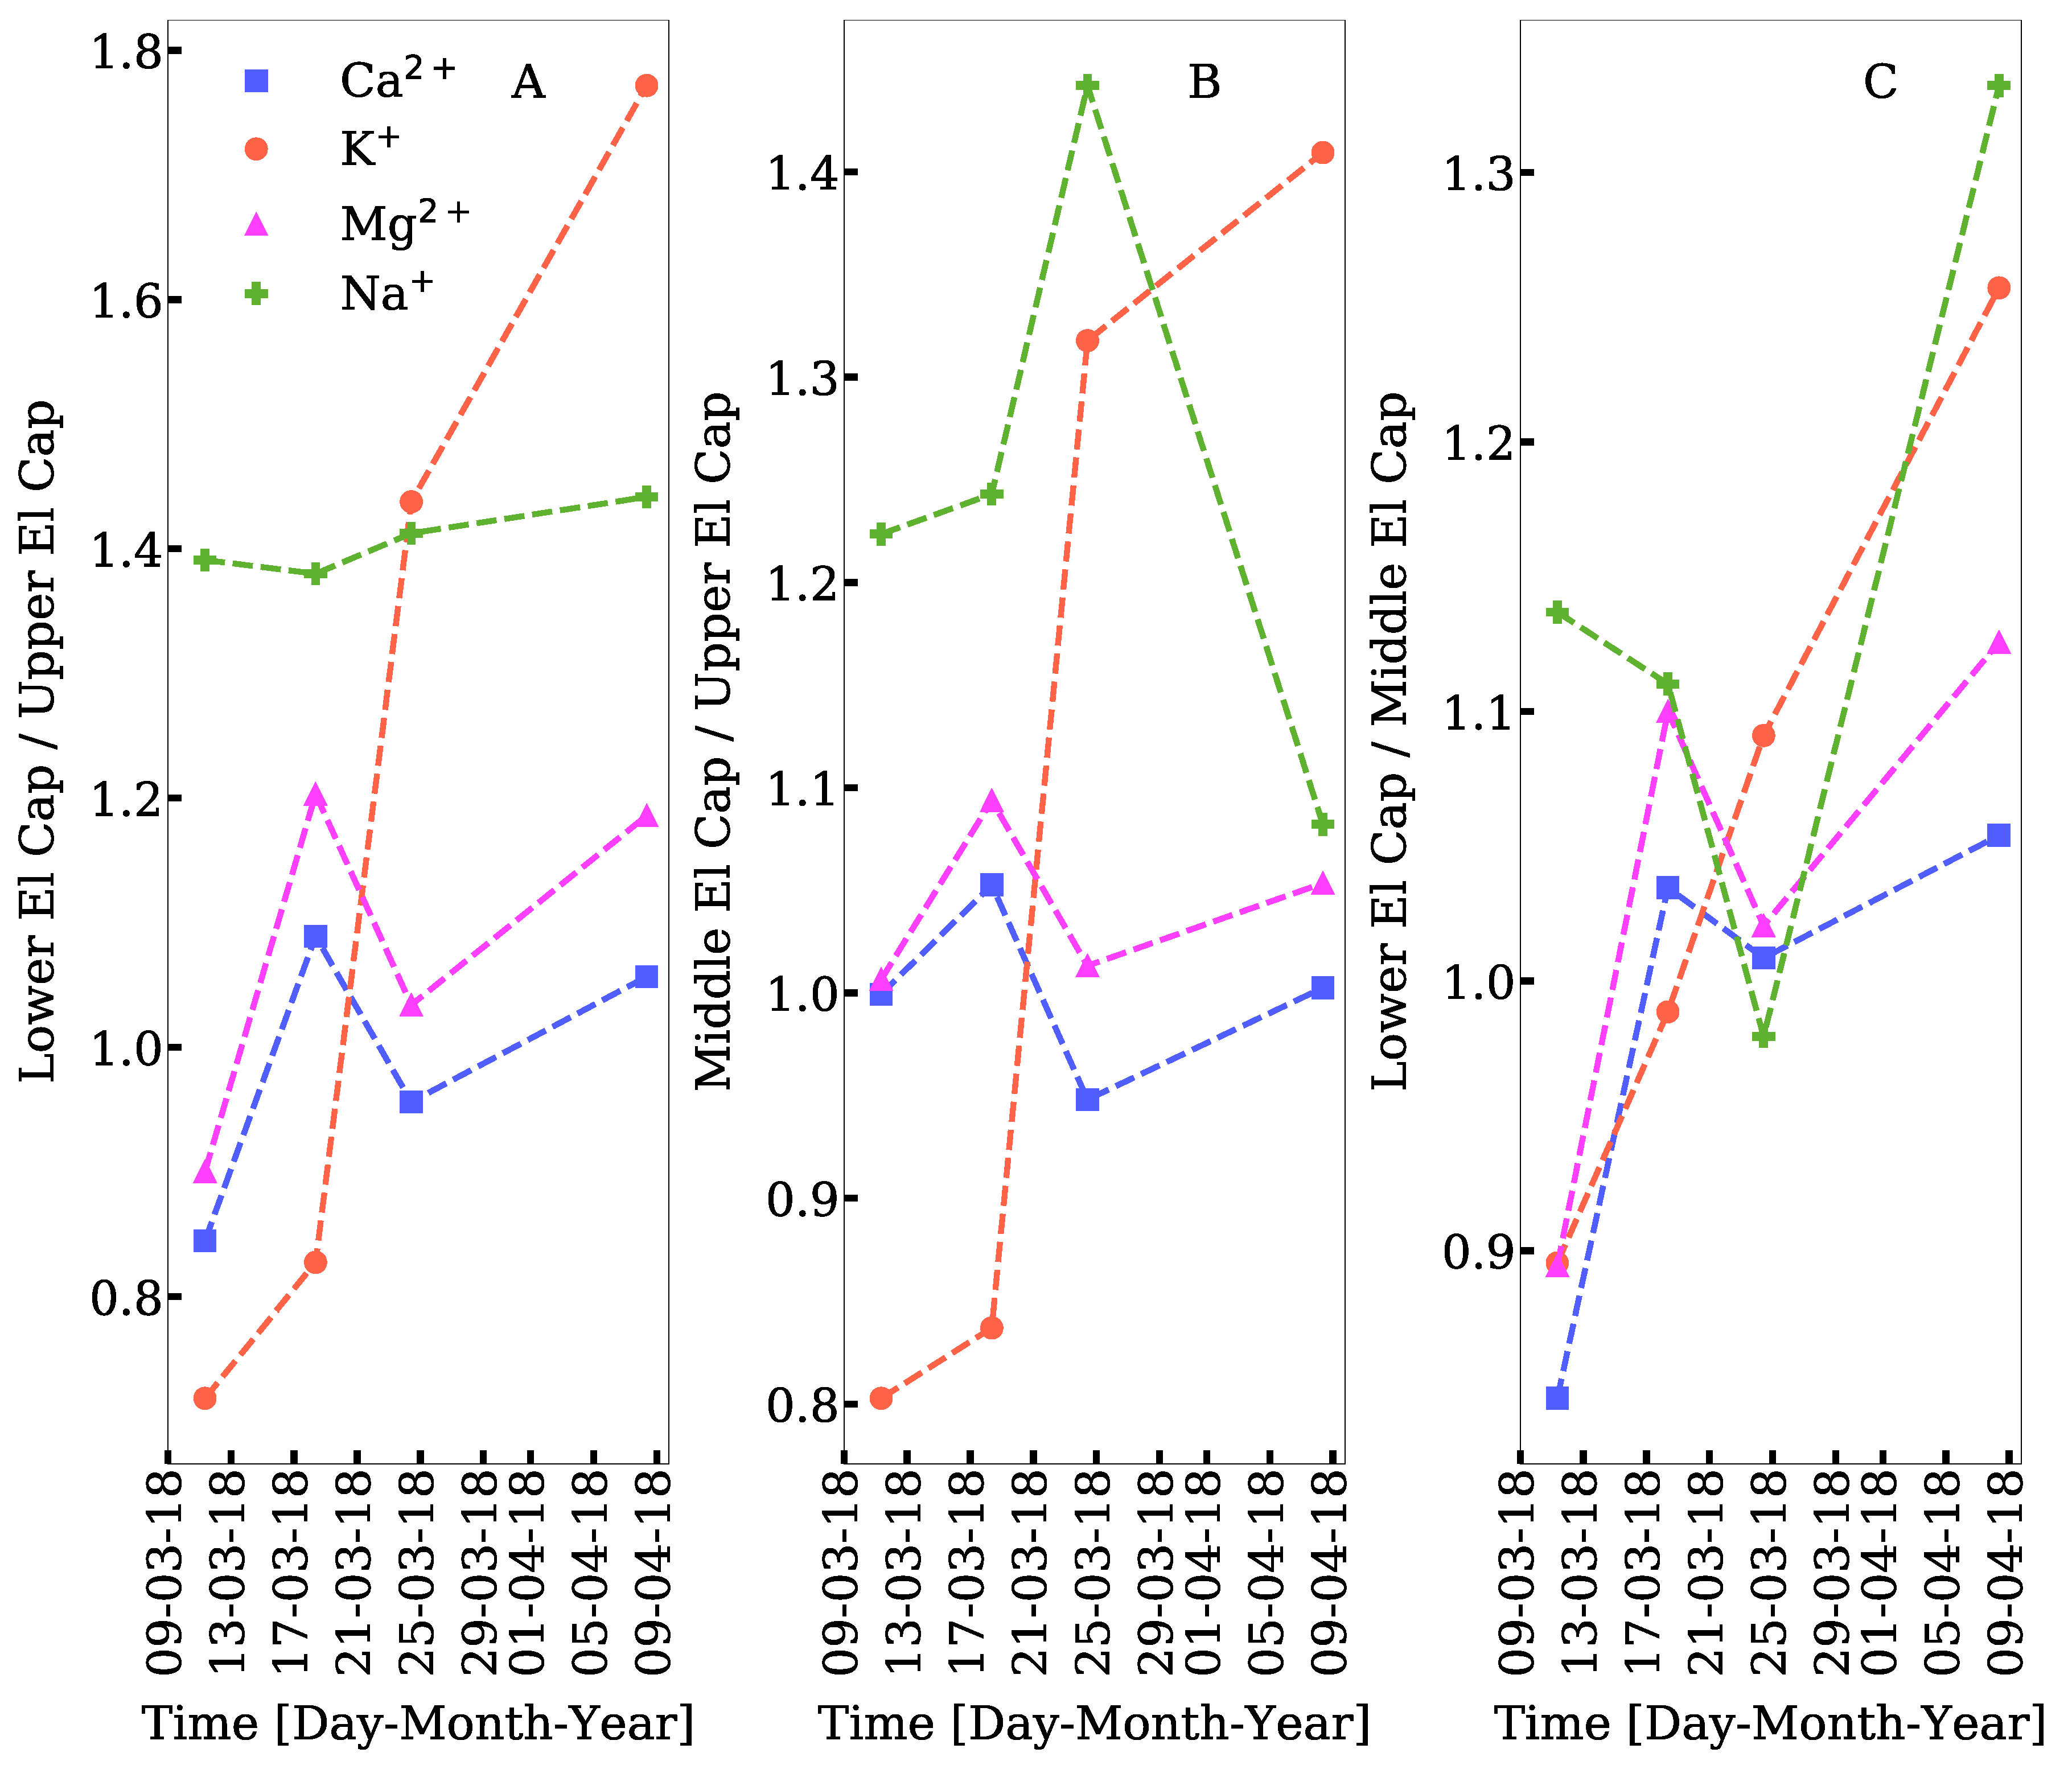
To evaluate variability of major cation concentrations downstream from the fire scar, we computed concentration ratios for each major cation comparing values for downstream and upstream sites using same-day samples after the second major storm (Figure 6). Two features of the figure were relevant to identify the trends: the value and the slope. A value <1 implied a higher upstream concentration compared to the downstream concentration, while a value >1 implied the downstream concentration was higher. A positive slope indicated that the downstream concentration was increasing relative to the upstream value, while a negative slope indicated the opposite. Slopes for all K+ downstream/upstream ratios were positive, revealing that K+ concentrations progressively increased downstream with time relative to the upstream sites. For each pairwise comparison, shortly after the second major storm, the ratios were less than unity, implying a higher upstream K+ concentration. Over time, the ratio increased monotonically, and at the end of the study period, in each case, the ratio was greater than unity, implying a higher downstream K+ concentration. Other major cations did not exhibit such variation.
3.3.3. Rattlesnake Creek
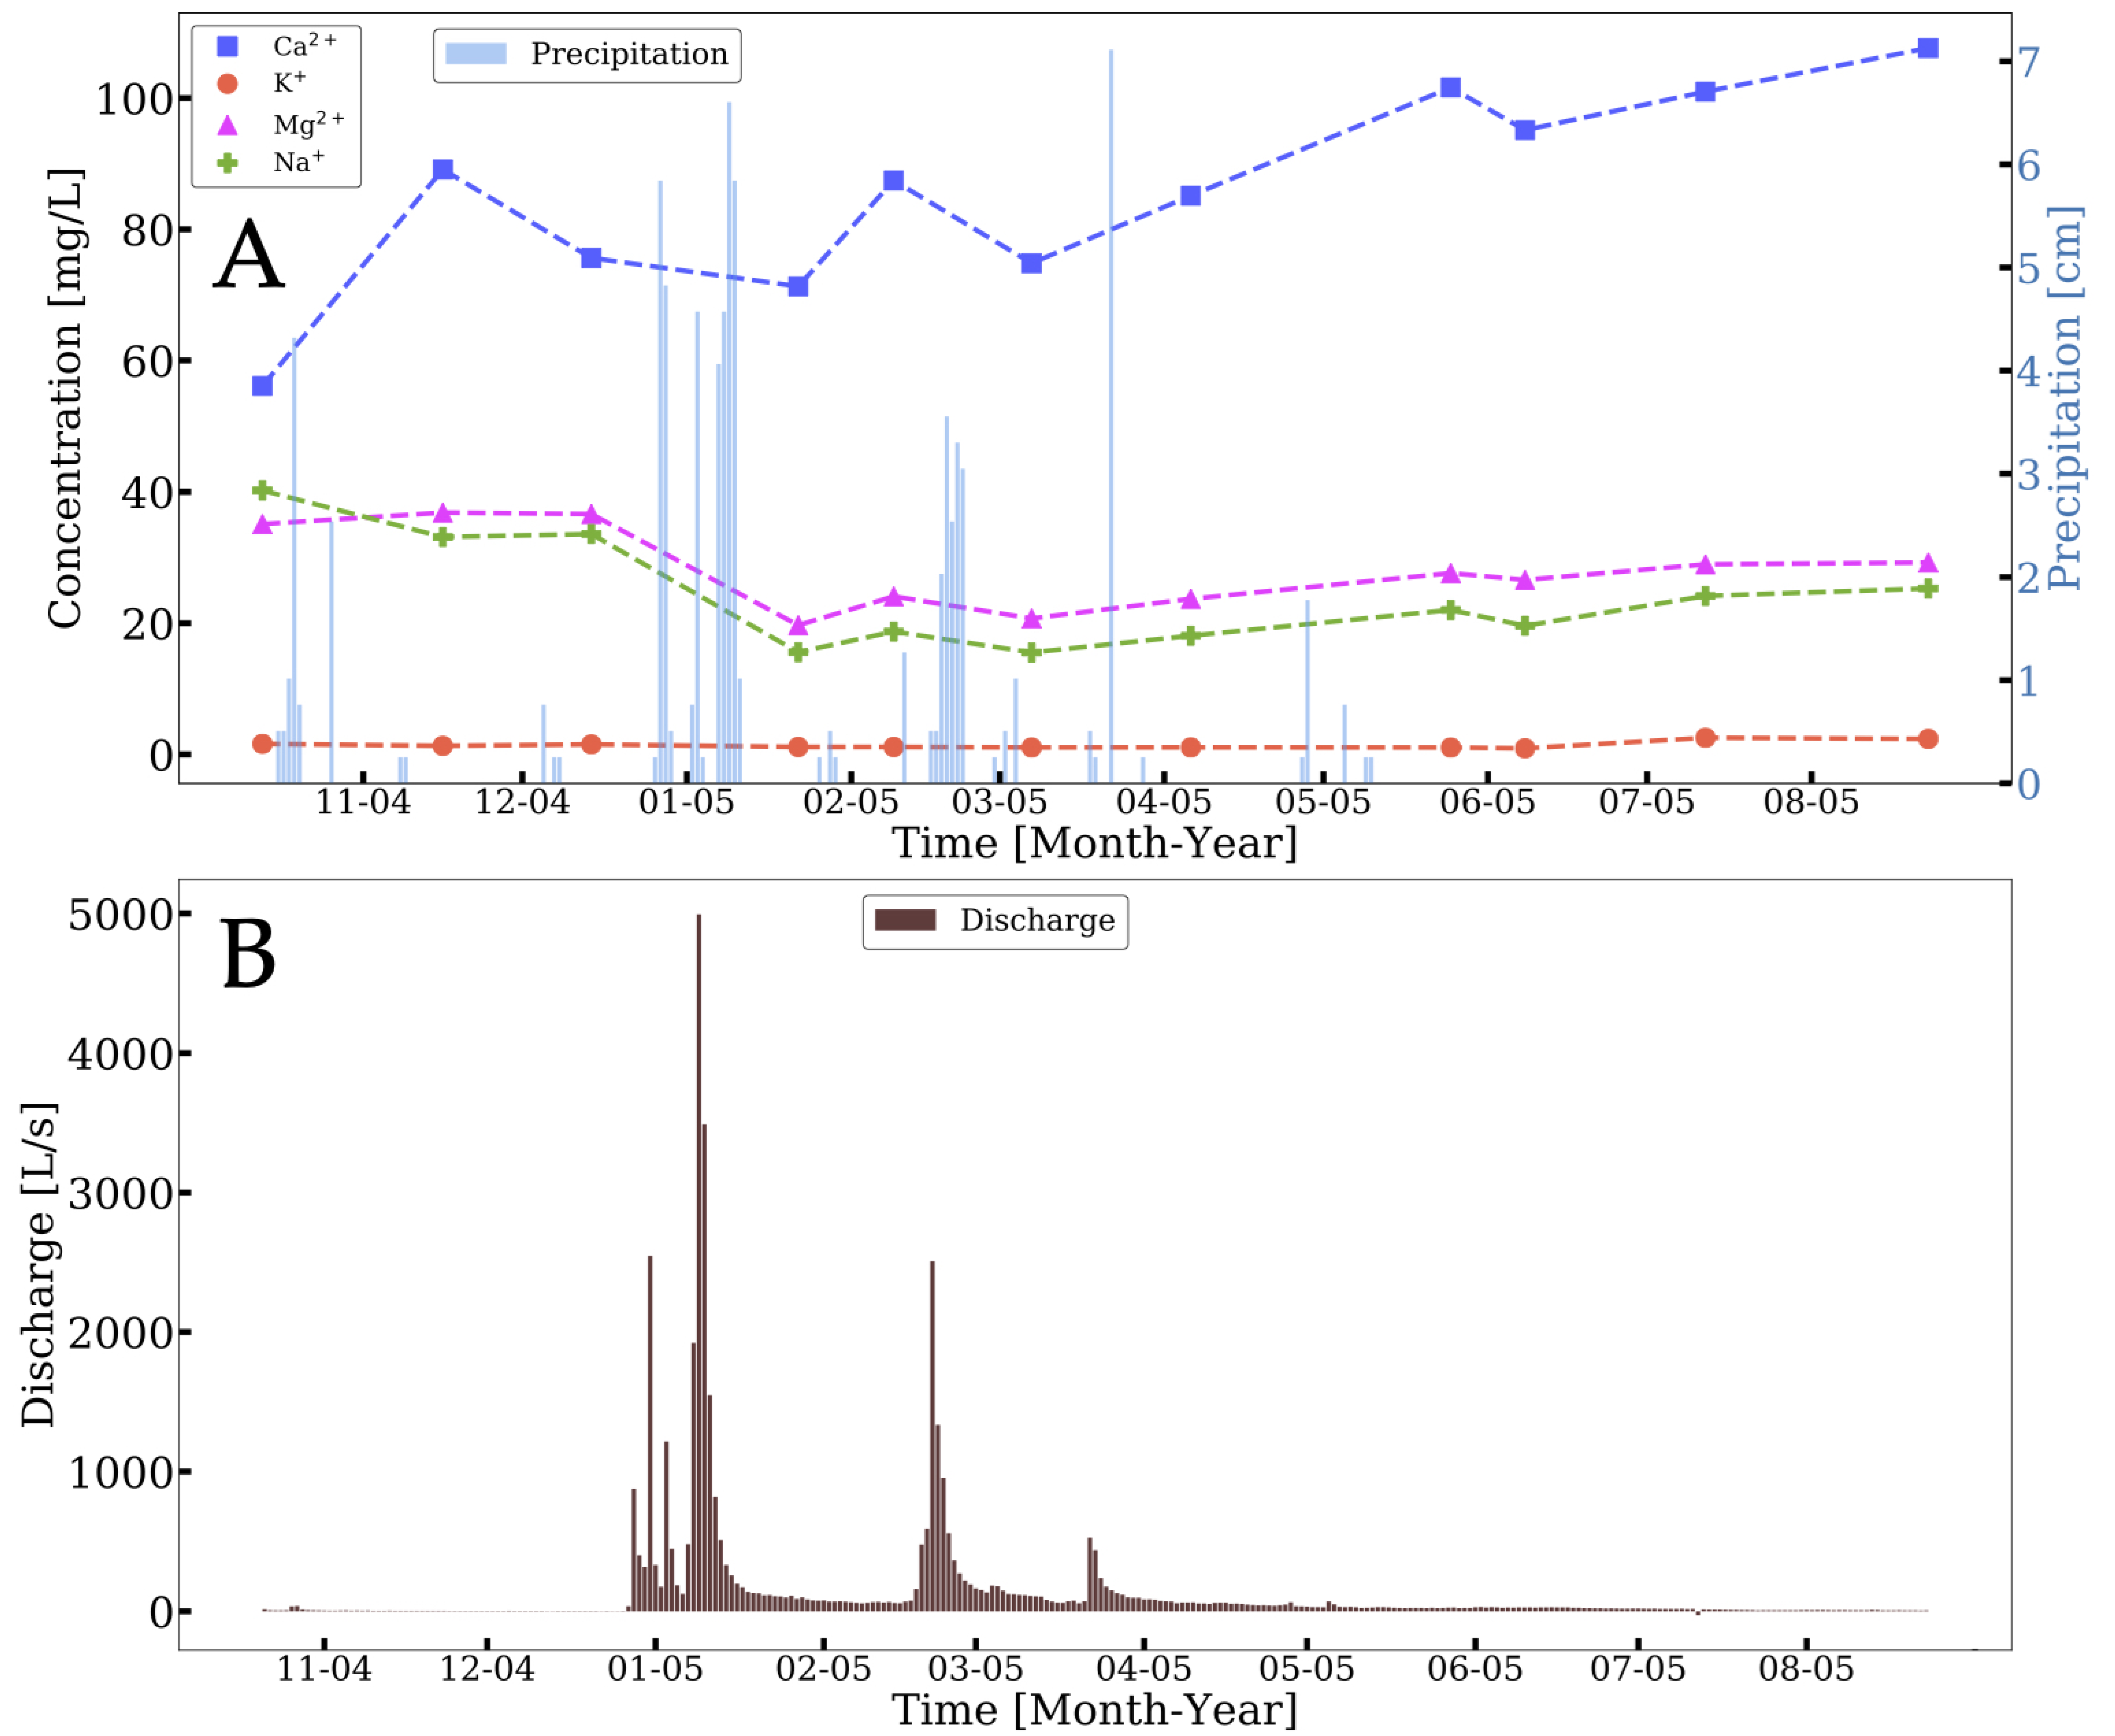
Earlier measurements at Rattlesnake Creek served as an unburned comparison for this study. Major cation (Mg2+, Ca2+, K+, and Na+) concentrations were measured in samples collected monthly from Rattlesnake Creek, from 13 October 2004 to 23 August 2005 [48] (identified as site RS02 in [30]). Rattlesnake Creek is located on the south-facing slopes of the Santa Ynez Mountains. Bedrock geology of the Rattlesnake Creek and El Capitan Creek watersheds are similar [39,49]. Upstream from the RS02 sampling site, vegetation is dominated by chaparral and shrublands, with riparian zones along stream channels. Similar characteristics between the RS02 and the Upper El Cap sampling sites enabled the use of the RS02 site as an unburned control for comparison with the Upper El Cap site.
Based on precipitation data acquired at an automated rain gauge located at 34°25′00″ N, 119°41′04″ W in the city of Santa Barbara ~5 km from the RS02 site, the first precipitation event of the 2004–2005 season occurred between the 13 October 2004 and 16 November 2004 sampling dates [50]. In contrast to the sharp increase in K+ that we observed in El Capitan Creek after the first storm following the Whittier Fire, K+ concentrations remained low, at levels 1.4 ± 0.6 mg/L over the time period recorded. Concentrations of Ca2+ increased from 56.1 mg/L on 13 October 2004 to 89.1 mg/L on 16 November 2004 (Figure 7), corresponding to before and after the first storm of the season. Concentrations of Mg2+ remained nearly constant over the same duration, while K+ and Na+ concentrations both decreased ~20% over that time period.
4. Discussion
4.1. Major Cation Concentrations Are Elevated in Stream Water after Storms
Concentrations of all major cations increased in stream water below the Whittier Fire scar at the Upper El Cap site. The most significant change occurred for K+, which had a 12-fold increase in the first week after the storm. In contrast, following the first rain of the season, in Rattlesnake Creek, K+ concentrations decreased, Na+ and Mg2+ concentrations remained nearly constant, and only Ca2+ concentrations increased. Our observation of major cation concentration changes in response to storms suggested that wildfires increase the flux of major cations via streams in this region.
While increases of all major cation concentrations in stream water were not observed in all other studies following wildfires, relatively high K+ concentrations in stream water have been consistently reported [25,26,27,28]. Field studies of burned catchments conducted by Cornish and Binns [28] and Betts and Jones [27] reported that the K+ concentrations in stream water could increase considerably relative to other cations within the first year following fire. Cornish and Binns [28] sampled stream water in a logging area located in a forested river basin in southeast Australia. They found that K+ concentrations in stream water increased in burned catchments within the first year compared to an unburned control catchment. However, concentrations of other major cations in the stream water (Na+, Mg2+, and Ca2+) decreased throughout the first year after burning. Betts and Jones [27] measured major cation concentrations in stream water in a catchment affected by a wildfire in the boreal forests of Alaska. They found that K+ concentrations in stream water increased ~50%, while Ca2+ concentrations decreased ~20%. Changes in Mg2+ and Na+ concentrations were both less than 10% in stream water following the fire in the burned catchment.
In accordance with our results, Feller and Kimmins [25] and Engle et al. [26] both observed concentration increases for all major cations in stream water downstream from burned regions. Feller and Kimmins [25], who studied the effects of slash burning of a pine forest in British Columbia, found that the maximum major cation concentrations in stream water ~5–6 h after burning were higher than maximum concentrations an hour before the burn. Maximum concentrations of Ca2+ and K+ were an order of magnitude higher, Mg2+ increased threefold, and Na+ increased ~30% following slash burning. However, these increases did not persist over the subsequent year. Engle et al. [26] measured major cation concentrations in streams before and after a prescribed burn in the Tharps Creek watershed in Sequoia National Park, California, which is dominated by fir, sequoia, and pine trees. They found that Mg2+ and K+ concentrations in stream water doubled, and Ca2+ concentrations tripled during the first water year (1 October–30 September) after the burn.
Wildfires can substantially increase major cation export. Over nine years following the burn, Engle et al. [25] calculated cumulative losses of 130 kg/ha Ca2+, 19 kg/ha Mg2+, 71 kg/ha Na+, and 29 kg/ha K+, which constituted up to 12–26% of the Ca2+, 28–35% of the Mg2+, and 46–76% of the K+ on the forest floor. Debano and Conrad [22] measured major cation export via surface runoff during the first year following a prescribed burn of a chaparral ecosystem near Santa Maria, California, in the Los Padres National Forest, a region near our study area. They found that the loss for all major cations increased in runoff following the burn, and that even greater losses were attributed to mobilization of debris.
4.2. Ash-Leaching Influence on K+ Concentrations
We postulated that the K+ concentration spike observed at the Upper El Cap site following the first storm of the season (Figure 3 and Figure 4) was due to the leaching of K+ from ash and mobilization via runoff or percolation through the soil column prior to entering the stream. This was supported by the high extractability of K+ in ash compared to other major cations (Figure 2). While extractable K+ and Na+ were correlated (R2 = 0.98; p < 0.0001) in ash samples, the amount of K+ leached was ~40 times that of Na+. Among major cations, K+ had the lowest pre-storm concentration at the Upper El Cap site. Consequently, an outflux of K+ from the fire scar more significantly altered K+ concentrations in the stream water compared to a similar outflux of other major cations with higher baseline concentrations. The combination of high K+ extractability in ash and low pre-storm K+ concentrations was consistent with the sharp increase in K+ concentrations observed in stream water after the first major storm (Figure 3 and Figure 4).
The relatively low K+ concentrations observed in the Middle El Cap and Lower El Cap sampling sites (Figure 5) were likely the result of dilution by runoff from unburned portions of the watershed from 11 March 2018 to 8 April 2018 following the second major storm (Figure 6). While the influx of runoff from unburned areas increased with distance downstream from the fire perimeter, information about the major cation content of flushed groundwater, leached soil, and pre-storm concentrations at all sites would be necessary to verify this interpretation.
Heterogeneity in major cation extractability in ash could be influenced by local attributes. The ash samples with the highest K+ extractability were collected near the eastern edge of the fire scar [45] (Figure 1). Fire intensity, ash depth, and ash color have been shown to influence extractability of major cations [52,53]. However, an analysis of ash from the Buckeye Flats fire, which burned a chaparral community in the Sierra Nevada in California, revealed that K+ extractability was not correlated with fire intensity or depth [52]. Pereira et al. [53] demonstrated that K+ extractability can vary with ash color in ash samples from wildfires that burned near Lisbon, Portugal. However, they reported variations in extractability at relative magnitudes well below the high variability reported in our study.
While no pre-burn surface litter was acquired in this study, our observations and interpretations were consistent with a previous study conducted by Christensen and Muller [54], who found that the extractable K+ in upper soil layers was leached in significantly higher concentrations from burned soil compared to unburned soil following a wildfire in chaparral ecosystems of the Santa Ynez Mountains in California.
Fire has been shown to influence the leachability of major cations in topsoil and surface material. Results from Lewis [24] and Grier [23] suggested that fire may have contrasting effects on extractability of major cations. Lewis [24] showed increased major cation solubility in surface litter following a prescribed burn in a South Carolina, USA, pine forest. Changes in the extractability of divalent major cations were higher than that of univalent major cations: extractability of Ca2+ increased 20-fold and Mg2+ increased 10-fold, while both Na+ and K+ only exhibited a ~2.3-fold increase. Grier [23] investigated the effects of a wildfire that burned through the Entiat Experimental Forest, a pine forest in the Entiat Valley located on the eastern slopes of the Cascade Range in Washington. In contrast to Lewis [24], prior to precipitation, Grier [23] found that the extractability of major cations in unburned surface litter was greater than that of the ash, and the extractability of major cations in topsoil either decreased or remained nearly constant following the burn.
4.3. Environmental Impacts Associated with K+
As a plant nutrient, K+ is essential for processes such as photosynthesis and activation of enzymes [55,56]. While K+ is not considered a limiting nutrient for plant growth or germination in chaparral soils, large loss associated with wildfires could occur if K+ outputs exceed inputs. Rundel and Parson [57] showed that after the burning of a chaparral ecosystem in Sequoia National Park, California, K+ concentrations in chamise (Adenostoma fasciculatum) and chaparral white thorn (Ceanothus leucodermis) foliage were high with respect to pre-fire concentrations. This was interpreted as luxury nutrient consumption due to increases in available K+ associated with burning. Such availability was demonstrated by Beatty [58], who sampled soils from a chaparral community in the Santa Monica Mountains dominated by chamise (Adenostoma fasciculatum) and redshanks (Adenostoma sparsifolium) before and after a wildfire. Beatty’s [58] results demonstrated that wildfires that burn chaparral communities dominated by these shrubs increase the extractability of K+ in associated soils. Experiments conducted by Hanley and Fenner [59] showed that deficiencies in K+ could increase seedling mortality rates in Pinus brutia and lower the growth rate of Citus creticus. Their results suggest that post-fire increases in available K+ and nitrogen may be essential to successfully establish Citus creticus seedlings after burning.
While Christensen and Muller showed that K+ concentrations were significantly elevated in burned chaparral ecosystems of the Santa Barbara area [54], little is known about how K+ directly influences plant growth and germination of chaparral species in southern California. Thanos and Rundel [60] demonstrated that different KNO3 concentrations influenced germination of Emmenanthe penduliflora, a fire-following chaparral plant native to California. Germination rates ranged from ~20–60%, with KNO3 concentrations ranging from 1–100 mM. Peak germination rates of ~60% occurred at ~10 mM. A similar study involving KNO3 and other nitrate-bearing compounds was conducted on plants native to California chaparral by Keely and Fotheringham [61]. While their experiment was primarily designed to test the effects of smoke on plant germination, the study attempted to decouple nitrate effects from K+ by testing different nitrate-bearing compounds (ammonium nitrate and sodium nitrate). Peak germination tended to occur around 10 mM, which was consistent with the results of Thanos and Rundel [60].
Following wildfires, removal of vegetation enables erosion of previously immobile soil and sediment [18,19] that can be directly transported to the ocean via debris flows, landslides, and suspended sediment. If not significantly diluted by stream water or rain, direct input of large amounts of ash and sediment that have unusually high K+ extractability could temporarily increase the K+ concentration in seawater [62]. Increases in the K+ concentration in seawater have been shown to induce settlement and metamorphosis in larva of red abalone (Haliotis rufescens) and wavy turban snail (Megastraea undosa, formerly Astraea undosa), and in larvae of the sandcastle worm (Phragmatopoma californica) all of which are species found along the California coast [63]. Thus, the direct introduction of burned debris to the ocean could influence biological activity in intertidal zones along the coast. However, since concentrations of K+ in El Capitan Creek were below 15 mg/L, introduction of K+ by creek water alone would dilute K+ concentrations in the nearby ocean. Any increase in K+ concentrations in seawater via direct input of ash and sediments would likely be transient. After our study was concluded, on 2 February 2019, a strong storm impacted the burn scar of the Whittier Fire and triggered a debris flow in Duval Canyon that transported large volumes of sediment into the ocean [64].
4.4. Low Nitrogen May Signify High Volatilization
Nitrogen is susceptible to volatilization after wildfires [65,66]. Nitrogen loss provides insight into wildfire severity, erosion rates, and bottlenecks for post-wildfire plant growth. For instance, N volatilization, which is most prevalent at or near the soil surface, begins at above 200 °C in chaparral soils, where up to 50% of N can be volatilized. At temperatures above 500 °C, all N is lost in chaparral soils [67]. Erosion also causes N loss after wildfires, due to the disassembly of vegetation and increased hydrophobicity of the surface soil. For example, Ellis [68] reported that in California chaparral, the erosion rates on slopes of 50% were double the erosion rates on slopes of 20%. Although total N tends to decrease, other forms of N often trend upwards in post-wildfire chaparral. Burnt organic matter and increased microbial activity generally increase the availability and amount of and in the underlying soil after wildfires [67].
Low N abundances in ash samples from this study may be attributed to higher volatilization of N relative to C (Table 1), or perhaps, as is common in many chaparral environments, the ecosystem was nitrogen-limited. If low N was attributable to volatilization, then we may infer high burn severities at most of the sites. Low N may limit future plant productivity during the growing season, similar to how water constrains growth during the dry season and when rainfall is limited. Large losses of N after wildfires are well documented. Lewis [24] reported a 60% volatilization rate. Contributors to N replacement after wildfires in chaparral ecosystems are wet and dry N deposition, as well as N fixing shrubs and bacteria [68,69].
However, low N concentrations in ash sampled during this study differed significantly compared to results obtained by Goodridge et al. [70], who conducted a study on N cycling in the Rattlesnake Creek watershed in Santa Barbara, California after the Jesusita Fire of 2009. They found that N in the soil from fire scar was: (1) 440% higher than unburned soil before the post-fire wet season, (2) decreased to 320% during initial sampling, and (3) returned to pre-fire levels within 66 days. They also found that while stream export of N was 1480% higher than pre-fire export data during the first post-fire rain, after three storms, the N export levels returned to those of pre-fire conditions within 106 days. After applying a mass balance model, they showed that only 1% of the wildfire N could be attributed to stream export, while 52% of the N could be attributed to plant and microbial growth. The other 47% of the N remained unaccounted for. The authors considered N loss to underlying bedrock, aquifers, uptake by largely unburned riparian zones and soil denitrification as potential explanations for the missing N.
5. Conclusions
Concentrations of major cations increased in the east fork of El Capitan Creek after the first major storm following the 2017 Whittier Fire. Such behavior of major cations was not detected in an unburned, nearby watershed in 2004–2005.
K+ was leached in high concentrations in ash samples compared to other major cations. Coupled with the order of magnitude increase in K+ concentrations in stream water after the first storm, burning appeared to lead to major K+ flux via leaching of ash, followed by export from the fire scar by stream discharge.
Following the second major storm, the K+ concentrations were higher at the upstream sampling site compared to two downstream sampling sites. Downstream sampling sites received more runoff from unburned areas, which increased proportionally with distance from the fire scar, diluting runoff from the burn.
Ash samples yielded low N content, suggesting high N volatilization during the burn, or low initial N concentrations in the surrounding material.
Supplementary Materials
The following are available online at https://www.mdpi.com/article/10.3390/w13172402/s1, Figure S1: Upper El Cap site. (A) Conditions on 30 September 2017 before the first major rainfall. (B) Conditions on 13 January 2018 after the first major rainfall, Figure S2: Surficial ash accumulations within the fire scar. Red boundaries delineate surficial ash at several sampling locations. Panel A illustrates ash that has accumulated in a gully at site Ash 1. Panel B illustrates ash that has accumulated in and around crevices near boulders at site Ash 2. Panel C shows ash that has accumulated as a pocket at site Ash 2. Panel D shows ash that has accumulated as a patchy blanket at site Ash 5, Figure S3: Nitrogen weight percent measurements at sites Ash 1, Ash 3, and Ash 5. At each site, 10 samples were taken (S1 to S10). Standard errors (SE = σ/√(n); σ = sample standard deviation, n = number of samples) are indicated by the red bars, Figure S4: Carbon weight percent measurements at sites Ash 1 to Ash 5. At each site, 10 samples were taken (S1 to S10). Standard errors (SE = σ/√(n); σ = sample standard deviation, n = number of samples) are indicated by the red bars, Figure S5: Correlations between nitrogen and carbon weight percentages in ash from sites Ash 1, Ash 3, and Ash 5, Figure S6: Correlation between Na+ and K+ concentrations leached from ash samples taken from all ash sampling sites, Figure S7: Correlations between carbon and extractible major cations in ash from all ash sampling sites, Figure S8: Standard deviations in major cation concentrations in stream water calculated from all samples by sampling site, Figure S9: Correlation between Mg2+ and Ca2+ in stream water sampled from the Upper, Middle and Lower El Capitan Creek sites.
Author Contributions
Conceptualization, C.S. and J.M.; data curation, C.S. and P.S.-C.; formal analysis, C.S., P.S.-C. and M.M.; funding acquisition, J.M.; investigation, C.S., P.S.-C. and J.M.; methodology, C.S. and J.M.; software, C.S. and P.S.-C.; supervision, J.C. and J.M.; validation, C.S. and J.C.; visualization, C.S., P.S.-C. and J.C.; writing—original draft, C.S. and P.S.-C.; Writing—review and editing, C.S., P.S.-C., M.M., J.C. and J.M. All authors have read and agreed to the published version of the manuscript.
Funding
This research was supported by the National Science Foundation’s Long-Term Ecological Research program (Grant No. OCE-123277) and by a fellowship from the David and Lucile Packard Foundation. The work of Carl Swindle was supported by the National Science Foundation Graduate Research Fellowship (Grant No. DGE-1745301).
Data Availability Statement
The data presented in this paper can be found at https://github.com/pshankinclarke/Water_Publication (accessed on 10 February 2021).
Acknowledgments
Jennifer Harkness measured major cations in water from Rattlesnake Creek. The MRL Shared Experimental Facilities are supported by the MRSEC Program of the NSF (Award No. DMR 1720256), a member of the NSF-funded Materials Research Facilities Network (www.mrfn.org). We appreciate the support of Carla D’Antonio for use of the CHN analyzer in her lab. The base map for Figure 1 was obtained from the OpenStreetMap Foundation (www.openstreetmap.org (accessed on 10 February 2021)).
Conflicts of Interest
The authors declare no conflict of interest.
References
- Knicker, H. How does fire affect the nature and stability of soil organic nitrogen and carbon? A review. Biogeochemistry 2007, 85, 91–118. [Google Scholar] [CrossRef]
- Halofsky, J.E.; Peterson, D.L.; Harvey, B.J. Changing wildfire, changing forests: The effects of climate change on fire regimes and vegetation in the Pacific Northwest, USA. Fire Ecol. 2020, 16, 4. [Google Scholar] [CrossRef] [Green Version]
- Úbeda, X.; Pereira, P.; Outeiro, L.; Martin, D.A. Effects of fire temperature on the physical and chemical characteristics of the ash from two plots of cork oak (Quercus suber). Land. Degrad. Dev. 2009, 20, 589–608. [Google Scholar] [CrossRef] [Green Version]
- Hepler, P.K.; Wayne, R.O. Calcium and plant development. Annu. Rev. Plant Physiol. 1985, 36, 397–439. [Google Scholar] [CrossRef]
- Evans, H.J.; Sorger, G.J. Role of mineral elements with emphasis on the univalent cations. Annu. Rev. Plant Physiol. 1966, 17, 47–76. [Google Scholar] [CrossRef]
- Gerendás, J.; Führs, H. The significance of magnesium for crop quality. Plant Soil 2013, 368, 101–128. [Google Scholar] [CrossRef] [Green Version]
- Subbarao, G.V.; Ito, O.; Berry, W.L.; Wheeler, R.M. Sodium—A functional plant nutrient. Crit. Rev. Plant Sci. 2003, 22, 391–416. [Google Scholar]
- Wang, M.; Zheng, Q.; Shen, Q.; Guo, S. The critical role of potassium in plant stress response. Int. J. Mol. Sci. 2013, 14, 7370–7390. [Google Scholar] [CrossRef] [PubMed] [Green Version]
- Schlesinger, W.H. Some thoughts on the biogeochemical cycling of potassium in terrestrial ecosystems. Biogeochemistry 2021, 154, 427–432. [Google Scholar] [CrossRef]
- Brownell, P.F. Sodium as an essential micronutrient element for plants and its possible role in metabolism. Adv. Bot. Res. 1980, 7, 117–224. [Google Scholar]
- Van Milgen, J. Modeling biochemical aspects of energy metabolism in mammals. J. Nutr. 2002, 132, 3195–3202. [Google Scholar] [CrossRef] [PubMed]
- Edelstein, L.; Segel, L.A. Growth and metabolism in mycelial fungi. J. Theor. Biol. 1983, 104, 187–210. [Google Scholar] [CrossRef]
- Rutigliano, F.A.; D’ascoli, R.; De Santo, A.V. Soil microbial metabolism and nutrient status in a Mediterranean area as affected by plant cover. Soil Biol. Biochem. 2004, 36, 1719–1729. [Google Scholar] [CrossRef]
- Duchesne, L.; Houle, D. Base cation cycling in a pristine watershed of the Canadian boreal forest. Biogeochemistry 2006, 78, 195–216. [Google Scholar] [CrossRef]
- Ouimet, R.; Duchesne, L. Base cation mineral weathering and total release rates from soils in three calibrated forest watersheds on the Canadian Boreal Shield. Can. J. Soil Sci. 2005, 85, 245–260. [Google Scholar] [CrossRef] [Green Version]
- Uchida, R. Essential nutrients for plant growth: Nutrient functions and deficiency symptoms. In Plant Nutrient Management in Hawaii’s Soils; College of Tropical Agriculture and Human Resources, University of Hawaii: Honolulu, HI, USA, 2000; pp. 31–55. [Google Scholar]
- Ranalli, A.J. A Summary of the Scientific Literature on the Effects of Fire on the Concentration of Nutrients in Surface Waters; Geological Survey: Reston, VA, USA, 2004.
- DiBiase, R.A.; Lamb, M.P. Vegetation and wildfire controls on sediment yield in bedrock landscapes. Geophys. Res. Lett. 2013, 40, 1093–1097. [Google Scholar] [CrossRef] [Green Version]
- Lamb, M.P.; Scheingross, J.S.; Amidon, W.H.; Swanson, E.; Limaye, A. A model for fire-induced sediment yield by dry gravel in steep landscapes. J. Geophys. Res. Earth Surf. 2011, 116, e2010JF001878. [Google Scholar] [CrossRef] [Green Version]
- Prieto-Fernández, A.; Acea, M.J.; Carballas, T. Soil microbial and extractable C and N after wildfire. Biol. Fert. Soils 1998, 27, 132–142. [Google Scholar] [CrossRef]
- Kennedy, N.; Egger, K.N. Impact of wildfire intensity and logging on fungal and nitrogen-cycling bacterial communities in British Columbia forest soils. For. Ecol. Manag. 2010, 260, 787–794. [Google Scholar] [CrossRef]
- DeBano, L.F.; Conrad, C.E. The effect of fire on nutrients in a chaparral ecosystem. Ecology 1978, 59, 489–497. [Google Scholar] [CrossRef]
- Grier, C.C. Wildfire effects on nutrient distribution and leaching in a coniferous ecosystem. Can. J. For. Res. 1975, 5, 599–607. [Google Scholar] [CrossRef]
- Lewis, W.M., Jr. Effects of fire on nutrient movement in a South Carolina pine forest. Ecology 1974, 55, 1120–1127. [Google Scholar] [CrossRef]
- Feller, M.C.; Kimmins, J.P. Effects of clearcutting and slash burning on streamwater chemistry and watershed nutrient budgets in southwestern British Columbia. Water Resour. 1984, 20, 29–40. [Google Scholar] [CrossRef]
- Engle, D.L.; Sickman, J.O.; Moore, C.M.; Esperanza, A.M.; Melack, J.M.; Keeley, J.E. Biogeochemical legacy of prescribed fire in a giant sequoia–mixed conifer forest: A 16-year record of watershed balances. J. Geophys. Res. Biogeosci. 2008, 113, e2006JG000391. [Google Scholar] [CrossRef]
- Betts, E.F.; Jones, J.B., Jr. Impact of wildfire on stream nutrient chemistry and ecosystem metabolism in boreal forest catchments of interior Alaska. Arct. Antarct. Alp. Res. 2009, 41, 407–417. [Google Scholar] [CrossRef] [Green Version]
- Cornish, P.M.; Binns, D. Streamwater quality following logging and wildfire in a dry sclerophyll forest in southeastern Australia. For. Ecol. Manag. 1987, 22, 1–28. [Google Scholar] [CrossRef]
- Belillas, C.M.; Rodà, F. The effects of fire on water quality, dissolved nutrient losses and the export of particulate matter from dry heathland catchments. J. Hydrol. 1993, 150, 1–17. [Google Scholar] [CrossRef]
- Aguilera, R.; Melack, J.M. Relationships among nutrient and sediment fluxes, hydrological variability, fire, and land cover in coastal California catchments. J. Geophys. Res. Biogeosci. 2018, 123, 2568–2589. [Google Scholar] [CrossRef]
- Tiwari, B.; Ajmera, B.; Gonzalez, A.; Sonbol, H. Impact of wildfire on triggering mudslides—a case study of 2018 Montecito debris flows. In Geo-Congress: Engineering, Monitoring, and Management of Geotechnical Infrastructure; American Society of Civil Engineers: Reston, VA, USA, 2020; pp. 40–49. [Google Scholar]
- Porter, T.W.; Crowfoot, W.; Newsom, G. 2017 Wildfire Activity Statistics; California Department of Forestry and Fire Protection: Sacramento, CA, USA, 2019. [Google Scholar]
- Moritz, M. Analyzing extreme disturbance events: Fire in Los Padres National Forest. Ecol. Appl. 1997, 7, 1252–1262. [Google Scholar] [CrossRef]
- Hanan, E.J.; Schimel, J.P.; Dowdy, K.; D’Antonio, C.M. Effects of substrate supply, pH, and char on net nitrogen mineralization and nitrification along a wildfire-structured age gradient in chaparral. Soil Biol. Biochem. 2016, 95, 87–99. [Google Scholar] [CrossRef]
- GeoMA. Geosciences and Environmental Change Science Center, United States Geological Survey. Available online: https://rmgsc.cr.usgs.gov/outgoing/GeoMAC/historic_fire_data/ (accessed on 19 June 2021).
- U.S. Geological Survey; National Geospatial Program. NHD 20200619 for California State or Territory Shapefile Model Version 2.2.1; U.S. Geological Survey: Reston, VA, USA, 2020.
- Goodridge, B.M.; Melack, J.M. Land use control of stream nitrate concentrations in mountainous coastal California watersheds. J. Geophys. Res. Biogeosci. 2012, 117, e2011JG001833. [Google Scholar] [CrossRef]
- Beighley, R.E.; Dunne, T.; Melack, J.M. Impacts of climate variability and land use alterations on frequency distributions of terrestrial runoff loading to coastal waters in southern California 1. J. Am. Water Resour. Assoc. 2008, 44, 62–74. [Google Scholar] [CrossRef]
- Dibblee, T.W. Geologic Map of the Santa Ynez and Tajiguas Quadrangles; Dibblee Geology Center Map #DF-15; Santa Barbara Museum of Natural History: Santa Barbara, CA, USA, 1988. [Google Scholar]
- Duvall, A.; Kirby, E.; Burbank, D. Tectonic and lithologic controls on bedrock channel profiles and processes in coastal California. J. Geophys. Res. Earth Surf. 2004, 109, e2003JF000086. [Google Scholar] [CrossRef] [Green Version]
- Francis, A. El Capitan Creek Stream Inventory Report December, 2008; Pacific States Marine Fisheries Commission and California Department of Fish and Game: Los Alamitos, CA, USA, 2010; pp. 1–95. [Google Scholar]
- Plumlee, G.S.; Martin, D.A.; Hoefen, T.; Kokaly, R.; Hageman, P.; Eckberg, A.; Meeker, G.P.; Adams, M.; Anthony, M.; Lamothe, P.J. Preliminary Analytical Results for Ash and Burned Soils from the October 2007 Southern California Wildfires; Open-File Report 2007-1407; U.S. Geological Survey: Reston, VA, USA, 2007; 13p.
- Daily Rainfall, Water Resources, Santa Barbara County, Department of Public Works. Available online: https://countyofsb.org/pwd/dailyrain.sbc (accessed on 4 October 2020).
- Swindle, C.R.; Shankin-Clarke, P.W. CN_combustion.csv. Available online: zenodo.org/record/5338527#.YS1128ZlDdc (accessed on 27 August 2021).
- Swindle, C.R.; Shankin-Clarke, P.W. Ash_leaching.csv. Available online: zenodo.org/record/5338527#.YS1128ZlDdc (accessed on 27 August 2021).
- Swindle., C.R.; Shankin-Clarke, P.W. Creek_water_cation. Available online: zenodo.org/record/5338527#.YS1128ZlDdc (accessed on 27 August 2021).
- Swindle, C.R.; Shankin-Clarke, P.W. Normalized_creek_water_cations.csv. Available online: zenodo.org/record/5338527#.YS1128ZlDdc (accessed on 27 August 2021).
- Swindle, C.R.; Shankin-Clarke, P.W. Rattlesnake_Creek_water_cations.csv. Available online: zenodo.org/record/5338527#.YS1128ZlDdc (accessed on 27 August 2021).
- Dibblee, T.W. Geologic Map of the Santa Barbara Quadrangle; Dibblee Geology Center Map #DF-06; Santa Barbara Museum of Natural History: Santa Barbara, CA, USA, 1986. [Google Scholar]
- Fayram, T.; Frye, J. Santa Barbara County Public Works Department 2004–05 Winter Report; County of Santa Barbara: Santa Barbara, CA, USA, 2005; pp. 1–140. [Google Scholar]
- Melack, J. SBC LTER: Land: Hydrology: Stream Discharge and Associated Parameters at Rattlesnake Creek, Las Canoas Rd (RS02) ver 9. Environmental Data Initiative. Available online: https://doi.org/10.6073/pasta/00ad8507a9eed8e923867c67d907af12 (accessed on 19 August 2021).
- Rice, S.K. Vegetation establishment in post-fire Adenostoma chaparral in relation to fine-scale pattern in fire intensity and soil nutrients. J. Veg. Sci. 1993, 4, 115–124. [Google Scholar] [CrossRef]
- Pereira, P.; Úbeda, X.; Martin, D.A. Fire severity effects on ash chemical composition and water-extractable elements. Geoderma 2012, 191, 105–114. [Google Scholar] [CrossRef]
- Christensen, N.L.; Muller, C.H. Effects of fire on factors controlling plant growth in Adenostoma chaparral. Ecol. Monogr. 1975, 45, 29–55. [Google Scholar] [CrossRef]
- Leigh, R.A.; Wyn Jones, R.G. A hypothesis relating critical potassium concentrations for growth to the distribution and functions of this ion in the plant cell. New Phytol. 1984, 97, 1–13. [Google Scholar] [CrossRef]
- Cakmak, I. The role of potassium in alleviating detrimental effects of abiotic stresses in plants. J. Plant. Nut. Soil. Sci. 2005, 168, 521–530. [Google Scholar] [CrossRef]
- Rundel, P.W.; Parsons, D.J. Nutrient changes in two chaparral shrubs along a fire-induced age gradient. Am. J. Bot. 1980, 67, 51–58. [Google Scholar] [CrossRef]
- Beatty, S.W. Fire effects on soil heterogeneity beneath chamise and redshanks chaparral. Phys. Geog. 1989, 10, 44–52. [Google Scholar] [CrossRef]
- Hanley, M.E.; Fenner, M. Seedling growth of four fire-following Mediterranean plant species deprived of single mineral nutrients. Funct. Ecol. 1997, 11, 398–405. [Google Scholar] [CrossRef]
- Thanos, C.A.; Rundel, P.W. Fire-followers in chaparral: Nitrogenous compounds trigger seed germination. J. Ecol. 1995, 83, 207–216. [Google Scholar] [CrossRef]
- Keeley, J.E.; Fotheringham, C.J. Smoke-induced seed germination in California chaparral. Ecology 1998, 79, 2320–2336. [Google Scholar] [CrossRef]
- Fukushi, K.; Hiiro, K. Determination of potassium in sea-water by capillary isotachophoresis. Fresen. Z. Anal. Chem. 1988, 332, 125–129. [Google Scholar] [CrossRef]
- Yool, A.J.; Grau, S.M.; Hadfield, M.G.; Jensen, R.A.; Markell, D.A.; Morse, D.E. Excess potassium induces larval metamorphosis in four marine invertebrate species. Biol. Bull. 1986, 170, 255–266. [Google Scholar] [CrossRef]
- Hill, S. 2017 Whittier Fire + 2019 Duval Canyon Debris Flow. In Timeline Stories; Santa Barbara Bucket Brigade: Santa Barbara, CA, USA, 2019. [Google Scholar]
- DeBell, D.S.; Ralston, C.W. Release of nitrogen by burning light forest fuels. Soil Sci. Soc. Am. J. 1970, 34, 936–938. [Google Scholar] [CrossRef]
- Knight, H. Loss of nitrogen from the forest floor by burning. For. Chron. 1966, 42, 149–152. [Google Scholar] [CrossRef] [Green Version]
- DeBano, L.F.; Rice, R.M.; Eugene, C.C. Soil heating in chaparral fires: Effects on soil properties, plant nutrients, erosion, and runoff. In Resarch Paper PSW-RP-145; US Department of Agriculture, Forest Service, Pacific Southwest Forest and Range Experiment Station: Berkeley, CA, USA, 1979; Volume 21, p. 145. [Google Scholar]
- Ellis, B.A.; Verfaillie, J.R.; Kummerow, J. Nutrient gain from wet and dry atmospheric deposition and rainfall acidity in southern California chaparral. Oecologia 1983, 60, 118–121. [Google Scholar] [CrossRef] [PubMed]
- Barro, S.C.; Conard, S.G. Fire effects on California chaparral systems: An overview. Environ. Int. 1991, 17, 135–149. [Google Scholar] [CrossRef]
- Goodridge, B.M.; Hanan, E.J.; Aguilera, R.; Wetherley, E.B.; Chen, Y.-J.; D’Antonio, C.M.; Melack, J.M. Retention of nitrogen in a chaparral ecosystem. Ecosystems 2018, 21, 1608–1622. [Google Scholar] [CrossRef]
Figure 1.
Whittier Fire and sampling locations. The Whittier Fire scar is represented by the orange shaded region [35]. Ash 1 was sampled at 34°31′57.0″ N, 120°01′17.0″ W; Ash 2 at 34°31′32.9″ N, 119°58′04.8″ W; Ash 3 at 34°31′33.2″ N, 119°57′14.4″ W; Ash 4 at 34°30′53.3″ N, 119°53′19.7″ W; and Ash 5 at 34°30′42.1″ N, 119°52′39.0″ W. Upper El Cap is located at 34°29′49.2″ N, 120°00′11.9″ W, ~0.7 km downstream from the fire perimeter, with a subcatchment area of 8 km2. Middle El Cap is located at 34°28′41.2″ N, 120°01′12.0″ W, ~3 km downstream from the fire perimeter, with a subcatchment area of 14 km2. Lower El Cap is located at 34°27′38.5″ N, 120°01′20.3″ W, ~5 km downstream from the fire, with a subcatchment area of 16 km2. Fire perimeter data from [34]. The base map for Figure 1 was obtained from the OpenStreetMap Foundation (www.openstreetmap.org (accessed on 10 February 2021)). The stream data was obtained from the National Hydrology Dataset (NHD) [36].

Figure 2.
Major cation concentrations leached from ash via rainwater by sampling site.

Figure 3.
Major cation concentrations at Upper El Cap (East Fork) site and precipitation data. Precipitation data are expressed as cumulative precipitation each day. Precipitation events clustered into two major storms, referred to as the first major storm (inclusive of 6 January 2018) and the second major storm (inclusive of 10 March 2018) of the season [43].

Figure 4.
Major cation concentrations at Upper El Cap (East Fork) site following the first major precipitation event for the season, normalized to (divided by) the mean pre-storm baseline concentrations.
Figure 4.
Major cation concentrations at Upper El Cap (East Fork) site following the first major precipitation event for the season, normalized to (divided by) the mean pre-storm baseline concentrations.

Figure 5.
Concentrations of major cations in El Capitan Creek by sampling site: Upper El Cap (solid line), Middle El Cap (dashed line), and Lower El Cap (dotted line). The data from Figure 3 recorded for site Upper El Cap begins prior to the first storm (6 January 2018) and is included here. Data collection began at the Middle and Lower El Cap sites on 3 February 2018 and continued on a weekly basis following the second major storm of the season from 11 March 2018 to 8 April 2018. The top right panel magnifies the last four K+ measurements at the Upper, Middle, and Lower El Cap sites (top left panel) for emphasis.

Figure 6.
Comparison of major cation concentrations between downstream and upstream sites for dates (day-month-year) following the second storm (11 March 2018). Each plot illustrates same-day downstream/upstream concentration ratios for a pair of sites. The results show how concentrations of major cations changed proportionally over time (y-value > 1 implies higher concentrations downstream; <1 implies lower concentrations downstream; =1 implies no change). (A) Concentrations in the Lower El Cap site compared to those of the Upper El Cap site; (B) concentrations in the Middle El Cap Site compared to those of the Upper El Cap site; and (C) concentrations in the Lower El Cap site compared to those of the Middle El Cap site. Dates follow the second major storm of the season.

Figure 7.
Rattlesnake Creek (unburned comparison site) in 2004–2005: (A) major cation concentrations compared with local precipitation [48]; (B) daily average discharge from Rattlesnake Creek [51].


Table 1.
Weight % (wt %) of carbon and nitrogen (represented below as C/N) for 10 separate CN analyzer measurements of ash from sites Ash 1–5, along with the means and standard deviations. The detection limit for C was 0.08 mg, which corresponded to a weight % of 0.79. The detection limit for N was 0.1 μg, which corresponded to a weight % of 0.0013. Nitrogen measurements listed as 0.00 were below the detection limit.
| Ash 1 (C/N wt %) | Ash 2 (C/N wt %) | Ash 3 (C/N wt %) | Ash 4 (C/N wt %) | Ash 5 (C/N wt %) | |
|---|---|---|---|---|---|
| Subsample 1 | 2.52/0.012 | 1.09/0.00 | 3.80/0.00 | 2.11/0.00 | 4.51/0.0049 |
| Subsample 2 | 2.98/0.065 | 0.79/0.00 | 3.72/0.00 | 2.77/0.00 | 5.45/0.00 |
| Subsample 3 | 2.07/0.019 | 1.49/0.00 | 1.71/0.0027 | 4.03/0.00 | 6.20/0.00 |
| Subsample 4 | 2.41/0.0056 | 1.61/0.00 | 2.48/0.00 | 3.95/0.00 | 6.80/0.00 |
| Subsample 5 | 1.85/0.033 | 1.89/0.00 | 3.42/0.00 | 3.46/0.00 | 6.13/0.00 |
| Subsample 6 | 2.89/0.049 | 1.84/0.00 | 3.18/0.00 | 3.49/0.00 | 6.23/0.041 |
| Subsample 7 | 2.16/0.00 | 1.92/0.00 | 1.74/0.086 | 4.27/0.00 | 6.12/0.037 |
| Subsample 8 | 2.27/0.0013 | 1.04/0.00 | 2.69/0.00 | 4.68/0.00 | 6.11/0.012 |
| Subsample 9 | 2.82/0.062 | 1.18/0.00 | 2.72/0.00 | 3.21/0.00 | 7.12/0.010 |
| Subsample 10 | 1.86/0.0086 | 1.15/0.00 | 3.30/0.00 | 3.42/0.00 | 6.26/0.00 |
| Mean | 2.38/0.026 | 1.40/0.00 | 2.88/0.0089 | 3.54/0.00 | 6.09/0.011 |
| Stnd. Dev. | 0.41/0.025 | 0.40/0.00 | 0.75/0.027 | 0.75/0.00 | 0.71/0.016 |
Publisher’s Note: MDPI stays neutral with regard to jurisdictional claims in published maps and institutional affiliations. |
© 2021 by the authors. Licensee MDPI, Basel, Switzerland. This article is an open access article distributed under the terms and conditions of the Creative Commons Attribution (CC BY) license (https://creativecommons.org/licenses/by/4.0/).
Share and Cite
MDPI and ACS Style
Swindle, C.; Shankin-Clarke, P.; Meyerhof, M.; Carlson, J.; Melack, J. Effects of Wildfires and Ash Leaching on Stream Chemistry in the Santa Ynez Mountains of Southern California. Water 2021, 13, 2402. https://doi.org/10.3390/w13172402
AMA Style
Swindle C, Shankin-Clarke P, Meyerhof M, Carlson J, Melack J. Effects of Wildfires and Ash Leaching on Stream Chemistry in the Santa Ynez Mountains of Southern California. Water. 2021; 13(17):2402. https://doi.org/10.3390/w13172402
Chicago/Turabian StyleSwindle, Carl, Parker Shankin-Clarke, Matthew Meyerhof, Jean Carlson, and John Melack. 2021. "Effects of Wildfires and Ash Leaching on Stream Chemistry in the Santa Ynez Mountains of Southern California" Water 13, no. 17: 2402. https://doi.org/10.3390/w13172402
Note that from the first issue of 2016, this journal uses article numbers instead of page numbers. See further details here.