Article

Climate vs. Human Impact: Quantitative and Qualitative Assessment of Streamflow Variation

by
Hamideh Kazemi
1,2,3,
Hossein Hashemi
2,3,*,
Fatemeh Fadia Maghsood
2,3,4,
Seyyed Hasan Hosseini
2,3,5,
Ranjan Sarukkalige
1,
Sadegh Jamali
6 and
Ronny Berndtsson
2,3
1
School of Civil and Mechanical Engineering, Curtin University, Perth 6102, Australia
2
Department of Water Resources Engineering, Lund University, 221 00 Lund, Sweden
3
Center for Advanced Middle Eastern Studies, Lund University, 221 00 Lund, Sweden
4
Department of Watershed Management and Engineering, College of Natural Resources, Tarbiat Modares University, Tehran 1411713116, Iran
5
Department of Water Engineering, Faculty of Agriculture, University of Tabriz, Tabriz 5166616471, Iran
6
Department of Technology and Society, Lund University, 221 00 Lund, Sweden
*
Author to whom correspondence should be addressed.
Water 2021, 13(17), 2404; https://doi.org/10.3390/w13172404
Submission received: 25 July 2021 / Revised: 25 August 2021 / Accepted: 29 August 2021 / Published: 31 August 2021

Abstract

:
This paper presents a novel framework comprising analytical, hydrological, and remote sensing techniques to separate the impacts of climate variation and regional human activities on streamflow changes in the Karkheh River basin (KRB) of western Iran. To investigate the type of streamflow changes, the recently developed DBEST algorithm was used to provide a better view of the underlying reasons. The Budyko method and the HBV model were used to investigate the decreasing streamflow, and DBEST detected a non-abrupt change in the streamflow trend, indicating the impacts of human activity in the region. Remote sensing analysis confirmed this finding by distinguishing land-use change in the region. The algorithm found an abrupt change in precipitation, reflecting the impacts of climate variation on streamflow. The final assessment showed that the observed streamflow reduction is associated with both climate variation and human influence. The combination of increased irrigated area (from 9 to 19% of the total basin area), reduction of forests (from 11 to 3%), and decreasing annual precipitation has substantially reduced the streamflow rate in the basin. The developed framework can be implemented in other regions to thoroughly investigate human vs. climate impacts on the hydrological cycle, particularly where data availability is a challenge.

1. Introduction

The Karkheh River basin (KRB), called “the food basket of Iran”, is one of the most important agricultural areas in Iran. Irrigated farmland in the basin produces wheat for the entire country, while non-irrigated areas yield grain and livestock products [1]. The KRB is equally essential for hydropower production. Nonetheless, due to frequent droughts, massive agricultural activities, and dam construction programs, the KRB has been experiencing substantial streamflow reduction in recent decades [1]. Enduring streamflow reduction in the basin may put the sustainability of food production for the nation, as well as the downstream environment, in jeopardy. Therefore, it is of vital importance to investigate the primary cause of streamflow reduction to develop an appropriate management plan [2].
The two main causes of streamflow change are climate variation (such as changing precipitation patterns and intensity, and/or temperature) [3], and human activities (such as land use changes, water withdrawal, and/or hydraulic structures) [4]. Studying the impacts of climate variation and human activities on streamflow provides crucial information for authorities and decision-makers to develop sustainable water resource management plans concerning water distribution and agricultural water management [5,6].
To separate the impacts of regional human activities and climate variation on streamflow change, hydrological modelling and the Budyko method are widely used (e.g., [7,8,9]). While studies such as Geris et al. (2015) [10] and Birhanu et al. (2019) [11] used hydrological modelling to assess the impact of land use and land cover change on streamflow variation, others, such as Patterson et al. (2013) [12], Wang et al. (2013) [13] and Liu et al. (2017) [5], implemented the Budyko method to investigate streamflow changes in different catchments. Patterson et al. (2013) used the Budyko equation to study the impact of both climate and human activities on the mean annual streamflow in the South Atlantic region of the USA. Human activities were found to be responsible for streamflow changes in 27% of studied basins in the South Atlantic area, which has been experiencing agricultural land expansion and dam construction [12]. Wang et al. (2013) [13] successfully employed the Budyko model to separate impacts of climate variation and human activities on runoff in the Haihe River basin in China, where it was concluded that human activities were responsible for more than 50% of the runoff reduction in the basin. In the Yanhe basin in China, the Budyko model was used to examine runoff reduction. The model suggested that runoff reduction in the Yanhe River basin was predominantly related to climate variation rather than direct human interaction. Climate variation was estimated to account for 46.1–60.8% (mean 54.1%) of the total decrease in runoff, whereas human activities accounted for 39.1–53.9% (mean 45.9%) [14]. In another study conducted on several river basins across China, Liu et al. (2017) used the Budyko model and found that, until recently, climate variation was a controlling factor affecting streamflow; however, during recent years, the effects of human activities have been increasing. They compared the performance of the Budyko model with hydrological models from literature and showed that in the assessment of climate variation and human activities on streamflow, Budyko-type and hydrological models perform equally well. However, since the Budyko model does not require complicated parameterization and large input data, it is more efficient when attempting to quantify the impacts of influencing factors on streamflow [5].
Hence, to assess the hydrological response of a basin on a finer timescale (e.g., daily or monthly timescale), hydrological modelling is a useful method. The Budyko method, on the other hand, is useful to analyze responses of watersheds to climatic variation in a more straightforward and systematic approach [14].
Another major advantage of the Budyko method is to express streamflow variation depending on evapotranspiration and precipitation [15]. Therefore, it can provide insights on the effects of human activities and climate variation on the hydrological system. It is noteworthy that while the two methods are widely used and proven to be efficient in investigating streamflow changes, they need to be validated using an independent approach.
The first step to separate the impacts of human activities and climate variation on streamflow is to detect change points (breakpoints) in the streamflow time series. However, this step can be very challenging because of the non-linear interdependence of streamflow, climate and human impacts [15]. Streamflow, as a hydrological variable, is highly dependent on precipitation (a variable of semi-random nature), which can vary significantly and, in a long-term period, have multiple breakpoints [15]. In most studies associated with separating the impacts of climate variation and human activities, a breakpoint is identified using common trend analysis such as the Petit test, which separates the natural (base) period from the impacted period (e.g., [16]). However, the majority of these analyses have not assessed the importance and number of changes, types, and causes.
From a policy-making perspective, knowing the type of change (i.e., abrupt or non-abrupt) can assist in mitigation plans and the operation of sustainable strategies for water resource management [15]. Hydrological change, more particularly streamflow change, can take place gradually over time (non-abrupt change) or suddenly in a short period (abrupt change) while having similar impact on the hydrological system over different periods of time. Typically, non-abrupt changes can be an indicator of land use and land cover change (LULC), while abrupt changes can be a result of sudden human activities, such as changing water distribution systems, dam installation, changes in observation systems or due to a sudden climate parameter variation [15,17].
In view of the above, this study introduces a novel framework that combines mathematical, hydrological, and remote sensing methods to separate the contribution of climate variation and regional human activities (such as land use/land cover change) to streamflow changes of large data-scarce river basins and verifies the results using an independent approach. For this purpose, we used hydrological data of the KRB as a relevant case study to validate the implemented framework. We applied the Budyko method and hydrological model (HBV model) to analyze mean annual streamflow variations of the studied region during the last three decades (from 1980 to 2012) and quantify the impact of climate variation vs. regional human impacts. To detect the breakpoints in the observed streamflow and climate variables (i.e., precipitation and evapotranspiration), the newly developed Detecting Breakpoints and Estimating Segments in Trend (DBEST) algorithm [18] was employed, which provides useful information on the number, significance, and type of changes observed. The DBEST algorithm provides insights of the length of non-abrupt changes and underlying reasons. Applying the DBEST algorithm in hydrological studies, offers a systematic improvement for segmenting streamflow time-series before implementing the hydrological modeling and Budyko method. To validate the proposed models’ results and the DBEST detected breakpoint/s, remote sensing was employed and multiple land use maps of the basin area over the studied period were provided.
To summarize, we developed a novel framework that comprises quantification of the impact of human activities and climate variability on streamflow reduction, evaluation of the Budyko method using the HBV model, and validation of the findings using remote sensing and image classification techniques. Although such a hybrid framework will provide a basis to discuss reliability of the results depending on agreement among different individual methods’ outcome, we included sensitivity and uncertainty analyses as supplementary to the framework to emphasize reliability of the results based on modelling, which is a way to conceptualize reality.

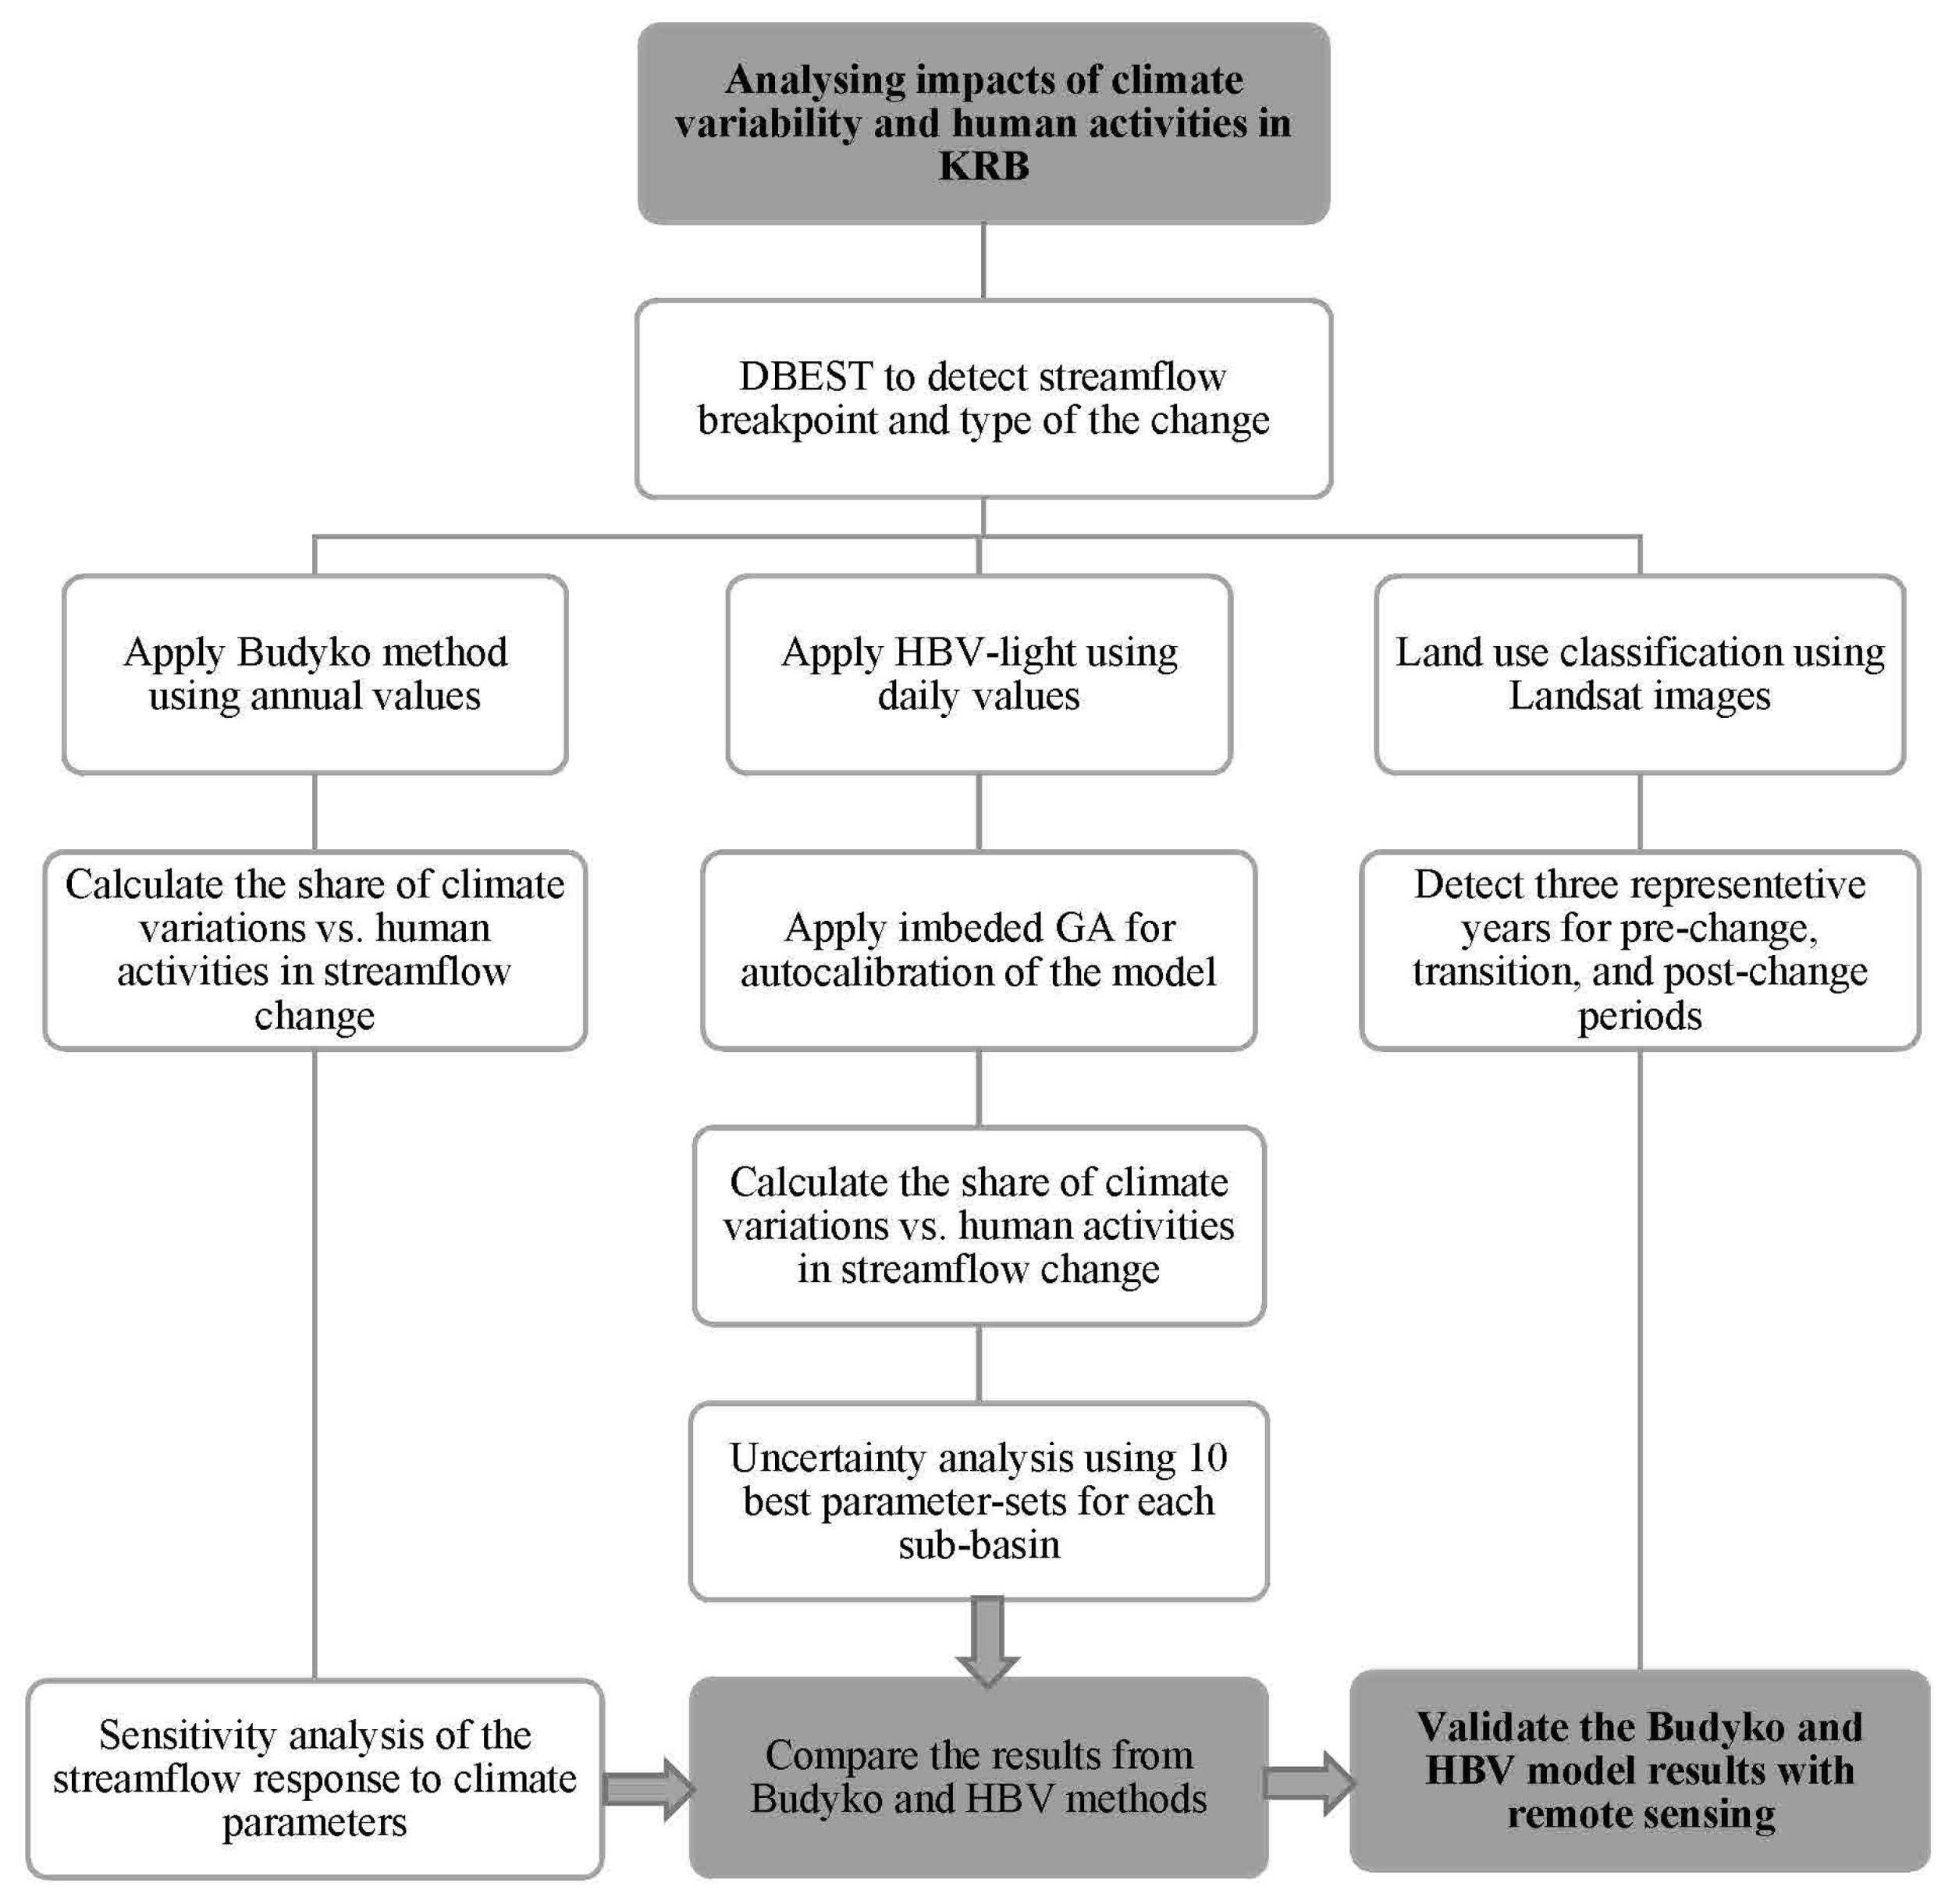
2. Materials and Methods
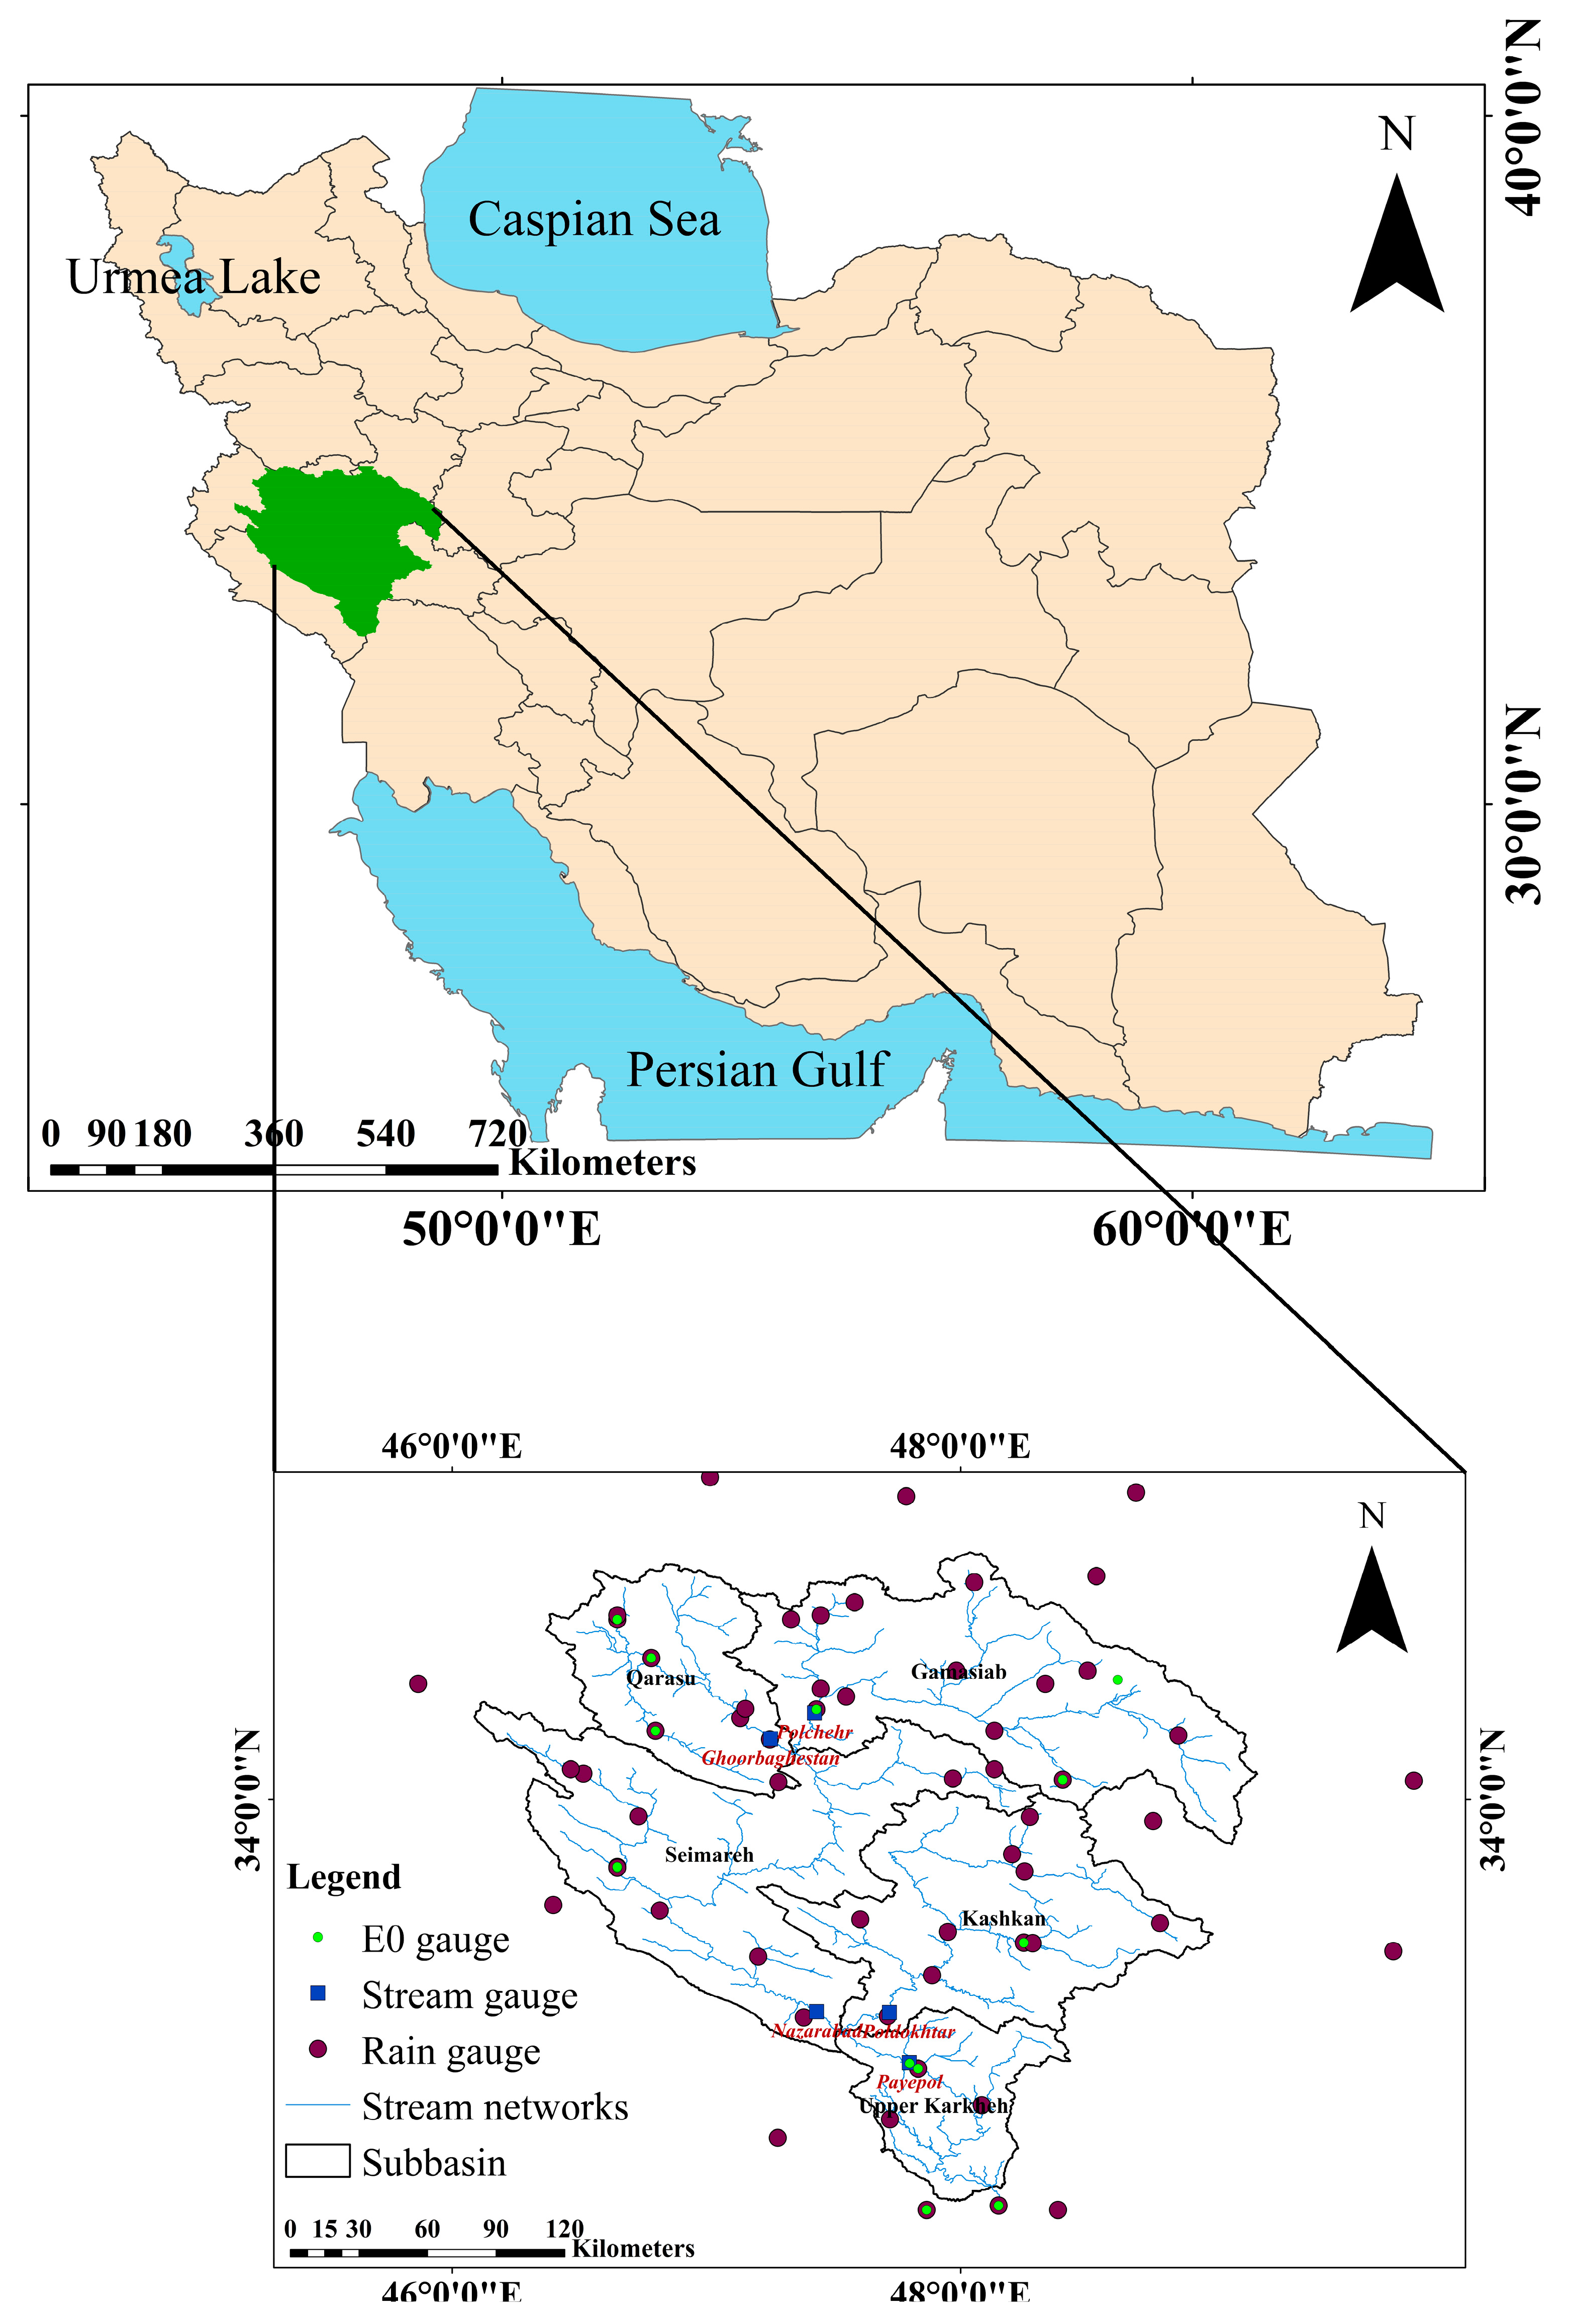
2.1. Study Area

The KRB, with an area of 43,000 km2 stretching over seven provinces and 32 districts, is located in the western part of Iran between 30° and 35° N latitude and 46° and 49° E longitude (Figure 1). The basin is the primary source of wheat production in Iran and encompasses 9% of the total irrigated area of the country [19]. As it plays a key role in food production in Iran, any hydrological changes in the basin directly affect the livelihoods of farmers as well as urban consumers at both basin and country levels. Five major rivers flow through the KRB, and the basin is divided into five main sub-basins named the Gamasiab, Qarasou, Kashkan, Seimareh, and Upper Karkheh [1]. The Upper Karkheh sub-basin is located upstream of the Karkheh Dam, and the flow that reaches the Upper Karkheh outlet is drained from the entire basin.
The KRB accommodates 5% of Iran’s population, which makes it the third most populated basin in the country. It has 3.5 million residents, of which 40% live in urban areas. Figure A1 in Appendix B shows the rural and urban population of each sub-basin. It should be noted that there is no official population record based on catchment division, and values are approximated based on the data of the smallest available countrywide division. The population is mostly concentrated in the Qarasou sub-basin, with 30% of the population occupying 17% of the KRB area. The southern parts of the KRB basin, with almost 11% of the area, are home to 5% of the population [20,21].
Figure 1 illustrates the location of the KRB in Iran and the climatic stations in each sub-basin.
The altitude of the basin varies from less than 10 m in the South to more than 3500 m above mean sea level in the North. Mean annual precipitation ranges from 150 mm in the south to 750 mm in the northern region (see Table 1). The maximum summer temperature varies between 35 and 45 °C across the basin. Range and pasture, rainfed agriculture, forest, irrigated agriculture, and urban area are the dominant land uses [19].
In the basin, spring water is traditionally used for irrigation; however, due to frequent droughts and subsequent surface water scarcity, groundwater pumping and river water diversions have become widespread in recent decades. The competition between irrigated agriculture and wetland ecosystems has led to an increasing salinity and reduced surface water availability, particularly in the lower parts of the basin [19].
During the twentieth century, the KRB remained mainly unregulated. The first dam constructed in the area was the Karkheh Dam, which was completed in 2001 and was the first large multipurpose dam in Iran, with a total storage of 5600 MCM (Table A1). Its reservoir is designed to irrigate 320,000 ha of agricultural land in the Upper Karkheh basin. The Seimareh Dam was built in 2013, and there are a few smaller reservoirs in operation, with several other small scale dams and irrigation schemes either under construction or under planning, all of which could impose extra burden on the streamflow of the study area [19].

2.2. Data

The study period (1980–2012) was selected considering availability and quality of data. Daily precipitation data for the study period were acquired from a well-distributed gauge network (57 stations) across the basin (Figure 1). The Thiessen method was used to determine the weight of each station for the total precipitation of the sub-basins.
Potential evapotranspiration (E0) stations are not spatially representative of the basin, though these stations (hereafter called reference stations) have a sufficiently long period of recorded temperature and E0. Temperature stations, however, are relatively well-distributed in the basin and provide a long period of recorded temperature. To extend the E0 estimation throughout the basin, temperature stations were classified based on their altitude and their distance from the reference stations [22]. Accordingly, for each year, a monthly relationship between observed E0 and temperature in the reference stations was developed to calculate E0 at temperature stations for the same altitude class. For instance, in 1995, for the Polchehr reference station (Figure 1), there is a high correlation between monthly E0 and monthly mean temperature, T (R2 = 0.95) (see Figure A2):
E 0 ( P ) = 15.103   ·     T ( P ) 20.929
Given that the Kermanshah temperature station is located at the same altitude and has a significant correlation with the Polchehr station (i.e., 0.94), TKermanshah was substituted in Equation (1) to estimate E0 for the Kermanshah station. Similarly, for each year of the study period and each temperature station, a relationship was derived to provide spatially distributed E0 data throughout the basin. Table A2 shows the temperature stations that are correlated with the E0 reference stations.
Regarding streamflow data, five discharge stations located at the outlet of the sub-basins, namely Polchehr at the Gamasiab River, Ghoorbaghestan at the Qarasou River, Poldokhtar at the Kashkan River, Nazarabad at the Seimareh River, and Payepol at the Upper Karkheh River, were selected considering their locations, period of records, and quality of data (Figure 1 and Table A3). The Payepol station is located downstream of the Karkheh Dam and receives a cumulative discharge from the upstream sub-basins. Thus, it provides useful information about the impact of the reservoir on the main river flow.

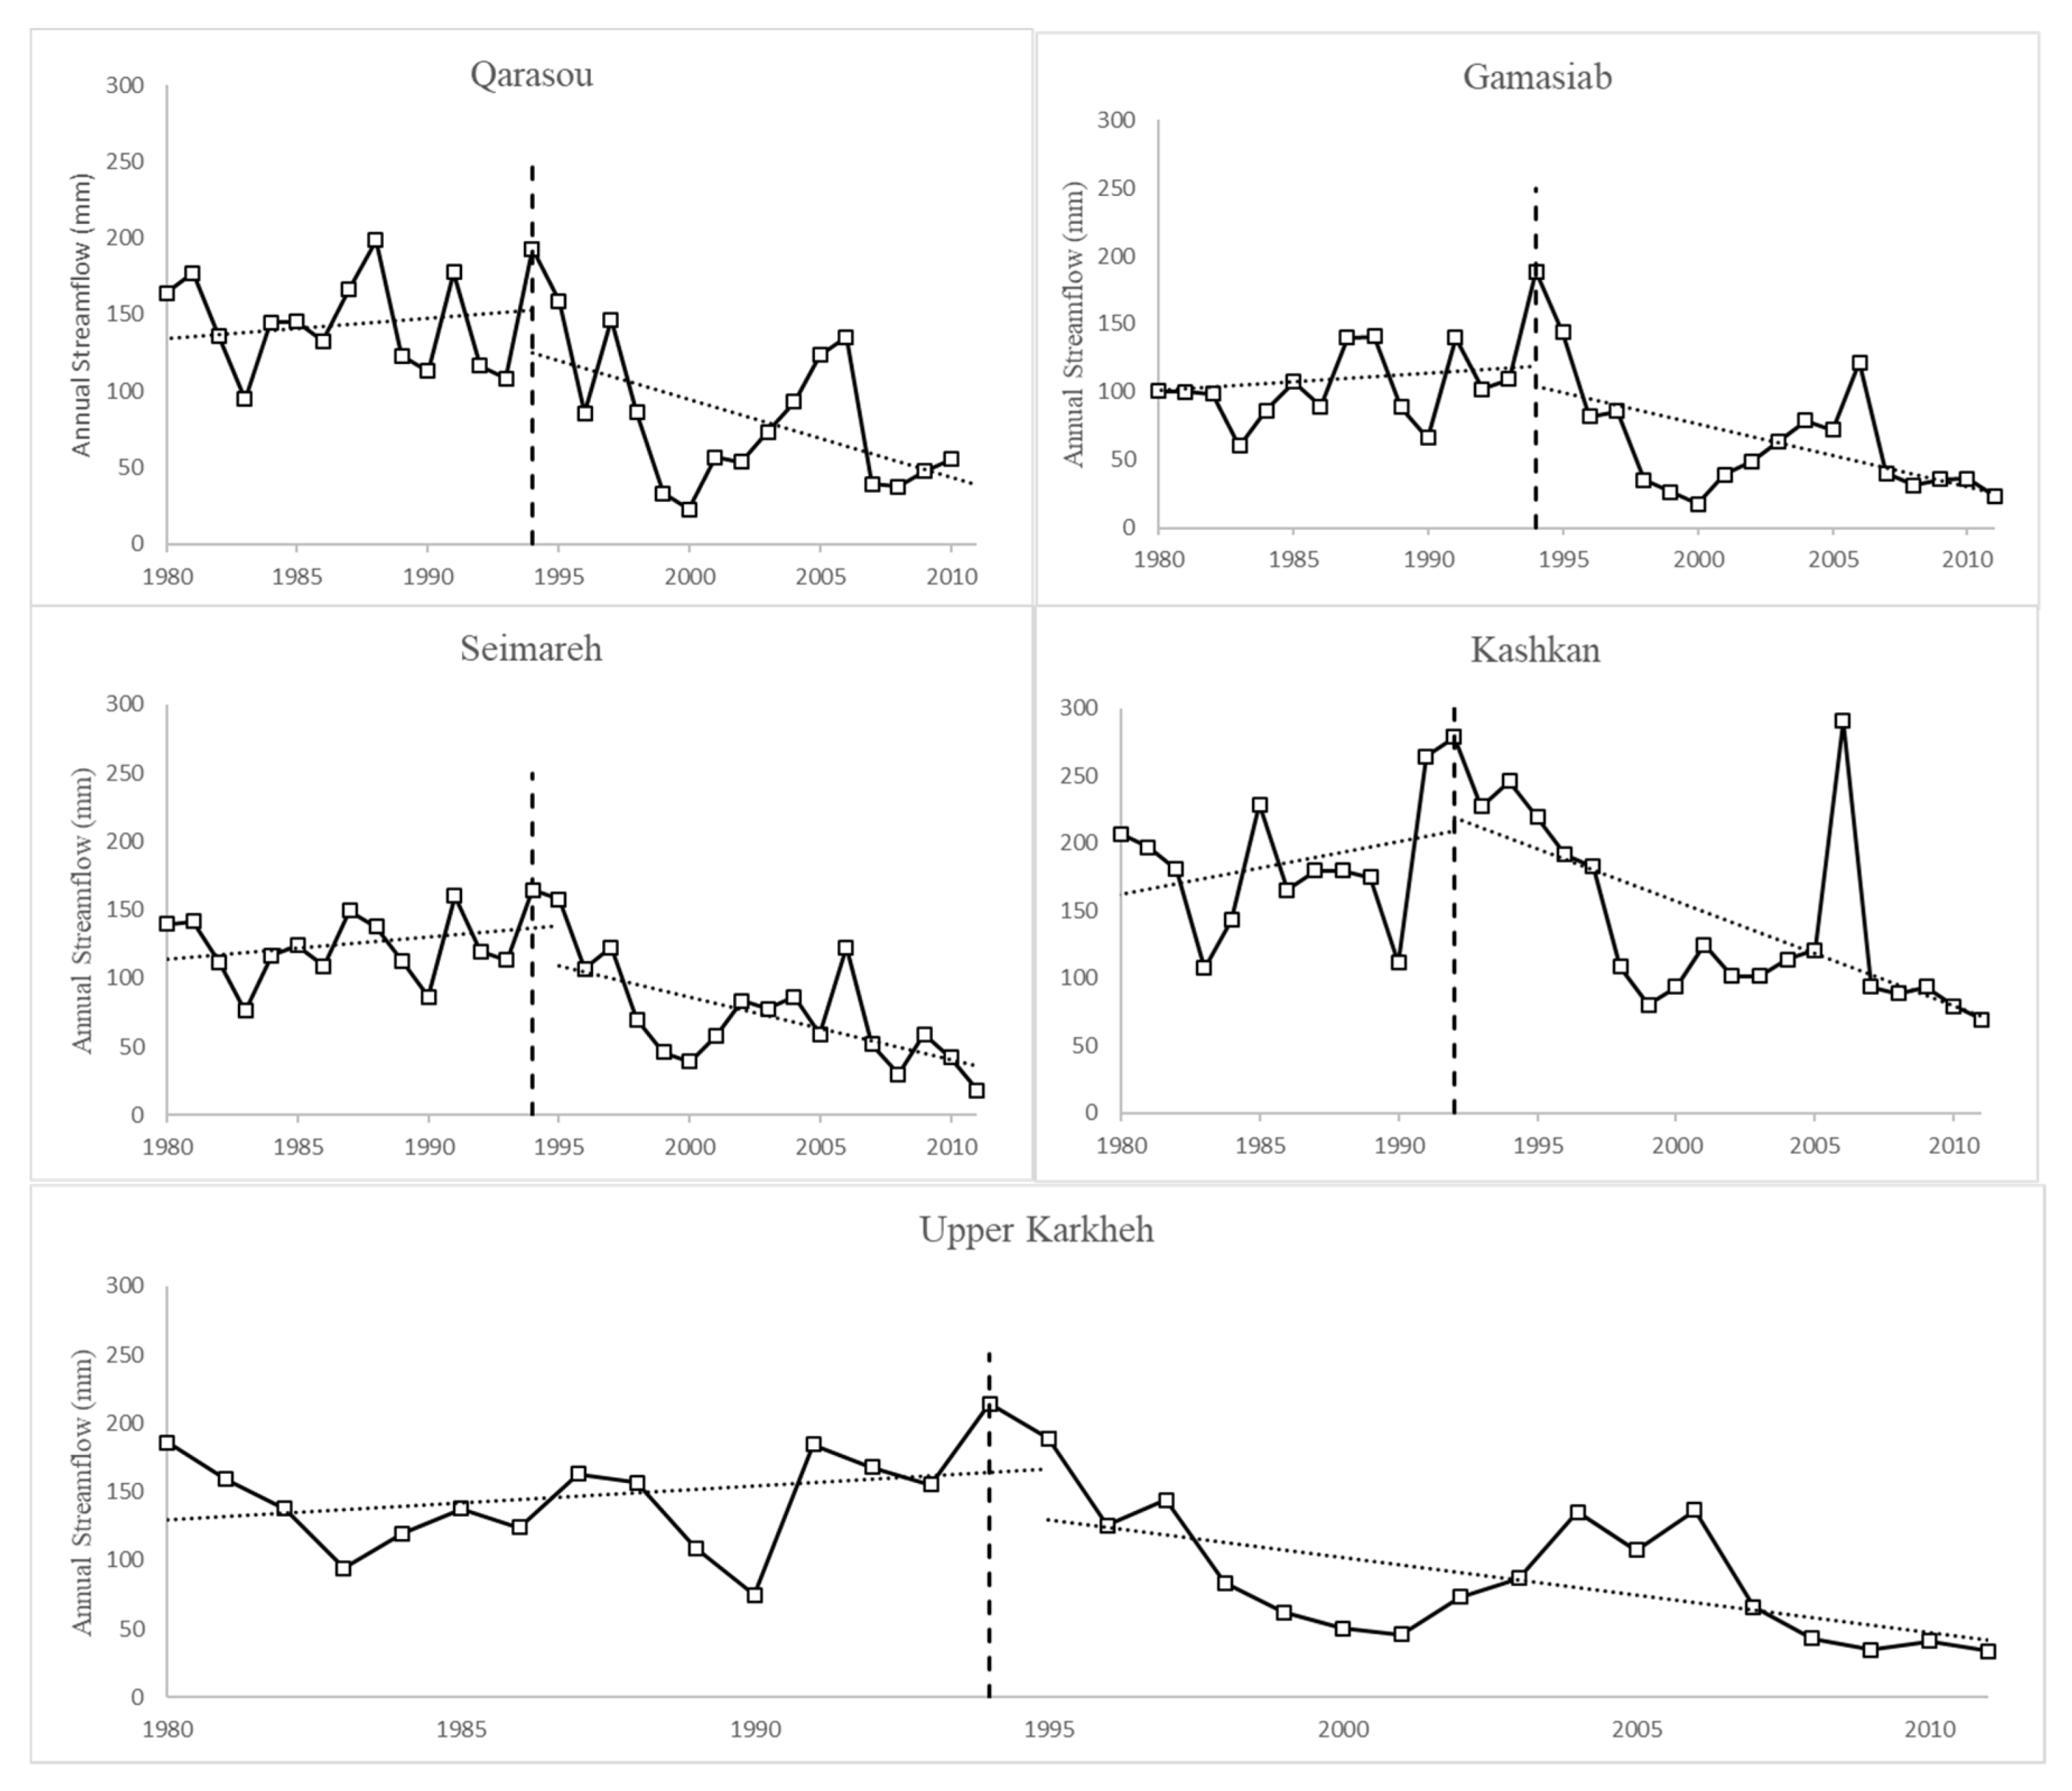
2.3. Change Detection

Hydrological modelling and the Budyko method, were employed to separate the impacts of climate variation and human activities on mean annual streamflow change in the KRB. The total change in streamflow (ΔQ) can be assumed to depend on climate variation ( Δ Q c ) and human activity ( Δ Q h ) [23,24,25]:
Δ Q = Δ Q c + Δ Q h
Major land use changes results in gradual streamflow changes, while climate can affect the streamflow abruptly [15,17]. Hence, the DBEST method was employed to pinpoint changes or breakpoints in the mean annual streamflow during the study period. DBEST is a user-friendly algorithm for analyzing time-series with two main application domains of generalizing trends to main features and detecting and characterizing trend changes. It uses a novel segmentation algorithm that simplifies the trend into linear segments, using the number of changes or a threshold for the magnitude of changes of interest for detection. In addition to detecting trend changes and estimating the statistical significance of the trend (using Student’s t-test), DBEST determines the timing, magnitude, number, direction, and type (abrupt or gradual) of the detected changes [15,18]. The validity of the detected changes is also examined in DBEST using Bayesian information (BIC) [26].
The detected breakpoint divides the streamflow time-series into a pre- and post-change period. In the pre-change period, also called the natural period, it is assumed that humans’ impacts on streamflow is not considerable. For the period after the breakpoint, the post-change period, both climate variation and human activities are considered to affect the streamflow [14,15,27,28,29].

2.4. Assessment of Streamflow Changes Using the HBV Hydrological Model

Different versions of the HBV model have been successfully applied in several basins across the world to simulate streamflow changes, including snow-influenced areas as well as semiarid climates at both local and regional scales (e.g., [24,30,31,32]). The latest version of the model, HBV-light, was selected for this study, due to its simple yet flexible structure. This is an important feature for a model to simulate a basin like Karkheh, which covers a large space from high mountainous terrain to low land areas at sea level. In this version, the basin area can be subdivided into different elevations and vegetation zones, suitable for the KRB, which is characterized by extensive elevation and vegetation range [30]. The model simulates streamflow at daily time steps using daily climate variables such as potential evapotranspiration, precipitation, and temperature. The HBV-light model uses variables from the warming-up period for initialization of parameters. An embedded genetic algorithm (GA) is used for auto- calibration. To assess the performance of the calibration, the model provides several common yet informative measures such as annual mean difference (δ), Nash–-Sutcliffe efficiency (Re), and Kling– Gupta efficiency (KGE).
The pre-change period was divided into calibration and validation periods. The calibration parameters (Table A4) were adapted according to the manual, catchment characteristics, and literature [24,25,30,33]. After calibration and validation of the model for the pre-change period, the HBV-light model was used to simulate flow of the post-change period, keeping parameters constant. Accordingly, Δ Q c was calculated by deducting the mean annual simulated streamflow from the post-change period and that of the pre-change period. Δ Q H was calculated as the difference between the mean annual simulated and observed streamflow, both from the post-change period (e.g., [8,14,15,27,28,29,34]). In this way, we were able to quantify the impact of climate variables and regional human activity for the post-change period.

2.5. Assessment of Streamflow Changes Using the Budyko Method

The Budyko method defines a physically understandable link between annual evapotranspiration and average water and energy balance at the basin level. It assumes that when the period of study is sufficiently long, the system is steady and water storage change is negligible [5]. Considering the water balance equation (Equation (3)), the Budyko method investigates the link between precipitation as an input of the hydrological system, and evapotranspiration and streamflow as outputs of the system. Hence, in the equation the water storage change (∆S) is insignificant when the water balance system is in a steady state [35]:
P = E + Q + Δ S
In the current study, to validate the steady state assumption for the KRB, the ABCD model was employed. The ABCD model is a widely used conceptual model which estimates water storage change in the catchment. This conceptual model, developed by Thomas (1981), is especially applicable for data-scarce regions [36,37,38], such as the KRB. The ABCD model code is written in R, and the model is further explained in Appendix C. After confirming the steady- state condition of the KRB, one of the most popular Budyko-type equations, the Choudhury equation (Equation (4)), was employed to calculate the effects of climate variation and regional human impact on streamflow at the basin level [39].
E P = 1 ( 1 + ( P E 0 ) n ) 1 / n
The empirical parameter n is a catchment characteristic, which represents soil properties, slope, land use, and climate seasonality [23,25,40]. The analytical elasticity method was used to define the contribution of each of the two variables to the streamflow changes, Δ Q (Equations (5)–(8)). In this method, ε P and ε E 0 (Equations (6) and (7)) are precipitation and potential evapotranspiration elasticity, respectively, and they are assumed to be independent [23,41]:
Δ Q C = ε P Δ P P ¯ Q ¯ + ε E 0 Δ E 0 E 0 ¯ Q ¯
ε P = { 1 1 / [ 1 + ( P E 0 ) n ] 1 + 1 / n   } / { 1 1 / [ 1 + ( P E 0 ) n ] 1 / n   }
ε E 0 = 1   [ 1 + ( E 0 P ) n ] 1 + 1 n   · 1 1 E 0 / P   1 [ 1 + ( E 0 P ) n ] 1 n
Δ Q H =   Δ Q     Δ Q C

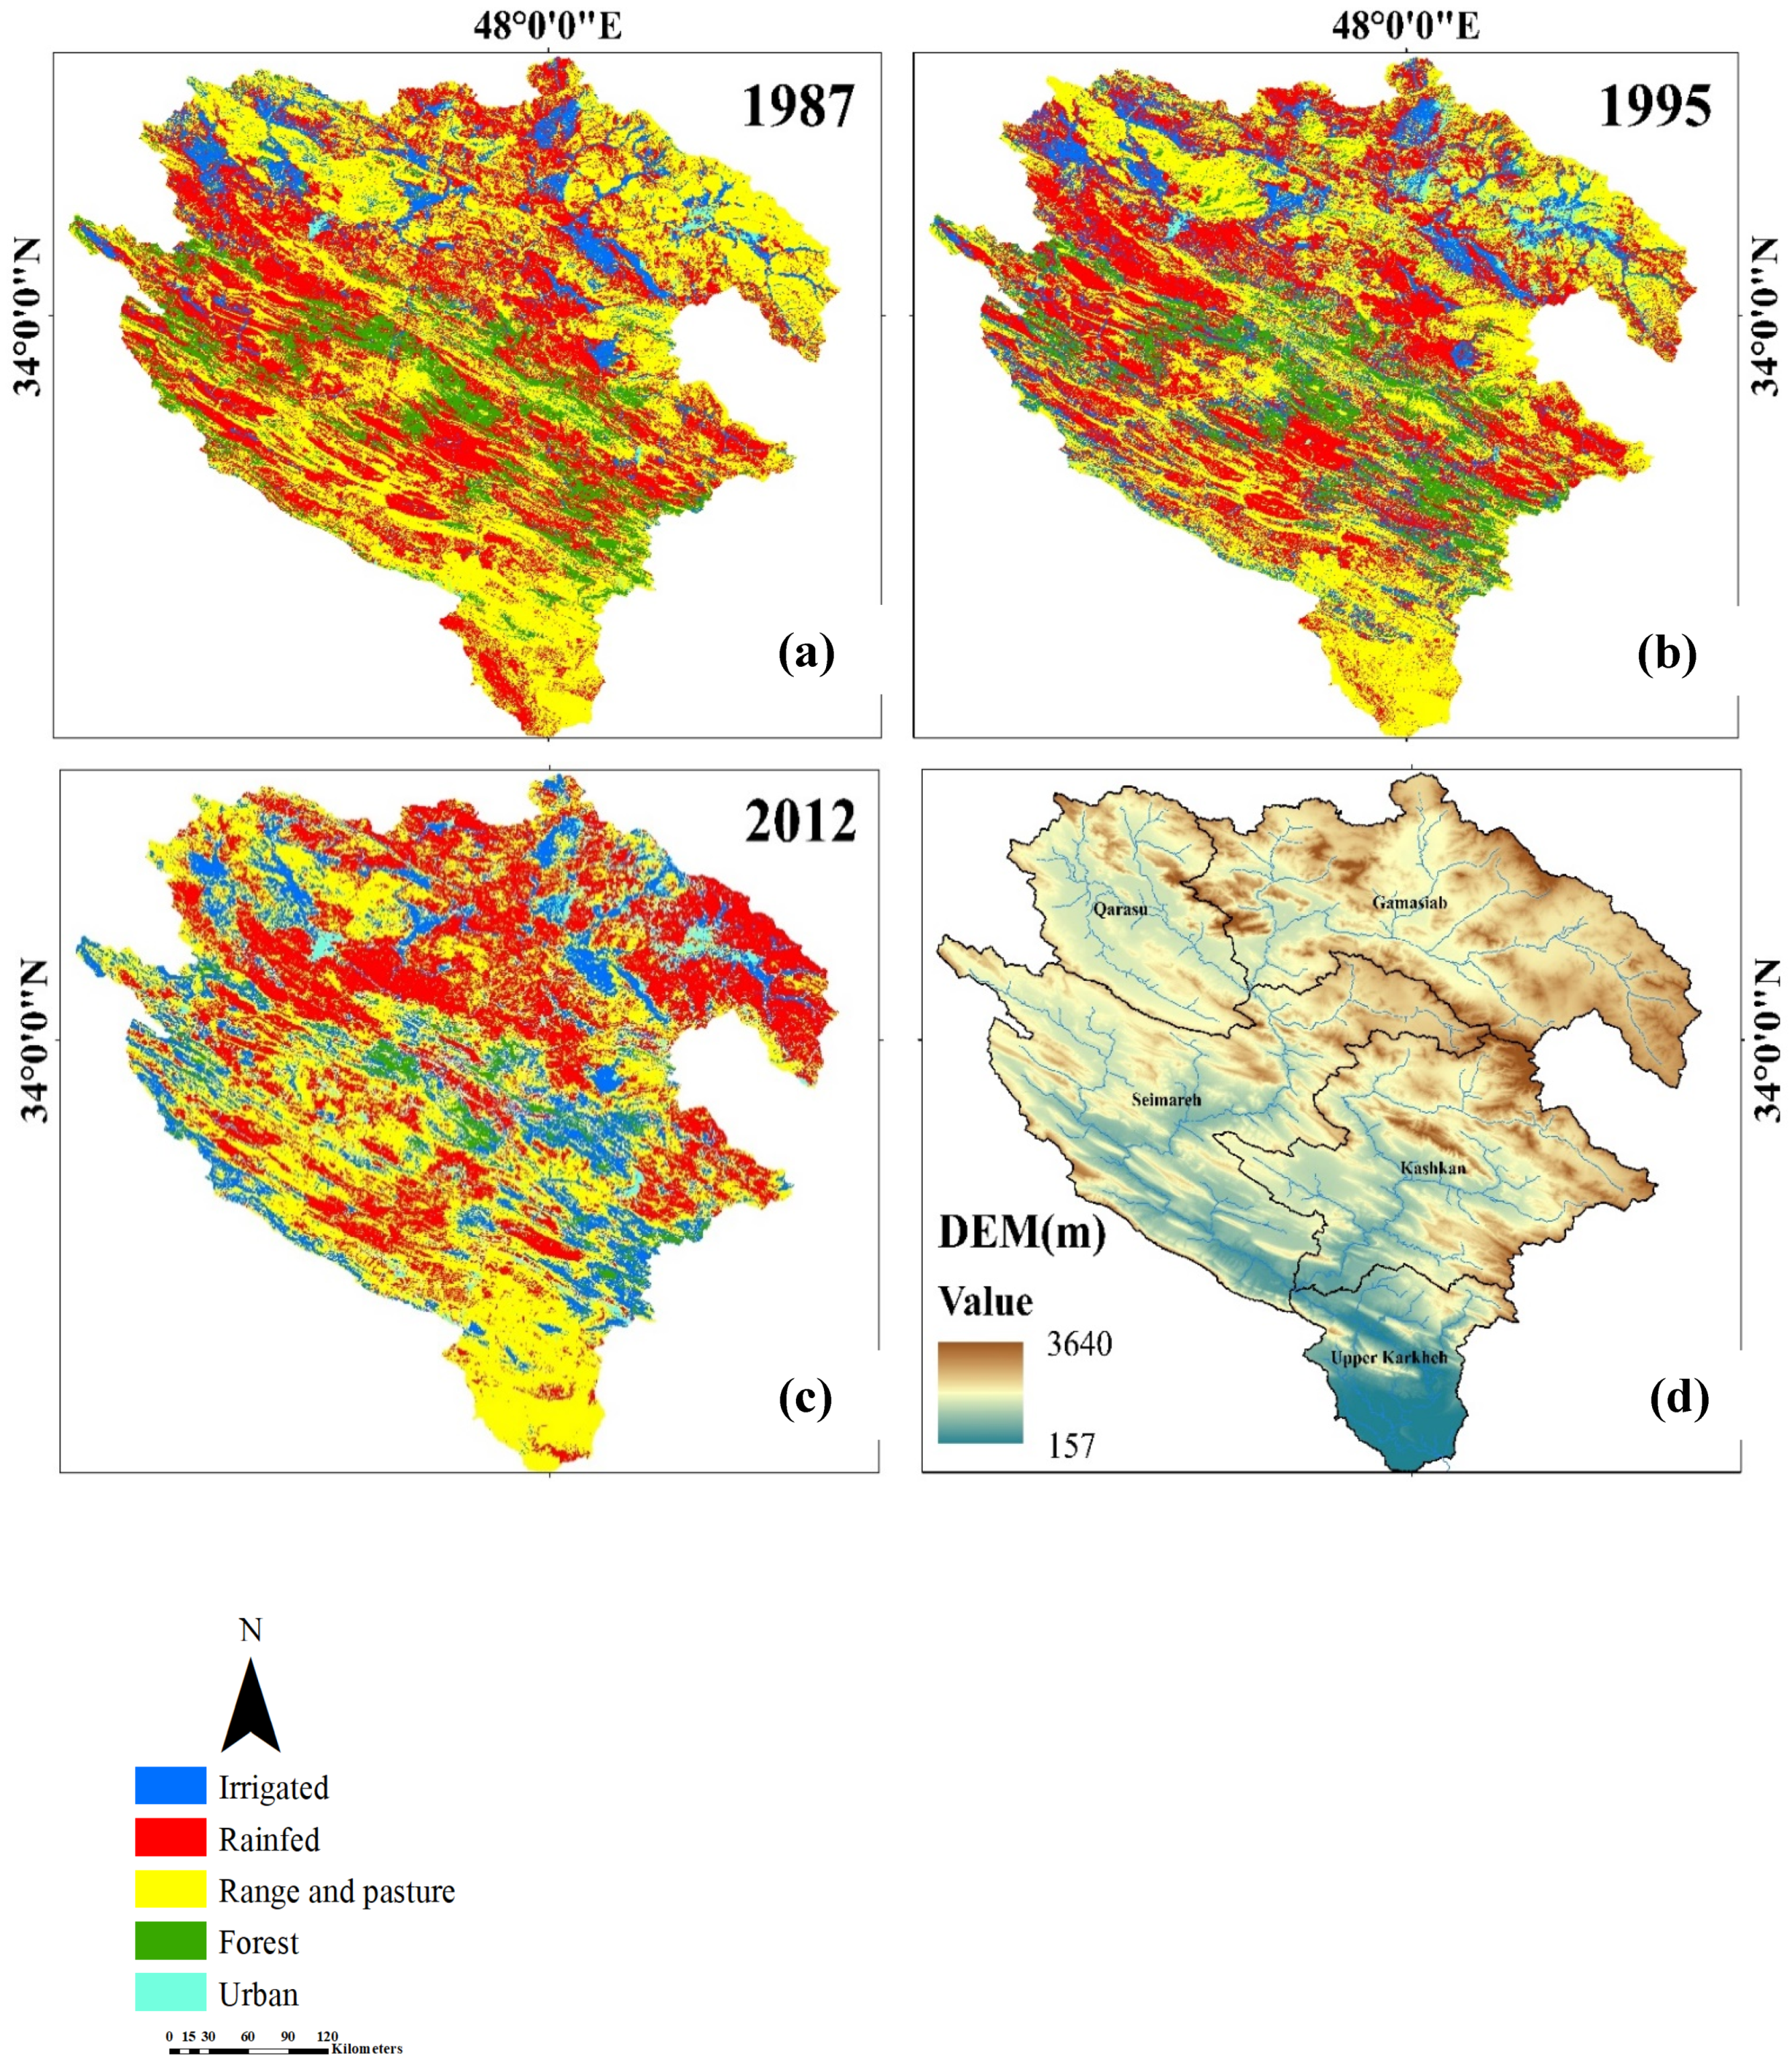
2.6. Analyzing Land Use–Land Cover Change during the Study Period

To validate the results of HBV and Budyko models concerning the contribution of climate vs. human impacts on stream flow changes, we implemented a remote sensing-based approach. Given the scarcity of land cover information in the KRB, multispectral Landsat satellite imagery were used to investigate the likely relationship between the land cover change and streamflow variation in the basin, and to obtain a spatiotemporal land use/land cover (LULC) information for the study area [42]. Landsat 5 Thematic Mapper (TM) was selected for this study because it offers high-resolution images (120 m) and complete spatial coverage of the study basin from 1980 to 2012.
Cloud-free Landsat images were acquired from Landsat 5 TM C1 Level-1 for three years of 1987, 1995, and 2012 (different months) representing the pre-change or natural period, transition period, and the post-change period, respectively. The images were, then, projected to the UTM (zone 38) and WGS 84 data reference system. The ground truth data were collected using the Global Positioning System (GPS) and ground control points from the Google Earth application to provide a signature for each land use type. These data were applied for classification and overall accuracy assessment of the classified images. Image classification processing was performed in the ENVI 4.8 environment by, employing a supervised classification technique with the maximum likelihood classifier (MLC) algorithm for generating the land use map. The MLC is a commonly used statistical technique for image classification and for evaluating the standard LULC [43]. Due to the complexity of the land use types in the basin, overlaps among different land use types, and a lack of sufficient numbers of historical ground truth data, an optimum threshold was determined to simplify the LULC classification of the study area.

2.7. Uncertainty Analysis

The application of hydrological models to discriminate the climate variation vs. human activities is a common approach (e.g., [44,45,46]). However, if the model is not well- calibrated, it can lead to uncertain results [8]. One of the main sources of uncertainty arises from non-uniqueness of model parameters, which means that different combinations of parameters may result in the same streamflow prediction [30]. Hence, the non-uniqueness of the model parameters was investigated. For this the ten -best sets of calibration parameters values produced by genetic algorithm (GA) were selected for each sub-basin to simulate the streamflow for the pre- and post-change periods. Subsequently, the impacts of climate variation and human activities were separated, accordingly.
In the case of Budyko method, the results can be affected by the noisy historical climate data [8]. In this study, the sensitivity of the Budyko equation to the precipitation and evapotranspiration input data was investigated using Equation (9) proposed by Yang et al. [41]. The equation derives the possible error of estimating streamflow due to climate parameter change as:
dQ = ε a da a · Q
where Q is flowrate (mm/year), ε is streamflow elasticity, and a is a climate parameter.
To provide an overview of the developed methodological approaches implemented in this study, Figure 2 illustrates the roadmap of the present study.

3. Results

The R-package (DBEST) was implemented to perform breakpoint detection and time-series analysis. For each sub-basin, DBEST detected one to three breakpoints in the streamflow trend, only one of which was major at the 0.05 statistical significance. The detected breakpoints were non-abrupt for all sub-basins and mostly occurred during the 1994–1995 period (Table 2 and Figure 3).
In the sub-basins, annual streamflow experienced a dramatic decrease from the pre-change period (1980–1994) to the post-change period (1995–2012).
As presented in Table 3, all sub-basins experienced a reduction in precipitation and an increase in evapotranspiration from the pre- to post-change period. The Qarasou sub-basin showed the most severe decline in average annual precipitation (−19%), while the Kashkan sub-basin experienced a minimum change in precipitation (+1%) relative to other sub-basins.
The DBEST analysis for potential evapotranspiration showed an increasing trend without detecting any significant breakpoint, while precipitation analysis showed two major breakpoints (1994 and 2006) in most sub-basins. As shown in Table 4, the major precipitation and streamflow breakpoints coincide for all sub-basins except for the Kashkan. In this particular sub-basin, the DBEST detected no significant breakpoint for precipitation but did detect an insignificant abrupt change in 1990, prior to the year that the streamflow breakpoint took place. In 2006, the Gamasiab, Seimareh, and Qarasou experienced substantial decreases in precipitation. While the streamflow trends were found to respond to this change, it did not significantly affect the already decreasing streamflow trends.

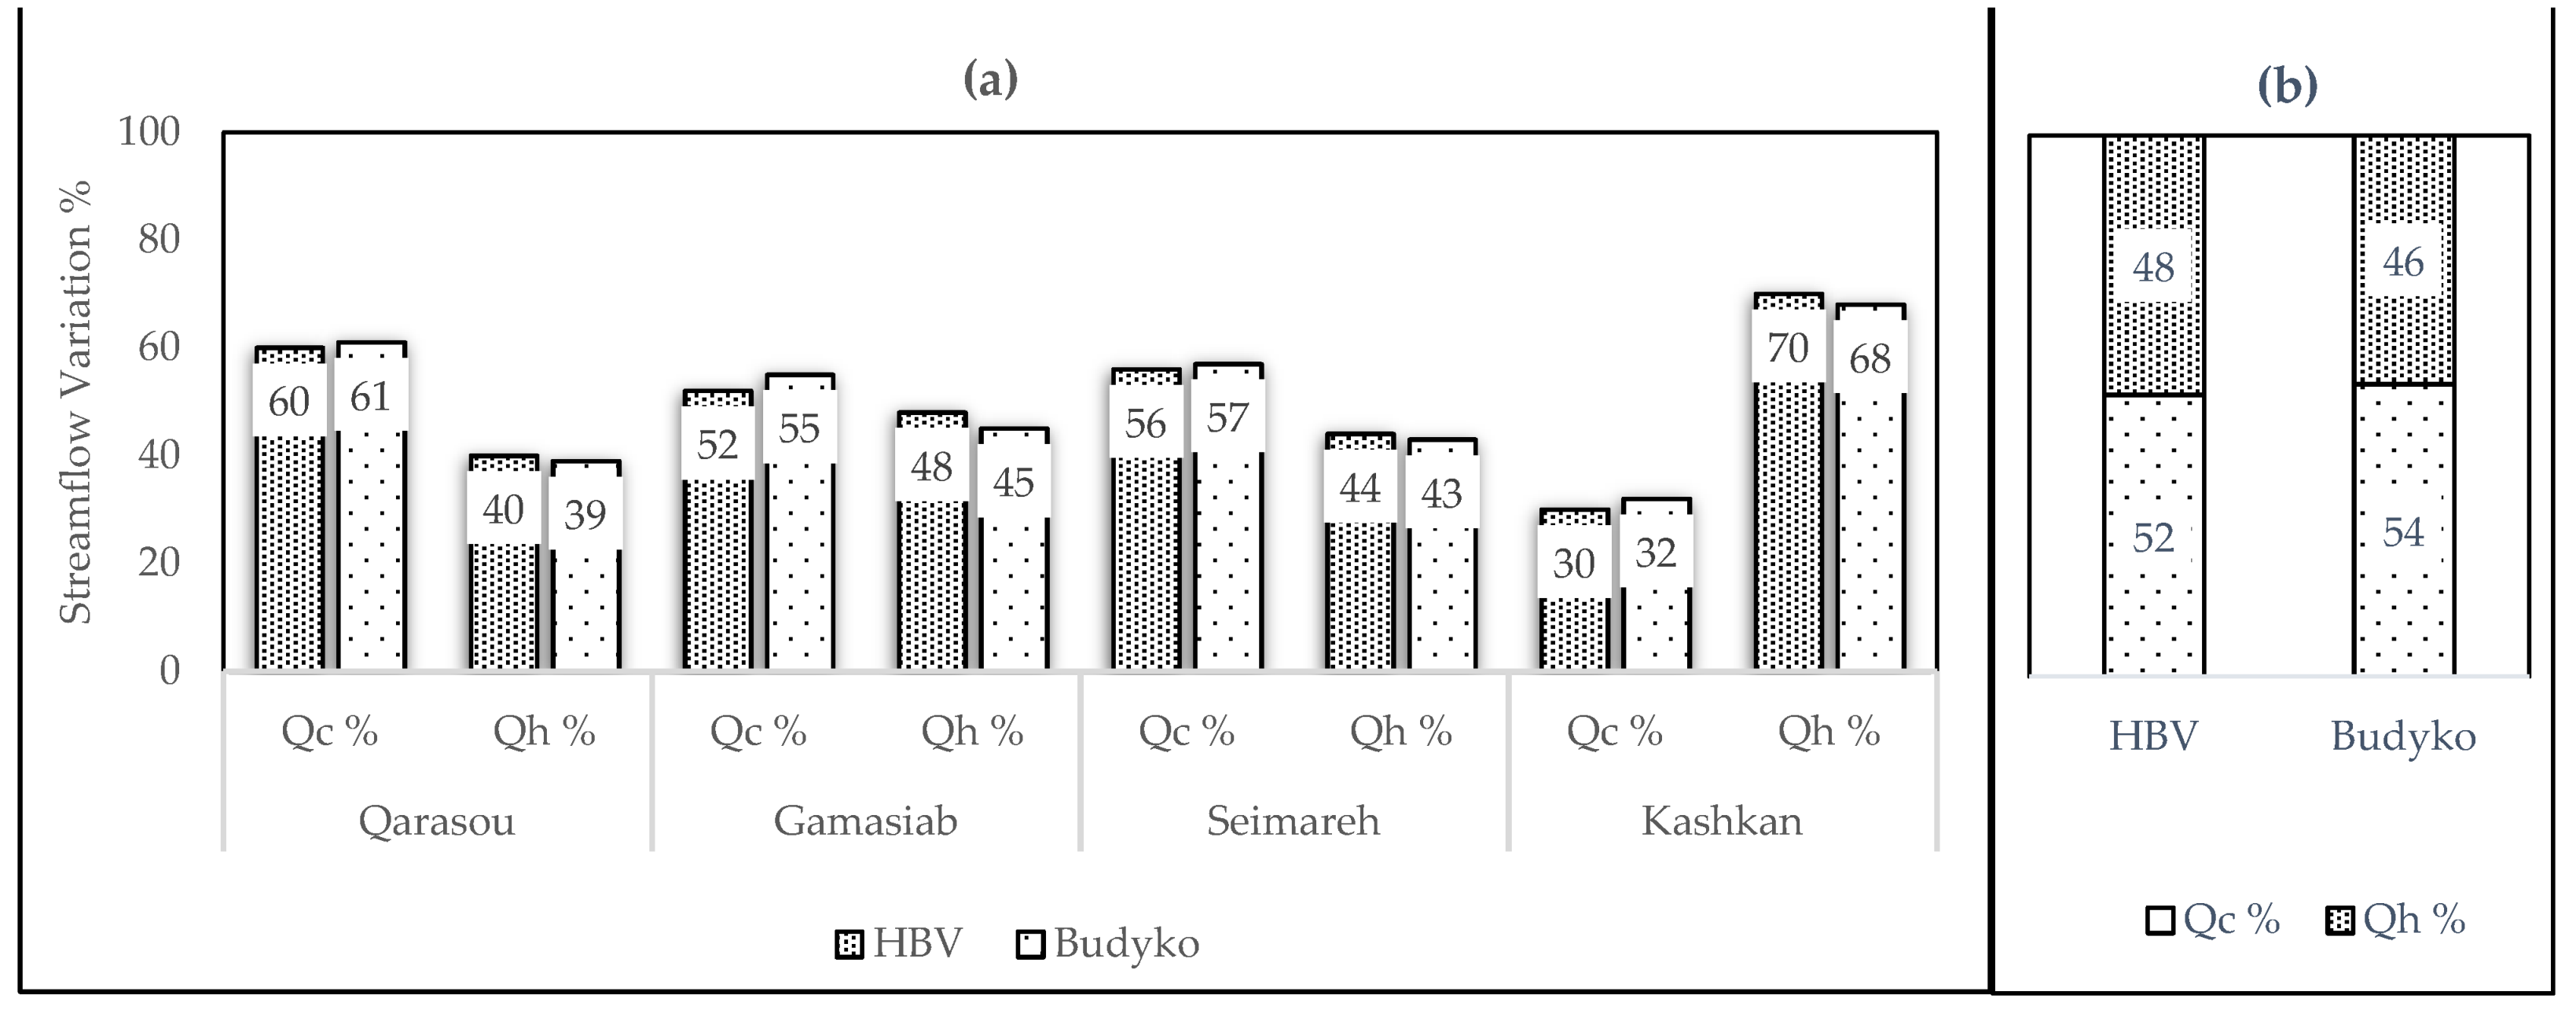
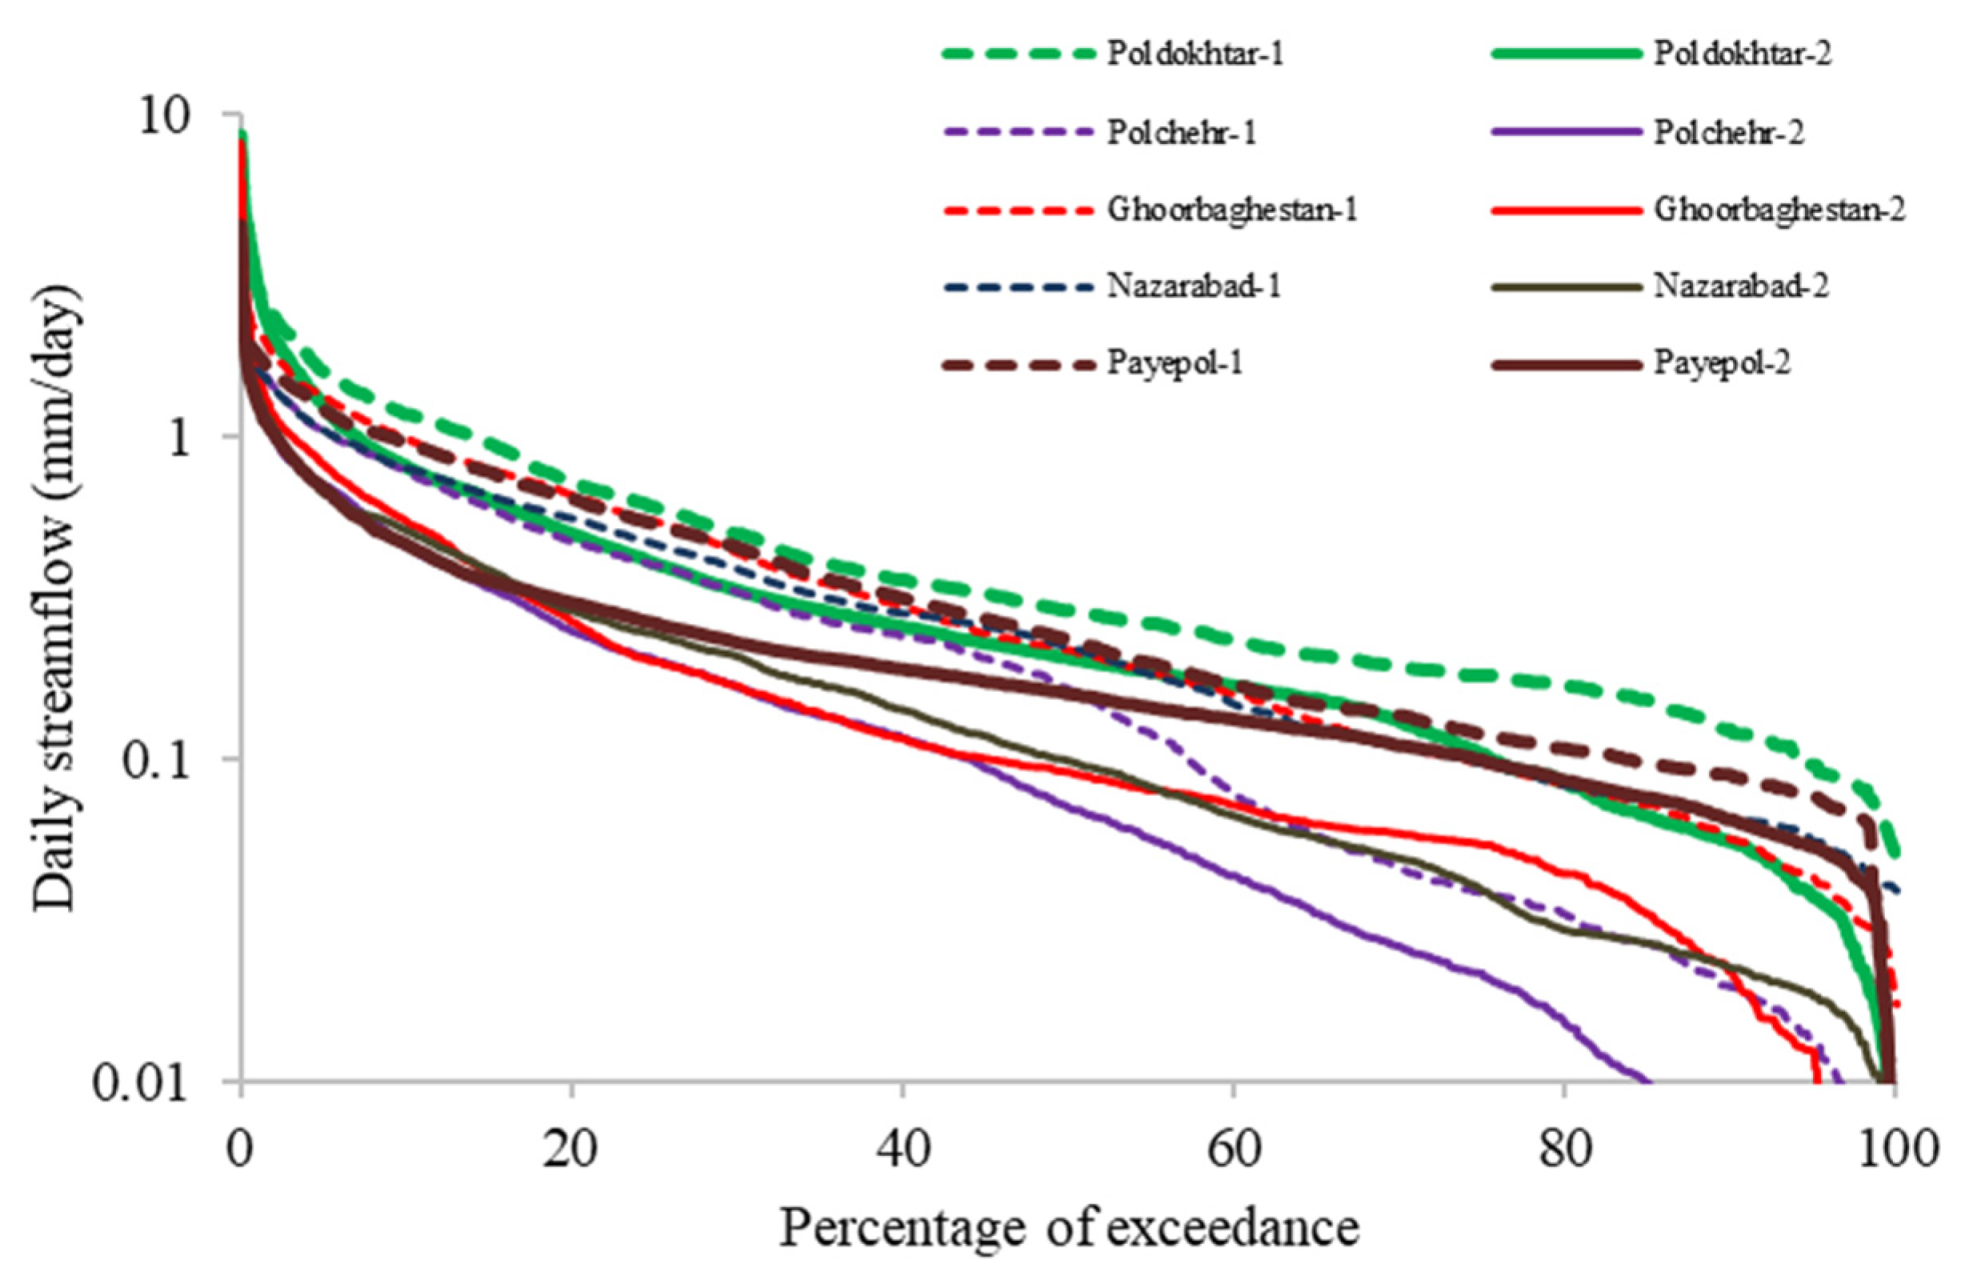
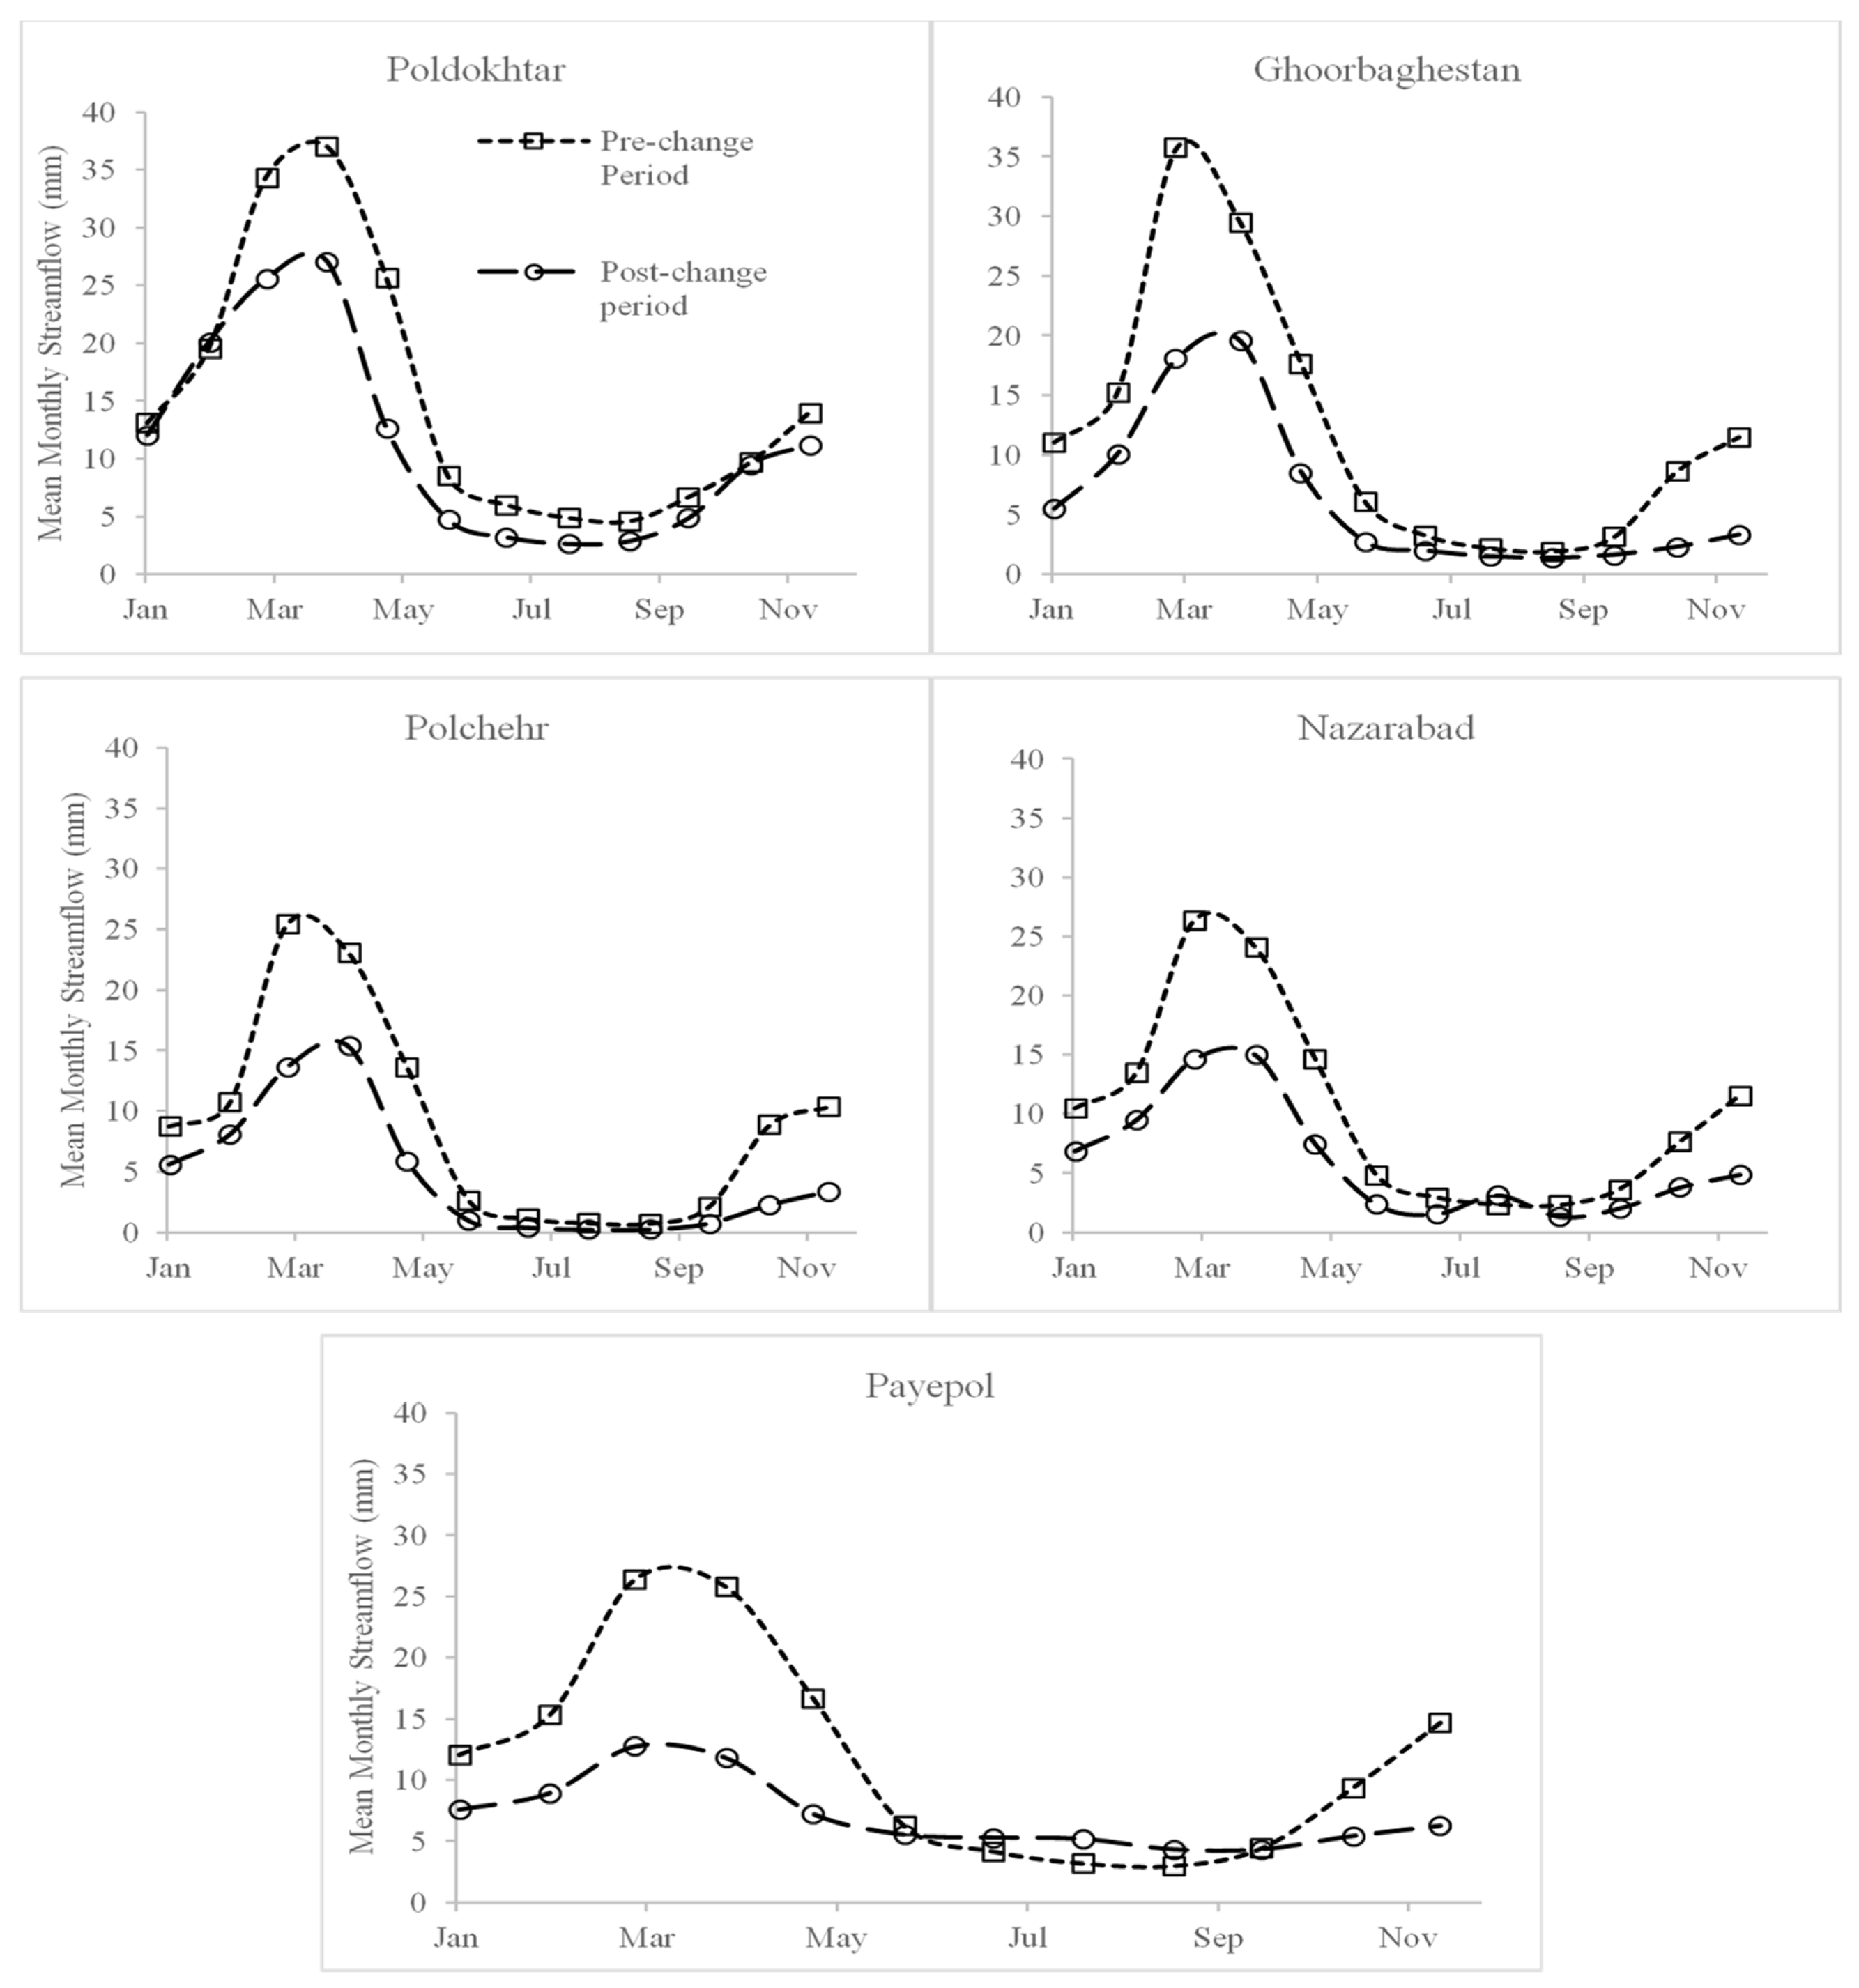
3.1. Hydrological Modelling

The evaluation indices presented in Table 5 implies that the HBV model was well-calibrated for the pre-change period, with the poorest performance observed for the Kashkan sub-basin (Re = 0.57). This seems to be a result of observed data quality.
The HBV modelling results for the ΔQc and ΔQh are presented in Table 6. It is shown that for all sub-basins except for the Kashkan, the streamflow reduction was mostly caused by climate variation. For the case of the Kashkan, streamflow reduction due to regional human activities (ΔQh) was significantly higher than ΔQc.

3.2. Budyko Method

The ABCD model showed that the average amount of water storage change (∆S), over the study period, is negligible (−0.17 mm) confirming that a steady state condition for the KRB is applicable (see Appendix C). Consequently, the parameters of precipitation elasticity (εP) and evapotranspiration elasticity (εE0) were calculated using Equations (6) and (7) (Table 6). The higher values of εP in comparison to εE0 for all sub-basins suggest that the hydrological responses of the sub-basins are more sensitive to the variation in precipitation than evapotranspiration. The negative εE0 indicates that evapotranspiration and streamflow are inversely related. As can be seen in Table 6, the ΔQc and ΔQh from the HBV model and the Budyko method varied between the sub-basins, but for any given sub-basin the results were compatible.
Figure 4a,b, provides a visual comparison between the implemented methods. Results for the Seimareh sub-basin are the cumulative response of the two upper sub-basins, Qarasou and Gamasiab, and the Seimareh. These findings indicate that both climate variation and human activities have a strong influence on streamflow changes in the sub-basins. However, the impact of climate variation on the stream flow changes is observed to be relatively more substantial than that of human activities in all sub-basins, except in the Kashkan.

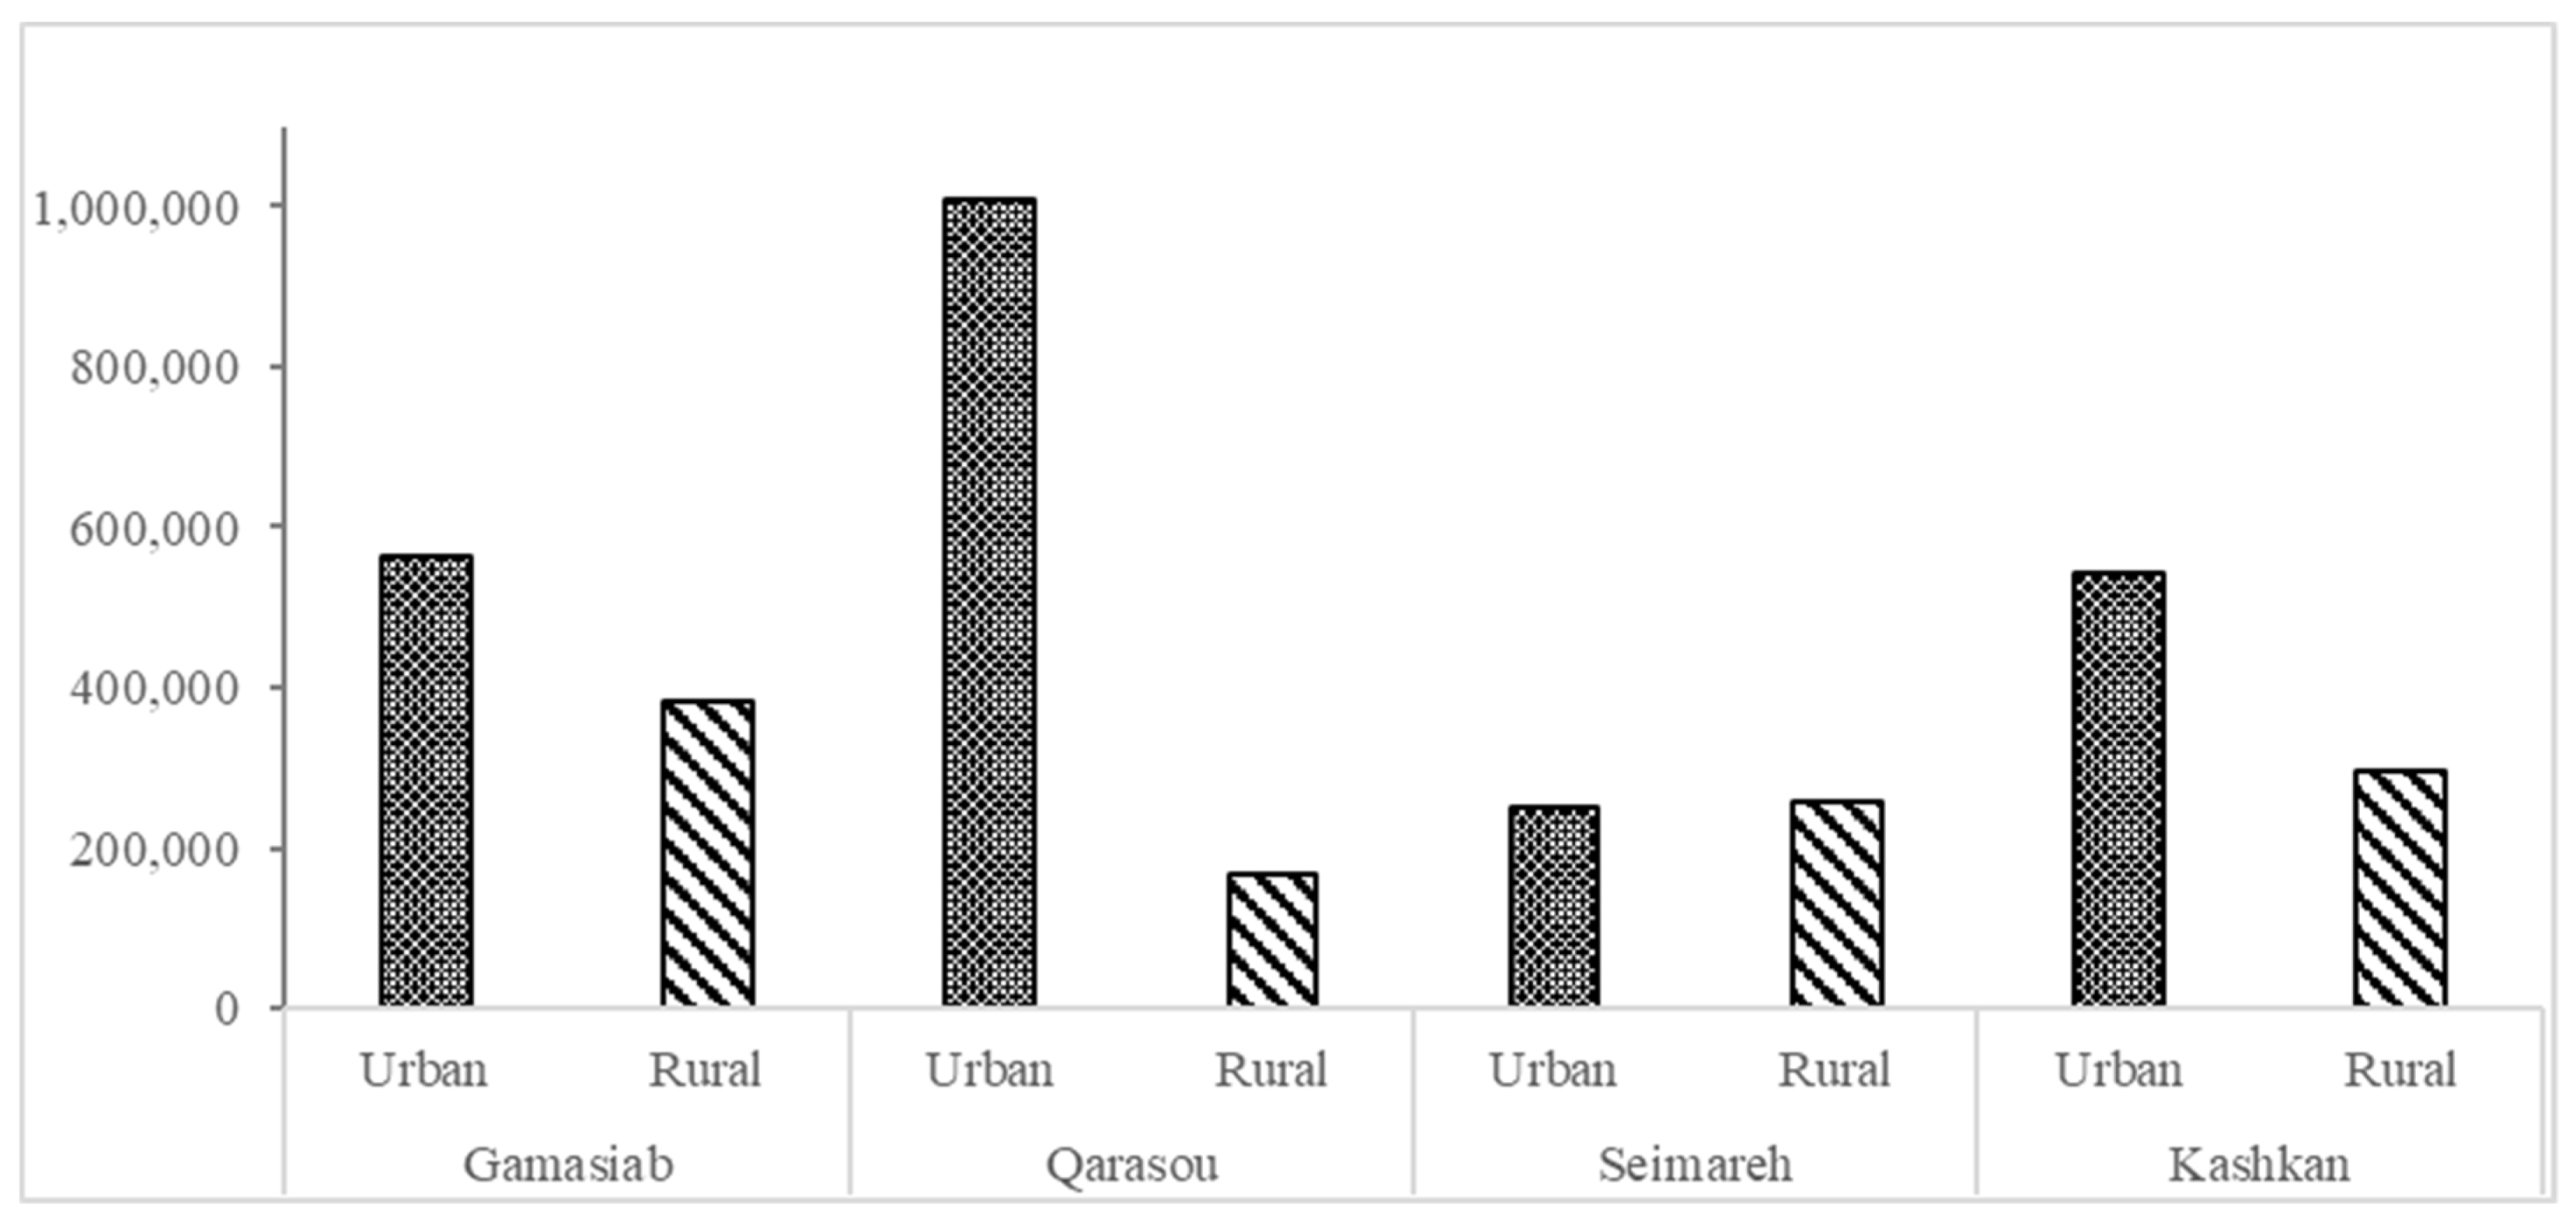
3.3. Land Use Change

Land cover change during the study period was investigated using Landsat 5 TM, as it is the only satellite mission that provides images dating back to the 1980s. The three years of 1987, 1995, and 2012 were selected to present the land use condition of the KRB, representing the three phases of the pre-change, transition, and post-change periods, respectively. Five types of land use were detected in the study area encompassing (i) irrigated (merged with about 5–10% rangelands and pasture area), (ii) rainfed (merged with about 10–20% irrigated and rangeland and pasture area), (iii) range and pasture, (iv) forest (merged with about 10–20% rangeland and pasture area), and (v) urban (includes buildings and orchards).
Figure 5 shows a noticeable expansion of irrigated farmlands in the basin during the three investigated years. Before the breakpoint, the majority of rainfed, range, and pasture areas were located in the mountainous region of the basin. Forests, mainly, covered the middle and south-eastern parts of the basin, while irrigated areas were scattered in the northern parts (Figure 5a). By 2012, after the breakpoint as presented in Figure 5c, a noticeable portion of rainfed farmland had converted to irrigated farmlands throughout the basin.
The LULC maps show that the KRB was initially covered predominantly by range, and pasture and rainfed farms. Although the basin is still covered, mostly, by the same land use types, the percentage area of the identified classes has changed since the 1980s (Table 7). According to Table 7 and Table 8, land use change, with a ~70% reduction in dense forest area and 100% increase in irrigated farms, accompanied with a 13% decline in rainfall, led to a more than 40% streamflow reduction for the entire basin, implying impacts of both climate variation and human activities. The present study suggests that all sub-basins in the KRB experienced a major abrupt change of streamflow during the 1994–1995 period, which coincides with the period of dam construction in the basin.
Figure 6 and Table 8 show that the forest area significantly decreased from 1987 to 2012, while the size of both irrigated areas and urban areas increased noticeably during the study period. Deforestation occurred in the south-eastern part of the basin, in the Kashkan sub-basin. Increasing urban area can influence the hydrological cycle of a basin dramatically by decreasing infiltration, vegetation cover, and changing the water consumption [15]. On the other hand, urbanization and deforestation result in decreased groundwater recharge and groundwater levels. The spatial decline of groundwater levels can have a major impact on the surface water flow through surface water-groundwater interactions.
The calculated land use map, together with the results from the Budyko and HBV methods, suggest that the streamflow decrease in the Kashkan sub-basin is mainly related to human activities rather than climate variation. In the case of the Upper Karkheh sub-basin, in addition to the cumulative response of the upstream sub-basins, the Karkheh Dam plays a major role in streamflow reduction. Based on a study conducted by Ahmad et al. (2010) [1], annual actual evapotranspiration varies from 41 to 1681 mm/year throughout the basin, with the highest rate for the Karkheh Dam, which indicates the substantial impact of the dam on basin-wide water balance.

3.4. Uncertainty and Sensitivity Analysis

The use of hydrological models is usually accompanied by uncertainty estimations related to the input of observed data or model structure. In order to adequately simulate a hydrological response at the basin level, accurate data such as climate variables (precipitation, E0, etc.) and the basin’s physical characteristics (topography, land coverage, vegetation, etc.) are vital. In climate variation-related studies, in which the study period is on the scale of decades, it is often difficult to obtain uniformly distributed and accurate data sets [47]. In the KRB, specifically, part of the uncertainty may arise from observed rainfall, potential evapotranspiration, and streamflow data. Weather gauges are usually not uniformly distributed in the entire basin. Moreover, elevation and topography of the basin can introduce bias to the observation time series, which can subsequently affect the runoff simulation [48]. To investigate uncertainty, the embedded GA in the HBV model provided sets of calibration parameters, leading to the best model performance. The 10 best sets were chosen to simulate streamflow. In other words, for each sub-basin, the HBV model was run 10 times to determine the impacts of climate variation and human activities for each set. If the results for the sub-basins remain consistent despite changes in parameters, the uncertainty is not significant and can be ignored [30]. Table 9 shows that the model’s responses to parameter change do not vary significantly. The highest range of change is less than 3.5% of the streamflow for all sub-basins.
While the Budyko method is more convenient and efficient, potential evapotranspiration and precipitation can introduce uncertainty to the results. Precipitation measurement was extended within the sub-basins using the Thiessen method, which is, basically, a simplification of the spatial variability of the input water to the system. Due to the lack of uniformly distributed E0 stations, a regression method was used for the case of E0 data, which again can introduce possible error to the modelling result. To address these issues, a sensitivity analysis of the Budyko equation with respect to the precipitation and evapotranspiration inputs was carried out. Table 10 shows the possible sources of error in the streamflow estimation, because of a 10% alternation in Budyko parameters, including P, E0, and n, for each sub-basin. As presented, the method is robust to these changes; for instance, the results suggest that a 10% change in the input precipitation data leads to a 3–5% error in streamflow estimation. On the other hand, the results indicate that streamflow estimation is not as sensitive to the evapotranspiration data.

4. Discussion

Studying the impacts of climate variation and regional human activities on water resources provides critical information for authorities and decision-makers to develop sustainable water resources management plans. Any hydrological variation due to these two factors (i.e., climate variation and human activities) can alter the status of streamflow, evapotranspiration, surface storage, and soil moisture, directly impacting a watershed’s hydro-environmental and hydro-ecological values. It can affect the vegetation, flora and fauna, intensifying the impact of intensify hydrological changes. In principle, variation in climate and regional activities can change the hydrological cycle, both directly through water supply demand, and indirectly through climate-induced vegetation change.
Most climate studies in the region have investigated the future hydrological response of the KRB basin under different climate scenarios (e.g., [49,50]). A handful of studies investigated water availability in the basin [2,30] and identified a significant decrease in the streamflow of the KRB during recent decades. For illustrating streamflow changes, flow duration curves (FDCs) and mean monthly flow for the pre- and post-change periods are provided in Figure 7 and Figure 8. Most climate studies in the region have investigated the future hydrological response of the KRB basin under different climate scenarios (e.g., [49,50]). A handful of studies investigated water availability in the basin [2,30] and stated significant decrease in streamflow of KRB during recent decades. For illustrating streamflow changes, Flow Duration Curves (FDCs) and mean monthly flow for the pre- and post-change periods are provided in Figure 7 and Figure 8.
Whilst the findings of this study confirm streamflow reduction in all sub-basins, a closer look at the flow duration curve (FDC) reveals a significant reduction in both high flow rates, i.e., streamflow with the exceedance probability of 5% (Q5), and low flow rates, i.e., streamflow with the exceedance probability of 95% (Q95) (Figure 7). For instance, the mean daily streamflow decreased by one-third during 50% of the study period in the Payepol station (Figure 7). The mean monthly flow in the sub-basins also experienced a major reduction for all months (Figure 8), with the exception of the Payepol station, in which the streamflow showed an increase in the summer months (June through -August) during the post-change period. This might be the result of river flow regulation due to the operation of the Karkheh Dam since 2001. The reservoir water, which is stored during times of abundance, is released in the summer season;, therefore, an increase in summer flow does not necessarily mean an increase in natural streamflow caused by rainfall throughout the basin. Moreover, for the Kashkan sub-basin, the difference between streamflow in the pre- and post-change periods, during late autumn and winter (October through -February) was less than that of the other sub-basins. For the summer months (June through -August), on the contrary, the largest differences between pre- and post-change period streamflow were observed in the Kashkan sub-basin (Figure 8). It can be postulated that intensive agricultural activities in the area led to a higher actual evapotranspiration and, therefore, the larger difference between the streamflow during the two periods.
The DBEST method showed streamflow breakpoints occurred gradually over time, which seemed to be related to the gradual LULC changes. On the other hand, precipitation analysis captured the breakpoints in the same year, which implies climate parameter variation is also effective. For the case of the Kashkan sub-basin, non-abrupt changes in the streamflow trend and an insignificant breakpoint in the precipitation trend can strengthen the claim that human activity has a dominant role in streamflow change. The findings were further validated when Landsat data analysis showed a significant change in land use during the study period. Employing image processing techniques added qualitative aspect to the framework and provided beneficial information of both quality and quantity regarding human activities and climate variation in the region.
A handful of studies that investigated the small-scale sub-basin hydrological processes of the KRB, revealed notable land use changes during the 1990′s. For instance, Karimi et al. (2018) [51] observed a dramatic increase in irrigated farms and urban areas during the 1992–2015 period in the Ravansar basin within the Qarasou sub-basin. Based on personal discussions with local authorities in the Kashkan sub-basin, there was a substantial investment in expanding agricultural lands in this basin during the 1990s. The primary purpose of this investment was to create jobs for locals. Kashkan, with a rural population of almost 300,000, is the most densely populated sub-basin in the KRB. The population density and development of agricultural lands are in line with the result of this study, suggesting that human influence is a dominant factor in streamflow reduction in this specific basin. The Seimareh sub-basin also experienced extensive agricultural development during the study period (Table 7).
Developing water distribution systems and the construction of reservoirs in the KRB have improved food production and provided easier lives for the residents. However, it has dramatically disturbed the water cycle in the basin. The KRB is considered a semiarid to arid region, which is subjected to water scarcity. Increasing human population, agricultural and industrial activities, and urbanization demands, combined with the governmental policy of being self-sufficient in food production, have put additional pressure on the water resources in the area [2]. Any change in LULC can lead to significant change in the basin-wide water balance by impacting, for example, groundwater storage, soil infiltration, and actual evapotranspiration [52].
The population of the KRB is predicted to increase to 4.8 million by the year 2025, out of which 75% will live in urban areas. Urbanization in the northern sub-basins will increase the strain on water resources in the basin, while in the southern part of the basin, dam constructions and 300,000 ha of planned irrigation programs would be overwhelming for the groundwater and surface water resources [21]. Accordingly, policymakers should carefully follow any changes in the quality and quantity of the available freshwater, as well as any changes in the hydrological behaviour of the stream flows. We believe the implemented method in this study is easy to replicate and does not need extensive observed data, which makes it a competitive approach to adopt, especially in the basins with limited data. Despite the timescale differences considered in the calculations (the annual timescale for the Budyko method and the daily timescale for hydrological modelling), the results of both methods, were highly consistent, with a minimum underestimation of climate variation by the HBV model compared to the Budyko method.
The results provide insight regarding the appropriate development of urban and rural management plans, restoration of ecological environments, implementation of conservation projects, and regulation of irrigation schemes, and can also impact sustainable management based on regional decisions on basin as well as sub-basin scales. If current water management and ecosystem planning remains unchanged, the combined impacts of climate variation and human activity may severely damage the stability of the ecosystem of the entire basin. Although, the main focus of the current study was the KRB, the proposed framework can be easily adapted to other case studies around the globe, particularly where data availability is an issue.

Limitations of the Study

To carry out the study using a hydrological approach, some assumptions were made. Similar to in previous literature (e.g., [14,28,29]), it was assumed that no human activity was involved in the streamflow variation during the pre-change period. In other words, the human activities in the pre-change period were considered negligible and the hydrological processes were assumed to be natural. It was also assumed that climate variation and human activities are two independent variables, while in reality, they are tied together and can amplify or amend each other [15]. In this study, the climate variability is defined as a combination of variability in the climate parameters, as well as global-scale human-induced effects that cause a worldwide greenhouse gas emissions. Human activities, on the other hand, are defined as the regional impacts of humans, considering the fact that dam construction and land use change, including urbanization and agricultural activities, etc., are intimately embedded in the human impact.
The catchment characteristic parameter (n) was assumed to be constant during the study period, while the value of n was subjected to change by changing LULC and also was dependent on other climate parameters, such as climate seasonality, mean storm depth [41], vegetation coverage [40], and/or effective rooting depth and plant root characteristics [53]. To calculate this parameter, following the same approach as similar studies (e.g., [8,23]), we simultaneously modelled E using Equation (4) and minimized the difference between the calculated E and observed long-term E. The catchment characteristic parameter (n) was assumed to be constant during the study period, while, the value of n is subjected to change by changing LULC and also is dependent on other climate parameters, such as climate seasonality, mean storm depth [41], vegetation coverage [40], and/or effective rooting depth and plant root characteristics [53]. To calculate this parameter, following the same approach as similar studies (e.g., [8,23]), we simultaneously modelled E using Equation (4) and minimized the difference between the calculated E and observed long-term E.
In the case of remote sensing, because of the shortages in historical ground truth points, availability of high-quality images, and complex land use types, the land use maps might be subjected to some uncertainties. For this, we considered an average overlap of ~10% between the similar land uses, as explained in the Methods section.

5. Conclusions

This paper introduces a new framework for analysing and separating contributions of climate variation vs. human activities to streamflow changes in the large and data-scarce basins. The Budyko method and HBV modeling were used to define the underlying reasons affecting streamflow, and the DBEST algorithm verified the results by detecting both non-abrupt changes in the streamflow caused by anthropogenic effects and abrupt changes in precipitation amount due to dramatic climate variation. The observable impacts of human activities in the form of land use change, obtained from satellite remote sensing, were additionally used for verification of the results of the Budyko method and HBV modelling. Sensitivity and uncertainty analyses were applied to these two methods, respectively. The methodology was successfully implemented for the KRB, and it was shown, by both the Budyko method and HBV modelling, that in most of the studied sub-basins, climate variation and human activities (i.e., agriculture, deforestation, and water diversion) were more or less equally responsible for the streamflow reduction. Land use maps based on Landsat 5 TM images suggested significant changes in land cover throughout the basin for the study period between 1980 and 2012. While it might be difficult to locally manage the impact of climate variation (as it is likely to be affected by changes on the global scale), existing knowledge of the regional scale anthropogenic impacts on water quantity, as suggested by the framework, can provide insights that leads to informed management plans, such as improved irrigation techniques, nature-based solutions, and urbanization control, to limit the adverse impacts of human activity on the streamflow. This, in turn, can compensate for the adverse impact of climate variations by adapting to a changing climate. On the other hand, the lack of such a framework in the hydrological studies may result either in wrongly condemning climate variation as the only causative factor contributing to the most hydro-agricultural and environmental problems or in confusing the regional policymakers regarding how to cope with the problem efficiently based on the less likely assumptions. Therefore, the outcomes of this study can be used to assist policymakers and water professionals in proposing a proper water management plan to prevent the further reduction of streamflow. The proposed methodology can be applied to any other catchment/region, particularly where access to data is challenging.

Author Contributions

H.K.: Conceptualization, Data curation, Formal analysis, Investigation, Methodology, Software, Validation, Visualization and Writing (original draft), Writing (reviewing and editing); H.H.: Funding acquisition, Methodology, Project administration, Resources, Supervision, Validation and Writing (reviewing and editing); F.F.M.: Software, Writing (reviewing and editing); S.H.H.: Data curation, Methodology, Writing (reviewing and editing); R.S.: Supervision and Writing (reviewing and editing); S.J.: Software, Writing (reviewing and editing); R.B.: Funding acquisition, Supervi-sion, Validation and Writing (reviewing and editing). All authors have read and agreed to the published version of the manuscript.

Funding

This work was partly supported by the Centre for Advanced Middle Eastern Studies, Lund University, Sweden. Grant agreement: MECW.

Institutional Review Board Statement

Not applicable.

Informed Consent Statement

Not applicable.

Data Availability Statement

The study did not report any data.

Acknowledgments

This project was funded in part by the MECW project at the Centre for Advanced Middle Eastern Studies, Lund University, Sweden. The hydrological data were acquired from the regional water companies of the corresponding provinces, as well as the Iran Water Resources Engineering Company. The meteorological data were provided by the Iran Meteorological Organization. The images for Landsat 5 TM C1 were acquired from the United States Geological Survey official website (http://earthexplorer.usgs.gov/ (accessed on 10 January 2019)).

Conflicts of Interest

The authors declare no conflict of interest.

Appendix A

Table A1. The KRB’s major dams of the KRB.
NameLong °ELat °NStorage-Normal Level (BCM)PurposeOperation Date
Karkheh48.150632.42085.6Irrigation, hydropower generation, flood control2001
Seimareh47.190833.31832.8Hydropower generation2013
Table A2. E0 reference stations and related temperature stations.
Reference E0 StationAltitude (m)Temperature StationAltittude (m)
Chamanjir1140Khorramabad
Koohdasht
1147
1190
Dasht Abbas161Dehloran232
Abdolkhan40
Hamidieh22
Chamgaz350Darreshahr670
Doab1310
Varayeneh1760Hamedan
Borujerd
1741
1630
Kheirabad1763Malayer
Eyvan
Kangavar
Nahavand
1778
1200
1468
1680
Ravansar1388Kamyaran1404
Mahidasht1360Eslamabad1349
Holeilan950Ilam1340
Dartoot703
Polchehr1280Kermanshah1306
Table A3. The KRB streamflow stations, their locations, recorded length, and streamflow characteristics.
Sub-BasinStationLong. °ELat. °NAltit. (m)Record LengthAnnual P (mm)Mean Q (mm/year)
QarasouGhoorbaghestan47.2534.2313001975–2011452111
GamasiabPolchehr47.4334.3313061970–201142981
KashkanPoldokhtar47.7233.176501980–2011512158
SeimarehNazarabad47.4333.175591979–201140697
Upper KarkhehPayepol48.1532.42901974–2011422114
Table A4. Suggested range for the calibration parameters of the HBV model.
ParameterUnitDescriptionRange
TT°CThreshold temperature−2.5–2.5
CFMAXmm °C−1 d−1Degree-day factor1–6
SFCF Snowfall correction factor0.5–1.25
FCmmMaximum of storage in soil box50–500
LP Threshold of reduction of evaporation1–6
Percmm d−1Maximum flow from upper to lower box0.1–6
UZLmmThreshold of Q0 outflow in upper box10–100
K0d−1Recession coefficient0.05–0.5
K1d−1Recession coefficient0.01–0.15
K2d−1Recession coefficient0.0001–0.05
MaxBASdRouting, length of weighting function1–6

Appendix B

Figure A1. Approximated population distribution in the KRB based on the 2015 national record.
Water 13 02404 g0a1
Figure A2. R2 between monthly evapotranspiration (E0) and average temperature (T) for the Polchehr reference station in 1995.
Water 13 02404 g0a2

Appendix C

The ABCD model uses monthly precipitation and potential evapotranspiration as an input and provides monthly actual evapotranspiration, streamflow, and soil and groundwater storage estimation. There are four parameters in the model (i.e., a, b, c, and d) to be defined and calibrated prior to simulation [36]. In this model, initial soil water storage (Si-1) and precipitation in a month (Pi) are defined as available water. Equation (A1) describes the correlation between available water (Wi) and evapotranspiration opportunity (Yi). The parameter of evapotranspiration opportunity (Yi) is a combination of soil water storage at the end of the month (Si) and actual evapotranspiration (Ei) [36,37,38]:
Y i ( W i ) = W i + b 2 a ( W i + b 2 a ) 2 W i b a
The groundwater discharge (base flow) is calculated as:
G i G i 1 = cR i dG i
where Gi−1 and Gi are the initial and end- of- the- month groundwater storage.
The monthly streamflow (Qi) from direct runoff (Ri) and groundwater discharge is estimated as:
Q i = ( 1 c ) R i dG i
Soil water storage at the end of the month can be derived as:
S i = Y i exp ( E 0 i / b )
Therefore, actual evapotranspiration of the given month can be obtained by deducting Si from the evapotranspiration opportunity (Yi).
The ABCD model code was developed in R, and the embedded genetic algorithm (GA) provided the best set of parameters (i.e., a, b, c and d) for the model. The objective functions for GA were Kling–-Gupta efficiency (KGE) and Nash–-Sutcliffe efficiency (Re), between monthly observed streamflow and monthly estimated streamflow.
Table A5. Calibration performance indices for the KRB.
KGERe
ABCD model0.760.63
Figure A3. Monthly water storage change in the KRB.
Water 13 02404 g0a3

References

  1. Ahmad, M.-U.; Giordano, M. The Karkheh River basin: The food basket of Iran under pressure. Water Int. 2010, 35, 522–544. [Google Scholar] [CrossRef]
  2. Masih, I.; Uhlenbrook, S.; Maskey, S.; Smakhtin, V. Streamflow trends and climate linkages in the Zagros Mountains, Iran. Clim. Chang. 2010, 104, 317–338. [Google Scholar] [CrossRef]
  3. Hashemi, H. Climate Change and the Future of Water Management in Iran. Middle East Crit. 2015, 24, 307–323. [Google Scholar] [CrossRef]
  4. Mesgaran, M.B.; Madani, K.; Hashemi, H.; Azadi, P. Iran’s land suitability for agriculture. Sci. Rep. 2017, 7, 7670. [Google Scholar] [CrossRef] [PubMed]
  5. Liu, J.; Zhang, Q.; Singh, V.P.; Shi, P. Contribution of multiple climatic variables and human activities to streamflow changes across China. J. Hydrol. 2017, 545, 145–162. [Google Scholar] [CrossRef] [Green Version]
  6. Yaseen, Z.M.; Kisi, O.; Demir, V. Enhancing Long-Term Streamflow Forecasting and Predicting using Periodicity Data Component: Application of Artificial Intelligence. Water Resour. Manag. 2016, 30, 4125–4151. [Google Scholar] [CrossRef]
  7. Fu, G.; Charles, S.P.; Chiew, F.H.S. A two-parameter climate elasticity of streamflow index to assess climate change effects on annual streamflow. Water Resour. Res. 2007, 43, 11. [Google Scholar] [CrossRef]
  8. Hu, S.; Liu, C.; Zheng, H.; Wang, Z.; Yu, J. Assessing the impacts of climate variability and human activities on streamflow in the water source area of Baiyangdian Lake. J. Geogr. Sci. 2012, 22, 895–905. [Google Scholar] [CrossRef]
  9. Hashemi, H.; Uvo, C.B.; Berndtsson, R. Coupled modeling approach to assess climate change impacts on groundwater recharge and adaptation in arid areas. Hydrol. Earth Syst. Sci. 2015, 19, 4165–4181. [Google Scholar] [CrossRef] [Green Version]
  10. Geris, J.; Tetzlaff, D.; Seibert, J.; Vis, M.; Soulsby, C. Conceptual Modelling to Assess Hydrological Impacts and Evaluate Environmental Flow Scenarios in Montane River Systems Regulated for Hydropower. River Res. Appl. 2014, 31, 1066–1081. [Google Scholar] [CrossRef]
  11. Birhanu, A.; Masih, I.; van der Zaag, P.; Nyssen, J.; Cai, X. Impacts of land use and land cover changes on hydrology of the Gumara catchment, Ethiopia. Phys. Chem. Earth Parts A/B/C 2019, 112, 165–174. [Google Scholar] [CrossRef]
  12. Patterson, L.A.; Lutz, B.D.; Doyle, M.W. Climate and direct human contributions to changes in mean annual streamflow in the South Atlantic, USA. Water Resour. Res. 2013, 49, 7278–7291. [Google Scholar] [CrossRef]
  13. Wang, W.; Shao, Q.; Yang, T.; Peng, S.; Xing, W.; Sun, F.; Luo, Y. Quantitative assessment of the impact of climate variability and human activities on runoff changes: A case study in four catchments of the Haihe River basin, China. Hydrol. Process. 2012, 27, 1158–1174. [Google Scholar] [CrossRef]
  14. Wu, J.; Miao, C.; Zhang, X.; Yang, T.; Duan, Q. Detecting the quantitative hydrological response to changes in climate and human activities. Sci. Total Environ. 2017, 586, 328–337. [Google Scholar] [CrossRef]
  15. Dey, P.; Mishra, A. Separating the impacts of climate change and human activities on streamflow: A review of methodologies and critical assumptions. J. Hydrol. 2017, 548, 278–290. [Google Scholar] [CrossRef]
  16. Liu, J.; Zhou, Z.; Yan, Z.; Gong, J.; Jiajia, L.; Xu, C.-Y.; Wang, H. A new approach to separating the impacts of climate change and multiple human activities on water cycle processes based on a distributed hydrological model. J. Hydrol. 2019, 578, 124096. [Google Scholar] [CrossRef]
  17. Ivancic, T.J.; Shaw, S.B. Identifying spatial clustering in change points of streamflow across the contiguous U.S. between 1945 and 2009. Geophys. Res. Lett. 2017, 44, 2445–2453. [Google Scholar] [CrossRef]
  18. Jamali, S.; Jönsson, P.; Eklundh, L.; Ardö, J.; Seaquist, J. Detecting changes in vegetation trends using time series segmentation. Remote Sens. Environ. 2015, 156, 182–195. [Google Scholar] [CrossRef]
  19. Muthuwatta, L.P.; Ahmad, M.-U.; Bos, M.G.; Rientjes, T.H.M. Assessment of Water Availability and Consumption in the Karkheh River Basin, Iran—Using Remote Sensing and Geo-statistics. Water Resour. Manag. 2009, 24, 459–484. [Google Scholar] [CrossRef]
  20. Engineers, J.C. Water Balance Report of Karkheh River Basin Area: Preliminary Analysis; Ministry of Energy: Tehran, Iran, 2006. [Google Scholar]
  21. Marjanizadeh, S.; de Fraiture, C.; Loiskandl, W. Food and water scenarios for the Karkheh River Basin, Iran. Water Int. 2010, 35, 409–424. [Google Scholar] [CrossRef]
  22. Lambert, L.; Chitrakar, B.D. Variation of Potential Evapotranspiration with Elevation in Nepal. Mt. Res. Dev. 1989, 9, 145. [Google Scholar] [CrossRef]
  23. Liang, W.; Bai, D.; Wang, F.; Fu, B.; Yan, J.; Wang, S.; Yang, Y.; Long, D.; Feng, M. Quantifying the impacts of climate change and ecological restoration on streamflow changes based on a Budyko hydrological model in China’s Loess Plateau. Water Resour. Res. 2015, 51, 6500–6519. [Google Scholar] [CrossRef]
  24. Al-Safi, H.I.J.; Kazemi, H.; Sarukkalige, P.R. Comparative study of conceptual versus distributed hydrologic modelling to evaluate the impact of climate change on future runoff in unregulated catchments. J. Water Clim. Chang. 2020, 11, 341–366. [Google Scholar] [CrossRef]
  25. Kazemi, H.; Sarukkalige, R.; Badrzadeh, H. Evaluation of streamflow changes due to climate variation and human activities using the Budyko approach. Environ. Earth Sci. 2019, 78, 713. [Google Scholar] [CrossRef]
  26. Schwarz, G. Estimating the Dimension of a Model. Ann. Stat. 1978, 6, 461–464. [Google Scholar] [CrossRef]
  27. Fan, J.; Tian, F.; Yang, Y.; Han, S.; Qiu, G. Quantifying the magnitude of the impact of climate change and human activity on runoff decline in Mian River Basin, China. Water Sci. Technol. 2010, 62, 783–791. [Google Scholar] [CrossRef]
  28. Zeng, S.; Xia, J.; Du, H. Separating the effects of climate change and human activities on runoff over different time scales in the Zhang River basin. Stoch. Environ. Res. Risk Assess. 2013, 28, 401–413. [Google Scholar] [CrossRef]
  29. Zhang, Q.; Liu, J.; Singh, V.P.; Gu, X.; Chen, X. Evaluation of impacts of climate change and human activities on streamflow in the Poyang Lake basin, China. Hydrol. Process. 2016, 30, 2562–2576. [Google Scholar] [CrossRef]
  30. Masih, I.; Uhlenbrook, S.; Maskey, S.; Ahmad, M.-U. Regionalization of a conceptual rainfall–runoff model based on similarity of the flow duration curve: A case study from the semi-arid Karkheh basin, Iran. J. Hydrol. 2010, 391, 188–201. [Google Scholar] [CrossRef]
  31. Li, J.; Zhou, S. Quantifying the contribution of climate- and human-induced runoff decrease in the Luanhe river basin, China. J. Water Clim. Chang. 2015, 7, 430–442. [Google Scholar] [CrossRef]
  32. Li, Y.; He, D.; Li, X.; Zhang, Y.; Yang, L. Contributions of Climate Variability and Human Activities to Runoff Changes in the Upper Catchment of the Red River Basin, China. Water 2016, 8, 414. [Google Scholar] [CrossRef] [Green Version]
  33. Johansson, B. IHMS Integrated Hydrological Modeling System Manual Version 6.3; Swedish Meteorological and Hydrological Institute: Stockholm, Sweden, 2013; p. 144. [Google Scholar]
  34. Chang, J.; Zhang, H.; Wang, Y.; Zhu, Y. Assessing the impact of climate variability and human activities on streamflow variation. Hydrol. Earth Syst. Sci. 2016, 20, 1547–1560. [Google Scholar] [CrossRef] [Green Version]
  35. Xu, X.; Liu, W.; Scanlon, B.R.; Zhang, L.; Pan, M. Local and global factors controlling water-energy balances within the Budyko framework. Geophys. Res. Lett. 2013, 40, 6123–6129. [Google Scholar] [CrossRef]
  36. Du, C.; Sun, F.; Yu, J.; Liu, X.; Chen, Y. New interpretation of the role of water balance in an extended Budyko hypothesis in arid regions. Hydrol. Earth Syst. Sci. 2016, 20, 393–409. [Google Scholar] [CrossRef] [Green Version]
  37. Wang, X.-S.; Zhou, Y. Shift of annual water balance in the Budyko space for catchments with groundwater-dependent evapotranspiration. Hydrol. Earth Syst. Sci. 2016, 20, 3673–3690. [Google Scholar] [CrossRef] [Green Version]
  38. Wang, X.; Gao, B.; Wang, X. A Modified ABCD Model with Temperature-Dependent Parameters for Cold Regions: Application to Reconstruct the Changing Runoff in the Headwater Catchment of the Golmud River, China. Water 2020, 12, 1812. [Google Scholar] [CrossRef]
  39. Wang, C.; Wang, S.; Fu, B.; Zhang, L. Advances in hydrological modelling with the Budyko framework: A review. Prog. Phys. Geogr. 2016, 40, 409–430. [Google Scholar] [CrossRef]
  40. Li, D.; Pan, M.; Cong, Z.; Zhang, L.; Wood, E. Vegetation control on water and energy balance within the Budyko framework. Water Resour. Res. 2013, 49, 969–976. [Google Scholar] [CrossRef]
  41. Yang, H.; Yang, D. Derivation of climate elasticity of runoff to assess the effects of climate change on annual runoff. Water Resour. Res. 2011, 47, 7. [Google Scholar] [CrossRef]
  42. Jafari, R.; Hasheminasab, S. Assessing the effects of dam building on land degradation in central Iran with Landsat LST and LULC time series. Environ. Monit. Assess. 2017, 189, 74. [Google Scholar] [CrossRef]
  43. Zaidi, S.M.; Akbari, A.; Abu Samah, A.; Kong, N.; Gisen, J. Landsat-5 Time Series Analysis for Land Use/Land Cover Change Detection Using NDVI and Semi-Supervised Classification Techniques. Pol. J. Environ. Stud. 2017, 26, 2833–2840. [Google Scholar] [CrossRef]
  44. Wang, G.; Xia, J.; Chen, J. Quantification of effects of climate variations and human activities on runoff by a monthly water balance model: A case study of the Chaobai River basin in northern China. Water Resour. Res. 2009, 45. [Google Scholar] [CrossRef] [Green Version]
  45. Li, D.; Tian, Y.; Liu, C. Distributed hydrological simulation of the source regions of the Yellow River under environmental changes. Acta Geogr. Sin. 2004, 59, 565–573. [Google Scholar]
  46. Montenegro, A.; Ragab, R. Hydrological response of a Brazilian semi-arid catchment to different land use and climate change scenarios: A modelling study. Hydrol. Process. 2010, 24, 2705–2723. [Google Scholar] [CrossRef]
  47. Kapangaziwiri, E.; Hughes, D.; Wagener, T. Towards the development of a consistent uncertainty framework for hydrological predictions in South Africa. IAHS Publ. 2009, 333, 84. [Google Scholar]
  48. Rientjes, T.; Muthuwatta, L.; Bos, M.; Booij, M.; Bhatti, H. Multi-variable calibration of a semi-distributed hydrological model using streamflow data and satellite-based evapotranspiration. J. Hydrol. 2013, 505, 276–290. [Google Scholar] [CrossRef]
  49. Abbaspour, K.C.; Faramarzi, M.; Ghasemi, S.S.; Yang, H. Assessing the impact of climate change on water resources in Iran. Water Resour. Res. 2009, 45, 10. [Google Scholar] [CrossRef] [Green Version]
  50. Jamali, S.; Abrishamchi, A.; Marino, M.A.; Abbasnia, A. Climate change impact assessment on hydrology of Karkheh Basin, Iran. Proc. Inst. Civ. Eng.-Water Manag. 2013, 158, 93–104. [Google Scholar] [CrossRef]
  51. Karimi, H.; Jafarnezhad, J.; Khaledi, J.; Ahmadi, P. Monitoring and prediction of land use/land cover changes using CA-Markov model: A case study of Ravansar County in Iran. Arab. J. Geosci. 2018, 11, 592. [Google Scholar] [CrossRef]
  52. Hashemi, H.; Berndtsson, R.; Kompanizare, M.; Persson, M. Natural vs. artificial groundwater recharge, quantification through inverse modeling. Hydrol. Earth Syst. Sci. 2013, 17, 637–650. [Google Scholar] [CrossRef] [Green Version]
  53. Cong, Z.; Zhang, X.; Li, D.; Yang, H.; Yang, D. Understanding hydrological trends by combining the Budyko hypothesis and a stochastic soil moisture model. Hydrol. Sci. J. 2014, 60, 145–155. [Google Scholar] [CrossRef]
Figure 1. Location of the Karkheh River basin in Iran. E0 denotes potential evapotranspiration.
Water 13 02404 g001
Figure 2. Flowchart of the implemented methodology.
Water 13 02404 g002
Figure 3. Streamflow trend in the sub-basins and their breakpoints as detected by DBEST.
Water 13 02404 g003
Figure 4. (a) Percentage of streamflow (Q) changes for all sub-basins due to climate variability and human activities. (b) Cumulative percentage of streamflow variation (%) for the entire KRB due to climate variability and human impact. c and h indicate climate variation and human activities, respectively.
Water 13 02404 g004
Figure 5. Land use maps for the KRB, (a) before breakpoint (1987), (b) in transition (1995), and (c) after breakpoint (2012), and (d) the digital elevation map.
Water 13 02404 g005
Figure 6. From left to right, KRB land use classifications before breakpoint (1987), during transition (1995), and after breakpoint (2012) periods.
Water 13 02404 g006
Figure 7. FDCs of the studied sub-basins for the pre-change (1) and post-change (2) periods.
Water 13 02404 g007
Figure 8. Mean monthly streamflow of the studied sub-basins during the pre-change (1) and post-change periods (2).
Water 13 02404 g008
Table 1. Karkheh sub-basin characteristics.
Sub-BasinArea
(km2)
Mean Altitude
(m amsl)
Mean Precipitation (mm/year)Mean Streamflow (mm/year)
Qarasou55081559424111
Gamasiab11,512185646181
Kashkan95241611477158
Seimareh12,350117941297
Upper Karkheh3995795422114
Table 2. Average streamflow variation for the pre-change period (Q1) to the post-change period (Q2), and type and magnitude of the change.
Sub-BasinBreakpointBreak TypeQ1 (mm/year)Q2 (mm/year)ΔQ (mm/year)ΔQ
(%)
Qarasou1994NA *14677.9−68.1−47%
Gamasiab1994NA107.857.7−50.1−47%
Kashkan1993NA186.2138.5−47.7−26%
Seimareh1994NA124.272.3−51.9−42%
Upper Karkheh1994NA145.485.6−59.8−41%
* NA: non-abrupt.
Table 3. E0 and p variation during the pre- and post-change periods. Numbers 1 and 2 denote the pre- and post-change period, respectively.
Sub-BasinE01 (mm)E02 (mm)ΔE0P1 (mm)P2 (mm)ΔP
Qarasou20982206+5%473381−19%
Gamasab20212277+13%494432−13%
Kashkan22022597+18%480474+1%
Seimareh20732240+8%446382−14%
Upper Karkheh21382344+9%454393−13%
Table 4. Precipitation trend analysis and the DBEST-detected breakpoints in the KRB.
Precipitation Time-Series AnalysisNumber of Significant BreakpointsType of ChangeYear of OccurrenceYear of Streamflow Breakpoint
Gamasiab2A *, NA1994, 20061994
Qarasou2A, A1994, 20061994
Kashkan0A19901993
Seimareh2A, A1994, 20061994
Upper Karkheh0NA19941994
* Abrupt.
Table 5. Calibration performance indices for the studied sub-basins.
BasinQarasouGamasabKashkanSeimarehUpper Karkheh
Re calibration0.770.750.570.770.68
δ (mm/year)2.0−8.011.05.00.0
KGE0.880.880.680.820.79
Table 6. Comparison between the HBV model and Budyko method for estimation of streamflow changes in the studied sub-basins.
Basinsεp ε E 0 ΔQ (mm)HBV Estimated Q (mm/year)Budyko Estimated Q (mm/year)
ΔQcΔQhΔQcΔQh
Qarasou1.61−0.6168.140.627.541.826.3
Gamasiab1.81−0.8150.125.924.227.722.4
Kashkan1.50−0.5047.714.433.215.332.4
Seimareh1.65−0.6551.928.923.029.622.3
Upper Karkheh1.60−0.6059.830.928.932.227.6
Table 7. Percentage of land use classes in the five studied sub-basins for selected years.
Sub-BasinLand Use Type1987 (%)1995 (%)2012 (%)
SeimarehIrrigated1.374.496.88
Rainfed11.8410.918.39
Range and pasture10.719.8112.24
Forest4.773.421.08
Urban0.090.170.24
QarasouIrrigated2.292.662.98
Rainfed5.025.554.92
Range and pasture4.874.074.61
Forest0.570.410.13
Urban0.110.150.19
GamasiabIrrigated4.285.115.91
Rainfed7.628.0913.00
Range and pasture14.1611.416.73
Forest0.320.890.04
Urban0.461.351.12
KashkanIrrigated1.122.826.80
Rainfed9.128.335.58
Range and pasture7.817.098.50
Forest4.103.851.15
Urban0.050.110.23
Upper KarkhehIrrigated0.090.901.08
Rainfed2.091.590.85
Range and pasture6.346.407.15
Forest0.740.370.07
Urban0.050.050.12
Table 8. Land use classes (total) percentage in different years.
Land Use ClassYear
198719952012
Irrigated (%)9.216.017.7
Rainfed (%)35.734.535.3
Range and pasture (%)43.938.842.3
Forest (%)10.58.92.7
Urban (%)0.81.82.1
Table 9. HBV model response to the changes in calibration parameters.
Sub-BasinMin ΔQc
(mm/year)
Max ΔQc
(mm/year)
Min ΔQh
(mm/year)
Max ΔQh
(mm/year)
Variation %
Qarasou39.840.627.528.31.0
Gamasiab25.927.622.524.23.3
Kashkan14.416.231.433.23.5
Seimareh28.929.523.022.41.1
Upper Karkheh30.932.528.927.32.7
Table 10. Streamflow response to a 10% change in the Budyko input parameters.
Basinsεp ε E 0 n Q ¯ P ¯ E 0 ¯ d Q p % d Q E 0 % d Q n %
(mm/year)
Qarasou1.61−0.610.811142421554.3−0.322.3
Gamasiab1.81−0.810.998146121573.3−0.322.7
Kashkan1.50−0.500.715847724375−0.321.3
Seimareh1.65−0.650.839741221623.9−0.32.1
Upper Karkheh1.60−0.600.7711442222484.5−0.322.0
Publisher’s Note: MDPI stays neutral with regard to jurisdictional claims in published maps and institutional affiliations.

