Article

Machine Learning-Based Prediction of Chlorophyll-a Variations in Receiving Reservoir of World’s Largest Water Transfer Project—A Case Study in the Miyun Reservoir, North China

1
State Key Laboratory of Water Environment Simulation, School of Environment, Beijing Normal University, Beijing 100875, China
2
Key Laboratory for Water and Sediment Sciences of Ministry of Education, School of Environment, Beijing Normal University, Beijing 100875, China
3
Chinese Academy for Environmental Planning, Beijing 100012, China
*
Author to whom correspondence should be addressed.
Water 2021, 13(17), 2406; https://doi.org/10.3390/w13172406
Submission received: 24 July 2021 / Revised: 25 August 2021 / Accepted: 30 August 2021 / Published: 1 September 2021

Abstract

:
Although water transfer projects can alleviate the water crisis, they may cause potential risks to water quality safety in receiving areas. The Miyun Reservoir in northern China, one of the receiving reservoirs of the world’s largest water transfer project (South-to-North Water Transfer Project, SNWTP), was selected as a case study. Considering its potential eutrophication trend, two machine learning models, i.e., the support vector machine (SVM) model and the random forest (RF) model, were built to investigate the trophic state by predicting the variations of chlorophyll-a (Chl-a) concentrations, the typical reflection of eutrophication, in the reservoir after the implementation of SNWTP. The results showed that compared with the SVM model, the RF model had higher prediction accuracy and more robust prediction ability with abnormal data, and was thus more suitable for predicting Chl-a concentration variations in the receiving reservoir. Additionally, short-term water transfer would not cause significant variations of Chl-a concentrations. After the project implementation, the impact of transferred water on the water quality of the receiving reservoir would have gradually increased. After a 10-year implementation, transferred water would cause a significant decline in the receiving reservoir’s water quality, and Chl-a concentrations would increase, especially from July to August. This led to a potential risk of trophic state change in the Miyun Reservoir and required further attention from managers. This study can provide prediction techniques and advice on water quality security management associated with eutrophication risks resulting from water transfer projects.

1. Introduction

As a water conservancy project for mitigating water scarcity and improving water quality, water transfer projects are of great significance in alleviating the uneven distribution of water resources to relieve regional water crises and to promote regional socio-economic development and ecological environment improvement [1,2]. However, transferred water can change the hydrologic and hydrodynamic characteristics of receiving reservoirs and disturb the water environment system of receiving reservoirs, which causes variations in water environmental factors and the potential risk of eutrophication [3,4]. With increasing project implementation time, negative effects on the water quality of receiving reservoirs are likely to accumulate and may lead to unexpected water quality deterioration. As the main source of regional drinking and irrigation water, the water quality of receiving reservoirs is related to regional water security, food safety, human health, and socio-economic development [5,6]. Therefore, to ensure water quantity and quality safety for people’s living and projects’ socio-economic and environmental benefits, it is crucial to study the impact of transferred water and predict the water quality variations of receiving reservoirs after the implementation of water transfer projects. This provides scientific advice on water transfer planning and offers water resource management suggestions for reservoir managers.
Generally speaking, there are three kinds of research methods used to provide scientific explanations for natural phenomenon: the deductive-nomological (D-N), the inductive-statistical (I-S) and the causal-mechanical methods [7,8]. The D-N method is usually used to explain general law and the I-S method is applicable to explaining statistical law with maximal specificity [9]. Because many natural phenomena cannot be explained by general laws, due to the limitations of current scientific and technological levels and human cognitions, the mechanical method is usually regarded as the compromise between D-N and I-S methods. Correspondingly, two kinds of models are most commonly used to predict water quality variations. One is the mechanical model based on interaction relationships between water environmental indicators and their impact factors (e.g., hydrodynamic and hydrologic factors) [1,10]. This can provide a reasonable explanation for water quality variations but requires vast measured data and specific interaction mechanisms to build a model, so the highly required modeling process limits its application and popularization. The other is the non-mechanistic model (i.e., I-S model) based on statistical theory to infer variation laws of water quality by identifying complex relationships among big data with no consideration of interactions. Owing to the simple and fast modeling process, the non-mechanistic model has been widely used in water quality prediction. Traditional non-mechanistic models (i.e., mathematical statistical models) for water quality prediction are based on simple mathematical and statistical data processing methods to analyze the relationship between water quality variations and their driving factors (e.g., hydrological factors, meteorological factors, landscape patterns) to predict and assess future water quality [11], such as regression analysis, cluster analysis, and discriminant analysis [12,13,14,15]. Although these methods are simple and fast, they require complete long-term data to build models, limiting their promotion in missing data areas.
However, due to extensive human activities and climate change, the water environmental problems have become more complicated and have wider impact ranges than before. Additionally, both environmental analytical tools and monitoring technologies have made rapid advancements recently. Therefore, the traditional mathematical statistical models can no longer meet the analytical requirement of big data and abnormal data in water environmental research [16]. In recent years, with the development of artificial intelligence, various machine learning models have also developed rapidly. With the advantages of high efficiency in calculating very large data collections, great ability to analyze complex nonlinear relationships and low data requirements, these models were expected to solve complex water environmental problems, such as predicting water resource availability [16], revealing hydrological phenomena of large basins [17,18], analyzing water quality variations [19,20], and so on. Some scholars used machine learning models and traditional statistical models to predict water quality variations and found that machine learning models had less data demand, higher prediction accuracy, and greater accuracy improvement with more driving factors introduced [21,22]. However, considering the variety of machine learning models, different models have their own advantages and disadvantages in different scenarios. El Bilali et al. [23] compared four common machine learning models’ prediction performances and found that Random Forest (RF) and Adaptive Boosting models had higher accuracy, and Artificial Neural Network and Support Vector Machine (SVM) models had better generalization ability and lower sensitivity.
However, most studies focused on the variations in hydrochemical factors (e.g., biochemical oxygen demand [21], nitrogen and phosphorus [22]), while few studies predicted the variations in trophic state (i.e., the eutrophication state caused by excessive nutrients). Generally, chlorophyll-a (Chl-a) is regarded as one of the proxies of algal biomass, and the combination of Chl-a, total nitrogen (TN) and total phosphorus (TP) concentrations is used as the reflection of the health of an aquatic ecosystem. However, the levels of TP and TN that are used to indicate eutrophication depending on the assumption that nutrients (i.e., nitrogen and phosphorus) are limiting factors for algal growth. Therefore, as a direct reflection of the relationship between nutrient concentration and algal abundance, Chl-a concentration has been widely used as a representative indicator of waterbody eutrophication risk [24,25,26,27]. In addition, most existing water quality prediction studies based on machine learning models have focused on water quality variations under natural conditions. However, with the extensive implementation of water transfer projects, the precise simulation and prediction of water quality variations under the influence of human activities is widely needed for targeted water resource planning and management. Owing to the advantage of generalization ability, machine learning models are desired to be expanded to precisely predict Chl-a concentration variations caused by large water transfer projects.
Considering the Miyun Reservoir in northern China, one of the receiving reservoirs of the world’s largest water transfer project (South-to-North Water Transfer Project, SNWTP) with a potential eutrophication trend as a case study, this study aimed to address the following objectives: (1) to build Chl-a prediction models based on the SVM and RF algorithms, the most common machine learning algorithms, and compare two models’ prediction performances, thus providing model selection advice for predicting receiving reservoir trophic state variations caused by water transfer projects; and (2) to predict Chl-a concentration variations in the Miyun Reservoir with increasing SNWTP implementation time and to analyze the impact of transferred water on the Miyun Reservoir trophic state, thus providing advice on water resource management for reservoir managers. The highlight of this study was to focus on the impact of such a world-famous large-scale water transfer project on waterbody trophic state variations in receiving reservoirs and suggest a suitable machine learning model for predicting Chl-a variations in receiving reservoirs by comparing their prediction performances. It is an important attempt in practical applications of machine learning models to predict the impact of human activities such as water transfer on the receiving reservoir. This can offer realistic decision-making support for regional water resource plans and management related to water transfer with the aim of alleviating water shortage pressure.

2. Materials and Methods

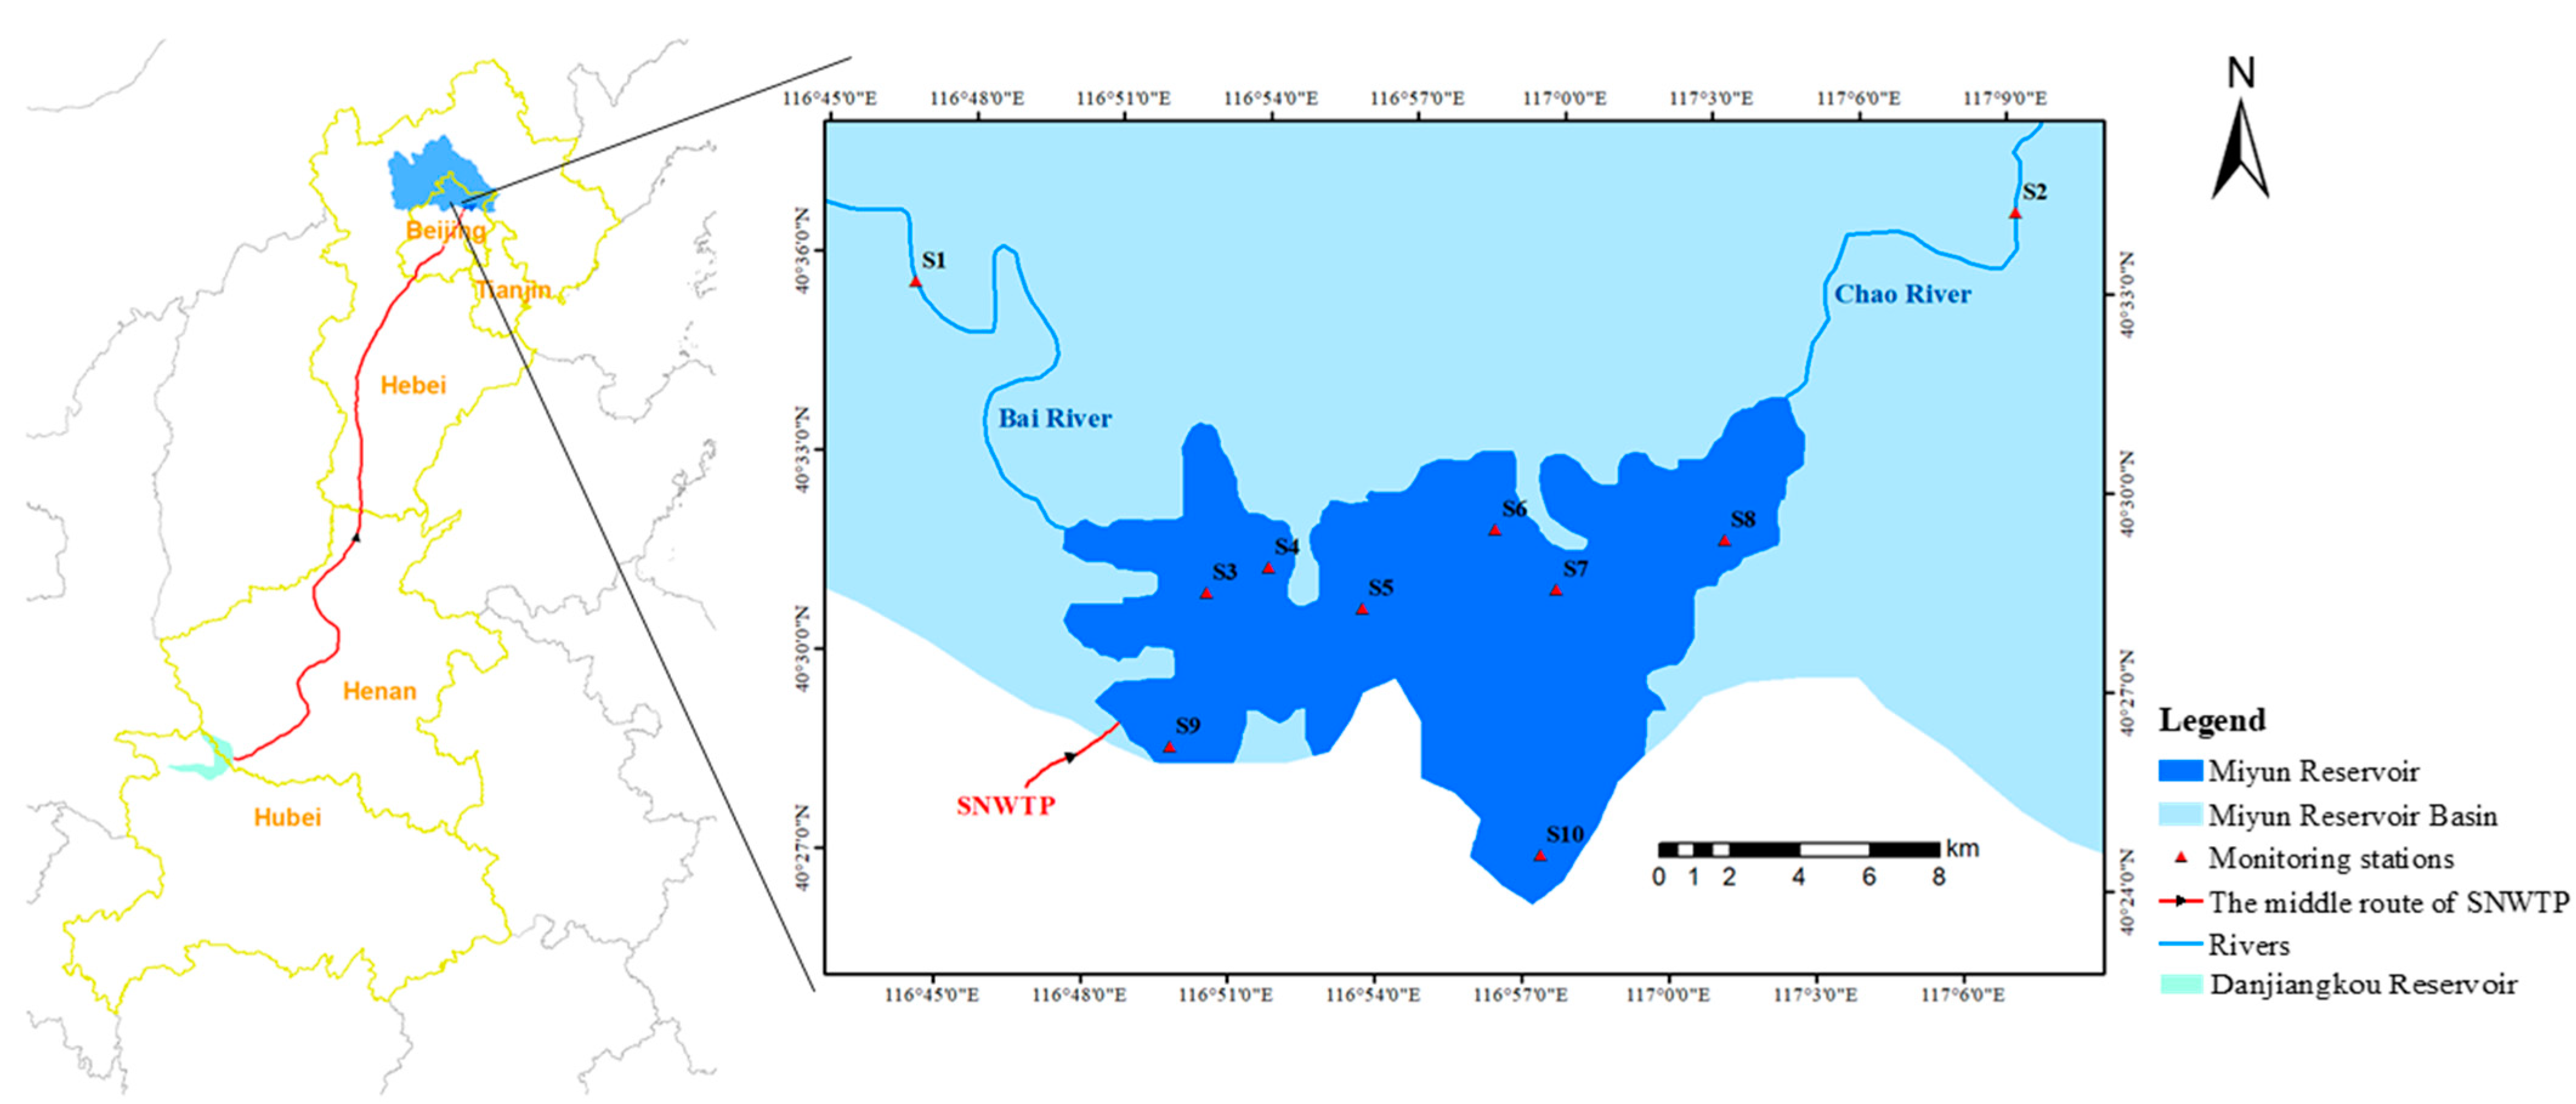
2.1. Study Area and Data Source

Owing to the uneven water resource distribution between North China and South China, the water shortage in North China has become increasingly severe. To ensure the basic water demand for people’s living and regional production and to realize sustainable development of the regional ecological environment and social economy, China launched a national strategic project—SNWTP, the world’s largest cross-basin water transfer project—to alleviate the contradiction between water supply and water demand and the ecological and environmental problems resulting from water scarcity. The middle route of SNWTP originates from the Danjiangkou Reservoir, located mid-upstream in the largest tributary of the Yangtze River (i.e., the Hanjiang River), crosses Henan and Hebei Provinces, and finally enters Beijing and Tianjin City. After entering Beijing City, the transferred water flows into the Miyun Reservoir along the Jing-Mi water diversion canal, with a total channel length of 1277 km and total water supply area of 1.55 × 10⁵ km2. After the middle route of the SNWTP was put into operation in December 2014, there was 5.04 × 10⁸ m3 of water transferred into the Miyun Reservoir by 2020. The project has greatly improved the water scarcity situation in 14 cities along the route to ensure water safety for 60 million people, and has promoted the economic and social development of central and northern China.
As one of the most important receiving reservoirs of SNWTP, Miyun Reservoir (116°48′–117°04′ E, 40°24′–41°32′ N) is located northeast of Beijing City, the capital of China, and approximately 90 km away from the urban center. It has a total area of approximately 188 km2 and total storage capacity of approximately 4.375 × 10¹⁰ m3, making it currently the largest and most important drinking water source for Beijing city. The main water sources for the Miyun Reservoir are the Chao River and the Bai River (Figure 1). However, the runoff of the two rivers has declined because of climate changes and intensive human activities (increasing water extraction, land use/cover changes, etc.), so reservoir inflow can no longer meet the water storage needs in recent years [27,28].
In addition, with the development of agriculture, industry, and tourism in the upstream area of the Miyun Reservoir, more nitrogen and phosphorus pollutants were discharged into the Chao River and the Bai River [29,30]. The concentrations of TP, TN and Chl-a changed from 0.0131, 1.0033 and 0.002597 mg/L to 0.0108, 1.2127 and 0.002604 mg/L, respectively, from 2009 to 2014 (i.e., 6 years before the implementation of the SNWTP), indicating that the Miyun Reservoir suffered water quality degradation and had a eutrophication trend before water transfer.
The basic water environmental indicators in the three reservoirs along the project, i.e., Danjiangkou Reservoir (water source area), Miyun Reservoir (water receiving area) and Daning Surge Tank (first storage reservoir for transferred water entering Beijing), are shown in Table 1. Compared with the Miyun Reservoir, the water transparency, TP, TN, and chemical oxygen demand (CODMn) in the Danjiangkou Reservoir were slightly higher, and the pH and dissolved oxygen (DO) were slightly lower, but the deviations were negligible. The implementation of SNWTP has greatly alleviated the water quantity crisis in the Miyun Reservoir. However, whether it will aggravate the potential risk of water quality decline, and if so, how to take positive measures to reduce risk in advance are worthy of attention.
The water quality data used in the study were monthly measured data from 10 monitoring stations (S1 in the Bai River, S2 in the Chao River, and S3–S10 inside the Miyun Reservoir, Figure 1) from 2002 to 2014 and obtained from the Miyun Reservoir Management Office. The meteorological data were measured data from the Miyun Meteorological Station and downloaded from the China Meteorological Data Service Center [36]. All data processing and analysis of the study was performed in R 3.6.1 software.

2.2. Technical Roadmap for Predicting Chl-a Variations in the Receiving Reservoir of Water Transfer Project

The technical roadmap of our research was as follows (Figure 2). First, we collected the original data of Chl-a concentrations and their impact factors in the Miyun Reservoir, and then rejected abnormal data in original datasets to form two datasets: Chl-a concentrations and impact factors. Then, we conducted the Pearson correlation analysis between two datasets to determine the key impact factors. Taking the key impact factors as input variables and Chl-a concentrations as output variables, we built two prediction models of Chl-a concentration variations based on the RF and SVM algorithms. The model with higher prediction accuracy and more robust prediction performance in data abnormality scenarios was determined as the final prediction model of Chl-a concentrations. We thereby used the final model to predict the interannual and monthly variations of Chl-a concentrations after the implementation of SNWTP. According to the prediction results, we could provide some scientific suggestions for water resource management for Miyun Reservoir’s managers.

2.3. Model Construction

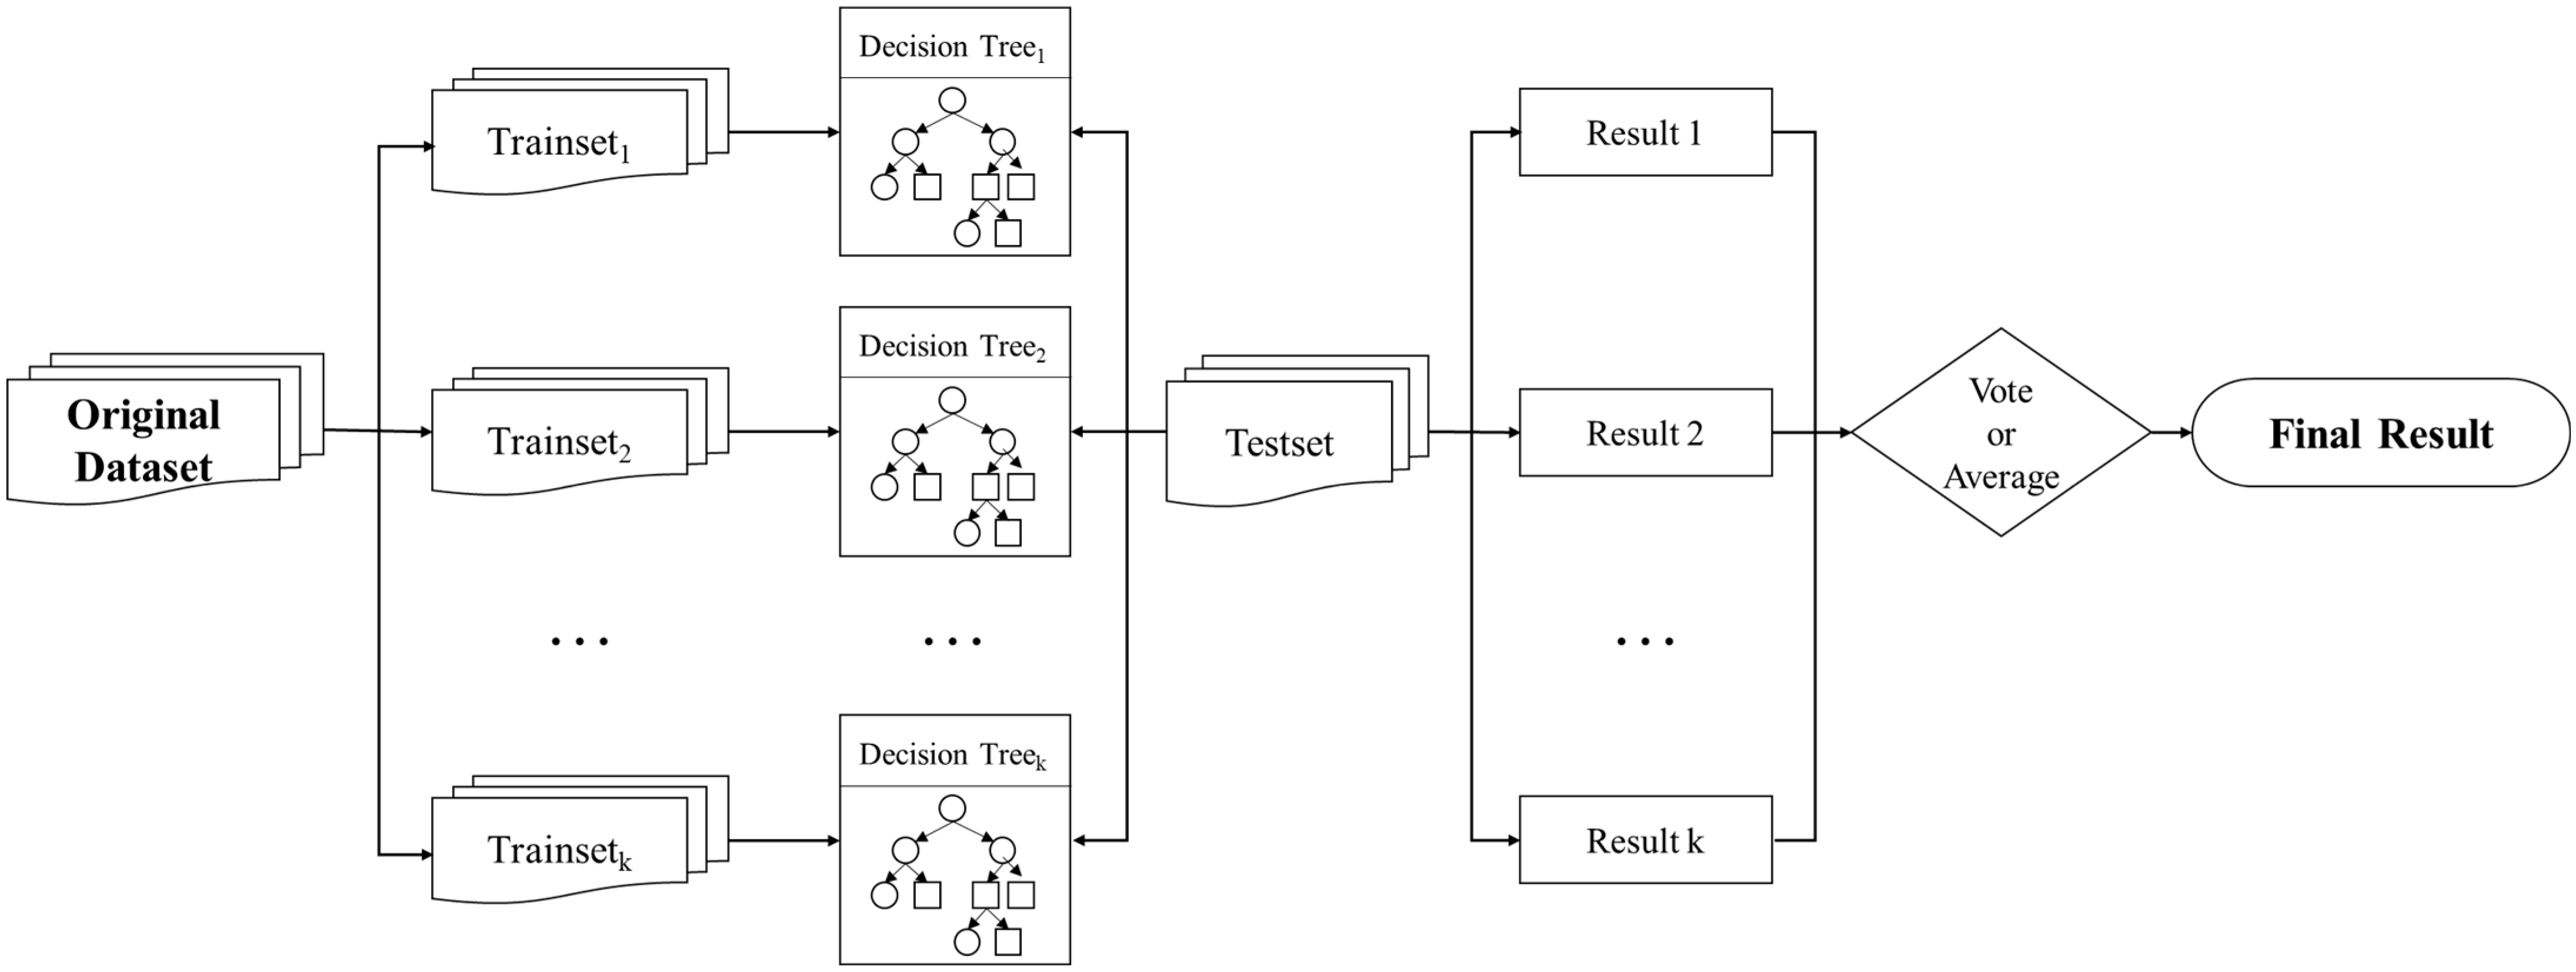
2.3.1. Model Principle

(1) Random Forest model
The RF model is a combination classifier based on statistical learning theory that combines bootstrap aggregation and the decision tree algorithm [37]. It resamples the original dataset randomly to form multiple trainsets to build decision trees and then integrates all decision trees’ results (majority vote or average) to determine the final prediction result [19]. Thus, the RF model can not only predict variables’ variations quickly, efficiently and accurately similar to the decision tree model, but can also compensate for the deficiency that a single decision tree is easy to overfit. Therefore, the RF model has the advantages of strong tolerance to abnormal and noisy data, stable and highly accurate prediction ability, strong generalization ability, and poor overfitting [37,38].
For a dataset containing N samples and M variables, there are three steps to build an RF model (Figure 3): (1) Forming trainsets: The original dataset is resampled randomly and repetitively to form K trainsets, and each trainset contains N samples. (2) Building decision trees: First, F (FM) characteristic variables are chosen from M variables randomly in one trainset. Then, F characteristic variables are ranked based on some splitting rules, and then the best characteristic variable is used to split the trees’ nodes to build a decision tree model. Based on K trainsets, K decision tree models are built. (3) Building the RF model to predict the final result: The RF model is integrated by K decision trees, and the final output is calculated based on all trees’ results by voting or averaging. Thus, two parameters are important to the RF model: (1) the number of decision trees (i.e., K), which determines forest composition on the macroscopic scale; and (2) the number of characteristic variables (i.e., F), which determines the forest structure on the microscopic scale.
(2) Support Vector Machine Model
The SVM model is a machine learning model based on statistical theory with the learning goal of minimizing structural risk. It can solve a series of practical problems in traditional learning models with advantages such as small-size samples, high dimensionality, multiple nonlinearity, ease of overlearning, and ease of restriction to local minimums [39]. Thus, the SVM model has better generalization ability. For linear separable data, the SVM model can construct an optimal separating hyperplane with the goal of minimizing errors to classify data [40]. For linear inseparable data, the model can use the kernel mapping method to map the low-dimension data into a high-dimension feature space and then construct the optimal separating hyperplane in the high-dimension space so that the linear inseparable problem in low-dimension space can be transformed into a high-dimension linear separable question to realize the classification of nonlinear datasets [41]. Therefore, the type and modeling complexity of SVM are affected by the kernel function and corresponding parameter setting. Generally, the function meeting the Mercer condition can be used as the kernel function, so the common kernel functions are as follows:
(1) Linear function
K ( x i , x j ) = ( x i x j )
where K(xi, xj) is the kernel function; and xi and xj are the ith and jth input vectors, respectively.
(2) Polynomial function
K ( x i , x j ) = [ s ( x i x j ) + c ] q
where s, c, and q are parameters. The linear function is a special case of the polynomial function.
(3) Radial basis function (RBF)
K ( x i , x j ) = exp ( x i x j 2 2 σ 2 ) = exp ( γ x i x j 2 )
where σ is the Gaussian noise level of the standard deviation, and γ is a parameter (γ > 0).
(4) Sigmoid function
K ( x i , x j ) = tan ( v ( x i x j ) + c )
where v and c are parameters.

2.3.2. Chl-a Prediction Model Development

In this study, 16 impact indicators (including climate, hydrology, and water quality factors) were chosen to build Chl-a prediction models. The time scale of all factors was from 2002 to 2014, 14 years before the implementation of SNWTP. Because the water quality inside the reservoir was different from that outside and the surface water of the Miyun Reservoir freezes in winter, the water quality dataset consisted of water quality data from April/May to November each year from monitoring stations inside the reservoir. There were 691 records initially collected, and 637 records were used to compose the original dataset, excluding missing and abnormal records.
Considering that the Miyun Reservoir is a reservoir with potential algal pollution and that the concentration of Chl-a (i.e., the main indicator of algae) is widely regarded as a reflection of waterbody trophic state, the Chl-a concentration was used as a representative factor to reflect the impact of SNWTP on the water quality of the receiving reservoir and to assess the eutrophication level of the receiving reservoir in the study. Because Chl-a concentrations and dynamic distributions are affected by climate, hydrology, and water quality factors, 16 indicators of the 3 factors were chosen preliminarily and then used to analyze their correlativity with the Chl-a concentrations. The results of the Pearson correlation analysis are listed in Table 2.
As Table 2 shows, the Pearson correlation coefficient of five-day biochemical oxygen demand (BOD5) was 0.0001, indicating that BOD5 had negligible correlations with Chl-a concentrations. Except for BOD5, the other 15 indicators had certain correlations with Chl-a concentrations because they could affect nutrient distribution in waterbodies and algae physiological activities. The RF model is insensitive to multicollinearity problems and has a robust ability to process outliers and missing data. The SVM model has unique advantages in determining small-size, high-dimensionality, and nonlinear problems. Thus, two models can both be used to predict Chl-a variations without further selecting input variables [42,43]. Therefore, in this study, two Chl-a prediction models were built based on the RF and SVM models, with 15 indicators except BOD5 as input variables and Chl-a concentrations of Miyun Reservoir as the output variable. For the RF model, the number of decision trees (ntree) was 1000, and the number of characteristic variables (mtry) was 2 in the study. For the SVM model, there were 2 optional regressions (eps-regression and nu-regression) and 4 optional kernel functions (linear, polynomial, RBF, and sigmoid). Therefore, we used an If-loop consisting of 2 regressions and 4 kernel functions to compare the performances of all possible models. Taking the maximum Pearson correlation coefficient and minimum root mean square error as the optimization goals, nu-regression and RBF were used to build the SVM model.

2.3.3. Assessment Metrics of Model Prediction Performance

To assess the prediction performances of the RF model and SVM model, a 10-fold cross-validation method was applied in the study [44]. The original dataset was randomly divided into 10 portions. Then, 9 of them were used as the trainset to develop the model and the other was used as the testset to validate the model in turn, until each data of the 10 subsets was used as validation data once. This process was repeated 10 times, and the mean of the 10 validation results from each process was considered the model accuracy.
Three common statistical indicators were used to assess the accuracy of the two models:
(1) Pearson correlation coefficient (r)
r = i = 1 n ( X i X ¯ ) ( Y i Y ¯ ) i = 1 n ( X i X ¯ ) 2 i = 1 n ( Y i Y ¯ ) 2
(2) Root Mean Squared Error (RMSE)
R M S E = i = 1 n ( X i Y i ) 2 n
(3) Mean Absolute Error (MAE)
M A E = i = 1 n | X i Y i | n
where i represents each sample; n is the total number of samples; Xi and Yi are the observation value and prediction value of each sample, respectively; X ¯ and Y ¯ are the means of the observation value and prediction value, respectively; r represents the correlation between the simulation model and the realistic model, with r > 0.6 representing a strong correlation and r > 0.8 representing a stronger correlation; RMSE and MAE represent the difference between the observation value and prediction value, with lower RMSE and MAE representing higher accuracy.

3. Results

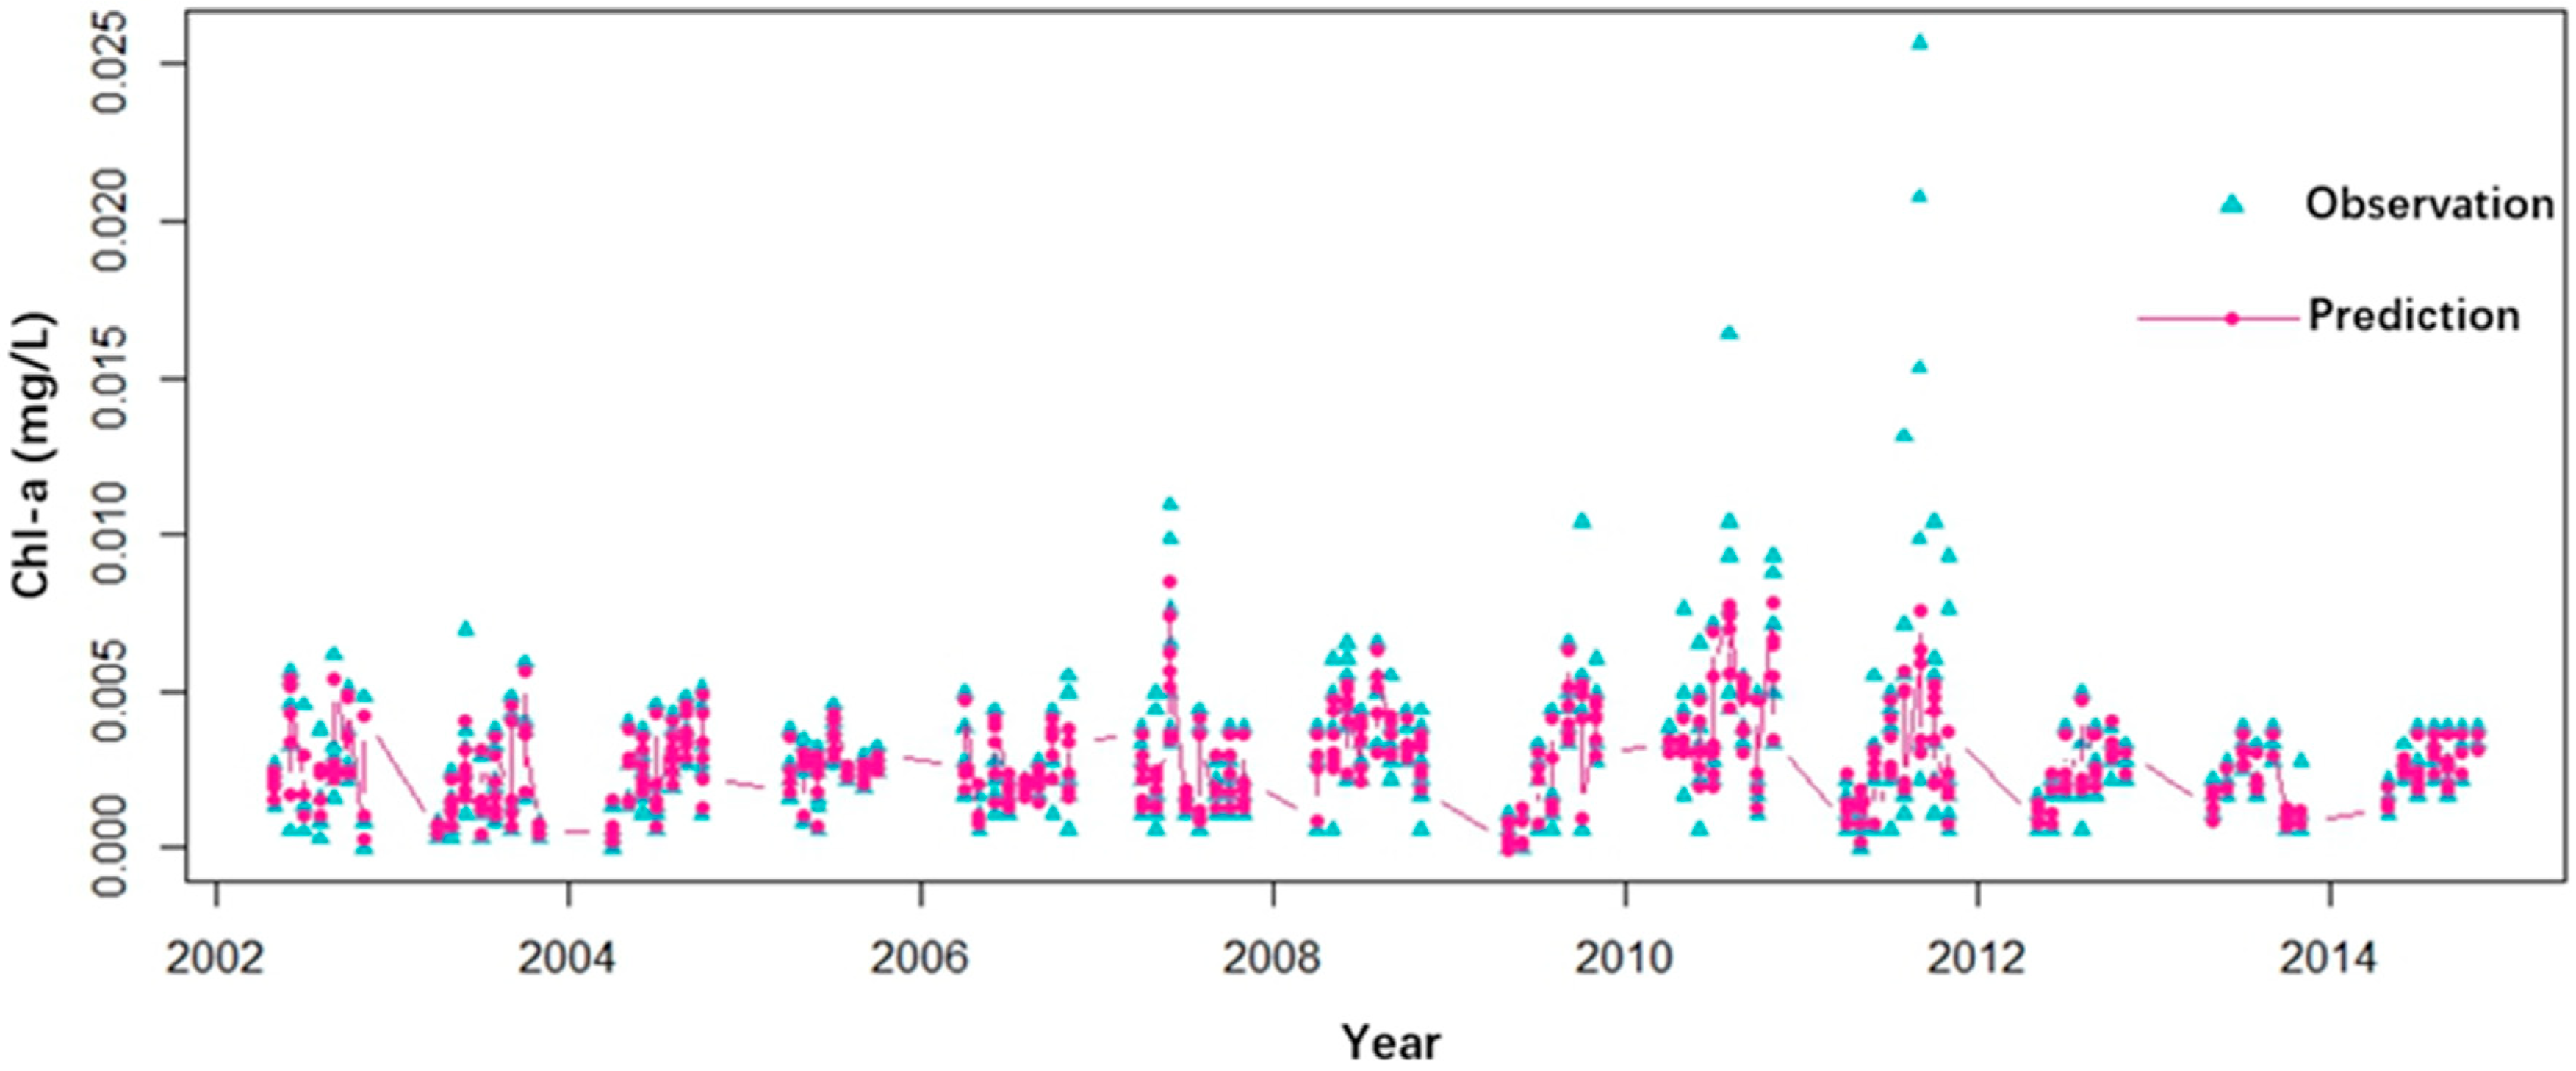
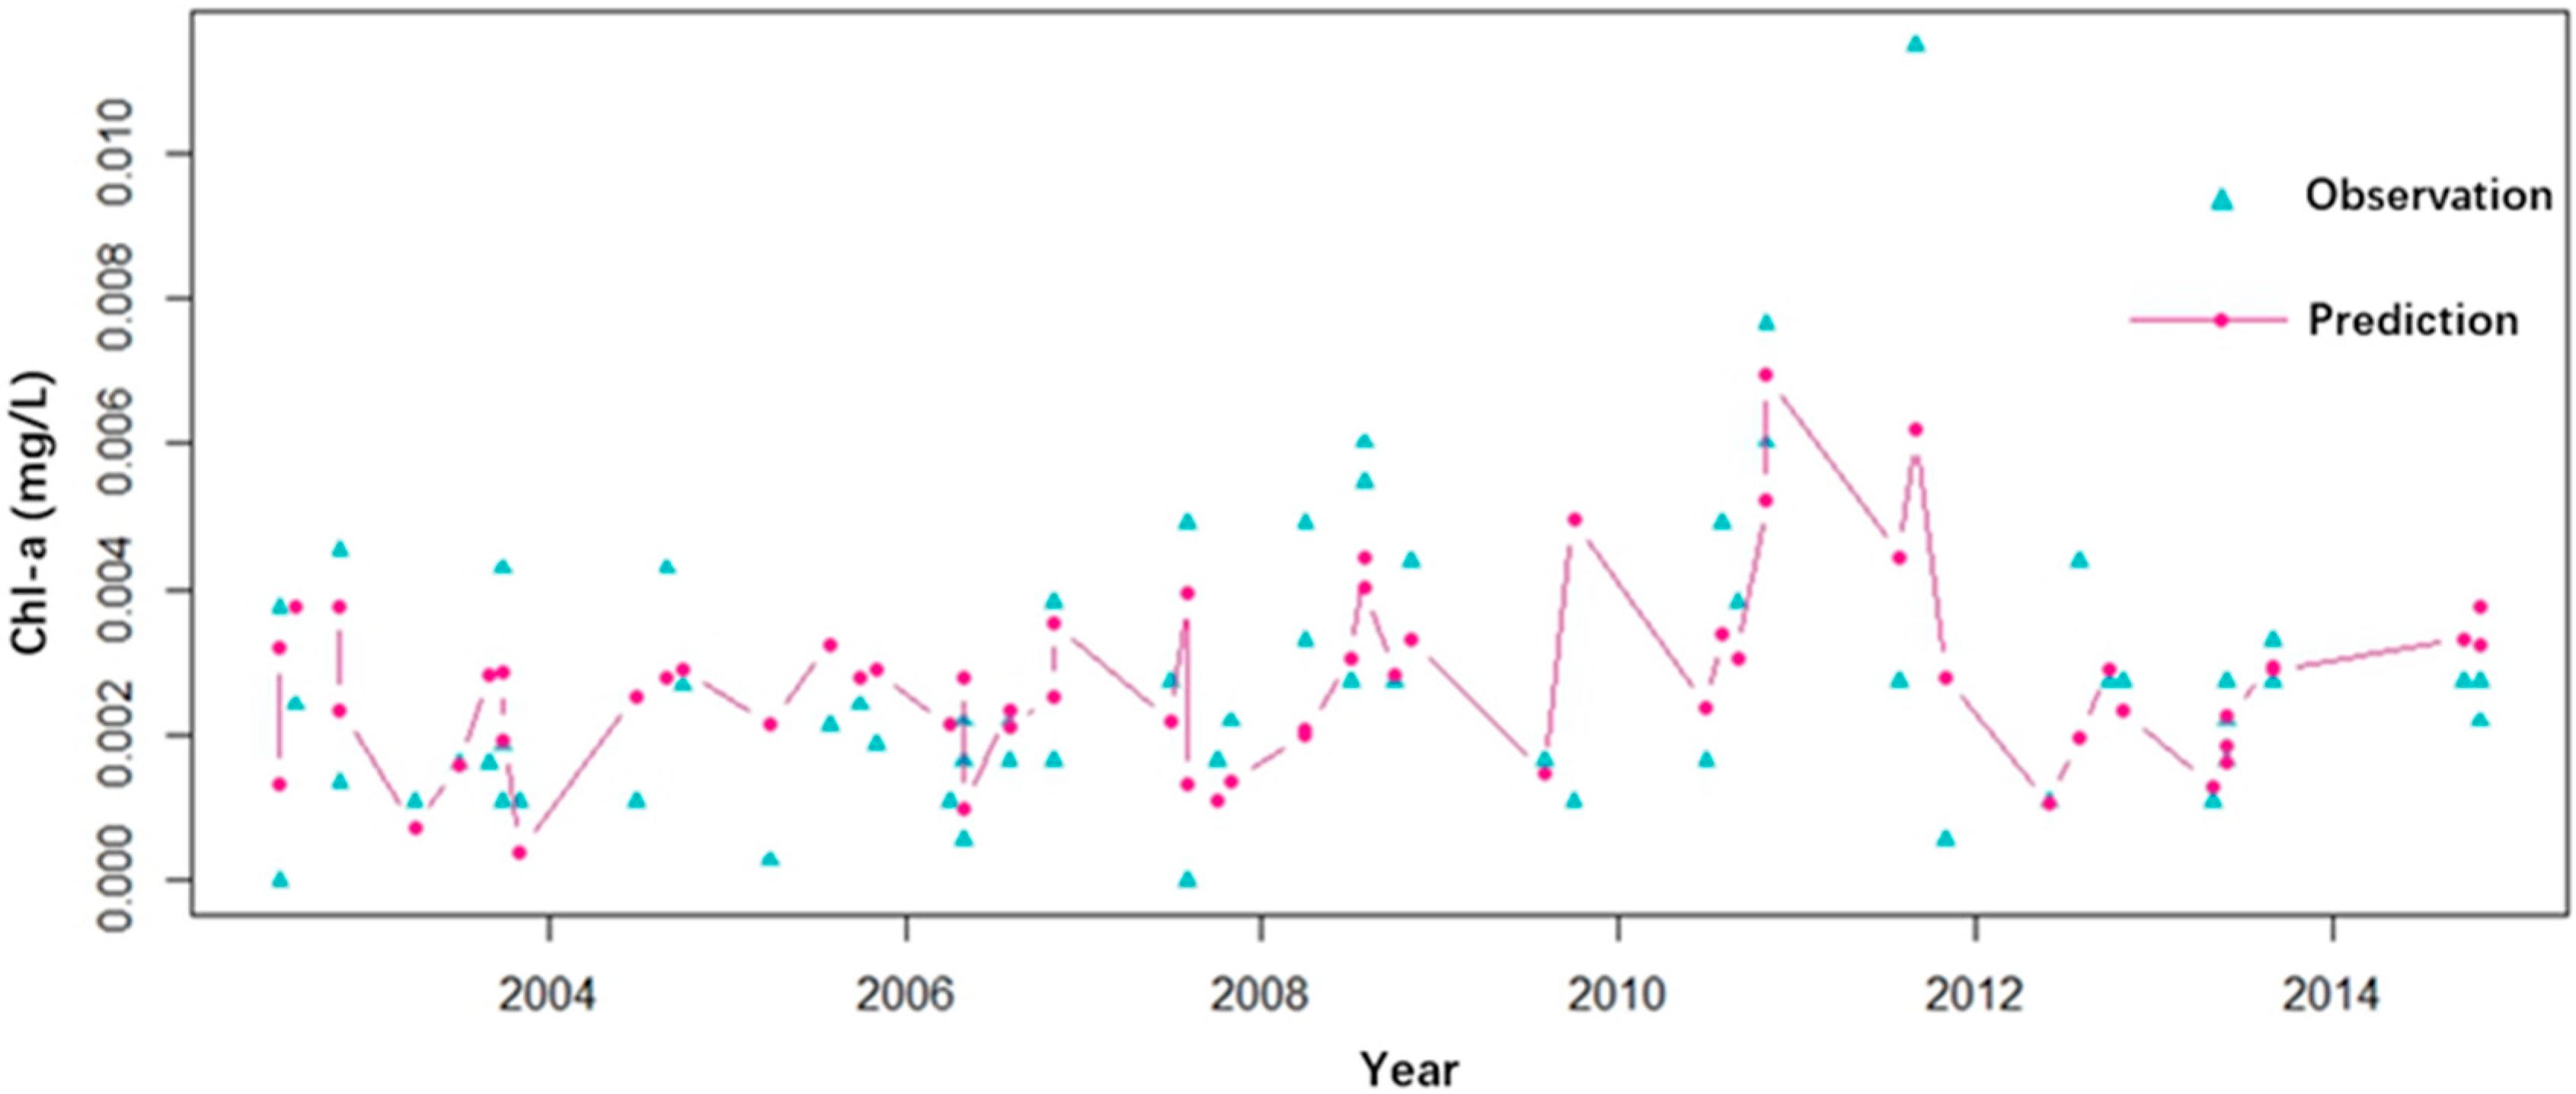
3.1. Prediction Performances of Two Machine Learning Models

3.1.1. Comparation of SVM and RF Models

According to the water transfer plan, 2 × 10⁸ m3 of water was transferred into the Miyun Reservoir through the middle route of the SNWTP every year since December 2014 [19]. Therefore, we took 2015 as the initial year and assumed that 0.25 × 10⁸ m3 of water was transferred monthly from April to November. The monthly outflow volume was taken as the corresponding historical mean of station S9 and station S10. To predict the water quality variations of the Miyun Reservoir after SNWTP implementation, four basic assumptions were proposed: (1) Future climate factors and upstream nutrient loads would remain the same as those before SNWTP implementation. (2) The future monthly capacity of the Miyun Reservoir would maintain its corresponding mean value from 2002 to 2014. (3) According to Table 1, the water quality of the Danjiangkou Reservoir and the Daning Surge Tank was similar to that of the Miyun Reservoir, so we assumed that the water quality of transferred water was the same as that of the current Miyun Reservoir. (4) Transferred water would uniformly mix with original water without considering the biochemical reactions between two kinds of water, and the reservoir outflow was the uniform mixture after SNWTP implementation. According to the above considerations and the mass balance principle, the concentrations of water quality indicators (i.e., the indicators shown in Table 2 except for BOD5) were predicted, and then the variations of Chl-a concentrations within 15 years after SNWTP implementation (i.e., 2015–2030) could be predicted.
The measured Chl-a concentrations of the Miyun Reservoir from 2002 to 2014 were used as the original dataset and were randomly divided into the trainsets and the testsets at a 9:1 ratio. The trainset was used to develop models, and the testset was used to validate model accuracies. The performances of the RF and SVM models on the two subsets were assessed by the 10-fold cross-validation method, and the prediction accuracies were assessed by r, RMSE, and MAE. The prediction performances of the two models are shown in Table 3, and the differences between the observation values and prediction values of the two models in train and test stages are shown in Figure 4, Figure 5, Figure 6 and Figure 7.
Since Chl-a concentrations in the Miyun Reservoir changed significantly in the natural environment, the model accuracy of r > 0.6 was considered to meet the prediction accuracy requirement. According to Table 3, the r of the RF model in the trainset and testset were relatively close and both over 0.6, and the RMSE and MAE were basically the same in the two subsets, indicating that the RF model had a stable (owing to the similar prediction results in the two subsets) and accurate (owing to the high fitting degree with reality of its results) prediction ability for Chl-a concentration variations in the Miyun Reservoir. Although the SVM model had a higher correlation with reality than the RF model in the train stage (r = 0.8447 > 0.8 > 0.6557, RMSE = 0.0013 < 0.0018, MAE = 0.0006 < 0.0011), it had a worse prediction performance in the test stage because of its unsatisfactory prediction accuracy (r = 0.5875 < 0.6) and slightly larger error (RMSE = 0.0018 > 0.0017, MAE = 0.0012 > 0.0011). This indicated that the SVM had an unstable prediction ability and may even have overfitting problems. Therefore, the RF model was more suitable for predicting Chl-a concentration variations in the Miyun Reservoir.

3.1.2. Robustness Analysis of RF Model

To assess the robustness of the RF model prediction ability in missing data situations, we compared the model’s prediction performances in data abnormality scenarios and normal scenarios. The scenario settings were as follows: (1) Normal scenario (Normal): using the preprocessed data (i.e., the dataset obtained after Section 2.3.2) without any elimination, (2) Program eliminating scenario (Program): eliminating the variables in the preprocessed dataset with Pearson correlation coefficients (shown in Table 1) of less than 0.05, (3) Random eliminating scenario (Random): randomly eliminating 5% of the data in the preprocessed dataset, and (4) Missing data filling scenario (Filling): using the rfimpute function in the RF algorithm to fill all missing data in the preprocessed dataset. Except for the dataset used, the other model parameters in the four scenarios were the same. The RF model prediction performances in the four scenarios are shown in Table 4.
According to Table 4, the correlation of the prediction model built in the program scenario with the realistic model (i.e., r) was lowest in the three abnormal scenarios, but the prediction accuracy in the program scenario still met the basic accuracy requirements in both the train stage (r = 0.6146 > 0.6) and test stage (r = 0.6229 > 0.6). The r in the Random scenario and Filling scenario were proximate to those in the Normal scenario (r in the Random and Filling scenarios were slightly lower than that in the Normal scenario in the trainset and higher than that in the Normal scenario in the testset). Even in the case of abnormal data, the RF model still had a strong correlation with the realistic model.
Regarding the difference between the prediction values and observation values, the RMSE and MAE in the three abnormal scenarios were all proximate to those in the normal scenario (RMSE were approximately 0.0017 and MAE were approximately 0.0011), indicating that abnormal data did not increase the prediction error of the RF model. This was because the RF model kept randomness in forming trainsets and dividing tree nodes when building decision trees, and the RF model integrated all results of multiple decision trees to obtain the final output result so that the RF model had the ability to balance errors and maintain accuracy when facing imbalanced data or feature-losing data. Owing to the advantages of anti-interference and generalization capabilities, the RF model was suitable for predicting water quality variations in the Miyun Reservoir and had great application prospects in predicting water quality variations in other lakes and reservoirs, especially in areas lacking data, in different water transfer scenarios.

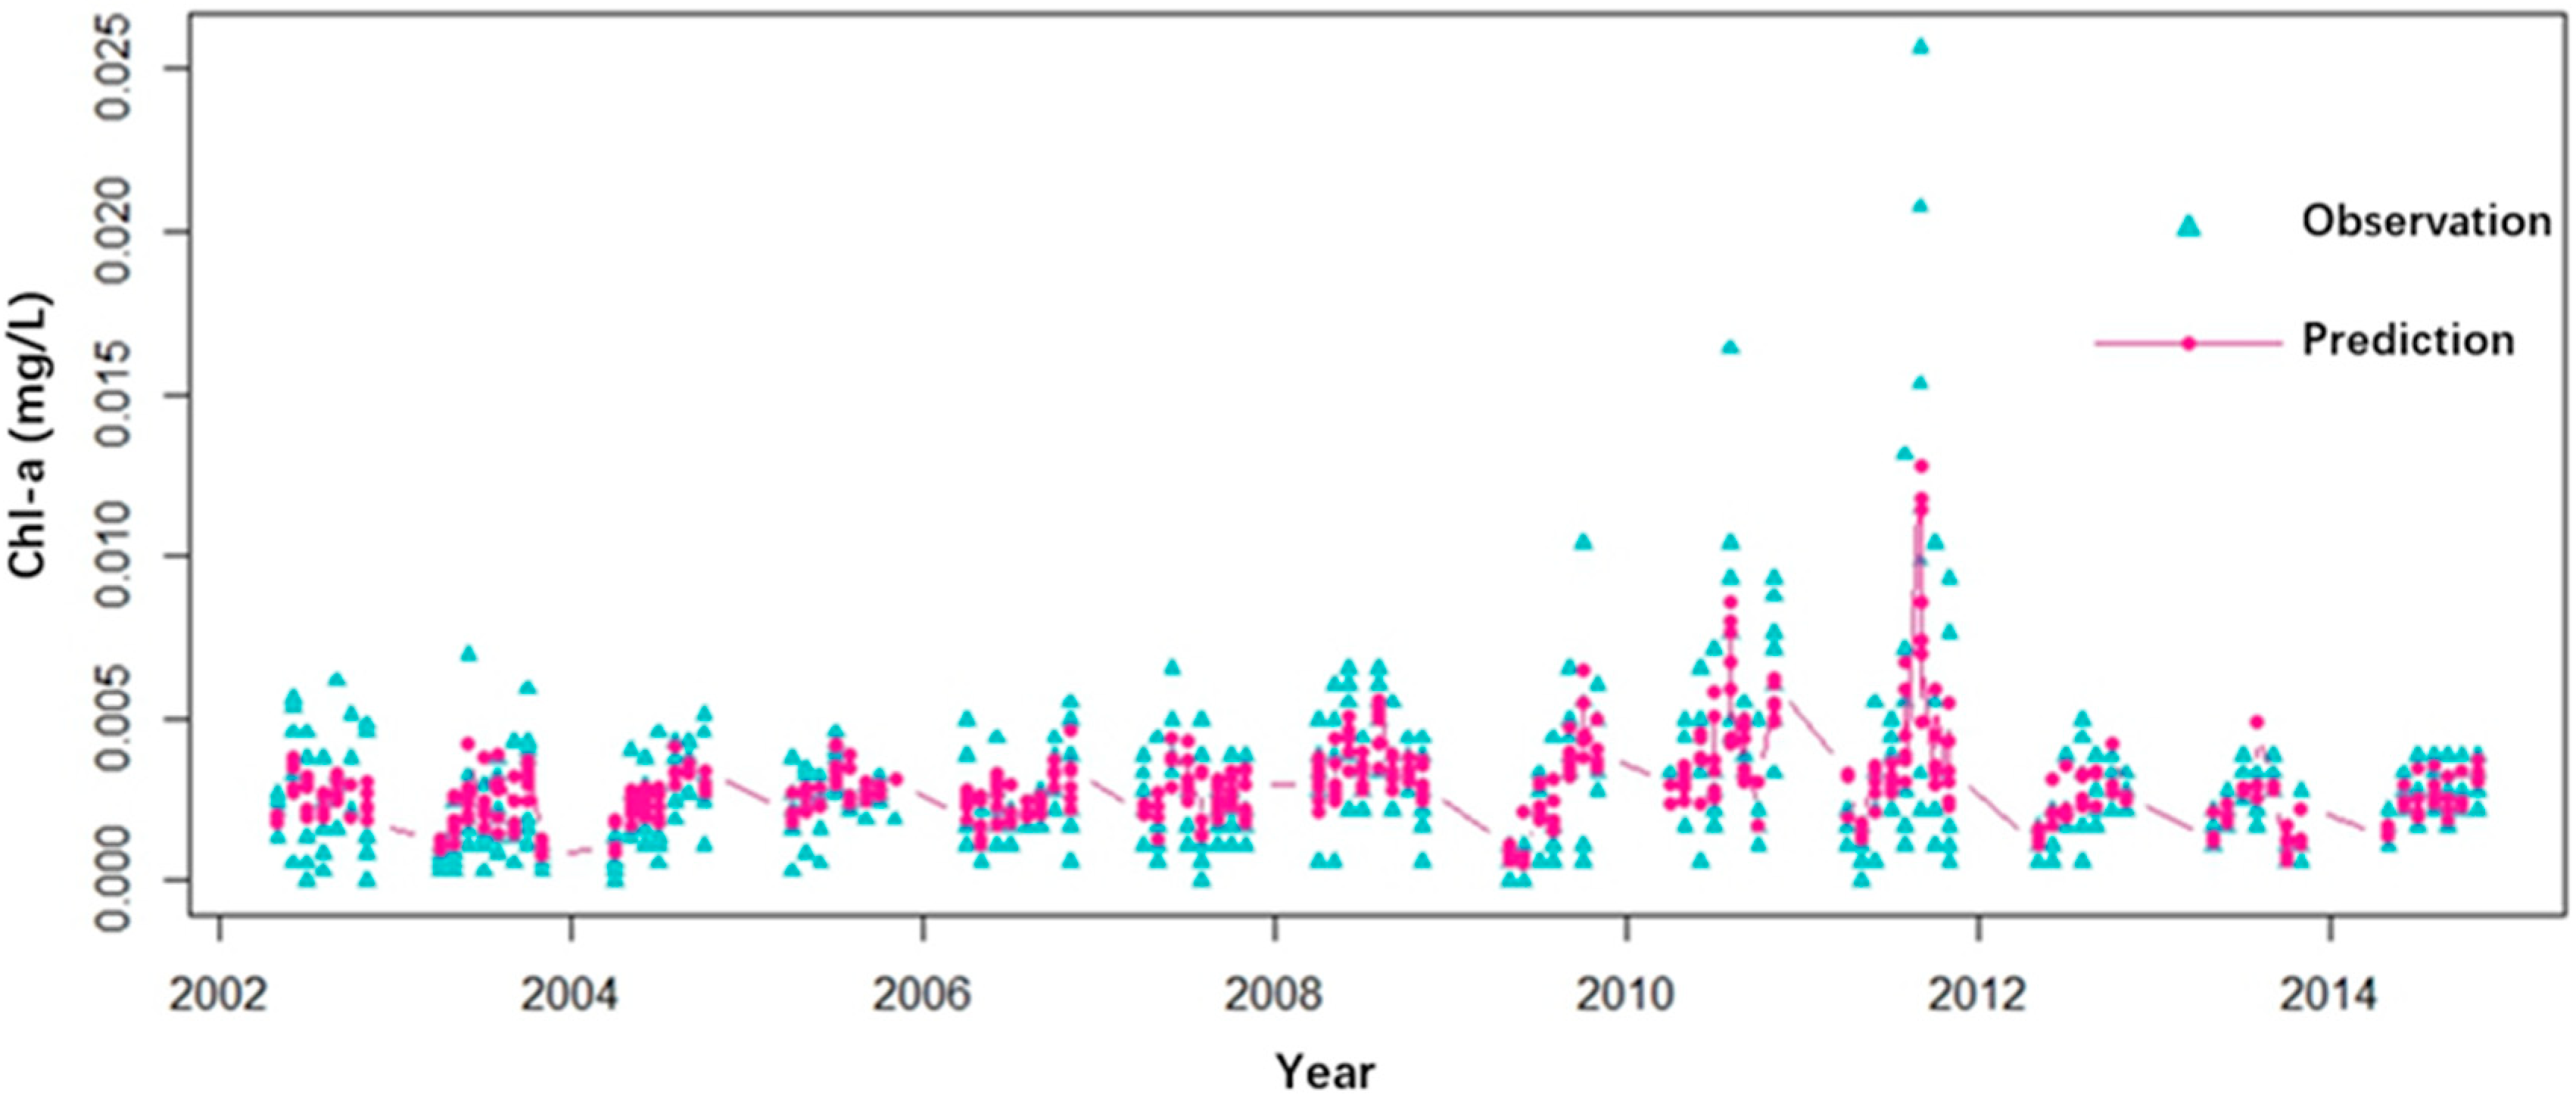
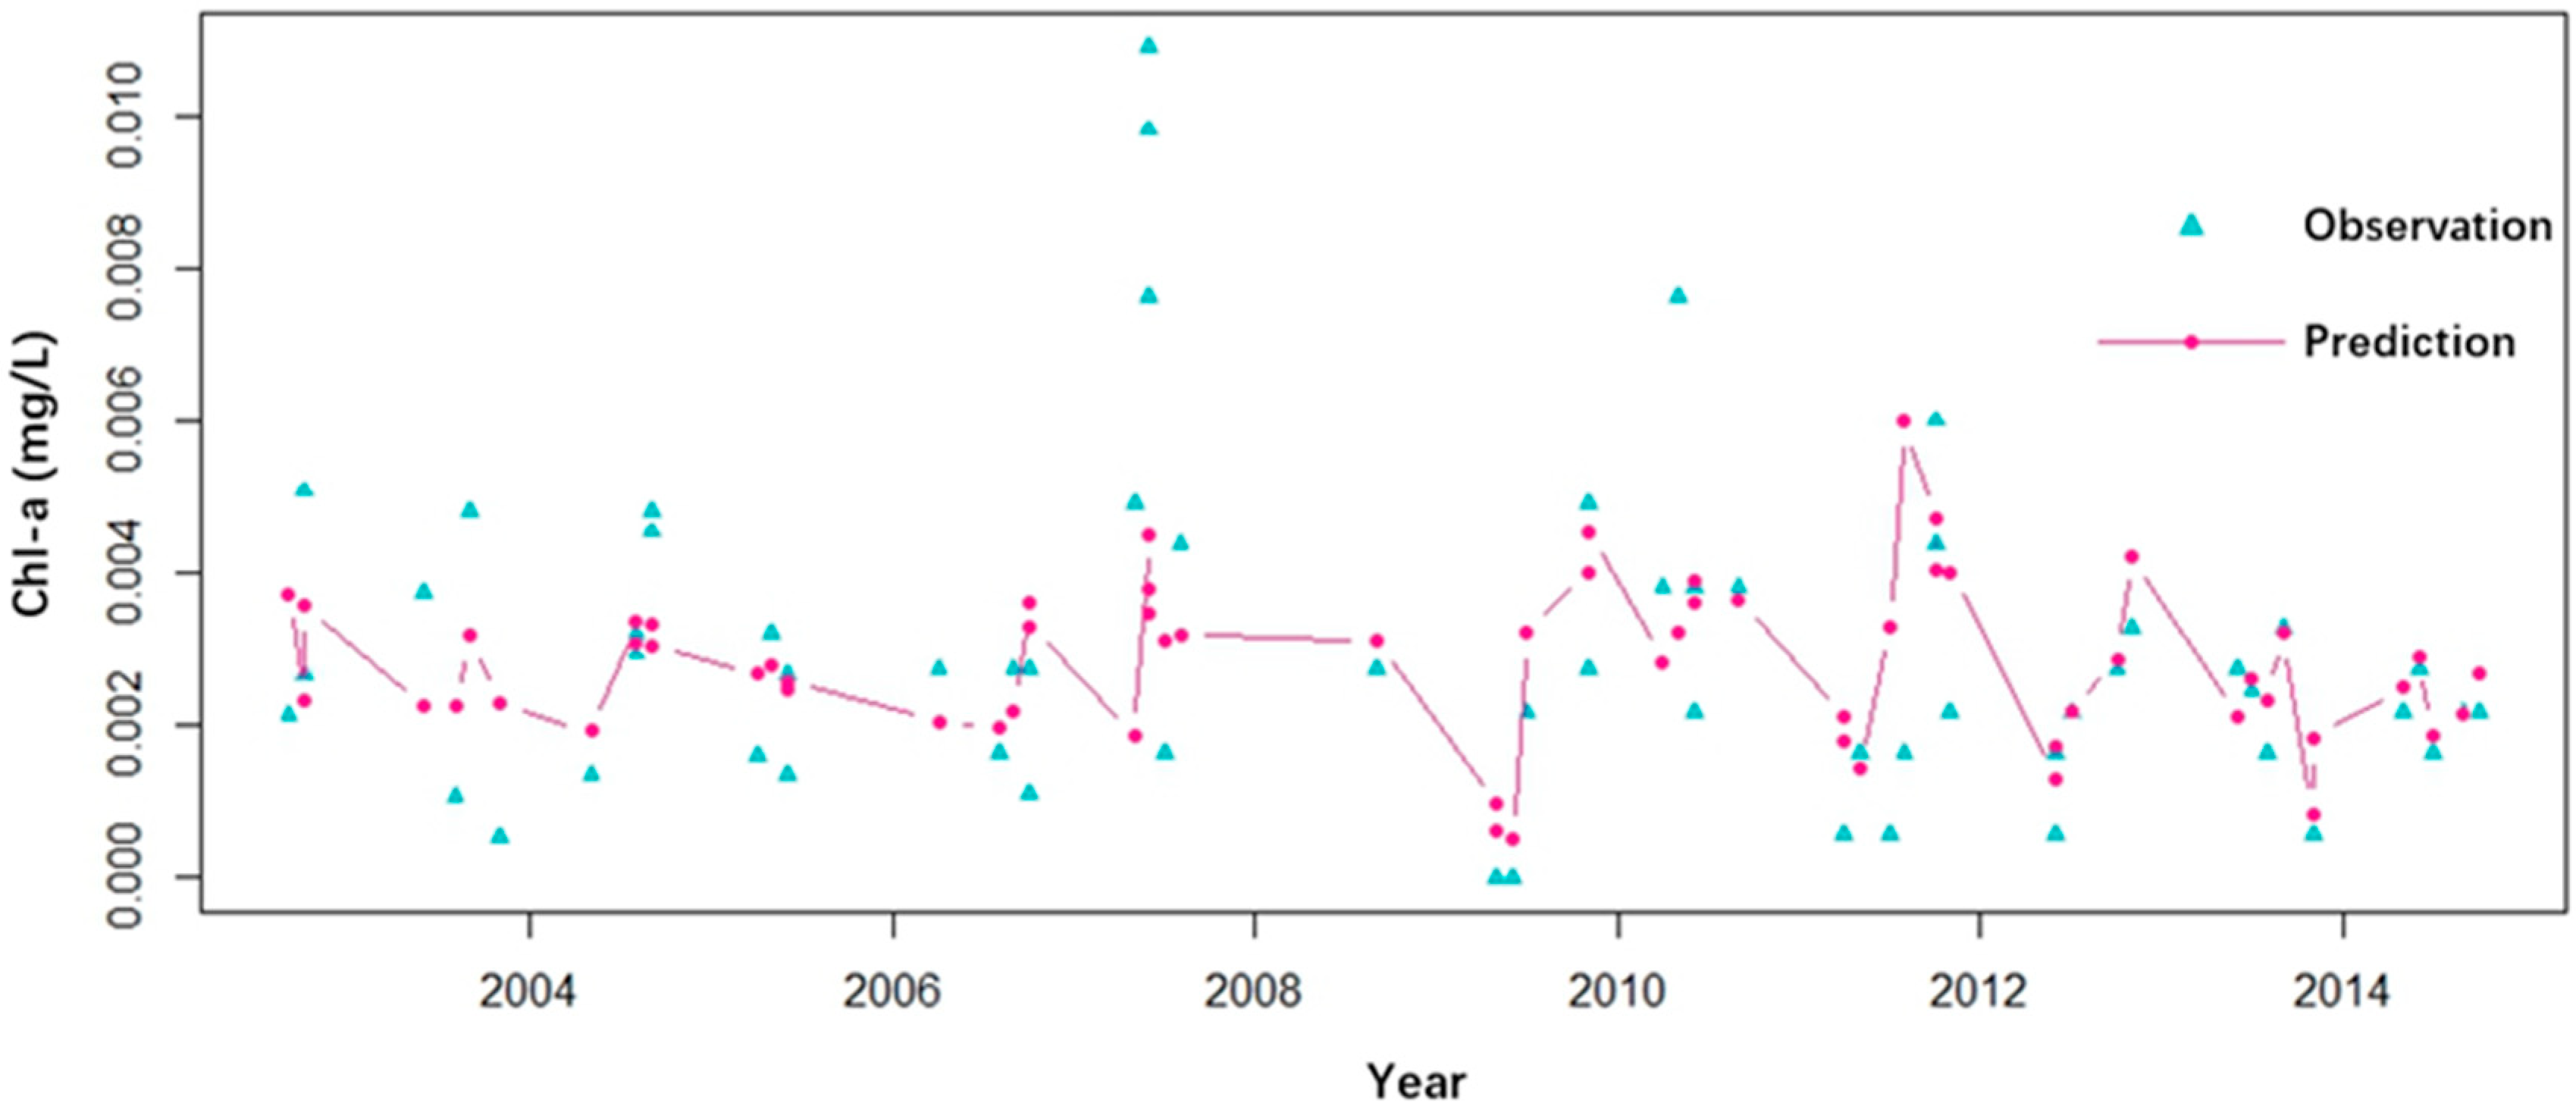
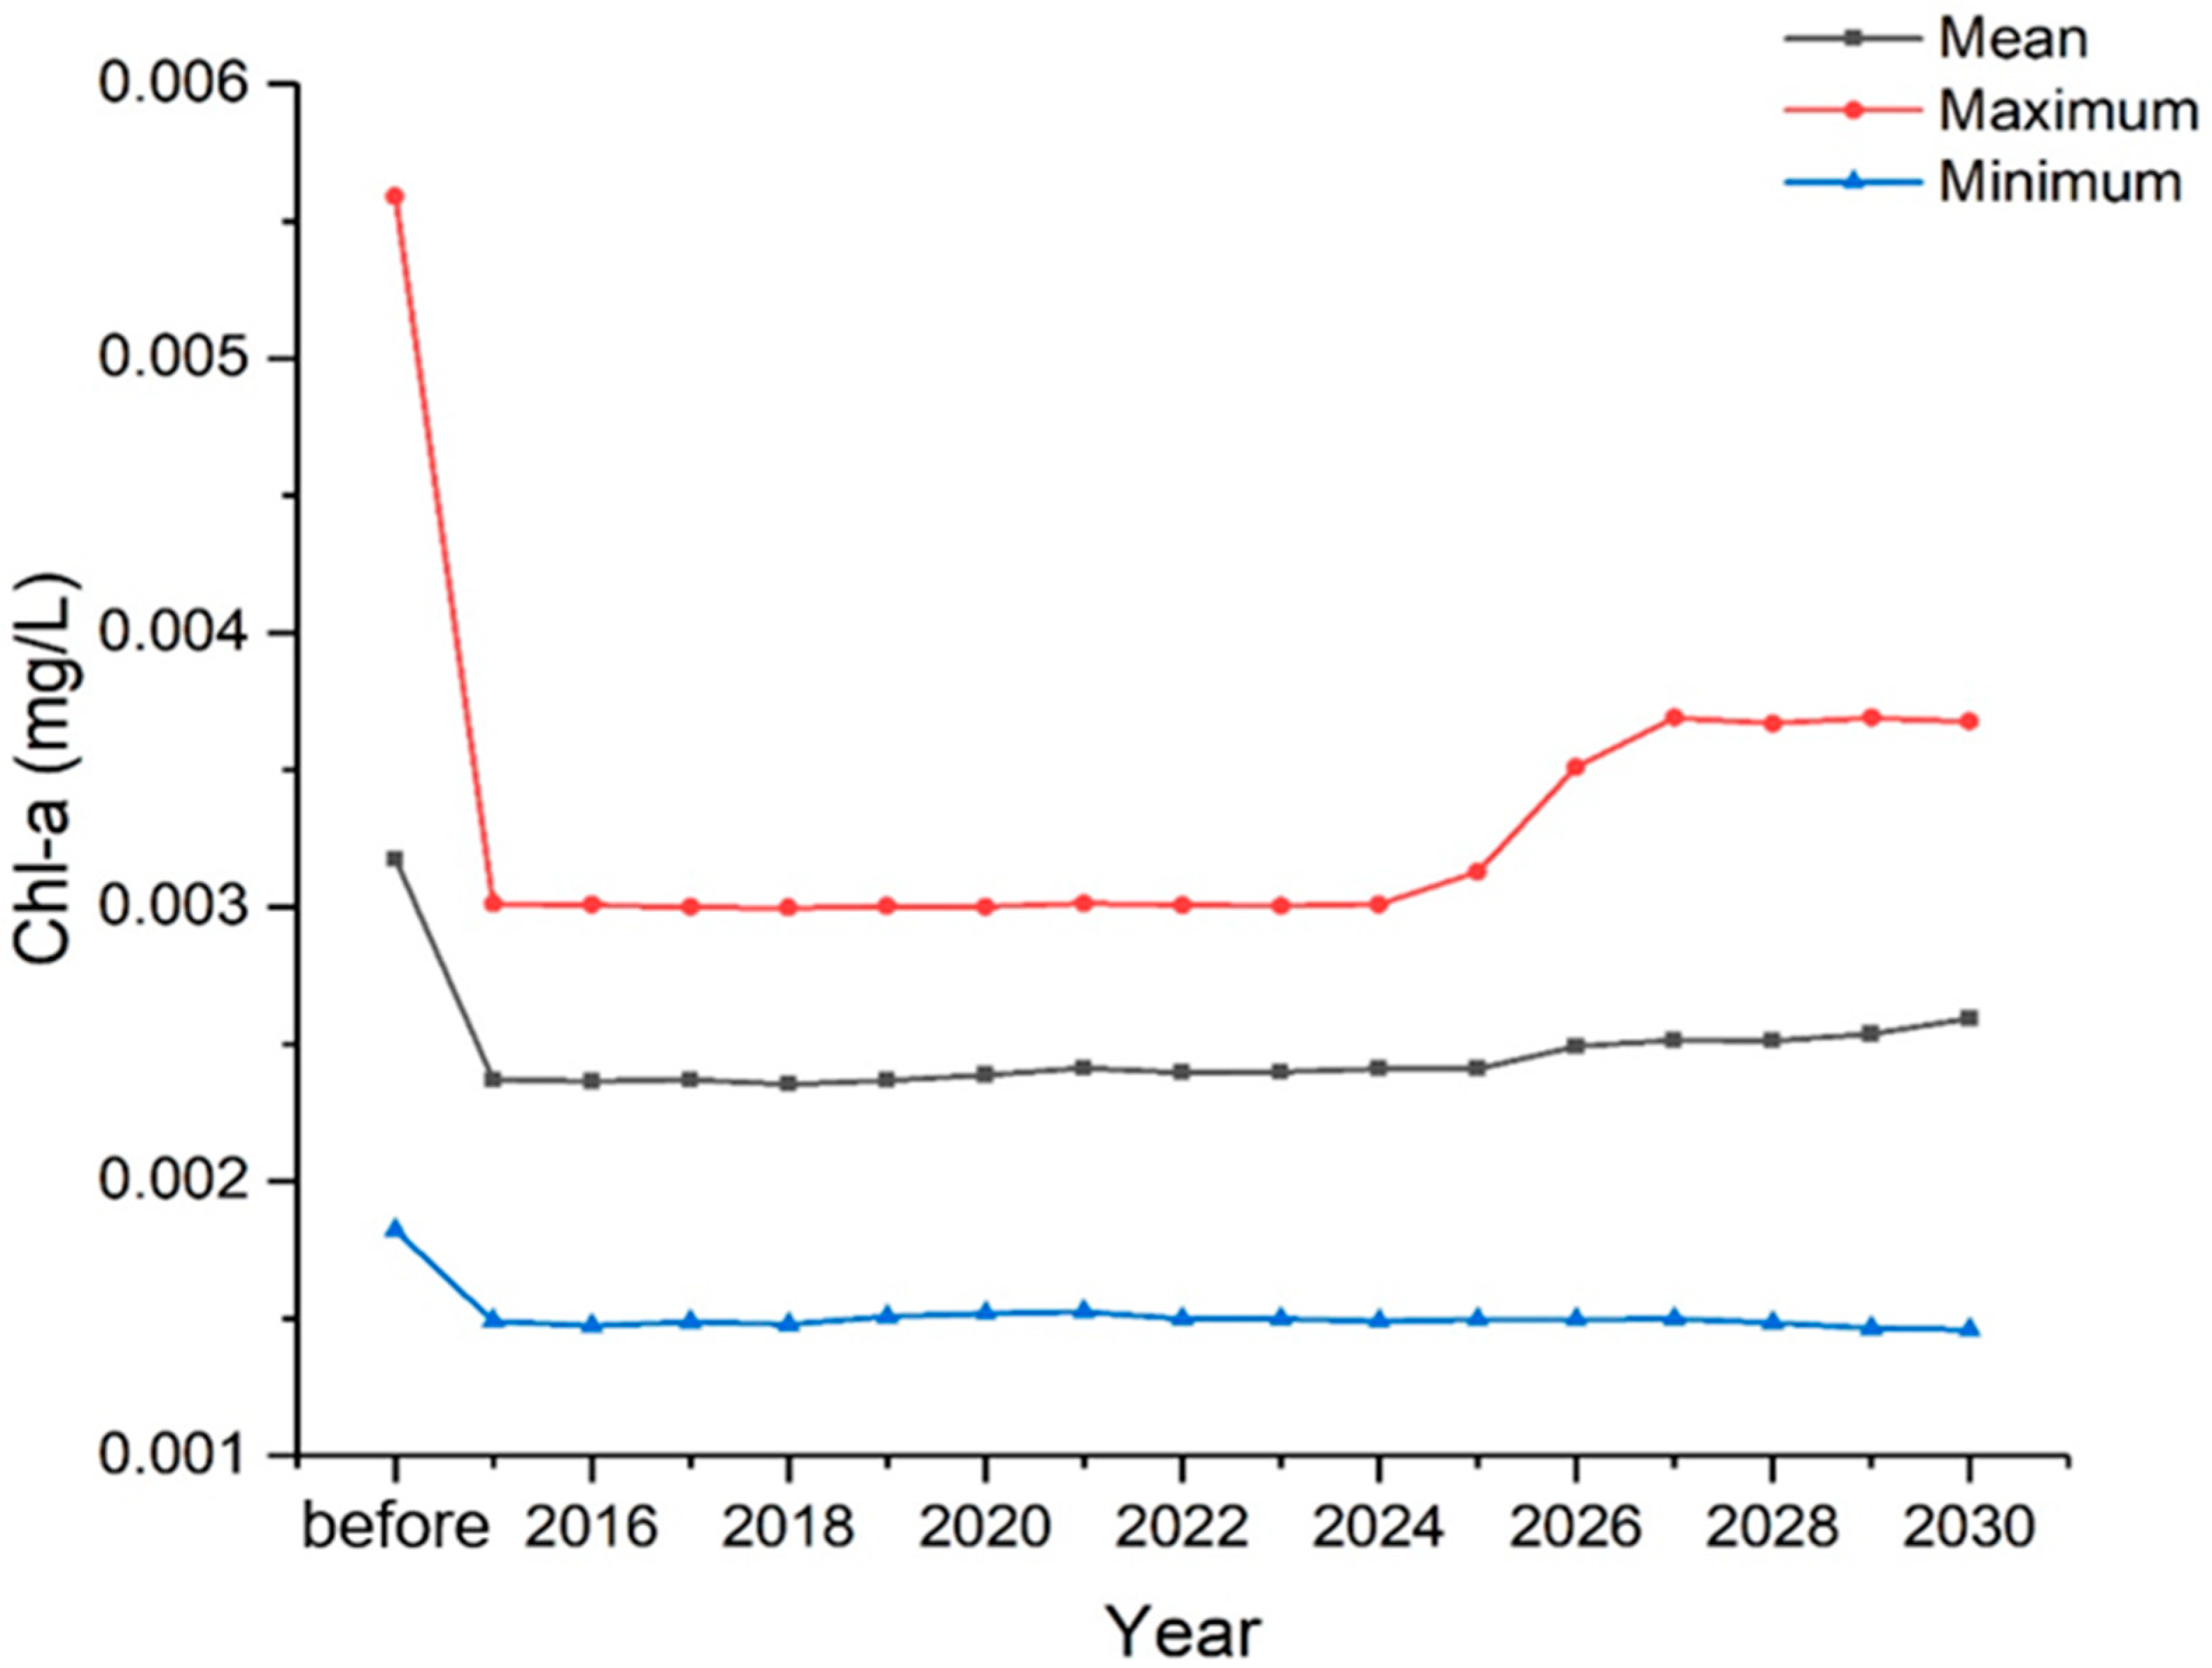
3.2. Prediction of Chl-a Concentration Variations

Owing to the good performance of the RF model, the variations in water chemical indicators after SNWTP implementation were substituted into the trained RF model in Section 3.1.1, and then the corresponding variations in Chl-a concentrations could be predicted. We took 2015 as the initial year of SNWTP implementation and used the trained RF model to predict Chl-a concentration variations in the Miyun Reservoir after the project implementation. The interannual and monthly variations in Chl-a concentrations before (2009–2014) and after (2015–2030) SNWTP implementation are shown in Figure 8 and Figure 9.
As shown in Figure 8, annual mean concentrations, annual maximum concentrations, and annual minimum concentrations of Chl-a in the Miyun Reservoir would decrease by approximately 18.29–25.80%, 33.99–46.39%, and 16.42–19.88%, respectively, after SNWTP implementation. According to Chinese Technological Regulations for Surface Water Resource Quality Assessment [45], the maximum Chl-a concentrations would decrease from mesotrophic level III (0.004–0.01 mg/L Chl-a) to mesotrophic level II (0.002–0.004 mg/L Chl-a) after SNWTP implementation, indicating that SNWTP could significantly improve the trophic state of the Miyun Reservoir. In conclusion, the SNWTP would greatly alleviate the eutrophication trend and improve the water quality of the Miyun Reservoir.
According to Figure 9, the annual Chl-a variation trends at different implementation times were basically consistent but were slightly different from that before SNWTP implementation. The Chl-a concentrations would decrease from April to May and reach the minimum of the year in May (approximately 0.0015 mg/L). Then, it would increase significantly to a maximum from May to August/September. In addition, it would decrease from August/September to November. The Chl-a concentrations in November (0.0020–0.0023 mg/L) would approach the level in April (approximately 0.0018 mg/L) from 2015 to 2030, while it increased again from October to November from 2009 to 2014, indicating that the SNWTP could prevent the water quality of the Miyun Reservoir from deteriorating and becoming eutrophic in autumn and winter. The variation trend predicted by the RF model in the study was consistent with the measured research in the Miyun Reservoir [46].
Comparing the monthly Chl-a concentrations in different years, we found that the declining trends from April to May and from August/September to November were basically similar. However, the increasing trend and maximum concentrations from May to August/September grew more significantly with increasing implementation time. Before 2025 (10 years after SNWTP implementation), the maximum Chl-a concentrations could still be maintained at the level in 2015 (initial year of SNWTP implementation). After that, the water quality started to deteriorate. The maximum Chl-a concentrations would increase by approximately 18.47% from 2025 to 2030 compared with that from 2015 to 2025. The appearance time of the maximum Chl-a concentrations would advance from September (before 2025) to August (2025–2030).

4. Discussion

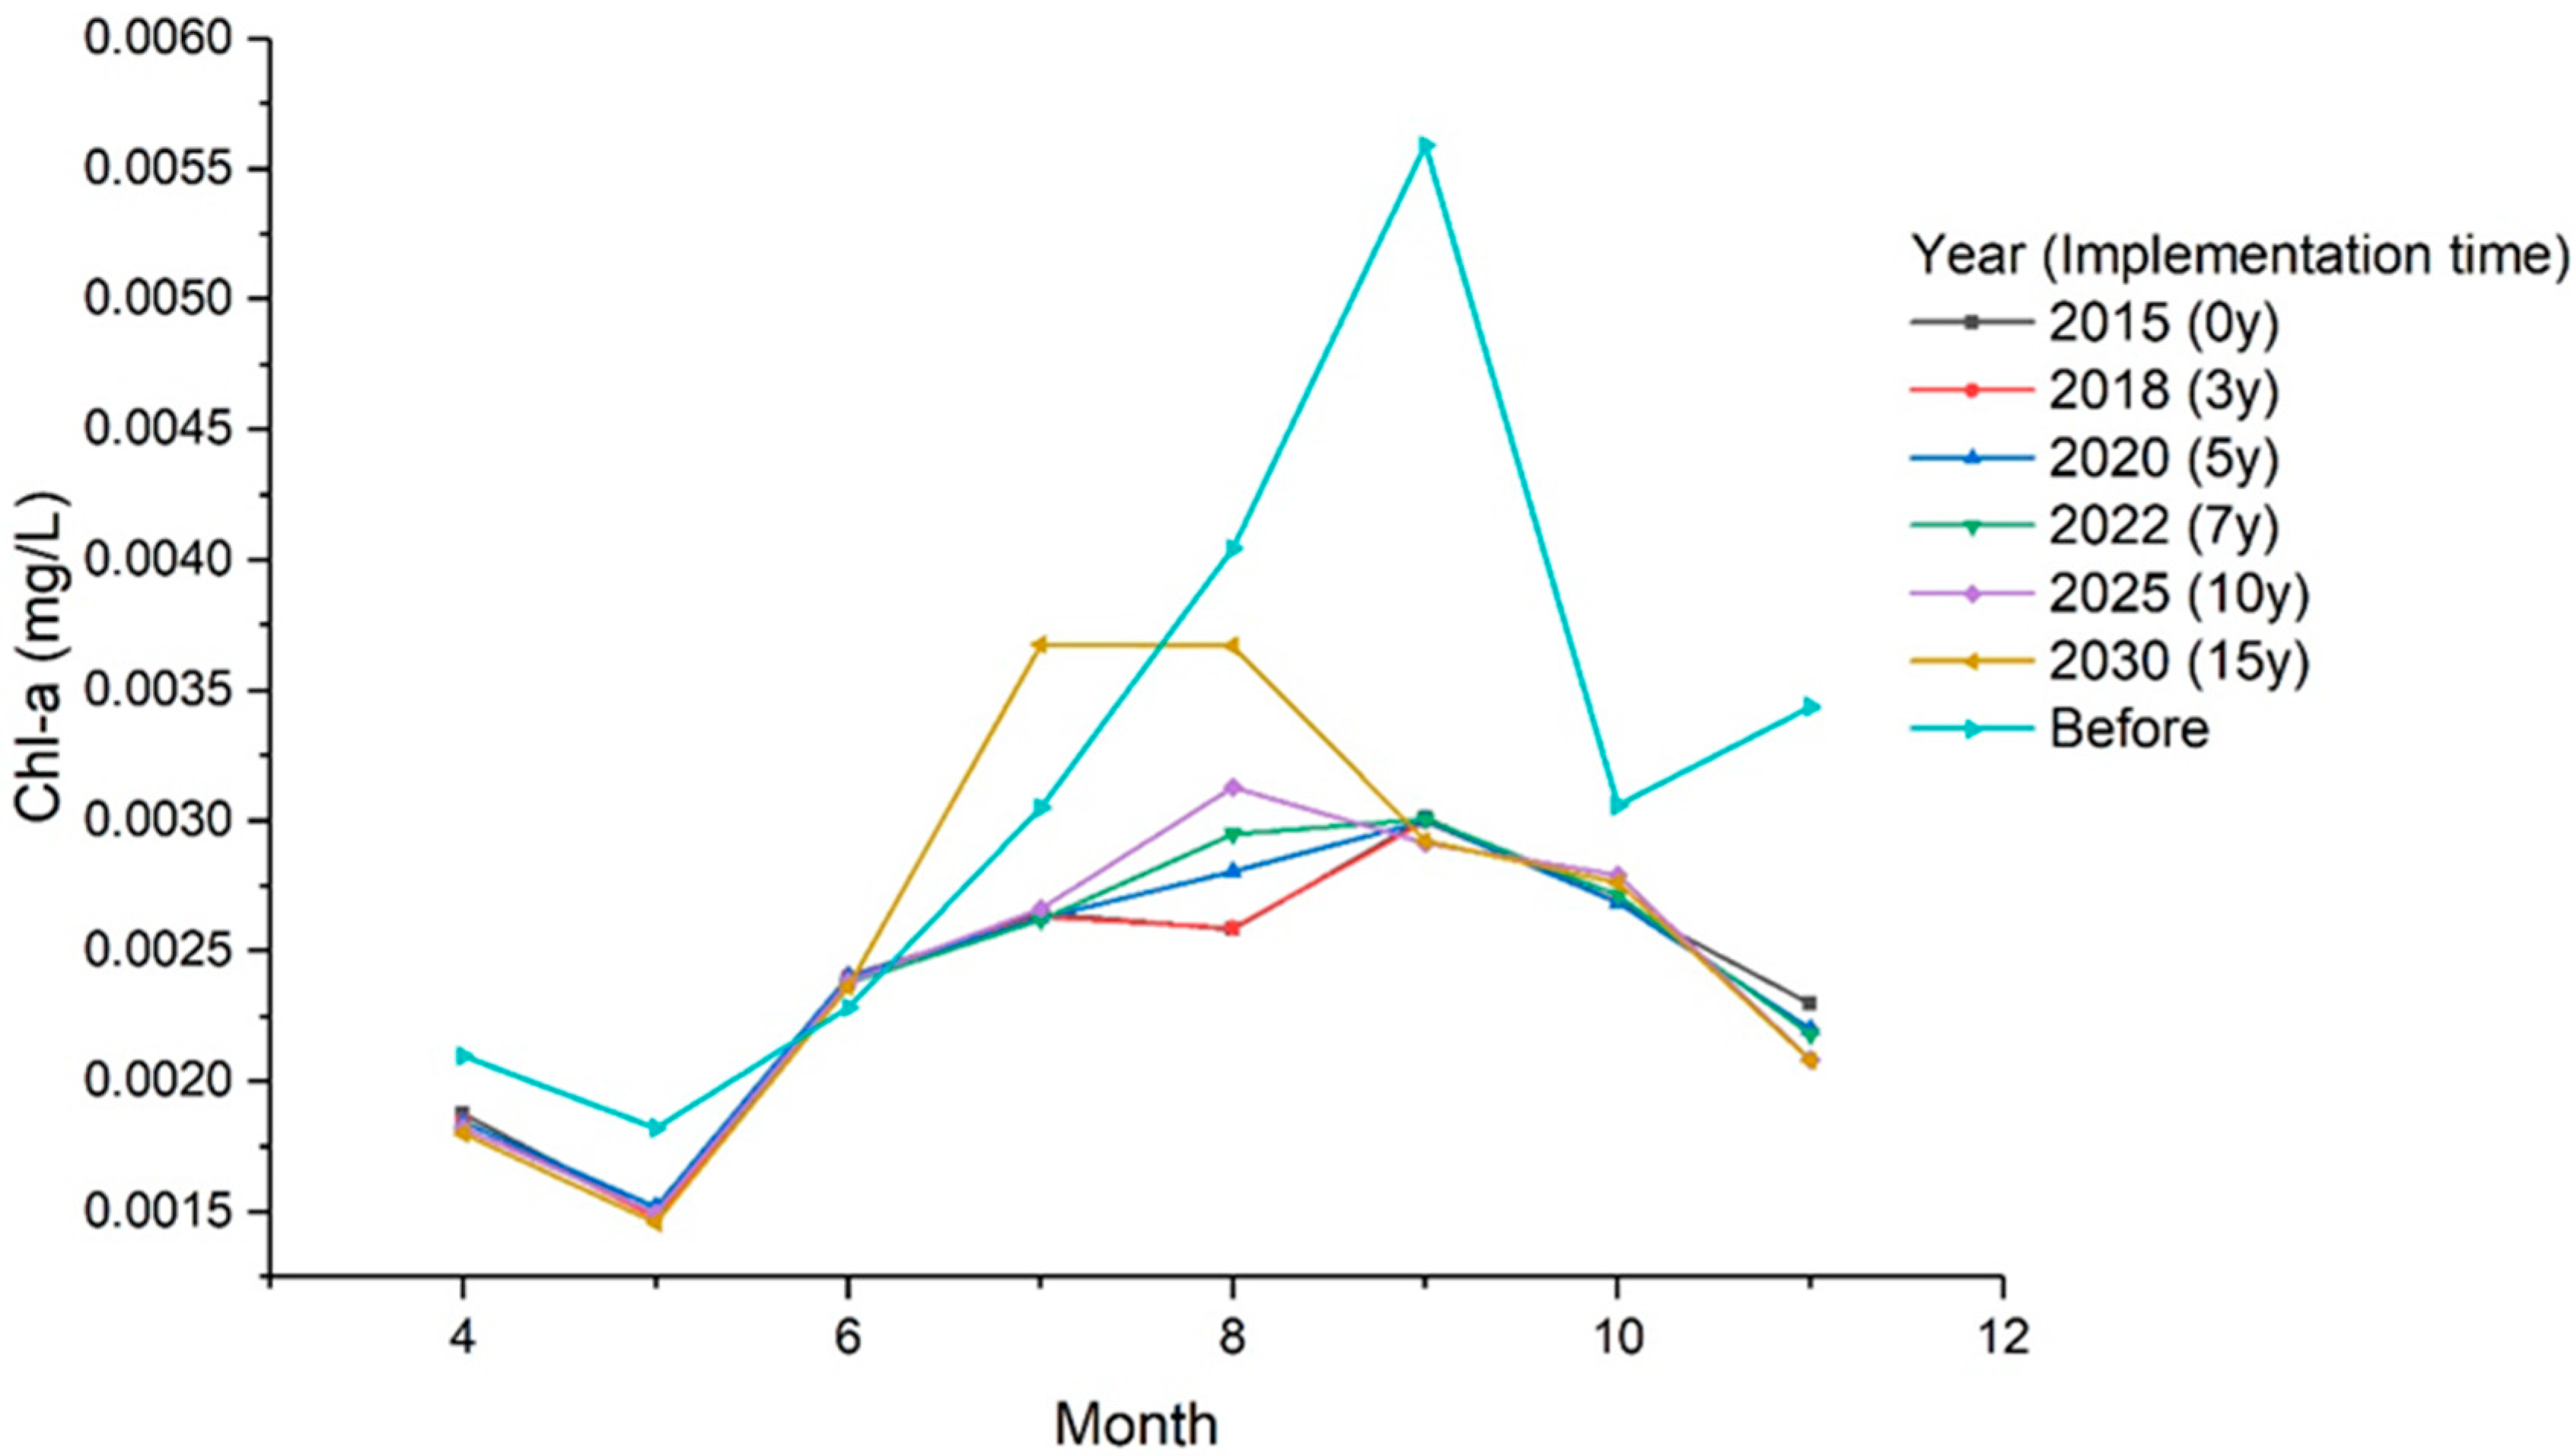
4.1. Analysis on the Variation Trend of Chl-a Concentrations in the Miyun Reservoir

Although the water quality of Danjiangkou Reservoir (i.e., the source of SNWTP) met the basic water quality requirements for drinking water sources in the Chinese Environmental Quality Standards for Surface Water (GB3838-2002), with little organic matter and low water turbidity and water hardness [47], the project was designed to transfer water by an open channel with shallow water depth and slow water flow, making water temperature significantly affected by air temperature. Therefore, the water temperature could reach higher than 30 °C in July and August. Coupled with the high nitrogen content in transferred water, the transferred water would become a suitable environment for algae to propagate. Therefore, with transferred water flowing into the Miyun Reservoir, the reservoir’s Chl-a concentrations would increase significantly in summer.
With the project’s implementation time passing, the impact of transferred water would gradually increase owing to its increasing proportion in the Miyun Reservoir [48], causing the maximum Chl-a concentrations to also increase and appear in advance. In 2030 (15 years after SNWTP implementation), the maximum concentrations would increase significantly to 0.0037 mg/L but stay at mesotrophic level Ⅱ, indicating that the trophic state of the Miyun Reservoir would not change significantly. Zeng et al. [49] found that the transferred water would not cause a significant change in the trophic state of the Miyun Reservoir if the concentrations of nitrogen and phosphorus in the Danjiangkou Reservoir were maintained at current concentrations, which was consistent with our study.
According to the model prediction results and above analyses, we could also infer that as the implementation time of the SNWTP was over 15 years, the trophic state of the Miyun Reservoir was likely to further deteriorate, especially in July and August, requiring close attention and preventive measures from reservoir managers. Therefore, we suggested that managers should (1) strengthen water quality protection and pollution control in the Danjiangkou Reservoir, Miyun Reservoir and along the middle route of the SNWTP, and strictly control the discharges of nitrogen and phosphorus pollutants to cut off the material base of algae growth and reproduction; (2) improve water quality monitoring along the middle route of the SNWTP (especially the monitoring of transferred water before it flows into the Miyun Reservoir) and then figure out the dynamic laws of variations in water quality indicators (especially nitrogen and phosphorus pollutants) to improve the model prediction accuracy to establish an early warning and emergency response mechanism for eutrophication risk; (3) deploy shading devices along the middle route project to prevent water temperature increases affected by air temperature, especially in July and August; and (4) adjust the seasonal distribution plan of transferred water (i.e., increase water transfer in spring and autumn and decrease water transfer in summer) to reduce the eutrophication risk caused by transferred water in summer.

4.2. Performance Comparisons of Machine Learning Models and Other Models

There are two kinds of models widely used to predict water quality variations: non-mechanistic models (including mathematical statistical models and machine learning models) and mechanical models. Both mathematical statistical models and machine learning models predict the variation of Chl-a concentrations with consideration of the statistical relationships between Chl-a concentrations and impact factors, rather than the impact mechanism from impact factors to Chl-a concentrations, allowing them to be easily applied in different regions. Mathematical statistical models (e.g., simple linear regression model, multiple linear regression model, etc.) have the advantages of the simple model construction, fast calculation and simulation process and the low barrier of learning, but they still have some limitations. For example, most mathematical statistical models are linear models with high data requirements, that is, the data used to build the model must be balanced data and have no collinearity between different variates. Otherwise, if there were a key factor having missing data or collinearity with other factors, the factor would be very likely to be rejected during regression, which may have a negative impact on model accuracy. However, in practical water quality prediction, the relationships between Chl-a concentrations and impact factors are usually nonlinear and there are interactive effects among different factors. Therefore, the linear statistical models have relatively low simulation accuracy [20]. Compared with mathematical statistical models, machine learning models can identify complex nonlinear relationships to the greatest extent and have better processing capacity with imbalanced data and missing data, so they have lower data requirements, higher prediction accuracy and more robust prediction performance [20,50].
Based on the impact mechanism to build models, the mechanical models can reflect the impact processes and mechanisms from impact factors on the Chl-a concentrations in detail and give reasonable explanations for the reasons of Chl-a concentration variations, but they still have some shortcomings. Firstly, the construction of mechanical models requires a large amount of long-term measured water quality data, accurate definition of boundary conditions and the specific physical, chemical and biological mechanism of algae growth and eutrophication. These three conditions are directly related to the simulation accuracy of models. Secondly, the processes of model construction and calibration are time-consuming and complicated owing to the vast calculations required [19,51]. For the large cross-basin water transfer project like SNWTP, it would cost excessive time, labor and money to set up sampling points along the way to investigate water quality and analyze hydrodynamics and water quality variations, requiring the researchers to make a trade-off between model accuracy and research economy and efficiency. Compared with the mechanical model, the machine learning models have a simpler and faster modeling and simulation process, and the ability to consider more impact factors, with lower construction requirements and greater ability to analyze big data [13]. Comparing the machine learning models in our study with Zeng et al.’s mechanical model [49], the results showed that the MAE of our model was between 0.0006 to 0.0012 (Table 3), while the MAE of the mechanical model was equal to 0.2177, indicating that our models had better prediction ability than mechanical model for predicting Chl-a concentration variations. Moreover, the monthly variation trend of Chl-a concentrations in our study was consistent with the measured research from 2017 to 2018 [46]. Comparing the predicted Chl-a concentration in the study with Wu et al.’s measured data [52] in August, 2019, the relative error was about 31.67%, which was acceptable in the study. Therefore, although the machine learning models are regarded as black box models, they are still good alternatives in predicting Chl-a concentrations for receiving reservoirs of the large-scale water transfer projects with no detailed data or unknown dynamics processes of eutrophication.
In conclusion, owing to the advantages of a simple and fast modeling process, acceptable prediction accuracy and robust prediction performance, machine learning models developed in the study can conduct precise simulations of water quality variations in receiving reservoirs after the implementation of large cross-basin water transfer projects, and have great application prospects in predicting the impact on receiving reservoirs caused by multiscale and multi-scenario water transfer projects. The simulation and prediction results are useful for making water resource management policies for receiving reservoirs, especially for reservoirs in areas lacking data, to improve policy efficiency and pertinency.

5. Conclusions

In this study, we used two kinds of machine learning models to predict the Chl-a concentration variations of the Miyun Reservoir after the implementation of the world’s largest water transfer project—SNWTP, and the basic results were shown as follows:
  • Compared with the SVM model, the RF model had higher prediction accuracy, more stable results, less overfitting, and more robust prediction ability when the data was missing or abnormal. Thus, the RF model was more suitable for predicting Chl-a variations in receiving reservoirs affected by the implementation of SNWTP.
  • The prediction results showed that short-term (within 3 years) implementation of SNWTP would not cause significant variations in Chl-a concentrations in the Miyun Reservoir.
  • The proportion of transferred water in the reservoir would have gradually increased as the SNWTP implementation time increased, causing the impact of transferred water to increase. Ten years after implementation, the Chl-a concentrations of the Miyun Reservoir would significantly increase, especially from July to August/September, indicating that the reservoir may suffer more severe eutrophication. Therefore, the long-term implementation of SNWTP may have a potential negative impact on the receiving reservoir, indicating that reservoir managers need to take more actions to prevent changes in the waterbody’s trophic state, especially in July and August.
From the perspective of trophic state variations, we focused on the impact of a large cross-basin water transfer project on the water quality variations of its receiving reservoir and compared the prediction performances of two machine learning models. Our study can provide scientific suggestions for making targeted water resource management policies and offer research references for the selection and popularization of Chl-a prediction models for receiving reservoirs, especially reservoirs in areas lacking data. However, owing to the limitations of machine learning methods, this study does not consider pollutants’ physical and chemical activities. Therefore, future studies should combine our results with actual water quality data of transferred water and simulation results of mechanical models to further confirm and explain water quality variations.

Author Contributions

Conceptualization, N.Z. and X.W.; methodology, N.Z.; software, N.Z. and Z.L.; validation, Z.L.; resources, N.Z. and X.W.; data curation, N.Z.; writing—original draft preparation, Z.L.; writing—review and editing, X.W.; visualization, Z.L. and N.Z.; supervision, X.W., C.L. and Q.L. All authors have read and agreed to the published version of the manuscript.

Funding

This research was financially supported by the National Natural Science Foundation of China (Grant No. 52070024, 51679008), and the National Key Research and Development Program of China (Grant No. 2017YFC0404505).

Data Availability Statement

The water quality datasets used in the study are not publicly available due to management requirements of Miyun Reservoir Management Office, but are available from the corresponding author on reasonable request. Except for the water quality datasets, other datasets used in the study are available in the China Meteorological Data Service Center (http://data.cma.cn/, accessed on 7 September 2017). All data generated or analyzed during this study are included in this published paper.

Acknowledgments

This research was financially supported by the National Natural Science Foundation of China (Grant No. 52070024, 51679008), and the National Key Research and Development Program of China (Grant No. 2017YFC0404505). We would like to extend special thanks to the editor and the anonymous reviewers for their valuable comments in greatly improving the quality of this paper.

Conflicts of Interest

The authors declare no conflict of interest. The funders had no role in the design of the study; in the collection, analyses, or interpretation of data; in the writing of the manuscript, or in the decision to publish the results.

References

  1. Peng, Z.; Hu, W.; Zhang, Y.; Liu, G.; Zhang, H.; Gao, R. Modelling the effects of joint operations of water transfer project and lake sluice on circulation and water quality of a large shallow lake. J. Hydrol. 2021, 593, 125881. [Google Scholar] [CrossRef]
  2. Zhuang, W. Eco-environmental impact of inter-basin water transfer projects: A review. Environ. Sci. Pollut. Res. 2016, 23, 12867–12879. [Google Scholar] [CrossRef]
  3. Guo, C.; Chen, Y.; Gozlan, R.E.; Liu, H.; Lu, Y.; Qu, X.; Xia, W.; Xiong, F.; Xie, S.; Wang, L. Patterns of fish communities and water quality in impounded lakes of China’s south-to-north water diversion project. Sci. Total Environ. 2020, 713, 136515. [Google Scholar] [CrossRef]
  4. Dai, J.; Wu, S.; Wu, X.; Lv, X.; Sivakumar, B.; Wang, F.; Zhang, Y.; Yang, Q.; Gao, A.; Zhao, Y.; et al. Impacts of a large river-to-lake water diversion project on lacustrine phytoplankton communities. J. Hydrol. 2020, 587, 124938. [Google Scholar] [CrossRef]
  5. Varol, M. Spatio-temporal changes in surface water quality and sediment phosphorus content of a large reservoir in Turkey. Environ. Pollut. 2020, 259, 113860. [Google Scholar] [CrossRef]
  6. Wen, S.; Wang, H.; Wu, T.; Yang, J.; Jiang, X.; Zhong, J. Vertical profiles of phosphorus fractions in the sediment in a chain of reservoirs in North China: Implications for pollution source, bioavailability, and eutrophication. Sci. Total Environ. 2020, 704, 135318. [Google Scholar] [CrossRef]
  7. Hempel, C.G. Aspects of Scientific Explanation and Other Essays in the Philosophy of Science; Free Press: New York, NY, USA, 1965. [Google Scholar]
  8. Salmon, W. Scientific Explanation and the Causal Structure of the World; Princeton University: Princeton, NJ, USA, 1984. [Google Scholar]
  9. Zhang, P. Research on Hempel’s Theory of Scientific Explanation. Ph.D. Thesis, Jilin University, Changchun, China, 2005. (In Chinese). [Google Scholar]
  10. Tang, C.; Yi, Y.; Yang, Z.; Cheng, X. Water pollution risk simulation and prediction in the main canal of the South-to-North Water Transfer Project. J. Hydrol. 2014, 519, 2111–2120. [Google Scholar] [CrossRef]
  11. Thoe, W.; Gold, M.; Griesbach, A.; Grimmer, M.; Taggart, M.; Boehm, A. Predicting water quality at Santa Monica Beach: Evaluation of five different models for public notification of unsafe swimming conditions. Water Res. 2014, 67, 105–117. [Google Scholar] [CrossRef] [PubMed]
  12. Penev, S.; Leonte, D.; Lazarov, Z.; Mann, R.A. Applications of MIDAS regression in analysing trends in water quality. J. Hydrol. 2014, 511, 151–159. [Google Scholar] [CrossRef] [Green Version]
  13. Peng, S.; Li, S. Scale relationship between landscape pattern and water quality in different pollution source areas: A case study of the Fuxian Lake watershed, China. Ecol. Indic. 2021, 121, 107136. [Google Scholar] [CrossRef]
  14. Hajigholizadeh, M.; Melesse, A.M. Assortment and spatiotemporal analysis of surface water quality using cluster and dis-criminant analyses. Catena 2017, 151, 247–258. [Google Scholar] [CrossRef]
  15. Li, T.; Li, S.; Liang, C.; Bush, R.T.; Xiong, L.; Jiang, Y. A comparative assessment of Australia’s Lower Lakes water quality under extreme drought and post-drought conditions using multivariate statistical techniques. J. Clean. Prod. 2018, 190, 1–11. [Google Scholar] [CrossRef]
  16. Zhong, S.; Zhang, K.; Bagheri, M.; Burken, J.G.; Gu, A.; Li, B.; Ma, X.; Marrone, B.L.; Ren, Z.J.; Schrier, J.; et al. Machine learning: New ideas and tools in environ-mental science and engineering. Environ. Sci. Technol. 2021. [Google Scholar] [CrossRef]
  17. Elbeltagi, A.; Kumari, N.; Dharpure, J.; Mokhtar, A.; Alsafadi, K.; Kumar, M.; Mehdinejadiani, B.; Etedali, H.R.; Brouziyne, Y.; Islam, A.T.; et al. Prediction of Combined Terrestrial Evapotranspiration Index (CTEI) over Large River Basin Based on Machine Learning Approaches. Water 2021, 13, 547. [Google Scholar] [CrossRef]
  18. Srivastava, A.; Sahoo, B.; Raghuwanshi, N.S.; Singh, R. Evaluation of Variable-Infiltration Capacity Model and MODIS-Terra Satellite-Derived Grid-Scale Evapotranspiration Estimates in a River Basin with Tropical Monsoon-Type Climatology. J. Irrig. Drain. Eng. 2017, 143, 04017028. [Google Scholar] [CrossRef] [Green Version]
  19. Zeng, Q.; Liu, Y.; Zhao, H.; Sun, M.; Li, X. Comparison of models for predicting the changes in phytoplankton community composition in the receiving water system of an inter-basin water transfer project. Environ. Pollut. 2017, 223, 676–684. [Google Scholar] [CrossRef] [PubMed]
  20. Wang, R.; Kim, J.-H.; Li, M.-H. Predicting stream water quality under different urban development pattern scenarios with an interpretable machine learning approach. Sci. Total Environ. 2021, 761, 144057. [Google Scholar] [CrossRef] [PubMed]
  21. Singh, K.P.; Basant, N.; Gupta, S. Support vector machines in water quality management. Anal. Chim. Acta 2011, 703, 152–162. [Google Scholar] [CrossRef]
  22. Castrillo, M.; Garcia, A.L. Estimation of high frequency nutrient concentrations from water quality surrogates using ma-chine learning methods. Water Res. 2020, 172, 115490. [Google Scholar] [CrossRef] [Green Version]
  23. El Bilali, A.; Taleb, A.; Brouziyne, Y. Groundwater quality forecasting using machine learning algorithms for irrigation purposes. Agric. Water Manag. 2021, 245, 106625. [Google Scholar] [CrossRef]
  24. Kim, H.G.; Hong, S.; Chon, T.S.; Joo, G.J. Spatial patterning of chlorophyll a and water-quality measurements for determin-ing environmental thresholds for local eutrophication in the Nakdong River basin. Environ. Pollut. 2021, 268 Pt A, 115701. [Google Scholar] [CrossRef]
  25. Liang, Z.; Xu, Y.; Qiu, Q.; Liu, Y.; Lu, W.; Wagner, T. A framework to develop joint nutrient criteria for lake eutrophication management in eutrophic lakes. J. Hydrol. 2021, 594, 125883. [Google Scholar] [CrossRef]
  26. Zou, W.; Zhu, G.; Cai, Y.; Vilmi, A.; Xu, H.; Zhu, M.; Gong, Z.; Zhang, Y.; Qin, B. Relationships between nutrient, chloro-phyll a and Secchi depth in lakes of the Chinese Eastern Plains ecoregion: Implications for eutrophication management. J. Environ. Manag. 2020, 260, 109923. [Google Scholar] [CrossRef] [PubMed]
  27. Ma, H.; Yang, D.; Tan, S.K.; Gao, B.; Hu, Q. Impact of climate variability and human activity on streamflow decrease in the Miyun Reservoir catchment. J. Hydrol. 2010, 389, 317–324. [Google Scholar] [CrossRef]
  28. Wang, X.; Hao, G.; Yang, Z.; Liang, P.; Cai, Y.; Li, C.; Sun, L.; Zhu, J. Variation analysis of streamflow and ecological flow for the twin rivers of the Miyun Reservoir Basin in northern China from 1963 to 2011. Sci. Total Environ. 2015, 536, 739–749. [Google Scholar] [CrossRef]
  29. Li, D.; Liang, J.; Di, Y.; Gong, H.; Guo, X. The spatial-temporal variations of water quality in controlling points of the main rivers flowing into the Miyun Reservoir from 1991 to 2011. Environ. Monit. Assess. 2016, 188, 42. [Google Scholar] [CrossRef]
  30. Wang, X.; Zang, N.; Liang, P.; Cai, Y.; Li, C.; Yang, Z. Identifying priority management intervals of discharge and TN/TP concentration with copula analysis for Miyun Reservoir inflows, North China. Sci. Total Environ. 2017, 609, 1258–1269. [Google Scholar] [CrossRef]
  31. Li, S.; Cheng, X.; Xu, Z.; Han, H.; Zhang, Q. Spatial and temporal patterns of the water quality in the Danjiangkou Reservoir, China. Hydrol. Sci. J. 2009, 54, 124–134. [Google Scholar] [CrossRef]
  32. Yin, D.; Zheng, L.; Song, L. Spatio-temporal distribution of phytoplankton in the Danjiangkou Reservoir, a water source area for the Southto-North Water Diversion Project (Middle Route), China. Chin. J. Oceanol. Limnol. 2011, 29, 531–540. [Google Scholar] [CrossRef]
  33. Xu, H.; Zhao, L.; Sun, H.; Ren, Y.; Ding, T.; Chang, S.; Wang, H.; Li, M.; Guo, Z. Water Quality Analysis of Beijing Segment of South-to-North Water Diversion Middle Route Project. Environ. Sci. 2017, 38, 1357–1365. (In Chinese) [Google Scholar] [CrossRef]
  34. Tao, L.; Huang, Z.; Lu, Y. Study on countermeasures and the nutrition of water in South-to-North water diversion project. Beijing Water 2017, 6, 15–21. (In Chinese) [Google Scholar]
  35. Tan, H.; He, W.; Han, H.; Zhang, X.; Ma, Y.; Zhang, S. Monitoring and analysis of Danjiangkou Reservoir water quality. Water Technol. 2015, 9, 1–5. (In Chinese) [Google Scholar]
  36. China Meteorological Data Service Center. Available online: http://data.cma.cn/ (accessed on 7 September 2017). (In Chinese).
  37. Cao, Z. Study on Optimization of Random Forests Algorithm. Ph.D. Thesis, Capital University of Economics and Business, Beijing, China, 2014. (In Chinese). [Google Scholar]
  38. Harrison, J.W.; Lucius, M.A.; Farrell, J.L.; Eichler, L.W.; Relyea, R.A. Prediction of stream nitrogen and phosphorus concen-trations from high-frequency sensors using Random Forests Regression. Sci. Total Environ. 2021, 763, 143005. [Google Scholar] [CrossRef] [PubMed]
  39. Karamouz, M.; Ahmadi, A.; Moridi, A. Probabilistic reservoir operation using Bayesian stochastic model and support vector machine. Adv. Water Resour. 2009, 32, 1588–1600. [Google Scholar] [CrossRef]
  40. Vapnik, V. The Nature of Statistical Learning Theory; Springer: New York, NY, USA, 2000. [Google Scholar]
  41. Vapnik, V.N. An overview of statistical learning theory. IEEE Trans. Neural Netw. 1999, 10, 988–999. [Google Scholar] [CrossRef] [PubMed] [Green Version]
  42. Catherine, A.; Mouillot, D.; Escoffier, N.; Bernard, C.; Troussellier, M. Cost effective prediction of the eutrophication status of lakes and reservoirs. Freshw. Biol. 2010, 55, 2425–2435. [Google Scholar] [CrossRef]
  43. Xu, Y.; Ma, C.; Liu, Q.; Xi, B.; Qian, G.; Zhang, D.; Huo, S. Method to predict key factors affecting lake eutrophication—A new approach based on Support Vector Regression model. Int. Biodeterior. Biodegrad. 2015, 102, 308–315. [Google Scholar] [CrossRef]
  44. Park, Y.; Pachepsky, Y.A.; Cho, K.H.; Jeon, D.J.; Kim, J.H. Stressor–response modeling using the 2D water quality model and regression trees to predict chlorophyll-a in a reservoir system. J. Hydrol. 2015, 529, 805–815. [Google Scholar] [CrossRef]
  45. Ministry of Water Resources of the People’s Republic of China. Technological Regulations for Surface Water Resources Quality Assessment (SL395-2007); China Water&Power Press: Beijing, China, 2007. (In Chinese) [Google Scholar]
  46. Li, Y. Analysis on the water quality and dynamic trend of Miyun Reservoir. Beijing Water 2020, S1, 36–40. (In Chinese) [Google Scholar] [CrossRef]
  47. Lin, M.; Zhang, Q.; Li, Z.; Zhang, G.; Zhang, Z.; Yang, Z.; Si, S.; Niu, H.; Sun, J.; Fan, H.; et al. Characteristics of the variance of the water qualtiy and quantity in the middle route of South-to-North Water Diversion Project and corresponding measures for urban water supply. Water Wastewater Eng. 2016, 52, 9–13. (In Chinese) [Google Scholar]
  48. Wu, X.; Wu, G.; Pan, K.; Liu, L. Predicting analysis on impact of incoming water from South-to-North water transfer project on water quality and aquatic organisms in Miyun reservoir. Beijing Water 2015, 4–6. (In Chinese) [Google Scholar] [CrossRef]
  49. Zeng, Q.; Qin, L.; Li, X. The potential impact of an inter-basin water transfer project on nutrients (nitrogen and phospho-rous) and chlorophyll a of the receiving water system. Sci. Total Environ. 2015, 536, 675–686. [Google Scholar] [CrossRef] [PubMed]
  50. Kuo, J.-T.; Hsieh, M.-H.; Lung, W.-S.; She, N. Using artificial neural network for reservoir eutrophication prediction. Ecol. Model. 2007, 200, 171–177. [Google Scholar] [CrossRef]
  51. Deng, T.; Chau, K.-W.; Duan, H.-F. Machine learning based marine water quality prediction for coastal hydro-environment management. J. Environ. Manag. 2021, 284, 112051. [Google Scholar] [CrossRef]
  52. Wu, T.; Zhu, G.; Zhu, M.; Xu, H.; Yang, J.; Zhao, X. Effects of algae proliferation and density current on the vertical distribu-tion of odor compounds in drinking water reservoirs in summer. Environ. Pollut. 2021, 288, 117683. [Google Scholar] [CrossRef]
Figure 1. Location of Miyun Reservoir in north China.
Water 13 02406 g001
Figure 2. Technical roadmap for predicting Chl-a variations in the receiving reservoir of the water transfer project.
Water 13 02406 g002
Figure 3. Process of building a RF model.
Water 13 02406 g003
Figure 4. Prediction results of RF model in train stage.
Water 13 02406 g004
Figure 5. Prediction results of RF model in test stage.
Water 13 02406 g005
Figure 6. Prediction results of SVM model in train stage.
Water 13 02406 g006
Figure 7. Prediction results of SVM model in test stage.
Water 13 02406 g007
Figure 8. Interannual variations in mean, maximum and minimum Chl-a concentrations of Miyun Reservoir before and after SNWTP implementation (before are mean concentrations from 2009 to 2014).
Water 13 02406 g008
Figure 9. Annual Chl-a concentration variations of Miyun Reservoir after SNWTP implementation (before are mean concentrations from 2009 to 2014).
Water 13 02406 g009
Table 1. Water environmental indicators in three reservoirs.
Water Quality IndicatorsMiyun ReservoirDanjiangkou ReservoirDaning Surge Tank
Mean ± SD *MeanReferencesMeanReferences
Water temperature (°C)19.75 ± 6.3119.02[31]
Water transparency (m)2.93 ± 1.464.32[32]
pH8.35 ± 0.248.00[32]8.31[33]
DO (mg/L)8.99 ± 1.487.97[32]9.65[34]
CODMn (mg/L)2.51 ± 0.512.58[35]2.75[34]
TP (mg/L)0.02 ± 0.010.036[32]0.018[33]
TN (mg/L)1.05 ± 0.581.27[32]1.18[33]
* The indicator values in Miyun Reservoir were annual mean values from 2002 to 2014.
Table 2. Pearson correlation coefficients between Chl-a concentrations and impact indicators.
FactorsIndicatorsCoefficientsFactorsIndicatorsCoefficients
ClimateSunshine duration (h)0.0795Water qualityWater transparency (m)0.2813
Percentage of sunshine (%)0.0094pH0.0085
Precipitation (mm)0.0226DO (mg/L)0.0702
Average wind speed (m/s)0.0928CODMn (mg/L)0.1076
Average air temperature (°C)0.0193BOD5 (mg/L)0.0001
HydrologyWater temperature (°C)0.1355TP (mg/L)0.0943
Upstream inflow (m3/s)0.0745TN (mg/L)0.0531
Downstream outflow (m3/s)0.0948
Average water level (m)0.0107
Table 3. Performances of two machine learning models on Chl-a concentration variations.
ModelProgram PackageParametersrRMSEMAE
TrainTestTrainTestTrainTest
RFrandomForestmtry = 2
ntree = 1000
0.65570.64880.00180.00170.00110.0011
SVMe1071RBF
nu-regression
C = 1.9
Sigma = 0.14
0.84470.58750.00130.00180.00060.0012
Table 4. RF model prediction performances in four scenarios.
ParametersScenariosrRMSEMAE
TrainTestTrainTestTrainTest
mtry = 2
ntree = 1000
Normal0.65320.64140.00180.00170.00110.0011
Program0.61460.62290.00180.00180.00110.0011
Random0.65270.66160.00170.00160.00110.0010
Filling0.65220.66540.00170.00160.00100.0010
Publisher’s Note: MDPI stays neutral with regard to jurisdictional claims in published maps and institutional affiliations.

