
Geochemical and Isotope Characterisation of Thermo-Mineral Springs of Corsica Island: From Geological Complexity to Groundwater Singularity

 , , , and
Abstract
:1. Introduction
2. Study Area Description
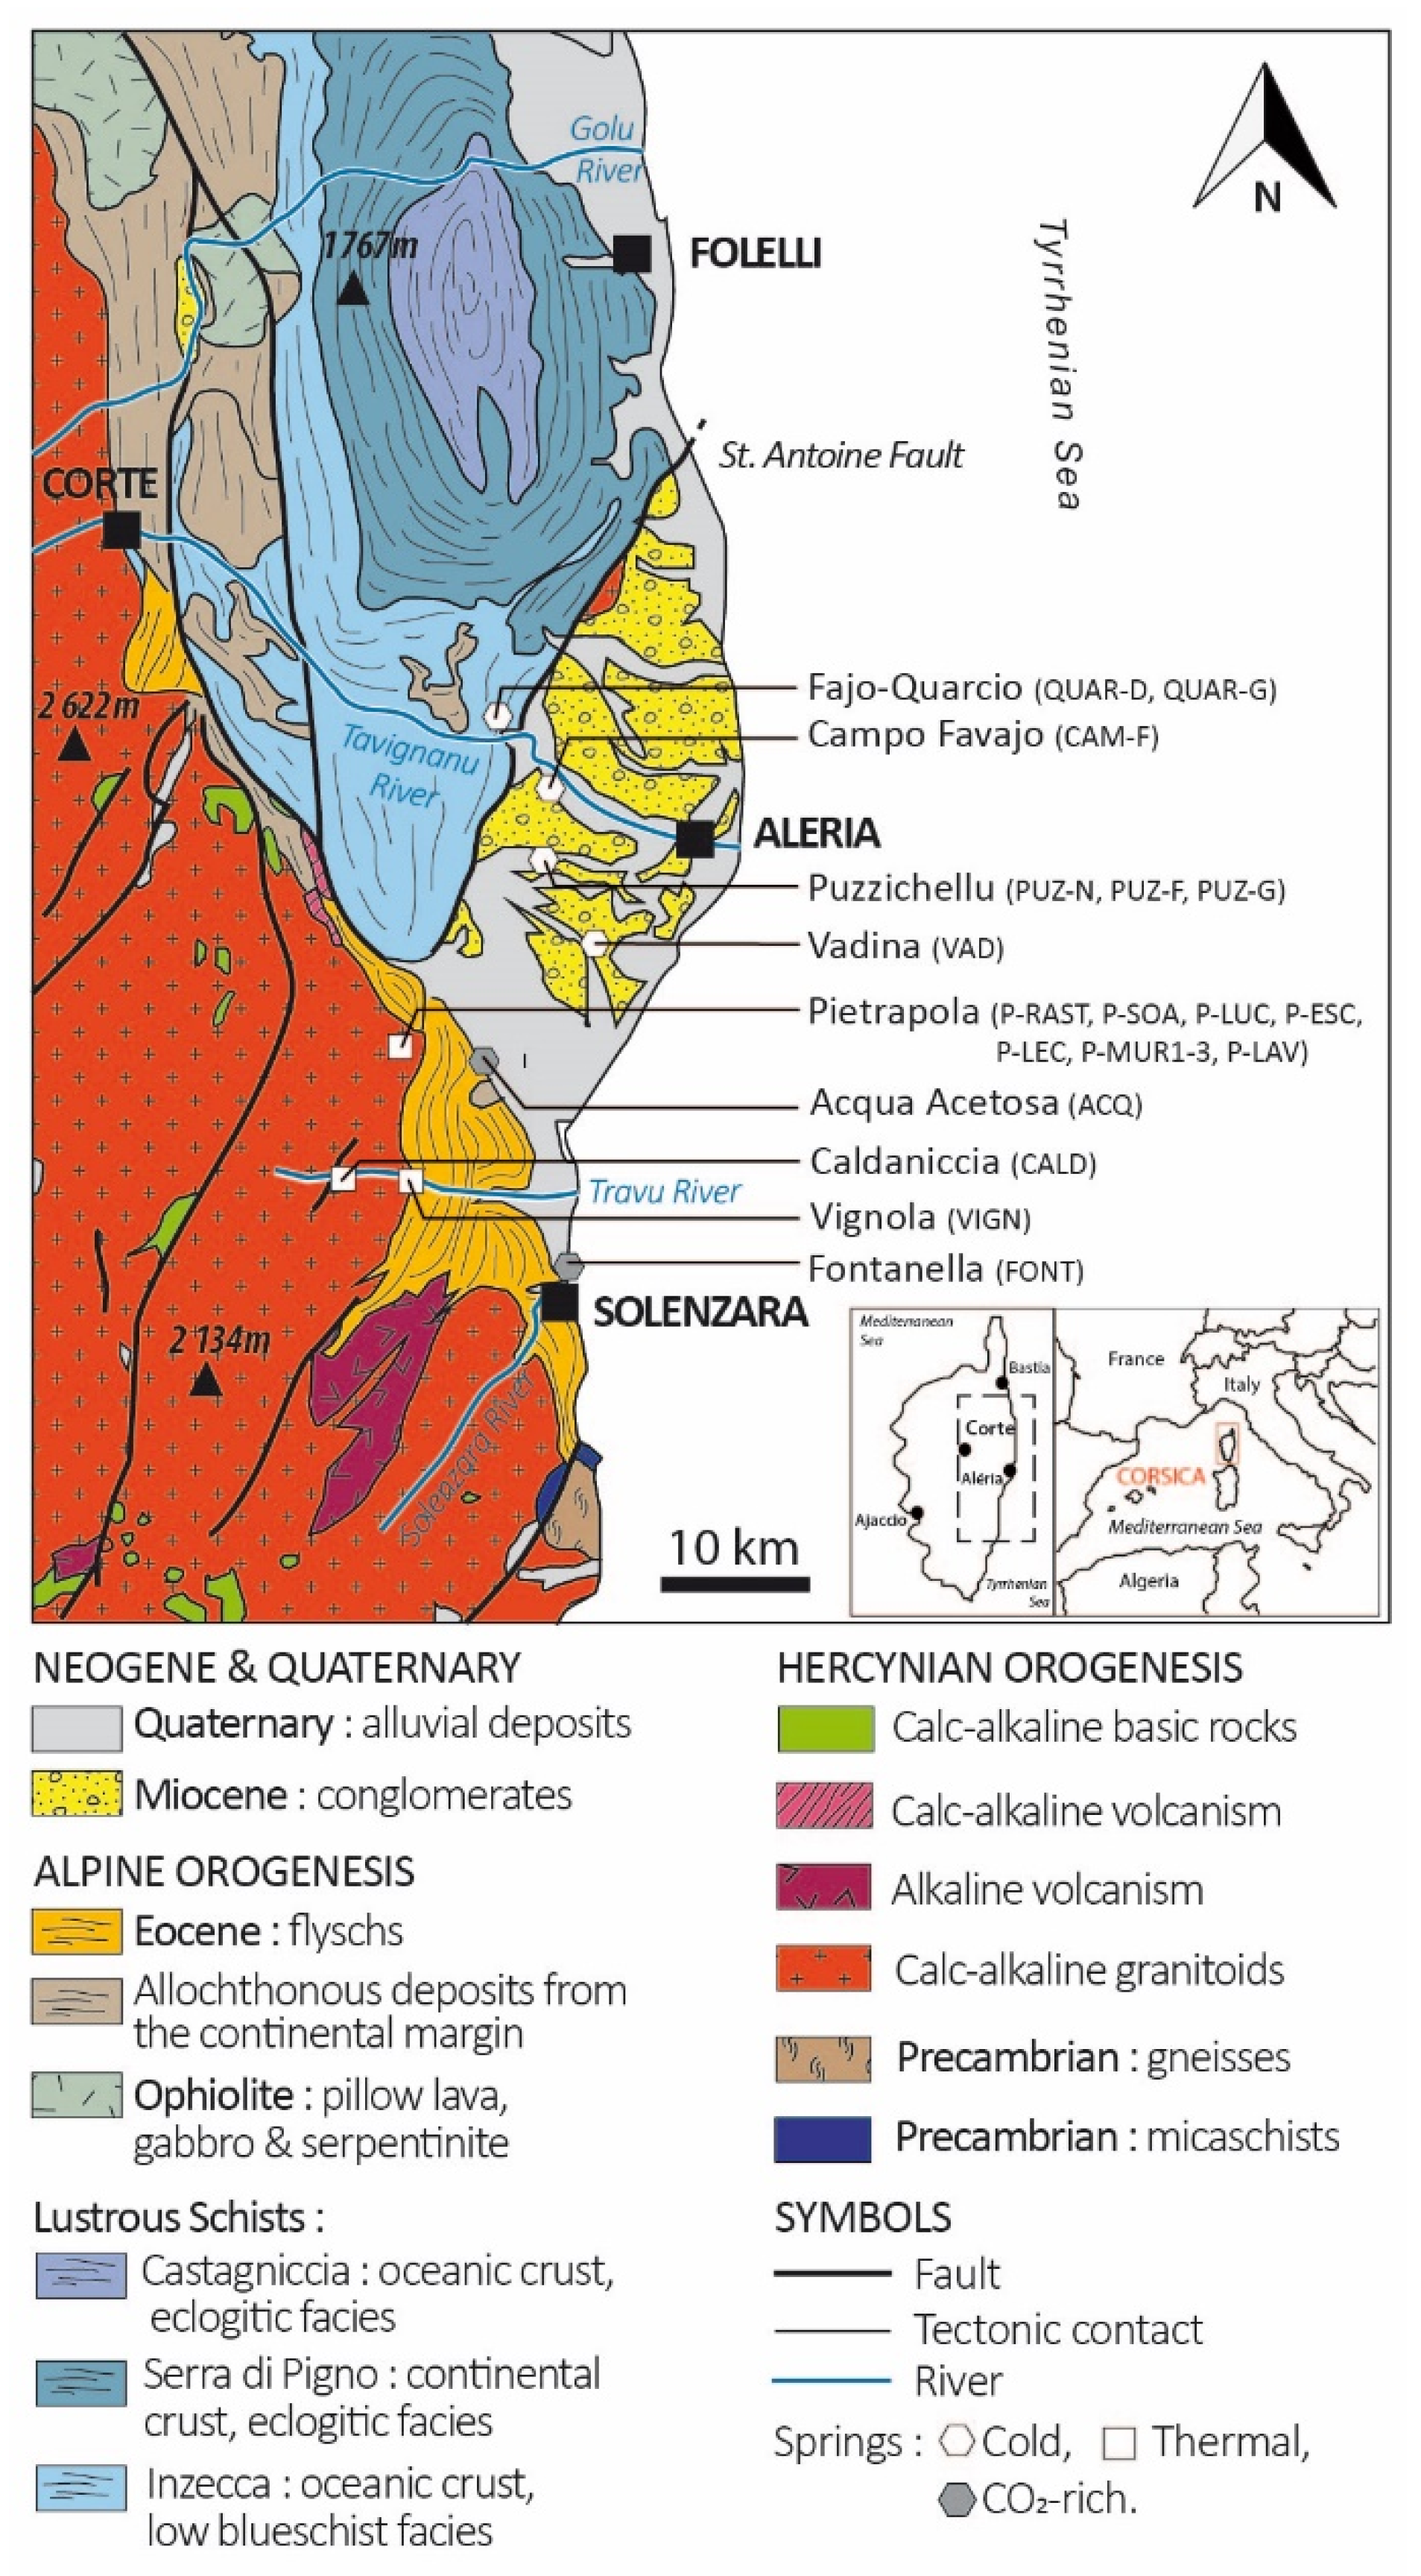
2.1. Localisation, Topography and Hydroclimatology
2.2. Geological and Hydrogeological Settings
- The Hercynian basement is mainly composed by biotite-rich monzogranite, tonalogranodiorite or monzogranodiorite [17,26]. Monzogranite, mainly located around Pietrapola (Figure 1), is composed by alkaline quartz [SiO2] (≈20%), alkaline feldspar [Na, K] (≈50%) and plagioclase [Na, Ca] (≈30%). Tonalogranodiorite and monzogranodiorite, mainly located in the Travu Valley (Figure 1), are, respectively, composed of quartz [SiO2] (24.4–32.6%), plagioclase [Na, Ca] (52.6–38.2%), alkaline feldspar [Na, K] (7.2–19.7%), biotite [K, Mg, Fe, F] (11.6–7.5%), amphibole [Ca, Mg, Fe] (3.6–1.2%). This basement is intensively fractured and shows many faults NE–SW oriented [17]. Only few hydrogeological studies describe very basic information on the different groundwater types and hydrogeological characteristics of this unit. Deep fractures and discontinuities associated to the superficial weathered levels are favourable to the groundwater storage and flow [16,26,27,28,29,30].
- The Alpine metamorphic units are composed of allochthonous material derived from the exhumation of oceanic and continental tectonic units involved in the Alpine orogeny (from the Late Cretaceous to the late Eocene, e.g., [21]). These tectonic units include meta-granitoid, metasedimentary rocks as serpentinites, meta-gabbros and meta-basalt. Lustrous schists observed were affected by a wide range of metamorphism-induced deformations going from blueschist facies (mainly Inzecca series), eclogite facies (mainly Serra di Pigno and Castagniccia series) to greenschist facies [18,21,31,32,33]. This geological formation, intensively pleated, is characterised by a lot of discontinuities displaying NS orientation of schistosity in the eastern part of the study site. The hydrogeological favourable zone is located in shallow-eroded parts or through deeper structural discontinuities.
- The Eocene detrital sedimentary flysch is an autochthonous unit structured as a vertical alternation of conglomerates, sandstones and clay, mainly composed by arkose (formed by quartz [SiO2] (up to 60%), feldspar [Na, K, Ca] (less than 20%), micas (up to 20%)) and pelites rocks. In its western part, this formation rubs along with the Hercynian basement according to the NE–SW contact and is overlapped by sedimentary deposits on the eastern part [16,34]. This heterogeneous geological unit has a low aquifer potential [18].
- The Neogene sedimentary units are very heterogeneous and constituted by lateral deposits of organic matter-rich marls, sandstone and rhyolite conglomerates. Called the “Aghione formation” (Burdigalian and Langhien) these sand-conglomerate sediments are covered by black marls (Miocene) [18]. Locally, these sediments are also composed of limestone and bioclastic sandstone (Tortonian). Due to basin subsidence, Neogene lithology deposits dip to the east and have an approximate thickness of 2 km at the coastline and can reach 8.5 km in the middle of the Corsica Channel. Covered by Quaternary alluvial deposits (Figure 1). Neogene sediments host few shallow local aquifers with very low productivity. However, the thickness of the detrital Miocene layer is in favour of a real hydrogeological potential as a deep multi-layer confined aquifer [19,20].
2.3. Thermal and Mineral Waters in Corsica: Historical Background
3. Methods
3.1. Sampling Network
- 8 springs of the Pietrapola group: P-SOA, P-MUR1, P-MUR3, P-LAV, P-LUC, P-RAST, P-ESC, P-LEC;
- 3 springs of the Puzzichellu group: PUZ-N, PUZ-F, PUZ-G, including the near-by Campo-Favajo site (CAM-F) and the “Fajo-Quarcio” site labelled: QUAR-G, QUAR-D;
- The Travu River Valley with a Vignola single spring (VIGN) and Caldaniccia single spring (CALD);
- 2 single isolated CO2-rich springs of Acqua Acetosa (ACQ) and Fontanella (FONT);
- The single cold spring of Vadina labelled as VAD.
3.2. Groundwater Sampling and Analytical Methods
4. Results and Discussion
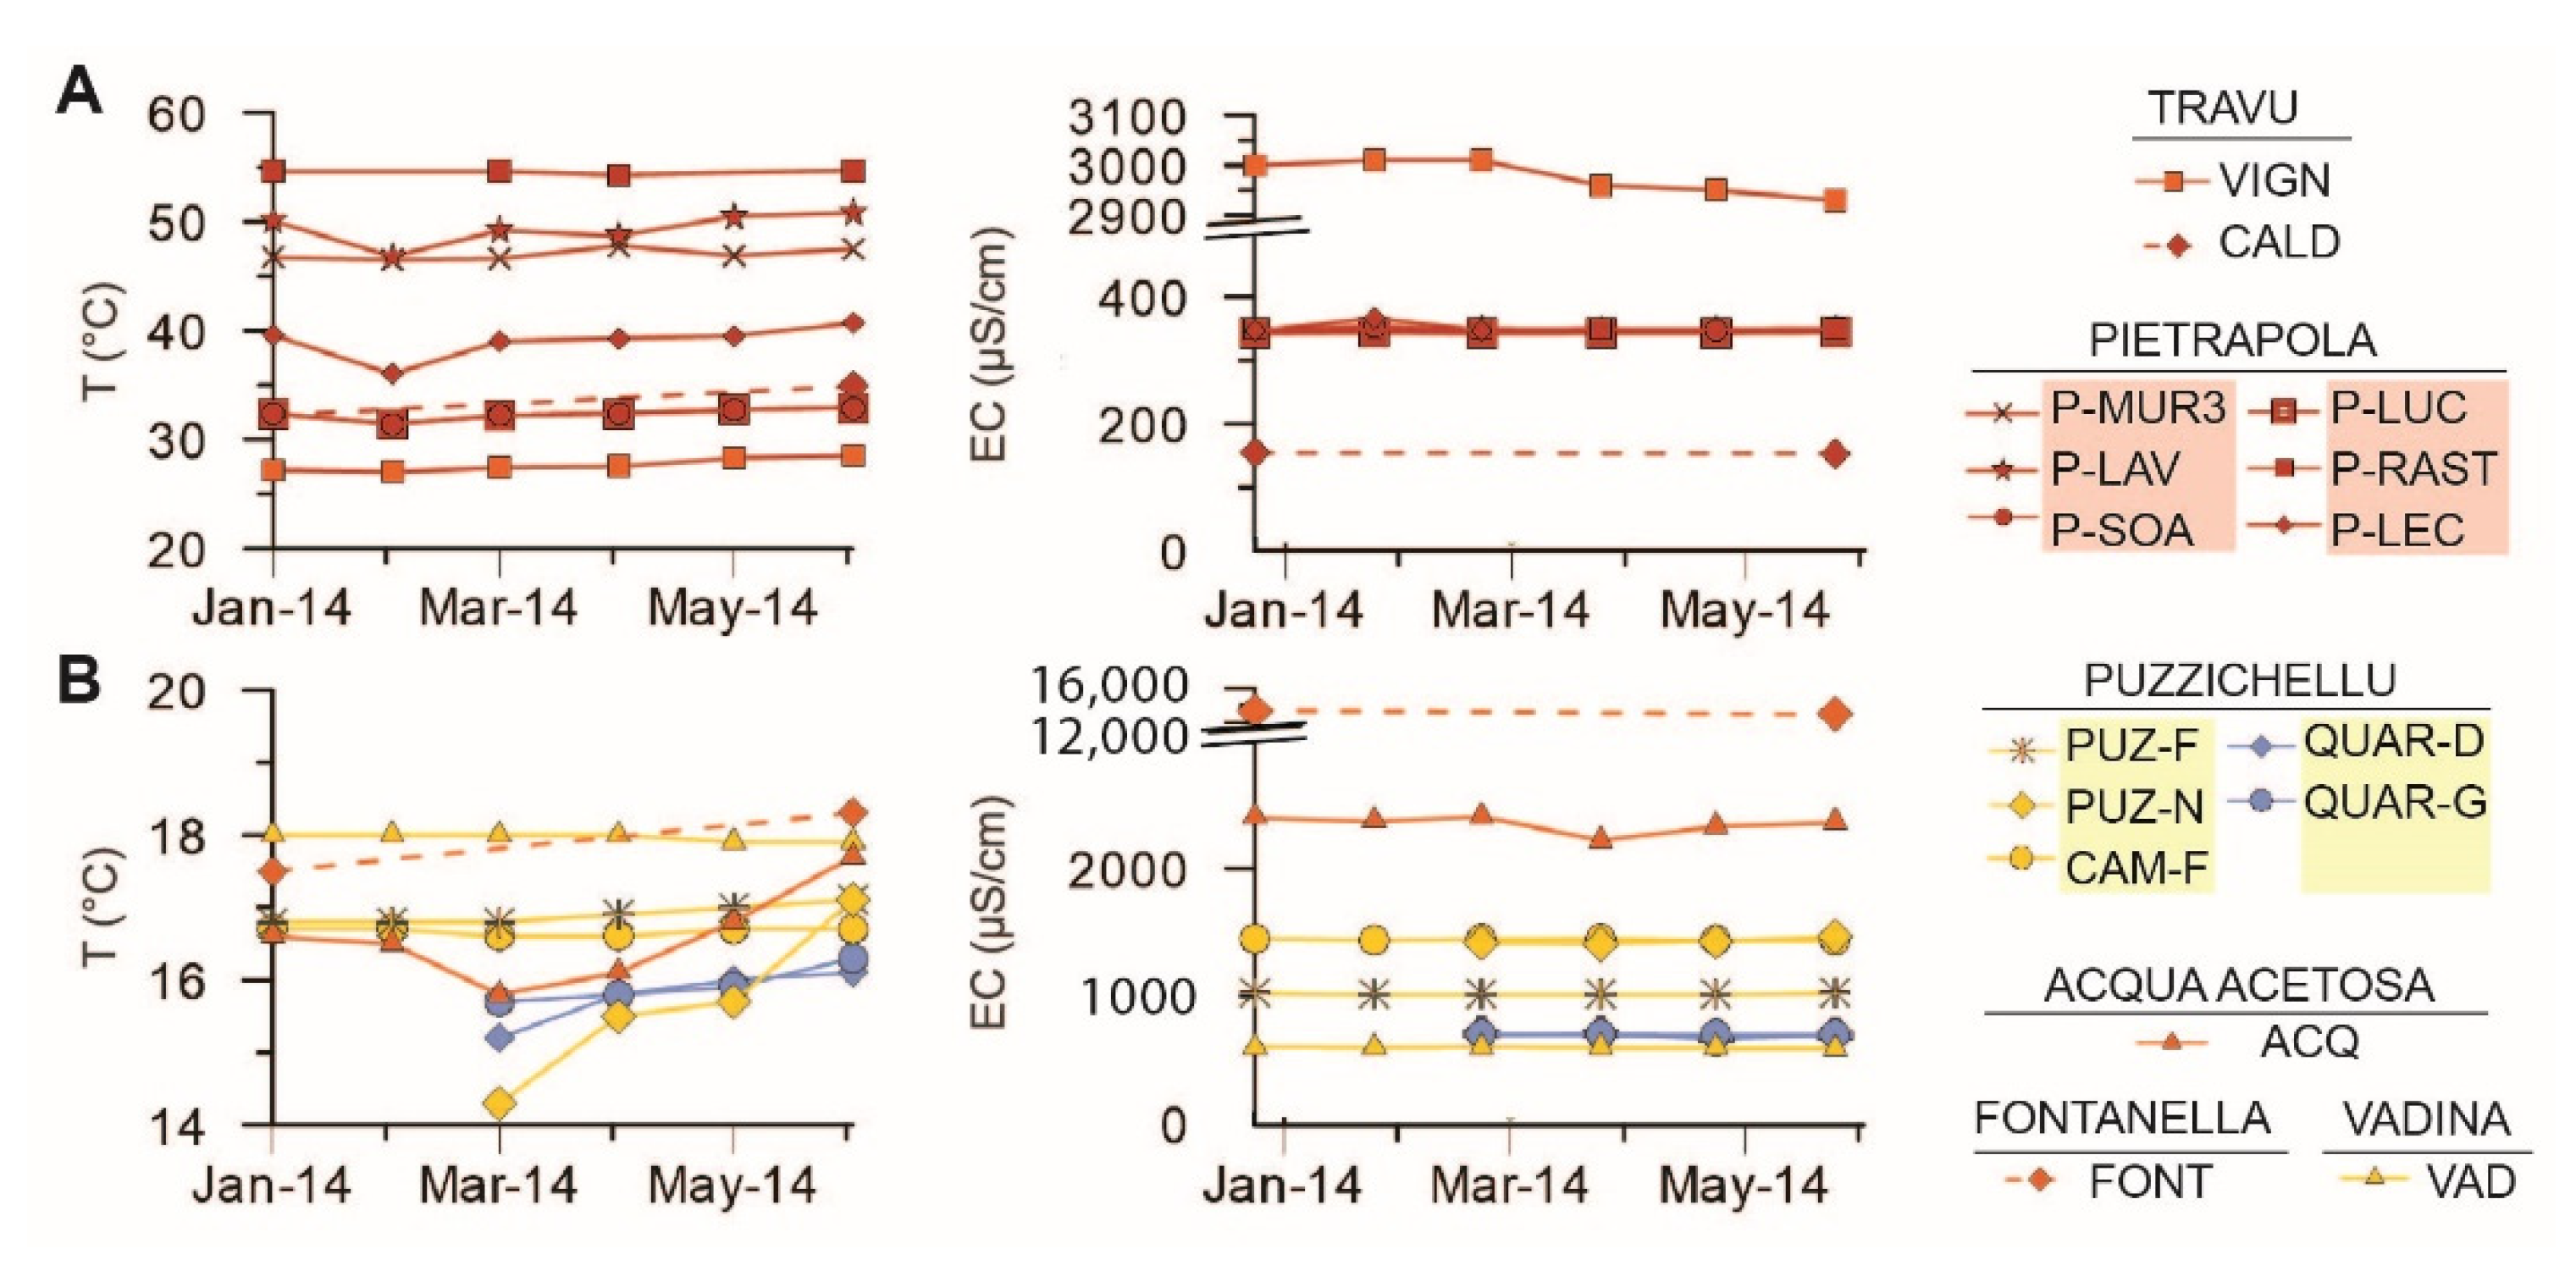
4.1. Thermal and Mineral Description
4.1.1. Physico-Chemical Parameters
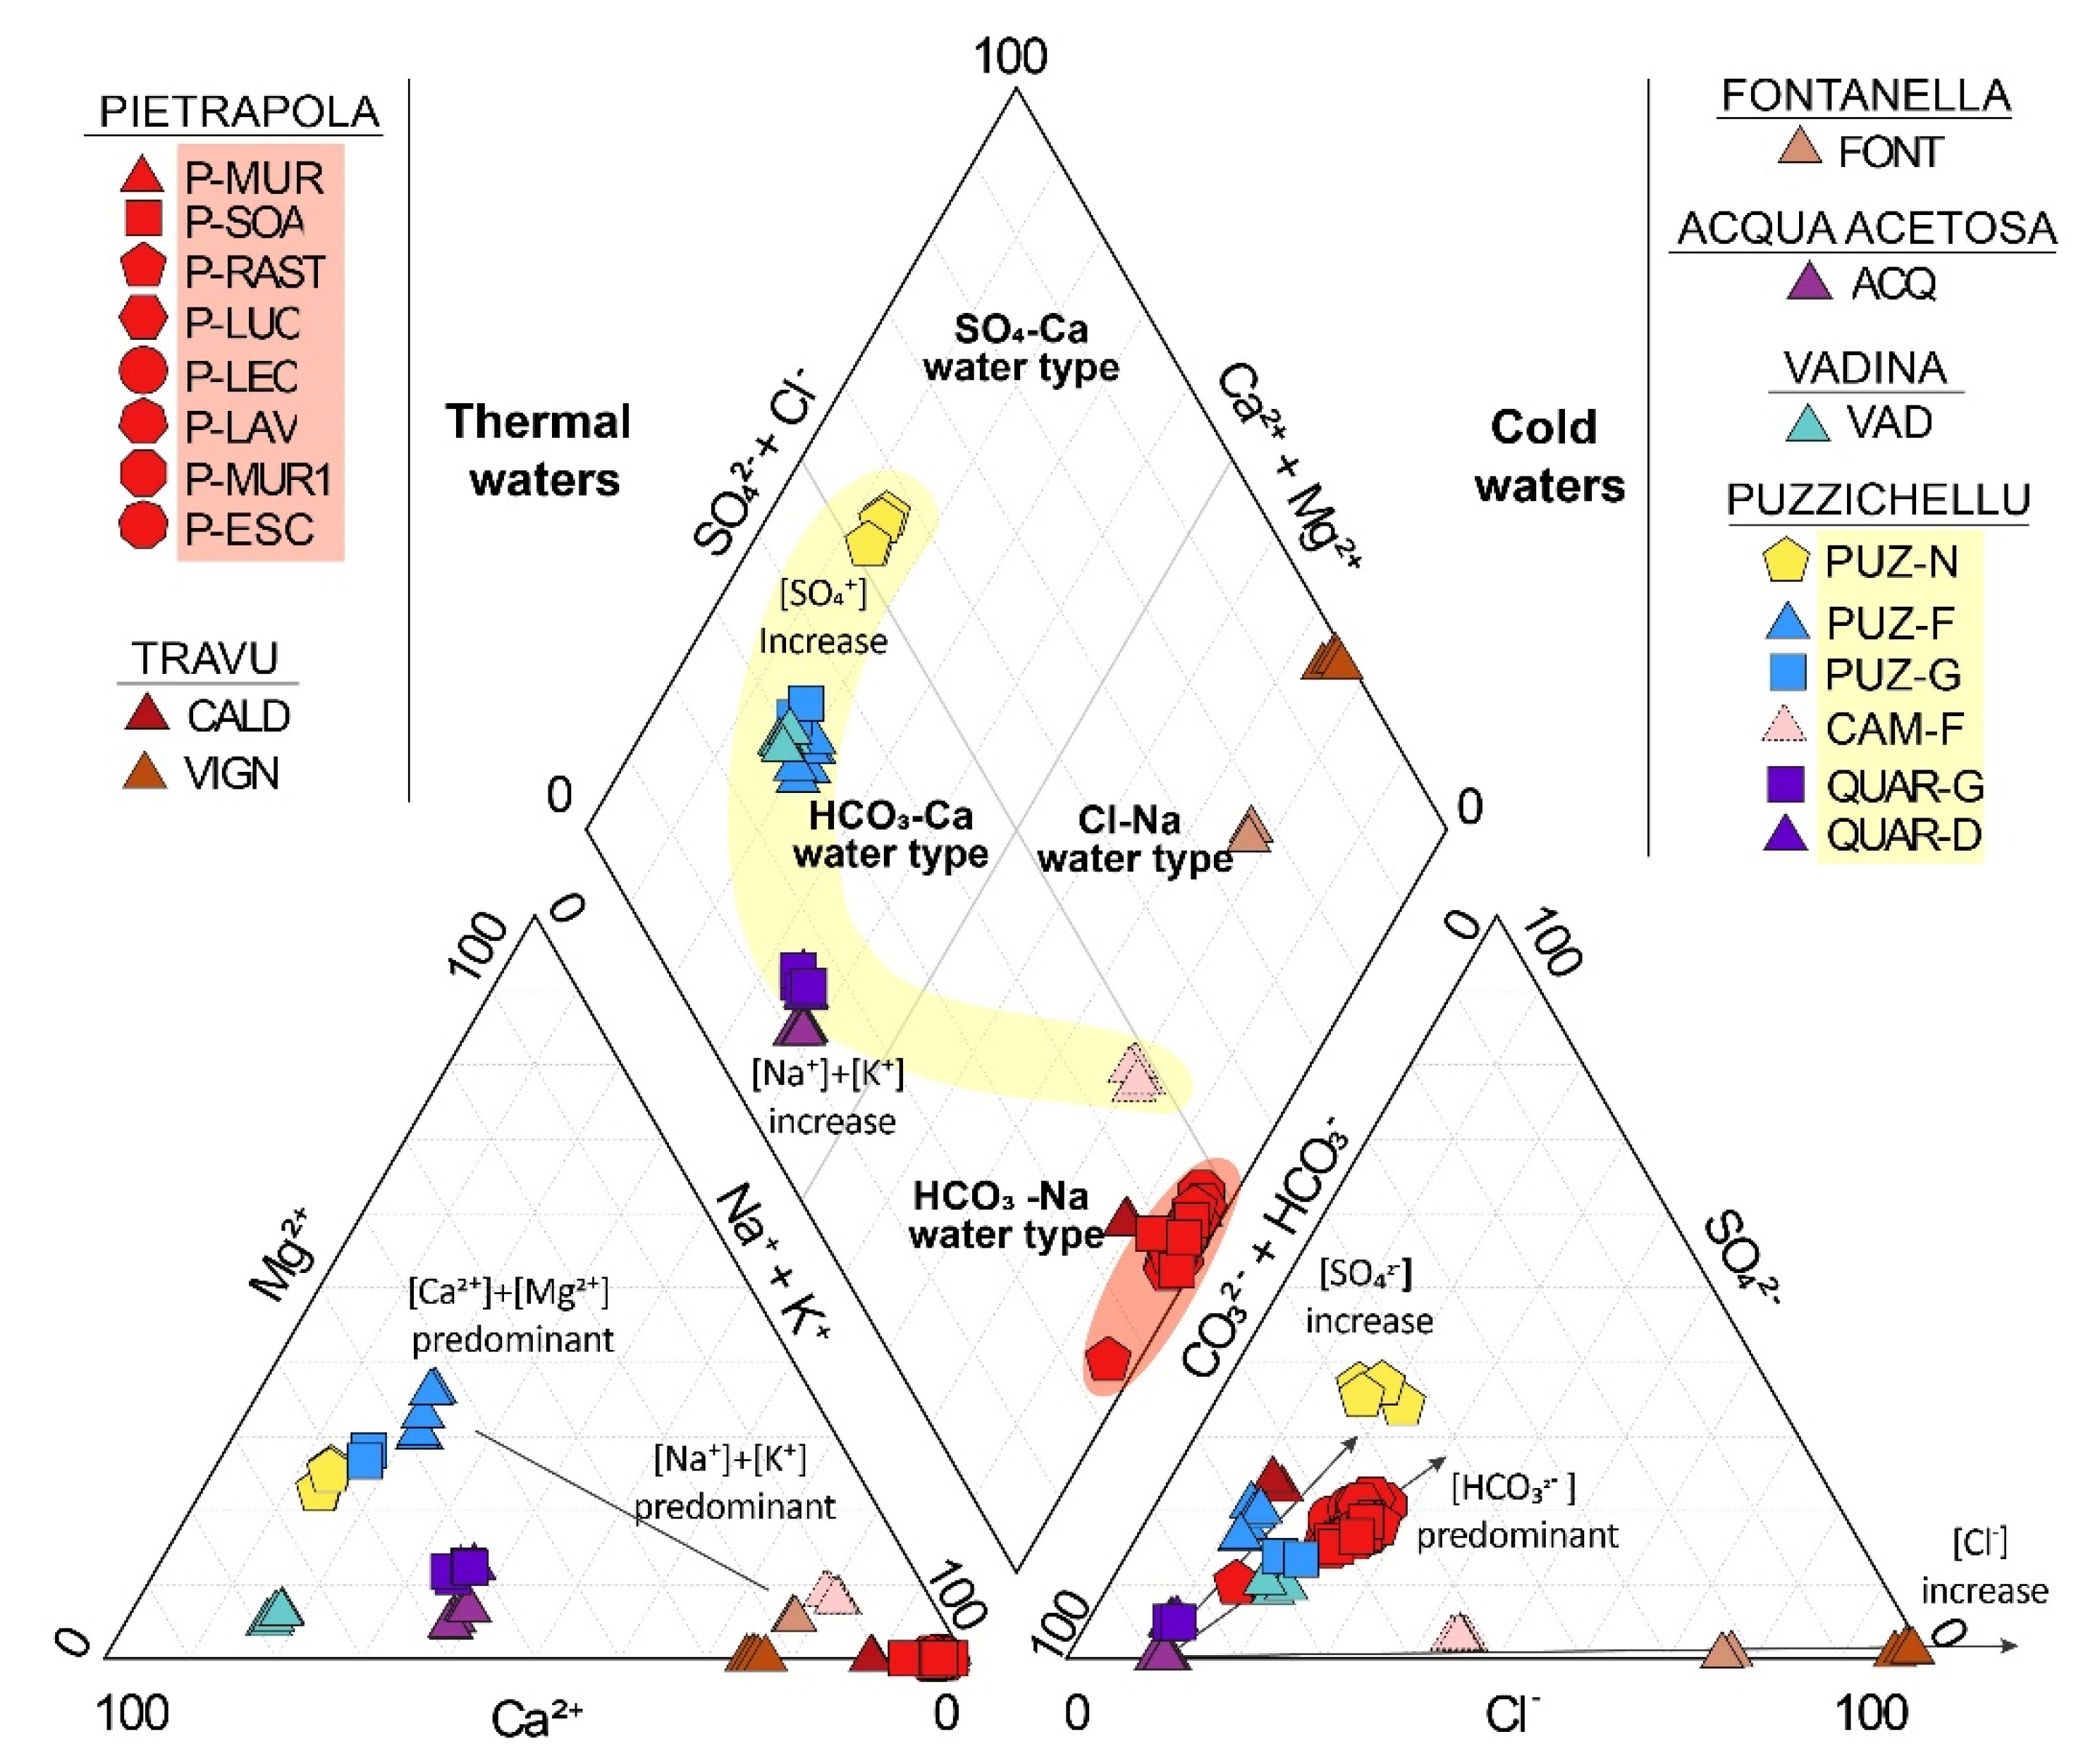
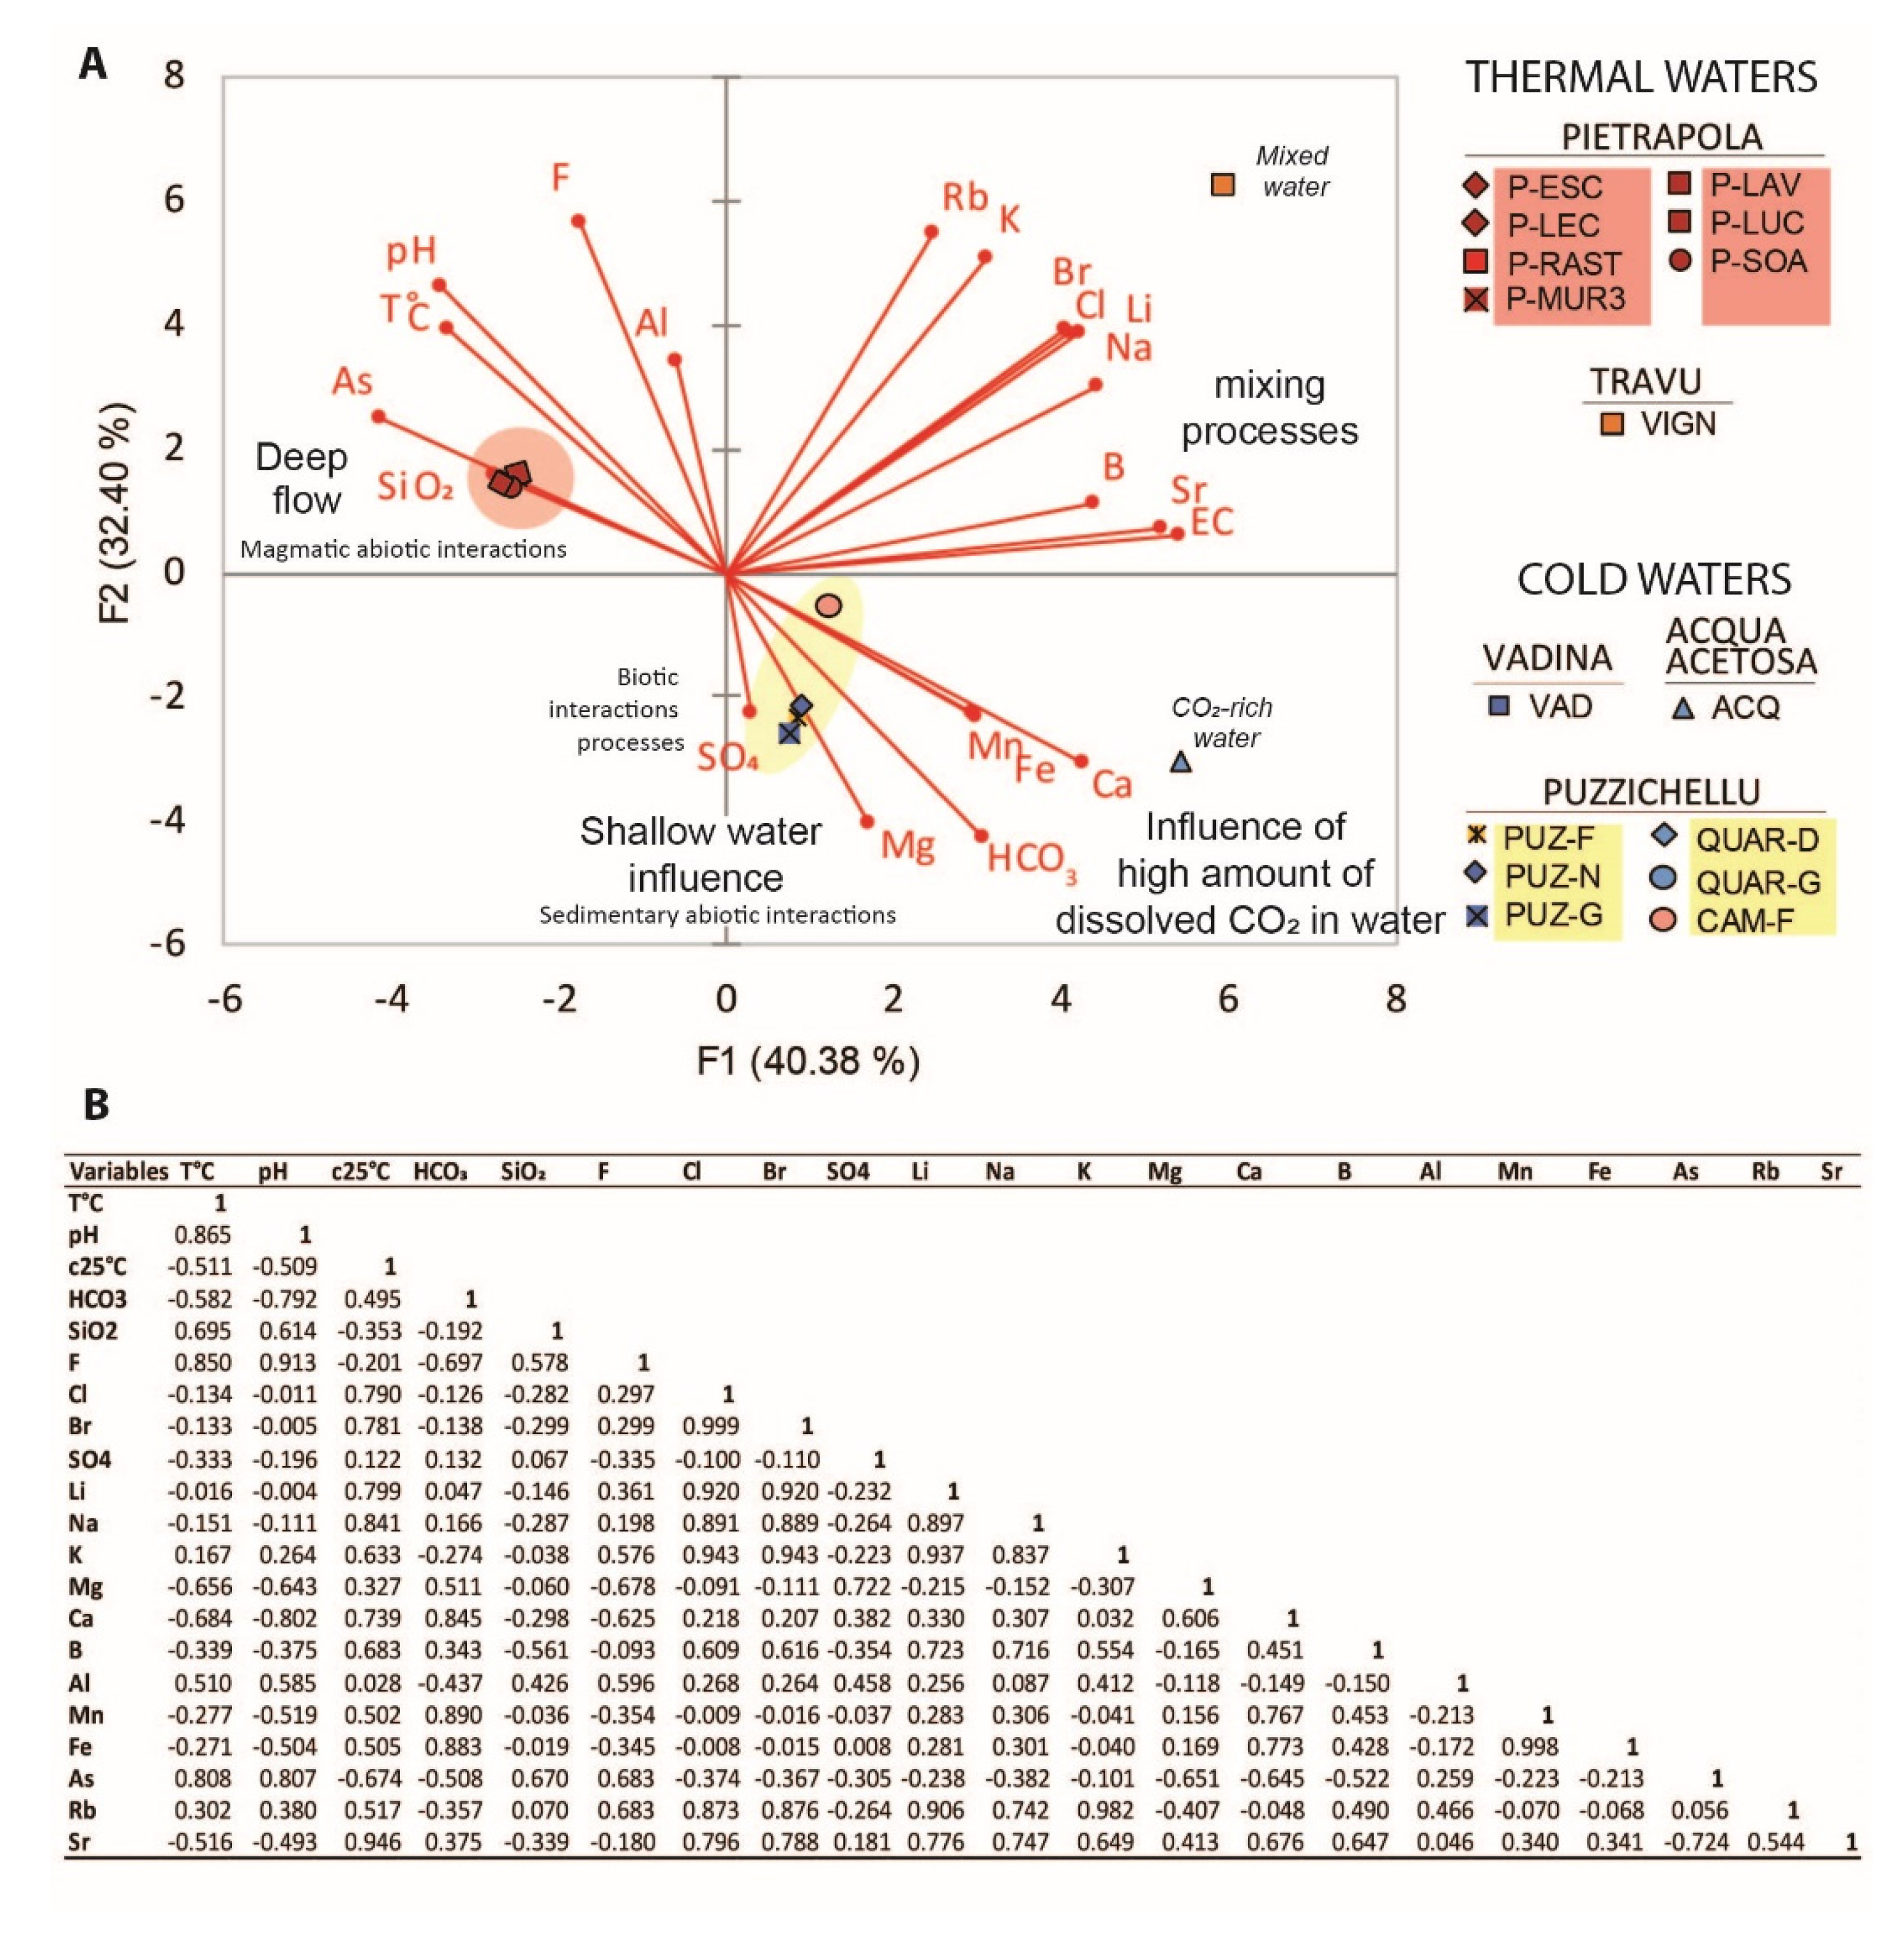
4.1.2. Diversity of Hydrochemical Water Types
4.1.3. Mixing Processes during Up-Flowing
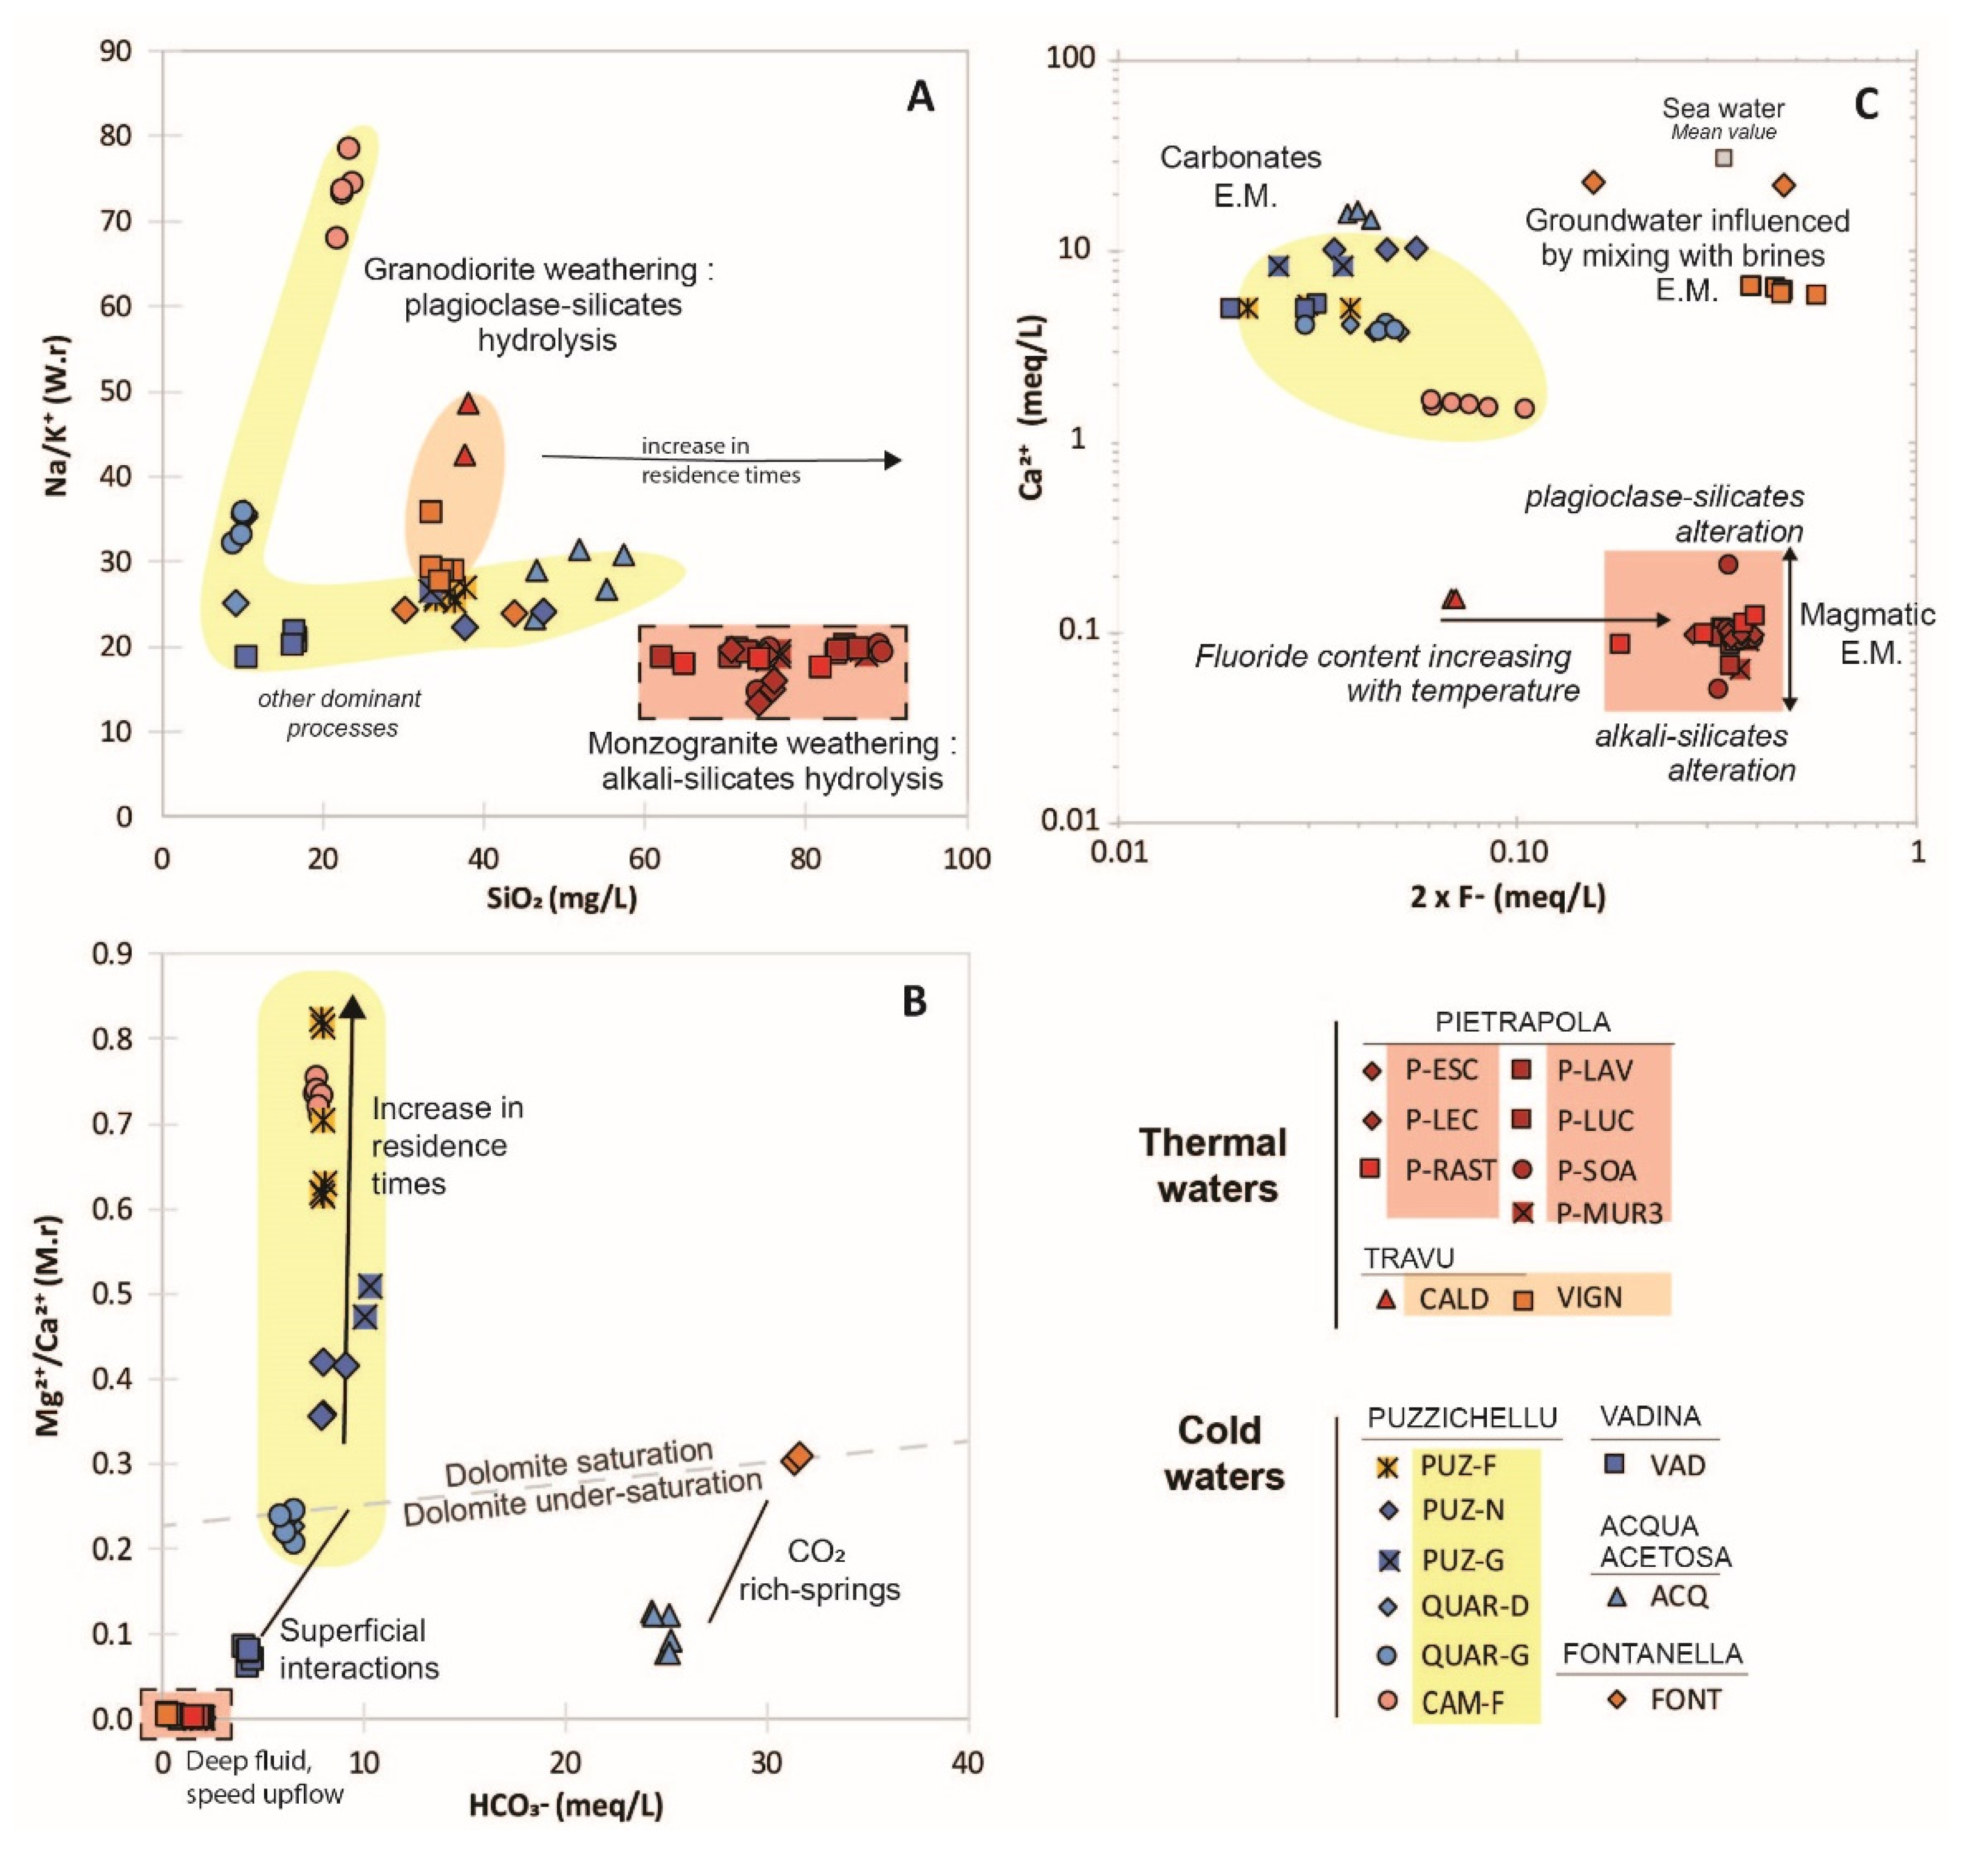
4.2. Water–Rock Interactions
4.2.1. Granitoid-Rocks Minerals Hydrolysis
4.2.2. Detrital Sedimentary Rocks Weathering
4.2.3. Evidence of Brine Waters Occurrence
4.2.4. Mixing Processes
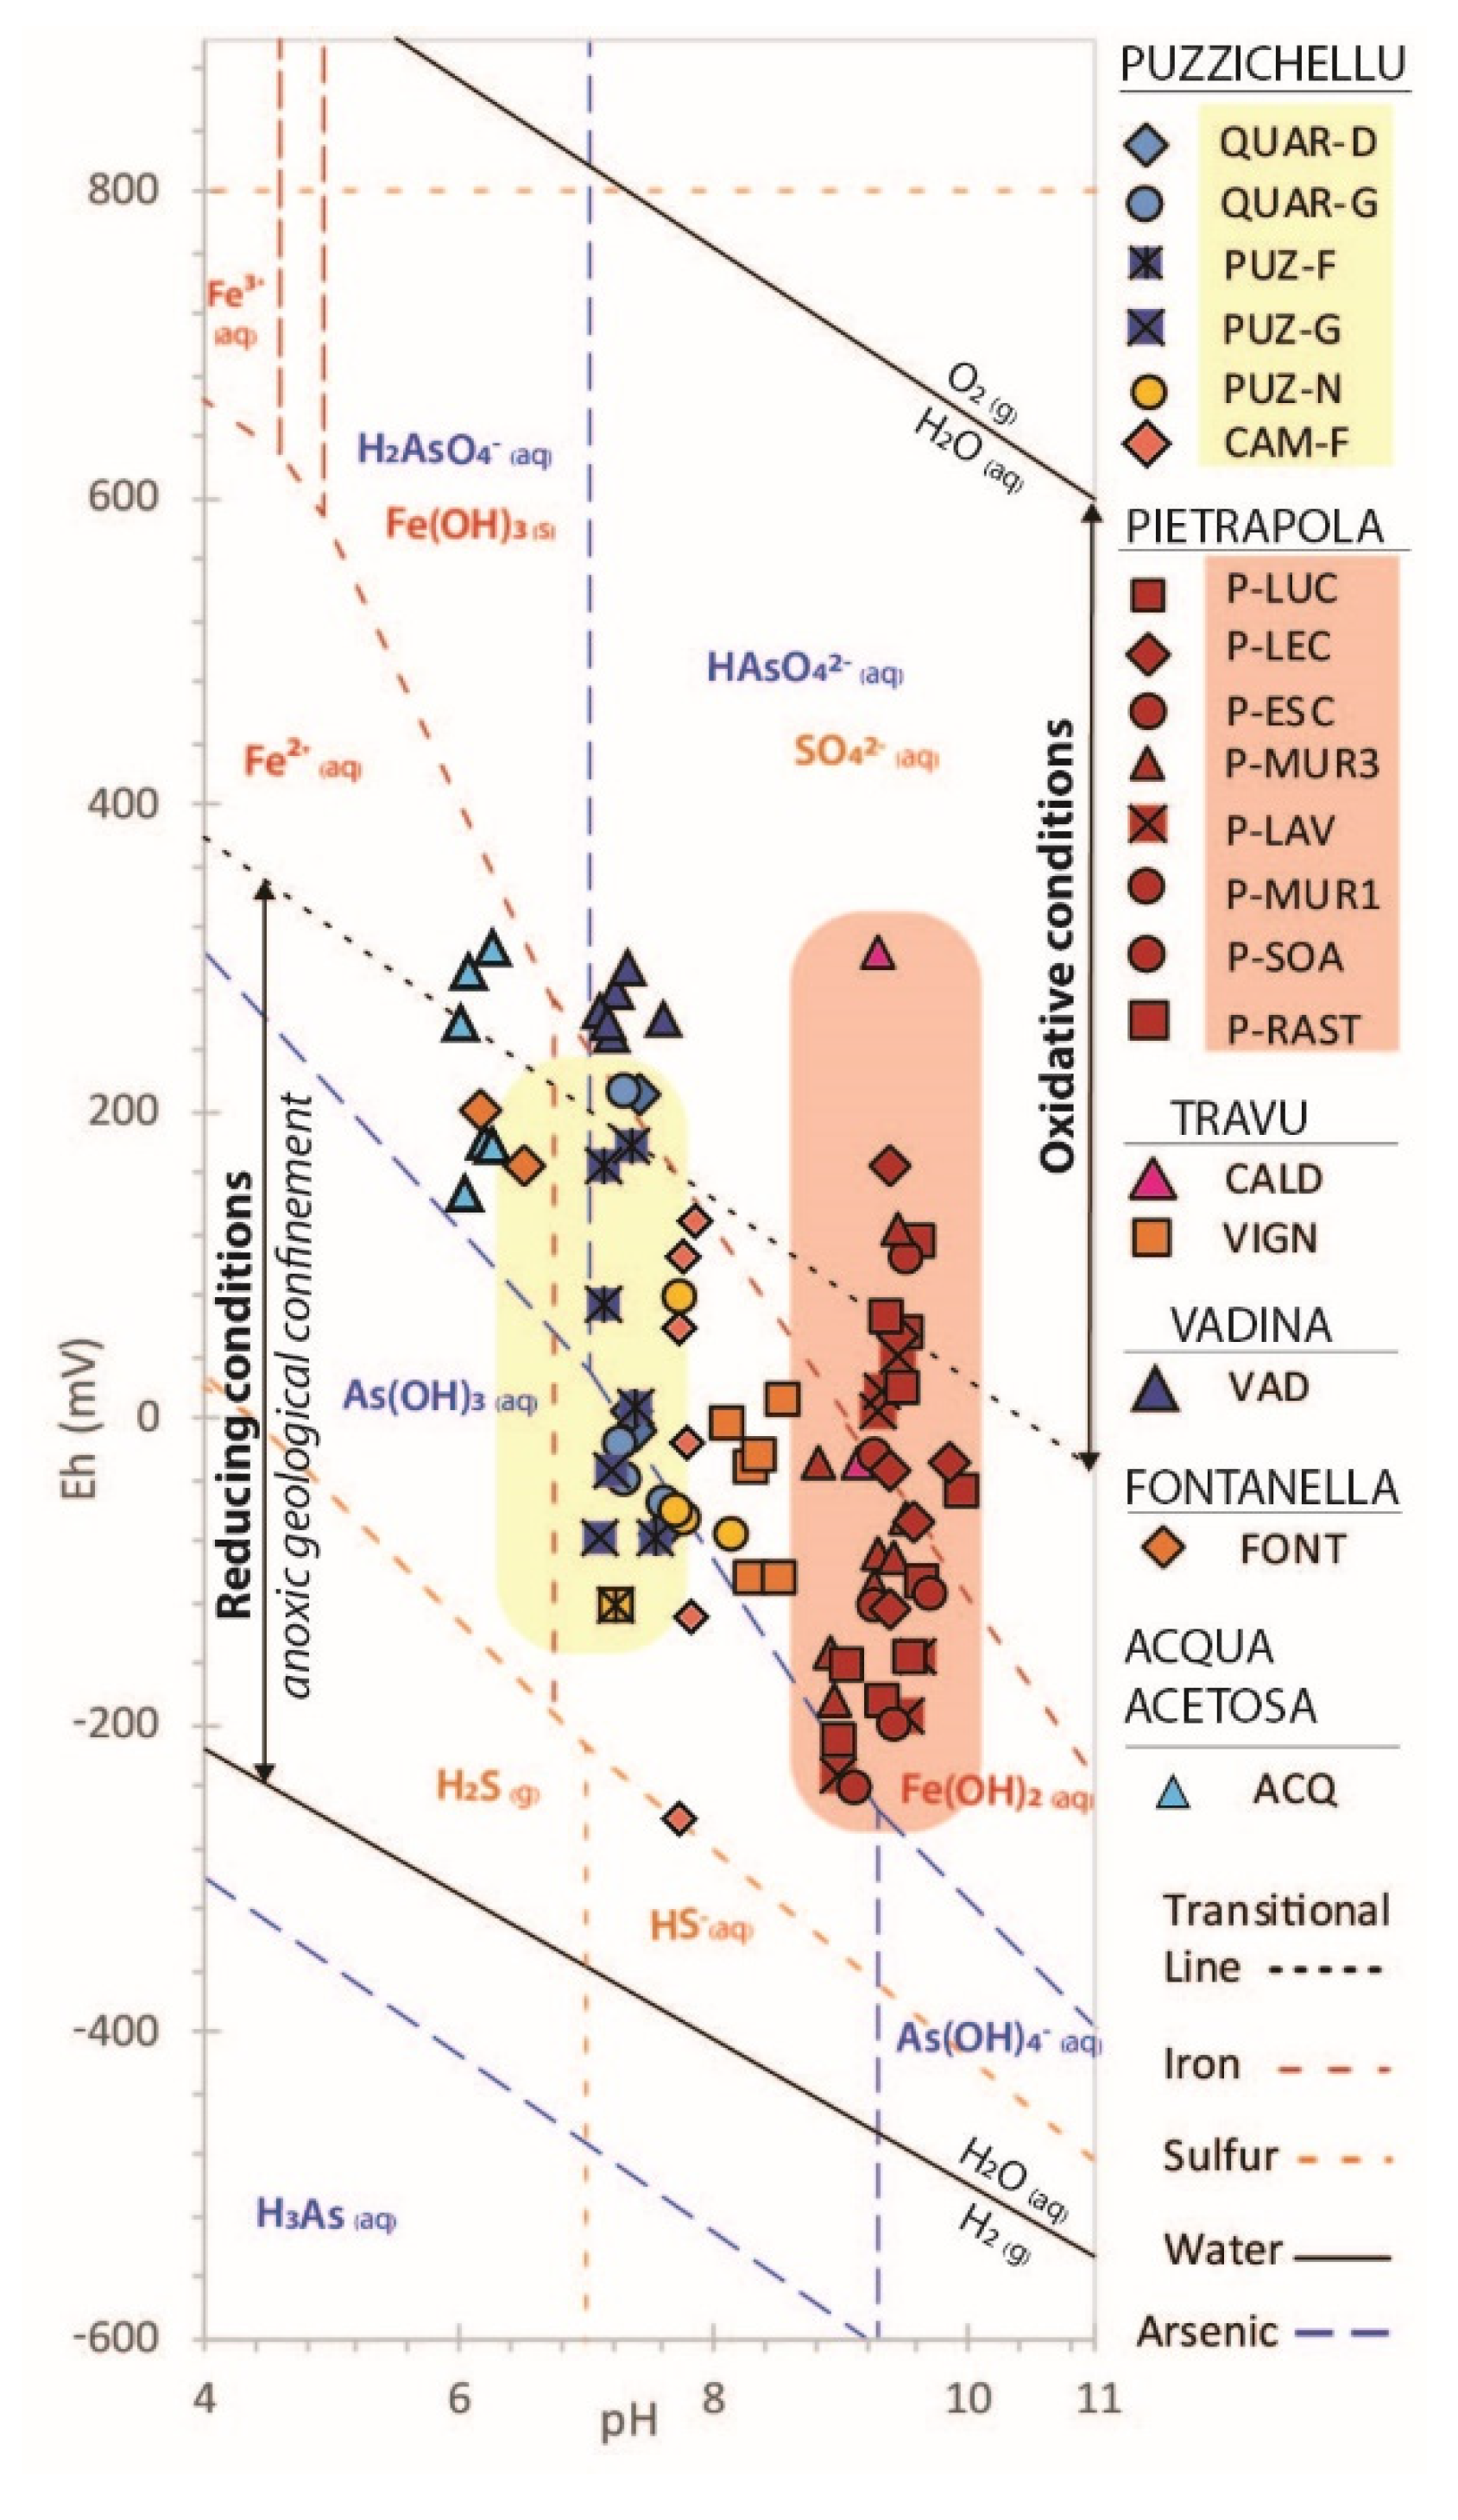
4.2.5. Elements Prevalence at Depth
4.3. Reservoir Conditions and Depth Assessment
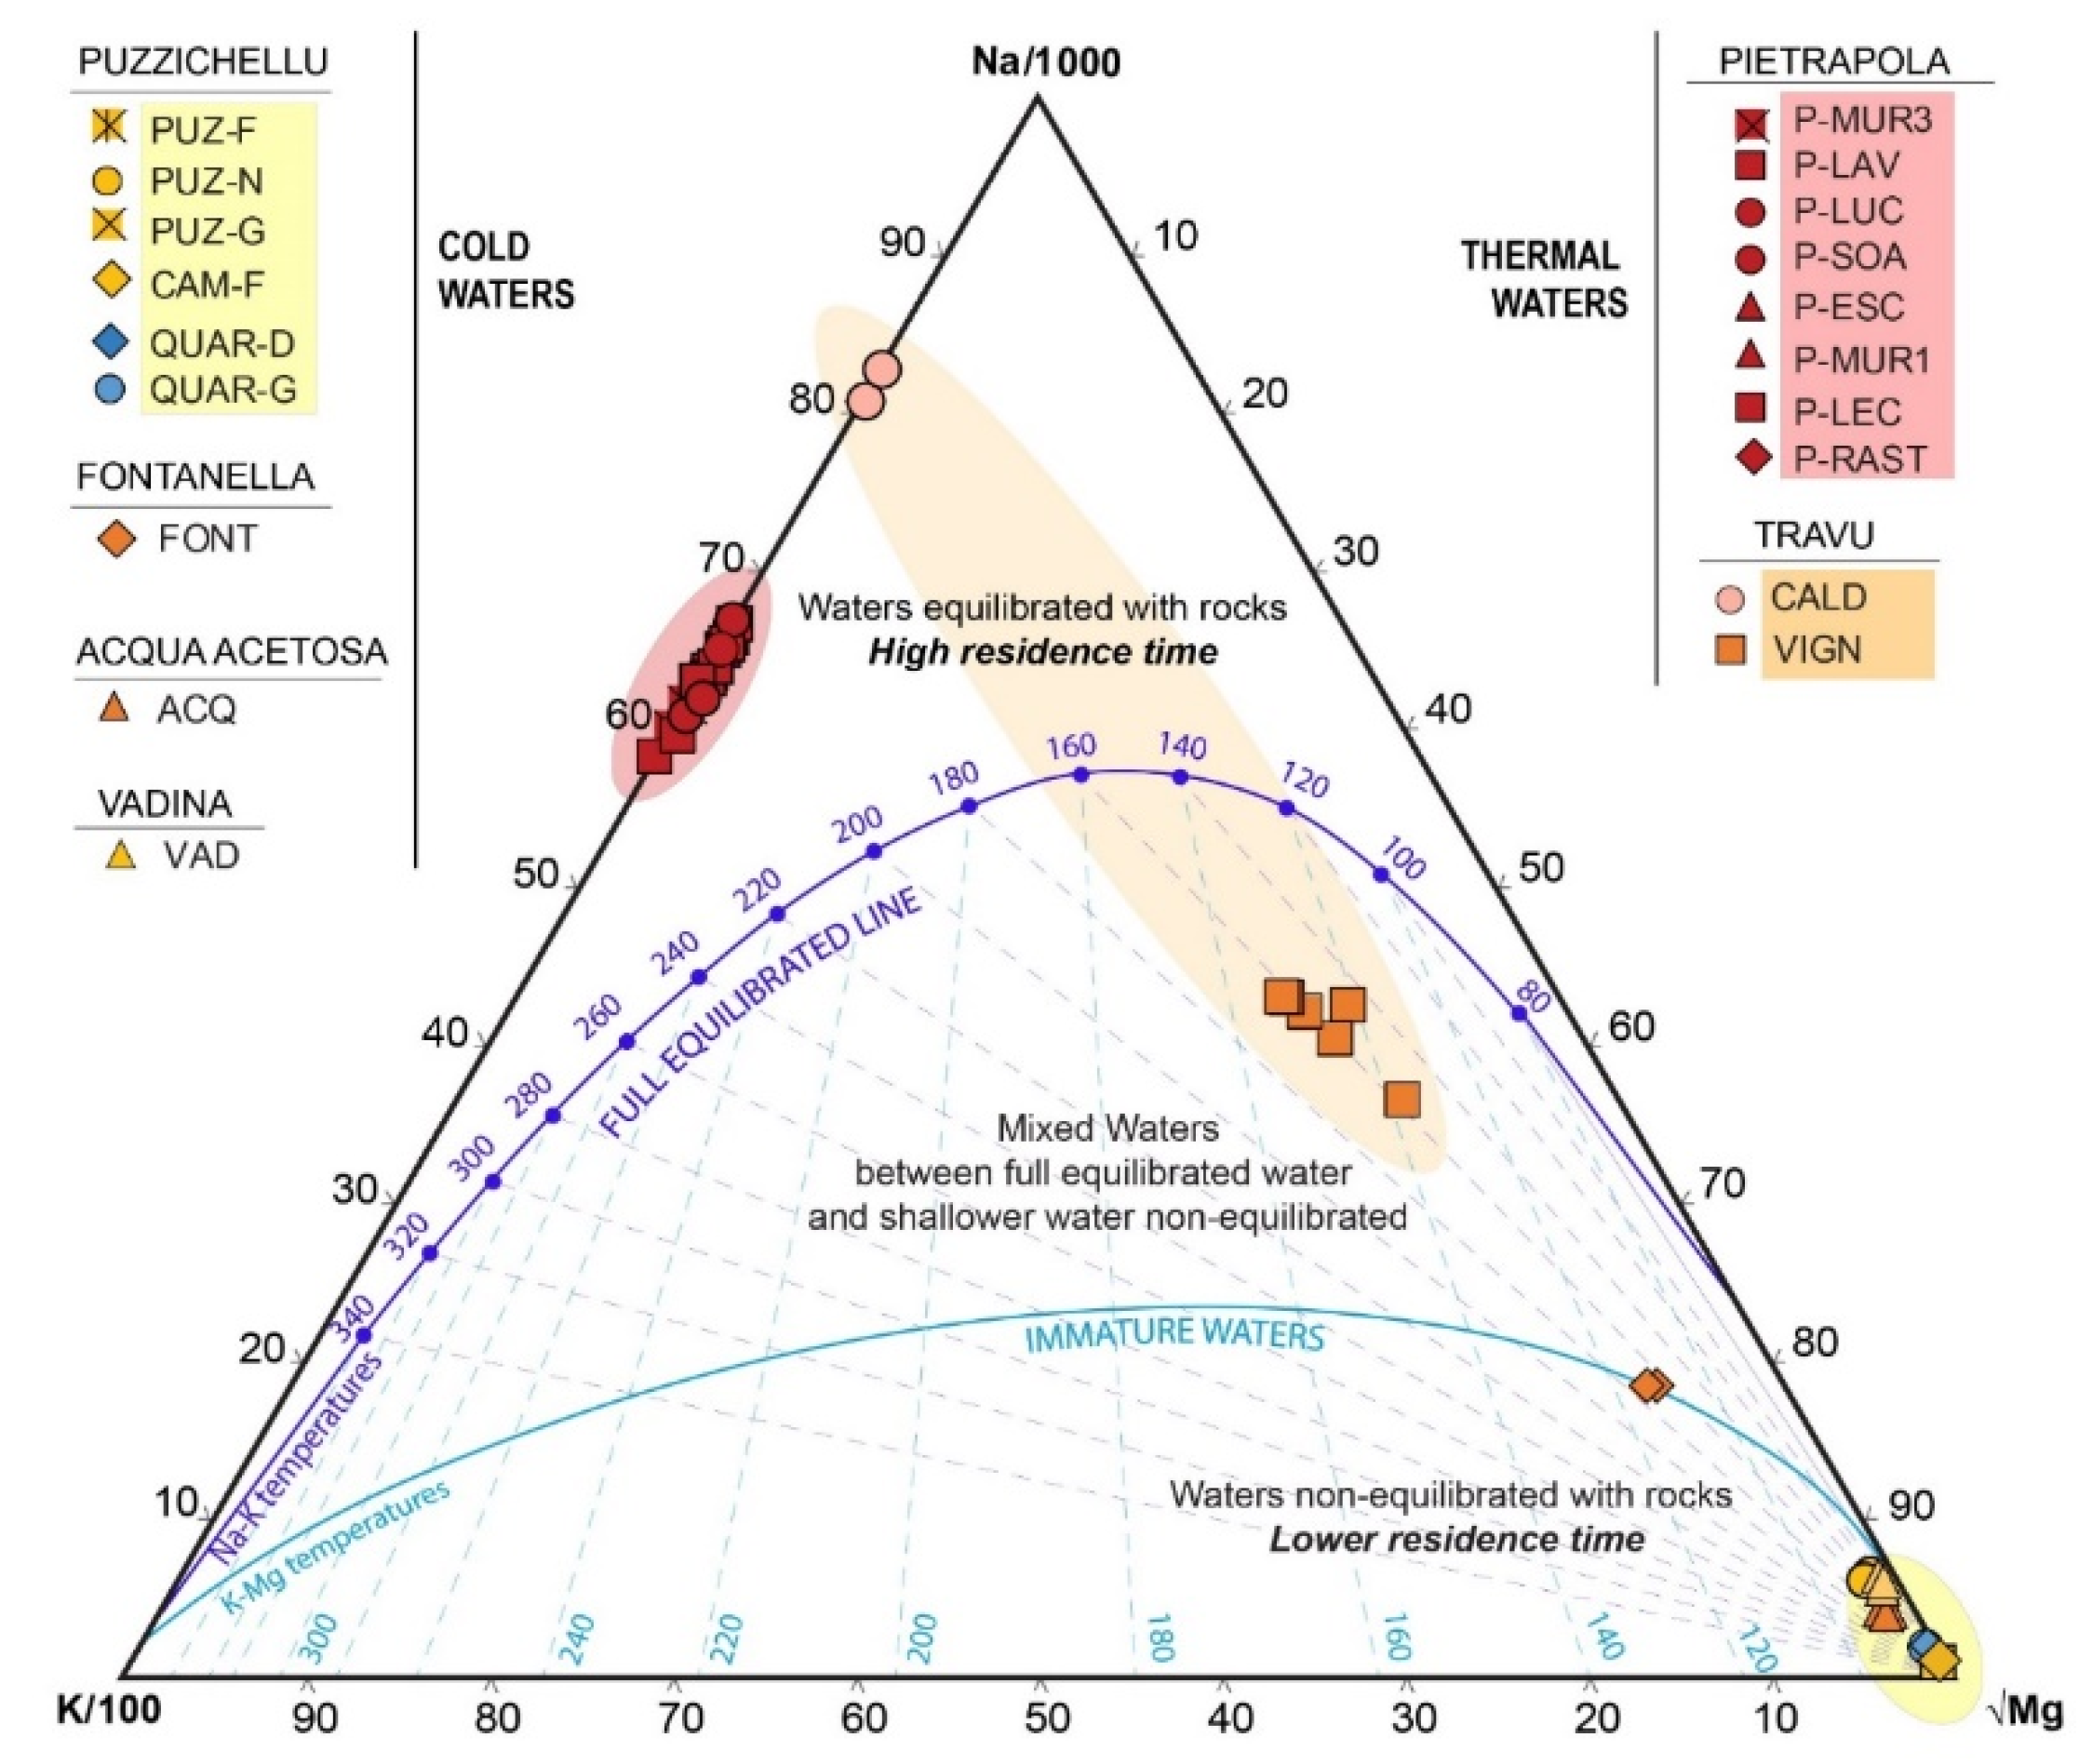
4.3.1. Water Equilibration in the Reservoir
4.3.2. Sulphur Origin and Geothermometry
Abiotic Origin of Sulphate
Biotic Origin of Sulphate
4.3.3. Reservoir Temperature and Depth Assessment
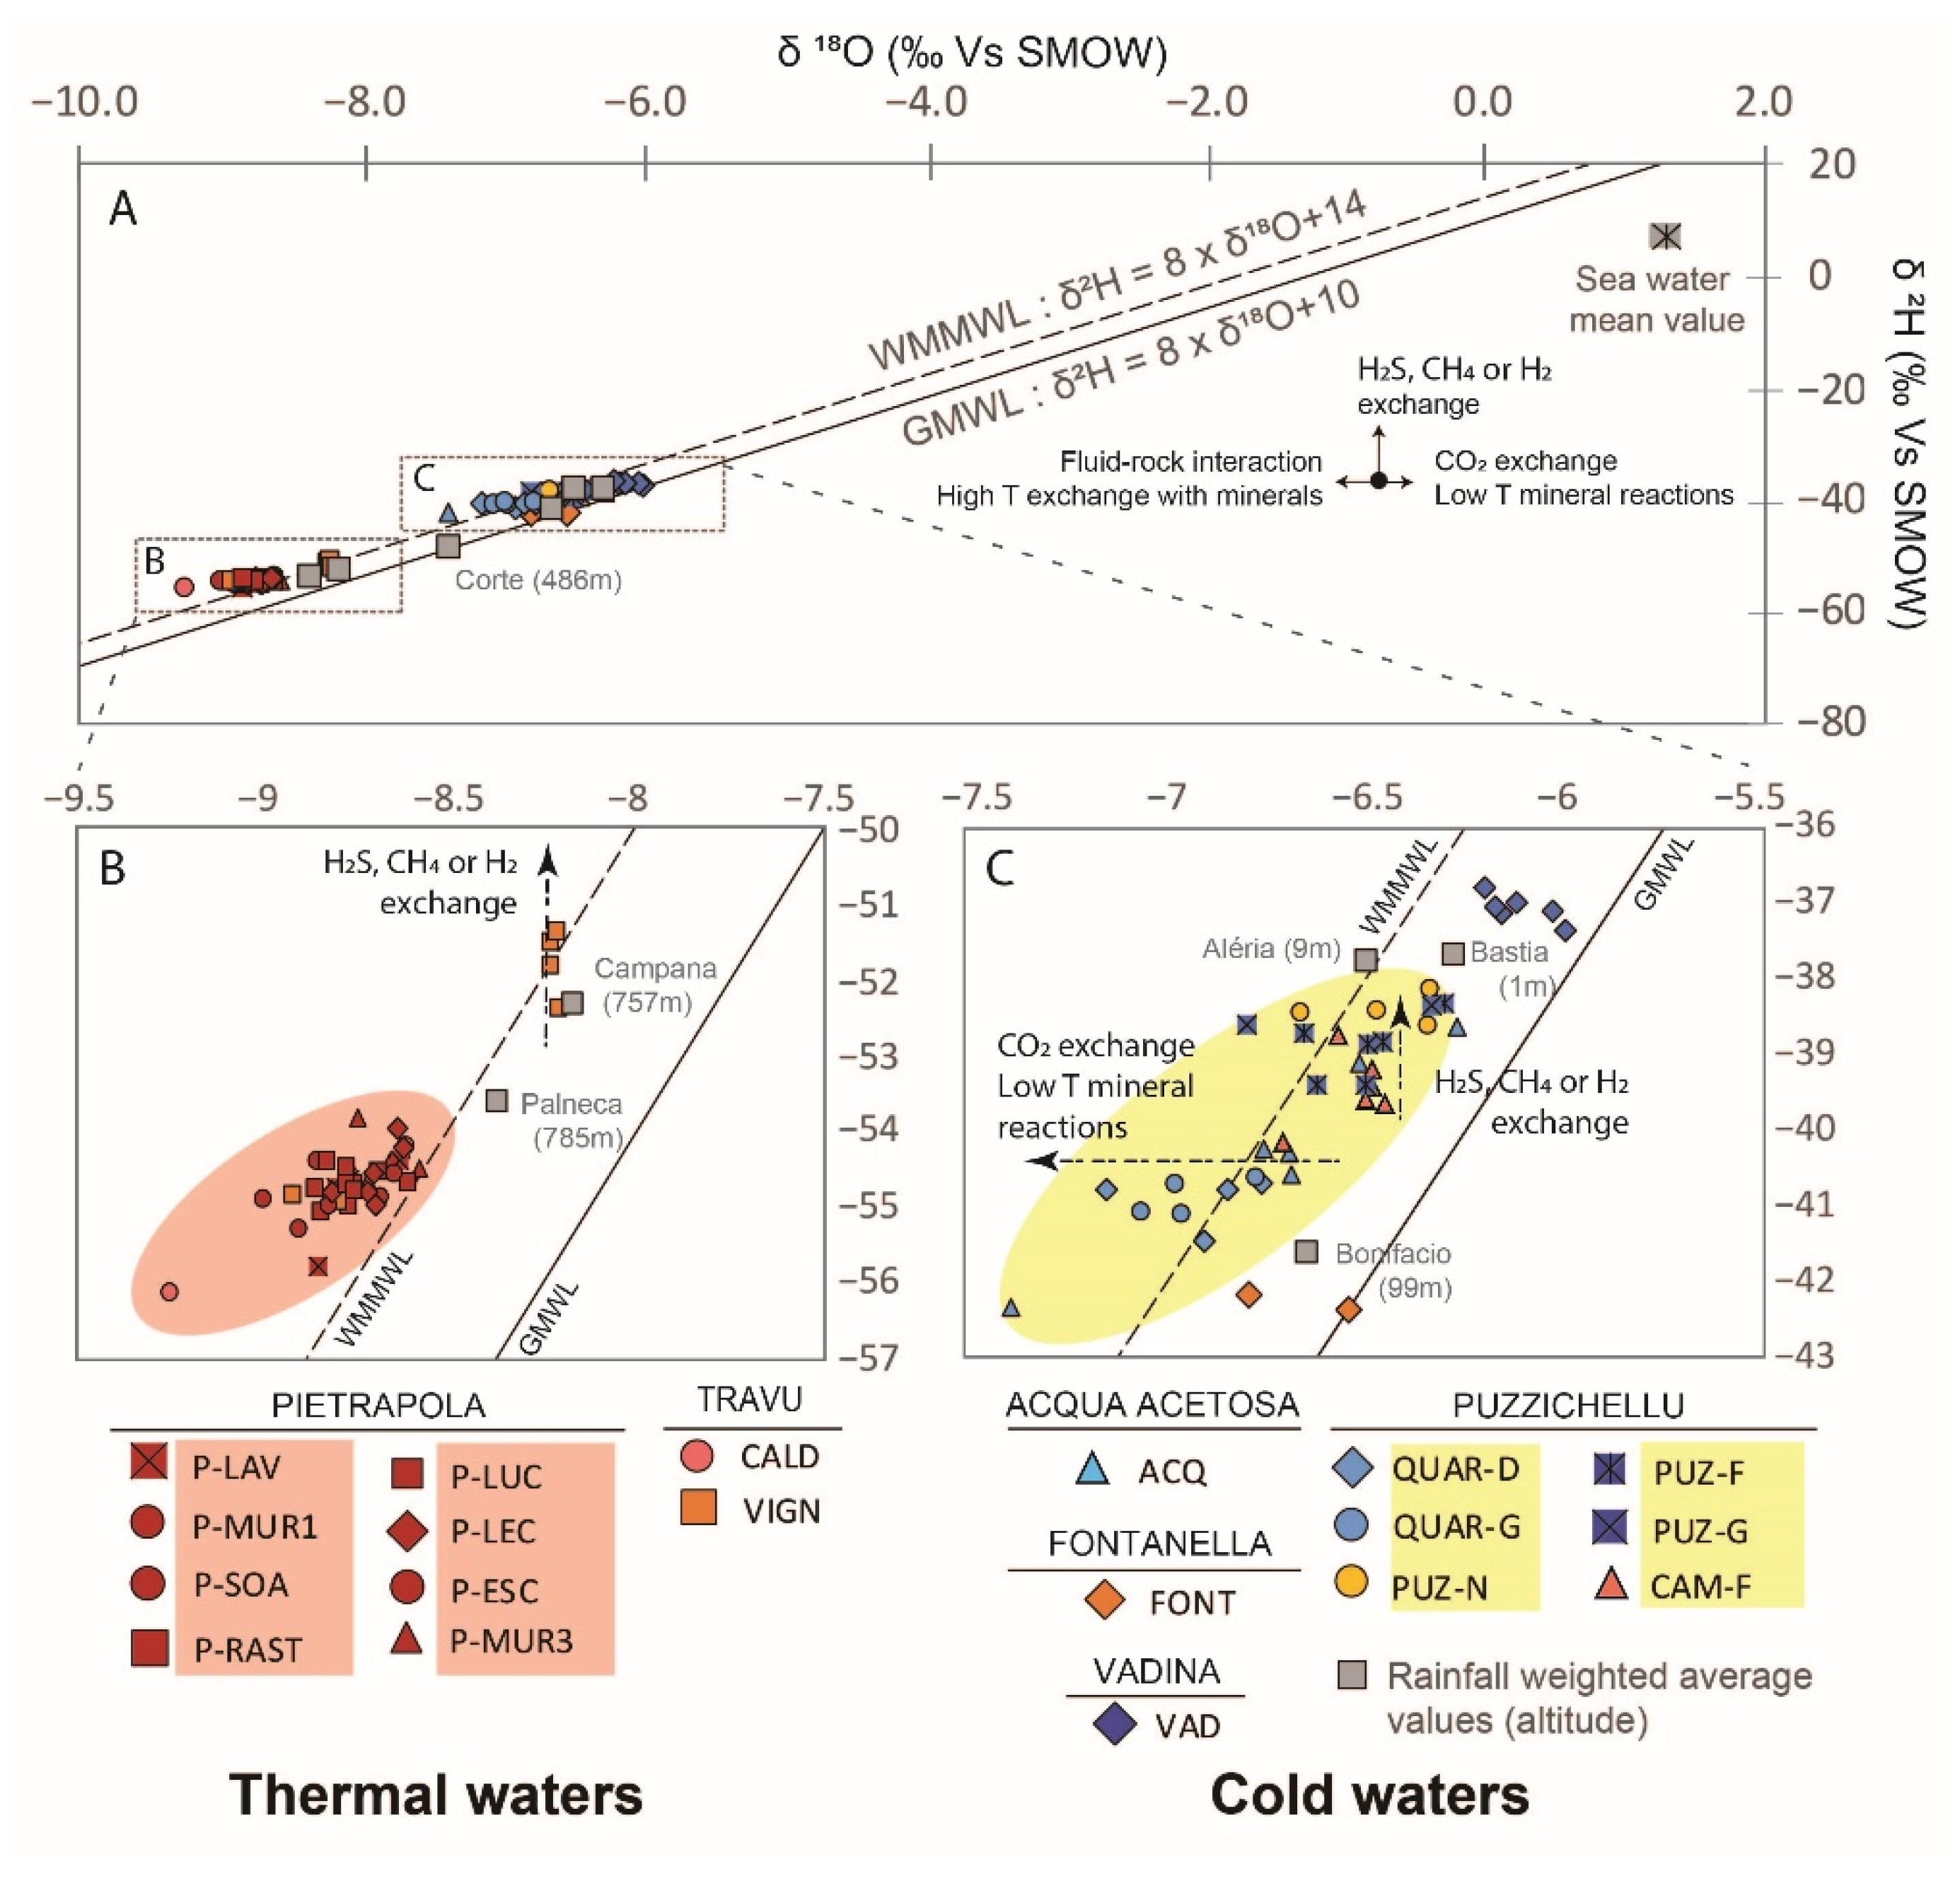
4.4. Groundwater Origin and Recharge Conditions
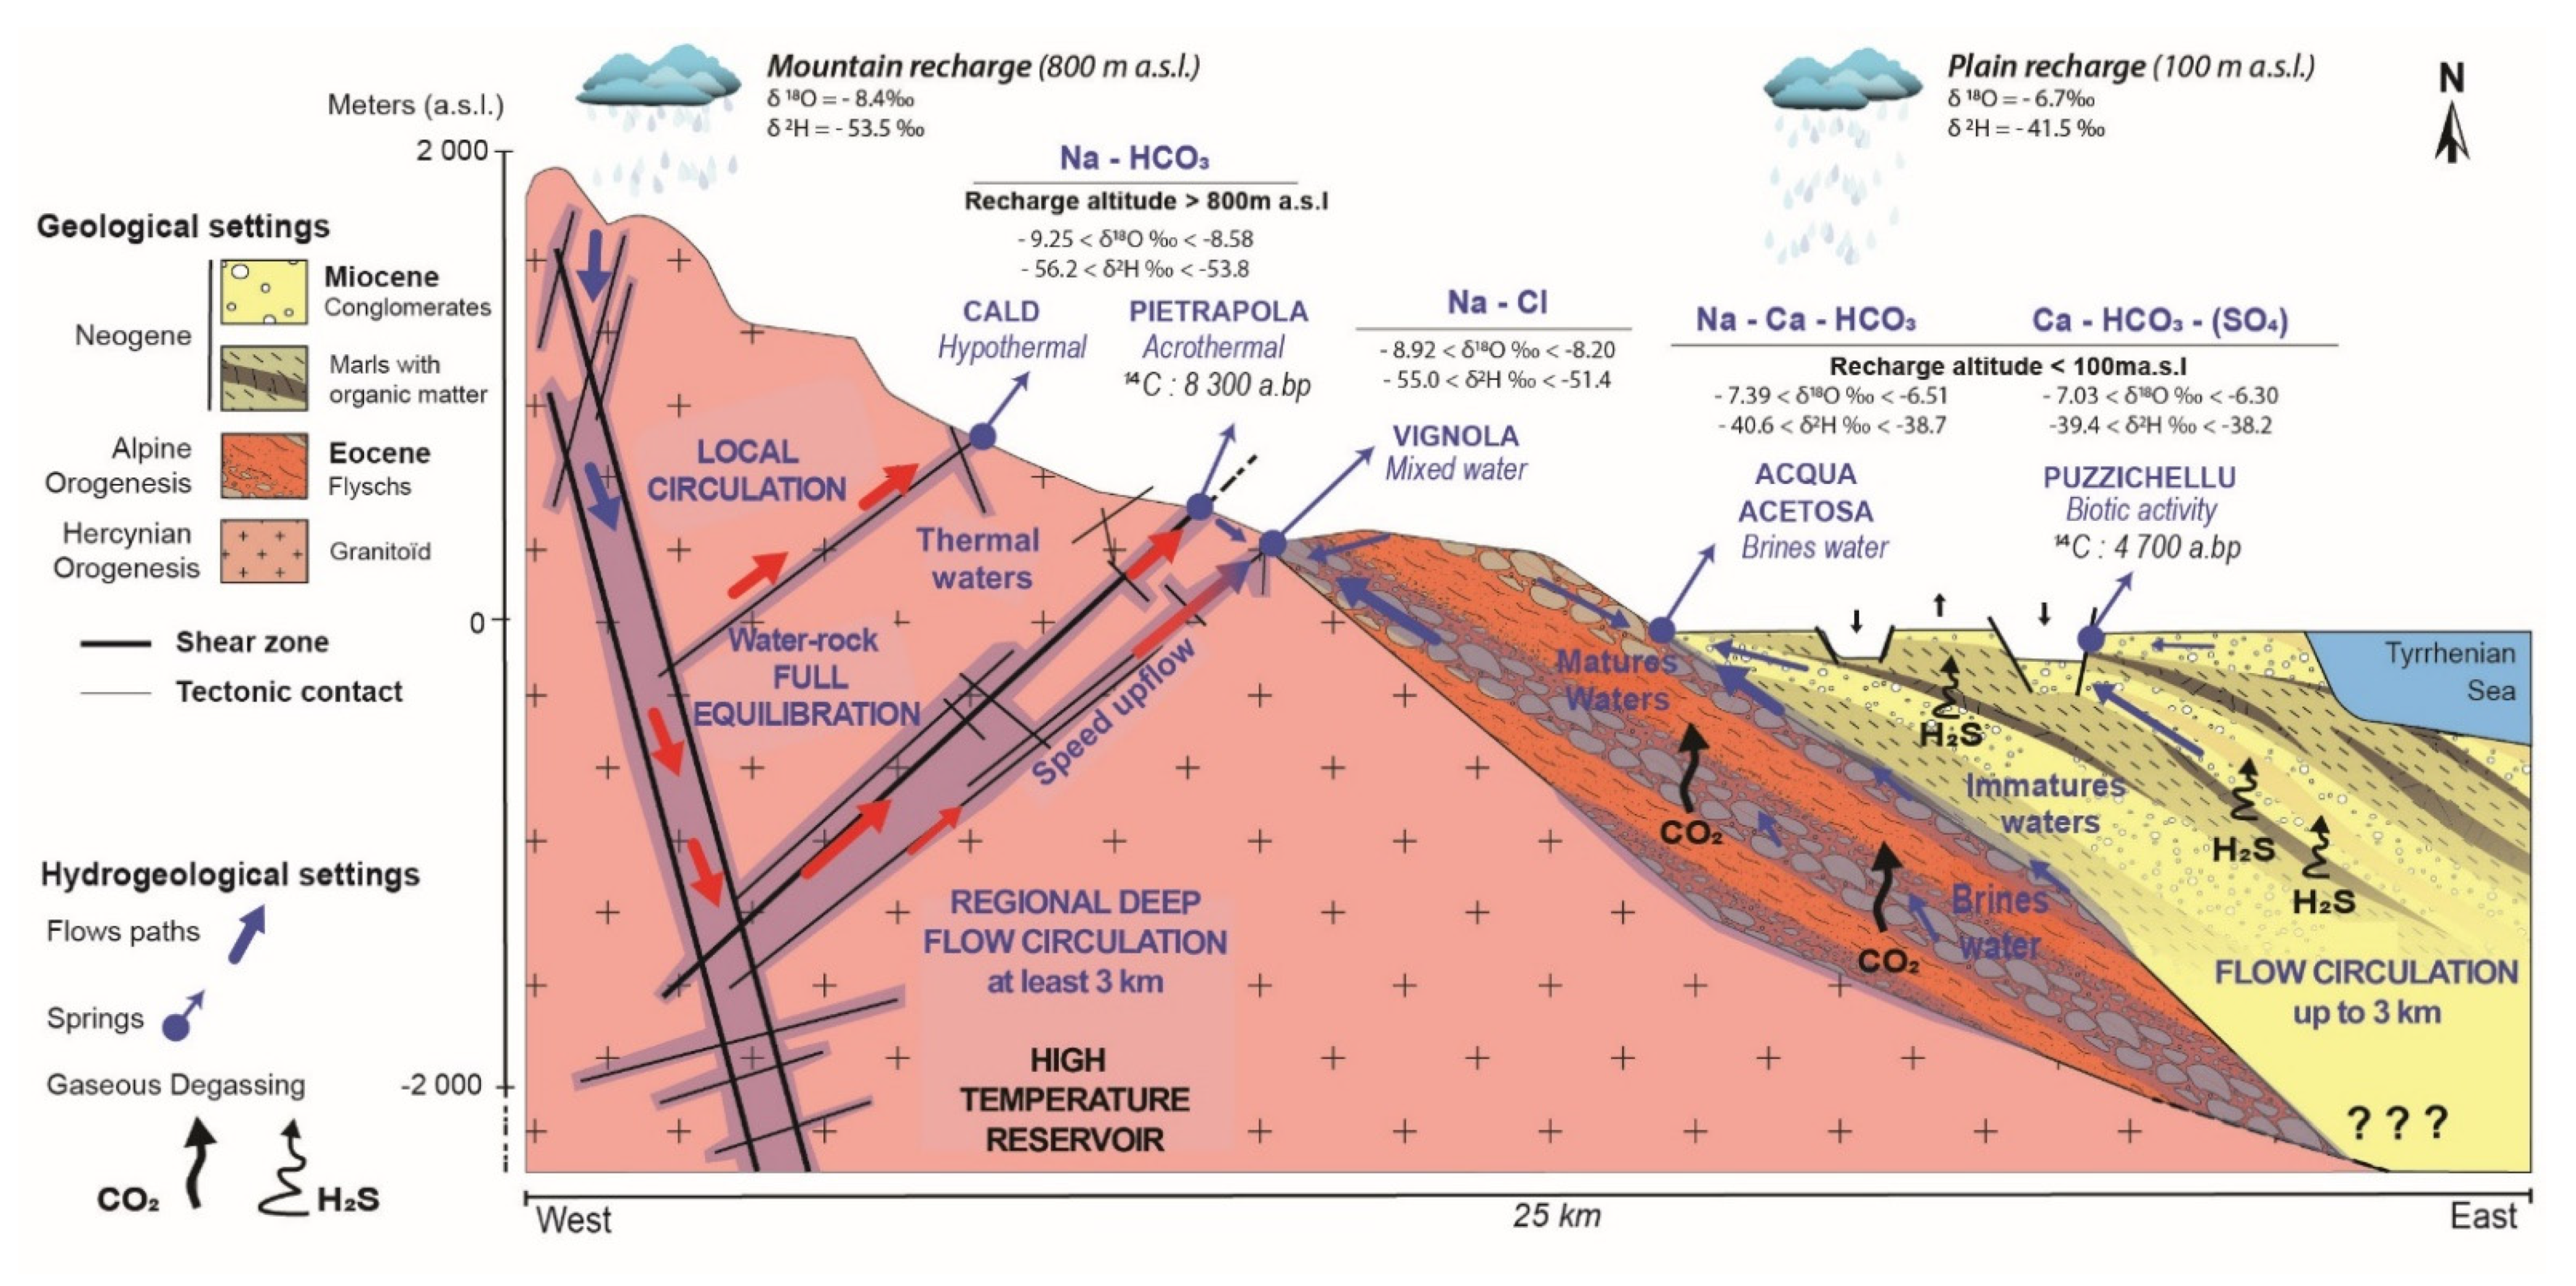
4.5. Conceptual Model
5. Conclusions
Author Contributions
Funding
Institutional Review Board Statement
Informed Consent Statement
Data Availability Statement
Conflicts of Interest
References
- Eggenkamp, H.G.M.; Marques, J.M. A Comparison of Mineral Water Classification Techniques: Occurrence and Distribution of Different Water Types in Portugal (Including Madeira and the Azores). J. Geochem. Explor. 2013, 132, 125–139. [Google Scholar] [CrossRef]
- Marques, J.M.; Graça, H.; Eggenkamp, H.G.; Neves, O.; Carreira, P.M.; Matias, M.J.; Mayer, B.; Nunes, D.; Trancoso, V.N. Isotopic and Hydrochemical Data as Indicators of Recharge Areas, Flow Paths and Water–rock Interaction in the Caldas Da Rainha–Quinta Das Janelas Thermomineral Carbonate Rock Aquifer (Central Portugal). J. Hydrol. 2013, 476, 302–313. [Google Scholar] [CrossRef]
- Albu, M.; Banks, D.; Nash, H. History of mineral and thermal waters. In Mineral and Thermal Groundwater Resources; Albu, M., Banks, D., Nash, H., Eds.; Springer: Dordrecht, The Netherlands, 1997; pp. 3–20. ISBN 978-94-011-5846-6. [Google Scholar]
- Elango, L.; Kannan, R. Chapter 11 Rock–water interaction and its control on chemical composition of groundwater. In Developments in Environmental Science; Sarkar, D., Datta, R., Hannigan, R., Eds.; Concepts and Applications in Environmental Geochemistry; Elsevier: Amsterdam, The Netherlands, 2007; Volume 5, pp. 229–243. [Google Scholar]
- Dinelli, E.; Lima, A.; De Vivo, B.; Albanese, S.; Cicchella, D.; Valera, P. Hydrogeochemical Analysis on Italian Bottled Mineral Waters: Effects of Geology. J. Geochem. Explor. 2010, 107, 317–335. [Google Scholar] [CrossRef]
- Albu, M.; Banks, D.; Nash, H. Mineral and Thermal Groundwater Resources; Springer Science & Business Media: New York, NY, USA, 2012; ISBN 94-011-5846-0. [Google Scholar]
- Vaselli, O.; Minissale, A.; Tassi, F.; Magro, G.; Seghedi, I.; Ioane, D.; Szakacs, A. A Geochemical Traverse across the Eastern Carpathians (Romania): Constraints on the Origin and Evolution of the Mineral Water and Gas Discharges. Chem. Geol. 2002, 182, 637–654. [Google Scholar] [CrossRef]
- Chandrajith, R.; Barth, J.A.C.; Subasinghe, N.D.; Merten, D.; Dissanayake, C.B. Geochemical and Isotope Characterization of Geothermal Spring Waters in Sri Lanka: Evidence for Steeper than Expected Geothermal Gradients. J. Hydrol. 2013, 476, 360–369. [Google Scholar] [CrossRef]
- Chelnokov, G.; Kharitonova, N.; Bragin, I.; Chudaev, O. Geochemistry of Mineral Water and Gases of the Razdolnoe Spa (Primorye, Far East of Russia). Appl. Geochem. 2015, 59, 147–154. [Google Scholar] [CrossRef]
- Alçiçek, H.; Bülbül, A.; Alçiçek, M.C. Hydrogeochemistry of the Thermal Waters from the Yenice Geothermal Field (Denizli Basin, Southwestern Anatolia, Turkey). J. Volcanol. Geotherm. Res. 2016, 309, 118–138. [Google Scholar] [CrossRef]
- Alçiçek, H.; Bülbül, A.; Yavuzer, İ.; Cihat Alçiçek, M. Origin and Evolution of the Thermal Waters from the Pamukkale Geothermal Field (Denizli Basin, SW Anatolia, Turkey): Insights from Hydrogeochemistry and Geothermometry. J. Volcanol. Geotherm. Res. 2019, 372, 48–70. [Google Scholar] [CrossRef]
- Viaroli, S.; Lotti, F.; Mastrorillo, L.; Paolucci, V.; Mazza, R. Simplified Two-Dimensional Modelling to Constrain the Deep Groundwater Contribution in a Complex Mineral Water Mixing Area, Riardo Plain, Southern Italy. Hydrogeol. J. 2019, 13, 37–46. [Google Scholar] [CrossRef] [Green Version]
- Cuccuru, S.; Deluca, F.; Mongelli, G.; Oggiano, G. Granite- and Andesite-Hosted Thermal Water: Geochemistry and Environmental Issues in Northern Sardinia, Italy. Environ. Earth Sci. 2020, 79, 257. [Google Scholar] [CrossRef]
- Martín-Loeches, M.; Pavón-García, J.; Molina-Navarro, E.; Martínez-Santos, P.; Almeida, C.; Reyes-López, J.; Cienfuegos-Hevia, I.; Sastre-Merlín, A. Hydrogeochemistry of Granitic Mountain Zones and the Influence of Adjacent Sedimentary Basins at Their Tectonic Borders: The Case of the Spanish Central System Batholith. Hydrogeol. J. 2020, 28, 2477–2500. [Google Scholar] [CrossRef]
- Birke, M.; Reimann, C.; Demetriades, A.; Rauch, U.; Lorenz, H.; Harazim, B.; Glatte, W. Determination of Major and Trace Elements in European Bottled Mineral Water—Analytical Methods. J. Geochem. Explor. 2010, 107, 217–226. [Google Scholar] [CrossRef]
- Amaudric, D.C.S. Les Relations Entre Schistes Lustres et Flyschs Autochtones Dans Le Sud de La Corse Alpine. Geol. Alp. 1973, 49, 5–12. [Google Scholar]
- Caritg, S. Carte Géologique Harmonisée du Département de la Corse du sud: Notice Explicative; BRGM: Orléans, France, 2009; p. 298.
- Caritg, S. Carte Géologique Harmonisée du Département de la Haute-Corse: Notice Explicative; BRGM: Orléans, France, 2009; p. 483.
- Loÿe-Pilot, M.-D.; Durand-Delga, M.; Feinberg, H.; Gourinard, Y.; Magné, J. Les Formations Burdigaliennes de Corse Orientale Dans Leur Cadre Géodynamique. Comptes Rendus Geosci. 2004, 336, 919–930. [Google Scholar] [CrossRef]
- Serrano, O.; Allanic, C.; Magar, M. Synthèse Géologique du Bassin Tertiaire de la Plaine Orientale Corse—Liaison Terre-Mer Entre San Nicolao et Solenzara; BRGM/RP-61394-FR; BRGM: Orléans, France, 2012; p. 178.
- Di Rosa, M.; De Giorgi, A.; Marroni, M.; Vidal, O. Syn-convergence Exhumation of Continental Crust: Evidence from Structural and Metamorphic Analysis of the Monte Cecu Area, Alpine Corsica (Northern Corsica, France). Geol. J. 2017, 52, 919–937. [Google Scholar] [CrossRef]
- Bruno, C.; Dupré, G.; Giorgetti, G.; Giorgetti, J.P.; Alesandri, J. Chi Tempu Face?: Météorologie, Climat et Microclimats de la Corse; CRDP de Corse: Ajaccio, France, 2001; ISBN 2-86620-146-9.
- Rome, S.; Giorgetti, J.-P. Du climat de la montagne corse et ses aléas. In Proceedings of the Actes du colloque de l’Association Internationale de Climatologie; Gérard beltrando, Malika Madelin et Hervé Quénol: Epernay, France, 2006; Volume 19, pp. 486–491. [Google Scholar]
- Santoni, S.; Huneau, F.; Garel, E.; Vergnaud-Ayraud, V.; Labasque, T.; Aquilina, L.; Jaunat, J.; Celle-Jeanton, H. Residence Time, Mineralization Processes and Groundwater Origin within a Carbonate Coastal Aquifer with a Thick Unsaturated Zone. J. Hydrol. 2016, 540, 50–63. [Google Scholar] [CrossRef] [Green Version]
- Erostate, M.; Huneau, F.; Garel, E.; Vystavna, Y.; Santoni, S.; Pasqualini, V. Coupling Isotope Hydrology, Geochemical Tracers and Emerging Compounds to Evaluate Mixing Processes and Groundwater Dependence of a Highly Anthropized Coastal Hydrosystem. J. Hydrol. 2019, 578, 123979. [Google Scholar] [CrossRef]
- Rossi, P.; Cocherie, A.; Fanning, C.M. Evidence in Variscan Corsica of a Brief and Voluminous Late Carboniferous to Early Permian Volcanic-Plutonic Event Contemporaneous with a High-Temperature/Low-Pressure Metamorphic Peak in the Lower Crust. Bull. Société Géologique Fr. 2015, 186, 171–192. [Google Scholar] [CrossRef]
- Caballero, Y.; Lachassagne, P.; Ladouche, B. Contribution à L’évaluation de la Ressource en eau des Aquifères de Socle des Roches Granitiques de Corse; BRGM/RP-54541-FR; BRGM: Orléans, France, 2006; 87p.
- Dewandel, B.; Lachassagne, P.; Zaidi, F.K.; Chandra, S. A Conceptual Hydrodynamic Model of a Geological Discontinuity in Hard Rock Aquifers: Example of a Quartz Reef in Granitic Terrain in South India. J. Hydrol. 2011, 405, 474–487. [Google Scholar] [CrossRef] [Green Version]
- Genevier, M.; Mardhel, V.; Frissant, N. Actualisation de la synthèse hydrogéologique de la région Corse; BRGM: Orléans, France, 2011; p. 99.
- Lachassagne, P. The Fracture Permeability of Hard Rock Aquifers Is Due Neither to Tectonics, nor to Unloading, but to Weathering Processes. Terra Nova 2011, 145–161. [Google Scholar] [CrossRef]
- Vitale Brovarone, A.; Beyssac, O.; Malavieille, J.; Molli, G.; Beltrando, M.; Compagnoni, R. Stacking and Metamorphism of Continuous Segments of Subducted Lithosphere in a High-Pressure Wedge: The Example of Alpine Corsica (France). Earth-Sci. Rev. 2013, 116, 35–56. [Google Scholar] [CrossRef]
- Gueydan, F.; Brun, J.-P.; Phillippon, M.; Noury, M. Sequential Extension as a Record of Corsica Rotation during Apennines Slab Roll-Back. Tectonophysics 2017, 710–711, 149–161. [Google Scholar] [CrossRef] [Green Version]
- Piccoli, F.; Vitale Brovarone, A.; Ague, J.J. Field and Petrological Study of Metasomatism and High-Pressure Carbonation from Lawsonite Eclogite-Facies Terrains, Alpine Corsica. Lithos 2018, 304–307, 16–37. [Google Scholar] [CrossRef]
- Berthier, F.; Demange, J.; Desplan, A. Etude préliminaire des ressources géothermiques de la Corse; BRGM: Orléans, France, 1980; p. 56.
- Zuccarelli, P.; Gentil, L. Stations Climatériques et Eaux Minérales de la Corse: Rapport à M. le Président du Conseil, Ministre de l’interieur/par M. le Dr Pascal Zuccarelli,…; Avec la Collaboration de M. Louis Gentil,…; A. Maloine: Paris, France, 1909. [Google Scholar]
- Ardouin, J. Des Maladies Dans les Pays Chauds: De Leur Caractère et de Leur Traitement par L’emploi de L’eau d’Orezza (Corse); Paul Faxo: Paris, France, 1876; p. 18. [Google Scholar]
- Giorgi, P.-J.; Mazonni, J.-F. Le Mémorial des Corses; Pomponi, F., Ed.; Alabiana; Cyrnos et Méditeranée: Ajaccio, France, 1979; Volume 4, ISBN 978-2-905124-52-4. [Google Scholar]
- Biscaldi, R.; Lopoukhine, M. Les Eaux Minérales en France: Les Ressources, le Marché et ses Perspectives; BRGM/RR-38103-FR; BRGM: Orléans, France, 1994; p. 81.
- Sabiani, T. Encyclopaedia Cosicae; Histoire; Maury, S.A.: Millau, France, 2004; Volume 4–5, ISBN 2-9510068-7-X. [Google Scholar]
- Serpentini, A.L. Dictionnaire Historique de la Corse; Albiana: Ajaccio, France, 2006; ISBN 2-84698-068-3. [Google Scholar]
- Huneau, F.; Garel, E.; Santoni, S.; Jaunat, J.; Celle-Jeanton, H. A New Network for Isotopes in Precipitation of Corsica (France); IAEA: Vienna, Austria, 2015. [Google Scholar]
- Penna, D.; Stenni, B.; Šanda, M.; Wrede, S.; Bogaard, T.A.; Gobbi, A.; Borga, M.; Fischer, B.M.C.; Bonazza, M.; Chárová, Z. On the Reproducibility and Repeatability of Laser Absorption Spectroscopy Measurements for δ2$H and δ18$O Isotopic Analysis. Hydrol. Earth Syst. Sci. 2010, 14, 1551–1566. [Google Scholar] [CrossRef] [Green Version]
- Hatfield, R.; Patrick, C. Radiocarbon Dating of Ground Water-Practical Applications; BETA Analytic: Miami, FL, USA, 2014; p. 12. [Google Scholar]
- Hotchkis, M.; Wei, T. Radiocarbon Detection by Ion Charge Exchange Mass Spectrometry. Nucl. Instrum. Methods Phys. Res. Sect. B Beam Interact. Mater. At. 2007, 259, 158–164. [Google Scholar] [CrossRef]
- International Atomic Energy Agency. Isotope Methods for Dating Old Groundwater; Publication/Division of Scientific and Technical Information, International Atomic Energy Agency: Vienna, Austria, 2013; ISBN 978-92-0-137210-9. [Google Scholar]
- Hellborg, R.; Skog, G. Accelerator Mass Spectrometry. Mass Spectrom. Rev. 2008, 27, 398–427. [Google Scholar] [CrossRef] [Green Version]
- Benavente, O.; Tassi, F.; Reich, M.; Aguilera, F.; Capecchiacci, F.; Gutiérrez, F.; Vaselli, O.; Rizzo, A. Chemical and Isotopic Features of Cold and Thermal Fluids Discharged in the Southern Volcanic Zone between 32.5° S and 36° S: Insights into the Physical and Chemical Processes Controlling Fluid Geochemistry in Geothermal Systems of Central Chile. Chem. Geol. 2016, 420, 97–113. [Google Scholar] [CrossRef]
- Marques, J.M.; Carreira, P.M.; Aires-Barros, L.A.; Monteiro Santos, F.A.; Antunes da Silva, M.; Represas, P. Assessment of Chaves Low-Temperature CO2-Rich Geothermal System (N-Portugal) Using an Interdisciplinary Geosciences Approach. Geofluids 2019, 2019, 1379093. [Google Scholar] [CrossRef]
- Marques, J.M.; Carreira, P.M.M.; Aires-Barros, L.; Graça, R.C. Nature and Role of CO2 in Some Hot and Cold HCO3/Na/CO2-Rich Portuguese Mineral Waters: A Review and Reinterpretation. Environ. Geol. 2000, 40, 53–63. [Google Scholar] [CrossRef]
- Deiana, M.; Cervi, F.; Pennisi, M.; Mussi, M.; Bertrand, C.; Tazioli, A.; Corsini, A.; Ronchetti, F. Chemical and Isotopic Investigations (Δ18O, Δ2H, 3H, 87Sr/86Sr) to Define Groundwater Processes Occurring in a Deep-Seated Landslide in Flysch. Hydrogeol. J. 2018, 26, 2669–2691. [Google Scholar] [CrossRef]
- Giggenbach, W.F. Chemical Techniques in Geothermal Exploration. Appl. Geochem. Geotherm. Reserv. Dev. 1991, 119–144. Available online: https://ci.nii.ac.jp/naid/10008803480/en/ (accessed on 29 June 2021).
- Pfeifer, H.R.; Derron, M.H.; Rey, D.; Schlegel, C.; Atteia, O.; Dalla Piazza, R.; Dubois, J.P.; Mandia, Y. Natural Trace Element Input to the Soil-Sediment-Water-Plant System: Examples of Background and Contaminated Situations in Switzerland, Eastern France and Northern Italy. In Trace Elements—Their Distribution and Effects in the Environment; Elsevier: Amsterdam, The Netherlands, 2000; pp. 33–86. [Google Scholar]
- Derron, M.-H.; Pfeifer, H.-R. Caractérisation Hydrogéochimique Des Eaux de Source Alpines Hydrogeochemical Characterization of Alpine Spring Waters. Bull. Soc. Vaud. Des Sci. Nat. 2018, 96, 5–29. [Google Scholar] [CrossRef]
- Giggenbach, W.F. Geothermal Solute Equilibria. Derivation of Na-K-Mg-Ca Geoindicators. Geochim. Cosmochim. Acta 1988, 52, 2749–2765. [Google Scholar] [CrossRef]
- Avşar, Ö.; Kurtuluş, B.; Gürsu, S.; Kuşcu, G.G.; Kaçaroğlu, F. Geochemical and Isotopic Characteristics of Structurally Controlled Geothermal and Mineral Waters of Muğla (SW Turkey). Geothermics 2016, 64, 466–481. [Google Scholar] [CrossRef]
- Boschetti, T.; Toscani, L.; Barbieri, M.; Mucchino, C.; Marino, T. Low Enthalpy Na-Chloride Waters from the Lunigiana and Garfagnana Grabens, Northern Apennines, Italy: Tracing Fluid Connections and Basement Interactions via Chemical and Isotopic Compositions. J. Volcanol. Geotherm. Res. 2017, 348, 12–25. [Google Scholar] [CrossRef]
- Besser, H.; Mokadem, N.; Redhaounia, B.; Hadji, R.; Hamad, A.; Hamed, Y. Groundwater Mixing and Geochemical Assessment of Low-Enthalpy Resources in the Geothermal Field of Southwestern Tunisia. Euro-Mediterr. J. Environ. Integr. 2018, 3, 16. [Google Scholar] [CrossRef] [Green Version]
- Bragin, I.V.; Chelnokov, G.A.; Chudaev, O.V.; Kharitonova, N.A.; Vysotskiy, S.V. Geochemistry of Thermal Waters of Continental Margin of Far East of Russia. Available online: https://onlinelibrary.wiley.com/doi/abs/10.1111/1755-6724.12657 (accessed on 27 August 2019).
- Morais, M. Hydrochemical and Isotopic Interpretation of Thermal Waters from the Felgueira Area (Central Portugal). In Water-Rock Interaction XIII; Taylor & Francis Group: London, UK, 2010; p. 169. [Google Scholar]
- Gupta, H.K.; Roy, S. Geothermal Energy: An Alternative Resource for the 21st Century; Elsevier: Amsterdam, The Netherlands, 2006; ISBN 978-0-08-046564-7. [Google Scholar]
- Rajmohan, N.; Elango, L. Identification and Evolution of Hydrogeochemical Processes in the Groundwater Environment in an Area of the Palar and Cheyyar River Basins, Southern India. Environ. Geol. 2004, 46, 47–61. [Google Scholar] [CrossRef]
- Saxena, V.; Ahmed, S. Dissolution of Fluoride in Groundwater: A Water-Rock Interaction Study. Environ. Geol. 2001, 40, 1084–1087. [Google Scholar] [CrossRef]
- Cinti, D.; Vaselli, O.; Poncia, P.P.; Brusca, L.; Grassa, F.; Procesi, M.; Tassi, F. Anomalous Concentrations of Arsenic, Fluoride and Radon in Volcanic-Sedimentary Aquifers from Central Italy: Quality Indexes for Management of the Water Resource. Environ. Pollut. 2019, 253, 525–537. [Google Scholar] [CrossRef] [PubMed]
- Marques, J.M.; Aires-Barros, L.; Graça, R. Genesis of Low-Temperature Sulfurous Mineral Waters (Northern Portugal): A Geochemical and Isotopic Approach. In Proceedings of the World Geothermal Congress, Kyushu-Tohoku, Japan, 28 May–10 June 2000; pp. 1407–1412. [Google Scholar]
- Fuge, R. Fluorine in the Environment, a Review of Its Sources and Geochemistry. Appl. Geochem. 2019, 100, 393–406. [Google Scholar] [CrossRef] [Green Version]
- Re, V.; Zuppi, G.M. Influence of Precipitation and Deep Saline Groundwater on the Hydrological Systems of Mediterranean Coastal Plains: A General Overview. Hydrol. Sci. J. 2011, 56, 966–980. [Google Scholar] [CrossRef] [Green Version]
- Custodio, E. Coastal Aquifers of Europe: An Overview. Hydrogeol. J. 2010, 18, 269–280. [Google Scholar] [CrossRef]
- Aquilina, L.; Dreuzy, J.-R.D. Relationship of Present Saline Fluid with Paleomigration of Basinal Brines at the Basement/Sediment Interface (Southeast Basin—France). Appl. Geochem. 2011, 26, 1933–1945. [Google Scholar] [CrossRef]
- Negrel, P.; Casanova, J.; Blomqvist, R.; Kaija, J.; Frape, S. Strontium Isotopic Characterization of the Palmottu Hydrosystem (Finland): Water–rock Interaction and Geochemistry of Groundwaters. Geofluids 2003, 3, 161–175. [Google Scholar] [CrossRef]
- Perri, F. Chemical Weathering of Crystalline Rocks in Contrasting Climatic Conditions Using Geochemical Proxies: An Overview. Palaeogeogr. Palaeoclimatol. Palaeoecol. 2020, 556, 109873. [Google Scholar] [CrossRef]
- Perri, F.; Scarciglia, F.; Apollaro, C.; Marini, L. Characterization of Granitoid Profiles in the Sila Massif (Calabria, Southern Italy) and Reconstruction of Weathering Processes by Mineralogy, Chemistry, and Reaction Path Modeling. J. Soils Sediments 2015, 15, 1351–1372. [Google Scholar] [CrossRef]
- Richard, L. Sur l’origine Des Ions Chlorure Dans Les Eaux Salines Des Massifs Granitiques. Comptes Rendus L’académie Sci. Ser. IIA Earth Planet. Sci. 2000, 331, 783–788. [Google Scholar] [CrossRef]
- Xu, P.; Li, M.; Qian, H.; Zhang, Q.; Liu, F.; Hou, K. Hydrochemistry and Geothermometry of Geothermal Water in the Central Guanzhong Basin, China: A Case Study in Xi’an. Environ. Earth Sci. 2019, 78. [Google Scholar] [CrossRef]
- Karimi, S.; Mohammadi, Z.; Samani, N. Geothermometry and Circulation Depth of Groundwater in Semnan Thermal Springs, Northern Iran. Environ. Earth Sci. 2017, 76, 659. [Google Scholar] [CrossRef]
- Stenström, K.E.; Skog, G.; Georgiadou, E.; Genberg, J.; Johansson, A. A Guide to Radiocarbon Units and Calculations; Lund University: Lund, Sweden, 2011; p. 18. [Google Scholar]
- Boschetti, T. Oxygen Isotope Equilibrium in Sulfate–water Systems: A Revision of Geothermometric Applications in Low-Enthalpy Systems. J. Geochem. Explor. 2013, 124, 92–100. [Google Scholar] [CrossRef]
- Mizutani, Y.; Rafter, T.A. Oxygen Isotopic Compostion of Sulphates. Part 5. Isotopic Composition of Sulphates in Rain Water, Gracefield, New Zealand. N. Z. J. Sci. 1969, 12, 69–80. [Google Scholar]
- Otero, N.; Soler, A.; Canals, À. Controls of Δ34S and Δ18O in Dissolved Sulphate: Learning from a Detailed Survey in the Llobregat River (Spain). Appl. Geochem. 2008, 23, 1166–1185. [Google Scholar] [CrossRef]
- Newman, L.; Krouse, H.R.; Grinenko, V.A. Sulphur isotope variations in the atmosphere. In Stable Isotopes: Natural and Anthropogenic Sulphur in the Environment; John Wiley and Sons: Chichester, UK, 1991. [Google Scholar]
- Crossley, R.J.; Evans, K.A.; Jeon, H.; Kilburn, M.R. Insights into Sulfur Cycling at Subduction Zones from In-Situ Isotopic Analysis of Sulfides in High-Pressure Serpentinites and ‘Hybrid’ Samples from Alpine Corsica. Chem. Geol. 2018, 493, 359–378. [Google Scholar] [CrossRef]
- Dupalová, T.; Sracek, O.; Vencelides, Z.; Žák, K. The Origin of Thermal Waters in the Northeastern Part of the Eger Rift, Czech Republic. Appl. Geochem. 2012, 27, 689–702. [Google Scholar] [CrossRef]
- Van Stempvoort, D.R.; Krouse, H.R. Controls of 18O in Sulfate: Review of Experimental Data and Application to Specific Environments. In Proceedings of the ACS Symposium Series; American Chemical Society: Washington, DC, USA, 1994; Volume 550, pp. 446–480. [Google Scholar]
- Seal, R.R. Sulfur Isotope Geochemistry of Sulfide Minerals. Rev. Mineral. Geochem. 2006, 61, 633–677. [Google Scholar] [CrossRef]
- Gilhooly, W.P.; Fike, D.A.; Druschel, G.K.; Kafantaris, F.-C.A.; Price, R.E.; Amend, J.P. Sulfur and Oxygen Isotope Insights into Sulfur Cycling in Shallow-Sea Hydrothermal Vents, Milos, Greece. Geochem. Trans. 2014, 15, 12. [Google Scholar] [CrossRef] [Green Version]
- Lloyd, R.M. Oxygen Isotope Behavior in the Sulfate-Water System. J. Geophys. Res. 1968, 73, 6099–6110. [Google Scholar] [CrossRef]
- Craig, H. Isotopic variations in meteoric waters. Science 1961, 133, 1702–1703. [Google Scholar] [CrossRef] [PubMed]
- Celle-Jeanton, H.; Travi, Y.; Blavoux, B. Isotopic Typology of the Precipitation in the Western Mediterranean Region at Three Different Time Scales. Geophys. Res. Lett. 2001, 28, 1215–1218. [Google Scholar] [CrossRef]
- Dominici, R. Eaux Thermales et Eaux Minérales de Corse: Synthèse Hydrogéologique; 2007 07EAUH05; BRGM: Orléans, France, 1992; p. 75.
- Karolytė, R.; Serno, S.; Johnson, G.; Gilfillan, S.M.V. The Influence of Oxygen Isotope Exchange between CO2 and H2O in Natural CO2-Rich Spring Waters: Implications for Geothermometry. Appl. Geochem. 2017, 84, 173–186. [Google Scholar] [CrossRef]
- Marques, J.; Graqa, R.; Pais, A.R. Geochemical and Isotopic Features of Hot and Cold COz-Rich Mineral Waters of Northern Portugal: A Review and Reinterpretation. Bull. D’hydrogéol. 1999, 17, 9. [Google Scholar]
- Cartwright, I.; Weaver, T.; Tweed, S.; Ahearne, D.; Cooper, M.; Czapnik, K.; Tranter, J. Stable Isotope Geochemistry of Cold CO2-Bearing Mineral Spring Waters, Daylesford, Victoria, Australia: Sources of Gas and Water and Links with Waning Volcanism. Chem. Geol. 2002, 185, 71–91. [Google Scholar] [CrossRef]
- Hemmerle, H.; van Geldern, R.; Juhlke, T.R.; Huneau, F.; Garel, E.; Santoni, S.; Barth, J.A.C. Altitude Isotope Effects in Mediterranean High-Relief Terrains: A Correction Method to Utilize Stream Water Data. Hydrol. Sci. J. 2021, 66, 1409–1418. [Google Scholar] [CrossRef]
- Mook, W.; Rozanski, K. Environmental Isotopes in the Hydrological Cycle; IAEA Publish: Viena, Austria, 2000; Volume 3. [Google Scholar]
- Paternoster, M.; Oggiano, G.; Sinisi, R.; Caracausi, A.; Mongelli, G. Geochemistry of Two Contrasting Deep Fluids in the Sardinia Microplate (Western Mediterranean): Relationships with Tectonics and Heat Sources. J. Volcanol. Geotherm. Res. 2017, 336, 108–117. [Google Scholar] [CrossRef]
- Bouchaou, L.; Warner, N.R.; Tagma, T.; Hssaisoune, M.; Vengosh, A. The Origin of Geothermal Waters in Morocco: Multiple Isotope Tracers for Delineating Sources of Water-Rock Interactions. Appl. Geochem. 2017, 84, 244–253. [Google Scholar] [CrossRef]


| Spring’s Name | Code | Spring Type | Location | Observations | |||||||||||
|---|---|---|---|---|---|---|---|---|---|---|---|---|---|---|---|
| Altitude (m asl) | GPS Co-Ordinates in “Lambert 93” | Temperature Classification | Mean Temperature | Mean TDS | Mean Discharge (L/h) | Water Type | CO2 | H2S | Beggiatoa Bacteria | Local Geology | |||||
| X (m) | Y (m) | Cold | Hot | (°C) | (mg/L) | ||||||||||
| Acqua Acetosa | ACQ | Modified | 47 | 1,227,704 | 6,119,786 | X | 16.6 | 2222 | 89 | Ca-Na-HCO3 | X | - | - | Contact zone between Eocene Flysch and Neogene sediments (marls and conglomerates) | |
| Caldaniccia Travu | CALD | Natural | 284 | 1,220,621 | 6,111,726 | Hypothermal | 33.5 | 1925 | - | Na-HCO3 | - | - | - | Hercynian basement (granitoids) | |
| Campo- Favajo | CAM-F | Modified | 25 | 1,231,885 | 6,137,973 | X | 16.7 | 1038 | 729 | Na-HCO3 | - | X | X | Neogene sediments (conglomerates and marls) | |
| Fontanella | FONT | Natural | 1 | 1,231,781 | 6,107,000 | X | 17.9 | 8584 | - | Na-Cl | X | X | - | Flysch Eocene (sequence of conglomerates, sandstone and marls) | |
| Pietrapola | P-MUR3 | Modified | 190 | 1222,834 | 6119,744 | Hyperthermal | 47.0 | 243 | 1388 | Na-HCO3 | - | - | - | Hercynian basement (granitoids) | |
| P-LAV | Modified | Hyperthermal | 49.3 | 243 | 571 | - | - | - | |||||||
| P-LEC | Modified | Mesothermal | 39.0 | 249 | - | - | - | - | |||||||
| P-LUC | Modified | Hypothermal | 32.3 | 239 | 244 | - | - | - | |||||||
| P-MUR1 | Modified | Hyperthermal | 46.6 | 234 | 353 | - | - | - | |||||||
| P-ESC | Modified | Mesothermal | 38.3 | 233 | - | - | - | - | |||||||
| P-RAST | Borehole | Acrothermal | 54.5 | 227 | - | - | - | - | |||||||
| P-SOA | Modified | Hypothermal | 50.3 | 242 | 147 | - | - | - | |||||||
| Puzzichellu | PUZ-F | Borehole | 19 | 1,230,383,109 | 6,135,227,581 | X | 16.9 | 837 | 627 | Ca-SO4-HCO3 | - | X | X | Neogene sediments (conglomerates and marls) | |
| PUZ-N | Modified | 60 | X | 15.6 | 1234 | - | - | X | X | ||||||
| PUZ-G | Modified | 60 | X | 14.6 | 1105 | - | - | X | X | ||||||
| Fajo- Quarcio | QUAR-D | Modified | 110 | 1,228,745 | 6,142,058 | X | 15.8 | 589 | - | Ca-Na-HCO3 | - | X | X | Jurassic and Cretaceous metamorphic rock (schist and limestone) | |
| QUAR-G | Modified | 110 | X | 15.9 | 584 | - | - | X | X | ||||||
| Vadina | VAD | Natural | 18 | 1,234,335 | 6,129,575 | X | 17.9 | 475 | - | Ca-HCO3 | - | X | - | Miocene sediment (sandstone and limestone) | |
| Vignola Travu | VIGN | Natural | 190 | 1,223,001 | 61,12l,348 | Hypothermal | 27.7 | 1424 | 1394 | Na-Cl | - | X | X | Contact zone between Eocene flysch and Hercynian basement (granitoids) | |
| T | pH | E.C. | Eh | HCO3 | SO4 | Cl | Br | F | Na | Ca | Mg | K | SiO2 | 2H | 18O | ||||
|---|---|---|---|---|---|---|---|---|---|---|---|---|---|---|---|---|---|---|---|
| ID | Date | °C | (-) | µS/cm | mV | mg/L | ‰ | STD | ‰ | STD | |||||||||
| ACQ | Jan | 16.6 | 6.0 | 2400 | 259 | 1535 | 2 | 120 | 0.5 | 0.4 | 254 | 317 | 23.3 | 8.2 | 57 | −40.6 | 0.07 | −6.68 | 0.02 |
| Feb | 16.5 | 6.1 | 2370 | 293 | 1525 | 2 | 110 | 0.4 | 0.4 | 243 | 328 | 15.3 | 9.1 | 55 | −40.2 | 0.05 | −6.75 | 0.04 | |
| Mar | 15.8 | 6.3 | 2410 | 307 | 1543 | 13 | 114 | 0.4 | 0.0 | 247 | 328 | 18.3 | 3.3 | - | −42.3 | 0.03 | −7.39 | 0.02 | |
| Apr | 16.1 | 6.0 | 2220 | 148 | 1537 | 2 | 105 | 0.4 | 0.4 | 220 | 297 | 14.0 | 7.6 | 46 | −40.3 | 0.12 | −6.69 | 0.05 | |
| May | 16.8 | 6.2 | 2330 | 181 | 1485 | 2 | 114 | 0.4 | 0.0 | 257 | 323 | 24.8 | 8.2 | 52 | −39.1 | 0.02 | −6.51 | 0.09 | |
| Jun | 17.7 | 6.3 | 2360 | 178 | 1488 | 2 | 113 | 0.5 | 0.0 | 231 | 289 | 21.5 | 9.9 | 46 | −38.7 | 0.10 | −6.86 | 0.03 | |
| FONT | Jan | 17.5 | 6.1 | 13,430 | 202 | 1918 | 26 | 3773 | 15.9 | 1.5 | 2301 | 463 | 84.7 | 95.9 | 44 | −54.2 | 0.09 | −8.62 | 0.02 |
| Jun | 18.3 | 6.5 | 13,020 | 165 | 1932 | 25 | 3628 | 14.4 | 4.5 | 2255 | 444 | 82.9 | 92.4 | 30 | −56.2 | 0.34 | −9.50 | 0.10 | |
| VIGN | Jan | 27.2 | 8.3 | 3000 | −105 | 39 | 6 | 639 | 2.5 | 3.7 | 435 | 131 | 0.2 | 15.1 | 36 | −39.2 | 0.03 | −6.48 | 0.07 |
| Feb | 27.0 | 8.3 | 3010 | −104 | 37 | 6 | 605 | 2.5 | 3.7 | 434 | 131 | 0.2 | 15.0 | 35 | −39.4 | 0.06 | −6.48 | 0.03 | |
| Mar | 27.4 | 8.5 | 3010 | −5 | 21 | 11 | 913 | 3.5 | 4.3 | 445 | 128 | 0.4 | 14.5 | - | −39.6 | 0.08 | −6.50 | 0.01 | |
| Apr | 27.5 | 8.1 | 2960 | −25 | 32 | 14 | 877 | 3.5 | 4.4 | 423 | 123 | 0.2 | 14.5 | 34 | −40.2 | 0.12 | −6.70 | 0.02 | |
| May | 28.3 | 8.4 | 2950 | 10 | 20 | 13 | 894 | 3.5 | 4.4 | 429 | 120 | 0.2 | 12.0 | 34 | −39.7 | 0.08 | −6.45 | 0.02 | |
| Jun | 28.5 | 8.6 | 2930 | −139 | 20 | 13 | 892 | 3.4 | 5.4 | 433 | 116 | 0.2 | 15.7 | 35 | −38.8 | 0.30 | −6.85 | 0.06 | |
| CALD | Jan | 32.2 | 9.3 | 154 | 305 | 53 | 15 | 7 | 1.9 | 0.7 | 28 | 3 | 0.0 | 0.6 | 38 | −42.2 | 0.58 | −6.79 | 0.09 |
| Jun | 34.9 | 9.1 | 153 | −28 | 54 | 16 | 6 | 0.1 | 0.7 | 28 | 3 | 0.0 | 0.7 | 38 | −42.4 | 0.34 | −7.13 | 0.10 | |
| P-MUR3 | Jan | 46.7 | 8.9 | 344 | −182 | 99 | 28 | 27 | 0.1 | 3.6 | 69 | 2 | 0.0 | 3.6 | 88 | −54.7 | 0.07 | −8.72 | 0.03 |
| Feb | 46.5 | 8.8 | 345 | −26 | 120 | 32 | 27 | 0.2 | 3.2 | 69 | 2 | 0.0 | 3.5 | 87 | −54.3 | 0.15 | −8.63 | 0.07 | |
| Mar | 46.6 | 9.3 | 350 | −86 | 127 | 25 | 27 | 0.1 | 3.5 | 67 | 1 | 0.0 | 3.4 | - | −54.4 | 0.08 | −8.66 | 0.04 | |
| Apr | 47.8 | 9.3 | 348 | −108 | 104 | 27 | 27 | 0.2 | 3.2 | 66 | 2 | 0.0 | 3.5 | 77 | −54.6 | 0.19 | −8.76 | 0.07 | |
| May | 46.9 | 9.4 | 349 | −89 | 117 | 32 | 28 | 0.2 | 3.2 | 68 | 2 | 0.0 | 3.6 | 75 | −54.5 | 0.11 | −8.58 | 0.05 | |
| Jun | 47.5 | 9.5 | 345 | −63 | 96 | 27 | 27 | 0.2 | 3.5 | 67 | 2 | 0.0 | 3.5 | 77 | −53.8 | 0.63 | −9.01 | 0.09 | |
| P-LAV | Jan | 50.1 | 9.0 | 347 | −232 | 107 | 24 | 28 | 0.1 | 3.6 | 69 | 2 | 0.0 | 3.4 | 85 | −54.9 | 0.04 | −8.78 | 0.02 |
| Feb | 46.8 | 9.3 | 348 | 19 | 129 | 27 | 27 | 0.2 | 3.1 | 68 | 2 | 0.0 | 3.5 | 85 | −54.4 | 0.14 | −8.64 | 0.09 | |
| Mar | 49.2 | 9.3 | 349 | 6 | 120 | 26 | 27 | 0.1 | 3.3 | 67 | 1 | 0.0 | 3.3 | - | −54.7 | 0.21 | −8.77 | 0.07 | |
| Apr | 48.7 | 9.4 | 347 | 43 | 120 | 26 | 27 | 0.1 | 3.4 | 66 | 2 | 0.0 | 3.4 | 84 | −55.8 | 0.20 | −8.85 | 0.05 | |
| May | 50.5 | 9.5 | 347 | −192 | 109 | 27 | 27 | 0.1 | 3.1 | 67 | 2 | 0.0 | 3.5 | 73 | −54.7 | 0.09 | −8.77 | 0.07 | |
| Jun | 50.8 | 9.6 | 348 | −154 | 98 | 24 | 27 | 0.2 | 3.5 | 68 | 2 | 0.0 | 3.4 | 72 | −54.8 | 0.06 | −9.07 | 0.05 | |
| P-LUC | Jan | 32.4 | 9.3 | 342 | −184 | 105 | 24 | 28 | 0.1 | 3.6 | 69 | 2 | 0.0 | 3.5 | 87 | −54.7 | 0.17 | −8.61 | 0.05 |
| Feb | 31.4 | 9.5 | 344 | 56 | 102 | 32 | 27 | 0.1 | 3.1 | 69 | 2 | 0.0 | 3.5 | 84 | −54.7 | 0.22 | −8.75 | 0.02 | |
| Mar | 32.2 | 9.5 | 342 | 19 | 126 | 24 | 27 | 0.2 | 3.3 | 67 | 2 | 0.0 | 3.4 | - | −54.6 | 0.10 | −8.69 | 0.05 | |
| Apr | 32.4 | 9.6 | 343 | 114 | 101 | 32 | 27 | 0.2 | 3.3 | 65 | 2 | 0.0 | 3.5 | 62 | −55.0 | 0.30 | −8.77 | 0.09 | |
| May | 32.7 | 9.7 | 343 | −106 | 110 | 32 | 27 | 0.2 | 3.6 | 67 | 2 | 0.0 | 3.6 | 71 | −55.1 | 0.11 | −8.84 | 0.08 | |
| Jun | 32.9 | 9.9 | 344 | −48 | 100 | 26 | 27 | 0.2 | 3.4 | 67 | 2 | 0.0 | 3.5 | 73 | −54.8 | 0.33 | −9.10 | 0.08 | |
| P-SOA | Jan | 50.7 | 9.1 | 348 | −240 | 115 | 24 | 28 | 0.2 | 3.8 | 69 | 2 | 0.0 | 3.4 | 89 | −54.9 | 0.11 | −8.69 | 0.06 |
| Feb | 50.1 | 9.3 | 353 | −24 | 126 | 25 | 27 | 0.1 | 3.3 | 69 | 5 | 0.0 | 3.5 | 90 | −54.9 | 0.12 | −8.92 | 0.03 | |
| Mar | 49.5 | 9.3 | 348 | −123 | 121 | 24 | 27 | 0.1 | 3.1 | 67 | 1 | 0.0 | 3.5 | - | −54.8 | 0.11 | −8.80 | 0.05 | |
| Apr | 49.5 | 9.5 | 350 | 105 | 105 | 25 | 28 | 0.1 | 3.3 | 65 | 2 | 0.0 | 4.5 | 74 | −55.3 | 0.26 | −8.90 | 0.05 | |
| May | 50.8 | 9.4 | 347 | −200 | 102 | 27 | 27 | 0.1 | 3.2 | 67 | 2 | 0.0 | 3.6 | 75 | −54.4 | 0.04 | −8.85 | 0.02 | |
| Jun | 51.1 | 9.7 | 349 | −114 | 106 | 24 | 27 | 3.5 | 67 | 2 | 0.0 | 3.4 | 76 | −54.9 | 0.50 | −9.26 | 0.04 | ||
| P-ESC | Apr | 38.3 | 9.4 | 347 | 126 | 106 | 24 | 27 | 0.1 | 3.5 | 65 | 2 | 0.0 | 3.8 | 25 | −38.8 | 0.05 | −6.46 | 0.04 |
| P-MUR1 | Jan | 46.6 | 8.9 | 347 | −151 | 98 | 30 | 28 | 0.1 | 3.8 | 68 | 3 | 0.0 | 3.5 | 84 | −38.9 | 0.13 | −6.49 | 0.10 |
| P-MUR2 | Jan | 46.8 | 348 | 191 | - | - | - | - | - | - | - | - | - | - | −39.4 | 0.10 | −6.6 | 0.10 | |
| P-LEC | Jan | 39.6 | 9.4 | 346 | −122 | 110 | 28 | 26 | 0.1 | 2.6 | 68 | 2 | 0.0 | 3.4 | 71 | −39.4 | 0.86 | −6.49 | 0.08 |
| Feb | 36.0 | 9.4 | 366 | 56 | 131 | 33 | 29 | 0.1 | 3.2 | 70 | 2 | 0.0 | 5.2 | 74 | −38.3 | 0.17 | −6.30 | 0.06 | |
| Mar | 39.0 | 9.4 | 347 | −33 | 120 | 27 | 27 | 0.1 | 3.5 | 68 | 2 | 0.0 | 3.4 | - | −38.7 | 0.15 | −7.02 | 0.06 | |
| Apr | 39.3 | 9.4 | 376 | 166 | 113 | 32 | 28 | 0.1 | 3.7 | 65 | 2 | 0.0 | 4.3 | 76 | −38.2 | 0.09 | −6.33 | 0.02 | |
| May | 39.5 | 9.6 | 347 | −66 | 111 | 32 | 27 | 0.2 | 3.3 | 67 | 2 | 0.0 | 3.5 | 75 | −38.7 | 0.04 | −6.34 | 0.08 | |
| Jun | 40.7 | 9.8 | 349 | −28 | 110 | 31 | 28 | - | 3.5 | 67 | 2 | 0.0 | 4.2 | 76 | −38.4 | 0.32 | −6.47 | 0.08 | |
| P-RAST | Jan | 54.6 | 9.0 | 348 | −212 | 110 | 12 | 12 | 0.1 | 1.7 | 52 | 2 | 0.0 | 2.9 | 65 | −38.5 | 0.11 | −7.03 | 0.07 |
| Mar | 54.6 | 9.1 | 348 | −160 | 120 | 25 | 27 | 0.1 | 3.5 | 67 | 2 | 0.0 | 3.4 | −38.4 | 0.12 | −6.33 | 0.04 | ||
| Apr | 54.3 | 9.4 | 348 | 65 | 113 | 25 | 27 | 0.1 | 2.8 | 65 | 2 | 0.0 | 3.7 | 82 | −38.6 | 0.17 | −6.80 | 0.06 | |
| Jun | 54.7 | 9.6 | 350 | −156 | 98 | 25 | 28 | 0.2 | 3.8 | 67 | 2 | 0.0 | 3.6 | 74 | −51.9 | 0.08 | −8.23 | 0.02 | |
| CAM-F | Jan | 16.7 | 7.7 | 1451 | 59 | 483 | 18 | 242 | 1.0 | 0.6 | 265 | 31 | 13.2 | 3.4 | 24 | −54.9 | 0.13 | −8.92 | 0.05 |
| Feb | 16.7 | 7.8 | 1440 | 130 | 466 | 19 | 235 | 0.8 | 0.6 | 255 | 33 | 14.6 | 3.4 | 24 | −51.6 | 0.14 | −8.23 | 0.11 | |
| Mar | 16.6 | 7.8 | 1446 | 106 | 472 | 20 | 230 | 0.9 | 0.7 | 266 | 31 | 14.2 | 3.4 | - | −51.4 | 0.13 | −8.21 | 0.05 | |
| Apr | 16.6 | 7.8 | 1451 | −15 | 473 | 19 | 230 | 0.9 | 0.7 | 243 | 32 | 14.4 | 3.6 | 22 | −52.4 | 0.02 | −8.20 | 0.05 | |
| May | 16.7 | 7.7 | 1436 | −260 | 489 | 19 | 230 | 0.9 | 1.0 | 251 | 30 | 13.2 | 3.4 | 23 | −55.0 | 0.03 | −9.04 | 0.07 | |
| Jun | 16.7 | 7.8 | 1435 | −127 | 476 | 21 | 230 | 0.9 | 0.8 | 254 | 30 | 13.2 | 3.5 | 23 | −55.0 | 0.49 | −8.82 | 0.08 | |
| PUZ-F | Jan | 16.8 | 7.1 | 1025 | 165 | 483 | 96 | 48 | 0.2 | 0.0 | 51 | 99 | 37.3 | 1.9 | 38 | −54.6 | 0.23 | −8.65 | 0.18 |
| Feb | 16.8 | 7.3 | 1014 | 180 | 489 | 116 | 47 | 0.2 | 0.3 | 52 | 106 | 39.5 | 2.0 | 36 | - | 0.27 | - | 0.11 | |
| Mar | 16.8 | 7.1 | 1014 | 77 | 492 | 87 | 47 | 0.2 | 0.4 | 50 | 102 | 38.8 | 1.9 | - | −54.3 | 0.13 | −8.62 | 0.07 | |
| Apr | 16.9 | 7.4 | 1015 | 8 | 490 | 108 | 51 | 0.2 | 0.2 | 50 | 101 | 43.2 | 1.9 | 36 | −54.6 | 0.13 | −8.71 | 0.07 | |
| May | 17.0 | 7.2 | 1014 | −121 | 486 | 112 | 52 | 0.3 | 0.0 | 52 | 99 | 49.4 | 2.0 | 34 | −54.8 | 0.00 | −8.72 | 0.08 | |
| Jun | 17.1 | 7.5 | 1026 | −77 | 490 | 89 | 48 | 0.2 | 0.0 | 50 | 98 | 48.3 | 1.9 | 40 | −55.0 | 0.24 | −8.70 | 0.05 | |
| PUZ-N | Mar | 14.3 | 7.8 | 1414 | −66 | 488 | 295 | 93 | 0.4 | 0.4 | 50 | 204 | 44.1 | 2.1 | - | −54.0 | 0.13 | −8.64 | 0.05 |
| Apr | 15.5 | 7.8 | 1412 | 79 | 483 | 296 | 140 | 0.3 | 0.3 | 49 | 205 | 44.2 | 2.0 | 48 | −54.8 | 0.20 | −9.07 | 0.07 | |
| May | 15.7 | 7.7 | 1432 | −60 | 490 | 315 | 115 | 0.4 | 0.0 | 50 | 202 | 51.3 | 2.2 | 38 | −54.5 | 0.33 | −8.77 | 0.06 | |
| Jun | 17.1 | 8.2 | 1466 | −77 | 559 | 324 | 114 | 0.5 | 52 | 209 | 52.3 | 2.2 | - | −54.7 | 0.30 | −8.78 | 0.08 | ||
| PUZ-G | Mar | 14.2 | 7.1 | 1386 | −77 | 632 | 100 | 96 | 0.3 | 0.3 | 56 | 168 | 51.6 | 2.1 | - | −54.8 | 0.17 | −8.75 | 0.04 |
| Apr | 15.1 | 7.2 | 1406 | −33 | 616 | 99 | 111 | 0.3 | 0.2 | 57 | 167 | 47.8 | 2.1 | 34 | −54.4 | 0.19 | −9.09 | 0.04 | |
| QUAR-D | Mar | 15.2 | 7.4 | 698 | −7 | 400 | 19 | 26 | 0.2 | 0.4 | 63 | 83 | 11.3 | 1.7 | - | −40.7 | 0.07 | −6.76 | 0.05 |
| Apr | 15.8 | 7.4 | 699 | 213 | 370 | 18 | 26 | 0.2 | 0.5 | 60 | 82 | 10.7 | 2.4 | 9 | −41.5 | 0.35 | −6.90 | 0.08 | |
| May | 16.0 | 7.4 | 669 | 7 | 400 | 18 | 26 | 0.2 | 0.4 | 62 | 76 | 11.2 | 1.7 | 10 | −40.8 | 0.03 | −6.84 | 0.05 | |
| Jun | 16.1 | 7.6 | 694 | −74 | 392 | 16 | 26 | 0.2 | 0.5 | 62 | 76 | 11.0 | 1.7 | 10 | −40.8 | 0.11 | −7.52 | 0.17 | |
| QUAR-G | Mar | 15.7 | 7.3 | 699 | −17 | 403 | 18 | 26 | 0.2 | 0.3 | 60 | 82 | 10.1 | 1.7 | - | −40.7 | 0.10 | −6.77 | 0.03 |
| Apr | 15.8 | 7.3 | 701 | 213 | 377 | 17 | 26 | 0.2 | 0.5 | 59 | 83 | 10.9 | 1.8 | 9 | −41.1 | 0.05 | −7.05 | 0.07 | |
| May | 15.9 | 7.3 | 700 | −42 | 405 | 18 | 26 | 0.2 | 0.4 | 60 | 76 | 11.3 | 1.8 | 10 | −41.1 | 0.13 | −6.96 | 0.08 | |
| Jun | 16.3 | 7.6 | 698 | −55 | 364 | 16 | 26 | 0.2 | 0.5 | 61 | 77 | 11.1 | 1.7 | 10 | −40.7 | 0.44 | −7.34 | 0.04 | |
| VAD | Jan | 18.0 | 7.2 | 602 | 280 | 254 | 28 | 41 | 0.3 | 0.0 | 25 | 96 | 4.8 | 1.2 | 17 | −37.4 | 0.11 | −6.00 | 0.02 |
| Feb | 18.0 | 7.1 | 595 | 267 | 260 | 28 | 40 | 0.2 | 0.3 | 24 | 104 | 3.9 | 1.2 | 17 | −37.1 | 0.01 | −6.03 | 0.04 | |
| Mar | 18.0 | 7.3 | 600 | 294 | 262 | 29 | 41 | 0.2 | 0.3 | 24 | 99 | 3.6 | 1.1 | - | −37.2 | 0.07 | −6.16 | 0.05 | |
| Apr | 18.0 | 7.2 | 595 | 251 | 277 | 28 | 44 | 0.2 | 0.2 | 24 | 99 | 4.1 | 1.1 | 17 | −37.1 | 0.34 | −6.17 | 0.09 | |
| May | 17.9 | 7.2 | 593 | 259 | 262 | 28 | 45 | 0.3 | 0.0 | 24 | 97 | 4.5 | 1.2 | 16 | −37.0 | 0.01 | −6.12 | 0.07 | |
| Jun | 17.9 | 7.6 | 592 | 262 | 270 | 31 | 39 | 0.2 | 0.0 | 23 | 93 | 4.5 | 1.3 | 11 | −36.8 | 0.29 | −7.07 | 0.18 | |
| Sea Water Mean | 18.3 | 8.2 | 57,375 | - | 165 | 2910 | 21,366 | 73 | 0.7 | 11,773 | 574 | 1421 | 328 | - | 6.12 | 0.13 | 1.31 | 0.08 | |
| Sampling Point | Traces Elements (µg/L) | ||||||||||||||
|---|---|---|---|---|---|---|---|---|---|---|---|---|---|---|---|
| ID | Li | B | As | Rb | Sr | Fe | Mn | Ba | F | Al | Cs | Si | Cr | U | |
| Acqua Acetosa | ACQ | 624 | 1508 | 0.262 | 20.6 | 2194 | 2947 | 953 | 317 | 190 | 2 | 5.3 | 34,820 | 4.7 × 10⁻² | 3.0 × 10⁻² |
| Travu | VIGN | 1440 | 1824 | 0.031 | 165.3 | 3867 | 8 | 4 | 59 | 4273 | 26 | 56.4 | 18,810 | 0.0 × 100 | 2.3 × 10⁻¹ |
| Pietrapola | P-LAV | 115 | 143 | 1.621 | 32.8 | 56 | 5 | 0 | 1 | 3286 | 17 | 10.2 | 48,391 | 6.0 × 10⁻³ | 8.9 × 10⁻³ |
| P-LEC | 112 | 138 | 1.772 | 33.0 | 51 | 3 | 0 | 1 | 3521 | 12 | 10.2 | 47,408 | 4.2 × 10⁻³ | 1.5 × 10⁻³ | |
| P-MUR3 | 110 | 137 | 1.413 | 31.9 | 52 | 3 | 0 | 1 | 3465 | 19 | 9.7 | 46,980 | 1.5 × 10⁻² | 6.6 × 10⁻³ | |
| P-LUC | 110 | 137 | 1.878 | 32.2 | 50 | 13 | 0 | 0 | 3295 | 13 | 10.0 | 48,086 | 2.4 × 10⁻² | 3.0 × 10⁻³ | |
| P-RAST | 111 | 138 | 1.280 | 33.1 | 53 | 6 | 1 | 1 | 3547 | 26 | 10.2 | 47,751 | 3.5 × 10⁻² | 6.8 × 10⁻³ | |
| P-SOA | 111 | 140 | 1.587 | 33.3 | 53 | 2 | 0 | 1 | 3067 | 20 | 10.2 | 47,270 | 4.3 × 10⁻³ | 4.0 × 10⁻⁴ | |
| Puzzichellu | PUZ-F | 37 | 62 | 0.028 | 2.8 | 1880 | 5 | 3 | 96 | 367 | 1 | 0.0 | 20,691 | 1.7 × 10⁻² | 1.5 × 10⁻³ |
| PUZ-G | 37 | 43 | 0.060 | 3.5 | 1583 | 39 | 24 | 116 | 349 | 6 | 0.0 | 24,114 | 1.3 × 10⁻¹ | 1.5 × 10⁻¹ | |
| PUZ-N | 38 | 32 | 0.091 | 3.7 | 1497 | 467 | 108 | 47 | 450 | 36 | 0.0 | 21,129 | 8.1 × 1 | 3.2 × 10⁻¹ | |
| CAM-F | 122 | 468 | 0.003 | 5.0 | 943 | 5 | 6 | 18 | 730 | 3 | 0.3 | 14,351 | 1.6 × 10⁻² | 1.1 × 10⁻¹ | |
| QUAR-D | 39 | 1206 | 0.021 | 1.8 | 769 | 18 | 25 | 44 | 364 | 4 | 1.1 | 5778 | 2.3 × 10⁻² | 5.6 × 10⁻¹ | |
| QUAR-G | 38 | 1200 | 0.010 | 1.7 | 752 | 9 | 25 | 42 | 283 | 3 | 1.1 | 5662 | 1.1 × 10⁻² | 5.8 × 10⁻¹ | |
| Vadina | VAD | 4 | 30 | 1.132 | 0.5 | 123 | 3 | 0 | 27 | 283 | 1 | 0.0 | 9026 | 4.3 × 10⁻¹ | 1.6 × 100 |
| Detection limit | 0.030 | 0.210 | 0.003 | 0.007 | 0.111 | 0.035 | 0.002 | 0.030 | 100 | 0.4 | 6.3 × 10⁻⁵ | 17 | 0.008 | 1.7 × 10⁻⁴ | |
| Sampling Point | Sample ID | T | pH | HCO3 | δ13C/12C | Fraction Modern | Apparent Age (Not Corrected) | |
|---|---|---|---|---|---|---|---|---|
| °C | - | (meq/l) | ‰ | pMC | Sd | |||
| Pietrapola | P-MUR3 | 46.6 | 9.27 | 2.08 | −16.20 | 35.80 | ± 0.2 | 8260 y |
| Puzzichellu | PUZ-F | 16.8 | 7.11 | 8.06 | −22.00 | 55.60 | ± 0.2 | 4720 y |
| δ34S | δ18O | ||||
|---|---|---|---|---|---|
| Sampling Point | Sulphate | Sulphide | Sulphate * | Water * | |
| Sample ID | ‰ VS. V-CDT | ‰ VS. V-CDT | ‰ VS. SMOW | ‰ VS. SMOW | |
| Puzzichellu | CAM-F | - | 5.6 | - | - |
| PUZ-F | 14.8 | −27.7 | 13.05 | −6.62 | |
| QUAR-G | 8.9 | - | 10.22 | −6.77 | |
| Vadina | VAD | 5.0 | - | 3.93 | −6.62 |
| Pietrapola | P-MUR3 | 14.1 | 0.1 | 6.33 | −8.66 |
| P-LUC | 14.9 | - | 7.11 | −8.69 | |
| P-SOA | 16.1 | 0.6 | 7.24 | −8.80 | |
| Travu | VIGN | 19.8 | - | 1.59 | −8.23 |
| Cold Waters | Thermal Waters | ||||||||
|---|---|---|---|---|---|---|---|---|---|
| Puzzichellu | Vadina | Travu | Pietrapola | ||||||
| Sample ID | QUAR-G | PUZ-F | VAD | VIGN | P-MUR3 | P-LUC | P-SOA | ||
| Isotope values | 18O-SO4 | (‰) | 10.22 | 13.05 | 3.93 | 1.59 | 6.33 | 7.11 | 7.24 |
| 18O-H2O | (‰) | −6.77 | −6.62 | −6.16 | −8.23 | −8.66 | −8.69 | −8.80 | |
| Geochemical Geothermometry calculation | Giggenbach (1988) [54] | Na-K | - | - | - | 160 | 200 | 200 | 200 |
| K-Mg | 100 | 100 | 100 | 150 | - | - | - | ||
| Isotope Geothermometry calculation | Lloyd (1968) [85] | T (°C) | 106 | 86 | 182 | 186 | 124 | 116 | 114 |
| Mizutani and Rafter (1969) [77] | T (°C) | 97 | 75 | 177 | 181 | 115 | 107 | 105 | |
| Boschetti (2013) [76] | Empirical T (°C) | 53 | 35 | 117 | 120 | 68 | 61 | 59 | |
| Theorical T (°C) | 58 | 42 | 118 | 121 | 72 | 66 | 65 | ||
| Depth assessment | Giggenbach (1988) [54] | Na-K depth (km) | - | - | - | 4.8 | 6.1 | 6.1 | 6.1 |
| K-Mg depth (km) | 2.8 | 2.8 | 2.8 | 4.5 | - | - | - | ||
| Lloyd (1968) [85] | (km) | 3.0 | 2.3 | 5.5 | 5.7 | 3.6 | 3.3 | 3.3 | |
| Mizutani and Rafter (1969) [77] | (km) | 2.7 | 2.0 | 5.4 | 5.5 | 3.3 | 3.0 | 3.0 | |
| Boschetti (2013) [76] | Empirical depth (km) | 1.2 | 0.6 | 3.4 | 3.5 | 1.7 | 1.5 | 1.4 | |
| Theorical depth (km) | 1.4 | 0.9 | 3.4 | 3.5 | 1.9 | 1.7 | 1.6 | ||
Publisher’s Note: MDPI stays neutral with regard to jurisdictional claims in published maps and institutional affiliations. |
© 2021 by the authors. Licensee MDPI, Basel, Switzerland. This article is an open access article distributed under the terms and conditions of the Creative Commons Attribution (CC BY) license (https://creativecommons.org/licenses/by/4.0/).
Share and Cite
Dupuy, M.; Garel, E.; Huneau, F.; Santoni, S.; Di Rosa, M.; Mattei, A. Geochemical and Isotope Characterisation of Thermo-Mineral Springs of Corsica Island: From Geological Complexity to Groundwater Singularity. Water 2021, 13, 2413. https://doi.org/10.3390/w13172413
Dupuy M, Garel E, Huneau F, Santoni S, Di Rosa M, Mattei A. Geochemical and Isotope Characterisation of Thermo-Mineral Springs of Corsica Island: From Geological Complexity to Groundwater Singularity. Water. 2021; 13(17):2413. https://doi.org/10.3390/w13172413
Chicago/Turabian StyleDupuy, Margaux, Emilie Garel, Frederic Huneau, Sebastien Santoni, Maria Di Rosa, and Alexandra Mattei. 2021. "Geochemical and Isotope Characterisation of Thermo-Mineral Springs of Corsica Island: From Geological Complexity to Groundwater Singularity" Water 13, no. 17: 2413. https://doi.org/10.3390/w13172413