
Analysis and Model of River Basin Sustainable Management by SWOT and AHP Methods


1
Faculty of Mining, Ecology, Institute of Earth Resources, Process Control and Geotechnologies, Technical University of Košice, Letná 9, 042 00 Košice, Slovakia
2
Energy Cluster of Prešov Region, Levočská 12, 080 01 Prešov, Slovakia
*
Author to whom correspondence should be addressed.
Water 2021, 13(17), 2427; https://doi.org/10.3390/w13172427
Submission received: 5 August 2021
/
Revised: 28 August 2021
/
Accepted: 31 August 2021
/
Published: 3 September 2021
(This article belongs to the Special Issue Anthropogenic and Geoenvironmental Impacts on the Hydrosphere: Diagnosis, Monitoring, Assessment, and Sustainable Management)
Abstract
:The sustainable management of river basins is a comprehensive problem involving not only environmental quality but also socio-economic aspects. The primary objective of the study is to propose a sustainable management model of a river basin based on a clear identification of the good water quality in the river basin applicable for any river basin. The proposal is based on a monitoring of the quality of surface water in the basin, a quantitative and qualitative analysis of pollution, a questionnaire survey on the sewer systems and wastewater treatment in the basin and the diffuse sources of water pollution. For a better outline, a case study of Hornád river basin, Slovakia, was carried out. Two methodologies were applied: SWOT analysis for identification of indicators and the priorities and AHP analysis for a prioritization of the decisions. These analyses can be carried out for any activity based on identification of indicators and the priorities of the defined indicators to promote sustainable development. Based on the findings and the results of the analyses the model for managing the development of surface water quality in the basin was proposed. Generally applicable principles of sustainable development, accepting legislation in the field of water management, considering the quality of surface water in the basin, the impacts of wastewater discharges into the recipient, the identification and evaluation of positive and negative aspects of surface water quality, and the implementation of the proposed measures and post-implementation monitoring of qualitative development were covered in and by the proposed model.
1. Introduction
Nowadays, surface water and groundwater pollution and the sources of this pollution are studied at the international level due to interstate consequences, however case studies at national level are also not negligible. Water is a special substance in nature that is constantly changing and regenerating. Surface water in watercourses is exposed to pollution by humans, industry, agriculture, transport and the like [1,2]. Water quality is becoming a criterion and its assessment is a requirement for the determination of the water source for different areas of the economy and for households [3,4]; thus, the continuous monitoring of processes leads to the elimination of pollution of surface and groundwater [5,6] and a need for reliable and sustainable water management [7,8]. Recently the water management approach has changed because of intensive climate changes [9,10,11]. Climate change, causing changes in the biogeochemical, physical and chemical parameters of water, results in the degradation of aquatic ecosystem and pressures on ecosystems [12,13,14]. Water management comprises many complex and multidisciplinary internal and external factors involving various stakeholders in the decision-making process [15,16,17]. Water management also includes an economic aspect, but it is not simple to quantify and predict all the parameters, though a study by Chen et al. [18] proved that a simplified causal understanding of prevailing water management choices can be performed. Additionally, in coastal regions, the environmental management plan and the environmental strategies of coastal regions are important measures for integrated management [19]. In the development and management of water resources, the integrated water resources management became a concept for achieving sustainable development [20]. A study based on an analysis of stakeholders involved in the management of a river basin showed that the integrated water resources management is challenging [21]. An innovation in sustainable river basin planning strategies and management faced uncertainties and conflicting interests among experts, while critical zones for implementing policies were identified and prioritized with improving reliability on the model results and optimistic, pessimistic and nominal viewpoints were obtained [22]. A qualitative analysis in the Republic of Ireland revealed several bodies associated with water management including local and international environmental organizations and local authorities [23].
The novelty of this research is a combined use of SWOT (Strengths, Weaknesses, Opportunities, Threats) and Analytic Hierarchy Process (AHP) analyses for evaluation of sustainable management of a river basin and proposal of sustainable management model of a river basin applicable not only for the case study of Hornád river basin, Slovakia. There have been published several articles that combine the SWOT and AHP methods in the field of water management, as discussed below, but only a few were applied in the field of river basin sustainable management [21,22], but under different circumstances. Both the methods were used in an analysis of coastal environmental management plan, the vision, mission, and objective of the environmental management development of an Iranian province coastline was determined by SWOT and the prioritization of the strategies was done by AHP [19]. SWOT and AHP were also combined to address the Kazakh water resource management problems [15]. In identification and ranking of the factors affecting the functioning of the integrated water resources management in Mozambique, the key factors affecting its implementation were determined by SWOT and obtaining the relative importance of each factor was done by AHP [20]. In a trans-regional river basin in Greece, significant as a natural resource and ecosystem due to exploitation for different purposes (domestic supply, irrigation, energy, recreation, etc.), the factors were ranked by SWOT analysis combined with AHP [21]. Within a regional hydro-system in Vojvodina Province, Serbia, in order to select the optimum reconstruction of a water intake, the factors of structure, the objects and pumping facilities, management policies, technical standards and rules of operation were divided into positive and negative by SWOT and were compared with an analogous list prepared by an expert using the AHP [24]. A hybridized SWOT model with a modified traditional fuzzy AHP for a better assessment of the sustainability was implemented in a model for sustainable management of a river basin, demonstrated on the Ganges River basin, India [22]. A SWOT-AHP analysis was introduced for water governance institutions and organizations in Bangladesh [25].
The combination of SWOT and AHP methods is also used in other ecological and environmental applications. In an urban development policy framework for sustainable planning in developing cities [26] and in a strategic plan for water resource management [27], both case studies of Delhi, India, SWOT and AHP were also combined. In manufacturing industry and environmental development status of manufacturing industry in Pearl River Delta (China), the finalization analysis of manufacturing industry was determined by SWOT and the weight of SWOT analysis factors was determined by AHP [28]. Geoconservation and geotourism development strategies for geomorphosite in West Bengal, India, protecting it from human activities and promoting local tourism in a sustainable way were studied by SWOT and AHP was used for prioritization of strategies to determine the most suitable strategy [29]. In ecotourism development assessment in a national park in China the SWOT analysis was used for evaluation of 13 factors for the development and the AHP method for weighting of the 13 factors [30]. The tourism in Gornje Međimurje, Croatia, was assessed in a way that the values of SWOT factor coefficients were used as criteria by AHP, but with a different evaluation procedure [31]. Factors of tourism in Turkey were analyzed by SWOT for internal and external environments and the tourism strategies were evaluated and prioritized by AHP [32]. The combination of the methods was also used in the revitalization of fishing village tourism [33], in the decarbonization of energy systems [34], in agriculture for sustainable development in Ghana [35], in the use of biomass in agricultural areas as an alternative in rural areas of China to reduce the consumption of coal [36], in the prioritization of available energy alternative technologies to support low-carbon energy technology policy [37], in a sustainable development strategy for the Uzbekistan textile industry [38], in assessment of the hydrocarbons sector in Cyprus [39], in analysis of dairy farming for critical factors in supply chain [40], in assessing competitiveness of Indonesian agricultural industry in nanotechnology [41], etc.
The paper deals with the interactions of river basin management determined by the sufficiency, equity and sustainability of the fundamental pillars—social, economic and environmental—in the context of the principles of sustainable development. It is for these reasons that the proposed model of the surface water quality development management in the river basin is based on the explicit recognition of the indicators determining the sustainable development. The objective in the design of the evaluation of the surface water quality is a clear identification of the good water quality in the river basin. It is achieved by assessing real or predicted impacts on water qualitive parameters. The originality of the research also lies in inclusion of not only the quality of surface water in the basin but also a quantitative analysis on the discharge of pollution, the results of a questionnaire survey on the sewer systems connected to wastewater treatment plants (WWTPs) infrastructure releasing pollution into the basin and the diffuse sources of water pollution.
2. Materials and Methods
The basis of any monitoring is observation, measurement and evaluation. The monitoring of surface water is primarily the observation and evaluation of the surface level and flow regime of surface water using a technological line in the network of surface water monitoring stations, with regard to limiting flows. The quality of surface water is assessed at monitoring points at certain periods determined by the purpose of monitoring and at any point situated on the stream.
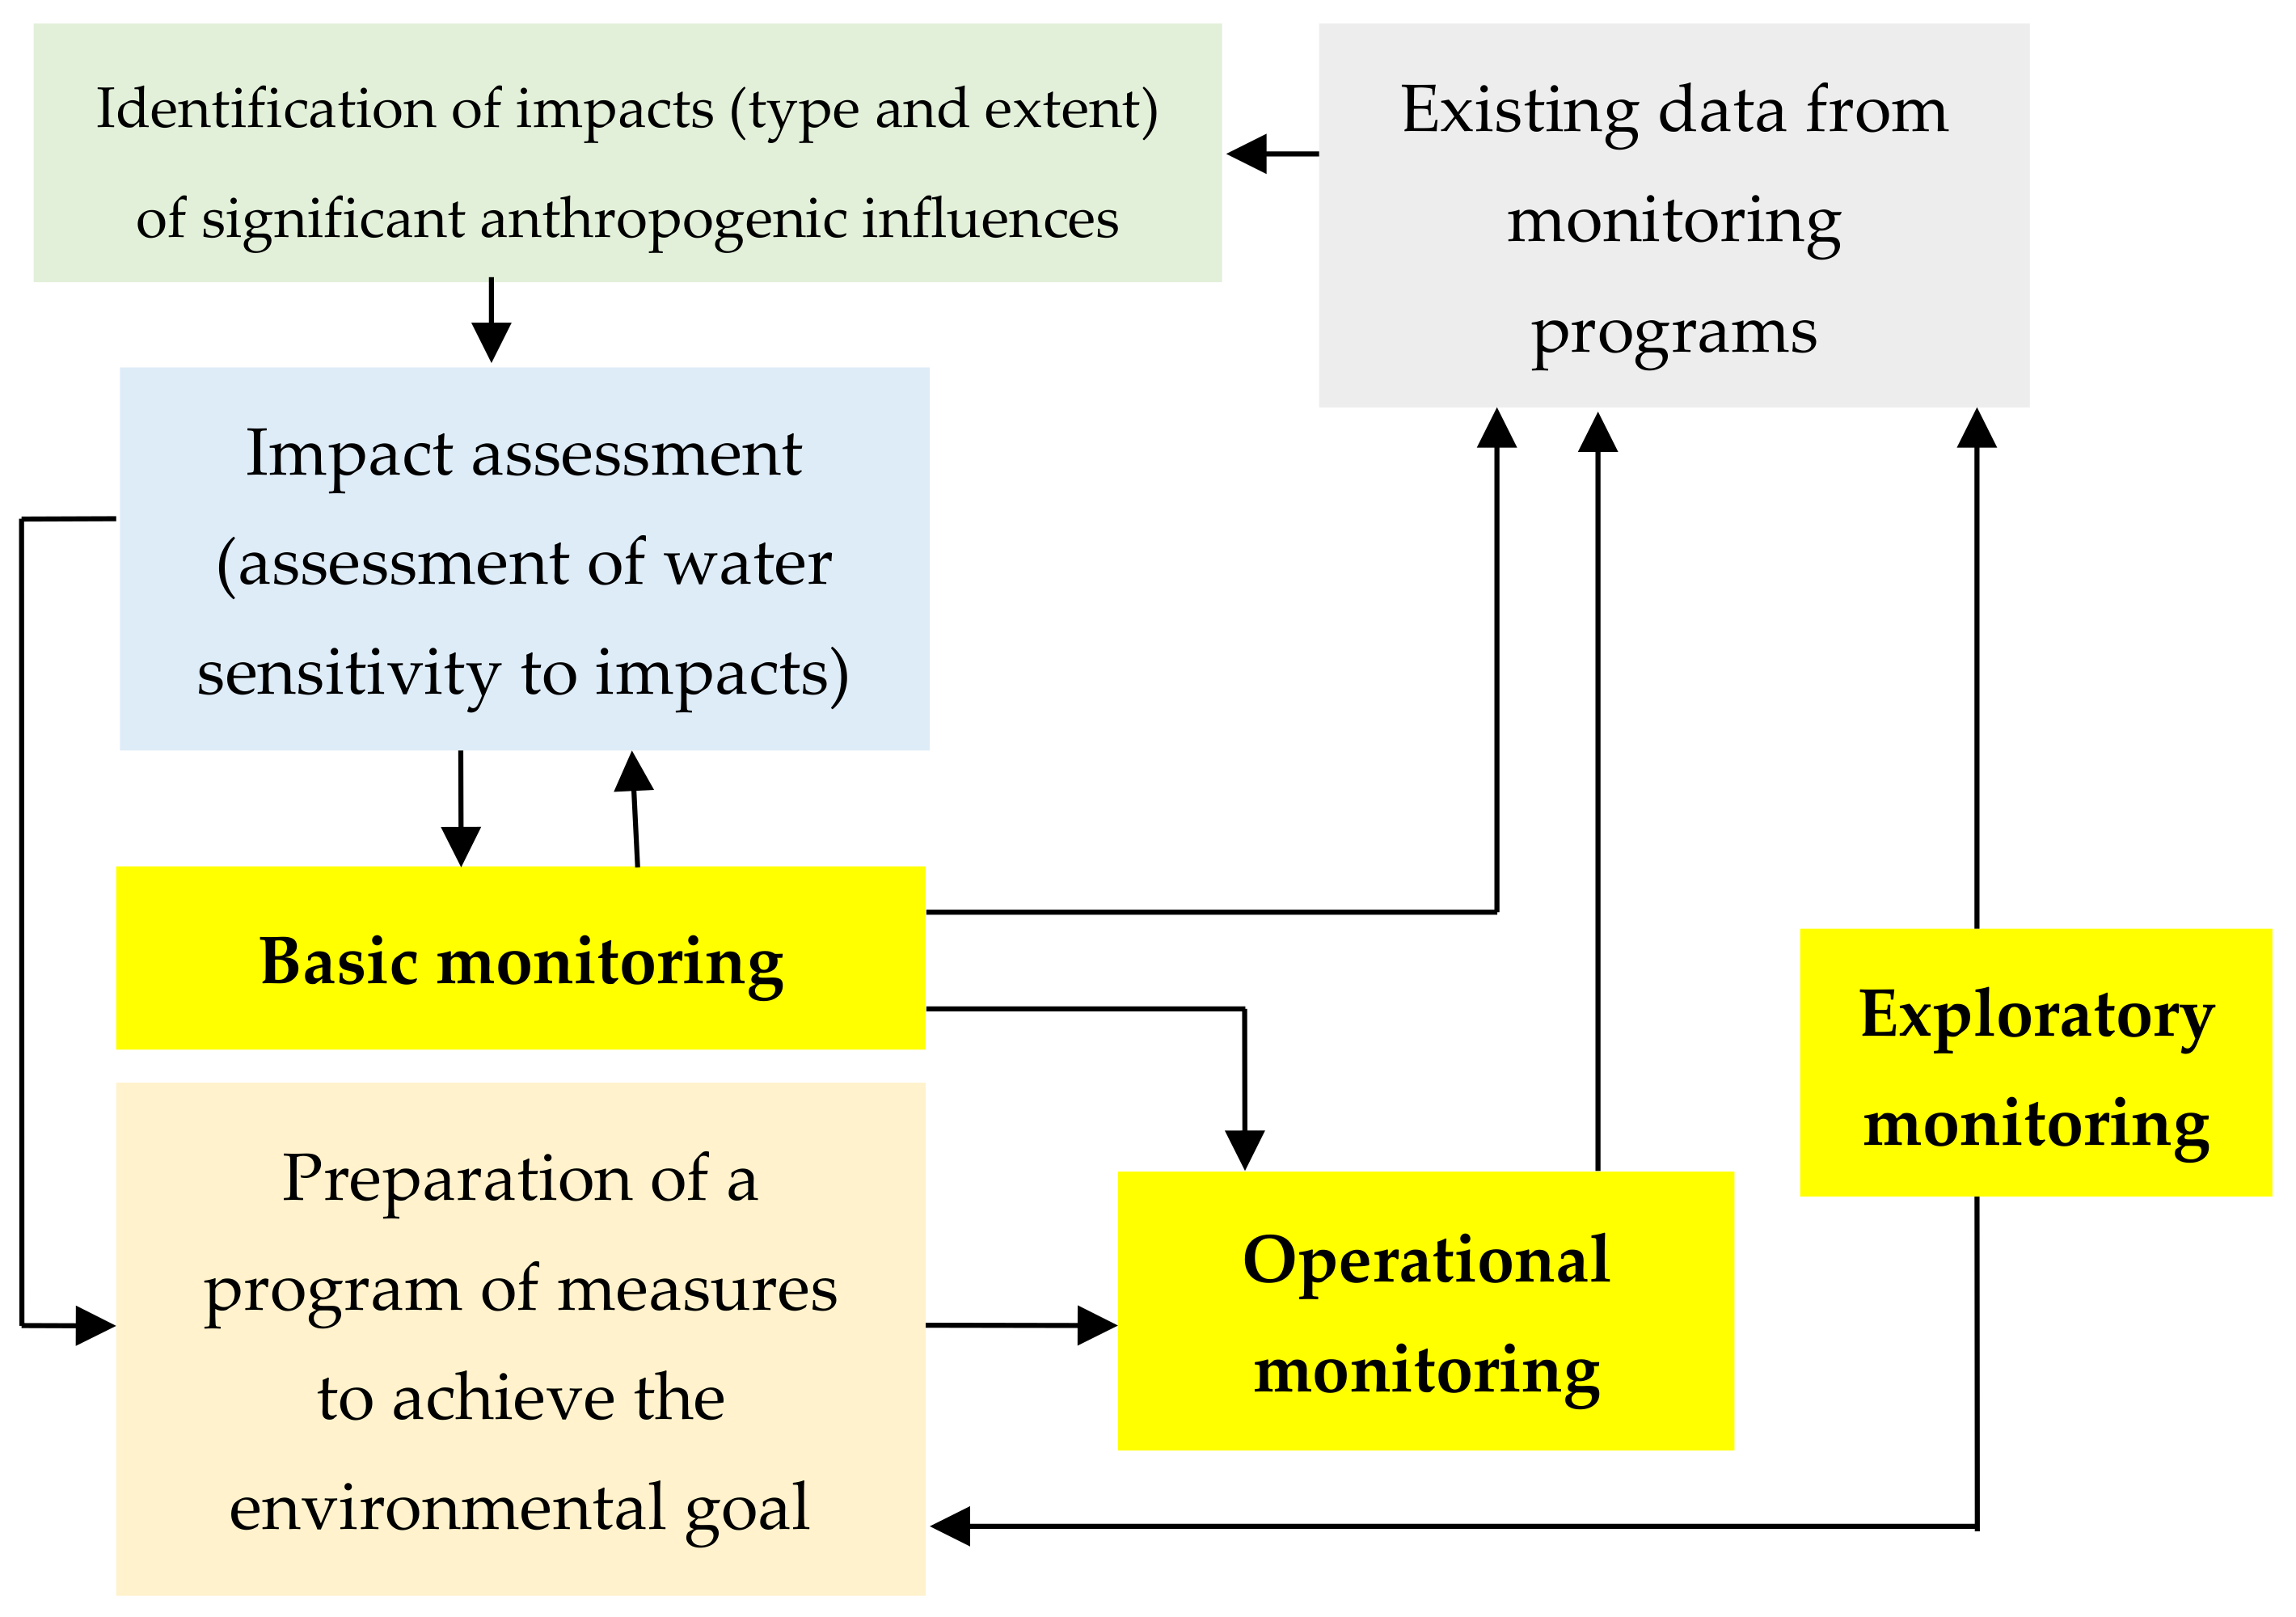
Three types of monitoring are recognized for the assessment of surface water quality presented in Figure 1 [42].
Basic monitoring:
- Supplementing and confirming the procedure for assessing the anthropogenic impacts on the status of surface waters;
- Effective and efficient design of future monitoring programs;
- Assessment of long-term changes in natural conditions;
- Evaluation of long-term changes resulting from anthropogenic activities.
- Operational monitoring:
- Determining the status of water bodies with a risk of non-compliance with environmental objectives;
- Assessment of changes in the status of these bodies resulting from the actions programs.
- Exploratory monitoring:
- Investigation of unknown causes of any exceedances in the parameters monitored in the aquatic environment;
- Investigation of the causes of probable non-fulfilment of environmental objectives in the event that operational monitoring has not yet started, in order to determine their causes;
- Determining the extent and consequences of emergency pollution.
For the evaluation of the water quality in the Hornád river basin a case study was carried out. In this study two methodologies were applied: SWOT analysis based on identification of indicators and the priorities and AHP analysis, a multi-criteria decision-making method. These analyses can be carried out for any activity based on identification of indicators and the priorities of the defined indicators to promote sustainable development. Combined methods of SWOT and AHP can be used in increasing and improving the base of strategic planning processes and provide not only a support in decision-making but also a scheme for strategic decision support in various situations [43]. Evidence of the wide use of these analyses is the amount of research using these methods in ecology as documented in the Introduction section.
2.1. Questionnaire Survey
A questionnaire survey was carried out in municipalities, by contacting the mayor’s office, with the sewer systems connected to WWTPs infrastructure releasing pollution into the Hornád river basin. The survey was realized in 31 municipalities with 4 questions:
- Does the municipality dispose of a WWTP?
- How long has it been in operation?
- Is the WWTP in operation fully, partially or broken?
- What percentage of the inhabitants are connected to the WWTP?
- The results of the questionnaire survey were also included in the decision-making.
2.2. SWOT Analysis
The SWOT analysis in the field of ecology implementing quantitative methods trying to remove subjectivity in the evaluation of individual strengths, weaknesses, opportunities and threats was used by White [44].
- Identification of factors—definition of the set of factors to be considered for each of the elements—strength, weakness, opportunity, threat—i ϵ S, W, O, T;
- Construction of pairwise comparison matrix for comparing the relative importance of factors within each set of factors regarding the objective and obtaining the relative importance weight vectors for each factor (WS, WW, WO, WT);
- Construction of pairwise comparison matrix for comparing the relative importance of SWOT sets and obtaining relative importance weight vector WG;
- Evaluation vector E by evaluating for each S, W, O, T factor with linguistic variable ei = (ei1, ei2, ei3, ei4);
- Evaluating the individual indicators in this way, partial products of rows according to Equation (1) were created:Si = ΠSij; j = 1, 2, 3, …, f,F—number of factors,Sij—single factor,
- The interactions of indicatorsRi = Si1/f,
The factors were selected depending on the partial results of the quantitative analysis on the discharge of pollution, the results of the questionnaire survey on the sewer systems connected to WWTPs infrastructure releasing pollution into the basin, the quality of surface water in the basin, the diffuse sources of water pollution in the basin, publications and manuals of Slovak and foreign authors, regulations of the legislation, Slovak statistical databases, expert opinions, etc.
As the method is associated with a comparison of all defined indicators of the same order with the evaluation of factors (Table 1), the symmetrical matrix, with the values of 1 plotted on the diagonal of the matrix—accepting the equivalence of the same indicators—is built with an identification of the pairwise comparisons of the individual indicators [44].
Based on these calculations, the sum of Ri was counted, quantifying the final value of individual weights αi reflecting the mutual interactions of comparative indicators. Points from the key rate < 1,5 > were assigned to the individual criteria according to the evaluation in Table 2.
The conjunctions of the weights αi and assigned points of individual factors were calculated and summed as the vectors of strengths and weaknesses of the internal environment, and opportunities and threats to the external environment. Subsequently, based on the vector sum, an effective strategy was identified.
2.3. AHP Analysis
Another method evaluating and interpreting the results of the assessment of ecological factors used is AHP, based on systematic and quantitative analysis of predefined indicators. Expert knowledge can also be involved, despite subjectivity, in ecological modelling and planning, in case of uncertainty [44]. The analysis is based on an identification of indicators using the so-called Saaty’s matrix with a numerical identification of the priorities of the defined indicators. The data on the research problem were gathered and decomposed into decision-making indicators. An expert team comprising scientists, representatives of water companies, self-government were involved in the process. The partial results of the quantitative analysis on the discharge of pollution, the results of the questionnaire survey on the sewer systems connected to WWTPs infrastructure releasing pollution into the basin, the quality of surface water in the basin, the diffuse sources of water pollution in the basin, and also the results of the SWOT analysis were considered. The synergistic interactions of the indicators by numerical expression of their prioritization through their weights—αi were quantified. The numerical values of the weights were set to all the indicators with sum of all the weights equal to 1. The values of weights were put into the Saaty’s matrix with dimensions of m × n, where m = 1…i and n = 1…j, the number of rows and columns, respectively, in respect to the condition of m = n, and quantified. The symmetrical matrix represents the strength of the indicators. This fact conforms that the method is based on an interactive comparison of all the defined indicators of the same order with the evaluation in Table 1 [47,48,49]. On the diagonal of the matrix, the values of 1 were plotted as the equivalence of the same indicators was accepted. The pairwise relations of the individual indicators were defined and partial products of rows were created according to the relation (1). A row of the created matrix quantified the Ri value for each criterion according to the formula (2). ΣRi was calculated based on the calculations quantifying the final value of individual weights reflecting the mutual interactions of comparative indicators.
The AHP is a mathematical method for multi-criteria decision-making developed by Saaty [50,51]. AHP was used for selection of indicators to create a model of surface water quality development management in the river basin due to its properties including [48,52,53]:
- adaptability, clarity, logic and brevity;
- splitting of a complicated problem into smaller ones;
- assessment of problem by professionals affecting the decision-making criteria.
2.4. The Case Study of Hornád River Basin in Eastern Part of Slovakia
Hornád River raises about 4 km west of the village Vikartovce at an altitude of 1050 m above the sea level. It is the fifth longest Slovak river. After a short segment of a typical mountain terrain Hornád River flows into a wider basin with meadows and fields. The flow heads through melaphyre, Paleogene shales, sandstones, and also flows through the limestone bedrock of the Slovak Paradise National Park. Then the River flows through the narrow valley of Čierna Hora and Košice Basin. Hornád River leaves the territory of Slovakia at the state border at an altitude of 160 m above the sea level. The length of the river is 286 km at the territory of Slovakia and 193 km from the state border with Hungary to the estuary. The river forms the state border with Hungary in the length of 10.5 km [54]. A map of the basin can be found at publicly available sources [55].
Industry, agriculture, population growth and unstable improvement of living standards accustomed by production growth seriously influence the pollution of water sources. Thus, the quality of water sources becomes important due to the use of natural sources and their pollution. A serious threat to water quality is industry, especially organic—oil, petroleum products and inorganic substances—lead, mercury, arsenic—and radioactive substances. Other source of pollution is agriculture—industrial fertilizers, pesticides, wastewater, and a major threat is the municipalities with a huge production of liquid and solid waste as well as the transportation and air pollutants resulting from it.
The basic monitoring is carried out in a sufficient number of rivers to assess the overall status of surface water basins. For the surface water quality assessment in the Hornád river basin three sampling points were selected—at the beginning of the watercourse in the Hranovnica municipality, in the middle of the watercourse in the Malá Lodina municipality and at the end of the watercourse where the river leaves the territory of Slovakia, near Hidasnémeti municipality in Hungary. Based on the monitoring data parameters for assessing the quality of surface water were surveyed in these sampling points. Each indicator of water quality is classified separately. The data were measured and recorded by Slovak Water Management Company. The results of the monitoring were analyzed during 1993–2020 and are presented below.
The water from the Hornád river basin is mainly used in the industrial sector. The water taken from the Hornád river basin is used for:
- Industrial use—71.8%;
- Energy production—14.1%;
- Households—13.5%;
- Agriculture—only 0.6%.
The ecological status of water in the Hornád river basin, during the monitored period, concerning the indicators in the values in most of the examined parameters improved and a positive trend with a declining and a steady state was observed [56,57].
It is important for the self-cleaning capacity of the river to understand the amount of soluble oxygen in the water. The soluble oxygen content is a function of temperature, organic matter content and photosynthesis intensity [58]. In summer the dissolved oxygen content is in the range of 8–12 mg·L−1, in winter about 6–8 mg·L−1. The oxygen content also fluctuates during the day because algae produce oxygen during the day. [59]. The limits of this indicator were not exceeded in any time or sampling site. As to the progress of the values of this indicator in the future, steady states that do not exceed the limit value range can be expected.
These results served as a basis for economic analyses and preparation of a model of sustainable management of a river basin.
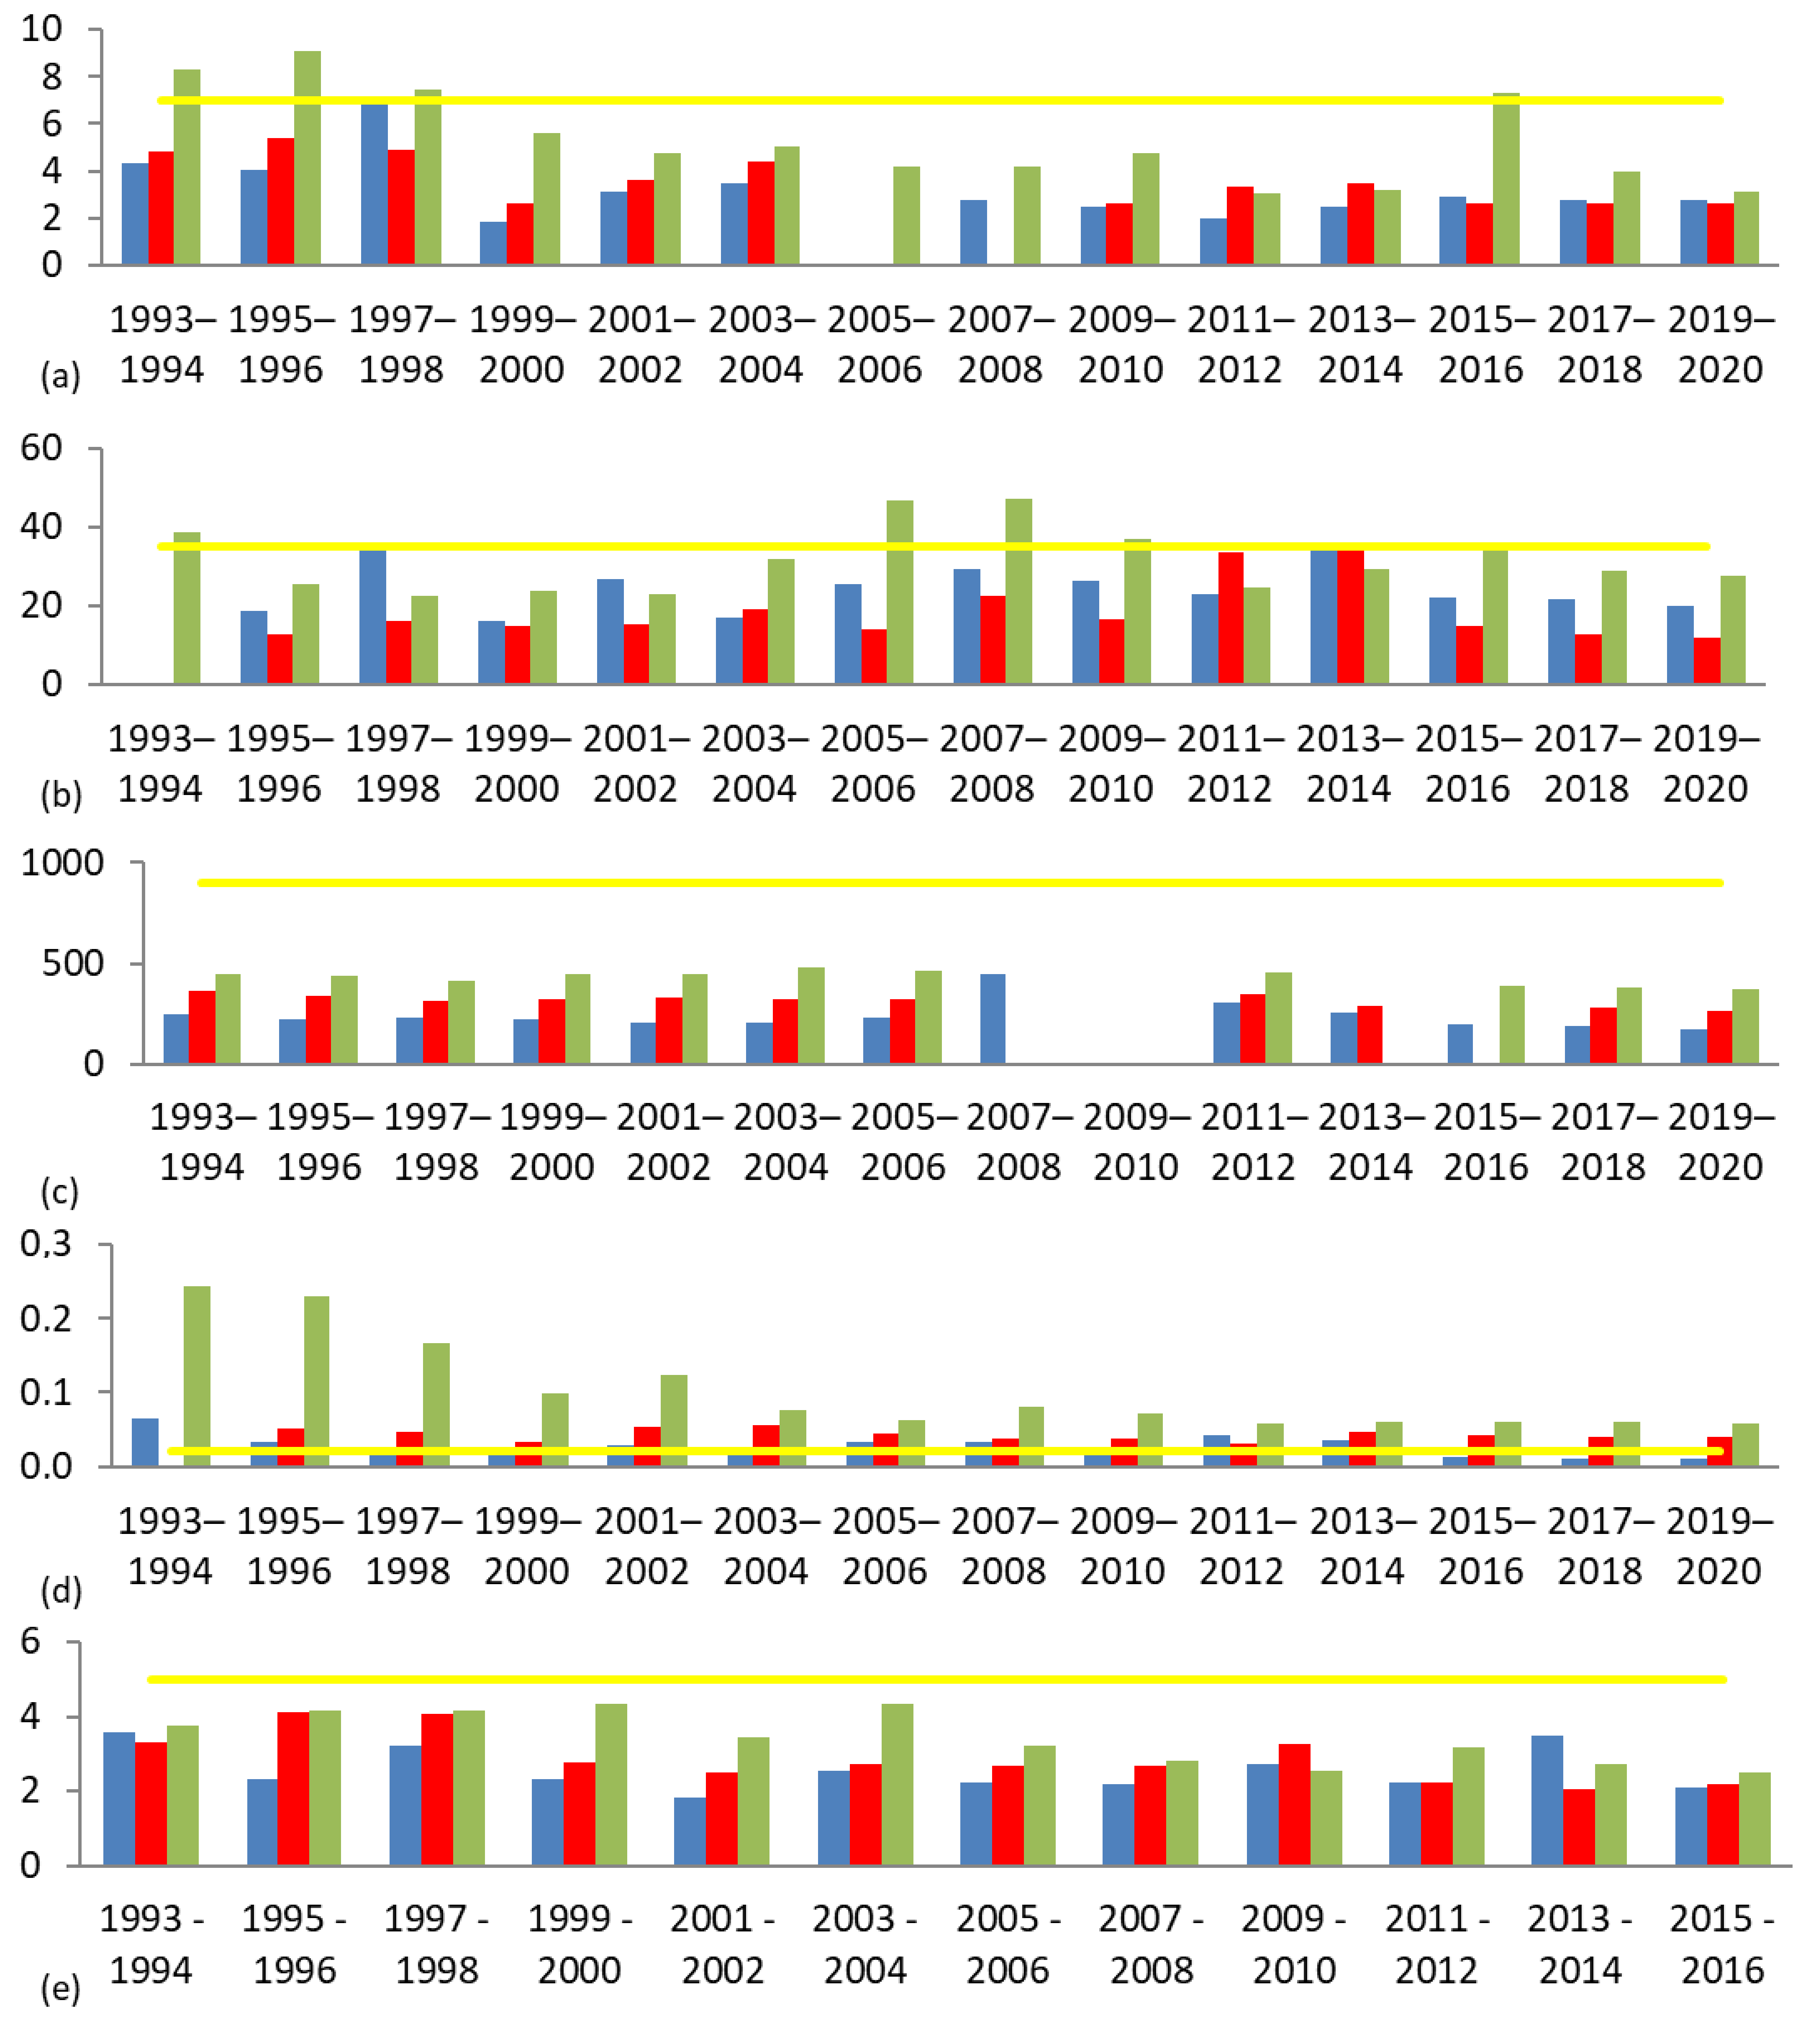
In the evaluation of the results of analyses of biochemical oxygen demand (BOD) with suppression of nitrification the limit value was 7 mg·L−1 during the monitored period. The limits were exceeded in the years 1993–1994 and 1997–1998. The maximum value exceeding the limit was a value of 9.16 mg·L−1 in the biennium 1995–1996. The BOD is declining. The limits were exceeded at the sampling sites Hranovnica and Hidasnémeti by 18.0 mg·L−1 in 1995. As to the progress of the values of this indicator in the future, steady to declining conditions that do not exceed the limit value can be expected (Figure 2a).
In the evaluation of the results of analyses of chemical oxygen demand (COD) the limit value was 35 mg·L−1 during the monitored period. The limits were slightly exceeded in the years 1993–1994 and 2009–2010. A significant exceedance occurred in the years 2005–2006, and an exceedance with an extreme value of 47.45 mg·L−1 occurred in the years 2007–2008. Maximum exceedance with an extreme value of 129.0 mg·L−1 was reached in 1995. The exceedances most frequently occurred at the sampling site Hidasnémeti. As to the progress of the values of this indicator in the future steady state with no exceedance or slight exceeding of the limit value can be expected. In the evaluation of the results of analyses of COD the limit value was from 6 to 8.5. The limits of this indicator were not exceeded in any time or sampling site. As to the progress of the values of this indicator in the future, steady states that do not exceed the limit value range can be expected (Figure 2b).
In the evaluation of the results of the analysis of the indicator soluble substances, dried at 105 °C the limit value was 900 mg·L−1. The limits of this indicator were not exceeded in any time or sampling site. As to the progress of the values of this indicator in the future steady states that do not exceed the limit value range can be expected (Figure 2c).
In the evaluation of the results of the analysis of the indicator nitrite nitrogen (N-NO2) the limit value was 0.02 mg·L−1. The limits were slightly exceeded every year. Significant exceedances occurred in the years 1995–1996 and 1997–1998, and an exceedance with an extreme value of 0.24 mg·L−1 was reached in the biennium 1993–1994. Maximum exceedance with an extreme value of 0.60 mg·L−1 was reached in 1993. The limits were extremely exceeded at the sampling site Hidasnémeti. The limits were regularly exceeded at the sampling sites Hranovnica and Malá Lodina. In view of the development of the values of this indicator in the future, steady states that slightly exceed the limit value, and occasional significant exceedance, can be expected (Figure 2d).
In the evaluation of the results of the analysis of the indicator nitrate nitrogen (N-NO3) the limit value was 5.0 mg·L−1. The limits of this indicator were not exceeded in any biennium or sampling site. As to the progress of the values of this indicator in the future steady states of not exceeding the limit value range can be expected (Figure 2e).
In the evaluation of the results of the analysis of the indicator total phosphorus the limit value was 0.4 mg·L−1. Slight exceedances of the limit occurred in the years 1995–1996 and 2001–2002 and significant exceedance occurred in the years 2003–2004, and an exceedance with an extreme value of 0.72 mg·L−1 was reached in the biennium 1993–1994. Maximum exceedance with an extreme value of 0.97 mg·L−1 was reached in 1993. The limits were only exceeded at the sampling site Hidasnémeti. In view of the development of the values of this indicator in the future steady state with of not exceeding the limit or slight and occasional exceeding of the limit value (Figure 2f).
In the evaluation of the results of the analysis of the indicator aluminum the limit value was 200 μg·L−1. The limits were exceeded in the years 2005–2006. An exceedance with an extreme value of 2340 μg·L−1 occurred in the years 2003–2004. The limits were exceeded at the sampling site Hidasnémeti. In view of the development of the values of this indicator in the future, a steady state that slightly exceeds the limit value can be expected (Figure 2g).
In the evaluation of the results of the analysis of the indicator arsenic the limit value was 7.5 μg·L−1. The limits were slightly exceeded in the years 1993–1994, 1995–1996, 1997–1998, 1999–2000 and 2001–2002. A significant exceedance occurred in the years 1999–2000, and an exceedance with an extreme value of 77.7 μg·L−1 occurred in the years 1999–2000. Maximum exceedance with an extreme value of 77.7 μg·L−1 was reached in the year 1999. The limits were extremely exceeded at the sampling sites Hranovnica, Malá Lodina, and Hidasnémeti. In view of the development of the values of this indicator in the future, there was a steady state that did not exceed the limit value or slightly exceed the limit value (Figure 2h).
In the evaluation of the results of the analysis of the indicator zinc the limit value was 52 mg·L−1. The limits were slightly exceeded almost each year. A significant exceedance occurred in the years 1995–1996, and an exceedance with an extreme value of 285.45 mg·L−1 occurred in the year 1995. Maximum exceedance with an extreme value of 470.1 mg·L−1 was reached in the year 1996. The limits were extremely exceeded at the sampling sites Hranovnica, Malá Lodina, and Hidasnémeti. In view of the development of the values of this indicator in the future, the steady state did not exceed the limit value or slightly exceed the limit value (Figure 2i).
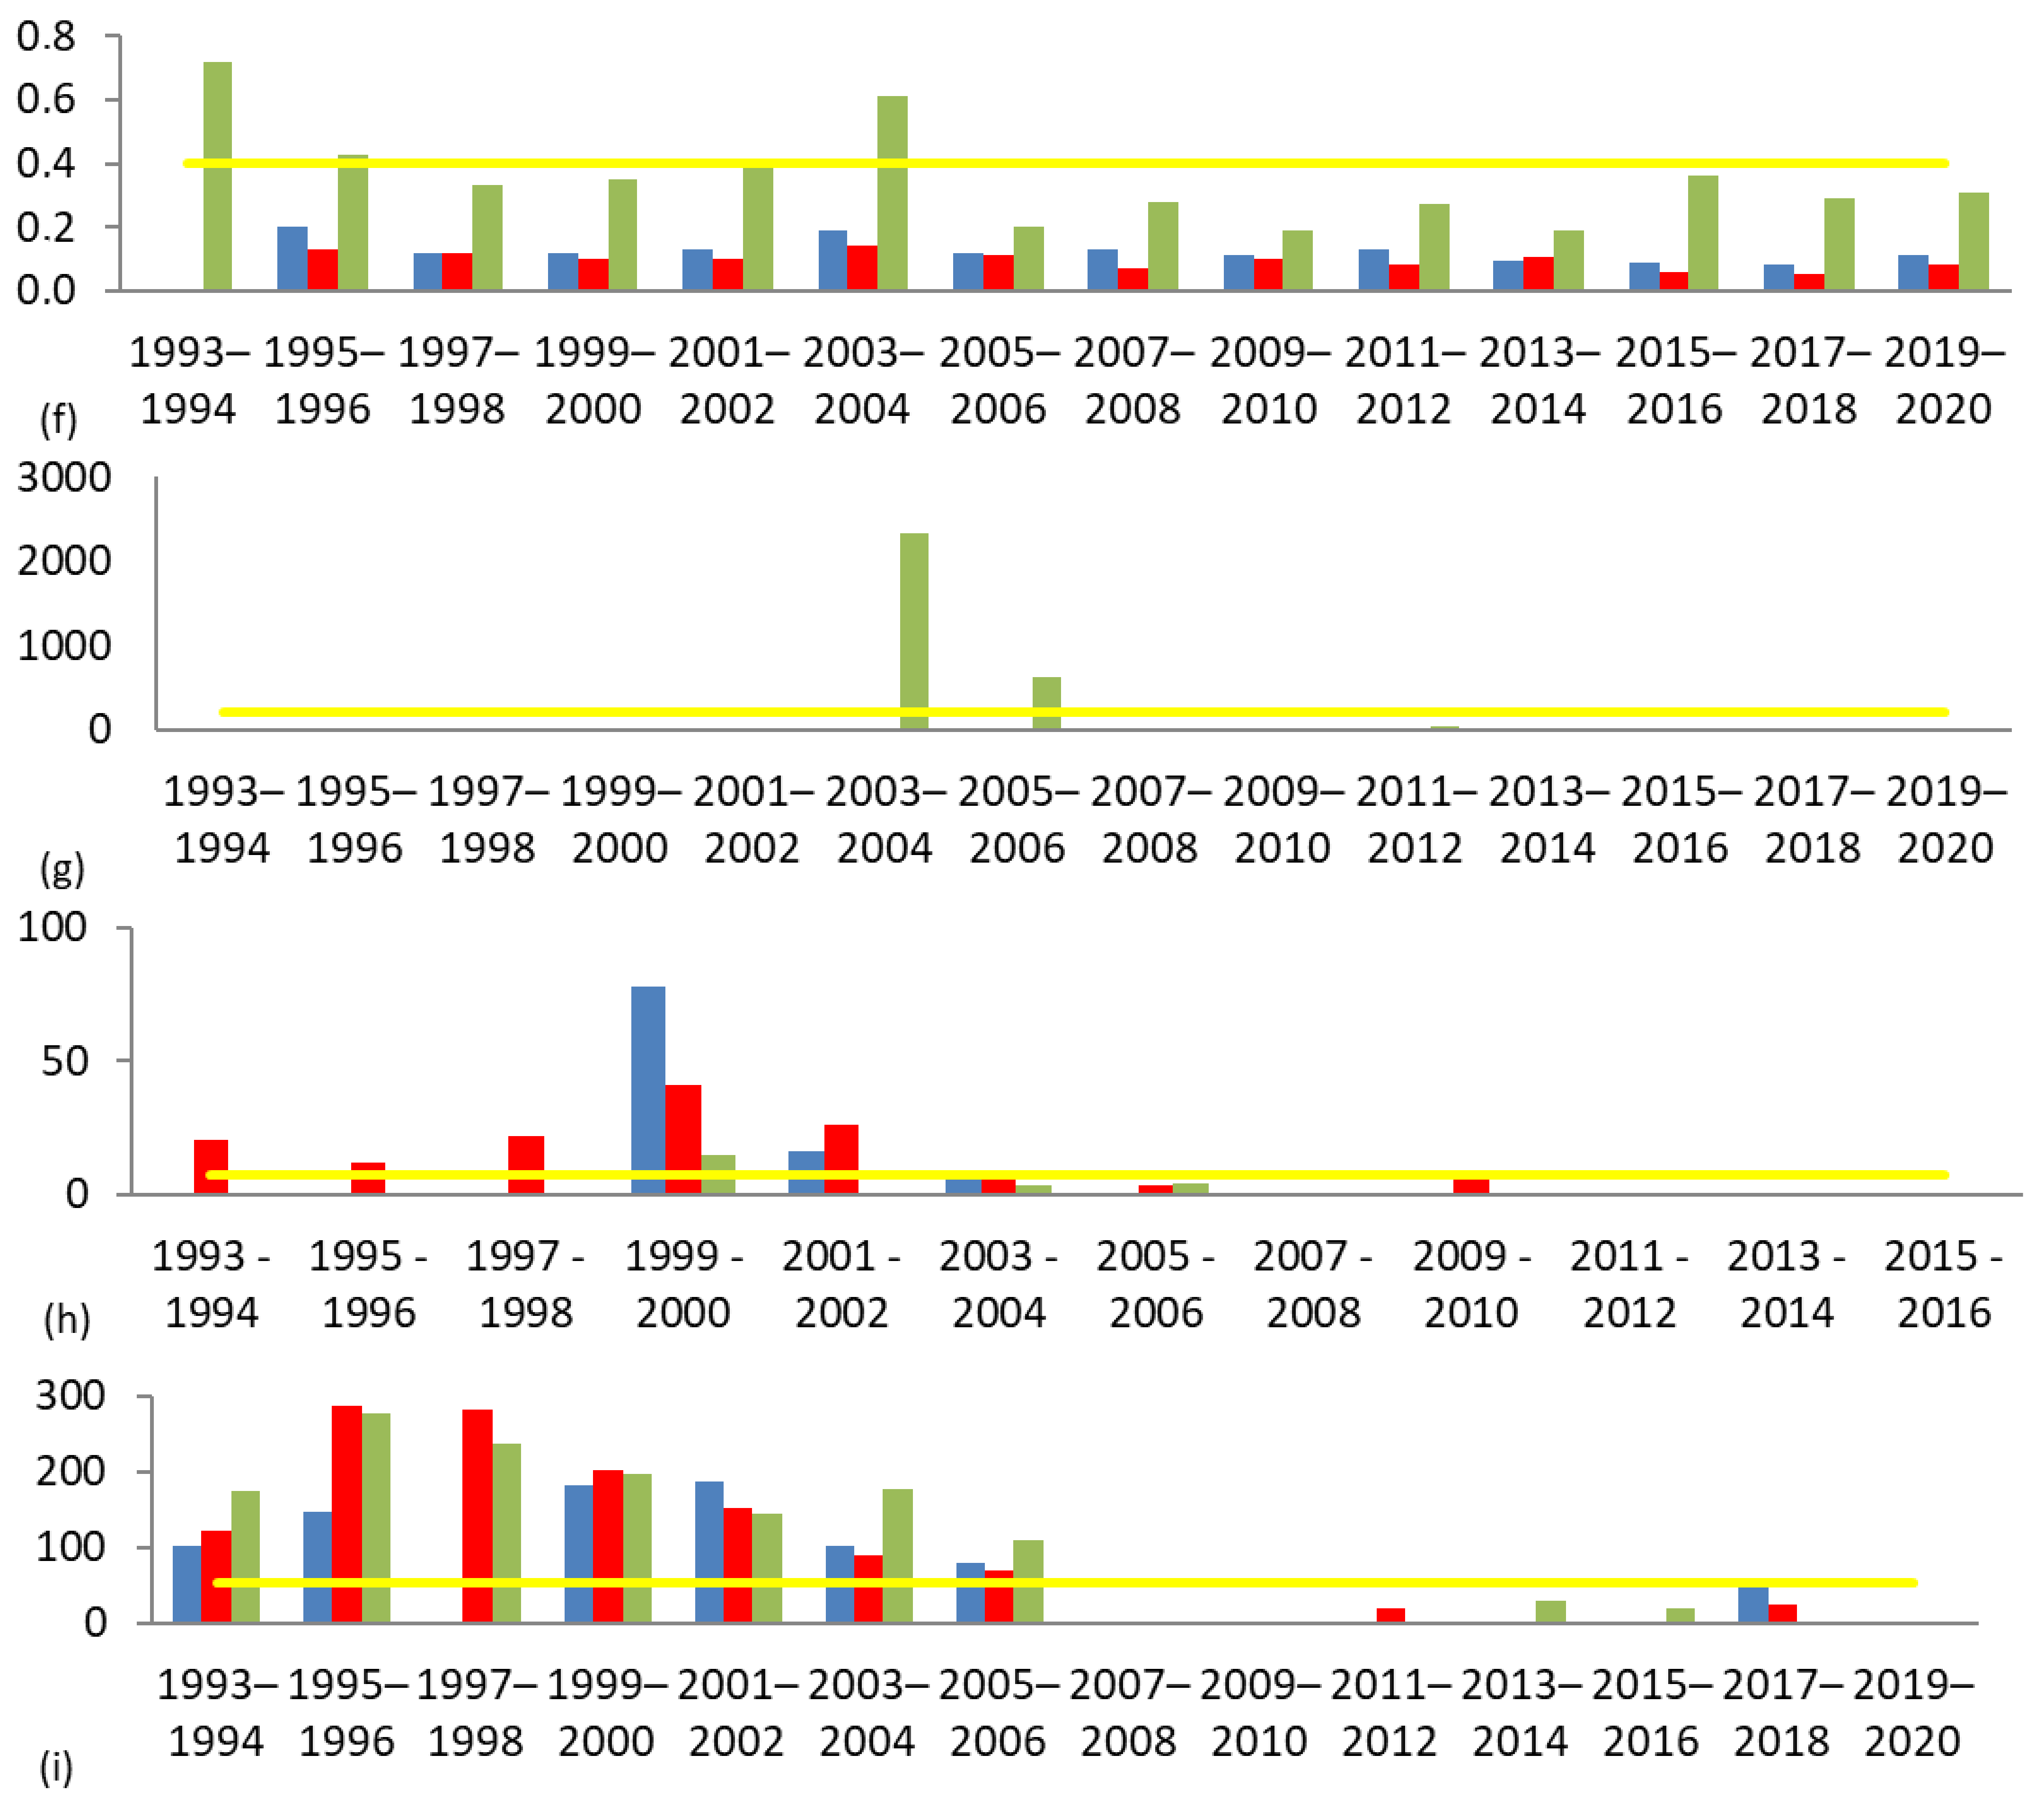
In the evaluation of the results of the analysis of the indicator Coliform bacteria the limit value was 100 CFU·mL−1. The limits were slightly exceeded every year. A significant exceedance occurred in the years 1995–1996 and 1997–1998, and an exceedance with an extreme value of 32,266.7 CFU·mL−1 was reached in 1997–1998. Maximum exceedance with an extreme value of 50,000 CFU·mL−1 was reached in the year 1998. The limits were extremely exceeded at the sampling sites Hranovnica, Malá Lodina, and Hidasnémeti. In view of the development of the values of this indicator in the future, there was a steady state that slightly exceeded the limit value (Figure 3a).
In the evaluation of the results of the analysis of the indicator thermotolerant Coliform bacteria the limit value was 20 CFU·mL−1. The limits were slightly or significantly exceeded every year. Maximum exceedance with an extreme value of 30,000 CFU·mL−1 was reached in the year 2006. The limits were extremely exceeded at the sampling sites Hranovnica, Malá Lodina, and Hidasnémeti. In view of the development of the values of this indicator in the future, there was a steady state that slightly exceeded the limit value (Figure 3b).
In the evaluation of the results of the analysis of the indicator intestinal enterococci the limit value was 10 CFU·mL−1. The limits were slightly exceeded every year. A significant exceedance occurred in the years 2003–2004 and 2013–2014, and an exceedance with an extreme value of 714 CFU·mL−1 was reached in 2011–2012. Maximum exceedance with an extreme value of 2050 CFU·mL−1 was reached in 2011. The limits were extremely exceeded at the sampling sites Hranovnica and Hidasnémeti. In view of the development of the values of this indicator in the future, there was a steady state that slightly exceeded the limit value (Figure 3c).
In the Hornád river basin there is an industrial plant located in the municipality of Krompachy. The consequences of the activities of the industrial park, especially in the past, are reflected in the increased levels of metals (Cu, Pb, Zn, As and Hg) in the surface water, soil and river sediments of surrounding watercourses [60]. On the border of Krompachy and Slovinky there is a sludge bed with a negative effect on the land and the surrounding environment [61,62]. In the Hornád river basin there is the industrial sludge bed of Halňa with a solid industrial waste landfill containing Pb, As, Cd and liquids containing cyanide are also stored in the amount of 760,000 m3, in addition to municipal solid waste landfill. Groundwater exceeds the limits for Cd, As and Ni [63].
For the monitored period, the maximum levels of parameters were achieved in 1993–1998 and 2003–2010 followed by a decline. The parameters related to the industrial activity were decreasing during the years 1993–1998 and 2003–2010 that most likely was caused by a decrease in industrial production especially in the Krompachy region. The improvement of the indicators mostly included measures for the reduction of plants operation and elimination of the sources of increased values of the indicators. The parameters related to WWTPs were balanced with exceeded limits in the past.
3. Results
3.1. Questionnaire Survey
Based on the results of the questionnaire 87% (27) of the municipalities participated in the survey. Four municipalities (13%) did not return the questionnaire. The questionnaire was carried out in 2018.
According to the information from the questionnaire, the infrastructure of WWTPs and sewerage systems in the municipalities relevant to the area of the Hornád river basin are built and functional in more than half of the municipalities—52% (14 out of 27). From the point of view of the number of inhabitants, the infrastructure of WWTPs is built mainly at the level of larger agglomerations (Spišská Nová Ves, Spišské Vlachy, Krompachy, Košice). For example, the town of Spišská Nová Ves has a WWTP with an age of over 10 years, which underwent reconstruction in 2015–2016, is currently fully functional and its capacity is used by the majority of the population (over 85%). In the town of Spišské Vlachy there is a partially functional WWTP (in operation for more than 10 years), which is used by less than 50% of the population. A similar situation is in the town of Krompachy, where a partially functional WWTP has been in operation for more than 10 years, which is used by more than 50% of the population. The city of Košice has a WWTP operated for about 30 years. The WWTP underwent an intensification in 2008, which ensured its full functionality and the possibility of use by more than 85% of the population.
Some municipalities, such as Vikartovce (fully functional reconstructed WWTP operated for more than 10 years, used by more than 85% of the population), Spišské Bystré and Spišský Štiavnik (fully functional WWTP operated for more than 10 years, used by more than 85% population), Markušovce (fully functional WWTP operated for more than 10 years, used by less than 50% of the population), Kysak (fully functional WWTP operated for less than 10 years, used by less than 50% of the population), Družstevná pri Hornáde (fully functional WWTP operated for less than 5 years, used by more than 50% of the population and gradually connecting more inhabitants), Kostoľany nad Hornádom (fully functional WWTP operated for less than 5 years, used by more than 85% of the population), dispose of and use WWTPs for different number of inhabitants. In smaller municipalitites (Betlanovce, Smižany, Matejovce, Chrasť nad Hornádom, Olcnava, Kolinovce, Richnava, Kluknava, Malá Lodina, Veľká Lodina, Trebejov, Kokšov-Bakša and Trstené pri Hornáde) such an infrastructure is unbuilt, assuming that wastewater is, most likely, discharged directly into the stream without treatment. A specific case is the municipality of Sokoľ with a built but not operated WWTP and the municipality of Ždaňa where the construction part of the WTP is implemented, but the technological part is missing, which prevents full use of the facilities (Table 3).
Specifically, 93% of municipalities use fully functional WWTPs, 7% of partially operational and none of broken. Most of the population of a municipality (more than 85%) is connected to WWTPs in 50% of the municipalities, a medium amount of the population of a municipality (more than 50%) is connected to WWTPs in 21% of the municipalities and a small of the population of a municipality (less than 50%) is connected to WWTPs in 29% of municipalities. A positive signal is the construction and reconstruction of WWTPs and sewerage systems in smaller municipalities with quality technologies, especially with the use of structural funds of the European Union.
Other indicators of water quality include indicators related to agricultural activity, where the means for its intensification (artificial fertilizers, plant protection products, etc.) and unsecured manure dumps, etc. appear as primary. To improve this situation, it is necessary to follow technological procedures in the storage, handling and application of industrial and organic fertilizers, herbicides and pesticides, etc., in the construction of WWTPs for agricultural enterprises. Some of these measures are gradually being put into practice, which seems to be positive.
3.2. SWOT Analysis
Based on the partial results of quantitative analyses on the discharge of pollution by point sources of surface water pollution in the Hornád river basin in interaction with the results of a questionnaire survey, it is necessary to clearly define a suitable strategy for solving the defined problem.
From the available information and partial results of detailed quantitative analyses of discharged pollution by point sources of pollution of the Hornád river basin, impacts of residual pollution discharges according to selected indicators of surface water pollution in the river basin, the factors of strengths were identified. They include the ecological status of water in the Hornád river basin (S1), self-cleaning capacity of the Hornád river basin (S2), keeping the values of pH (S3), keeping the values of soluble substances (S4) and keeping the values of nitrates (S5) in all monitored sampling points for directional pollution. After identifying the factors, their weights were numerically determined. The factors of weakness include the chemical status of surface water in the Hornád river basin (W1), above-limit nitrite discharges (W2), above-limit arsenic and zinc discharges (W3) and above-limit discharges of bacteria (W4) which are characteristic for surface water environment in the Hornád river basin. The values of their weights were quantified similarly as in the case of factors of strength. Analogously the factors of opportunities were identified including the completion of WWTPs to reduce residual pollution (O1), connectivity to WWTPs (O2), increase the efficiency of WWTPs (O3) and the possibility of drawing funds from the Environmental Fund (EF) (The Environmental Fund is an independent legal entity based in Bratislava, Slovakia. The fund is managed by the Ministry of the Environment of the Slovak Republic. It is primarily established for the purpose of implementing state support for care for the environment and the creation of the environment on the principles of sustainable development. The main mission of the fund is to provide funding to applicants in the form of grants or loans to support projects within the activities aimed at achieving the objectives of state environmental policy at the national, regional or local level) which would also reduce residual pollution in discharged wastewater in interaction with the reduction of potential diffuse sources (O4) and factors of threat including possible changes in the legislative environment (T1), increase of diffuse sources of surface water pollution in the Hornád river basins as it is an area with a relatively high degree of agricultural production (T2), the unwillingness of the population to use public sewerage or WWTPs in their catchment area (T3), current bad condition of WWTPs (T4) and undersized WWTPs (T5) (Table 4).
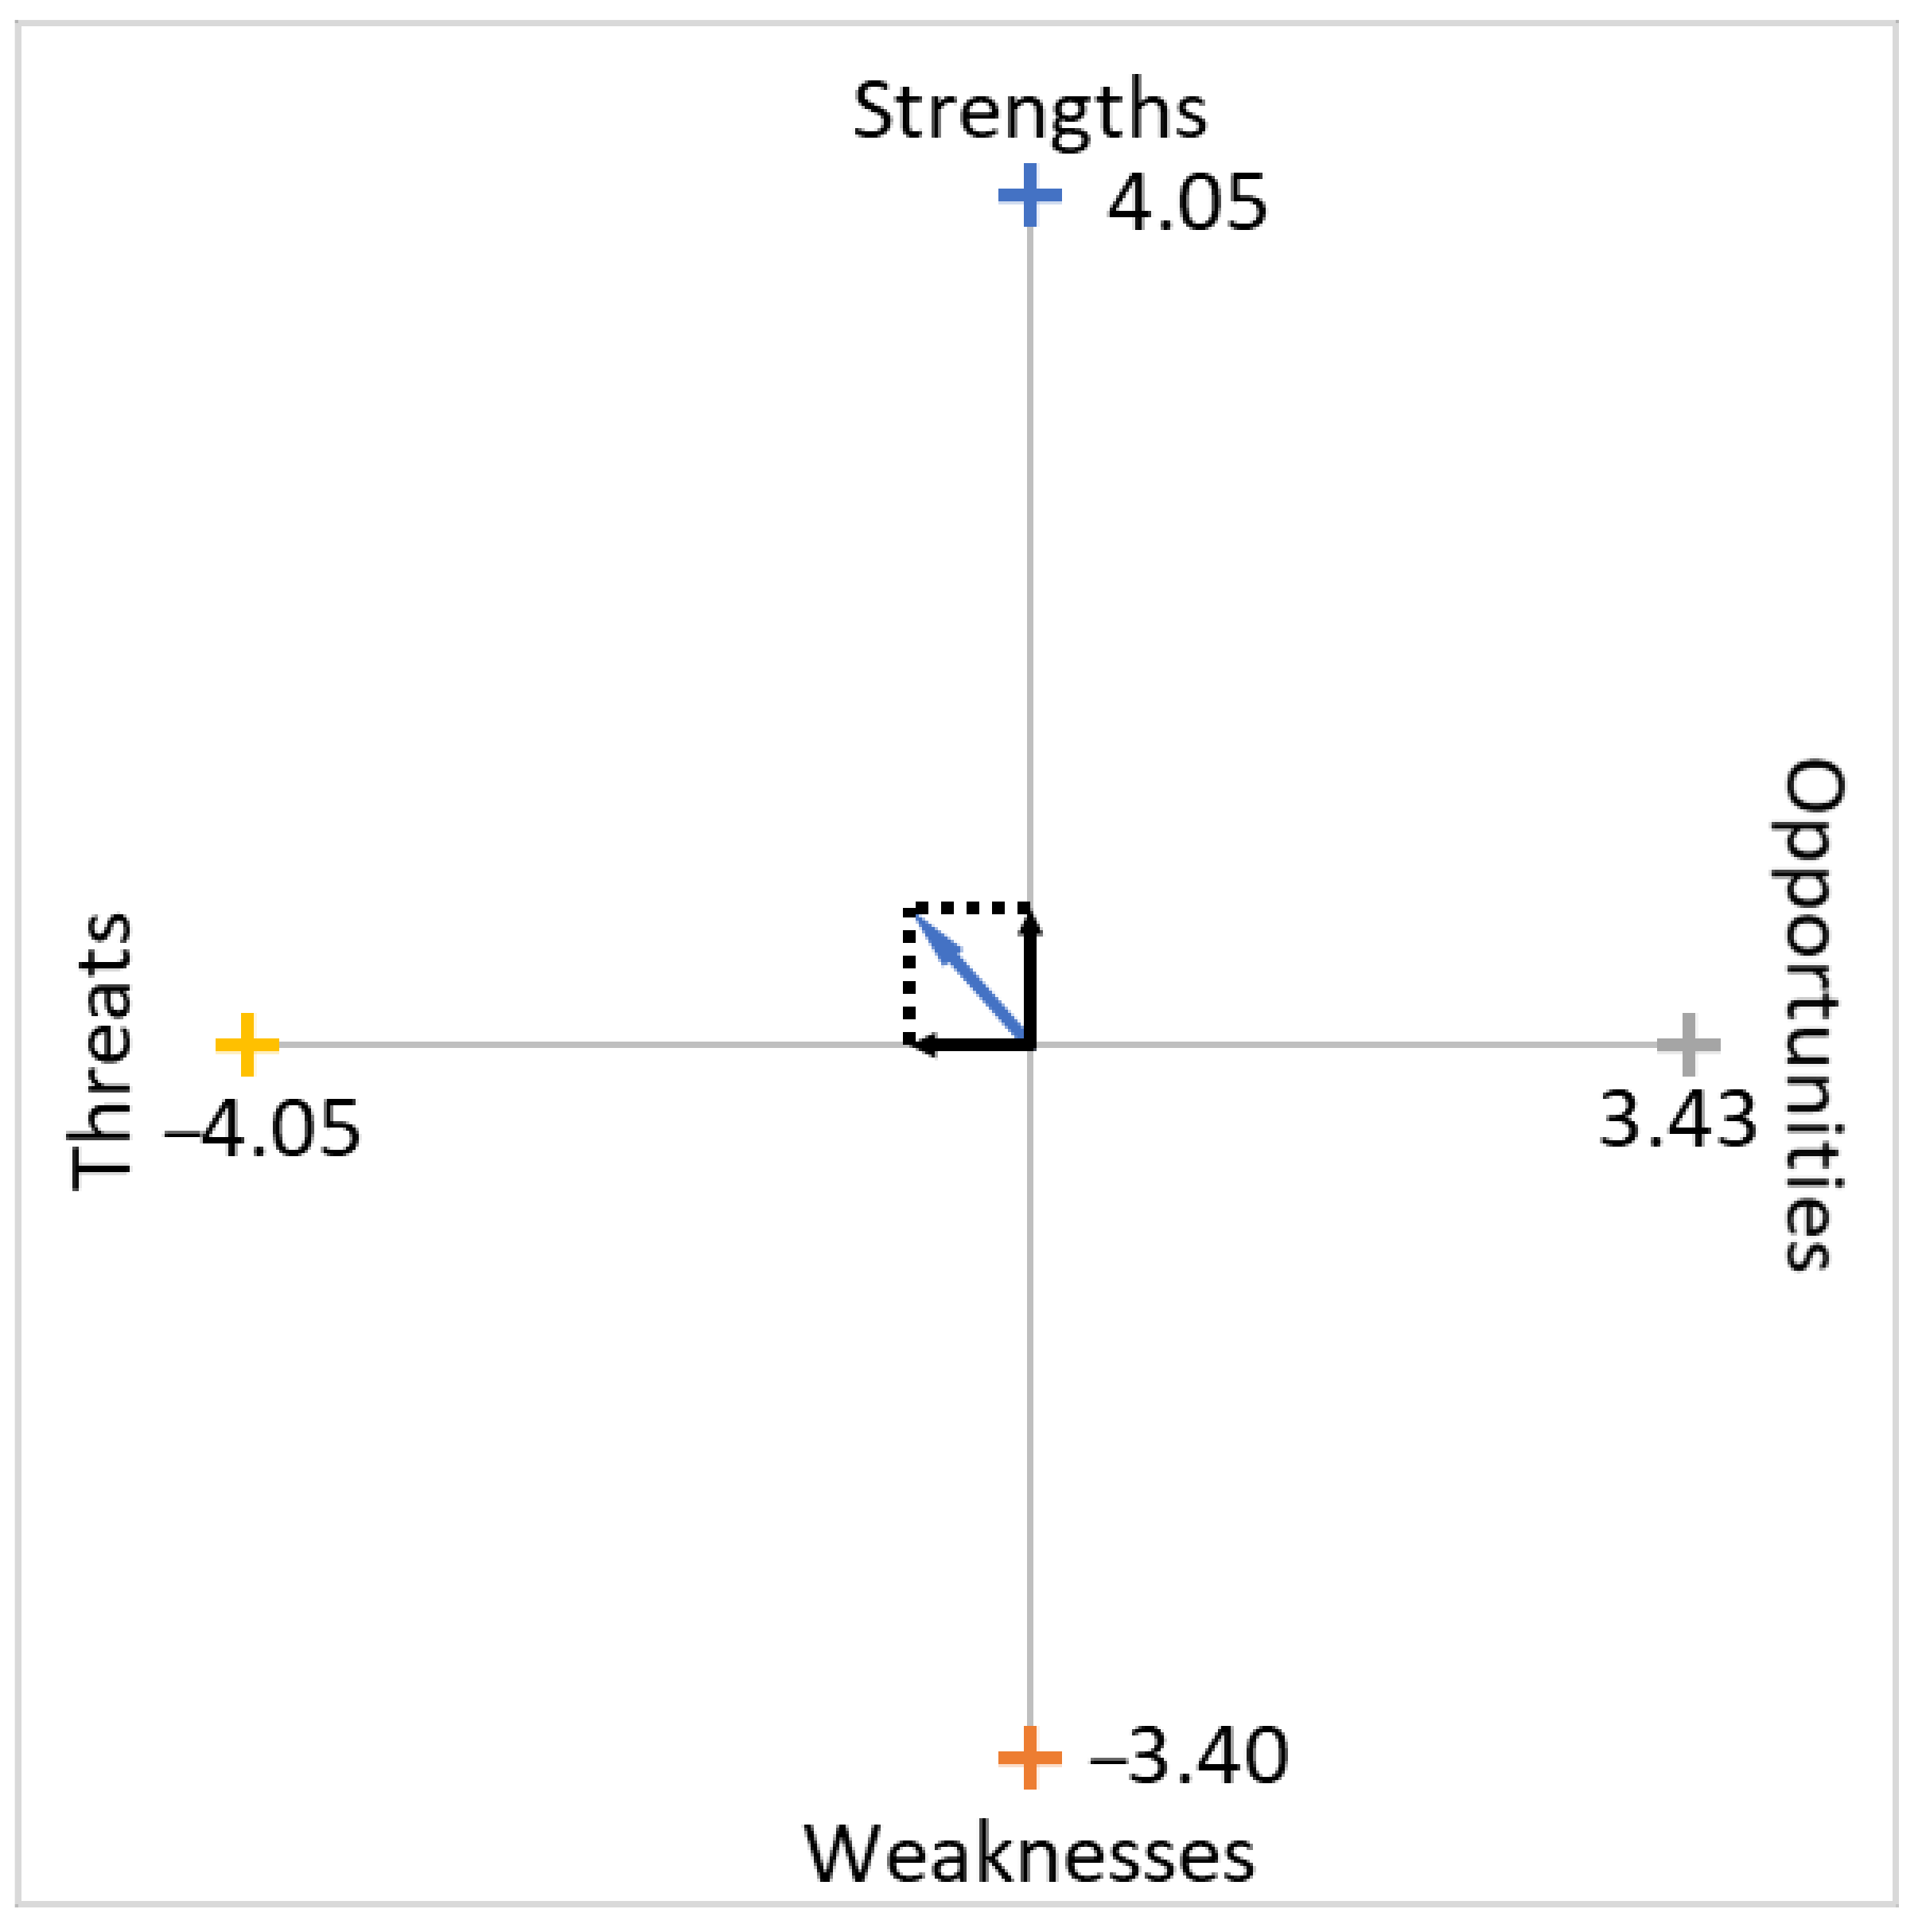
In terms of the methodological procedure of the SWOT analysis, a summary quantification of SWOT analysis vectors (Table 5) and its graphical design, as the result of the vector sum of partial vectors of individual SWOT areas (Figure 4) were performed. From the graphical representation of the SWOT analysis of the Hornád river basin, it was found that the strengths outweighed the weaknesses and the threats overweighed the opportunities, i.e., the improving the quality of surface water in the Hornád river basin should be governed by the principles of the defensive strategy. In the area of achieving good surface water status in the analyzed Hornád river basin, continual completion of sewerage infrastructure in municipalities where this infrastructure is still absent or increasing the connection of the inhabitants of municipalities with the built-up sewerage infrastructure which would also increase the index of its use in interaction with increasing the quality of surface water in the Hornád river basin, are recommended.
3.3. AHP Method
The identification of positive and negative aspects is directly determined by the quality of surface water in the Hornád river basin, also considering the diffuse sources of water pollution, was defined as a basic platform for investigating the impacts of the discharge of residual pollution from point sources of water pollution to the development of the quality of the basin. The primary goal of the basic platform was the explicit identification of basic factors in the area of positive and negative aspects of the discharge of pollution and its synergistic effect indicating the surface water quality in the Hornád river basin, with an emphasis on achieving good surface water status in accordance with applicable legislation.
The process of identification and subsequent quantification of weights of factors of positive aspects was based on partial results of quantitative analyses of development trends of selected pollution indicators in surface water of Hornád river basin in three specific monitoring sites, developmental changes of monitored indicators during the analysed period, quantification of synergistic discharge effect of residual pollution discharge of selected indicators, but also SWOT analysis. In total, 11 basic factors of positive aspects were identified and assessed in direct interaction on the surface water quality in the recipient of the Hornád river basin, including the ecological status of the Hornád river (f1), the self-cleaning capacity of the basin (f2), positive development trend of pH (f3), of soluble substances (f4), of N-NO3 concentration (f5), completion of water infrastructure (f6), connection to WWTPs (f7) and their intensification (f8), use of innovative technologies in wastewater treatment (f9), synergistic effect of discharged residual pollution and water quality in the basin (f10) and the possibility of using funds from the EF (f11) (Table 6).
From the quantification of the weights αi of individual factors of positive aspects directly determining the development of quality in the surface water of the Hornád river basin, it was found that the most important factor in deciding on a specific category of water pollution sources on the quality of the water was self-cleaning capacity. Additionally, on the contrary, it is the least important possibility of using funds from the EF, while the result of the matrix allowed us to compile a descending order of partial factors of positive aspects in interaction with the development of the water quality:
- Self-cleaning capacity of the Hornád river basin;
- Connection of the population to existing WWTPs;
- Intensification of WWTPs;
- The synergistic effect of the discharged residual pollution and the water quality in the basin;
- Positive development of soluble substances;
- Positive pH development;
- Positive development of N-NO3 concentration;
- Completion of water management infrastructure;
- Ecological status of the Hornád river basin;
- Implementation of innovative technologies in wastewater treatment;
- The possibility of drawing funds from the EF.
In a logical connection to the analysis of the factors of positive aspects directly determining the development of surface water quality in the Hornád river basin, an analysis of the factors of potential negative aspects using the same methodological procedure was performed. In total, 8 factors of negative aspects were identified, whose prioritization was obtained from the quantification of their weights based on the Saaty matrix and also were compiled in descending order (Table 7):
- Above-limit residual biological pollution discharged into the basin;
- Chemical status of surface water in the basin;
- Increase of diffuse sources of surface water pollution in the basin;
- Above-limit discharge of As and Zn in wastewater into the basin;
- Above-limit discharge of N-NO2 in wastewater into the basin;
- Reluctance of the population to use public sewers and WWTPs;
- Non-compliance with legislative regulations;
- Bad condition of WWTPs.
In the area of monitoring and effective management of all external influences determining the development of surface water quality of the water in the Hornád river to achieve and maintain good surface water status in the basin, the above-mentioned matrices with the acceptance of the principles of sustainable development should also be integrated into the model of impact assessment of the discharge of wastewater.
Regarding the above facts resulting from the matrix of positive and negative aspects, the mutual interaction of partial factors of the mentioned aspects (Table 8) was subsequently evaluated, determining the development of surface water quality in the Hornád river basin. It resulted in explicit quantification of the total ratio of positive and negative aspects indicating the category of impacts of wastewater discharges on the quality of surface water in the Hornád river basin (Table 9). The categories of impacts of wastewater discharge on the surface water quality in the basin integrate both positive and negative aspects of residual pollution discharge in wastewater determining the final effect of surface water quality development in the basin, which is given by summarizing the partial condition of individual areas. The quantification in Table 8 shows a comprehensive assessment of the discharge of residual pollution in wastewater into the surface water of the Hornád river basin in the Košice region, and clearly points to the predominance of positive aspects (59.40%) over negative aspects (40.60%), as evidenced by the proposed quantifier, scoring ratio, of 1.46.
4. Discussion—Model of Water Quality Management in River Basins
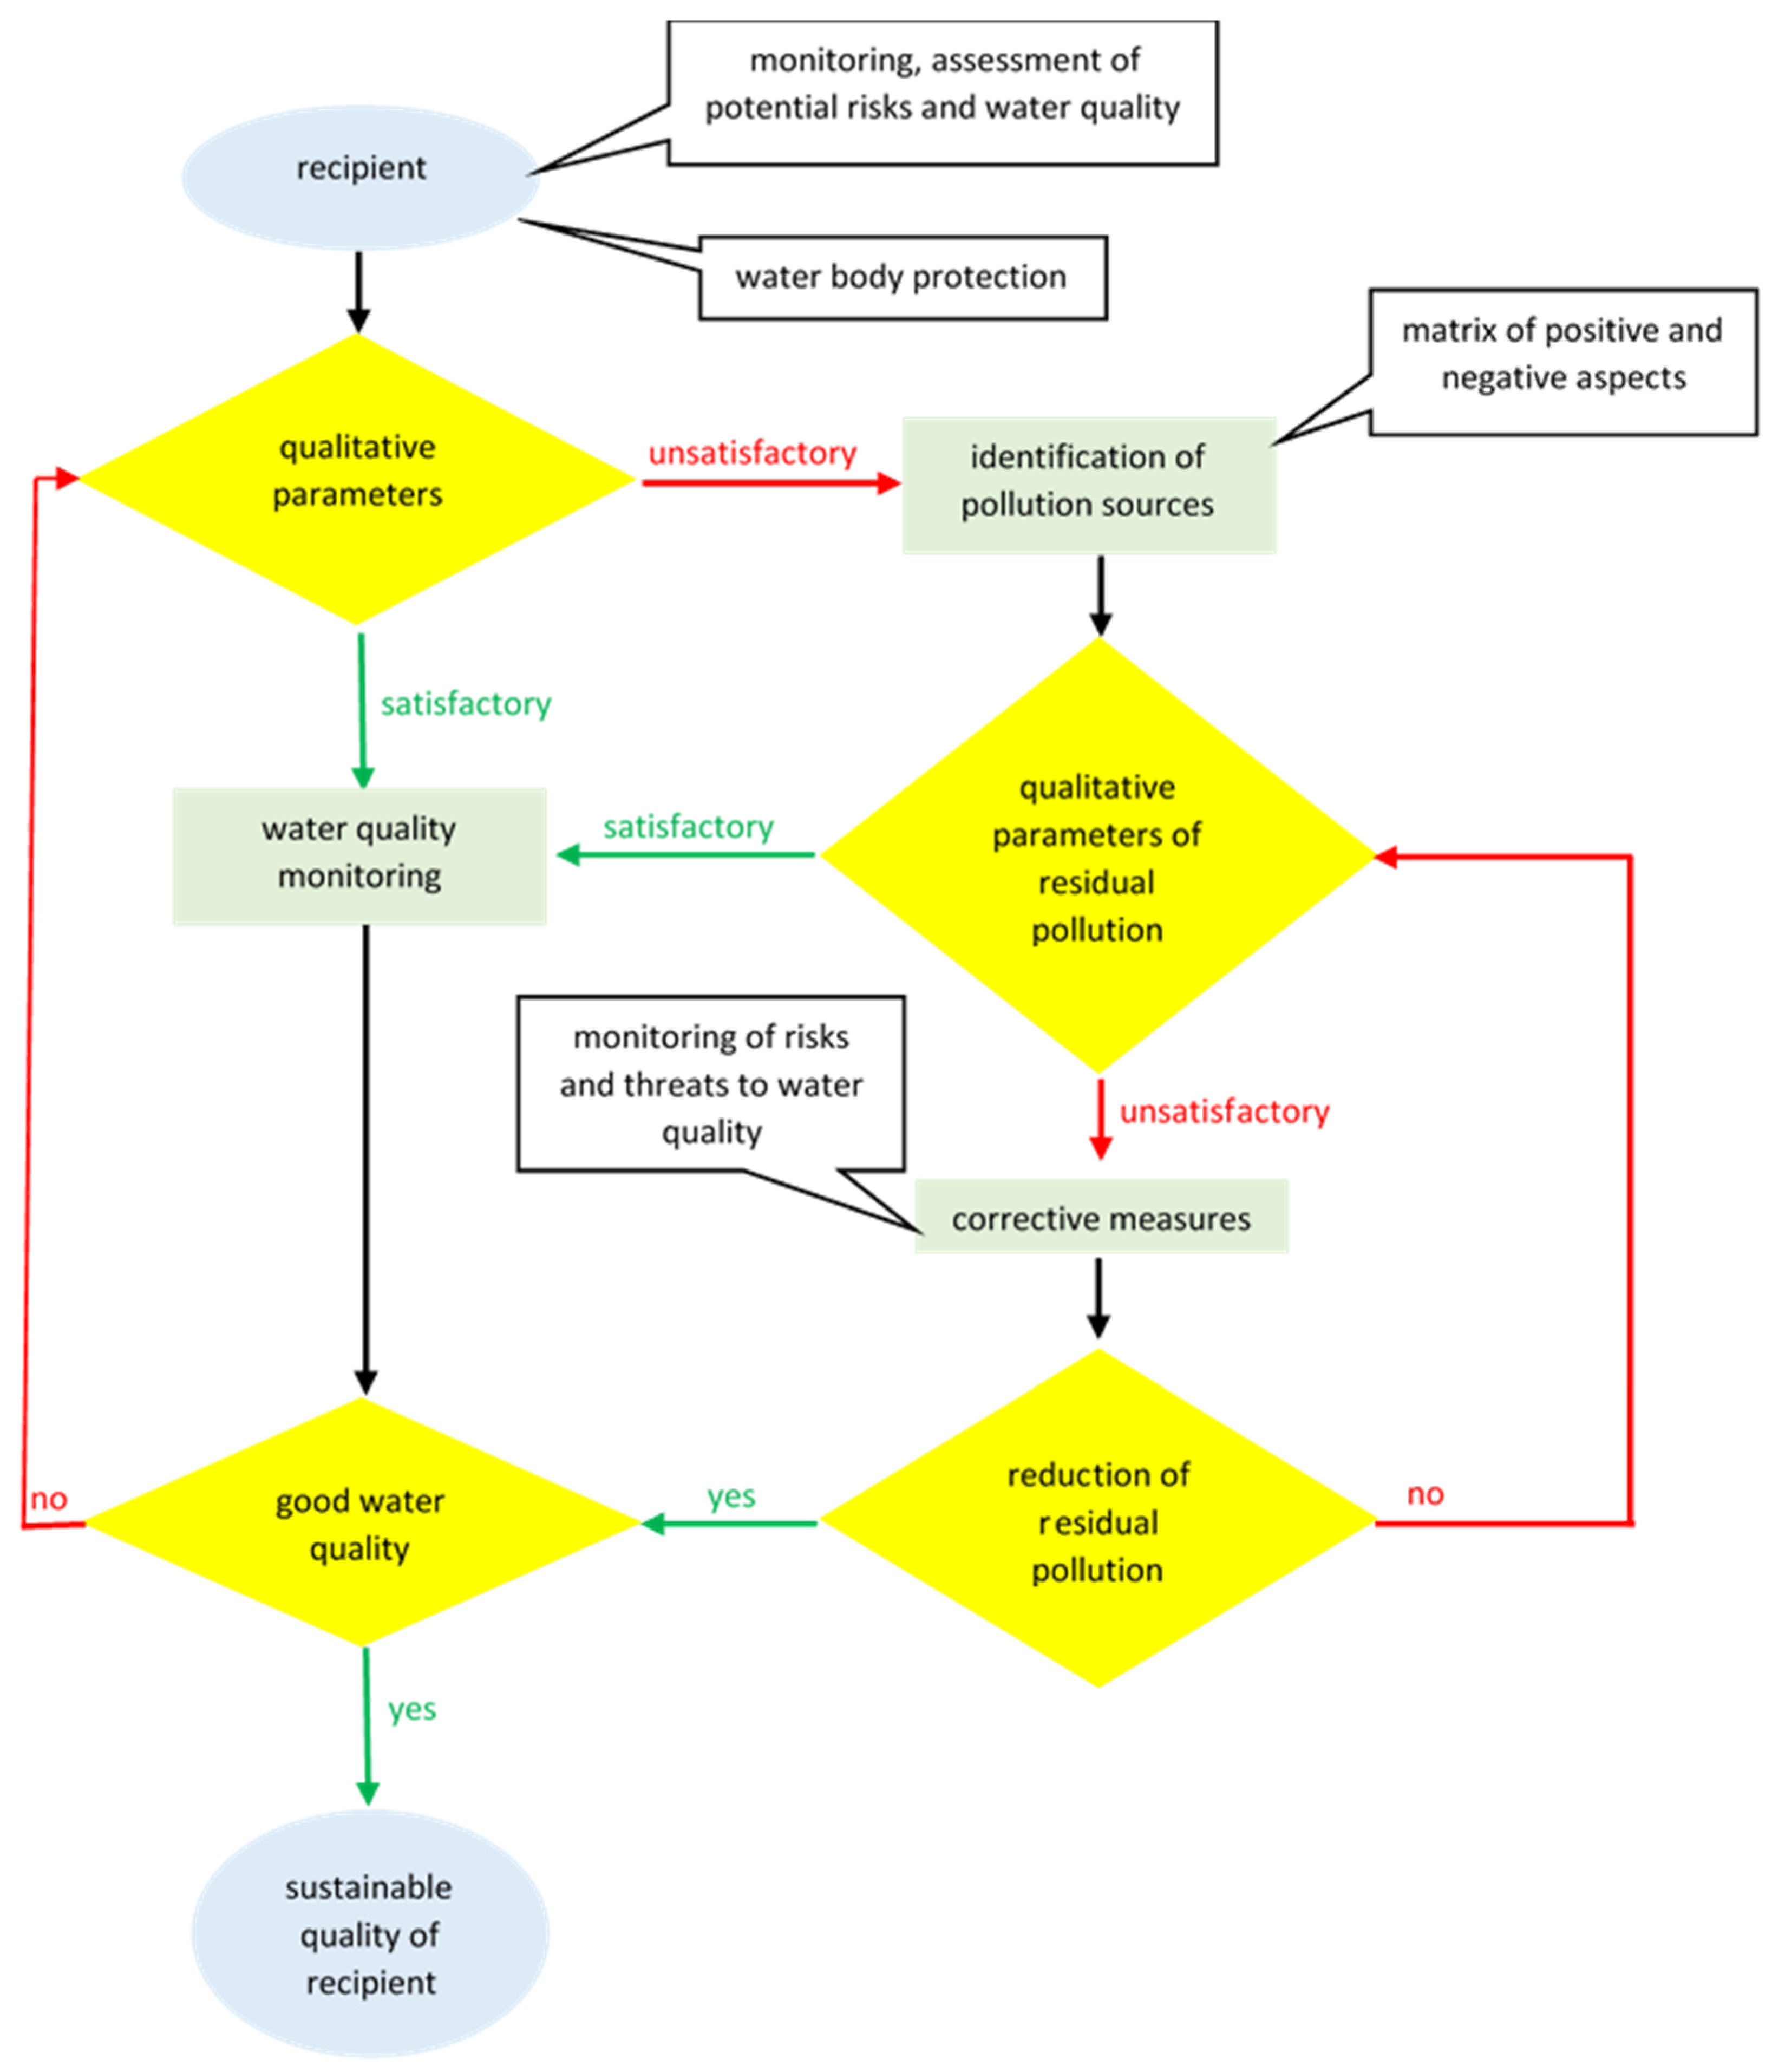
By synthesizing the partial results of quantitative analyses of development trends of selected surface water pollution in the Hornád river basin, changes in discharged residual pollution, identification of its synergistic effect with water quality in the basin and SWOT and AHP analysis, it can be concluded that an effective surface water quality management in the basin should have clearly defined rules for monitoring and regular evaluation of quantitative and qualitative indicators determining the development of water quality in the basin with an integrated matrix for assessing the impact of discharges into the basin based on the quantifier—scoring ratio—reflecting the intensity of positive aspects supporting the achievement and subsequent maintenance of good surface water status in the basin. From the point of view of increasing the quality of surface water in the basin, there are also hydrogeological conditions, allocation of diffuse sources of water pollution, intensity of wastewater treatment in WWTPs discharging wastewater into the basin, as well as the qualitative state of individual components of the environment primarily influencing the development of surface water quality in the basin. For these reasons, when designing a model for effective management of surface water quality in the basin, all external and internal aspects determining the quality development, as well as the fact that the resulting benefit synthesizes factors of positive and negative aspects of predicted and real quality of the basin, were respected (Figure 5). The proposed model is based on the generally applicable principles of sustainable development, accepting the legislation in the field of water management and the proposed quantifier of the impacts of the discharge of wastewater, thus it considers:
- The current qualitative status of surface water in the basin;
- A proposal for assessing the impacts of the discharge wastewater into the recipient;
- Identification and evaluation of positive and negative aspects determining the development of surface water quality in the basin;
- Implementation of the proposed measures and post-implementation monitoring of qualitative development.
In the environmental strategies of a coastal region the priorities are [19]:
- The optimal management of the environment and sensitive ecosystems;
- The preservation, restoration and creation of criteria for exploitation of natural resources;
- Applicable management plans for a proper use of natural resources and culture;
- Development of pollution control facilities in industrial and mining zones.
In the implementation of the integrated water resources management in Mozambique, the factors of opportunity should [20]:
- Overcome the weaknesses (low human resource capacity building in the water sector institutions, inexistence of water resources management plans at river basin level and weak financial structure);
- Overcome the threats (brain drain in the water sector);
- Maximize the strengths (existence of adequate institutional arrangement to gather data).
An effective decision-making team could be made by the foundation and operation of a river basin council, as an alternative administrative and coordinative centre in a trans-regional river basin in Greece [21]. The key policies from another study include regulation of heavy metals disposal, promoting hydropower, transformation towards organic farming, involvement of stakeholders and control of dams and barrages in a river basin in India [22]. A pressure on water resources is also made by agriculture, forestry, peat extraction, eutrophication and hydro-morphology in the Republic of Ireland [23].
These examples from different countries also support the suggested model, as the first step of the surface water quality management in the river basin must be a monitoring of water quality and assessment of potential risks. These steps are necessary for the present and future protection of the basin. The qualitative parameters must be assessed according to the local legislation. In case of unsatisfactory water quality parameters, it is necessary to employ a decision-making process (e.g., SWOT and AHP analyses, with an evaluation of strengths, weaknesses, opportunities and threats and by constructing a matrix of positive and negative factors). In the case of unsatisfactory qualitative parameters of residual pollution corrective measures must take place with a monitoring of risks and threats to the water quality. In the case that the reduction of residual pollution is not fulfilling the legislative requirements it is necessary to introduce other corrective measures and repeat the monitoring of risks and threats to the water quality. In the case of satisfactory water quality parameters, it is necessary to continue the water quality monitoring to keep good water quality. If the water quality, any time during the monitoring, is degraded, the steps of the water quality management must be repeated. Good water quality is fundamental for sustainable water quality in the water body.
5. Summary and Conclusions
In the present time all the inhabitants are not forced to think about how much water we have, what water we drink, how we care for water and so on. However, it is explicitly stated that the way we take care of our surroundings, the same way we will live and function in. According to the available sources, it is clear that experience with pollution removal over the last 20 years shows that the measures taken do not, in most cases, completely remove pollutants from water sources, and those sources of pollution, although partially removed, continue to produce pollution in long term. Therefore, it is very important to focus first and foremost on the assessment of water quality and to take a stand on the prevention of pollution, whether it is surface water or groundwater. The quality of surface water and the issue of pollution is a problem of many organizations and local governments not only in Slovakia but also around the World. These topics are very closely linked and depend on the applicable legislation and the awareness of the population. Therefore, it is very important to find the right tools to create an appropriate penetration of legislation as a theoretical basis and awareness of the population as a practical superstructure to manage this issue. In this way, it is possible to significantly help address the issue of wastewater quality in the near future. In the longer term, it is necessary to monitor the emerging and anticipate possible risks of negative effects on the quality of wastewater and eliminate them from the outset. According to available data, environmental pollution for a period of 10 years, in general, within the total amount of wastewater is caused by discharges into recipients from the industry, but the primary producers are electricity generation, the chemical industry and pulp and paper production.
Based on the results of the questionnaire survey it can be stated that the use of WWTPs is mainly related to larger agglomerations. Despite the construction of wastewater treatment infrastructure, the inhabitants of smaller agglomerations use its capacity to less than 50%. The aspects revealed by the survey are:
- the infrastructure of WWTPs and sewerage systems in the municipalities are built and functional in more than half of the municipalities;
- the construction and reconstruction of WWTPs and sewerage systems in smaller municipalities with quality technologies;
- smaller municipalities do not use WWTPs and sewerage systems, thus it is assumed that the wastewater is directly released into the river;
- most municipalities use fully functional WWTPs;
- it is necessary to improve the situation related to agricultural activities.
The first partial finding of this study was the influence of individual indicators on water quality in relation to the existence and functionality of WWTPs in the basin. By a comprehensive analysis of surface water quality at selected sampling points, it is thus possible to propose measures for streamlining the operation of facilities for the elimination of surface water pollution and achieve the lowest possible degree of water pollution in the basin.
In the three monitored places, due to the development tendencies of selected indicators of surface water pollution in the basin, they were characterized by a fluctuating development trend during the analysed period. There is no negative impact of the discharged wastewater on the quality of surface water in the basin because the residual pollution in synergy with the quality of surface water in the basin was consistent with the permissible pollution values in all three analysed indicators, BOD, COD and soluble substances despite the fact that their development tendencies were fluctuating.
The survey on the disposal of wastewater treatment infrastructure found that the use of WWTPs is mainly linked to larger (urban) agglomerations. Despite the construction of wastewater treatment infrastructure, the inhabitants of smaller (municipal) agglomerations use its capacity to less than 50%. The cause of this situation is often the illegal discharge of wastewater into rivers and the charging of discharged wastewater.
SWOT and AHP analysis of the basin, based on partial results of quantitative analyses of residual pollution by point sources of surface water pollution in the basin in interaction with the results of a questionnaire survey, clearly defines an appropriate strategy for potential improvement of water quality.
Based on the results of the analysis, the strengths prevailed over the weaknesses and the threats prevailed over the opportunities, thus the area of improving the quality of surface water in the basin should be guided by the principles of the so-called defensive strategy. In the area of achieving good surface water status, it is therefore recommended to continuously complete the sewerage infrastructure in municipalities where this infrastructure is still absent or increasing the connection of the inhabitants of municipalities with the built-up sewerage infrastructure, which would also increase the index of its use in interaction with increasing the quality of surface water in the basin.
The presented model of evaluation of impacts of discharged wastewater on the quality in the basin includes individual categories of impacts of wastewater discharge on the quality of surface water in the basin and integrates positive and negative aspects of residual pollution in wastewater determining the final effect of surface water quality in the basin, which is given by the summary of partial facts of areas. Quantification of a comprehensive assessment of the discharge of residual pollution in the wastewater into the surface water of the basin points to the predominance of positive aspects over negative aspects.
Synthesis of partial results of quantitative analyses of development tendencies of selected indicators of surface water pollution in the basin, changes in discharged residual pollution, identification of synergistic effect with water quality in the basin. SWOT and AHP analyses revealed that an effective management system of surface water quality in the basin should have clearly defined rules for monitoring and regular evaluation of quantitative and qualitative indicators determining the development of water quality in the basin with an integrated matrix for assessing the impact of wastewater discharges into the basin, reflecting the intensity of positive aspects supporting the achievement and subsequent maintenance of good surface water status in the basin.
The proposed model for managing the development of surface water quality in the basin is based on generally applicable principles of sustainable development, accepting legislation in the field of water management and the proposed quantifier of wastewater discharge impacts, thus takes into account the quality of surface water in the basin, takes into account the proposal for assessing the impacts of wastewater discharges into the basin, takes into account the identification and evaluation of positive and negative aspects determining the development of surface water quality in the recipient, and takes into account the implementation of the proposed measures and post-implementation monitoring of qualitative development.
The presented analysis has also some limitations. The SWOT was based on 18 factors, 5 of strength, 4 of weaknesses, 4 of opportunities and 5 of threats, and the AHP was based on decision-making with 11 positive and 8 negative factors that were identified to clearly define a suitable strategy for achieving good surface water status in accordance with applicable legislation for the water quality development management and the quantification of weights according to the methodological procedure with determination of their priority in the decision-making process. Future study may reconsider the use of other methods for evaluation as well as include other S/W/O/T and/or positive/negative factors and other (re)sources. The results were considered for the local situation for the Hornád river basin; however, they may be generalized for other regions, and the proposed model of surface water quality development management in the river basin may be used anywhere in the world.
Author Contributions
T.B., H.P. and A.T. have contributed equally to this publication. All authors have read and agreed to the published version of the manuscript.
Funding
This research was funded by Kultúrna a Edukačná Grantová Agentúra MŠVVaŠ SR, grant number 001UVLF-4/2020.
Conflicts of Interest
The authors declare no conflict of interest.
References
- Rickert, B.; Chorus, I.; Schmoll, O. (Eds.) Protecting Surface Water for Health. Identifying, Assessing and Managing Drinking-Water Quality Risks in Surface-Water Catchments, 2nd ed.; WHO Library Cataloguing-in-Publication Data: Geneva, Switzerland, 2016. [Google Scholar]
- Shah, H.A.; Sheraz, M.; Khan, A.U.; Khan, F.A.; Shah, L.A.; Khan, J.; Khan, A.; Khan, Z. Surface and Groundwater Pollution: The Invisible, Creeping Threat to Human Health. Civ. Environ. Eng. 2020, 16, 157–169. [Google Scholar] [CrossRef]
- Young, R.A.; Loomis, J.B. Determining the Economic Value of Water, 2nd ed.; Routledge: New York, NY, USA, 2014. [Google Scholar]
- Pavolová, H.; Bakalár, T.; Kudelas, D.; Puškárová, P. Environmental and economic assessment of rainwater application in households. J. Cleaner Prod. 2019, 209, 1119–1125. [Google Scholar] [CrossRef]
- Keeler, B.L.; Polasky, S.; Brauman, K.A.; Johnson, K.A.; Finlay, J.C.; O’Neille, A.; Kovacs, K.; Dalzell, B. Linking water quality and well-being for improved assessment and valuation of ecosystem services. Proc. Natl. Acad. Sci. USA 2012, 109, 18619–18624. [Google Scholar] [CrossRef] [Green Version]
- Moroke, T.; Schoeman, C.; Schoeman, I. Developing a neighbourhood sustainability assessment model: An approach to sustainable urban development. Sustain. Cities Soc. 2019, 48, 101433. [Google Scholar] [CrossRef]
- Butler, D.; Ward, S.; Sweetapple, C.; Astaraie-Imani, M.; Diao, K.; Farmani, R.; Fu, G. Reliable, resilient and sustainable water management: The Safe & SuRe approach. Glob. Chall. 2016, 1, 63–77. [Google Scholar] [PubMed]
- Hajare, R.; Labhasetwar, P.; Nagarnaik, P. A Critical Review of Applications of QMRA for Healthy and Safe Reclaimed Water Management. Environ. Model Assess. 2021, 26, 339–354. [Google Scholar] [CrossRef]
- Medema, W.; McIntosh, B.S.; Jeffrey, P.J. From premise to practice: A critical assessment of integrated water resources management and adaptive management approaches in the water sector. Ecol. Soc. 2008, 13, 29. [Google Scholar] [CrossRef] [Green Version]
- Pokhrel, Y.; Burbano, M.; Roush, J.; Kang, H.; Sridhar, V.; Hyndman, D.W. A Review of the Integrated Effects of Changing Climate, Land Use, and Dams on Mekong River Hydrology. Water 2018, 10, 266. [Google Scholar] [CrossRef] [Green Version]
- Auffhammer, M. Quantifying Economic Damages from Climate Change. J. Econ. Perspect. 2018, 32, 33–52. [Google Scholar] [CrossRef] [Green Version]
- Rizzi, J.; Torresan, S.; Critto, A.; Zabeo, A.; Brigolin, D.; Carniel, S.; Pastres, R.; Marcomini, A. Climate change impacts on marine water quality: The case study of the Northern Adriatic sea. Mar. Pollut. Bull. 2015, 102, 271–282. [Google Scholar] [CrossRef]
- Malhi, Y.; Franklin, J.; Seddon, N.; Solan, M.; Turner, M.G.; Field, C.B.; Knowlton, N. Climate change and ecosystems: Threats, opportunities and solutions. Phil. Trans. R. Soc. B 2020, 375, 20190104. [Google Scholar] [CrossRef] [Green Version]
- Arneth, A.; Shin, Y.; Leadley, P.; Rondinini, C.; Bukvareva, E.; Kolb, M.; Midgley, G.F.; Oberdorff, T.; Palomo, I.; Saito, O. Post-2020 biodiversity targets need to embrace climate change. Proc. Natl. Acad. Sci. USA 2020, 117, 30882–30891. [Google Scholar] [CrossRef]
- Karatayev, M.; Kapsalyamova, Z.; Spankulova, L.; Skakova, A.; Movkebayeva, G.; Kongyrbay, A. Priorities and challenges for a sustainable management of water resources in Kazakhstan. Sustain. Water Qual. Ecol. 2017, 9–10, 115–135. [Google Scholar] [CrossRef]
- Cole, J.; Sharvelle, S.; Grigg, N.; Pivo, G.; Haukaas, J. Collaborative, Risk-Informed, Triple Bottom Line, Multi-Criteria Decision Analysis Planning Framework for Integrated Urban Water Management. Water 2018, 10, 1722. [Google Scholar] [CrossRef] [Green Version]
- Gebre, S.L.; Cattrysse, D.; Van Orshoven, J. Multi-Criteria Decision-Making Methods to Address Water Allocation Problems: A Systematic Review. Water 2021, 13, 125. [Google Scholar] [CrossRef]
- Chen, A.; Abramson, A.; Becker, N.; Megdal, S.B. A tale of two rivers: Pathways for improving water management in the Jordan and Colorado River basins. J. Arid Environ. 2015, 112, 109–123. [Google Scholar] [CrossRef]
- Sharifipour, R.; Mahmodi, B. Presentation of Coastal Environmental Management Plan by using SWOT/AHP methods. Appl. Sci. Environ. Manag. 2012, 16, 157–163. [Google Scholar]
- Gallego-Ayala, J.; Juízo, D. Strategic implementation of integrated water resources management in Mozambique: An A’WOT analysis. Phys. Chem. Earth A/B/C 2011, 36, 1103–1111. [Google Scholar] [CrossRef]
- Podimata, M.V.; Yannopoulos, P.C. Evaluating challenges and priorities of a trans-regional river basin in Greece by using a hybrid SWOT scheme and a stakeholders’ competency overview. Int. J. River Basin Manag. 2013, 11, 93–110. [Google Scholar] [CrossRef]
- Srinivas, R.; Singh, A.P.; Dhadse, K.; Garg, C.; Deshmukh, A. Sustainable management of a river basin by integrating an improved fuzzy based hybridized SWOT model and geo-statistical weighted thematic overlay analysis. J. Hydrol. 2018, 563, 92–105. [Google Scholar] [CrossRef]
- Antwi, S.H.; Linnane, S.; Getty, D.; Rolston, A. River Basin Management Planning in the Republic of Ireland: Past, Present and the Future. Water 2021, 13, 2074. [Google Scholar] [CrossRef]
- Srdjevic, Z.; Bajcetic, R.; Srdjevic, B. Identifying the Criteria Set for Multicriteria Decision Making Based on SWOT/PESTLE Analysis: A Case Study of Reconstructing a Water Intake Structure. Water Resour. Manag. 2012, 26, 3379–3393. [Google Scholar] [CrossRef]
- Chan, N.W.; Roy, R.; Chaffin, B.C. Water Governance in Bangladesh: An Evaluation of Institutional and Political Context. Water 2016, 8, 403. [Google Scholar] [CrossRef] [Green Version]
- Rajput, T.S.; Singhal, A.; Routroy, S.; Dhadse, K.; Tyagi, G. Urban Policymaking for a Developing City Using a Hybridized Technique Based on SWOT, AHP, and GIS. J. Urban Plann. Dev. 2021, 147, 04021018. [Google Scholar] [CrossRef]
- Takeleb, A.; Sujono, J.; Jayadi, R. Water resource management strategy for urban water purposes in Dili Municipality, Timor-Leste. Australas. J. Water Resour. 2020, 24, 199–208. [Google Scholar] [CrossRef]
- Bai, D.; Liu, P. Research on Development Strategy of Manufacturing Industry in Pearl River Delta Based on SWOT-AHP Model. In Proceedings of the 9th International Conference on Education, Management, and Computer (ICEMC 2019), Shenyang, China, 12–14 May 2019; Cha, G., Miracle, J., Jing, W., Eds.; Web of Proceedings: London, UK, 2019; pp. 454–461. [Google Scholar]
- Datta, K. Application of SWOT-TOWS Matrix and Analytical Hierarchy Process (AHP) in the Formulation of Geoconservation and Geotourism Development Strategies for Mama Bhagne Pahar: An Important Geomorphosite in West Bengal, India. Geoheritage 2020, 12, 45. [Google Scholar] [CrossRef]
- Wei, X.; Mao, X.; Fan, Z.; Tang, Z.; Luo, Y. AHP-SWOT Analysis on Ecotourism Development in the Three River Sources National Park. Manag. Sci. Eng. 2020, 9, 66–74. [Google Scholar] [CrossRef]
- Fabac, R.; Zver, I. Applying the modified SWOT–AHP method to the tourism of Gornje Međimurje. Tour. Hosp. Manag. 2011, 17, 201–215. [Google Scholar] [CrossRef]
- Ozdemir, Y.; Demirel, T. Prioritization of Tourism Strategies in Turkey Using a SWOT-AHP Analysis. Int. J. Bus. Ind. Mark. 2018, 3, 34–45. [Google Scholar]
- Lee, S.; Kim, D.; Park, S.; Lee, W. A Study on the Strategic Decision Making Used in the Revitalization of Fishing Village Tourism: Using A’WOT Analysis. Sustainability 2021, 13, 7472. [Google Scholar] [CrossRef]
- Skov, I.R.; Schneider, N.; Schweiger, G.; Schöggl, J.-P.; Posch, A. Power-to-X in Denmark: An Analysis of Strengths, Weaknesses, Opportunities and Threats. Energies 2021, 14, 913. [Google Scholar] [CrossRef]
- Ali, E.B.; Agyekum, E.B.; Adadi, P. Agriculture for Sustainable Development: A SWOT-AHP Assessment of Ghana’s Planting for Food and Jobs Initiative. Sustainability 2021, 13, 628. [Google Scholar] [CrossRef]
- Wang, Q.; Dogot, T.; Yang, Y.; Jiao, J.; Shi, B.; Yin, C. From “Coal to Gas” to “Coal to Biomass”: The Strategic Choice of Social Capital in China. Energies 2020, 13, 4171. [Google Scholar] [CrossRef]
- Kokkinos, K.; Karayannis, V. Supportiveness of Low-Carbon Energy Technology Policy Using Fuzzy Multicriteria Decision-Making Methodologies. Mathematics 2020, 8, 1178. [Google Scholar] [CrossRef]
- Kim, Y.; Park, J. Sustainable Development Strategy for the Uzbekistan Textile Industry: The Results of a SWOT-AHP Analysis. Sustainability 2019, 11, 4613. [Google Scholar] [CrossRef] [Green Version]
- Tsangas, M.; Jeguirim, M.; Limousy, L.; Zorpas, A. The Application of Analytical Hierarchy Process in Combination with PESTEL-SWOT Analysis to Assess the Hydrocarbons Sector in Cyprus. Energies 2019, 12, 791. [Google Scholar] [CrossRef] [Green Version]
- Mor, R.S.; Bhardwaj, A.; Singh, S. Integration of SWOT-AHP Approach for Measuring the Critical Factors of Dairy Supply Chain. Logistics 2019, 3, 9. [Google Scholar] [CrossRef] [Green Version]
- Rochman, N.T.; Gumbira-Sa’id, E.; Daryanto, A.; Nuryartono, N. Analysis of Indonesian Agroindustry Competitiveness in Nanotechnology Development Perspective Using SWOT-AHP Method. Int. J. Bus. Manag. 2011, 6, 235–244. [Google Scholar]
- SHMÚ. Celkové Hodnotenie Kvality Podzemných Vôd na Slovensku v Roku. 2012. Available online: http://www.shmu.sk/File/podzemna%20voda/Kvalita/Text/2012/verejne_informacie_2012.pdf (accessed on 1 February 2019).
- Kajanus, M.; Leskinen, P.; Kurttila, M.; Kangas, J. Making use of MCDS methods in SWOT analysis—Lessons learnt in strategic natural resources management. For. Policy Econ. 2012, 20, 1–9. [Google Scholar] [CrossRef]
- White, T.H., Jr.; Barros, Y.D.M.; Develey, P.F.; Llerandi-Román, I.C.; Monsegur-Rivera, O.A.; Trujillo-Pinto, A.M. Improving reintroduction planning and implementation through quantitative SWOT analysis. J. Nat. Conserv. 2015, 28, 149–159. [Google Scholar] [CrossRef]
- Kurttila, M.; Pesonen, M.; Kangas, J.; Kajanus, M. Utilizing the analytic hierarchy process (AHP) in SWOT analysis—A hybrid method and its application to a forest-certification case. For. Policy Econ. 2000, 1, 41–52. [Google Scholar] [CrossRef]
- Bakalár, T.; Pavolová, H.; Hajduová, Z.; Lacko, R.; Kyšeľa, K. Metal recovery from municipal solid waste incineration fly ash as a tool of circular economy. J. Cleaner Prod. 2021, 302, 126977. [Google Scholar] [CrossRef]
- Saaty, R.W. The analytic hierarchy process—What it is and how it is used. Math. Modell. 1987, 9, 161–176. [Google Scholar] [CrossRef] [Green Version]
- Kopacza, M.; Kryzia, D.; Kryzia, K. Assessment of sustainable development of hard coal mining industry in Poland with use of bootstrap sampling and copula-based Monte Carlo simulation. J. Cleaner Prod. 2017, 159, 359–373. [Google Scholar] [CrossRef]
- Pavolová, H.; Bakalár, T.; Emhemed, E.M.A.; Hajduová, Z.; Pafčo, M. Model of sustainable regional development with implementation of brownfield areas. Entrep. Sustain. Issues 2019, 6, 1088–1100. [Google Scholar] [CrossRef] [Green Version]
- Saaty, T.L. A scaling method for priorities in hierarchical structures. J. Math. Psychol. 1977, 15, 234–281. [Google Scholar] [CrossRef]
- Saaty, T.L. The Analytic Hierarchy Process, 1st ed.; McGraw-Hill: New York, NY, USA, 1980. [Google Scholar]
- Saaty, T.L. Fundamentals of Decision Making and Priority Theory, 1st ed.; RWS Publications: Pittsburgh, PA, USA, 2000. [Google Scholar]
- Saaty, T.L.; Vargas, L.G. Models, Methods, Concepts & Applications of the Analytic Hierarchy Process, 2nd ed.; Springer Science + Business Media: NewYork, NY, USA, 2012. [Google Scholar]
- Szabó, S. Rieka Hornád. 2013. Available online: http://abov.vucke.sk/trip/abov/abov/priroda/rieka-hornad.html (accessed on 16 August 2013).
- Hornád. Available online: https://maps.goo.gl/48c78F8cfv5L4kp56 (accessed on 1 February 2019).
- Ľoch, B.; Puškárová, P.; Róth, B.; Marcin, M.; Šándorová, K. Impact of water quality on water based activities in Hornád river basin. In 17th International Multidisciplinary Scientific GeoConference SGEM 2017; STEF92 Technology: Sofia, Bulgaria, 2017; pp. 507–514. [Google Scholar]
- L‘och, B.; Bakalár, T.; Róth, B. Water quality assessment of River Hornád, Slovakia. Res. J. Min. 2017, 1, 72–79. [Google Scholar]
- Lumnitzer, E.; Románová, M.; Badida, M. Hodnotenie Kvality Prostredia, 1st ed.; ELFA: Košice, Slovakia, 2007. [Google Scholar]
- Tölgyessy, J. Chémia, Biológia a Toxikológia Vody a Ovzdušia, 1st ed.; SAV: Bratislava, Slovakia, 1984. [Google Scholar]
- Mazúrek, J. Banská činnosť a jej vplyv na krajinu stredného Slovenska. Geogr. Štúdie 1998, 5, 23–34. [Google Scholar]
- Krokusová, J. Analýza priestorového rozmiestnenia banských antropogénnych foriem v obci Slovinky. Acta Fac. Rerum Nat. Univ. Comen. Geogr. 2005, 3, 300–308. [Google Scholar]
- Kozáková, L.; Zeleňák, M.; Bakalár, T.; Zeleňák, F. Elimination of heavy metals from the material of sludge bed Slovinky. Solid State Phenom. 2016, 244, 228–233. [Google Scholar] [CrossRef]
- Krokusová, J. The influence of industrial setting pit Halňa on the landscape of the Krompachy town and possibilities of his recultivation. Folia Geogr. 2013, 21, 48–66. [Google Scholar]
Figure 1.
Scheme for monitoring the surface water assessment.

Figure 2.
The tendency of chemical indicators during monitored period: (a) BOD, (b) COD, (c) soluble substances, (d) N-NO2, (e) N-NO3, (f) phosphorus, (g) aluminium, (h) arsenic, (i) zinc. Notes: horizonal axis: biennium; units of vertical axis: mg·L−1; blue: Hranovnica, red: Malá Lodina, green: Hidasnémeti, yellow: limit; the results are presented as maximum values biennium due to methodology used before 2002.


Figure 3.
The tendency of biological indicators during monitored period: (a) Coliform bacteria, (b) thermotolerant bacteria, (c) intestinal enterococci. Notes: horizonal axis: biennium; units of vertical axis: CFU·L−1; blue: Hranovnica, red: Malá Lodina, green: Hidasnémeti, yellow: limit; the results are presented as maximum values biennium due to methodology used before 2002.

Figure 4.
SWOT analysis of Hornád river basin.

Figure 5.
Model of surface water quality development management in the river basin.


| Indicator Value | Description of Compared Indicators |
|---|---|
| 1 | The indicators i and j are equivalent |
| 3 | The indicator i is slightly preferred over the determinant j |
| 5 | The indicator i is strongly preferred over the determinant j |
| 7 | The indicator i is highly preferred over the determinant j |
| 9 | The indicator i is absolutely preferred over the determinant j |
| Points | Criteria |
|---|---|
| 1 | meets significantly below average |
| 2 | meets below average |
| 3 | meets at an average |
| 4 | meets above average |
| 5 | meets significantly above average |
Table 3.
An overview of municipalities with a WWTP.
| Municipality | Number of Inhabitants 1 | Released Wastewater 2 [m3·year−1] |
|---|---|---|
| Spišská Nová Ves | 37,558 | 6,835,336 |
| Jaklovce | 1890 | 120,122 |
| Kysak | 1452 | 61,671 |
| Košice | 239,171 | 30,608,842 |
| Čaňa | 5805 | 156,750 |
1 Data from 2016 according to Statistical Office of the Slovak Republic. 2 Average value during 2010–2020 according to Slovak Hydrometeorological Institute.
Table 4.
Factors of strengths, weaknesses, opportunities and threats.
| * F | S1 | S2 | S3 | S4 | S5 | Si | Ri | αi | * F | W1 | W2 | W3 | W4 | Si | Ri | αi |
|---|---|---|---|---|---|---|---|---|---|---|---|---|---|---|---|---|
| S1 | 1 | 3 | 1 | 5 | 1/3 | 5.00 | 1.38 | 0.23 | W1 | 1 | 7 | 1 | 5 | 35.00 | 2.43 | 0.51 |
| S2 | 1/3 | 1 | 5 | 3 | 1/3 | 1.67 | 1.11 | 0.19 | W2 | 1/7 | 1 | 5 | 1/3 | 0.24 | 0.70 | 0.15 |
| S3 | 1 | 1/5 | 1 | 5 | 1 | 1.00 | 1.00 | 0.17 | W3 | 1 | 1/5 | 1 | 1/3 | 0.07 | 0.51 | 0.11 |
| S4 | 1/5 | 1/3 | 1/5 | 1 | 1.5 | 0.00 | 0.31 | 0.05 | W4 | 1/5 | 3 | 3 | 1 | 1.80 | 1.16 | 0.24 |
| S5 | 3 | 3 | 1 | 5 | 1 | 45.00 | 2.14 | 0.36 | * S | 4.80 | 1.00 | |||||
| * S | 5.93 | 1.00 | ||||||||||||||
| * F | O1 | O2 | O3 | O4 | Si | Ri | αi | * F | T1 | T2 | T3 | T4 | T5 | Si | Ri | αi |
| O1 | 1 | 1/3 | 1/5 | 1/3 | 0.02 | 0.39 | 0.07 | T1 | 1 | 7 | 1 | 1 | 1 | 7.00 | 1.48 | 0.25 |
| O2 | 3 | 1 | 1 | 5 | 15.00 | 1.97 | 0.38 | T2 | 1/7 | 1 | 1/3 | 1/5 | 1/7 | 0.00 | 0.27 | 0.05 |
| O3 | 5 | 1 | 1 | 5 | 25.00 | 2.24 | 0.43 | T3 | 1 | 3 | 1 | 1 | 1 | 3.00 | 1.25 | 0.21 |
| O4 | 3 | 1/5 | 1/5 | 1 | 0.12 | 0.59 | 0.11 | T4 | 1 | 5 | 1 | 1 | 1/3 | 1.67 | 1.11 | 0.19 |
| * S | 5.18 | 1.00 | T5 | 1 | 7 | 1 | 3 | 1 | 21.00 | 1.84 | 0.31 | |||||
| * S | 5.93 | 1.00 |
* F—factor/interaction. * S—Sum.
Table 5.
SWOT analysis of Hornád river basin.
| Strengths | αi | * P | Sum | Weaknesses | αi | * P | Sum |
|---|---|---|---|---|---|---|---|
| ecological status of river | 0.23 | 5 | 1.16 | chemical status of river | 0.51 | 4 | 2.03 |
| self-cleaning capacity of the basin | 0.19 | 3 | 0.56 | above-limit nitrite discharges | 0.15 | 3 | 0.44 |
| keeping the values of pH | 0.17 | 4 | 0.67 | above-limit arsenic and zinc discharges | 0.11 | 2 | 0.21 |
| keeping the values of soluble substances | 0.05 | 4 | 0.21 | above-limit discharges of bacteria | 0.24 | 3 | 0.72 |
| keeping the values of nitrates | 0.36 | 4 | 1.44 | ||||
| SUM | 4.05 | SUM | 0.72 | ||||
| Opportunities | αi | *P | Sum | Threats | αi | * P | Sum |
| completion of WWTPs | 0.07 | 3 | 0.22 | changes in the legislation | 0.25 | 4 | 0.99 |
| connectivity to WWTPs | 0.38 | 3 | 1.14 | increase of diffuse sources of pollution | 0.05 | 3 | 0.14 |
| increase the efficiency of WWTPs | 0.43 | 4 | 1.73 | unwillingness to use public sewerage | 0.21 | 3 | 0.63 |
| drawing funds from the EF | 0.11 | 3 | 0.34 | bad condition of WWTPs | 0.19 | 4 | 0.75 |
| undersized WWTPs | 0.31 | 5 | 1.55 | ||||
| SUM | 3.43 | SUM | 4.05 |
* P—points.
Table 6.
Matrix of positive aspects in the development of surface water quality in the Hornád river basin.
Table 6.
Matrix of positive aspects in the development of surface water quality in the Hornád river basin.
| f1 | f2 | f3 | f4 | f5 | f6 | f7 | f8 | f9 | f10 | f11 | Si | Ri | αi | |
|---|---|---|---|---|---|---|---|---|---|---|---|---|---|---|
| f1 | 1 | 1 | 1/3 | 1/3 | 3 | 3 | 1/5 | 1/5 | 3 | 1/7 | 5 | 0.086 | 0.80 | 0.06 |
| f2 | 1 | 1 | 5 | 5 | 5 | 3 | 1 | 3 | 3 | 5 | 9 | 151,875.000 | 2.96 | 0.22 |
| f3 | 3 | 1/5 | 1 | 1 | 1 | 1 | 3 | 5 | 1/3 | 1 | 3 | 9.000 | 1.22 | 0.09 |
| f4 | 3 | 1/5 | 1 | 1 | 1 | 3 | 3 | 1/3 | 3 | 1 | 3 | 16.200 | 1.29 | 0.10 |
| f5 | 1/3 | 1/5 | 1 | 1 | 1 | 3 | 1 | 1/3 | 5 | 1 | 7 | 2.333 | 1.08 | 0.08 |
| f6 | 1/3 | 1/3 | 1 | 1/3 | 1/3 | 1 | 1/3 | 1 | 5 | 1 | 7 | 0.144 | 0.84 | 0.06 |
| f7 | 5 | 1 | 1/3 | 1/3 | 1 | 3 | 1 | 3 | 3 | 3 | 5 | 225.000 | 1.64 | 0.12 |
| f8 | 5 | 1/3 | 1/5 | 3 | 3 | 1 | 1/3 | 1 | 5 | 1 | 7 | 35.000 | 1.38 | 0.10 |
| f9 | 1/3 | 1/3 | 3 | 1/3 | 1/5 | 1/5 | 1/3 | 1/5 | 1 | 1/5 | 1/3 | 0.000 | 0.37 | 0.03 |
| f10 | 7 | 1/5 | 1 | 1 | 1 | 1 | 1/3 | 1 | 5 | 1 | 9 | 21.000 | 1.32 | 0.10 |
| f11 | 1/5 | 1/9 | 1/3 | 1/3 | 1/7 | 1/7 | 1/5 | 1/7 | 3 | 1/9 | 1 | 0.000 | 0.27 | 0.02 |
| SUM | 13.16 | 1.00 | ||||||||||||
Table 7.
Matrix of negative aspects in the development of surface water quality in the basin.
| f1 | f2 | f3 | f4 | f5 | f6 | f7 | f8 | Si | Ri | αi | |
|---|---|---|---|---|---|---|---|---|---|---|---|
| f1 | 1 | 1 | 1 | 1/3 | 5 | 7 | 5 | 1/3 | 19.44 | 1.45 | 0.16 |
| f2 | 1 | 1 | 1 | 1/3 | 1/3 | 1 | 3 | 5 | 1.67 | 1.07 | 0.12 |
| f3 | 1 | 1 | 1 | 1 | 1/3 | 1 | 3 | 5 | 5.00 | 1.22 | 0.14 |
| f4 | 3 | 3 | 1 | 1 | 5 | 1 | 3 | 3 | 405.00 | 2.12 | 0.24 |
| f5 | 1/8 | 3 | 3 | 1/5 | 1 | 5 | 3 | 3 | 10.13 | 1.34 | 0.15 |
| f6 | 1/7 | 1 | 1 | 1 | 1/5 | 1 | 3 | 5 | 0.43 | 0.90 | 0.10 |
| f7 | 1/5 | 1/3 | 1/3 | 1/3 | 1/3 | 1/3 | 1 | 1/3 | 0.00 | 0.36 | 0.04 |
| f8 | 3 | 1/5 | 1/5 | 1/3 | 1/3 | 1/5 | 3 | 1 | 0.01 | 0.55 | 0.06 |
| SUM | 9.00 | 1.00 |
Table 8.
The resulting matrix for assessing the impacts of wastewater discharges into the Hornád river basin.
Table 8.
The resulting matrix for assessing the impacts of wastewater discharges into the Hornád river basin.
| Factor | PS [%] | S [%] | SR |
|---|---|---|---|
| ecological status of the Hornád river | +3.61 | 59.40 | 1.46 |
| self-cleaning capacity of the basin | +13.35 | ||
| positive development trend of pH | +5.51 | ||
| positive development trend of soluble substances | +5.81 | ||
| positive development trend of N-NO3 concentration | +4.87 | ||
| completion of water infrastructure | +3.78 | ||
| connection to WWTPs | +7.38 | ||
| Intensification of WWTPs | +6.23 | ||
| innovative technologies | +1.69 | ||
| synergistic effect of discharged residual pollution and water quality | +5.95 | ||
| possibility of using funds from the EF | +1.20 | ||
| chemical status of surface water | –6.54 | 40.60 | |
| above-limit discharge of N-NO2 | –4.81 | ||
| above-limit discharge of As and Zn | –5.52 | ||
| above-limit residual biological pollution | –9.56 | ||
| increase of diffuse sources of surface water pollution | –6.03 | ||
| reluctance of the population to use public sewers and WWTPs | –4.06 | ||
| bad condition of WWTPs | –1.62 | ||
| non-compliance with legislative regulations | –2.47 |
PS—partial score. S—score. SR—scoring ratio.
Table 9.
Categorization of the impact of wastewater discharge on surface water quality.
| Wastewater Discharge Impact Category | Scoring Rate | |
|---|---|---|
| I. | Negligible impact | above 1.5 |
| II. | Very low impact | 1.49–1.10 |
| III. | Slight effect | 1.09–0.85 |
| IV. | Average impact | 0.84–0.55 |
| V. | Significant impact | 0.54 and less |
Publisher’s Note: MDPI stays neutral with regard to jurisdictional claims in published maps and institutional affiliations. |
© 2021 by the authors. Licensee MDPI, Basel, Switzerland. This article is an open access article distributed under the terms and conditions of the Creative Commons Attribution (CC BY) license (https://creativecommons.org/licenses/by/4.0/).
Share and Cite
MDPI and ACS Style
Bakalár, T.; Pavolová, H.; Tokarčík, A. Analysis and Model of River Basin Sustainable Management by SWOT and AHP Methods. Water 2021, 13, 2427. https://doi.org/10.3390/w13172427
AMA Style
Bakalár T, Pavolová H, Tokarčík A. Analysis and Model of River Basin Sustainable Management by SWOT and AHP Methods. Water. 2021; 13(17):2427. https://doi.org/10.3390/w13172427
Chicago/Turabian StyleBakalár, Tomáš, Henrieta Pavolová, and Alexander Tokarčík. 2021. "Analysis and Model of River Basin Sustainable Management by SWOT and AHP Methods" Water 13, no. 17: 2427. https://doi.org/10.3390/w13172427
Note that from the first issue of 2016, this journal uses article numbers instead of page numbers. See further details here.