
River Runoff Modelling and Hydrological Drought Assessment Based on High-Resolution Brightness Temperatures in Mainland China
by
Xing Qu
1,2, 
Ziyue Zeng
1,2,*,
Zhe Yuan
1,2,*,
Junjun Huo
1,2,
Yongqiang Wang
1,2 and
Jijun Xu
1,2 1
Changjiang River Scientific Research Institute of Changjiang Water Resources Commission, Wuhan 430010, China
2
Hubei Provincial Key Laboratory of Basin Water Resources and Ecological Environment, Wuhan 430010, China
*
Authors to whom correspondence should be addressed.
Water 2021, 13(17), 2429; https://doi.org/10.3390/w13172429
Submission received: 16 July 2021
/
Revised: 31 August 2021
/
Accepted: 1 September 2021
/
Published: 3 September 2021
(This article belongs to the Special Issue Characterizing, Monitoring and Prediction of Hydrometeorological Extremes under Climate Change)
Abstract
:Under the background of global climate change, drought is causing devastating impacts on the balance of the regional water resources system. Hydrological drought assessment is critical for drought prevention and water resources management. However, in China to assess hydrological drought at national scale is still challenging basically because of the difficulty of obtaining runoff data. In this study, we used the state-of-the-art passive microwave remote sensing techniques in river runoff modelling and thus assessed hydrological drought in Mainland China in 1996–2016. Specifically, 79 typical hydrological stations in 9 major basins were selected to simulate river runoff using the M/C signal method based on a high-resolution passive microwave bright temperature dataset. The standardized runoff index (SRI) was calculated for the spatial and temporal patterns of hydrological drought. Results show that passive microwave remote sensing can provide an effective way for runoff modelling as 92.4% and 59.5% of the selected 79 stations had the Pearson correlation coefficient (R) and the Nash-Sutcliffe efficiency coefficient (NS) scores greater than 0.5. Especially in areas located on Qinghai-Tibet Plateau in the Inland and the Southwest River Basin, the performance of the M/C signal method is quite outstanding. Further analysis indicates that stations with small rivers in the plateau areas with sparse vegetation tend to have better simulated results, which are usually located in drought-prone regions. Hydrological drought assessment shows that 30 out of the 79 stations present significant increasing trends in SRI-3 and 18 indicate significant decreasing trends. The duration and severity of droughts in the non-permanent dry areas of the Hai River Basin, the middle reaches of the Yangtze River Basin and the Southwest of China were found out to be more frequent and severe than other regions. This work can provide guidance for extending the applications of remote sensing data in drought assessment and other hydrological research.
1. Introduction
As one of the most complex natural phenomena, droughts with extreme severity can tremendously influence crop production, water resources, natural ecology, thus producing destructive impacts on the ecosystem and social-economic development in the world [1]. Under the background of climate change, such influences show an increasing trend, which has led to great attention from both the scientific community and the public worldwide [2]. For example, in Europe, central Europe is frequently affected by drought due to significant precipitation and temperature variations. Financial losses due to the 2018 drought were estimated to be about 3,000,000,000 EUR, which made it the costliest single-year event in Europe [3,4]. The Australian Bureau of Agricultural and Resource Economics and Sciences reported that the 2006 drought reduced national winter cereal crops by 36% and cost $3,500,000,000 AUD, leaving numerous farmers in fiscal crisis [5]. Similarly, China is now facing a very severe shortage of water resources. Drought disasters are constantly occurring, causing extremely serious economic losses in China [6]. Especially during 1997–2009, with extreme droughts occurring almost every two years, the affected area and economic losses nationwide were significantly higher than the average of the recent 30 years [7]. For example, according to the China’s Ministry of Water Resources, 29,258,800 hectares of crops were affected by drought in 2009, and 89 cities struggled with water shortages, causing economic losses of about $176,630,000,000 billion [8]. Several severe drought events including the mega-drought in Sichuan Province and Chongqing City in 2006 and the 2009–2012 meteorological drought of record-breaking magnitudes in the Southwest China, caused devastating and long-lasting impacts to agriculture, society, economy and ecosystems in local but large areas [9,10]. In recent years, affected by global warming and human activities, extreme weather is becoming more and more frequent. Drought disasters still pose a great threat, especially to the North and West China [11,12].
In general, drought can be divided into three main categories: meteorological, agricultural and hydrological drought [2,7]. Meteorological drought is mainly triggered by low precipitation, which is the result of abnormal atmospheric circulation. Agricultural drought, also called soil water drought, is characterized by the deficit in soil water. Hydrological drought is related to the low flow or water level of rivers, lakes, groundwater and other water bodies. Depending on which part of the hydrological cycle is most impacted, the form of drought can change. Meteorological drought caused by a lack of precipitation during a certain period of time can propagate and develop into the others. Hydrological drought characterized by a reduction in streamflow is considered the most complex drought as it evolves along with the land-surface hydrological process. Incalculable impact on the balance of the regional water resources system can be caused once hydrological drought occurs [13,14]. Therefore, effective monitoring, analysis and assessment of hydrological drought is an important prerequisite for rational management and effective utilization of water resources [7]. To evaluate their frequency, duration and severity, drought indices, such as the standardized precipitation index (SPI) [15], the soil moisture drought index (SMDI) and the standardized runoff index (SRI) are the most widely used methods [15,16,17]. Many studies based on different drought indices have been conducted in China for recent decades. For instance, the propagation of meteorological drought to hydrological drought under the influence of human activities in the Hai River basin of the North China was simulated by Xu et al. [18] based on the SPI and SRI. Xiang et al. [19] combined a multidimensional Copula function hydrological approach with the SRI to assess hydrological drought risk in arid inland basins of China. Results showed that the study area was dominated by mild to moderate hydrological droughts in 1961–2018. Lei et al. [20] also investigated the transition mechanism from meteorological drought to hydrological drought for major basins of China from 1961 to 2014 using the SPEI and SRI. However, these studies usually forced on a single or a few basins and it is difficult to reveal the patterns of hydrological drought across China. Moreover, as the most basic data for drought assessment, river runoff is very difficult to obtain in mountainous or highland areas and international river basins in China [21], which restricts comparative analysis of hydrological drought in multiple basins at national scale. To overcome this obstacle, hydrological modelling is the most widely used method. However, for many areas, information on model inputs such as accurate precipitation and river morphology is often insufficient. High-resolution modelling usually relies on massive computational resources [22,23], especially in the Qinghai-Tibet Plateau region, where the presence of glacial snow and frozen earth, as well as the lack of meteorological data and complex hydrological cycle mechanisms further constrain the application of hydrological models. Meanwhile, with the rapid development of remote sensing technology, real-time or near-real-time satellite data of high efficiency, wide observation range and large volume have been widely used in earth science research, including vegetation classification, land use/cover (LULC) planning, environmental pollution and disaster monitoring [24]. Remote sensing can provide another effective way to obtain basic information to simulate river runoff for drought assessment. To date, applications of using remote sensing spatial information in hydrological cycle research have recently gained popularity in hydrological research [25,26,27]. Compared with optical remote sensing, microwave remote sensing is basically not restricted by meteorological conditions and can observe and monitor surface changes day and night. In particular, satellite network equipped with microwave sensors can obtain daily global coverage data and minimize the interference of non-water features in runoff simulation, which has obvious advantages and can provide a new way to obtain data for drought studies in areas where data are scarce [28,29]. Furthermore, brightness temperature (Tb), a fundamental parameter measured by the satellite microwave radiometer traveling upward from the Earth’s surface to the satellite, is one of the core methods used in river runoff simulation based on passive microwave remote sensing [30,31]. The radiation properties of the ground surface can be reflected by Tb. For example, Tb of water bodies is often lower than other land features, which can be adopted for water body detection and runoff monitoring by methods such as threshold classification [32]. Many institutes, including the National Aeronautics and Space Administration (NASA), the National Snow and Ice Data Center (NSIDC) provide real-time data download service of Tb observations for free, whose time period can date back to 1979. Meanwhile, the theoretical methods of passive microwave remote sensing for river runoff simulation are relatively mature, among which the M/C signal proposed by Brakenridge et al. [32,33,34] is the most typical method. It has been applied in many basins around the world and works effectively. For example, van Dijk et al. [35] used the M/C signal to simulate the monthly average runoff at 442 rivers worldwide and the results show that its performance is better in small rivers or tropical areas than that in arid areas. Revilla-Romero et al. [36] also applied the M/C signal method in typical river basins in Europe, Asia, Africa and the South America. Climate type, LULC type and basin area were found out to be the dominant influencing factors.
In this paper, we explored how microwave remote sensing Tb data can promote the current hydrological drought assessment by combining the M/C signal method with the SRI algorithm in typical basins of Mainland China. The main objectives of this study are to discuss the utility of microwave remote sensing data for drought assessment and to reveal the patterns of hydrological drought over the last few decades in Mainland China, as well as to gain a better understanding of drought disasters in areas lacking in long-term station observed data but frequently hit by drought hazards, such as the northern Tibet, the Tarim Basin, the Yunnan-Guizhou Plateau and remote areas in northeastern China. First, 79 stations in 9 major basins of Mainland China were selected for runoff modelling using the latest global high-resolution passive microwave Tb dataset based on the M/C signal method. Then, hydrological drought assessment based on simulated runoff data was conducted using the SRI algorithm. Further investigation was made to explore how topographic and hydro-meteorological factors influenced the runoff simulated results. In the end, the spatial and temporal patterns of hydrological drought in the major basins of Mainland China were discussed and summary and conclusions were drawn.
2. Study Areas and Data
2.1. Study Areas
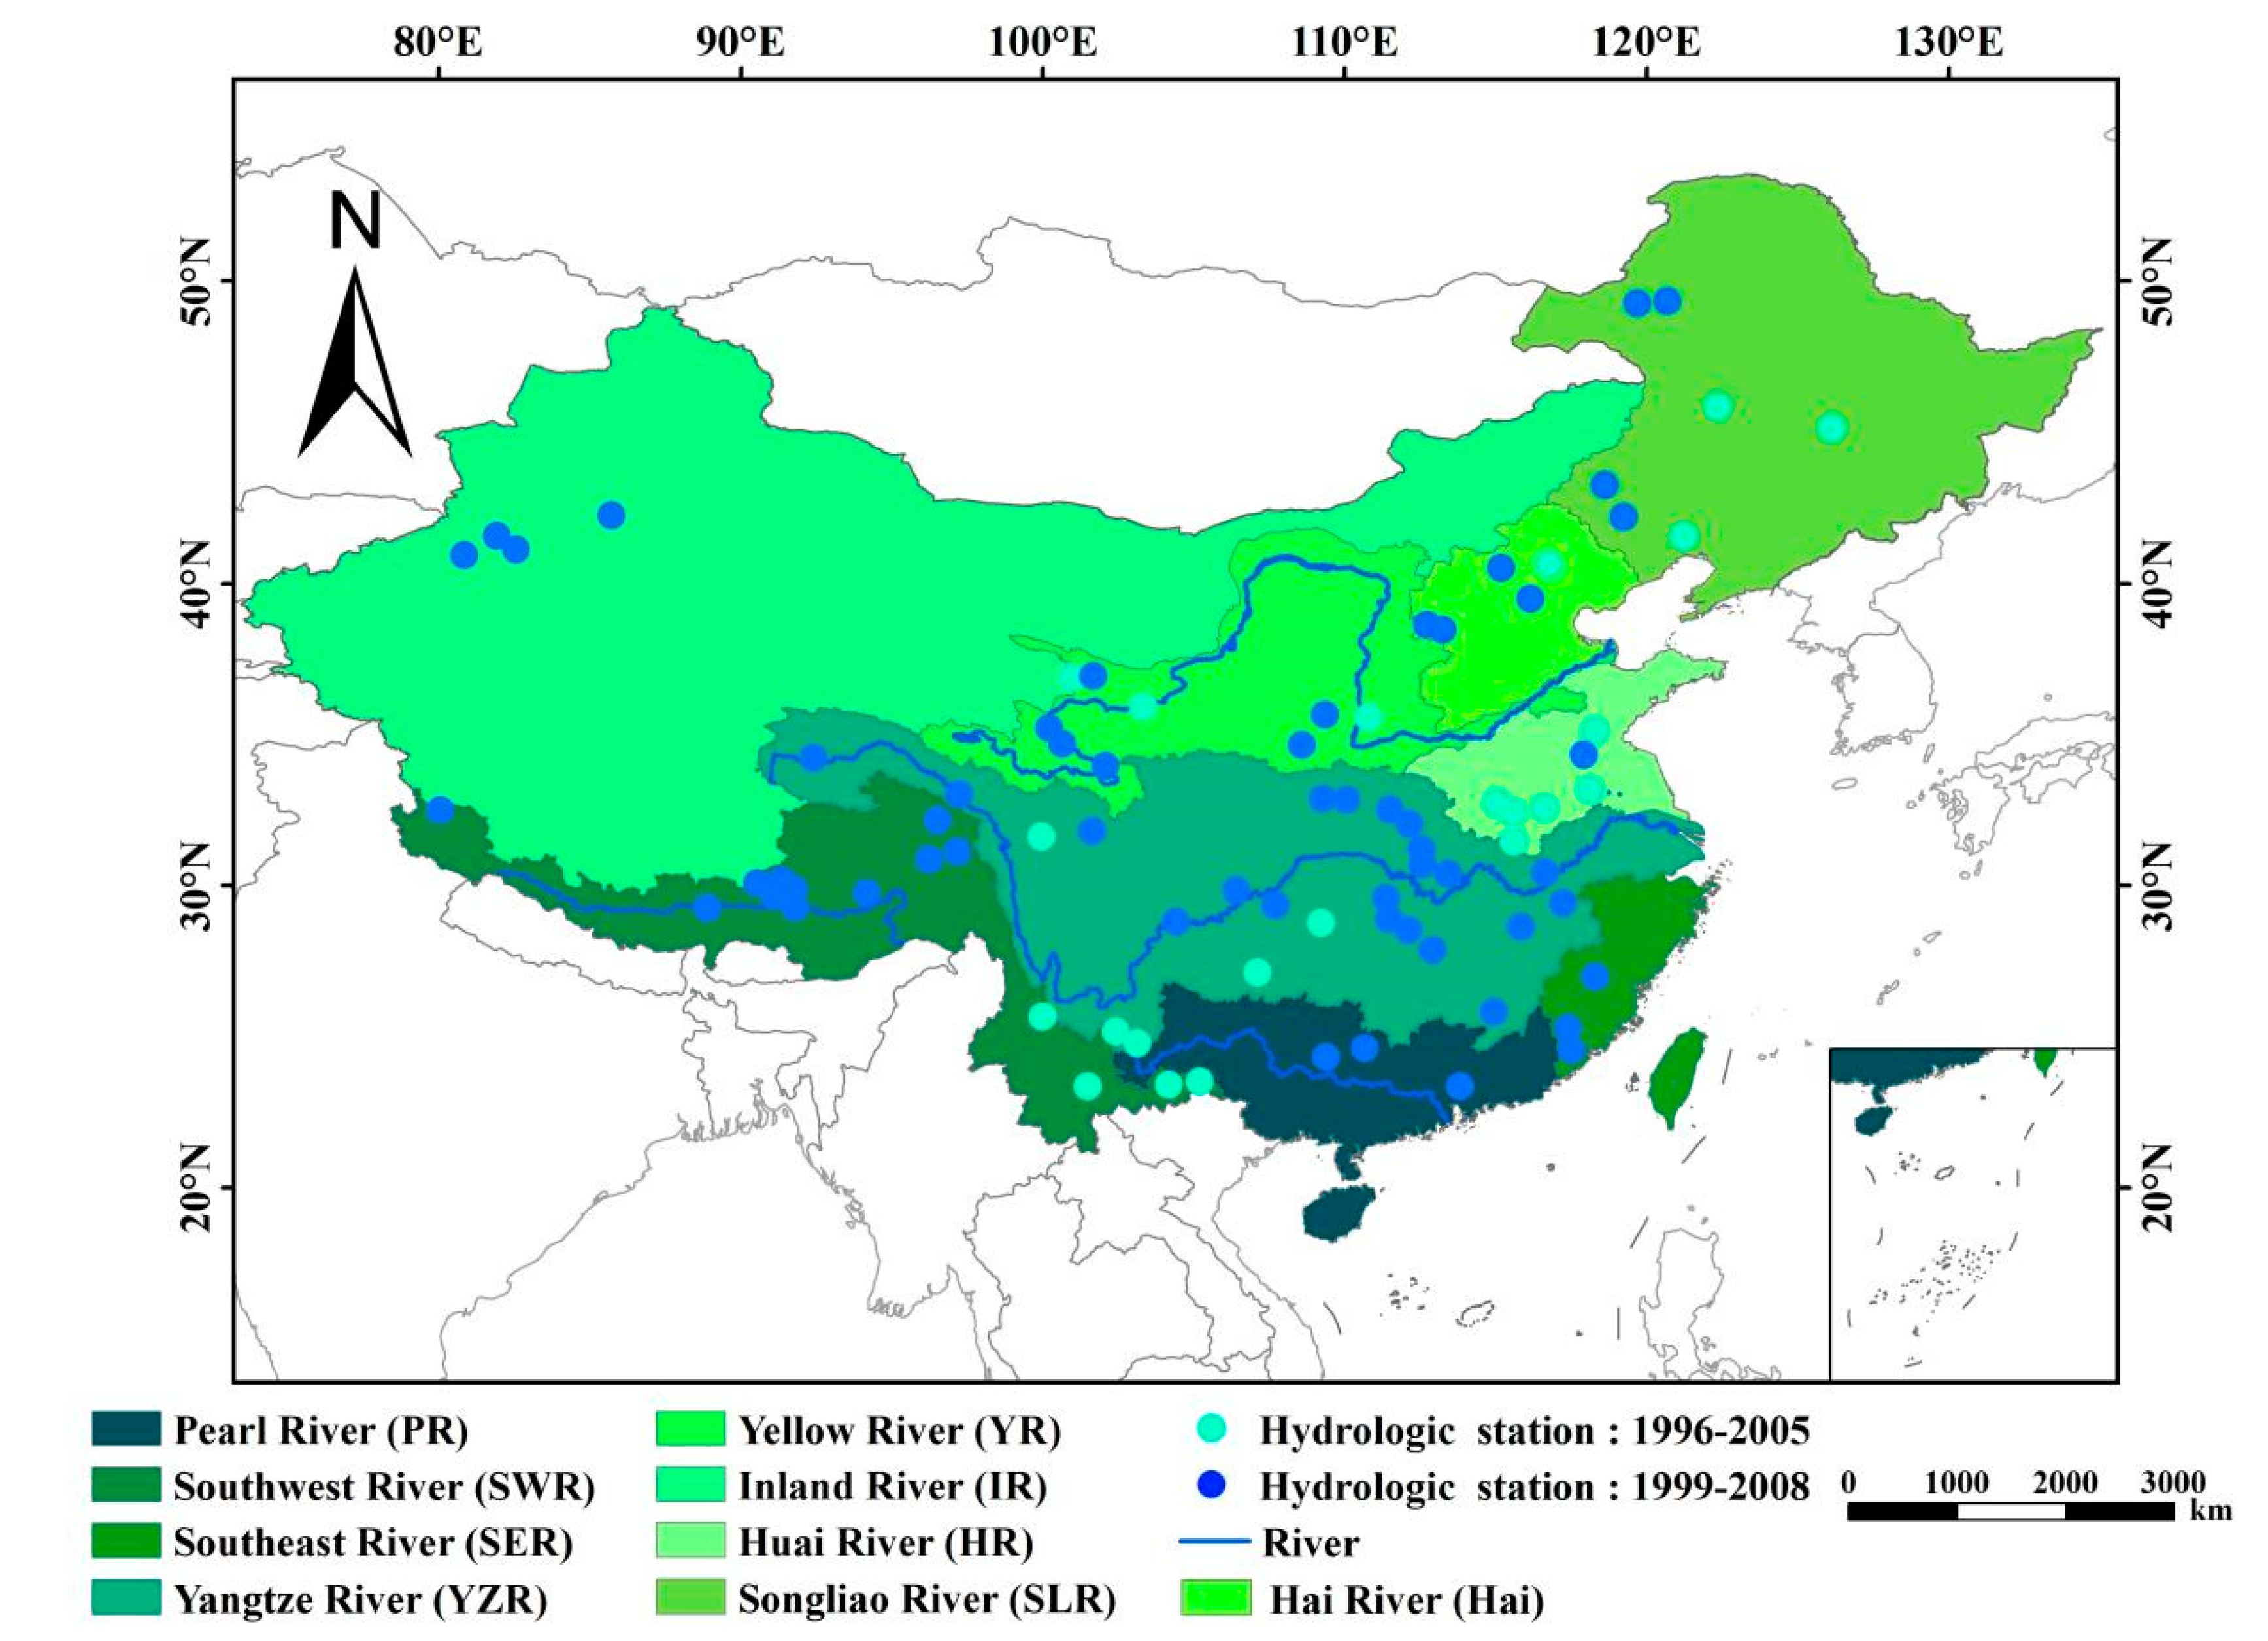
China is a vast country with an area of 9.63 × 10⁶ km2 and has a great variety of climates, varying from tropical, subtropical to temperate and polar [37]. The topography descends from the west to the east, forming a three-step “staircase” according to altitude. The 9 major basins include the Yangtze River Basin (YZR), the Yellow River Basin (YR), the Pearl River Basin (PR), the Southwest River Basin (SWR), the Huai River Basin (HR), the Southeast River Basin (SER), the Hai River Basin (Hai), the Songliao River Basin (SLR) and the Inland River Basin (IR). In this study, 79 typical hydrological stations were selected in these basin areas, involving 65 small, medium and large rivers (Figure 1). Among them, the middle and lower reaches of the YZR and YR, PR, HR and SER are mainly plain or hilly areas, with well-developed river systems and high-dense station networks. The SWR and the three rivers’ source region (TRSR), located on the Qinghai-Tibetan Plateau, which belong to the plateau area, are the source of many rivers. However, gauging station records are generally sparse in the SWR and TRSR as the topography and climate conditions are relatively harsh. While the IR, SLR and Hai belong to the arid and cold zones, characterized by low annual precipitation, low annual runoff and frequent drought disasters [19,38].
2.2. Data
2.2.1. Hydrological Data
Daily observed runoff of 79 typical hydrological stations in the 9 major basins were collected. The period of all the data is from 1996 to 2008, with records from 57 stations of 1999–2008 and 22 stations of 1996–2005. A few data gaps existed and linear interpolation was performed to fill them. Table 1 shows the basic information of the hydrological data.
2.2.2. Remote Sensing Data
A high-resolution passive microwave Tb dataset from the Making Earth System data records for Use in Research for Earth Science (MEaSUREs) multi-platform Calibrated Brightness Temperature Earth System Data Record (ESDR) (CETB) was used in this study [39]. This dataset was released by NSIDC in 2017. It compiles global Tb time series generated from data records of the Scanning Multichannel Microwave Radiometer (SMMR), the Special Sensor Microwave/Imager (SSM/I), the Special Sensor Microwave Image/Sounder (SSMIS) and the Advanced Microwave Scanning Radiometer-Earth Observing System (AMSR-E) sensors from 1978 to present. These data have been produced at smoothed 25 km resolution and an imaging reconstruction algorithm developed at the Brigham Young University was used to enhance the data resolution up to 12.5 km, and 3.125 km [40]. The CETB has been well evaluated in studies of water and snow surface detection with the H-polarized 36.5 or 37 GHz frequency channels showing the highest sensitivity to water surface changes [27,41,42]. Therefore, the high-resolution Tb data extracted from the SSM/I sensor 37 GHz at H-polarization with a data period of 1996–2008 at a resolution of 3.125 km, was utilized for the M/C signal to detect river runoff changes in this study.
2.2.3. Reference Data
The reference data used to evaluate surface conditions for the performance of satellite passive microwave signals are: 90 m Digital Elevation Model (DEM) data from the Shuttle Radar Topographic Mapping Mission [43], 250 m river width data from the Global Width Database for Large Rivers (GWD-LR) [44], 500 m LULC data [45] and 250 m Vegetation Continuous Fields (VCF) [46] from the Moderate Resolution Imaging Spectroradiometer (MODIS) Level 3 products, climate zones from the World Map of Köppen-Geiger climate classification [47,48]. The above data were all upscaled into the same spatial resolution (3.125 km) as the Tb data.
3. Methods
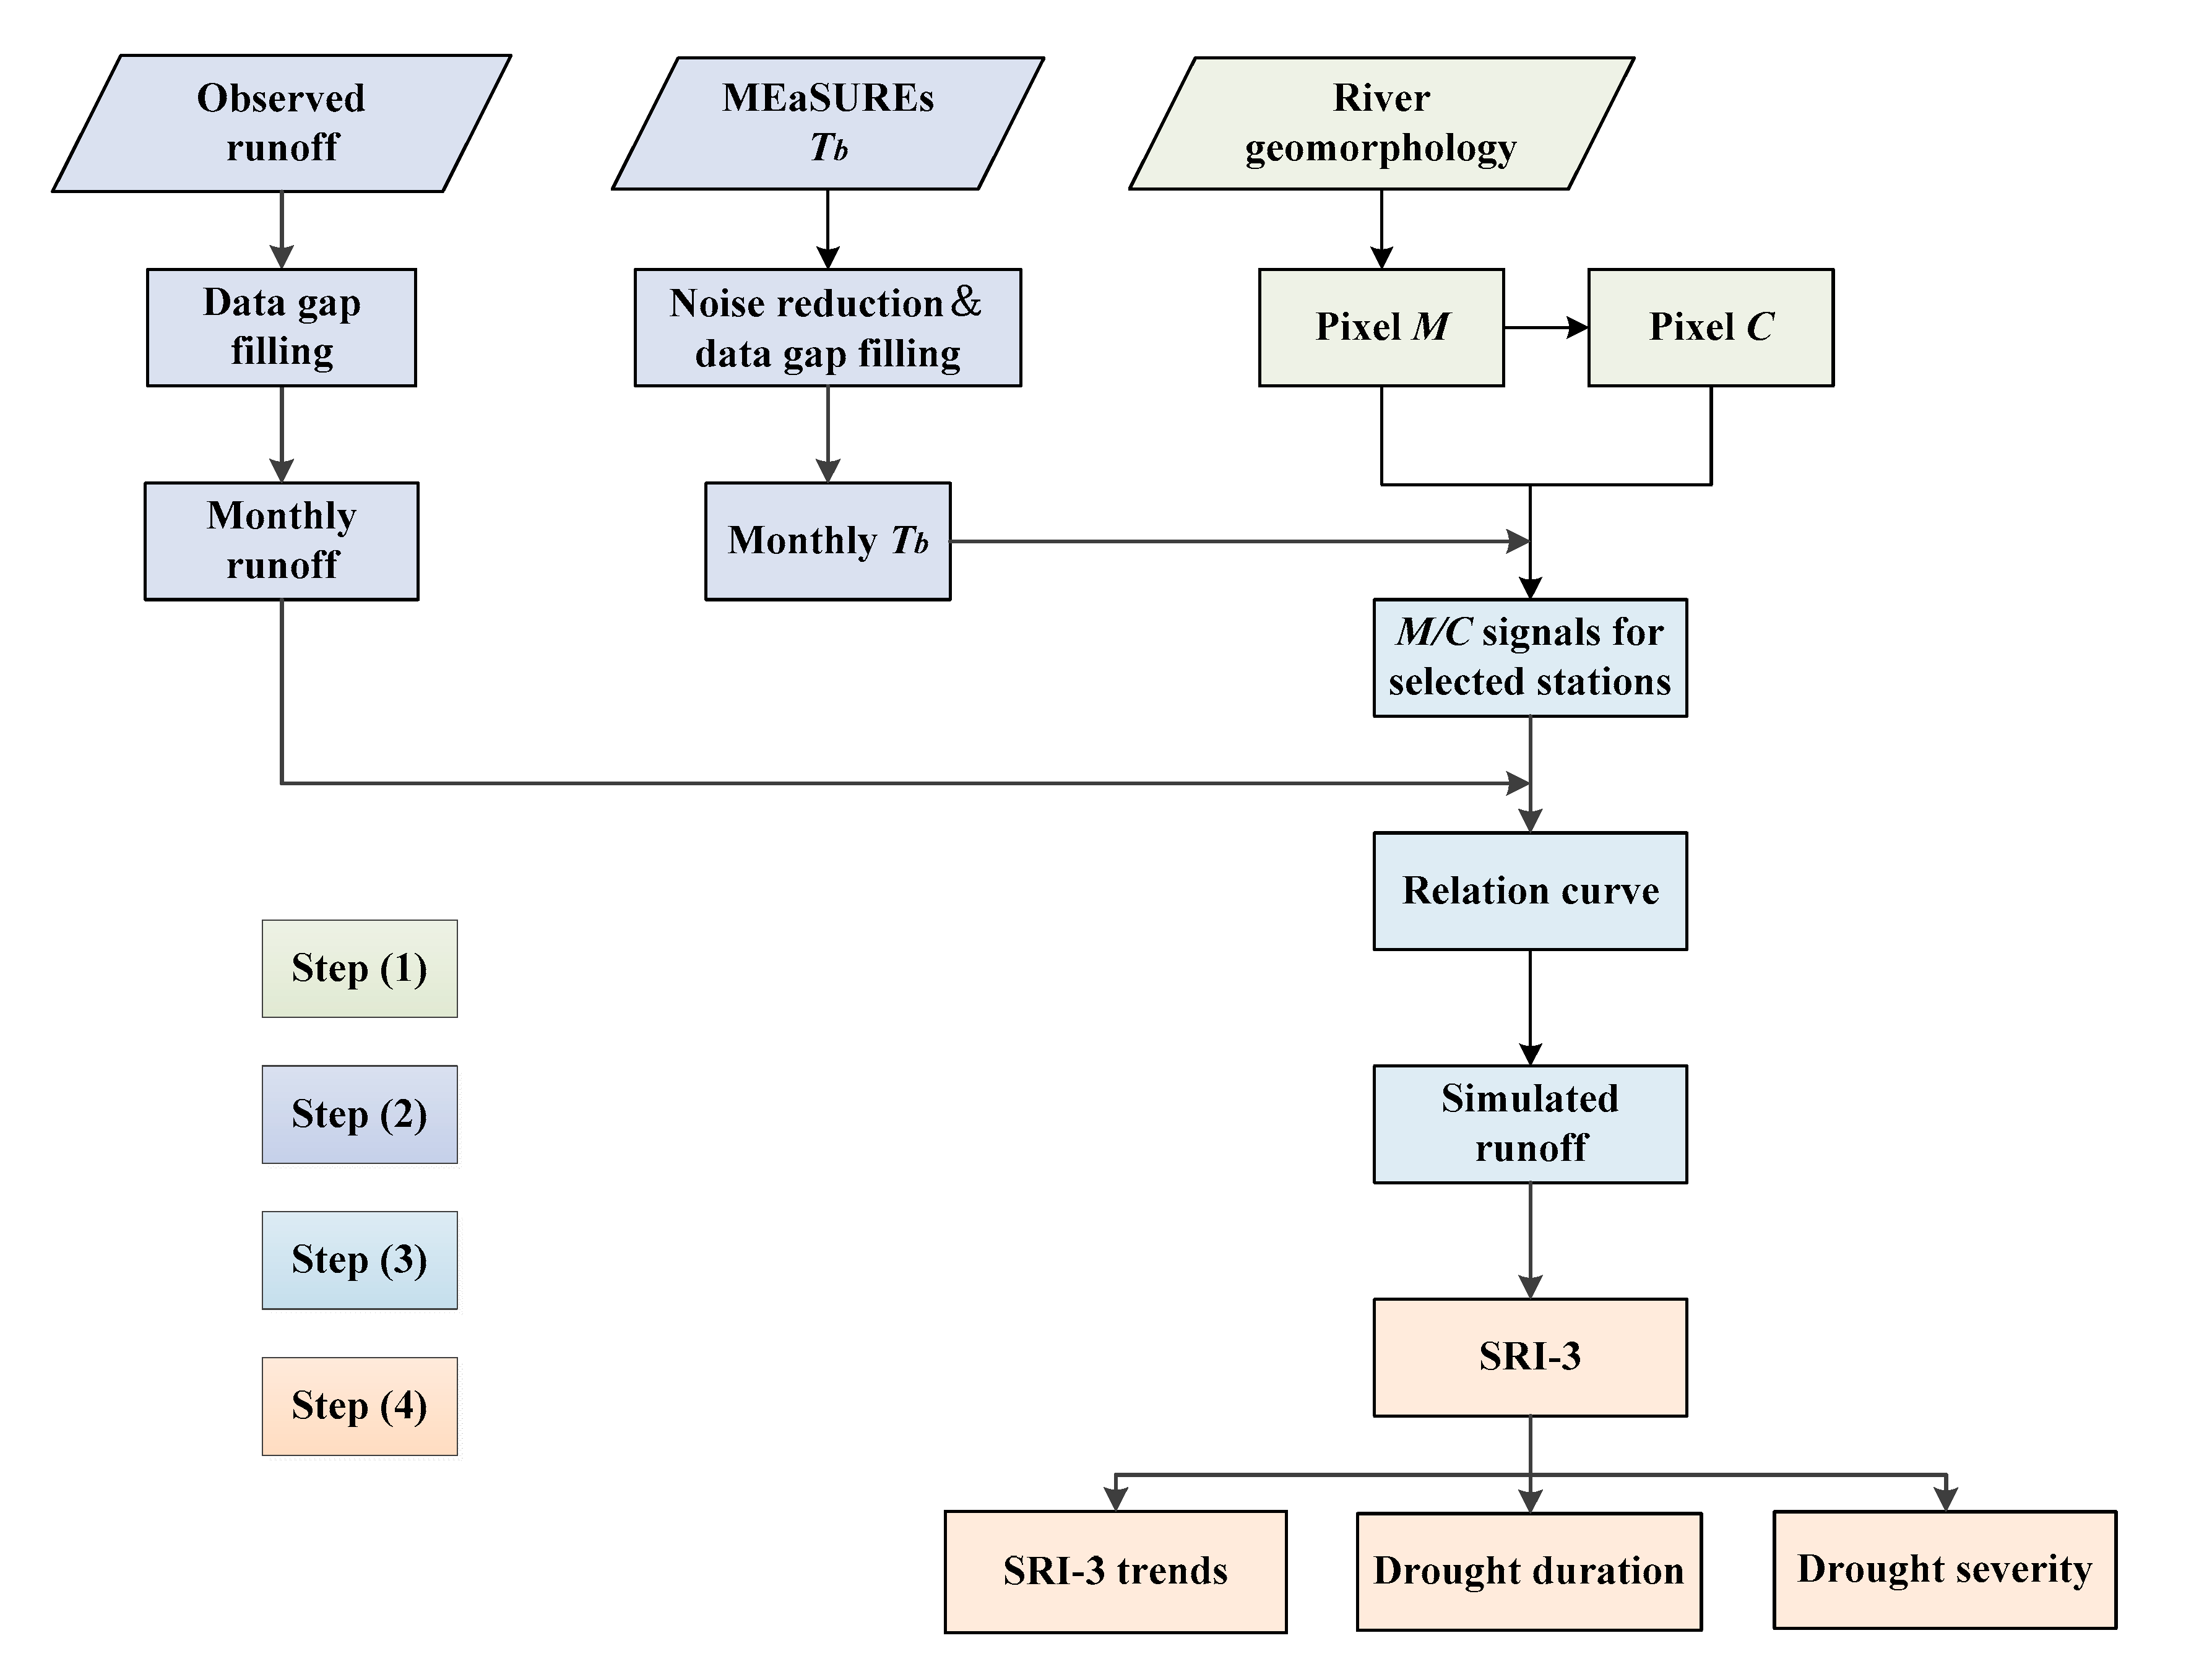
As shown in Figure 2, the hydrological drought assessment based on passive microwave data was conducted in the following steps: (1) choosing pixels of M and C at the location of each station; (2) pre-processing observed runoff and Tb data extracted from the passive microwave dataset; (3) calculating the M/C signals and developing the relation curve between the M/C signals and observed runoff for each station to build the runoff model; (4) assessing the patterns of hydrological drought using the SRI based on the monthly runoff obtained from the step (3).
3.1. Processing Steps for Tb Data
Before extracting the Tb data, pixels M and C needed to be selected according to the station location. The “wet pixel” (pixel M with the Tb value marked as M) that covers part or all of the river channel is located near the station in a non-bending river. The water level in this pixel will rise when flooding, so the floodplain on both sides of the river shows periodic or seasonal changes in the Tb value. Correspondingly, the “dry pixel” (pixel C with the Tb value marked as C) covers only land areas near the “wet pixel”. To make the selection process automatic, C is determined as the brightest (95th percentile, avoiding selecting outliers) value of the pixels within a 9 × 9 pixel array centered on the pixel M. Ideally, the C is not influenced by water bodies and can also represent the Tb of the region if all other influencing factors can be excluded.
According to the M/C signal method, by obtaining the ratio of Tb value of the dry and wet pixels, the influence of other environmental factors on the “wet pixel” can be excluded. Moreover, Planck’s radiation law considers that the Tb value of the object is related to its physical temperature T and emissivity . M and C can be expressed as follows:
where w stands for the surface water fraction of the pixel; Tb,l is the Tb of land; Tb,w is the Tb of water; Tb,m is M; Tm is the physical temperature of the pixel M; εl is the emissivity of the land part of the pixel M; Tb,c is C; Tc is the physical temperature of the pixel C; εw is the emissivity of water.
For pixels M and C at a certain region, an assumption is made that the physical temperatures of them are the same and the emissivity of the land in both pixels can be considered as equal. Therefore, the ratio of M and C can be expressed as:
Previous studies have shown that M/C reflects the variability of the water fraction in the pixel M and can be used as a monitoring signal for runoff variability. Since the emissivity of water bodies tends to be around 0.5, while the emission rate of land (e.g., rock minerals) is between 0.75 and 0.95 [49], the ratio M/C is taken in the range of 0 to 1. Moreover, the larger the water fraction w, the smaller the value of M/C and correspondingly the larger the runoff of the river within the pixel M.
3.2. Building a Runoff Simulation Model
It is recognized that for large rivers, using daily signals to monitor surface river runoff might result in a few days of lag when comparing with observed runoff. In other words, when the flood wave approaches, the water level at the gauging station will rise immediately, but streamflow will not spread rapidly to the river floodplain and the Tb values observed by remote sensing will not change in time, which may introduce errors in the rating curve of M/C and runoff [50]. In addition, Khan et al. [51] have observed that in some cases, it may lead to an overestimation compared to observed runoff during the dry season when using a single regression equation for calibration. To better reflect runoff characteristics and minimize errors, a linear regression equation was established separately for each month. The simulated runoff calibrated by the M/C signal method can be expressed as:
where Qs,i is the simulated runoff of month ith; ai and bi are the regression equation coefficients of the ith month; ()i is the value of ith month.
3.3. SRI Calculation and Run Theory
The SRI, which is used to characterize the hydrological droughts, is based on the SPI proposed by McKee [15,17]. In this study, due to the seasonal drought that exists in many of the selected river basins, SRI on a 3-month scale (SRI-3) was obtained as the drought indicator. The reason why 3-month timescale was adopted is to consider seasonally wet/dry conditions as well as to avoid redundant information if a longer timescale were used (e.g., 6–24 months). Assuming that the runoff volume for a certain time period is x, the probability density function f(x) of its gamma distribution can be expressed as:
where and are the shape and scale parameters, respectively, which can be calculated by the maximum likelihood method. is the gamma function. For a particular time scale, the cumulative probability of runoff x0 is as the following:
After standardizing the probability of the distribution, the SRI can be calculated by the following equation:
F is the probability derived from Equation (8) or Equation (9); when , S = 1; when , S = −1; the other values are empirical parameters, and their specific values are: c0 = 2.515517, c1 = 0.802853, c2 = 0.010328, d1 = 1.432788, d2 = 0.189269, d3 = 0.001308 [19].
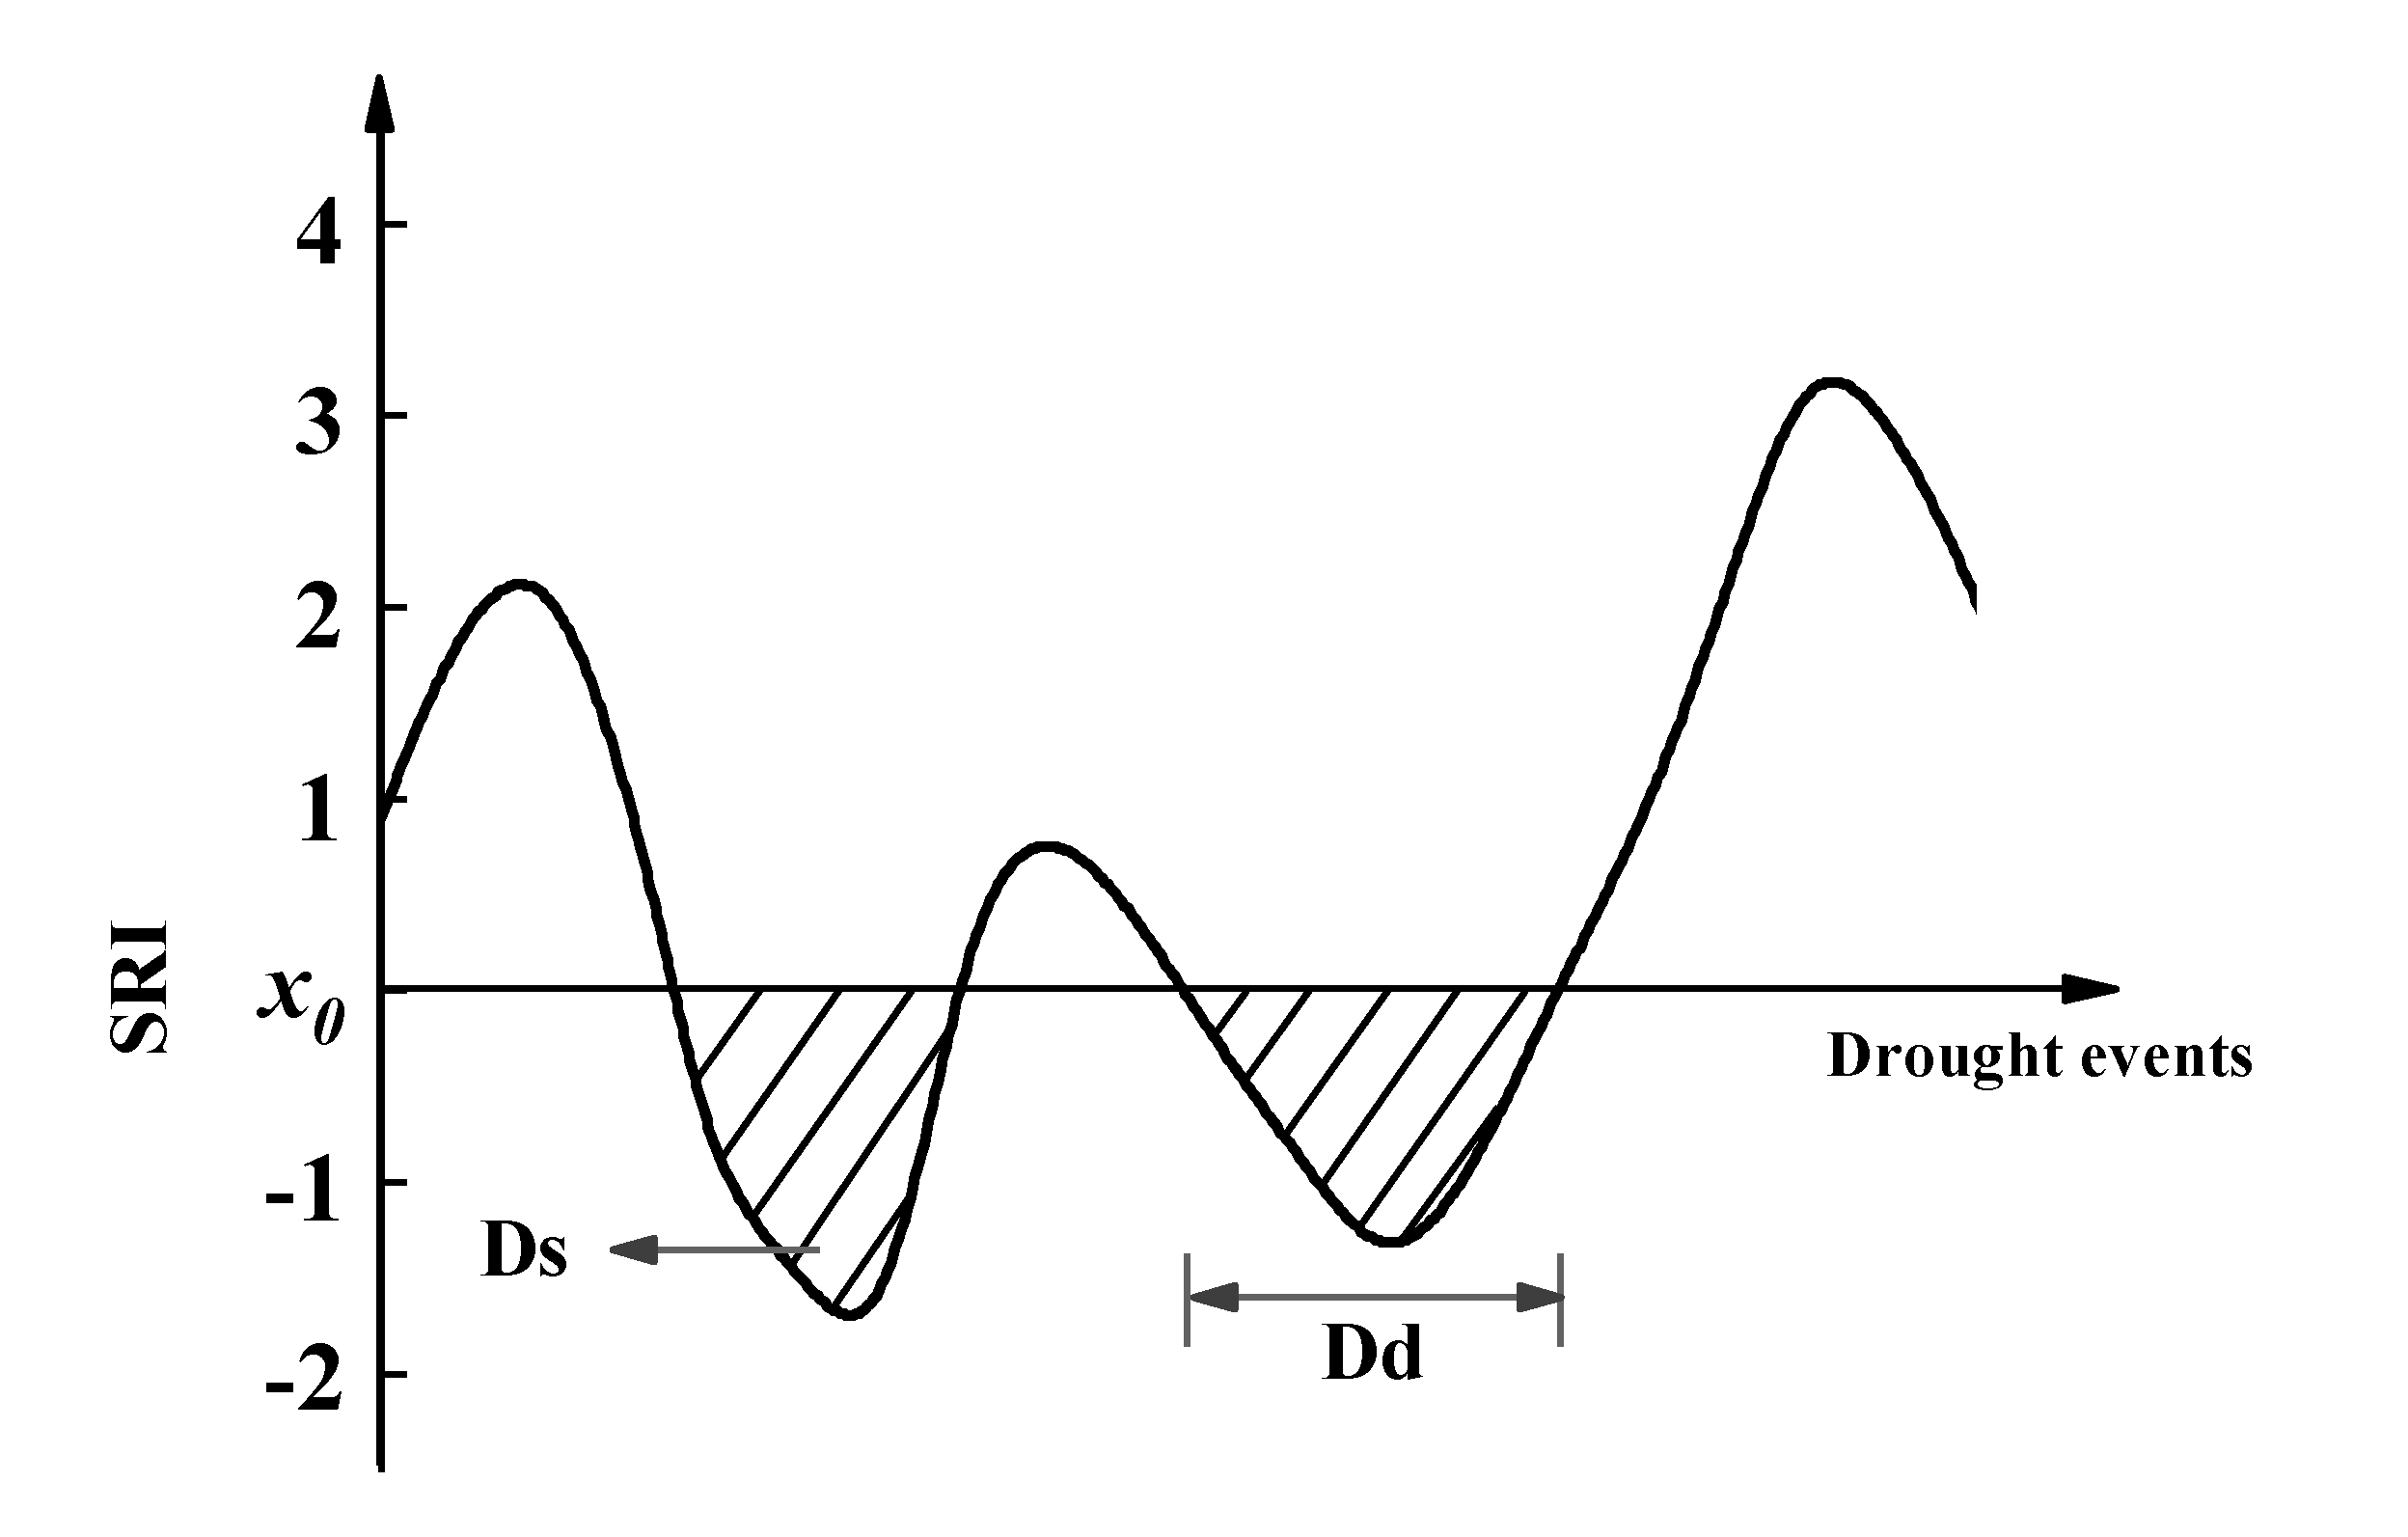
Based on the run theory [52], the drought characteristics include drought duration (Dd) and drought severity (Ds). Previous studies usually set −0.5 [19,53] or −1.0 [54] as a threshold to identify drought events. In this study, the threshold was defined as −1.0 in order to better separate the more severe drought events from the moderate drought events. The count of continuous months at which the value of the SRI is below the threshold x0 is Dd and the absolute sum of all SRI during the drought period is Ds. The run theory schemes are shown in Figure 3.
3.4. Statistical Metrics
In this study, the Pearson correlation coefficient (R), the Nash-Sutcliffe efficiency coefficient (NS) which are commonly used in hydrological modelling, were adopted to evaluate the simulation performance [56,57]. Among them the R and NS will be divided into 5 categories: <0.5, 0.5–0.7, 0.7–0.8, 0.8–0.9 and 0.9–1.0. To further analyze, the normalized centered root-mean-square error (NCRMSE) and the mean relative error (MRE), which are indicators of random error and systematic error, respectively, were used to reflect the dispersion between simulated and observed runoff values [58,59].
where Qo is for the observed monthly runoff, m3/s; Qs is for the simulated monthly runoff, m3/s; is for the average observed runoff, m3/s; is for the simulated average runoff, m3/s. R can be used to reflect the correlation between the simulated value and observed values. The range of values is 0–1. R value closer to 1 indicates that the performance of the runoff model is better. NS is commonly used to assess the predictive power of hydrological models and was calculated here also to reflect the fitting effect of the peaks. NS = 1 indicates a perfect match of simulation and observed data, whereas NS = 0 means the simulated result is as accurate as the mean of the observed value. The value range of NS is [−∞,−1]. The range of both NCRMSE and MRE is [0, ∞], when the values are equal to 0 for a perfect model.
4. Results
In the M/C signal method, the simulation accuracy not only depends on the geometry of the selected river cross-section and floodplain, but also is impacted by the time series data [60]. Considering the length of the measured runoff data, the first 7 years (1996–2002 or 1999–2005) were selected as the calibration period and the last 3 years (2003–2005 or 2006–2008) as the validation period for 79 typical stations in this paper. Firstly, the daily Tb values of pixels M and C from 1996 to 2008 were extracted, and then a 7-day forward running mean was performed for each pixel to remove data gaps as well as to eliminate the existing noise of the original data. Finally, for each month, the regression equation was obtained by linearly fitting the observed monthly runoff values and Tb values during the calibration period.
4.1. Runoff Simulation Results Obtained by the M/C Signal Method
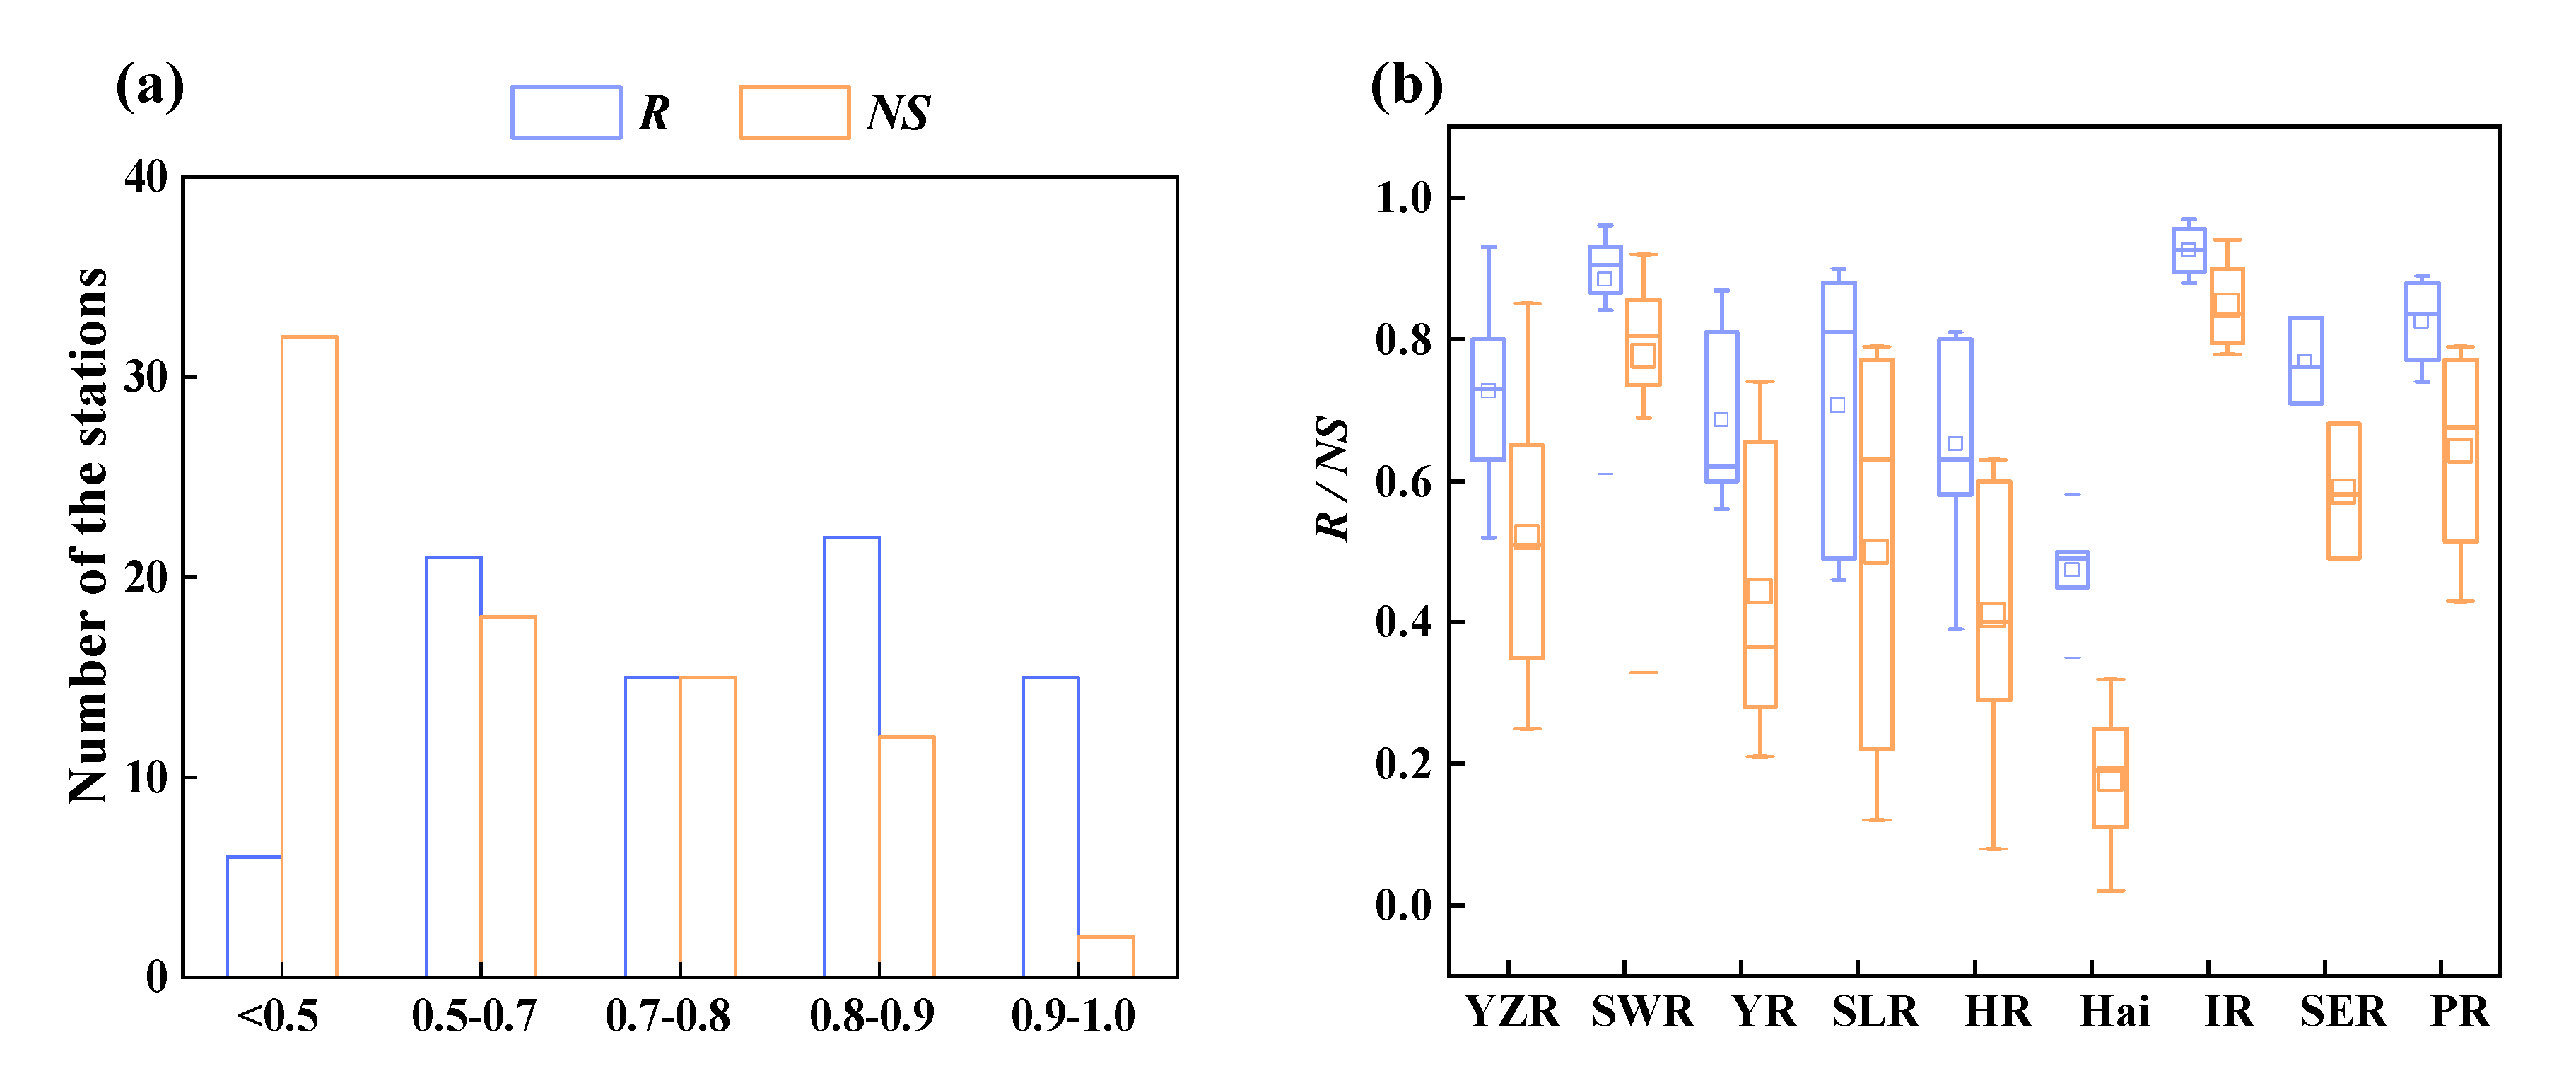
Figure 4a depicts the R and NS statistics of each category for the whole simulation time. The results indicate that among the 79 stations, the percentage of stations with R and NS reaching 0.5 is 92.4% and 59.5%. While the percentage of stations with R ≥ 0.8 is 46.8%, with 27.8% in the range of 0.8–0.9 and 19.0% reached 0.9. The NS is slightly worse, all stations are greater than 0, including 15.2% in the range of 0.8–0.9 and 2.5% reached 0.9. Figure 4b demonstrates the statistics for the 9 basins. In terms of individual station analysis, the best simulation results in the YZR were obtained at the Tuotuo River station as R is 0.93 and NS is 0.85, followed by the Zhimenda station on the source of the Yangtze River with R reaching 0.91 and NS above 0.82. R scores in the SWR are all greater than 0.61 and the mean value of NS reached 0.87 with the best simulation results observed at the Gengzhang station on the tributary of the Yarlung Tsangpo River. In the YR, runoff of the Qiaotou station at the source of the Yellow River and the Xiaochuan station in the upper reaches of the Yellow River were best simulated with R of 0.85 and NS above 0.72. The mean values of R and NS in the SLR reached 0.72 and 0.51, respectively, with the Balinqiao station on the tributary of Liao River showing the best performance. The stations in the IR have the best overall simulated results with all of the R scores exceeding 0.8 and NS exceeding 0.78, among which the Xidaqiao station on the Tarim River tributary shows the highest R and NS of 0.97 and 0.94, respectively. The simulated results of the PR are also quite good with the best R and NS of 0.89 and 0.79 at the Pingle station on the tributary of the Xi River. The performance of the other three basins (the HR, Hai and SER) are slightly less well, as shown in Figure 4b.
In comparison, the runoff model got the best performance at the IR, followed by the SWR, while the performance of the Hai is worse than others due to low streamflow, a relatively narrow river channel and a lack of discernible Tb difference between pixels M and C. As shown in Figure 5, R score of each station during the validation period shows a decreasing trend from the west to east, which is similar with the spatial distribution of NS.
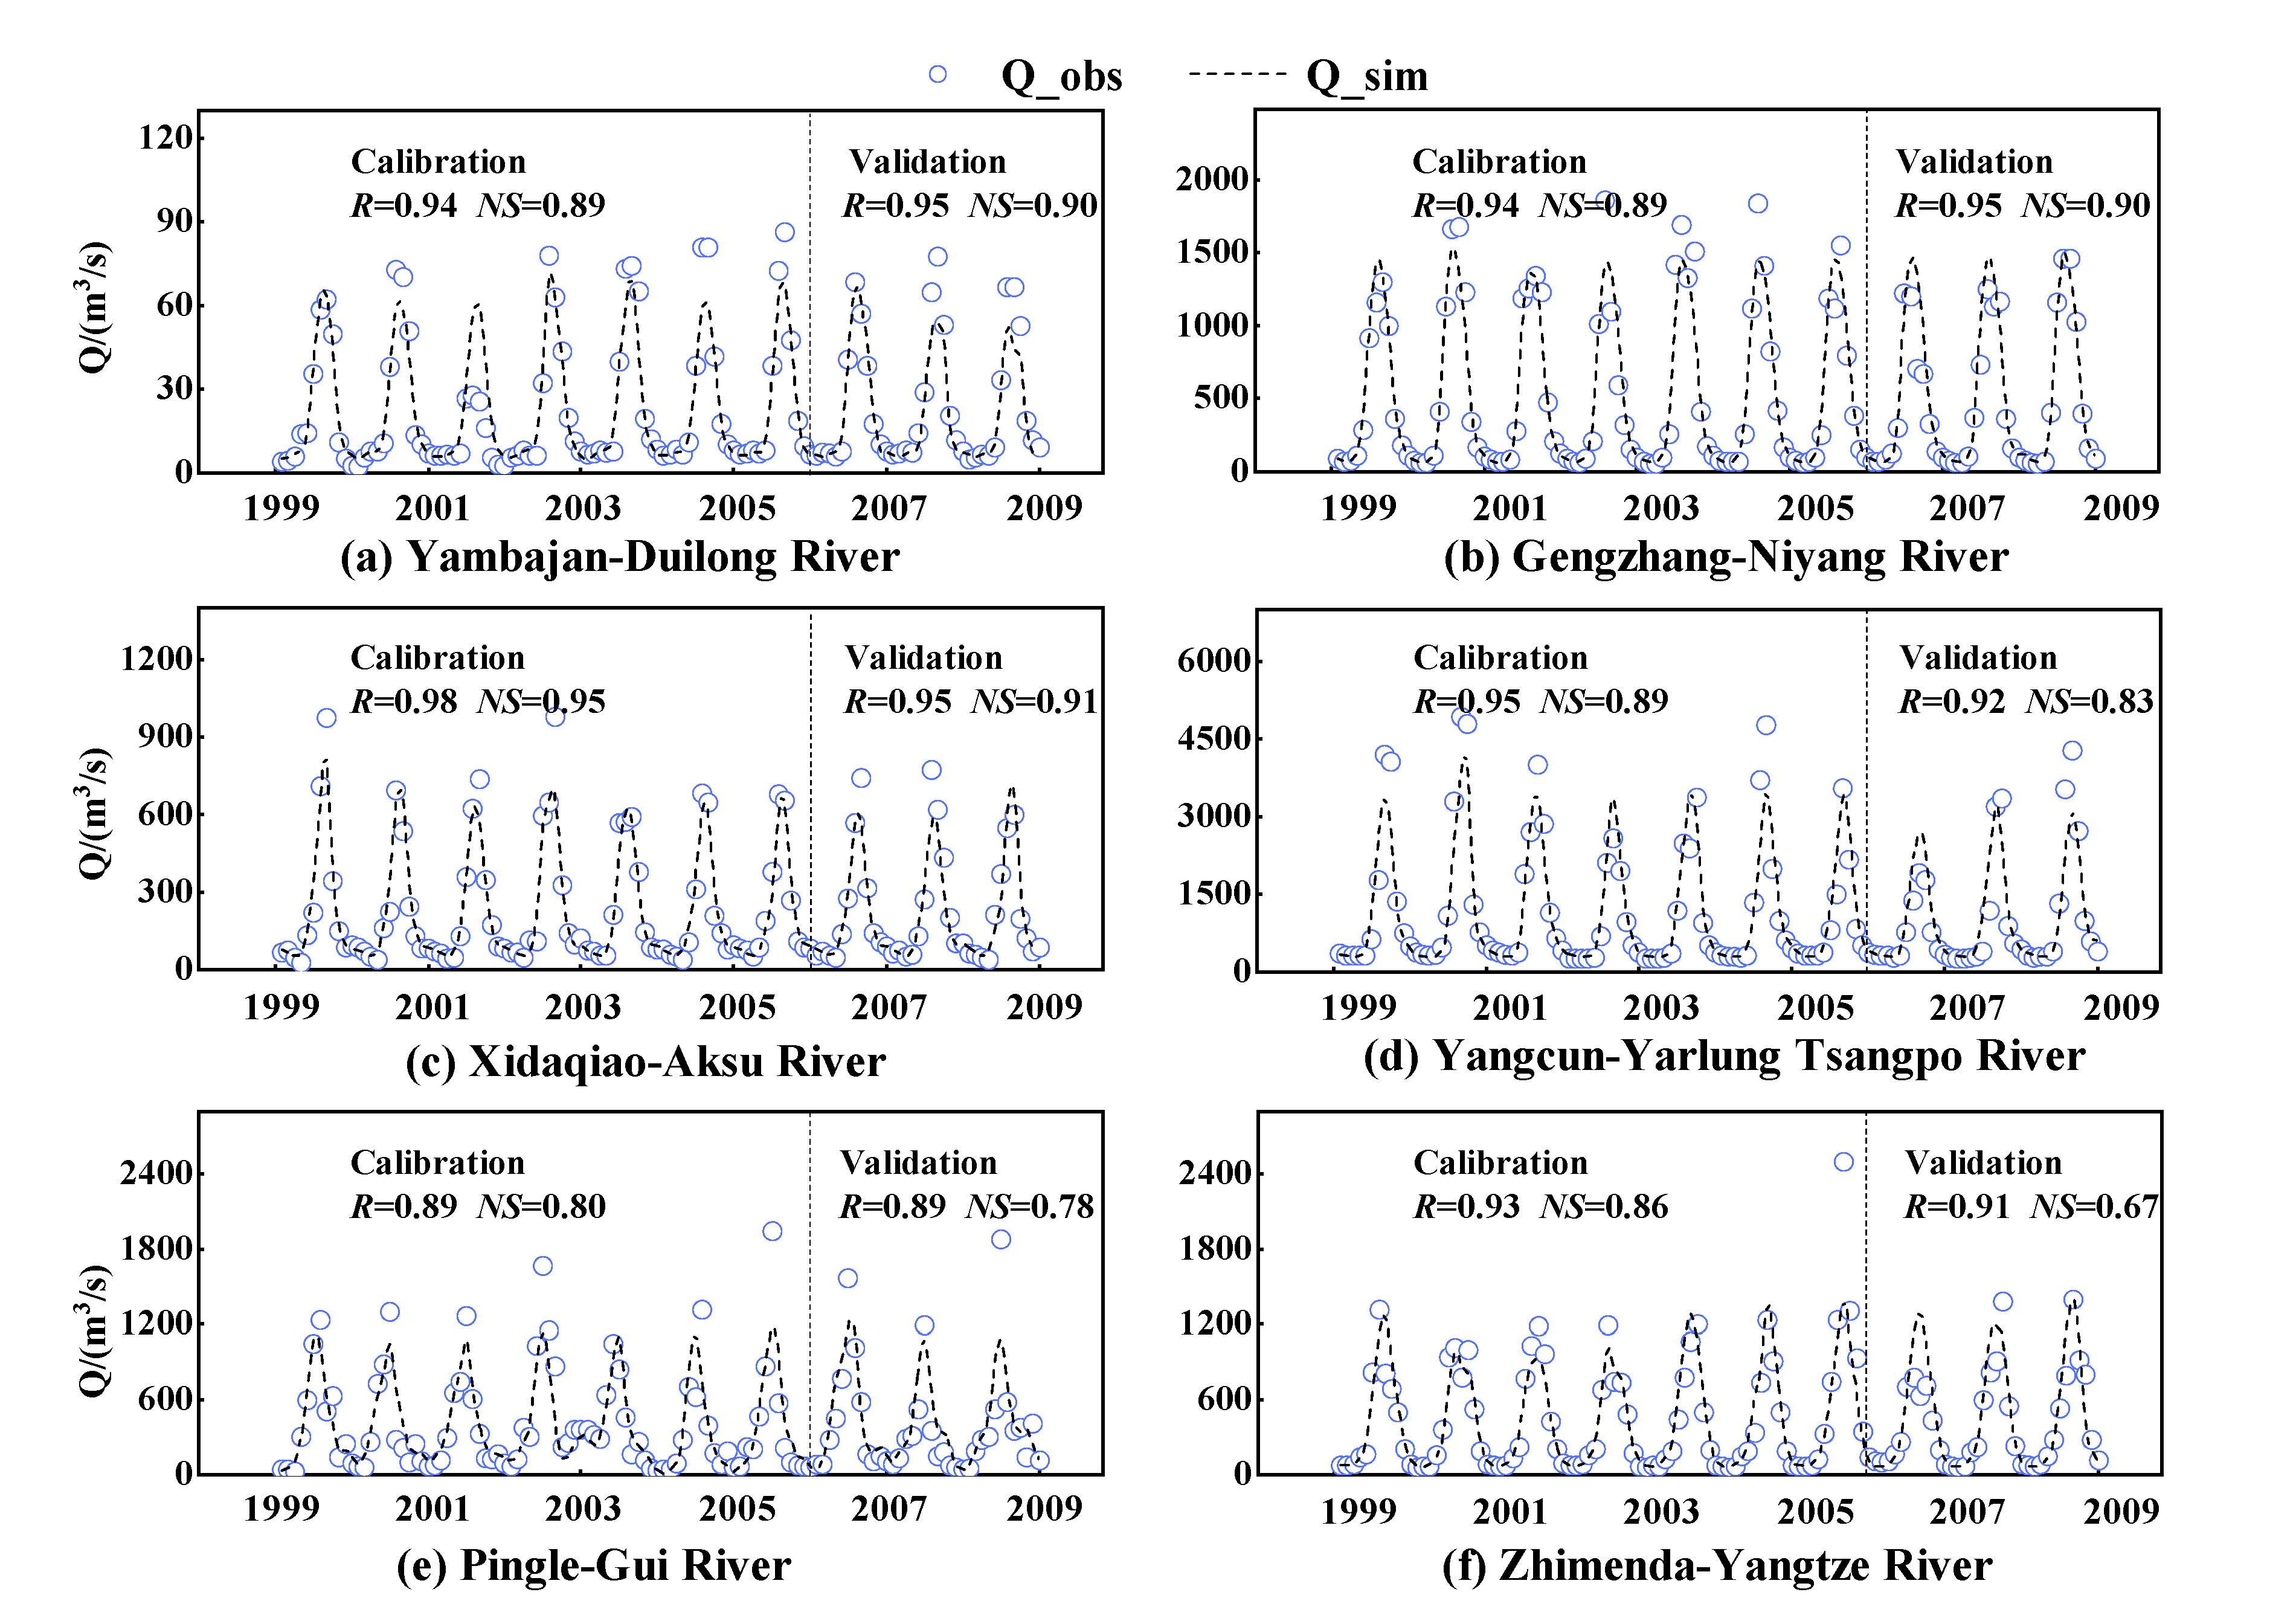
Figure 6 compares the observed and simulated monthly runoff processes at several representative stations. During the calibration and validation period, the simulated runoff Q_sim obtained by the M/C signal method at the Yambajing, Gengzhang, Xidaqiao, Yangcun, Pingle and Zhimenda station basically matched very well with the observed runoff Q_obs. Generally, the performance during the calibration period is better than that of the validation period. The simulated results in dry seasons are significantly better at all stations, while the flood peaks were underestimated for some of the stations. This phenomenon was also observed in the research of Khan et al. [51]. For specific reasons, the flooded area of some stations will exceed the coverage extent of a single pixel M (i.e., 3.125 km × 3.125 km) when flood approaches. However, the monitored Tb value by the satellite sensors does not decrease accordingly, resulting in an underestimation of simulated runoff during flood seasons.
4.2. Hydrological Drought Assessment Based on Simulated Runoff
In order to assess the hydrological drought for recent decades in China, the time series of runoff for all the stations from 1996 to 2016 were generated using Equation (7) based on microwave Tb data. The SRI-3 for each station was then calculated to analyze hydrological drought in the selected 9 major basins across Mainland China.
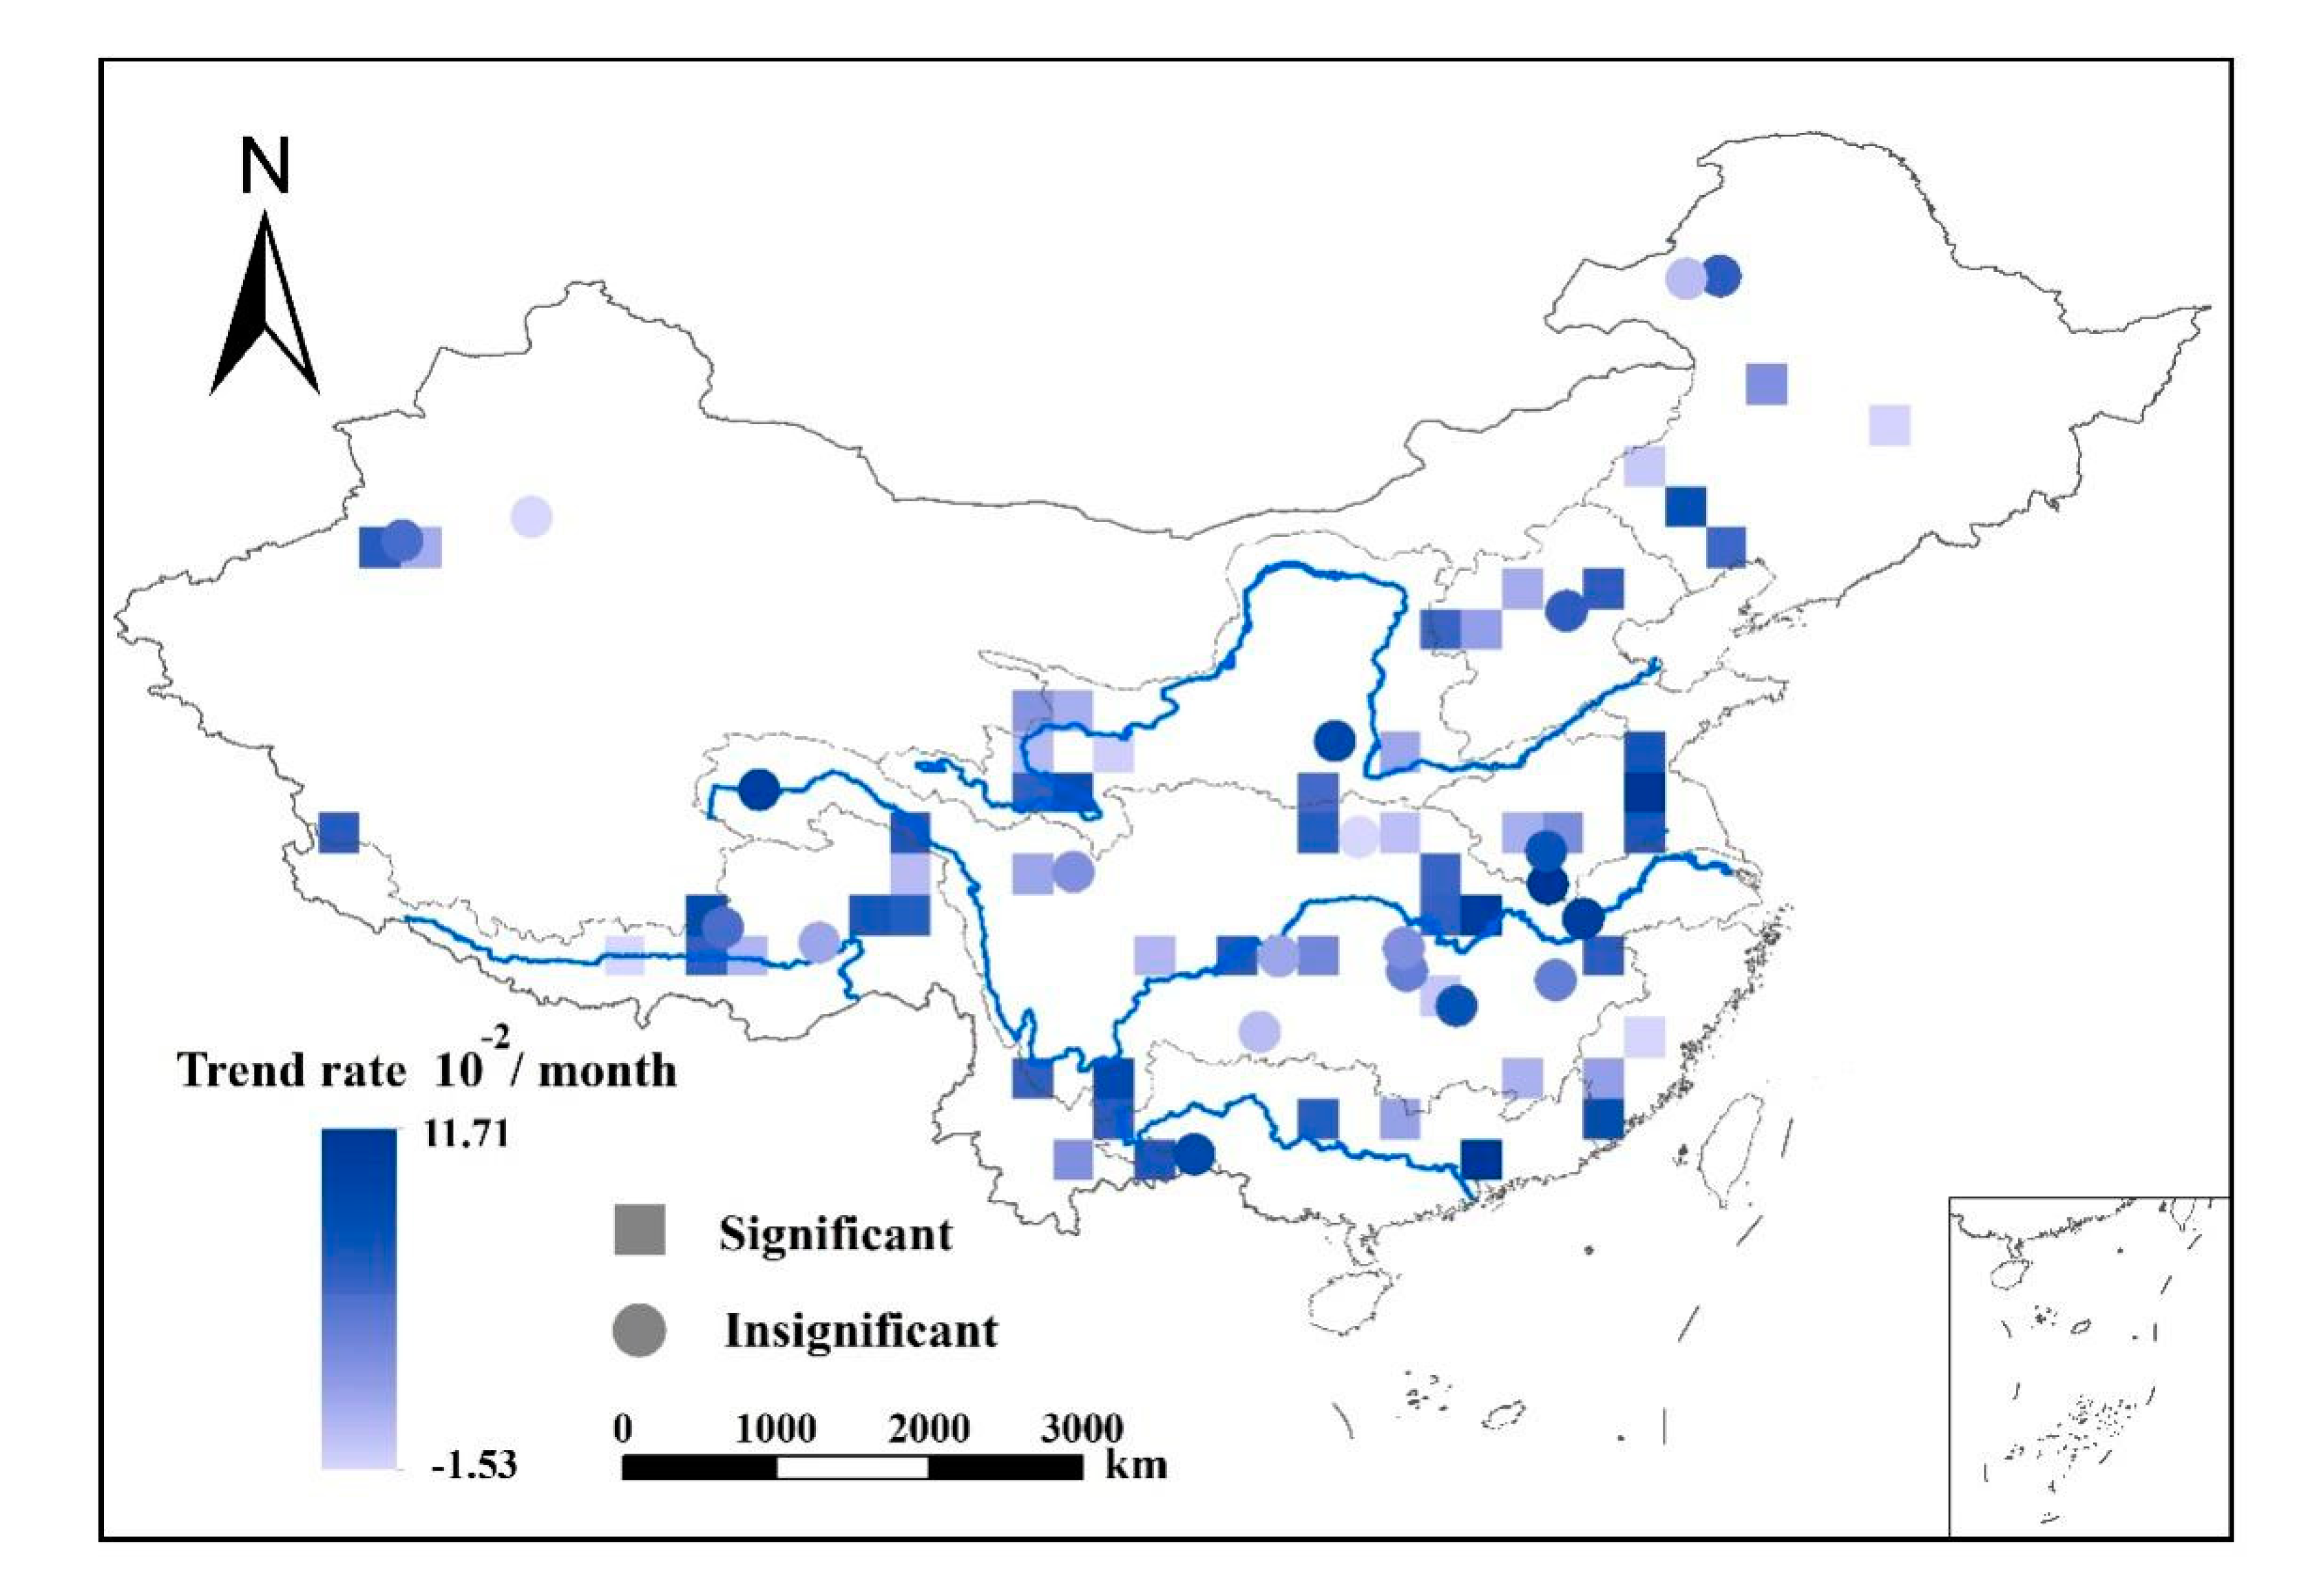
The Mann-Kendall (M-K) test [61,62] was used to analyze the SRI-3 as shown in Figure 7, presenting the trend of change and significance. According to the analysis, 40 of the 79 stations indicate an increasing trend in SRI-3, with 30 stations showing a significant increase. Conversely, 39 stations present decreasing trends, 18 out of which experienced significant decreases. As shown in Table 2, among the 9 basins, the SRI-3 values of the PR, SWR and HR show primarily increasing trends as these basins were dominated by drought intensification from 1996 to 2016. The SRI-3 of the YZR, SER, Hai, SLR and YR, on the other hand, primarily indicates decreasing trends, showing a slight drought relief in this period. The three stations with the highest rising SRI-3 trends are the Qilinzui station on the Zeng River, a tributary of the Pearl River, the Yunhe station on the Dayun River, a tributary of the Huai River, and the Xiantao station on Han River, a tributary of the Yangtze River.
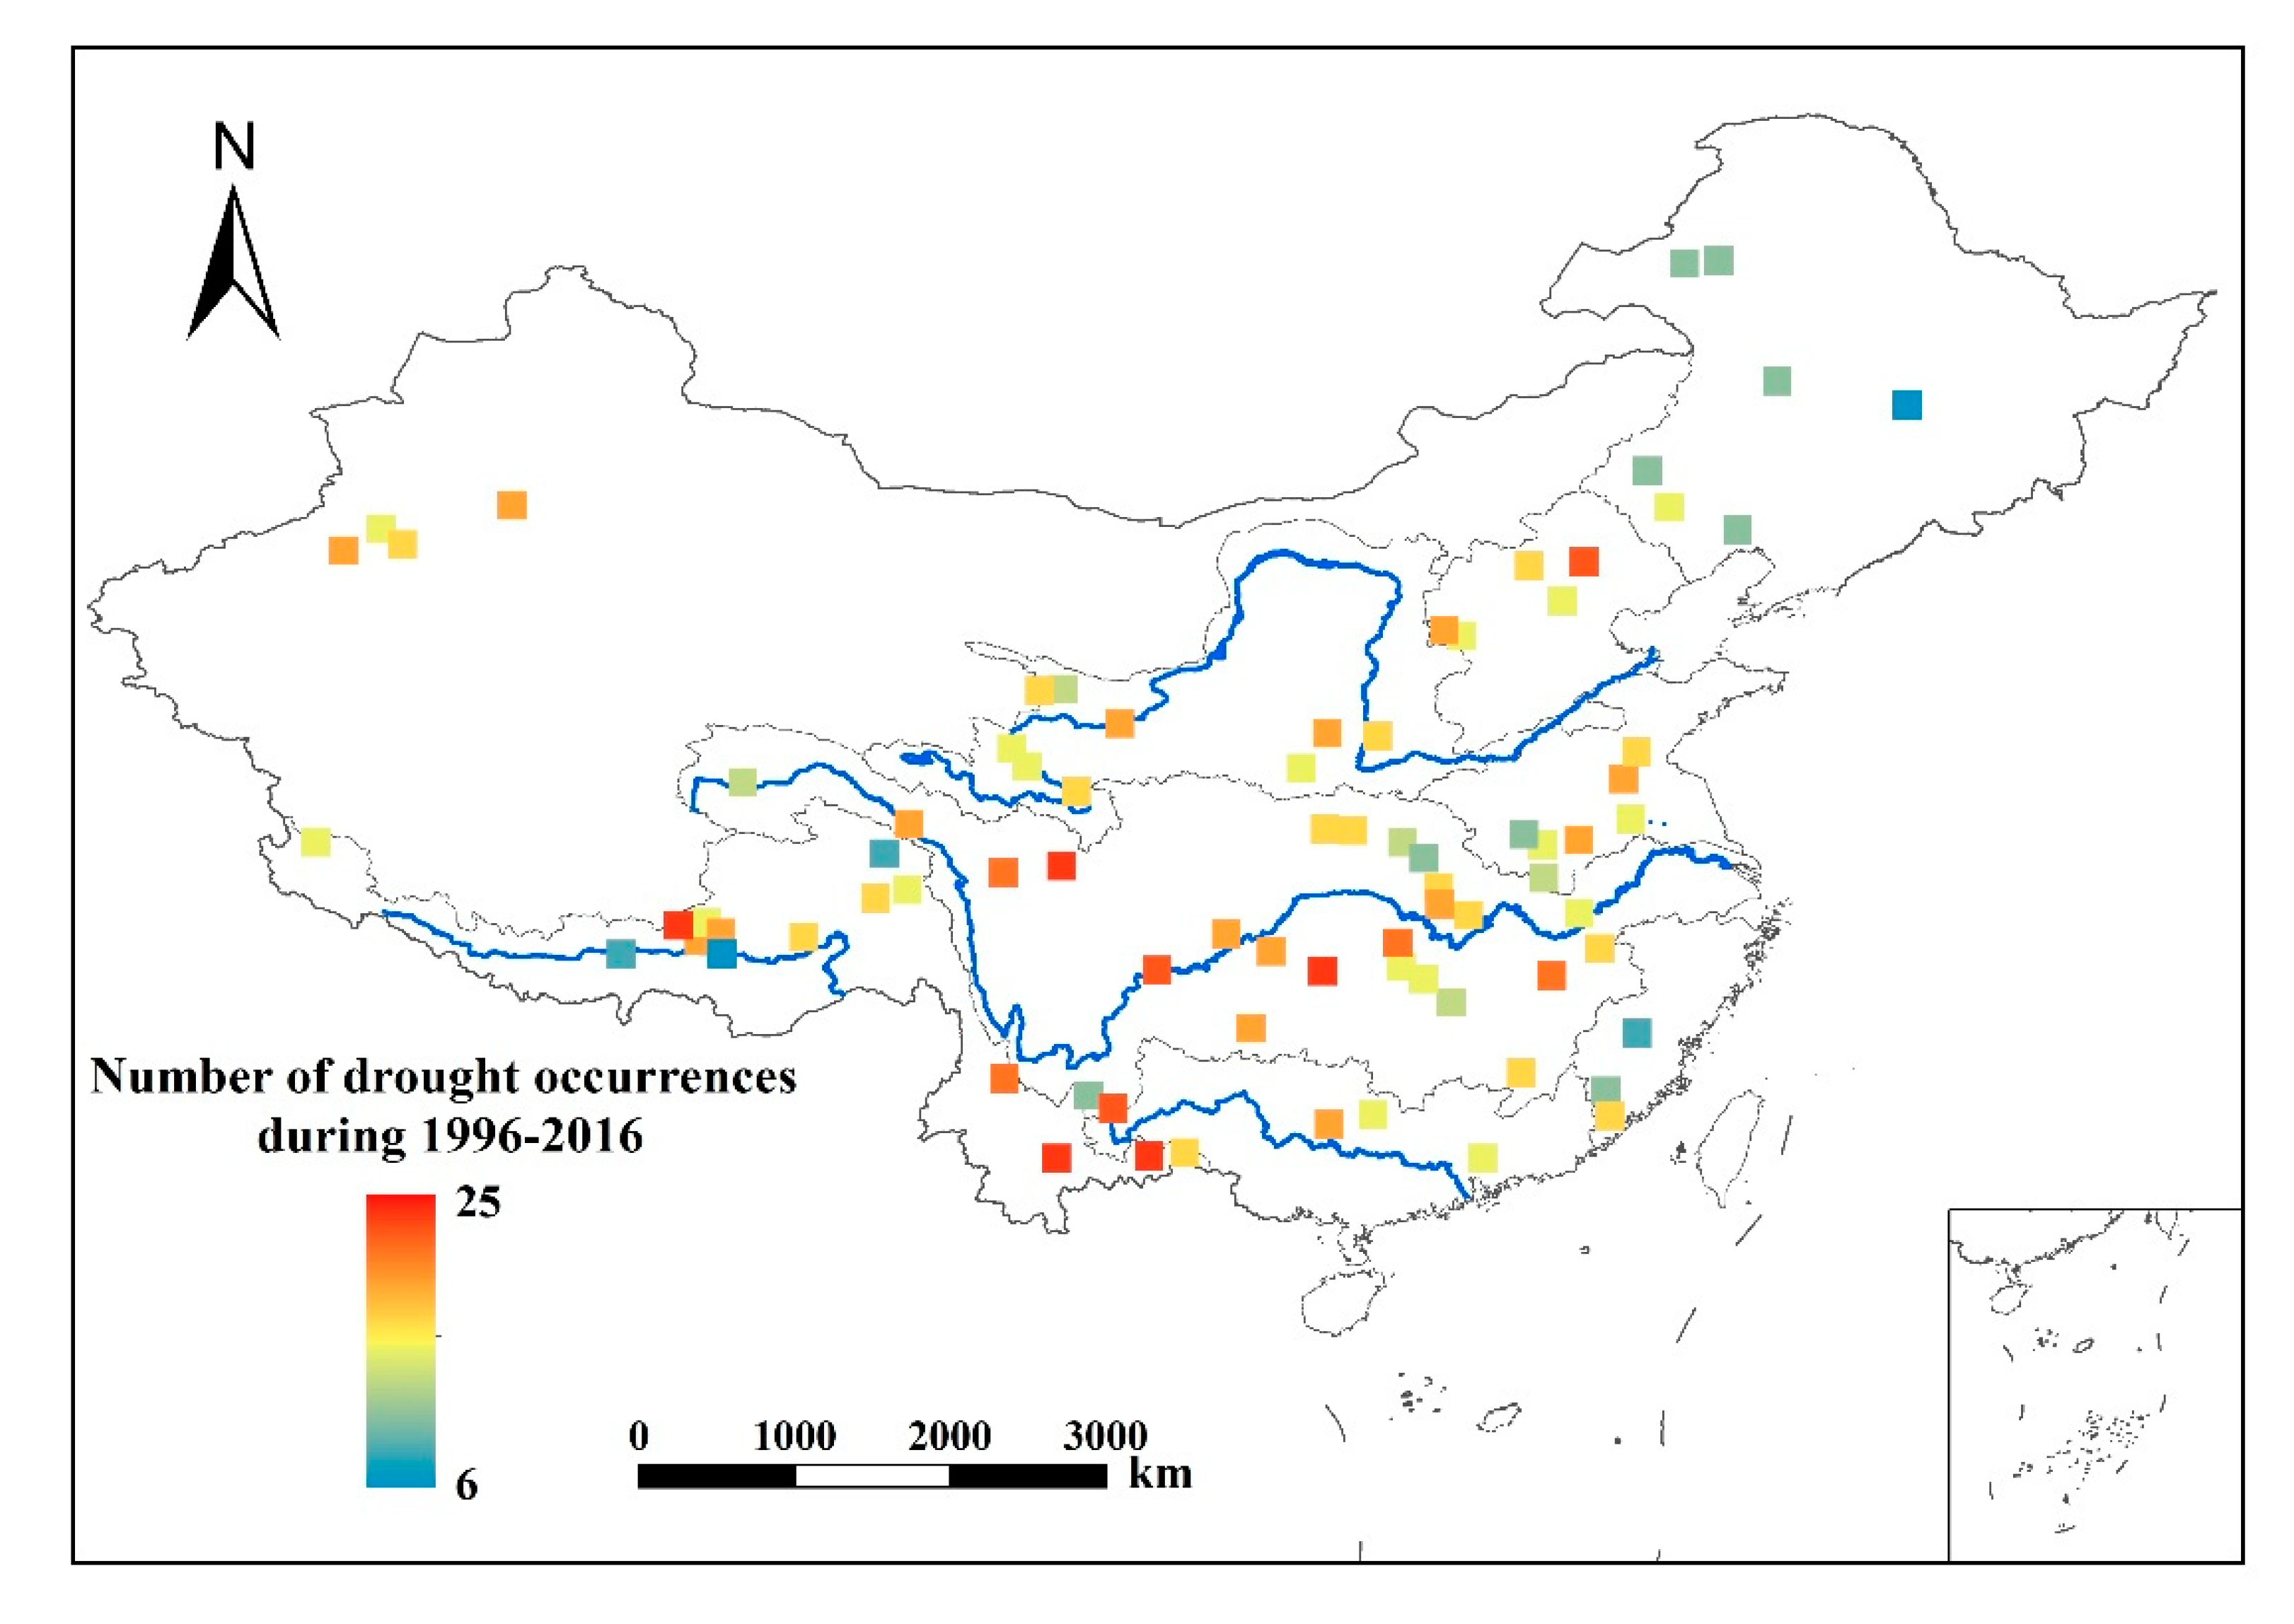
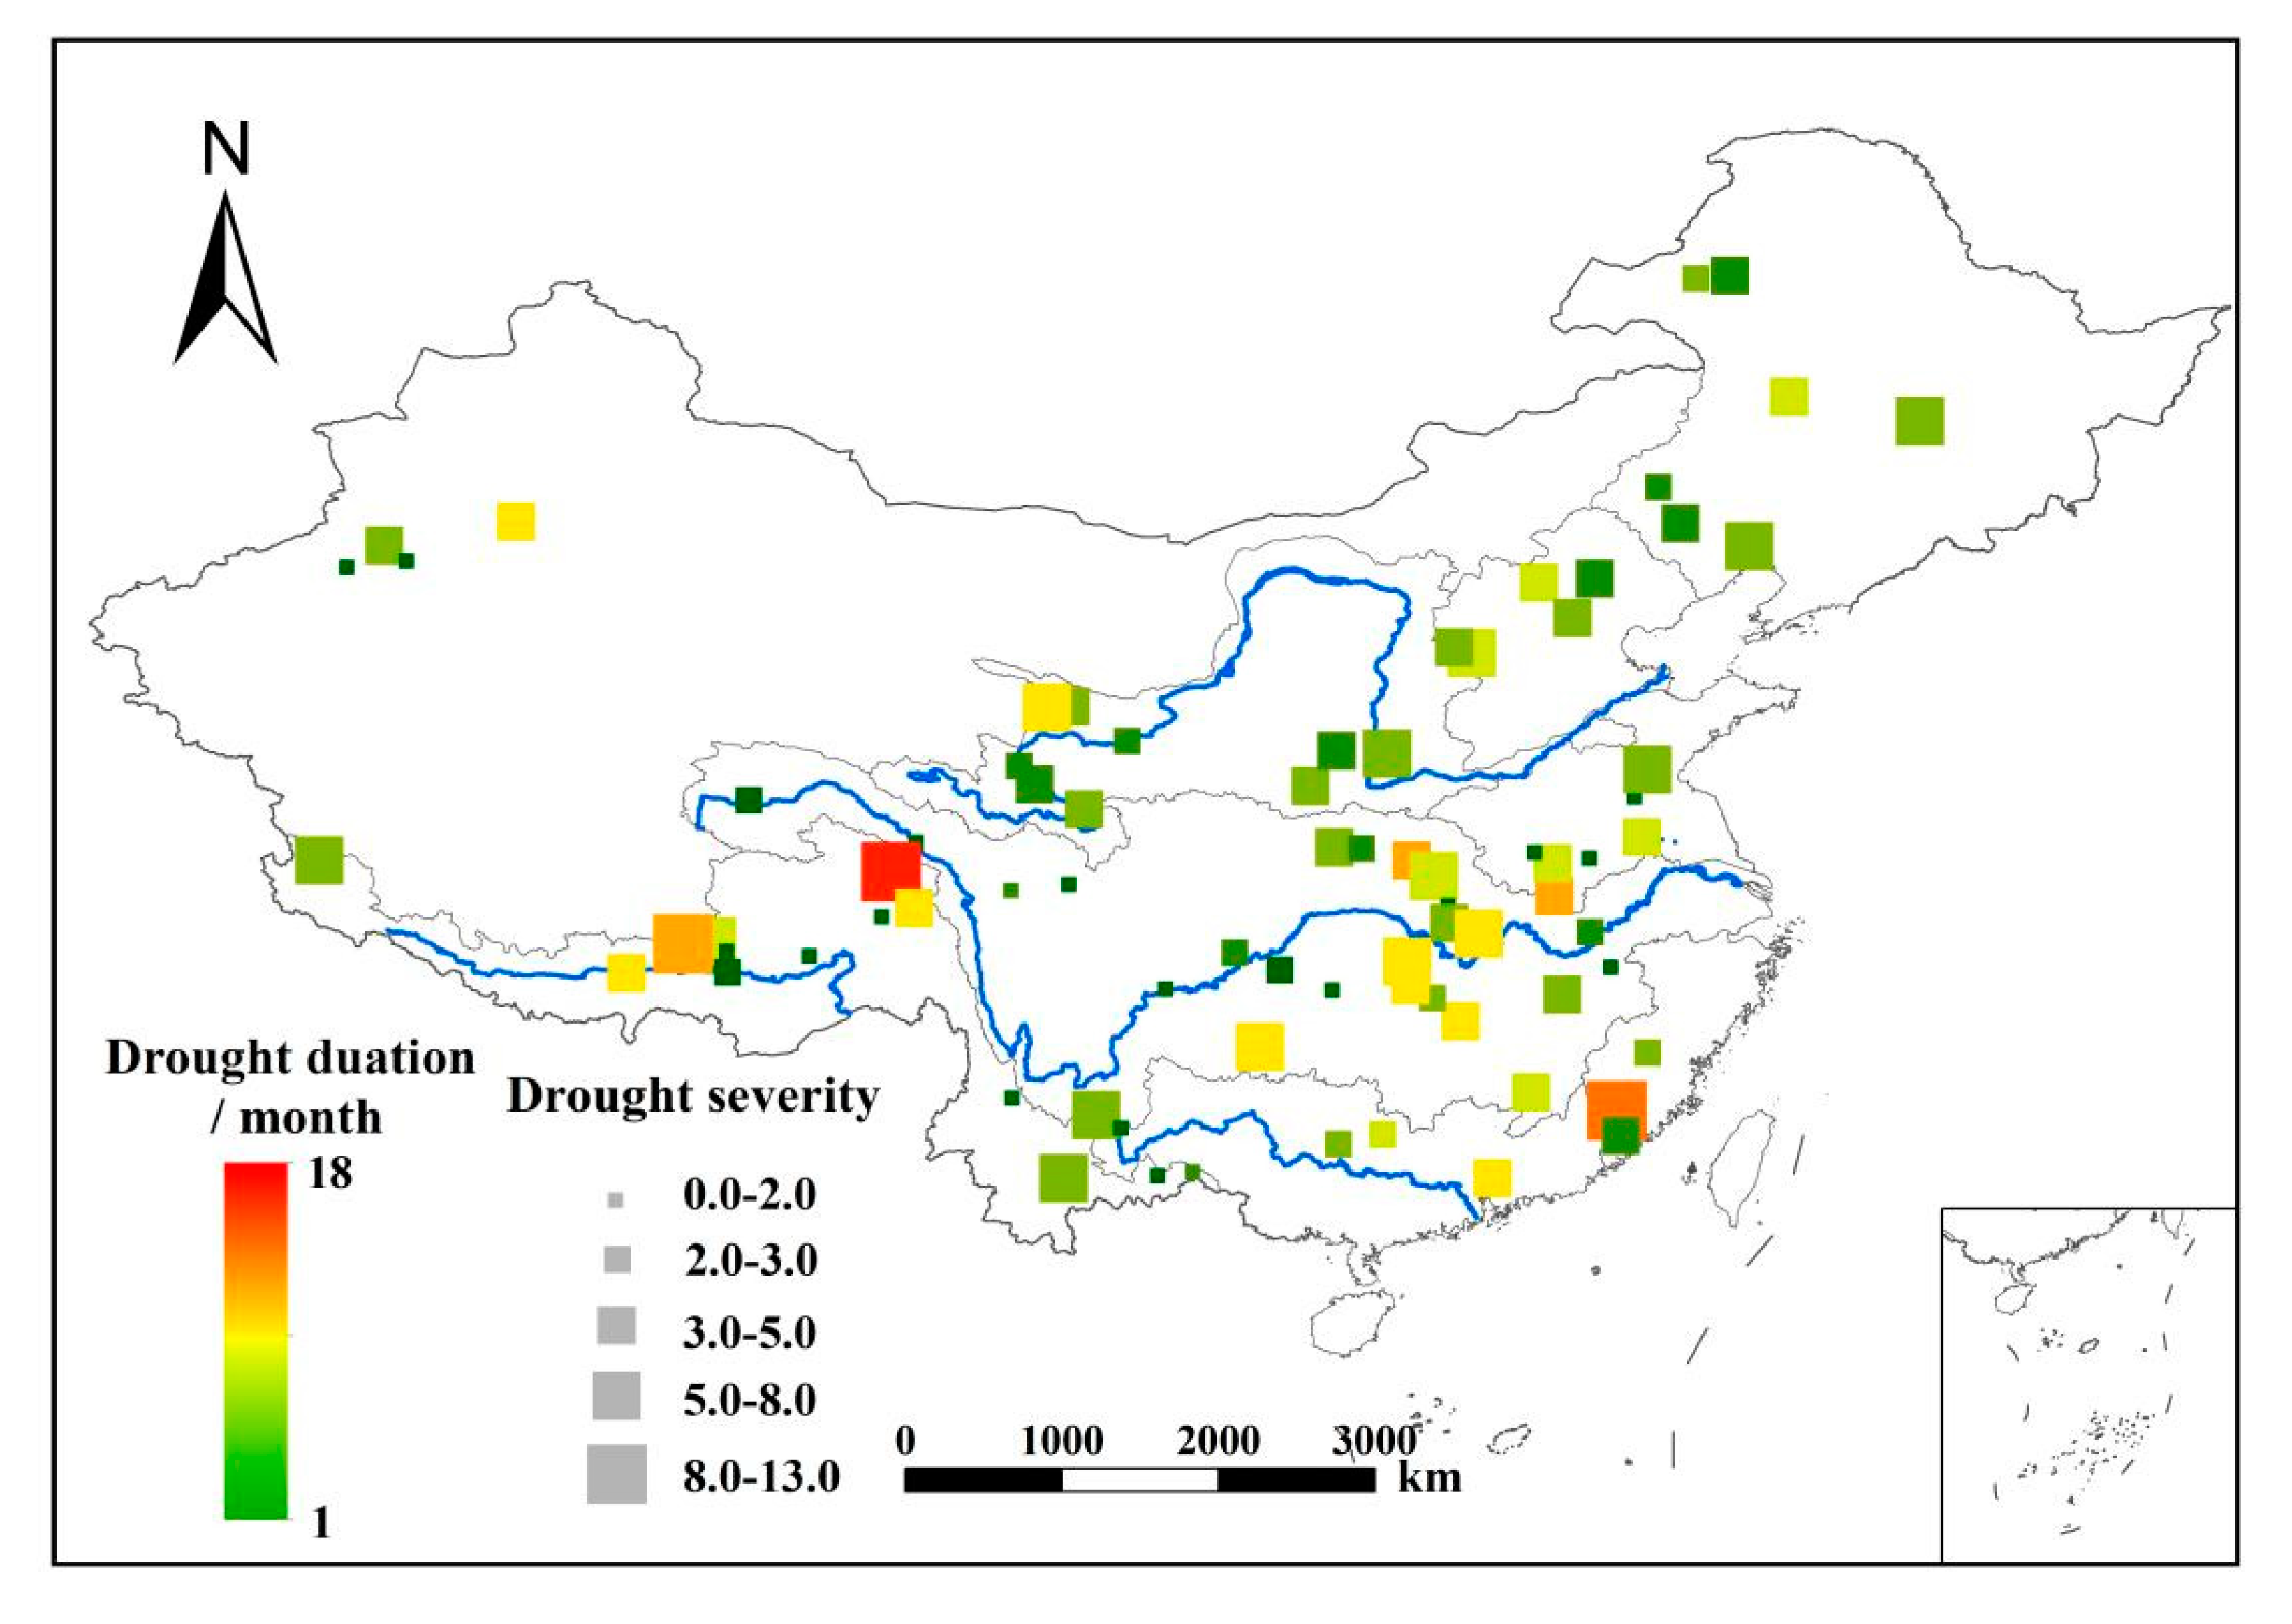
Statistics on the frequency of drought events occurring at the 79 stations during 1996–2016 (shown in Figure 8) indicate that, apart from the permanent dry regions (mainly in the IR), the areas with the most frequent occurrence of drought are mainly located in the upper reaches of the PR, the middle and upper reaches of the YZR, the middle reaches of the Yarlung Tsangpo River (in the SWR) and the Hai. Basically, these areas belong to Yunnan Province, Sichuan-Chongqing regions, Lhasa City and Beijing-Tianjin-Hebei region. Furthermore, the largest drought events in 1996–2016 were also identified and their Dd and Ds were calculated, as shown in Figure 9. It can be found that in terms of spatial distribution, Dd and Ds are larger in the upper reaches of the YR, the Tibetan region and some areas in the middle reaches of the YZR, while the drought in the SLR is more severe despite its short duration. In terms of time of occurrence, half of these strongest drought events occurred in the periods 1996–1999 and 2009–2014, which was also proved by the analysis from the China Meteorological Agency (CMA) (http://www.cma.gov.cn/en2014/, accessed on 31 August 2021).
5. Discussion
5.1. Influencing Factors of Runoff Simulation Based on the M/C Signal Method
Comparing to the performance of M/C signal method in simulating runoff at global scale, this method shows to be more capable and effective in typical river basins in Mainland China. For example, in the analysis of Revilla-Romero et al. [36] for the simulated runoff from several rivers across the globe, the percentage of R 0.5 is only 10.6% and the percentage of NS 0 reached 53.6%. Furthermore, the outcomes of van Dijk et al. [35] at the global scale show that only 2.5% of stations had R 0.8. In this study, R score for 92.4% of the stations is greater than 0.5 and NS of all stations is above 0. Error analysis also indicate that both random error and systematic error are within accepted range (please see Figures S1 and S2). Especially in the Qinghai-Tibetan Plateau area, the performance for stations such as the Gengzhang, Zhimenda, Yangcun is more prominent.
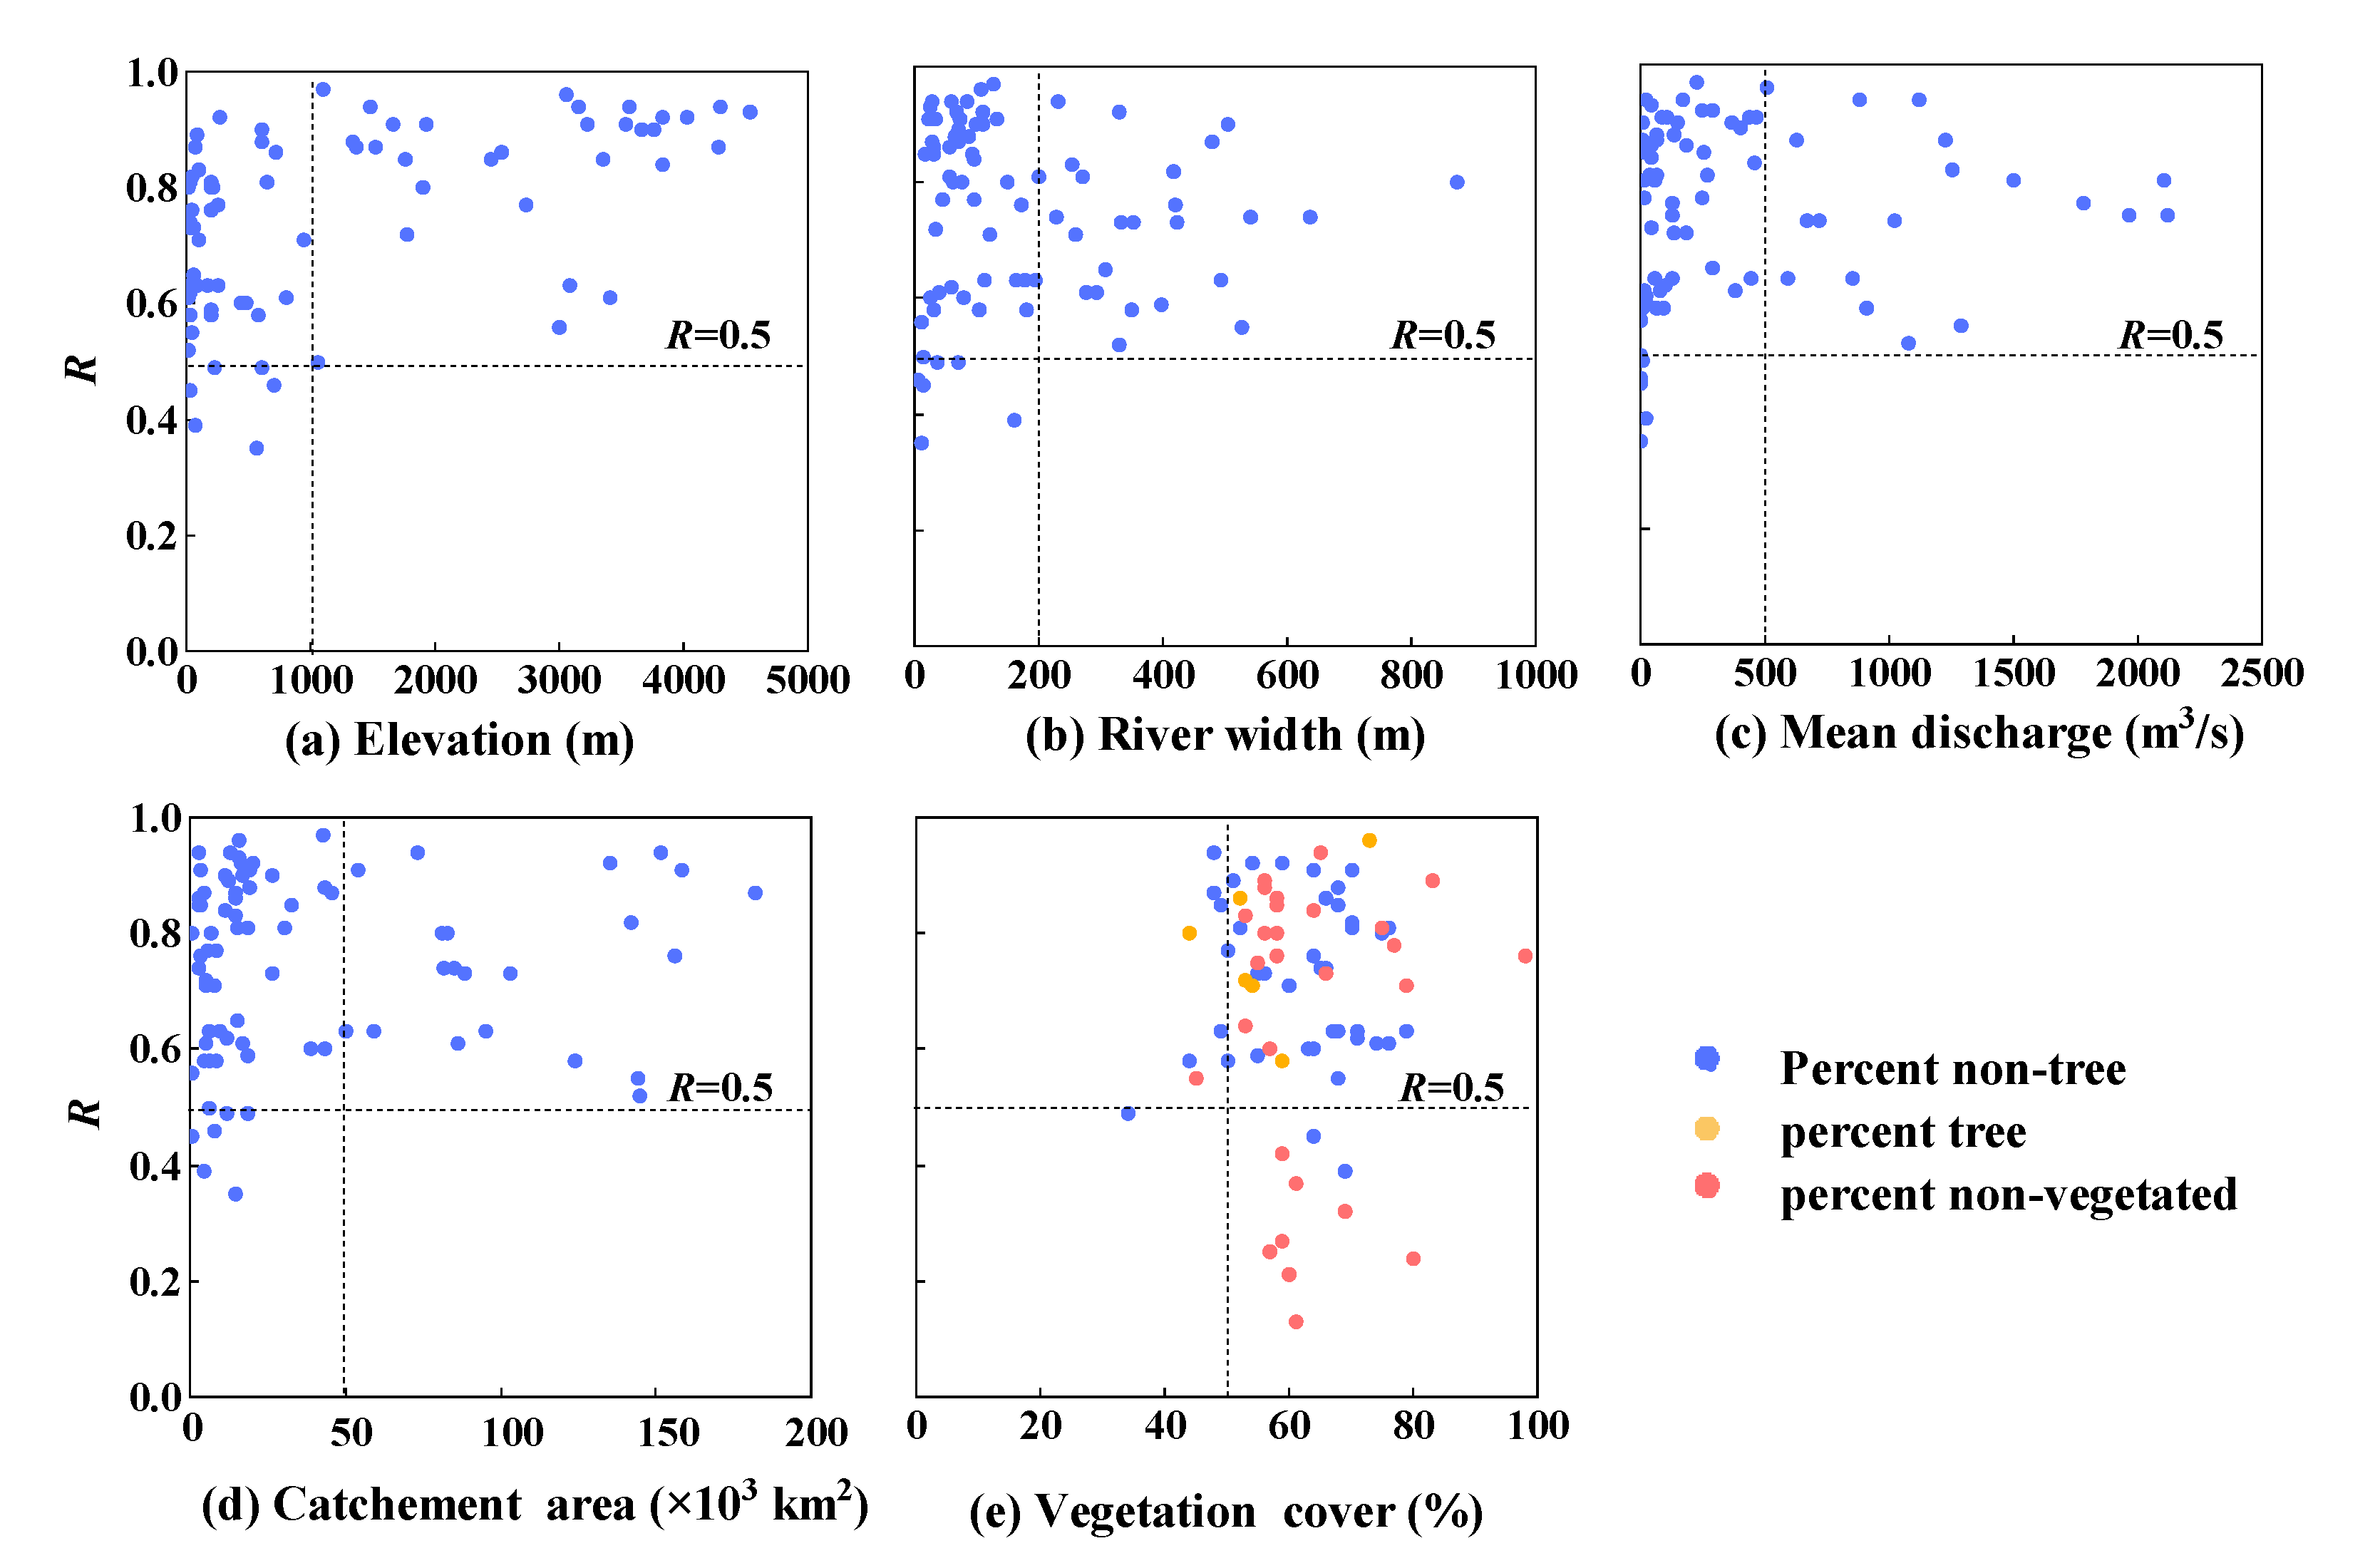
To further clarify the factors influencing the M/C signal method, 7 topographic and hydro-meteorological factors, including elevation, river width, mean discharge, catchment area, vegetation cover, LULC and climate, were selected and discussed based on the R score of each station during the 1999–2008 (or 1996–2005) time period.
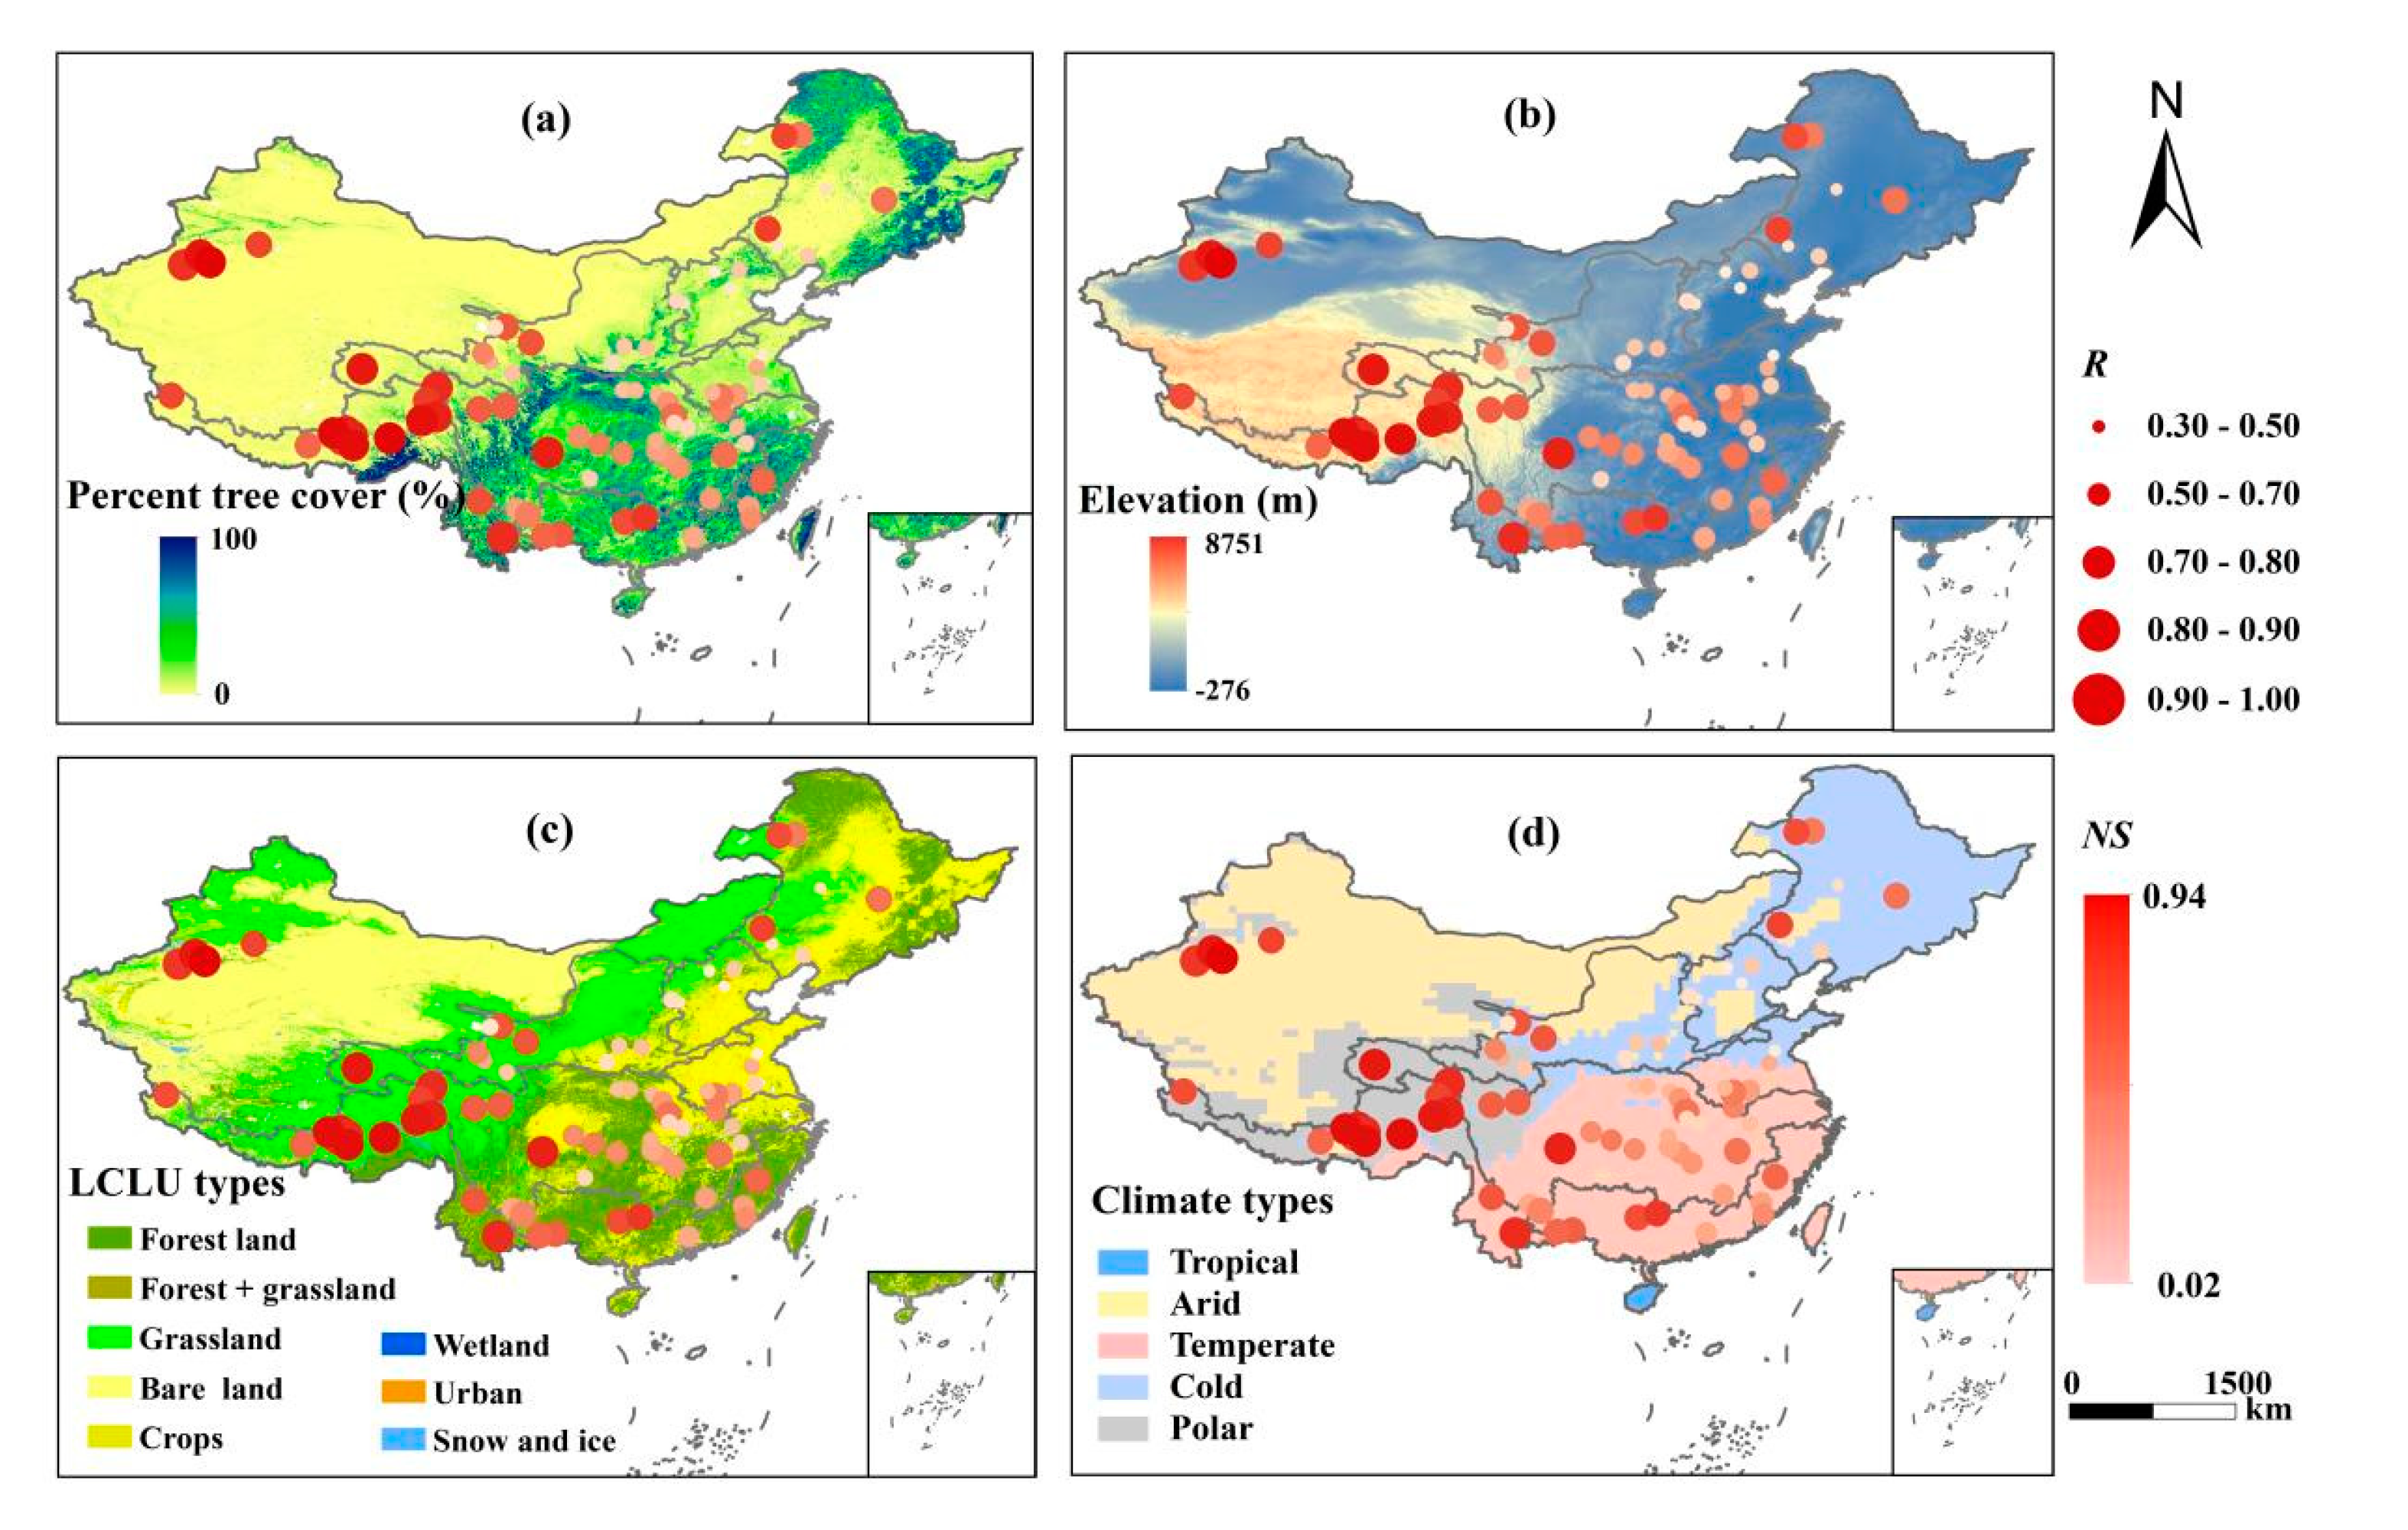
Elevation: In Figure 10a and Figure 11b, the values of elevation and R score show a certain positive correlation. The higher the elevation, the better the R score obtained from the simulation. The performance is clearly better for stations with elevation greater than 1000 m, where R all exceeded 0.61. These stations are mostly located in the Qinghai-Tibet Plateau and the Yunnan-Guizhou Plateau.
River width: According to the equation , the variation of runoff Q depends not only on the runoff velocity v, but also the river cross-sectional area A, which is related to the river width, water depth and cross-sectional geometry. As a result, there can exist a relationship between R score and river width W [63]. As shown in Figure 10b, all stations with W 200 m have an R score greater than 0.5; 90.9% of the 55 stations with W 200 m are greater than 0.5, while the stations showing inferior results are primarily those with river widths of less than 100 m.
Mean discharge and catchment area: As shown in Figure 10c,d, considering the mean discharge and catchment area, 56.7% of the 37 stations with outstanding simulation results (R 0.8) have a mean discharge between of 100 and 1500 m3/s and the catchment of more than 10,000 km2. For rivers with discharge lower than 100 m3/s, the difference between the Tb values of pixels M and C is not obvious, resulting in an unsatisfactory performance. On the contrary, for stations with larger discharge ( ≥ 1500 m3/s), although interference from hydraulic engineering projects near the station can be excluded in the process of selecting pixel M, larger hydroelectric power plants and dams upstream and downstream may still affect. In addition, during the flood seasons overflowing from pixel M is very likely to occur, which can also introduce uncertainties to the simulated results.
Vegetation cover: Vegetation cover indicates the percentage of tree canopy cover for each pixel and can be used to assess how vegetation cover affects the Tb value of the pixel. The VCF product used in this study has three attributes: percent tree, percent non-tree and percent non-vegetated, which represent forest land, non-forest land and bare land, respectively. From Figure 10e, it can be noticed that 57.0% of the stations are dominated by non-tree, while 35.4% by bare land. The spatial distribution of R score and percent tree is shown in Figure 11a. All the stations dominated by forest land have R scores greater than 0.5 and R scores at 93.3% of non-forest land dominated stations all exceeded 0.5. The proportion of bare land dominated stations with R scores lower than 0.5 is slightly larger than the other two.
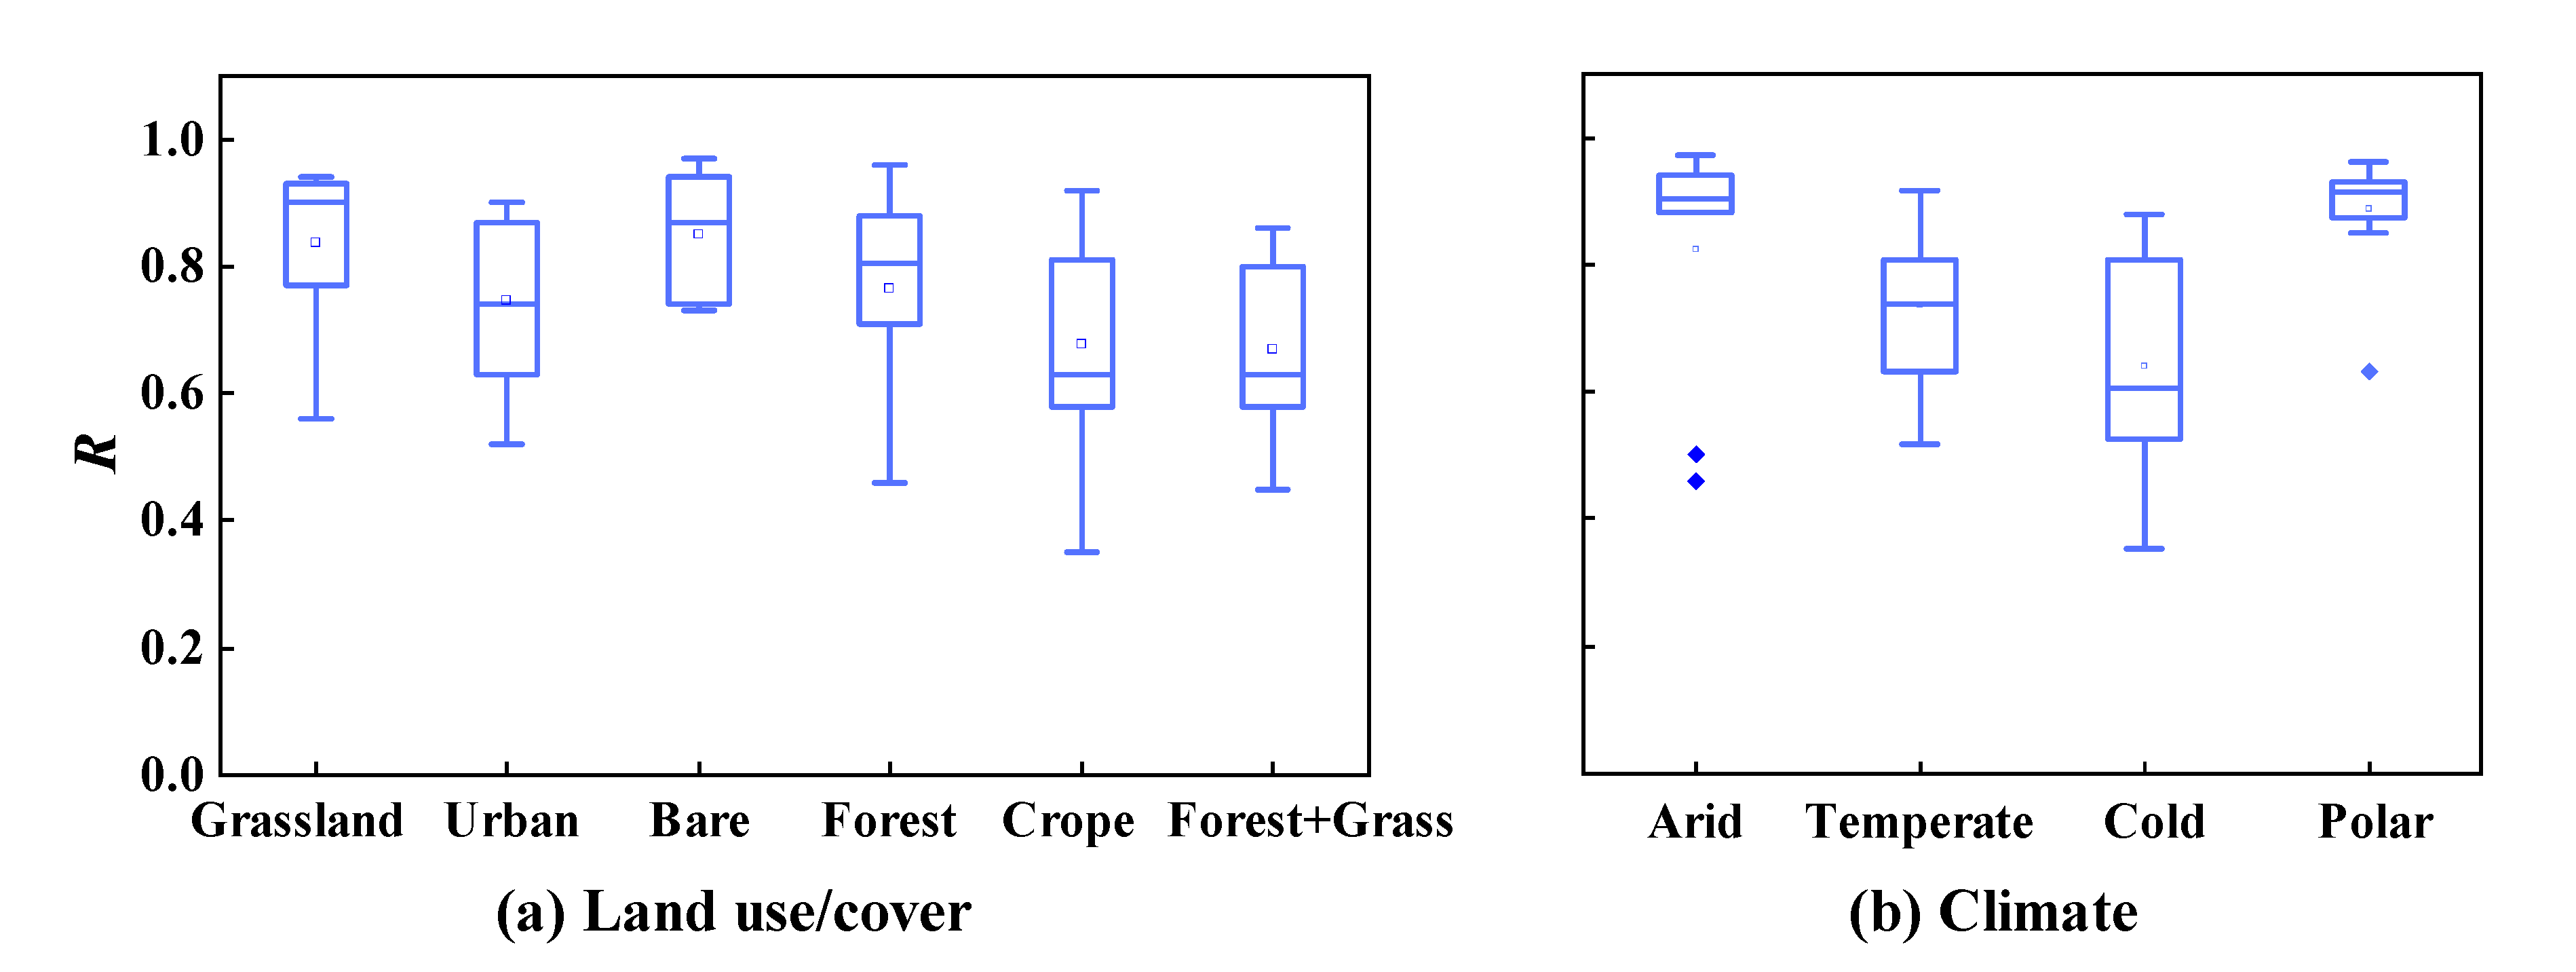
LULC types: As illustrated in Figure 11c and Figure 12a, six LULC types were observed at the 79 stations, including grassland, urban, bare land, forest land, crop and forest + grass. From the box line diagram of the R score under different LULC types, it can be found that stations with grassland or bare land tend to acquire the best R scores, both with a mean value above 0.8.
Climate types: Figure 12b shows that among the four climate types: arid, temperate, cold and polar, most stations with good performance exist in the polar climate area with both of the mean and median of R reached 0.87, followed by the arid climate and temperate climate with the mean R of 0.81 and 0.78, respectively. Stations with the cold climate tend to have poor performance, as Figure 11d shows. Considering that climate type can influence river discharge and LULC type, further analysis shows that in 77% of these stations located in cold climate, the LULC type is grassland and 85% of them have a mean discharge of lower than 500 m3/s.
To obtain the factors that have the greatest influence on runoff modelling, the multiple linear regression analysis was conducted. The results indicate that elevation, climate type and mean discharge significantly affected the simulation results (please see Table S1). These three factors are dominant. The remaining factors such as river width, land use/cover, vegetation cover and catchment area have less influence on the performance of the M/C signal method. The finding is generally consistent with the studies of van Dijk et al. [35] and Revilla-Romero et al. [36]. Among these factors, elevation is the most significant, followed by mean discharge and then climate type. Most of the stations with good performance are located in high altitude areas such as the Qinghai-Tibet Plateau and the Yunnan-Guizhou Plateau. As the source and upstream areas of many rivers in Asia, these areas are less influenced by human activities. Moreover, they usually have smaller river widths and low soil moisture in the floodplain [64], which interfere relatively less with the Tb observations, thus creating more favorable conditions for runoff simulation when using the M/C signal method.
In summary, the simulated runoff tends to match with the observed runoff in the plateau area with elevation above 1000 m, and mean discharge of 100–1500 m3/s. The M/C signal method based on passive microwave remote sensing Tb is proven to have broad applicability in China’s plateau region. In regions such as the Huai River Plain and the middle and lower reaches of the YZR, the large runoff and wide river channel usually lead to slightly inferior performance of the M/C signal method. Furthermore, the fitting method, the length of data series, uncertainty of the method (e.g., in the selection of pixel C, in the producing of Tb data), the presence of other water bodies near the stations and the river channel shape can also affect. For example, after precipitation, the water volume of depressions around some stations accumulates, which interferes with the accuracy of acquiring the Tb value of pixel C, subsequently affecting the simulation results [45,46]. Another example is that for rivers with wide and shallow channels or with floodplains on both sides, river width can change significantly, making the Tb values within the pixel M more different from the pixel C, which is more conducive to simulating runoff based on the M/C signals [65,66].
5.2. Drought Assessment Based on Remote Sensing
Most previous drought studies based on meteorological data concluded that the southwestern region of China is drought-prone and most severely affected, while droughts in northeastern and southeastern China are usually characterized by short duration and low severity [21,67,68]. For example, the spatial and temporal variability of drought in China conducted by Xu et al. [11,12] showed that the drought occurring in 2010–2011 was one of the most severe drought events in the past half century, sweeping through more than half of the non-arid regions in China. Large-scale droughts are usually concentrated in the areas from the North China Plain to the lower reaches of the Yangtze River, as well as in the Southwest China, while the western part of the North China Plain, the Loess Plateau, the Sichuan Basin and the Yunnan-Guizhou Plateau show a significant drying trend. Based on meteorological data, Zhai et al. [69] investigated the spatial distribution of the Palmer drought severity index (PDSI) and SPI in 10 major basins of China. The results also show a visible increasing trend of SPI in the middle and upper reaches of the Yangtze River in the Yunnan-Sichuan region. These findings present considerable agreement with the analysis in Section 4.2, proving that drought assessment based on simulated runoff data from passive microwave remote sensing is feasible. In addition, we also compared the results of the drought based on observed and simulated runoff during the period of 1996–2008 (Figure S3). The results show that 60% of the stations are consistent in the trend test of SRI-3 with R reaching 0.6 or higher scores. Comparisons of Dd and Ds generated by observed and simulated runoff, respectively, also indicate that drought assessment based on simulated runoff is reliable.
As mentioned in Section 5.1, passive microwave remote sensing is capable of runoff modelling, especially in areas with small river width and low discharge in the river channel, where are usually drought-prone regions. In fact, besides the runoff data used for calculating SRI in this study, meteorological data, soil moisture and vegetation data derived from multi-source satellites can also be used to calculate various drought indices as well as to provide data support and high-quality applications for precise drought research. At present, in meteorological and agricultural drought studies, remote sensing data such as multi-source satellite precipitation, soil moisture derived from records of passive or active satellite sensors are more widely used [65,66,67,68]. With the development of satellite technology, multi-source remote sensing data are becoming more and more abundant. Previous studies show that relationship generated by the rating curve between M/C signals and Q at a downstream station can be applied to upstream areas [26], which means the relation curve can be transported into the data-gap regions in the upstream of a certain basin if well modified. It will bring more potential for drought investigation by generating long-term runoff time series at large scales or in data-scared areas. One of the focuses of future studies can be integrating the multi-source remote sensing data to explore the evolution of drought.
6. Summary and Conclusions
To explore the utility of microwave remote sensing data for runoff modelling and thus drought assessment in Mainland China, we combined the M/C signal method with the SRI algorithm based on the MEASUREs high-resolution passive microwave remote sensing Tb observation dataset for 79 typical stations in the 9 major basins across Mainland China. Specifically, SRI-3 was calculated based on the simulated data to assess spatially and temporal patterns of droughts over 1996–2016. The main conclusions of this study can be summarized as follows:
(1) 92.4% and 59.5% of the selected 79 stations got the R and NS greater than 0.5 when comparing the simulated and observed runoff. Among the 9 major basins, the M/C signal method shows the best performance in the IR and the SWR. Meanwhile, the simulated results at the stations such as the Gengzhang, Yangcun, Zhimenda and Pingle, which are located on the Qinghai-Tibet Plateau and Yunnan-Guizhou Plateau, are also quite outstanding. Comparing the simulated and observed monthly runoff processes, it is obvious that the M/C signal method is far more effective for the dry season than the flood season as the flood peaks of some stations were underestimated.
(2) The monthly runoff data obtained by the M/C signal method for 1996–2016 was applied for calculating the SRI-3. 30 out of the 79 stations indicate significant increasing trends in SRI-3 and 18 show significant decreasing trends. By analyzing the frequency of drought events and the most severe drought events at each station during this 21-year period, the duration and severity of droughts in the non-permanent dry areas of the Hai, the middle reaches of the YZR and the Southwest of China were found to be more frequent and severe than that in other regions.
(3) After analyzing 7 topographic and hydro-meteorological influencing factors, elevation, climate type and mean discharge were found to be the dominated factors. Stations over small rivers in plateau areas with sparse vegetation tend to have better simulated results. To be more specific, areas with elevation higher than 1000 m, river mean discharge between 100 and 1500 m3/s and a polar climate are defined to be more suitable for applying passive microwave remote sensing data to runoff modelling. Meanwhile, these regions are usually prone to drought, proving that passive microwave remote sensing can be a feasible way for hydrological drought assessment.
This study proposed an effective way for hydrological drought assessment based on microwave remote sensing in Mainland China. It can be further applied to studies on all forms of drought together with other multi-source satellite data. This study can provide guidance for other practical hydrological applications, especially in regions of limited ground data.
Supplementary Materials
The following are available online at https://www.mdpi.com/article/10.3390/w13172429/s1. Figure S1. Box plots of normalized centered root-mean-square error (NCRMSE) and mean relative error (MRE) for the 79 stations; Figure S2. NCRMSE vs. R and MRE vs. R for the 79 stations; Figure S3. Comparisons of the standardized runoff index on a 3-month scale (SRI-3) trends, drought event frequency, distribution of drought duration (Dd) and drought severity (Ds) for the 79 stations from 1996–2008 based on simulated and observed runoff, respectively; Table S1. Multiple regression analysis of the influencing factors.
Author Contributions
Conceptualization, Z.Z. and X.Q.; methodology, Z.Z. and Z.Y.; formal analysis, X.Q. and Z.Z.; resources, J.H. and J.X.; data curation, J.H. and Y.W.; validation, J.X.; supervision, Z.Z. and Z.Y.; writing—original draft preparation, X.Q.; writing—review and editing, Z.Z.; funding acquisition, Z.Z. and Y.W. All authors have read and agreed to the published version of the manuscript.
Funding
This research was funded by the National Natural Science Foundation of China, grant number 52009007, the Natural Science Foundation of Hubei Province, grant number 2020CFB132 and the Water Resource Science and Technology Innovation Program of Guangdong Province, grant number 2017-03.
Institutional Review Board Statement
Not applicable.
Informed Consent Statement
Not applicable.
Data Availability Statement
Data sharing not applicable.
Acknowledgments
This research was financially supported by the National Natural Science Foundation of China (Grant NO. 52009007), the Natural Science Foundation of Hubei Province (NO. 2020CFB132) and the Water Resource Science and Technology Innovation Program of Guangdong Province (2017-03).
Conflicts of Interest
The authors declare no conflict of interest.
References
- Schubert, S.D.; Stewart, R.E.; Wang, H.; Barlow, M.; Berbery, E.H.; Cai, W.; Hoerling, M.P.; Kanikicharla, K.K.; Koster, R.D.; Lyon, B.; et al. Global meteorological drought: A synthesis of current understanding with a focus on SST Drivers of precipitation deficits. J. Clim. 2016, 29, 3989–4019. [Google Scholar] [CrossRef] [Green Version]
- Mishra, A.K.; Singh, V.P. A review of drought concepts. J. Hydrol. 2010, 391, 202–216. [Google Scholar] [CrossRef]
- Ionita, M.; Nagavciuc, V.; Kumar, R.; Rakovec, O. On the curious case of the recent decade, mid-spring precipitation deficit in central Europe. NPJ Clim. Atmos. Sci. 2020, 3, 1–10. [Google Scholar] [CrossRef]
- Ionita, M.; Dima, M.; Nagavciuc, V.; Scholz, P.; Lohmann, G. Past megadroughts in central Europe were longer, more severe and less warm than modern droughts. Commun. Earth Environ. 2021, 2, 53887. [Google Scholar] [CrossRef]
- Kim, T.; Jehanzaib, M. Drought Risk Analysis, Forecasting and Assessment under Climate Chang. Water-Sui 2020, 12, 1862. [Google Scholar]
- Zhuguo, M.; Congbin, F. Interannual characteristics of the surface hydrological variables over the arid and semi-arid areas of northern China. Glob. Planet. Chang. 2003, 37, 189–200. [Google Scholar]
- Leng, G.; Tang, Q.; Rayburg, S. Climate change impacts on meteorological, agricultural and hydrological droughts in China. Glob. Planet. Chang. 2015, 126, 23–34. [Google Scholar] [CrossRef]
- Barriopedro, D.; Gouveia, C.M.; Trigo, R.M.; Wang, L. The 2009/10 Drought in China: Possible Causes and Impacts on Vegetation. J. Hydrometeorol. 2012, 13, 1251–1267. [Google Scholar] [CrossRef] [Green Version]
- Li, Y.; Xu, H.; Liu, D. Features of the extremely severe drought in the east of Southwest China and anomalies of atmospheric circulation in summer 2006. Acta Meteorol. Sin. 2011, 25, 176–187. [Google Scholar] [CrossRef]
- Zhang, J.; Jiang, L.; Feng, Z.; Li, P. Detecting effects of the recent drought on vegetation in southwestern China. J. Resour. Ecol. 2012, 3, 43–49. [Google Scholar]
- Xu, K.; Yang, D.; Xu, X.; Lei, H. Copula based drought frequency analysis considering the spatio-temporal variability in Southwest China. J. Hydrol. 2015, 527, 630–640. [Google Scholar] [CrossRef]
- Xu, K.; Yang, D.; Yang, H.; Li, Z.; Qin, Y.; Shen, Y. Spatio-temporal variation of drought in China during 1961–2012: A climatic perspective. J. Hydrol. 2015, 526, 253–264. [Google Scholar] [CrossRef]
- Fendeková, M.; Gauster, T.; Labudová, L.; Vrablíková, D.; Danáčová, Z.; Fendek, M.; Pekárová, P. Analysing 21st century meteorological and hydrological drought events in Slovakia. J. Hydrol. Hydromech. 2018, 66, 393–403. [Google Scholar] [CrossRef] [Green Version]
- Vasiliades, L.; Loukas, A.; Liberis, N. A water balance derived drought index for Pinios River Basin, Greece. Water Resour. Manag. 2011, 25, 1087–1101. [Google Scholar] [CrossRef]
- McKee, T.B.; Doesken, N.J.; Kieist, J. The relationship of drought frequency and duration to time scales. In Proceedings of the Eighth Conference on Applied Climatology, Anaheim, CA, USA, 17–22 January 1993. [Google Scholar]
- Welford, M.; Hollinger, S.; Isard, S. A new soil moisture drought index for predicting crop yields. In Proceedings of the Eighth Conference on Applied Climatology, Anaheim, CA, USA, 17–22 January 1993; pp. 187–190. [Google Scholar]
- Shukla, S.; Wood, A.W. Use of a standardized runoff index for characterizing hydrologic drought. Geophys. Res. Lett. 2008, 35. [Google Scholar] [CrossRef] [Green Version]
- Xu, Y.; Zhang, X.; Wang, X.; Hao, Z.; Singh, V.P.; Hao, F. Propagation from meteorological drought to hydrological drought under the impact of human activities: A case study in northern China. J. Hydrol. 2019, 579, 124147. [Google Scholar] [CrossRef]
- Xiang, Y.; Wang, Y.; Chen, Y.; Bai, Y.; Zhang, L.; Zhang, Q. Hydrological drought risk assessment using a multidimensional Copula function approach in arid inland basins, China. Water-Sui 2020, 12, 1888. [Google Scholar] [CrossRef]
- Gu, L.; Chen, J.; Yin, J.; Xu, C.; Chen, H. Drought hazard transferability from meteorological to hydrological propagation. J. Hydrol. 2020, 585, 124761. [Google Scholar] [CrossRef]
- Liu, X.; Wang, S.; Zhou, Y.; Wang, F.; Li, W.; Liu, W. Regionalization and spatiotemporal variation of drought in China based on standardized precipitation evapotranspiration index (1961–2013). Adv. Meteorol. 2015, 2015, 1–18. [Google Scholar] [CrossRef] [Green Version]
- Yin, J.; Guo, S.; Gu, L.; Zeng, Z.; Liu, D.; Chen, J.; Shen, Y.; Xu, C. Blending multi-satellite, atmospheric reanalysis and gauge precipitation products to facilitate hydrological modelling. J. Hydrol. 2021, 593, 125878. [Google Scholar] [CrossRef]
- Tang, G.; Long, D.; Hong, Y.; Gao, J.; Wan, W. Documentation of multifactorial relationships between precipitation and topography of the Tibetan Plateau using spaceborne precipitation radars. Remote Sens. Environ. 2018, 208, 82–96. [Google Scholar] [CrossRef]
- Bjerklie, D.M.; Lawrence Dingman, S.; Vorosmarty, C.J.; Bolster, C.H.; Congalton, R.G. Evaluating the potential for measuring river discharge from space. J. Hydrol. 2003, 278, 17–38. [Google Scholar] [CrossRef]
- Krajewski, W.F.; Anderson, M.C.; Eichinger, W.E.; Entekhabi, D.; Hornbuckle, B.K.; Houser, P.R.; Katul, G.G.; Kustas, W.P.; Norman, J.M.; Peters-Lidard, C.; et al. A remote sensing observatory for hydrologic sciences: A genesis for scaling to continental hydrology. Water Resour. Res. 2006, 42, W7301. [Google Scholar] [CrossRef] [Green Version]
- Zhang, Y.; Hong, Y.; Wang, X.; Gourley, J.J.; Gao, J.; Vergara, H.J.; Yong, B. Assimilation of passive microwave streamflow signals for improving flood forecasting: A first study in Cubango River Basin, Africa. Appl. Earth Obs. Remote Sens. 2013, 6, 2375–2390. [Google Scholar] [CrossRef]
- Zeng, Z.; Gan, Y.; Kettner, A.J.; Yang, Q.; Zeng, C.; Brakenridge, G.R.; Hong, Y. Towards high resolution flood monitoring: An integrated methodology using passive microwave brightness temperatures and Sentinel synthetic aperture radar imagery. J. Hydrol. 2020, 582, 124377. [Google Scholar] [CrossRef]
- Zaji, A.H.; Bonakdari, H.; Gharabaghi, B. Remote sensing satellite data preparation for simulating and forecasting river discharge. IEEE Trans. Geosci. Remote Sens. 2018, 56, 3432–3441. [Google Scholar] [CrossRef]
- Huang, Q.; Long, D.; Du, M.; Zeng, C.; Li, X.; Hou, A.; Hong, Y. An improved approach to monitoring Brahmaputra River water levels using retracked altimetry data. Remote Sens. Environ. 2018, 211, 112–128. [Google Scholar] [CrossRef]
- McFarland, M.J.; Miller, R.L.; Neale, C.M.U. Land surface temperature derived from the SSM/I passive microwave brightness temperatures. IEEE Trans. Geosci. Remote Sens. 1990, 28, 839–845. [Google Scholar] [CrossRef]
- Alley, R.; Jentoft-Nilsen, M. Algorithm Theoretical Basis Document for: Brightness Temperature; Jet Propulsion Laboratory: Pasadena, CA, USA, 1999. [Google Scholar]
- Brakenridge, G.R.; Cohen, S.; Kettner, A.J.; De Groeve, T.; Nghiem, S.V.; Syvitski, J.P.M.; Fekete, B.M. Calibration of satellite measurements of river discharge using a global hydrology model. J. Hydrol. 2012, 475, 123–136. [Google Scholar] [CrossRef]
- Brakenridge, G.R.; Nghiem, S.V.; Anderson, E.; Chien, S. Space-based measurement of river runoff. Trans. Am. Geophys. Union 2005, 86, 185–188. [Google Scholar] [CrossRef] [Green Version]
- Brakenridge, G.R.; Nghiem, S.V.; Anderson, E.; Mic, R. Orbital microwave measurement of river discharge and ice status. Water Resour. Res. 2007, 43, W4405. [Google Scholar] [CrossRef]
- van Dijk, A.I.J.M.; Brakenridge, G.R.; Kettner, A.J.; Beck, H.E.; De Groeve, T.; Schellekens, J. River gauging at global scale using optical and passive microwave remote sensing. Water Resour. Res. 2016, 52, 6404–6418. [Google Scholar] [CrossRef]
- Revilla-Romero, B.; Thielen, J.; Salamon, P.; De Groeve, T.; Brakenridge, G.R. Evaluation of the satellite-based Global Flood Detection System for measuring river discharge: Influence of local factors. Hydrol. Earth Syst. Sci. 2014, 18, 4467–4484. [Google Scholar] [CrossRef] [Green Version]
- Wu, B.; Lang, X.; Jiang, D. Köppen climate zones in China over the last 21,000 years. J. Geophys. Res. Atmos. 2021, 126, e2020JD034310. [Google Scholar] [CrossRef]
- Chen, X.; Jiang, J.; Li, H. Drought and flood monitoring of the Liao River Basin in Northeast China using extended GRACE data. Remote Sens. 2018, 8, 1168. [Google Scholar] [CrossRef] [Green Version]
- Brodzik, M.J.; Long, D.G.; Hardman, M.A.; Paget, A.; Armstrong, R. MEaSUREs Calibrated Enhanced-Resolution Passive Microwave Daily EASE-Grid 2.0 Brightness Temperature ESDR, Version 1; NASA National Snow and Ice Data Center Distributed Active Archive Center: Boulder, CO, USA, 2020. [Google Scholar]
- Brodzik, M.J.; Hardman, M.A.; Long, D.G. Leveraging metadata conventions to improve usability of an EASE-Grid 2.0 passive microwave data product. Int. Geosci. Remote Sens. Symp. 2017, 5197–5200. [Google Scholar] [CrossRef]
- Long, D.G.; Stroeve, J. Enhanced-Resolution SSM/I and AMSR-E Daily Polar Brightness Temperatures; NASA DAAC at the National Snow and Ice Data Center: Boulder, CO, USA, 2011. [Google Scholar]
- Johnson, M.T.; Ramage, J.; Troy, T.J.; Brodzik, M.J. Snowmelt detection with calibrated, Enhanced--Resolution Brightness Temperatures (CETB) in Colorado Watersheds. Water Resour. Res. 2020, 1, e2018WR024542. [Google Scholar] [CrossRef]
- Farr, T.G.; Rosen, P.A.; Caro, E.; Crippen, R.; Duren, R.; Hensley, S.; Kobrick, M.; Paller, M.; Rodriguez, E.; Roth, L.; et al. The shuttle radar topography mission. Rev. Geophys. 2007, 45, G2004. [Google Scholar] [CrossRef] [Green Version]
- Yamazaki, D.; O’Loughlin, F.; Trigg, M.A.; Miller, Z.F.; Pavelsky, T.M.; Bates, P.D. Development of the Global Width Database for Large Rivers. Water Resour. Res. 2014, 50, 3467–3480. [Google Scholar] [CrossRef]
- Chen, J.; Ban, Y.; Li, S. China: Open access to Earth land-cover map. Nature 2014, 7523, 434. [Google Scholar]
- DiMiceli, C.; Carroll, M.; Sohlberg, R.; Kim, D.; Kelly, M.; Townshend, J. MOD44B MODIS/Terra Vegetation Continuous Fields Yearly L3 Global 250 m SIN Grid V006; NASA EOSDIS Land Processes DAAC: Washington, DC, USA, 2015. [Google Scholar]
- Beck, H.E.; Zimmermann, N.E.; McVicar, T.R.; Vergopolan, N.; Berg, A.; Wood, E.F. Present and future Köppen-Geiger climate classification maps at 1-km resolution. Sci. Data 2018, 5, 1–12. [Google Scholar] [CrossRef] [Green Version]
- Peel, M.C.; Finlayson, B.L.; Mcmahon, T.A. Updated world map of the Köppen-Geiger climate classification. Hydrol. Earth Syst. Sci. Discuss. 2007, 5, 1633–1644. [Google Scholar] [CrossRef] [Green Version]
- Rees, W.; Peellikkap, P.P. Principles of remote sensing. In Remote Sensing of Glaciers; Taylor & Francis: Abingdon, UK, 2009. [Google Scholar]
- Brakenridge, G.R.; De Grove, T. Satellite River Discharge and Runoff Measurements: Technical Summary; University of Colorado: Boulder, CO, USA, 2013. [Google Scholar]
- Khan, S.I.; Hong, Y.; Vergara, H.J.; Gourley, J.J.; Brakenridge, G.R.; De Groeve, T.; Flamig, Z.L.; Policelli, F.; Yong, B. Microwave satellite data for hydrologic modeling in ungauged basins. Trans. Geosci. Remote Sens. 2012, 4, 663–667. [Google Scholar] [CrossRef]
- Zelenhasić, E.; Salvai, A. A method of streamflow drought analysis. Water Resour. Reacher. 1987, 1, 156. [Google Scholar] [CrossRef]
- Wu, R.; Zhang, J.; Bao, Y.; Guo, E. Run theory and Copula-based drought risk analysis for Songnen Grassland in northeastern China. Sustainability 2019, 11, 6032. [Google Scholar] [CrossRef] [Green Version]
- Kwak, J.; Kim, S.; Jung, J.; Singh, V.P.; Lee, D.R.; Kim, H.S. Assessment of meteorological drought in Korea under climate Chang. Adv. Meteorol. 2016, 2016, 1–13. [Google Scholar] [CrossRef]
- Guttman, N.B. Accepting the Standardized Precipitation Index: A calculation algorithm. J. Am. Water Resour. Assoc. 1999, 35, 311–322. [Google Scholar] [CrossRef]
- Gupta, H.V.; Sorooshian, S.; Yapo, P.O. Status of automatic calibration for hydrologic models: Comparison with multilevel expert calibration. J. Hydrol. Eng. 1999, 4, 135–143. [Google Scholar] [CrossRef]
- Nash, J.E.; Sutcliffe, J.V. River flow forecasting through conceptual models part I-A discussion of principles. J. Hydrol. 1970, 10, 282–290. [Google Scholar] [CrossRef]
- Mei, Y.; Nikolopoulos, E.I.; Anagnostou, E.N.; Borga, M. Evaluating Satellite Precipitation Error Propagation in Runoff Simulations of Mountainous Basins. J. Hydrometeorol. 2016, 17, 1407–1423. [Google Scholar] [CrossRef]
- Ehsan Bhuiyan, M.A.; Nikolopoulos, E.I.; Anagnostou, E.N.; Polcher, J.; Albergel, C.; Dutra, E.; Fink, G.; Martínez-de La Torre, A.; Munier, S. Assessment of precipitation error propagation in multi-model global water resource reanalysis. Hydrol. Earth Syst. Sci. 2019, 23, 1973–1994. [Google Scholar] [CrossRef] [Green Version]
- De Groeve, T. Flood monitoring and mapping using passive microwave remote sensing in Namibia. Geomat. Nat. Hazards Risk 2010, 1, 19–35. [Google Scholar] [CrossRef]
- Hipel, K.W.; McLeod, A.I. Time Series Modelling of Water Resources and Environmental Systems; Elsevier Science: New York, NY, USA, 1994. [Google Scholar]
- Kendall, M.G. Rank Correlation Methods; Griffin: London, UK, 1975. [Google Scholar]
- Bjerklie, D.M. Estimating the bankfull velocity and discharge for rivers using remotely sensed river morphology information. J. Hydrol. 2007, 341, 144–155. [Google Scholar] [CrossRef]
- Tian, H.; Iqbal, M. Utilizing a new soil effective temperature scheme and archived satellite microwave brightness temperature data to estimate surface soil moisture in the Nagqu region, Tibetan Plateau of China. J. Arid Land 2018, 10, 84–100. [Google Scholar] [CrossRef] [Green Version]
- Bjerklie, D.M.; Moller, D.; Smith, L.C.; Dingman, S.L. Estimating discharge in rivers using remotely sensed hydraulic information. J. Hydrol. 2005, 309, 191–209. [Google Scholar] [CrossRef]
- Moffitt, C.B.; Hossain, F.; Adler, R.F.; Yilmaz, K.K.; Pierce, H.F. Validation of a TRMM-based global Flood Detection System in Bangladesh. Int. J. Appl. Earth Obs. 2011, 13, 165–177. [Google Scholar] [CrossRef]
- Yao, N.; Zhao, H.; Li, Y.; Biswas, A.; Feng, H.; Liu, F.; Pulatov, B. National-scale variation and propagation characteristics of meteorological, agricultural, and hydrological droughts in China. Remote Sens. 2020, 12, 3407. [Google Scholar] [CrossRef]
- Yu, M.; Li, Q.; Hayes, M.J.; Svoboda, M.D.; Heim, R.R. Are droughts becoming more frequent or severe in China based on the Standardized Precipitation Evapotranspiration Index: 1951–2010? Int. J. Climatol. 2014, 34, 545–558. [Google Scholar] [CrossRef]
- Zhai, J.; Su, B.; Krysanova, V.; Vetter, T.; Gao, C.; Jiang, T. Spatial variation and trends in PDSI and SPI indices and their relation to streamflow in 10 large regions of China. J. Clim. 2010, 23, 649–663. [Google Scholar] [CrossRef]
Figure 1.
Distribution of the 79 typical stations in the 9 major basins, where dark blue dots indicate data period is 1999–2008 and light blue dots indicate data period is 1996–2005.
Figure 1.
Distribution of the 79 typical stations in the 9 major basins, where dark blue dots indicate data period is 1999–2008 and light blue dots indicate data period is 1996–2005.

Figure 2.
Methodological workflow to assess hydrological drought based on passive microwave remote sensing.
Figure 2.
Methodological workflow to assess hydrological drought based on passive microwave remote sensing.

Figure 3.
Schematic diagram of the run theory used to determine drought duration (Dd) and drought severity (Ds) [55].
Figure 3.
Schematic diagram of the run theory used to determine drought duration (Dd) and drought severity (Ds) [55].

Figure 4.
(a) Statistics of each category and (b) comparisons between basins for R and NS of the 79 stations.
Figure 4.
(a) Statistics of each category and (b) comparisons between basins for R and NS of the 79 stations.

Figure 5.
Spatial distribution of R and NS for the 79 stations.

Figure 6.
Observed vs. simulated monthly runoff at typical stations during the calibration and validation period: (a) Yambajan Station of Duilong River; (b) Gengzhang Station of Niyang River; (c) Xidaqiao Station of Aksu River; (d) Yangcun Sation of Yarlung Tsanpo River; (e) Pingle Station of Gui River; (f) Zhimenda Station of Yangtze River.

Figure 7.
Standardized runoff index on a 3-month scale (SRI-3) trends for 79 stations from 1996–2016.
Figure 7.
Standardized runoff index on a 3-month scale (SRI-3) trends for 79 stations from 1996–2016.

Figure 8.
Distribution of drought event frequency for the 79 stations during 1996–2016.

Figure 9.
Distribution of Dd and Ds for the most severe drought events for each station during 1996–2016.
Figure 9.
Distribution of Dd and Ds for the most severe drought events for each station during 1996–2016.

Figure 10.
Relationship between R and the influencing factors including (a) elevation, (b) river width, (c) mean discharge, (d) catchment area and (e) vegetation cover for the 79 stations.
Figure 10.
Relationship between R and the influencing factors including (a) elevation, (b) river width, (c) mean discharge, (d) catchment area and (e) vegetation cover for the 79 stations.

Figure 11.
Spatial distribution maps of R and NS: (a) percent tree, (b) elevation, (c) LULC types and (d) climate types.
Figure 11.
Spatial distribution maps of R and NS: (a) percent tree, (b) elevation, (c) LULC types and (d) climate types.

Figure 12.
Box plots of R for the influencing factors: (a) land use/cover (LULC) types and (b) climate types for the 79 stations.
Figure 12.
Box plots of R for the influencing factors: (a) land use/cover (LULC) types and (b) climate types for the 79 stations.


Table 1.
Statistics of climate, land use/cover (LULC), topography and data period of 79 stations for the 9 basins, which are Yangtze River Basin (YZR), the Yellow River Basin (YR), the Pearl River Basin (PR), the Southwest River Basin (SWR), the Huai River Basin (HR), the Southeast River Basin (SER), the Hai River Basin (Hai), the Songliao River Basin (SLR) and the Inland River Basin (IR).
| Basin | YZR | YR | PR | SWR | HR | SER | Hai | SLR | IR | |
|---|---|---|---|---|---|---|---|---|---|---|
| Climate | Tropical | |||||||||
| Arid | 2 | 1 | 2 | 4 | ||||||
| Temperate | 21 | 7 | 4 | 4 | 5 | 3 | ||||
| Cold | 2 | 2 | 4 | 5 | ||||||
| Polar | 4 | 2 | 7 | |||||||
| LULC | Grassland | 4 | 5 | 6 | ||||||
| Forest + grassland | 4 | 1 | 2 | 2 | 2 | 2 | ||||
| Crops | 5 | 2 | 2 | 2 | 5 | 3 | ||||
| Urban | 6 | 2 | 1 | 1 | 1 | |||||
| Forest land | 3 | 3 | 3 | 5 | ||||||
| Bare land | 3 | 1 | 3 | |||||||
| Mean discharge (m3/s) | <100 | 6 | 7 | 1 | 6 | 3 | 5 | 7 | ||
| 100–500 | 6 | 1 | 2 | 6 | 2 | 3 | 4 | |||
| >500 | 13 | 1 | 1 | 3 | 2 | |||||
| Catchment area (×103 km2) | <10 | 7 | 5 | 2 | 4 | 2 | 2 | 3 | 1 | |
| 10–50 | 5 | 3 | 2 | 7 | 2 | 1 | 2 | 6 | 4 | |
| >100 | 13 | 1 | 4 | 3 | ||||||
| Topography | Fist terrace | 4 | 6 | 11 | 3 | |||||
| Second terrace | 8 | 3 | 1 | 4 | 1 | 3 | 4 | |||
| Third terrace | 13 | 3 | 7 | 4 | 4 | |||||
| Data Period | 1996–2005 | 4 | 3 | 1 | 4 | 6 | 1 | 3 | ||
| 1999–2008 | 21 | 6 | 3 | 11 | 1 | 3 | 4 | 4 | 4 | |
| Total | 25 | 9 | 4 | 15 | 7 | 3 | 5 | 7 | 4 | |
Table 2.
Statistics of SRI-3 trends for the selected 79 stations.
| Basin | Increasing Trend | Percentage (%) | Decreasing Trend | Percentage (%) |
|---|---|---|---|---|
| YZR | 12/25 * | 48.0 | 13/25 | 52.0 |
| YR | 3/7 | 37.5 | 5/7 | 62.5 |
| PR | 3/4 | 75.0 | 1/4 | 25.0 |
| SWR | 9/16 | 56.3 | 7/16 | 43.8 |
| SER | 1/3 | 33.3 | 2/3 | 66.7 |
| HR | 4/7 | 57.1 | 3/7 | 42.9 |
| Hai | 2/5 | 40.0 | 3/5 | 60.0 |
| SLR | 2/7 | 28.6 | 5/7 | 71.4 |
| IR | 2/4 | 40.0 | 2/4 | 40.0 |
Note: * The number of stations with the SRI-3 of the corresponding trend/the total number of stations in the corresponding basin.
Publisher’s Note: MDPI stays neutral with regard to jurisdictional claims in published maps and institutional affiliations. |
© 2021 by the authors. Licensee MDPI, Basel, Switzerland. This article is an open access article distributed under the terms and conditions of the Creative Commons Attribution (CC BY) license (https://creativecommons.org/licenses/by/4.0/).
Share and Cite
MDPI and ACS Style
Qu, X.; Zeng, Z.; Yuan, Z.; Huo, J.; Wang, Y.; Xu, J. River Runoff Modelling and Hydrological Drought Assessment Based on High-Resolution Brightness Temperatures in Mainland China. Water 2021, 13, 2429. https://doi.org/10.3390/w13172429
AMA Style
Qu X, Zeng Z, Yuan Z, Huo J, Wang Y, Xu J. River Runoff Modelling and Hydrological Drought Assessment Based on High-Resolution Brightness Temperatures in Mainland China. Water. 2021; 13(17):2429. https://doi.org/10.3390/w13172429
Chicago/Turabian StyleQu, Xing, Ziyue Zeng, Zhe Yuan, Junjun Huo, Yongqiang Wang, and Jijun Xu. 2021. "River Runoff Modelling and Hydrological Drought Assessment Based on High-Resolution Brightness Temperatures in Mainland China" Water 13, no. 17: 2429. https://doi.org/10.3390/w13172429
Note that from the first issue of 2016, this journal uses article numbers instead of page numbers. See further details here.