
Constructed Wetlands to Face Water Scarcity and Water Pollution Risks: Learning from Farmers’ Perception in Alicante, Spain


1
Water and Territory Research Group, Interuniversity Institute of Geography, University of Alicante, 03690 San Vicente del Raspeig, Alicante, Spain
2
Environmental Intelligence for Global Change Lab, Department of Electronics, Information and Bioengineering, Politecnico di Milano, 20133 Milano, Italy
3
Department of Regional Geographic Analysis and Physical Geography, University of Alicante, 03690 San Vicente del Raspeig, Alicante, Spain
*
Author to whom correspondence should be addressed.
Water 2021, 13(17), 2431; https://doi.org/10.3390/w13172431
Submission received: 20 July 2021
/
Revised: 1 September 2021
/
Accepted: 2 September 2021
/
Published: 4 September 2021
(This article belongs to the Special Issue Application of Constructed Wetland Systems for Agricultural Wastewater Treatment in the Mediterranean Region)
Abstract
:Treated wastewater is constantly produced and relatively unaffected by climatic conditions, while Constructed Wetlands (CWs) are recognized as green technology and a cost-effective alternative to improve treated wastewater quality standards. This paper analyses how farmers consider (1) treated wastewater to face water scarcity risk and (2) CW as mechanisms to face agricultural water pollution in a climate change adaptation context. A survey about climate change perception and adaptation measures was answered by 177 farmers from two irrigation communities near El Hondo coastal wetland and the Santa Pola saltmarshes, both perceived as natural-constructed systems in Alicante, southern Spain. Results highlighted how, even with poor-quality standards, treated wastewater is considered a non-riskier measure and more reliable option when addressing climate change impacts. Overall, physical water harvesting (such as CWs) is the favorite choice when investing in water technologies, being perceived as the best option for users of treated wastewater and those concerned about water quality standards. Consequently, CWs were recognized as mechanisms to increase water supply and reduce water pollution. Policy-makers and water managers can use these learnings from farmers’ experience to identify the main barriers and benefits of using treated wastewater and CWs to address water scarcity and water pollution risks.
1. Introduction
Climate change alters the human relationship with the environment, modifies relatively stable climate factors, and makes them partially uncertain, unpredictable, and threatening [1]. The Mediterranean is one of the most prominent and vulnerable climate change hotspots, and the Euro-Mediterranean region frequently experiences extreme climate and weather events such as more frequent and pronounced droughts, heat waves, and heating days, together with higher temporal and spatial variability in precipitation (e.g., storms, flood risk, heavy rainfall) [2]. According to the European Environment Agency, the largest increase in the number of drought events in Europe is projected for Spain, resulting in an increased desertification hazard. In addition, future climate projections indicate a predominant shift towards a precipitation regime of higher interannual variability, spatially more heterogeneous, of higher intensity and greater extremes. Although the change tendencies throughout the 21st century present notable discrepancies among the global models, all of them, coincide in a significant reduction of total annual precipitation, which is maximum in spring and somewhat lower in summer. For example, the set of projections for scenario SRES A2 suppose precipitation will decrease from the control period (1961–1990) by approx. 5%, 9%, and 17% during 2011–2040, 2041–2070, and 2071–2100, respectively [3]. Recent studies also confirm how a large reduction in the average number of days and duration of all types of extreme precipitation events is expected across all seasons and regions of Spain, while the average intensity of episodes is projected to increase in winter and spring and decrease in summer [4]. Likewise, there is a tendency to increase the number of days without precipitation or with precipitation less than 1 mm, being manifested more clearly towards the end of the century, when the increase in days without precipitation could be around 20 days per year [5].
Climate change is a determining element for risk factors, especially for water-related impacts, enabling new risks to emerge or amplifying pre-existing ones in an already critical context [6], directly affecting many socio-economic sectors. For agricultural activity, highly sensitive to change, increasing the incidence of extreme climatic events and changing weather patterns will result in food insecurity and reduced agricultural productivity [7]. Water scarcity and water pollution risks, both worldwide phenomena and two of the biggest challenges that humankind faces today, will be aggravated by climate change [8]. On one side, water scarcity, especially in semi-arid regions, will become more extreme as the occurrence and severity of climate change impacts are projected to increase [9]. Consequently, increasing agricultural water security through irrigation to complement soil moisture deficit has improved agricultural production in large global regions. However, food production generates unintended effects such as depletion of river flow and groundwater resources [10]. On the other hand, water pollution has environmental consequences that make water unfit for consumption, increasing water scarcity. Water pollution has worsened in many regions, and water quality standards’ deterioration is expected to escalate, increasing the threat to human health, the environment, and sustainable development [11]. For example, in the EU, more than half of water bodies are not in a good ecological status, as required by the EU Water Framework Directive (2000/60/EC), with non-point nutrient pollution being one of the major causes of degradation [12]. Non-point pollution represents a special challenge because of not easily identifiable sources of pollution such as the runoff from soil, nutrients, and other chemicals from agricultural fields and residential areas [13]. Despite growing urgency to reconcile food production and environmental protection, water pollution from intensive agriculture remains a major global problem, being one of leading causes of water pollution globally [14] and causing human health problems, increasing water treatment costs, and eutrophication of fresh and marine waters [15]. Moreover, eutrophication or nutrient and phosphorus enrichment is a significant issue that results in water quality deterioration, stimulating excessive growth of plants and algae, high decomposition rates of the accumulated plant biomass, water acidification, decreased oxygenation, and overall habitat degradation [16].
As water scarcity and pollution become more noticeable and costlier, some current water management strategies will no longer be useful, and the changed situation will call for adaptation strategies that directly tackle both issues [17]. One of the most available, constantly produced, and relatively unaffected by climatic conditions water resource is treated wastewater. The reuse of treated wastewater is already taking place, directly or indirectly, in many semi-arid areas of the world in response to emerging water scarcity challenges (e.g., Africa, Central America, Southern Asia, Southern Europe) [18]. This non-conventional water resource is becoming an increasingly important source for irrigation since agriculture is the sector most affected by water scarcity. Irrigation accounts for 70% of global freshwater withdrawals and more than 90% of the consumption (including non-conventional water resources) [19]. According to estimations, about 11% of the total cultivated area worldwide is irrigated using untreated wastewater [20], while around 10% of citizens globally consume crops and vegetables produced using untreated wastewater [21]. Treated wastewater used for crop irrigation globally has increased about 10–29% per year in Europe, the United States, and China, and up to 41% in Australia [22]. Treated wastewater reduces pressure on global freshwater resources, providing mineral fertilizers compared to conventional methods while being used for landscaping and environmental goals, especially in areas suffering from water scarcity in the spring and summer seasons [23,24,25]. However, amongst financial constraints, inadequate regulatory frameworks, or engineering issues, several drawbacks mainly associated with health risks and significant sources of pollution to natural water bodies and the environment at large have increased the yuck factor [26,27]. For example, many studies have examined the role that factors such as water source, intended use, risk perception, trust, disgust, or economic incentives can have in hindering or facilitating acceptance of wastewater reuse. Across these studies, several significant findings have emerged, especially regarding public perception: (a) public perception and acceptance are primarily hampered by feelings of disgust and concern over public health risks, (b) people are generally more willing to accept treated wastewater reuse for non-potable purposes only, and (c) public acceptance of treated wastewater reuse is highly dependent on the respondents’ level of trust in water managers, farmers, researchers, and government officials [28]. The lack of widespread public support combined with farmer rejection, and technical and economical implementation issues (ensuring quality standards and energy efficiency at low cost), are some of the main barriers identified by treated wastewater promoters [29].
Research on treated wastewater strategies is being carried out to address water scarcity and prevent further deterioration of freshwater quality standards [30]. Considering that reuse of treated wastewater is essential to protect water resources, the environment, and public health, attention has been put on those systems to improve water quality standards. In recent decades, it has been recognized that wetlands, both natural or constructed (CWs), are an attractive wastewater treatment alternative to conventional treatment systems [31]. As nature-based solutions or green infrastructures for water pollution control based on processes observed in the natural environment [32], CWs can manage the great variety in wastewater origins in terms of organic and inorganic constituents, considering different treatments and recycling methods [33]. The pollution removal efficiency of CWs for wastewater treatment relies on microbial-mediated processes, such as the transformation and mineralization of organic matter and/or the degradation of pollutants [34]. Studies suggested that CWs were able to remove organics, total carbon, and nutrients effectively (e.g., fecal indicator bacteria removal ranged from 97% to 99%, such as coliforms and Escherichia coli) [35] but also biological contaminants, metals, or emergent pollutants by more than 85% [36]. In these processes, pollutant removal is reached through a combination of physical, chemical, and biological dynamics and efficiency indicators in which all the elements of CWs (plants, microorganisms, and substrates) can have a significant influence [37], including a positive effect on greenhouse gas emissions reduction [38].
As transition zones between terrestrial and aquatic environments [39], CWs are perceived as a cost-effective (low-cost and straightforward construction, operation and maintenance reduced costs, or energy biomass production) [40] and ecological and sustainable technology for treating different types of wastewater without the input of fossil fuels [41]. Likewise, CWs can contribute to flooding risk mitigation, stormwater runoff management, and increase water supply [42] by constituting an alternative option to conventional wastewater treatment plants (WWTPs) [43]. In general, CWs emulate natural wetlands in both form and function as water storage and management, although CWs also provide social and ecosystem functions (e.g., recreation, landscaping, aesthetic values, or green in the built environment) to contribute to the circular economy [44]. However, there has been limited research on the social acceptance process of treated wastewater, and very few studies have attempted to identify individual characteristics linked to beliefs affecting farmers’ (non-) acceptance [45] or on the socio-environmental aspects of promoting CWs [46], that is, how both strategies are perceived by end-users and stakeholders, such as citizens or farmers, including the acceptance/rejection rate when facing water pollution and water scarcity risks in semi-arid regions. According to [47], this is because the assessment of whether individuals are keen to accept a technology represents a relatively recent question, and this calls for a better understanding of the factors leading to positive or negative perceptions on the part of farmers.
Most studies analyzed public acceptance to justify the location, financing, development, and operation of WWTPs [48]. Likewise, most of the existing reviews within this topic have addressed the reuse of wastewater for agricultural purposes from a feasibility perspective, focusing on proper treatments and methods instead of a motivation or attitude change perspective from conventional to non-conventional water resources use [49]. However, studies on public acceptance have not been linked to farmers’ perceptions. Farmers’ feedback is essential to understand their particular needs and concerns when using treated wastewater because acceptance and successful implementation of treated wastewater projects in agriculture largely depends upon the support of farmers [50], but also to avoid distrust in food quality standards from consumers [51]. That is, how farmers perceive treated wastewater use and CWs is important because [52]: (1) local experience can be shared and compared and this would be useful to identify common patterns from individual strategies (to be transferred to policy makers), and (2) perception provides cognitive information that can be contrasted and evaluated according to attitude change and adaptation capacity. In this paper, we are particularly interested in exploring the social side of farmers regarding the use of treated wastewater and CWs, by asking (1) if agricultural treated wastewater and CWs are considered preferred mechanisms to face climate change by focusing on farmers’ awareness, perceived impacts, and adaptation capacity, and (2) which driving factors from farmers’ sociodemographic characteristics determine the acceptance or rejection of both measures.
2. Materials and Methods
2.1. Data Collection
The research design of the study was a descriptive survey carried out from March to September 2018. The target population of this study was farmers from Riegos de Levante Left Margin and Carrizales irrigation communities. The first is an irrigation association including eight minor irrigation communities, of which the Crevillente and Elche irrigation communities have been selected as those closest to El Hondo coastal wetland. We used a stratified, random sampling method to select farmers collaborating with irrigation communities and based on three combined criteria: adults, landowners, and without off-farm activity. According to both irrigation communities’ managers, a third of the irrigators meet these criteria. The process resulted in a sample of 242 randomly selected farmers; the overall response rate was 73.1%, yielding a valid sample of 177. We administered a closed-ended structured questionnaire in person through workshops and by email. Additionally, in collecting data from respondents, their participation consent was sought first.
The questionnaire (Table S1) contains 42 variables duly structured in six sections: farmers’ characteristics, farm characteristics, climate change awareness, climate change impacts, current adaptation measures, and barriers to adaptation. The first two sections included multiple-choice questions, covering the respondents’ socio-demographic and economic characteristics, including the age of the household head, education level, farming experience, succession intention, farmers association membership or subsidies, and essential information on-farm activity, such as farm size, main crop, irrigation method, water consumption, and treated wastewater use and quality standards. After collecting these independent variables, farmers were invited to indicate how they are aware of climate change occurrence, main perceived climate change impacts, and actions to be adapted, including main constraints to increasing their climate change resilience as dependent variables. These sections were coded as binary categorical variables, and choice options were coded using a Likert scale (‘yes/agree’ or ‘no/disagree’ scoring for 1 or 0, respectively, while ‘undecided/unknown’ was coded as 2, if applicable).
2.2. Data Analysis
Following previous studies on climate change perception and farmers’ behavior [53,54], we assumed that the community’s extent of awareness and how farmers perceive climate change impacts contribute to explaining the local exposure to climate risks and the farmers’ capacity to face perceived impacts from climate change patterns. Data were coded and analyzed using Microsoft Excel and the Statistical Package for Social Scientists (SPSS 27 version 21.0). The research, therefore, employed descriptive statistics to summarize the data distribution and statistical (inferential) analysis to identify linkages, associations, and the influence of farmers’ socioeconomic characteristics. Descriptive statistics (e.g., frequencies, percentages, means, and standard deviations) were calculated to identify trending profiles considering farmers and farm characteristics. Linear regression inferential statistic was used to determine the contributions of the independent variables (farmers’ profile) to the dependent (treated wastewater use and climate change perception). Correlation and bivariate analysis (Spearman’s rho and Pearson chi-square), distribution (Student’s t-value), and analysis of variance (ANOVA) (considering the association between groups, e.g., farmers characteristics) were calculated to determine if farmers’ beliefs and concerns regarding (1) climate change awareness and adaptation capacity and (2) preference to use treated wastewater differ across sociodemographic variables such as age, level of education, farm experience, type of crop, or farm size, membership in an agricultural association, and subsidies. Furthermore, descriptive and inferential statistics were employed to assess three main research questions (RQs):
RQ1: Are farmers favorable to use treated wastewater? Which is the perception of treated wastewater quality standards?
RQ2: Are farmers aware of climate change occurrence and how they perceive climate change impacts?
RQ3: Are treated wastewater use and CWs considered as climate change adaptation measures?
3. Case Study: El Hondo Coastal Wetland and Santa Pola Saltmarshes
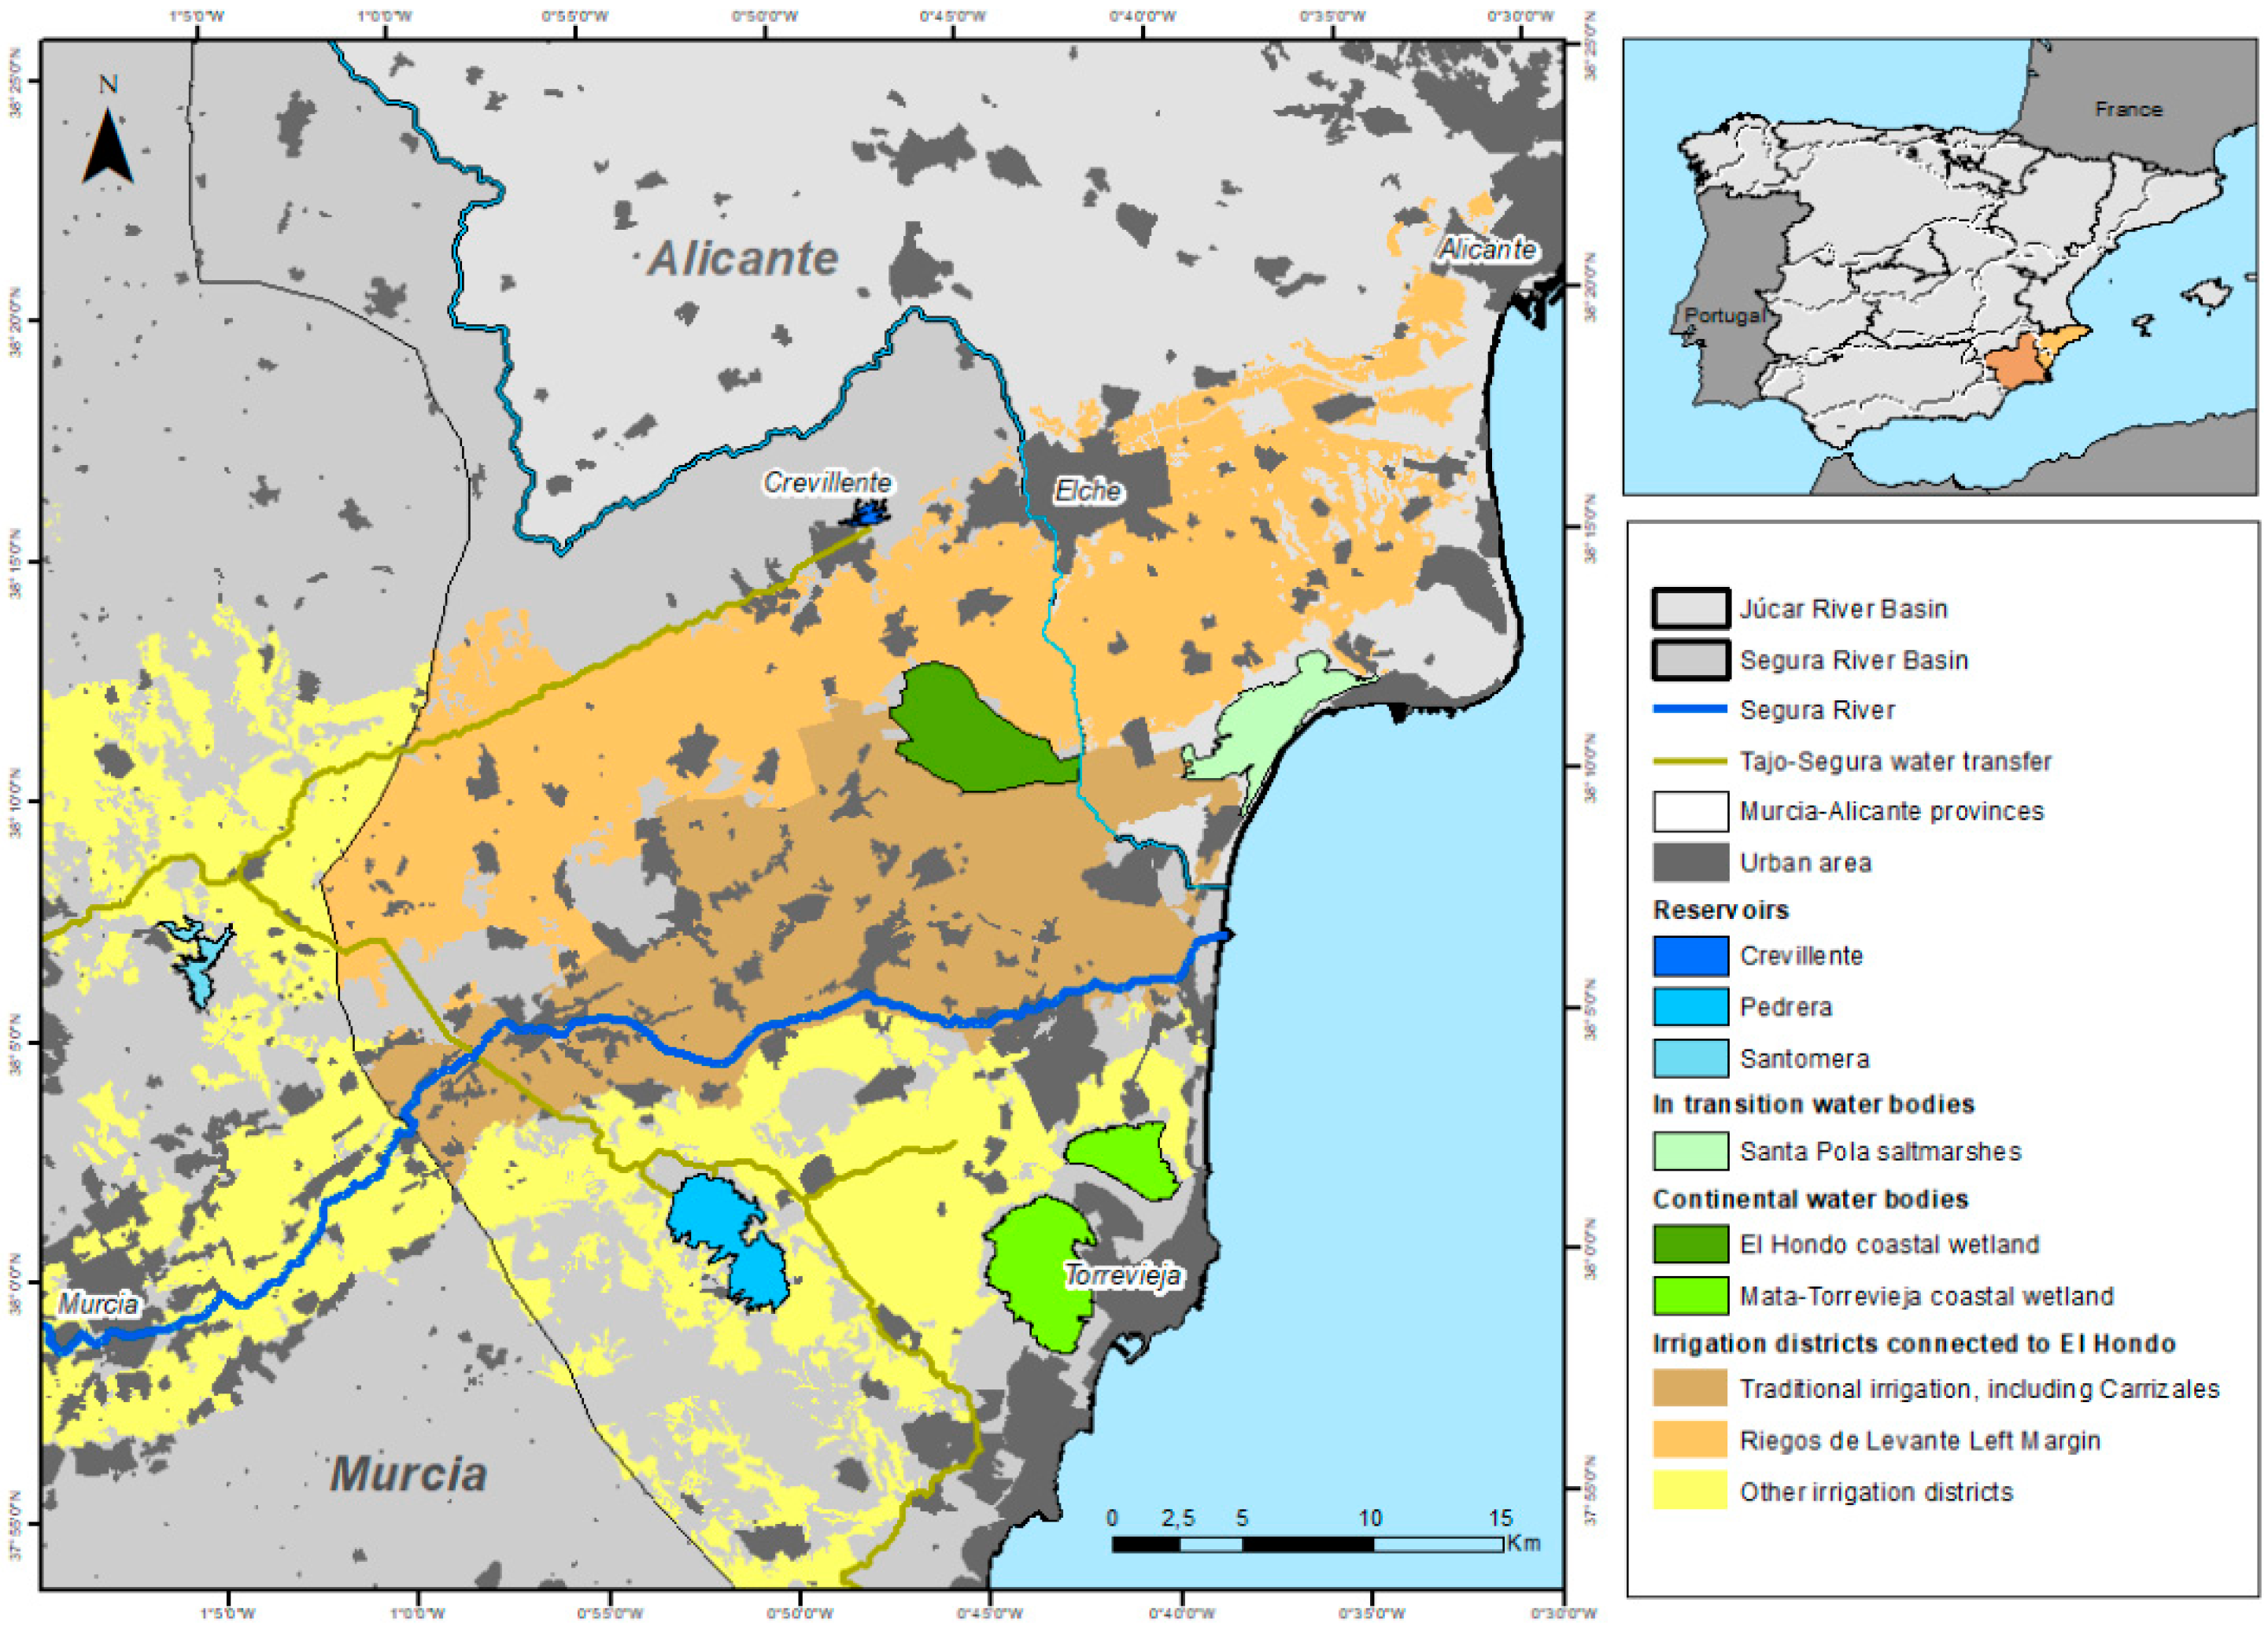
El Hondo and the Salinas de Santa Pola natural parks are examples of coupled human–nature systems that formerly made up the ancient Elche’s lagoon (Albufera de Elche), located in Alicante, southeastern Spain (N 38.202250; W 0.757072) (Figure 1). Included in the Vinalopó-Alacantí water resources scheme as part of the Jucar River Basin District, both systems are conditioned by rainfall variability, in which precipitation is a lot scarcer, showing average annual values of 345 mm and minimum values of 190 mm. However, precipitation events may occur with great intensity and short duration during October and November, commonly known as the ‘cold drop’. According to the Jucar River Basin Management Plan 2022–2027 (draft proposal in public consultancy since 22 June 2021) and Annex 14 on Risks Associated with Climate Change and Adaptation [55], precipitation in the Vinalopó-Alacantí system will decrease throughout the century in both RCP4.5 and RCP8.5 scenarios, although with significant variability. For example, the RCP4.5 scenario shows a generalized increase in precipitation (about 5%) during the first quarter of the hydrological year (October–December), while in the RCP8.5 scenario, the reduction in precipitation is generalized in all quarters (e.g., between 28–34% from January to September).
Both wetlands are hydrologically fed by surplus water from the Segura River. El Hondo coastal wetland covers an area of 2387 ha due to the drainage works carried out in the 18th century. However, the main change of this system started in 1923 when the Riegos de Levante irrigation community built two large freshwater ponds (16 hm3) named Poniente and Levante. Both ponds mainly serve as water reservoirs to irrigate about 31,600 ha, mainly distributed outside the limits of the coastal wetland. Agriculture occupies about half of the full extension and is limited to traditional crops of pomegranates, orchards, and palm tree nurseries. Furthermore, four ponds dedicated to ecological conservation and ten smaller hunting/fishing ponds are internally connected through five main canals [56]. Meanwhile, the Santa Pola saltmarshes cover 2470 ha and include salt farms, a series of freshwater ponds with varying degrees of salinity, an area of dunes and beaches, and a fraction of farmland. The coastal part, separated from the sea by dunes and beaches, was converted for intensive salt production during the early 20th century, while the inland part was less transformed, featuring marshes and temporary pools. The Santa Pola Wastewater Treatment Plant (WWTP) is located close to the Santa Pola saltmarshes and near to El Hondo coastal wetland and includes different reservoirs covering about 9 ha. According to a recent study (2018) carried out by the local conservationist organization Friends of the South Wetlands of Alicante Association, the WWTP is an example of CW assuming environmental functions: the association has identified the high ornithological value of the reservoirs, where are living up to 54 species of aquatic birds, some of them in danger of extinction.
Both spaces were declared natural parks in 1994 due to the high environmental value and the compatibility with traditional uses. The last bird census carried out by the regional government (Generalitat Valenciana) in 2019 confirmed how El Hondo regularly houses more than 20,000 wintering water birds from 179 species that inhabit certain seasons of the year, while 32 wetland plant and animal species found in Santa Pola are threatened and ten species are endemic [57]. The abundance and diversity of birds contributed to both systems’ classification as internationally recognized by the Ramsar agreement and included as a Special Protection Area for Birds (ZEPA) and Place of Community Interest (LIC). In March 2020, the regional government approved the expansion of the ZEPA surface covering El Hondo coastal wetland up to 3900 ha after including the Carrizales Agricultural Natural Park, located between both spaces and considered an agri-environmental connector [58].
Among the different irrigation communities in the area, Riegos de Levante Left Margin and Carrizales are the most relevant and those closest to El Hondo coastal wetland and Santa Pola saltmarshes (Table 1) [59]. The first one is an irrigation association including eight minor irrigation communities. This irrigation association and their associated minor irrigation communities have been benefiting from a Segura River water concession since 1918, when the start-up of the company Riegos de Levante S.A. was created to develop irrigation to a wide geographical area, complementing the agricultural system with hydroelectric production and the construction of a network of irrigation canals and reservoirs. Since 1976, through their representative bodies and based on their operating ordinances, farmers are in charge of the exploitation and distribution of water from concessions and assignments from the Tajo-Segura water transfer. Water rights come from the Segura River (77 hm3) and the Tajo-Segura water transfer (78 hm3). Water coming from the lower Segura River, which is of very poor quality, provides water resources to El Hondo. In order to address this situation, at the end of 2018, Riegos de Levante started the procedures to build a desalination plant after obtaining confirmation that the regional government will pay them 9.5 million euros as compensation for prohibiting hunting in El Hondo. The desalination plant (16 hm3) will be located in Crevillente with the aim to face the Tajo-Segura water transfer supply problems due to drought periods (e.g., in the past ten years, the average water concession received by the irrigation community has been less than half of the granted volume). In addition, the desalination plant will improve the water quality standards of El Hondo reservoirs. The Levante reservoir is the most used for irrigation, which does not usually have more than 4000 µS/cm, while the Poniente reservoir, where the protected flora and fauna ecosystem is located, nearly double this value (7000 µS/cm), so it is not used for irrigation.
On the other side, the Carrizales irrigation community is located between El Hondo coastal wetland and the Santa Pola saltmarshes. This transitional location motivated the designation of the Carrizales Agrarian Natural Park in 2008. The most agricultural area is irrigated (60%) by a capillary network of naturalized earth ditches and open canals covering more than 200 km [60]. The current irrigation system is part of the irrigation network of the Bajo Segura and Bajo Vinalopó counties. Due to semi-arid and subsoil conditions, water management has historically required two parallel canalization systems: irrigation and drainage. Thus, the water taken from the river by some of its historic weirs is diverted through ditches. The filtered water would become bogged down in the field if these dead waters were not channeled through runoffs. Likewise, and here lies the peculiarity of the Vega Baja county system, these dead waters are used to irrigate fields several times (up to five times), being an example of the maximum water reuse principle. This mechanism is essential to regularly address drought periods affecting the area due to the climate seasonality characterizing the Mediterranean region, considered a climate change hotspot [61] dominated by alternating high- and low-pressure systems [62]. Future projections of climate trends show that the Mediterranean region will become drier and hotter, resulting in a severe decrease in agricultural productivity [63]. To face this scenario, the irrigation community requested in 2019 that the agrarian natural park be connected with the nearby WWTPs plants, especially the Carrizales WWTP, to be less dependent on the Segura River water contributions.
In recent years, both irrigation communities—led by Riegos de Levante Left Margin—have emphasized the need to ensure the assignments from the Tajo-Segura water transfer while increasing the water quality standards of non-conventional water resources, as treated wastewater, to face water scarcity periods. According to news and interviews published in the local press, both irrigation communities put attention on the role of the public entity for wastewater sanitation (EPSAR) to ensuring water quality standards according to the Council Directive 91/271/EEC. Furthermore, together with different union farms (e.g., Young Farmers Agrarian Association, ASAJA, and the Union of Farmers and Livestock, La Unió) they claimed the guarantee of compliance with the optimal agronomic conditions of treated wastewater according to the requirements established by the Royal Decree 1620/2007, of 7 December, which establishes the legal regime for the reuse of treated water, and the recently approved Regulation (EU) 2020/741 of the European Parliament and of the Council, of 25 May 2020, on minimum requirements for water reuse. Likewise, both irrigation communities criticized the role of the Jucar River Basin Authority due to the non-compliance of the polluter pays principle by urban water users since farmers must assume the cost of additional water treatments (water disinfection, ultrafiltration, and desalination) needed to ensure the water quality standards of treated wastewater for agricultural use.
4. Results
4.1. Farmers Profile and Treated Wastewater Use
The distribution of respondents’ sociodemographic characteristics is shown in Table 2. Results indicate that only 1.7% of farmers were younger than 40 years old, while 54.3% were 60 years or older, or retired. Respondents with professional studies had the highest prevalence in the sample (30.5%), followed by farmers with primary education (29.9%). Most farmers (54.3%) have no less than 30 years of experience, while only 2.8% of the respondents have less than five years of experience. Just over a third of farmers (32.3%) had ensured succession, about a half of the respondents (50.8%) are members of a union farm, and the majority of farmers (70.1%) are not benefiting from subsidies (e.g., Common Agricultural Policy, CAP). Regarding the farm size, 16.9% of farmers had less than 1 ha, while 69% had between 1 and 10 ha. The main cultivated crops are citrus (27.7%), vegetables (19.2%), and a mixture of three to five crops (20.9%). Almost two-thirds of respondents (63.3%) used surface irrigation as their water resource, while the annual water consumption for most farmers (53.2%) is between 1000–5000 m3. Finally, about half of the respondents (51.4%) use treated wastewater, but only one-third (31.1%) considered their quality standards mainly good. However, the farmers’ general perception (including treated wastewater users and non-users) reported a lack of information about the quality standards of treated wastewater.
4.2. Climate Change Awareness
Awareness is a key factor determining effective measures for climate change adaptation because it reflects farmers’ level of exposure to climate risks [64]. The study reveals that 78% of the respondents are aware of climate change, whereas 20.3% do not know if climate change is occurring. Almost two-thirds of the respondents (63.8%) agree with the anthropogenic nature of climate change. The vast majority of farmers (71.8%) affirmed that climate change poses a risk to agriculture, and more specifically, to irrigated crops (85.3%). Farmers also highlighted the highest level of awareness regarding warming temperatures and water shortage due to climate change (93.8% and 88.7%, respectively). On the contrary, answers about the awareness of extreme events highlighted an unclear position among farmers, with one-third (33.3%) of the farmers being aware, 28.8% unaware, and the majority (37.9%) unknown. Furthermore, awareness of warming and water shortage obtained lower dispersion values, while the awareness of extreme events obtained the highest value according to the dispersion results (Table 3). These differences in dispersion values can exemplify higher awareness about warming temperatures and water shortage instead of extreme events.
Overall, almost all the exploratory variables comparing farmers’ sociodemographic characteristics and climate change awareness were negatively signed and statistically insignificant: the set of parameters configuring the farmer’s profile does not determine the level of awareness about climate change. However, some exceptions can be highlighted (Table 4). The respondent’s age is statistically significant and positively correlated with the perception that climate change is occurring and negatively correlated with warming awareness. As age increases, farmers reinforce their perception that climate change is real but decreases its direct nexus with global warming, while younger farmers are more likely to be concerned about warming temperatures than their older counterparts. Likewise, farming experience is negatively signed but statistically significant as a driver of warming awareness. Therefore, more experienced farmers are not more concerned with warming temperatures. In the same line, to be a member of a union farm does not provide additional awareness of warming temperatures but about the occurrence of climate change as a global phenomenon. On the opposite, farmers with lower levels of education (e.g., illiterate, primary education) and those applying crop diversification are more aware of climate change occurrence and about the exposition of irrigated crops to climate change. However, farmers who receive subsidies and plant dominant crops (e.g., citrus, vegetables) are less aware of water shortage.
4.3. Climate Change Impacts
Respondents were also asked about local changes perceived in the weather pattern. Data reveal that the vast majority of farmers had indeed heard about listed impacts except for two of them, land erosion and weeds or invasive species, which were confirmed by about one-third of the respondents (38.4% and 35%, respectively). A remarkable aspect is that the ‘unknown’ option rate is higher than the ‘no’ option rate for all the perceived impacts (except for ‘decreased plant growth’). The top three perceived impacts were related to warming patterns and their effects on water availability: ‘increased frequency/intensity of droughts’ (94.4%), ‘warmer temperatures and heat waves’ (93.2%), and ‘less reliable water supply (water scarcity)’ (88.7%). A similar level of agreement has been obtained on ‘change in timing, intensity or frequency of rainfall events’ (84.7%), while farmers considered ‘new diseases or pests’ (65%) and ‘decrease in plant growth’ (54.2%) as those impacts less noticeable. Table 5 confirms temperature and precipitation patterns as those variables mainly clustered around the mean (highlighting the affinity between farmers’ responses), while dispersion values are higher in agronomic variables (with a greater number of extreme responses).
Almost all the exploratory variables comparing farmers’ sociodemographic characteristics with climate change impacts were negatively signed and statistically insignificant (Table 6). Age, succession intention, union farm membership, subsidy beneficiary, and irrigation method do not influence the nature of perceived climate change impacts. On the contrary, education is positively signed and statistically significant with the perception of ‘warmer temperatures and heatwaves’ and ‘increased frequency or intensity of droughts’. Therefore, trained farmers (e.g., professional, higher education) perceived climate change impacts more accurately than illiterate and farmers with primary education. Likewise, farmers with less farming experience are more aware of the impact of warming temperatures, while the smaller the farm size and the lower the annual water consumption rates, the greater the impact on plant growth and relevance of weeds or invasive species. Finally, farmers applying crop diversity are less aware of the impact of warmer temperatures and heatwaves and less affected by water supply and water scarcity risks.
4.4. Main Adaptation Measures and Barriers
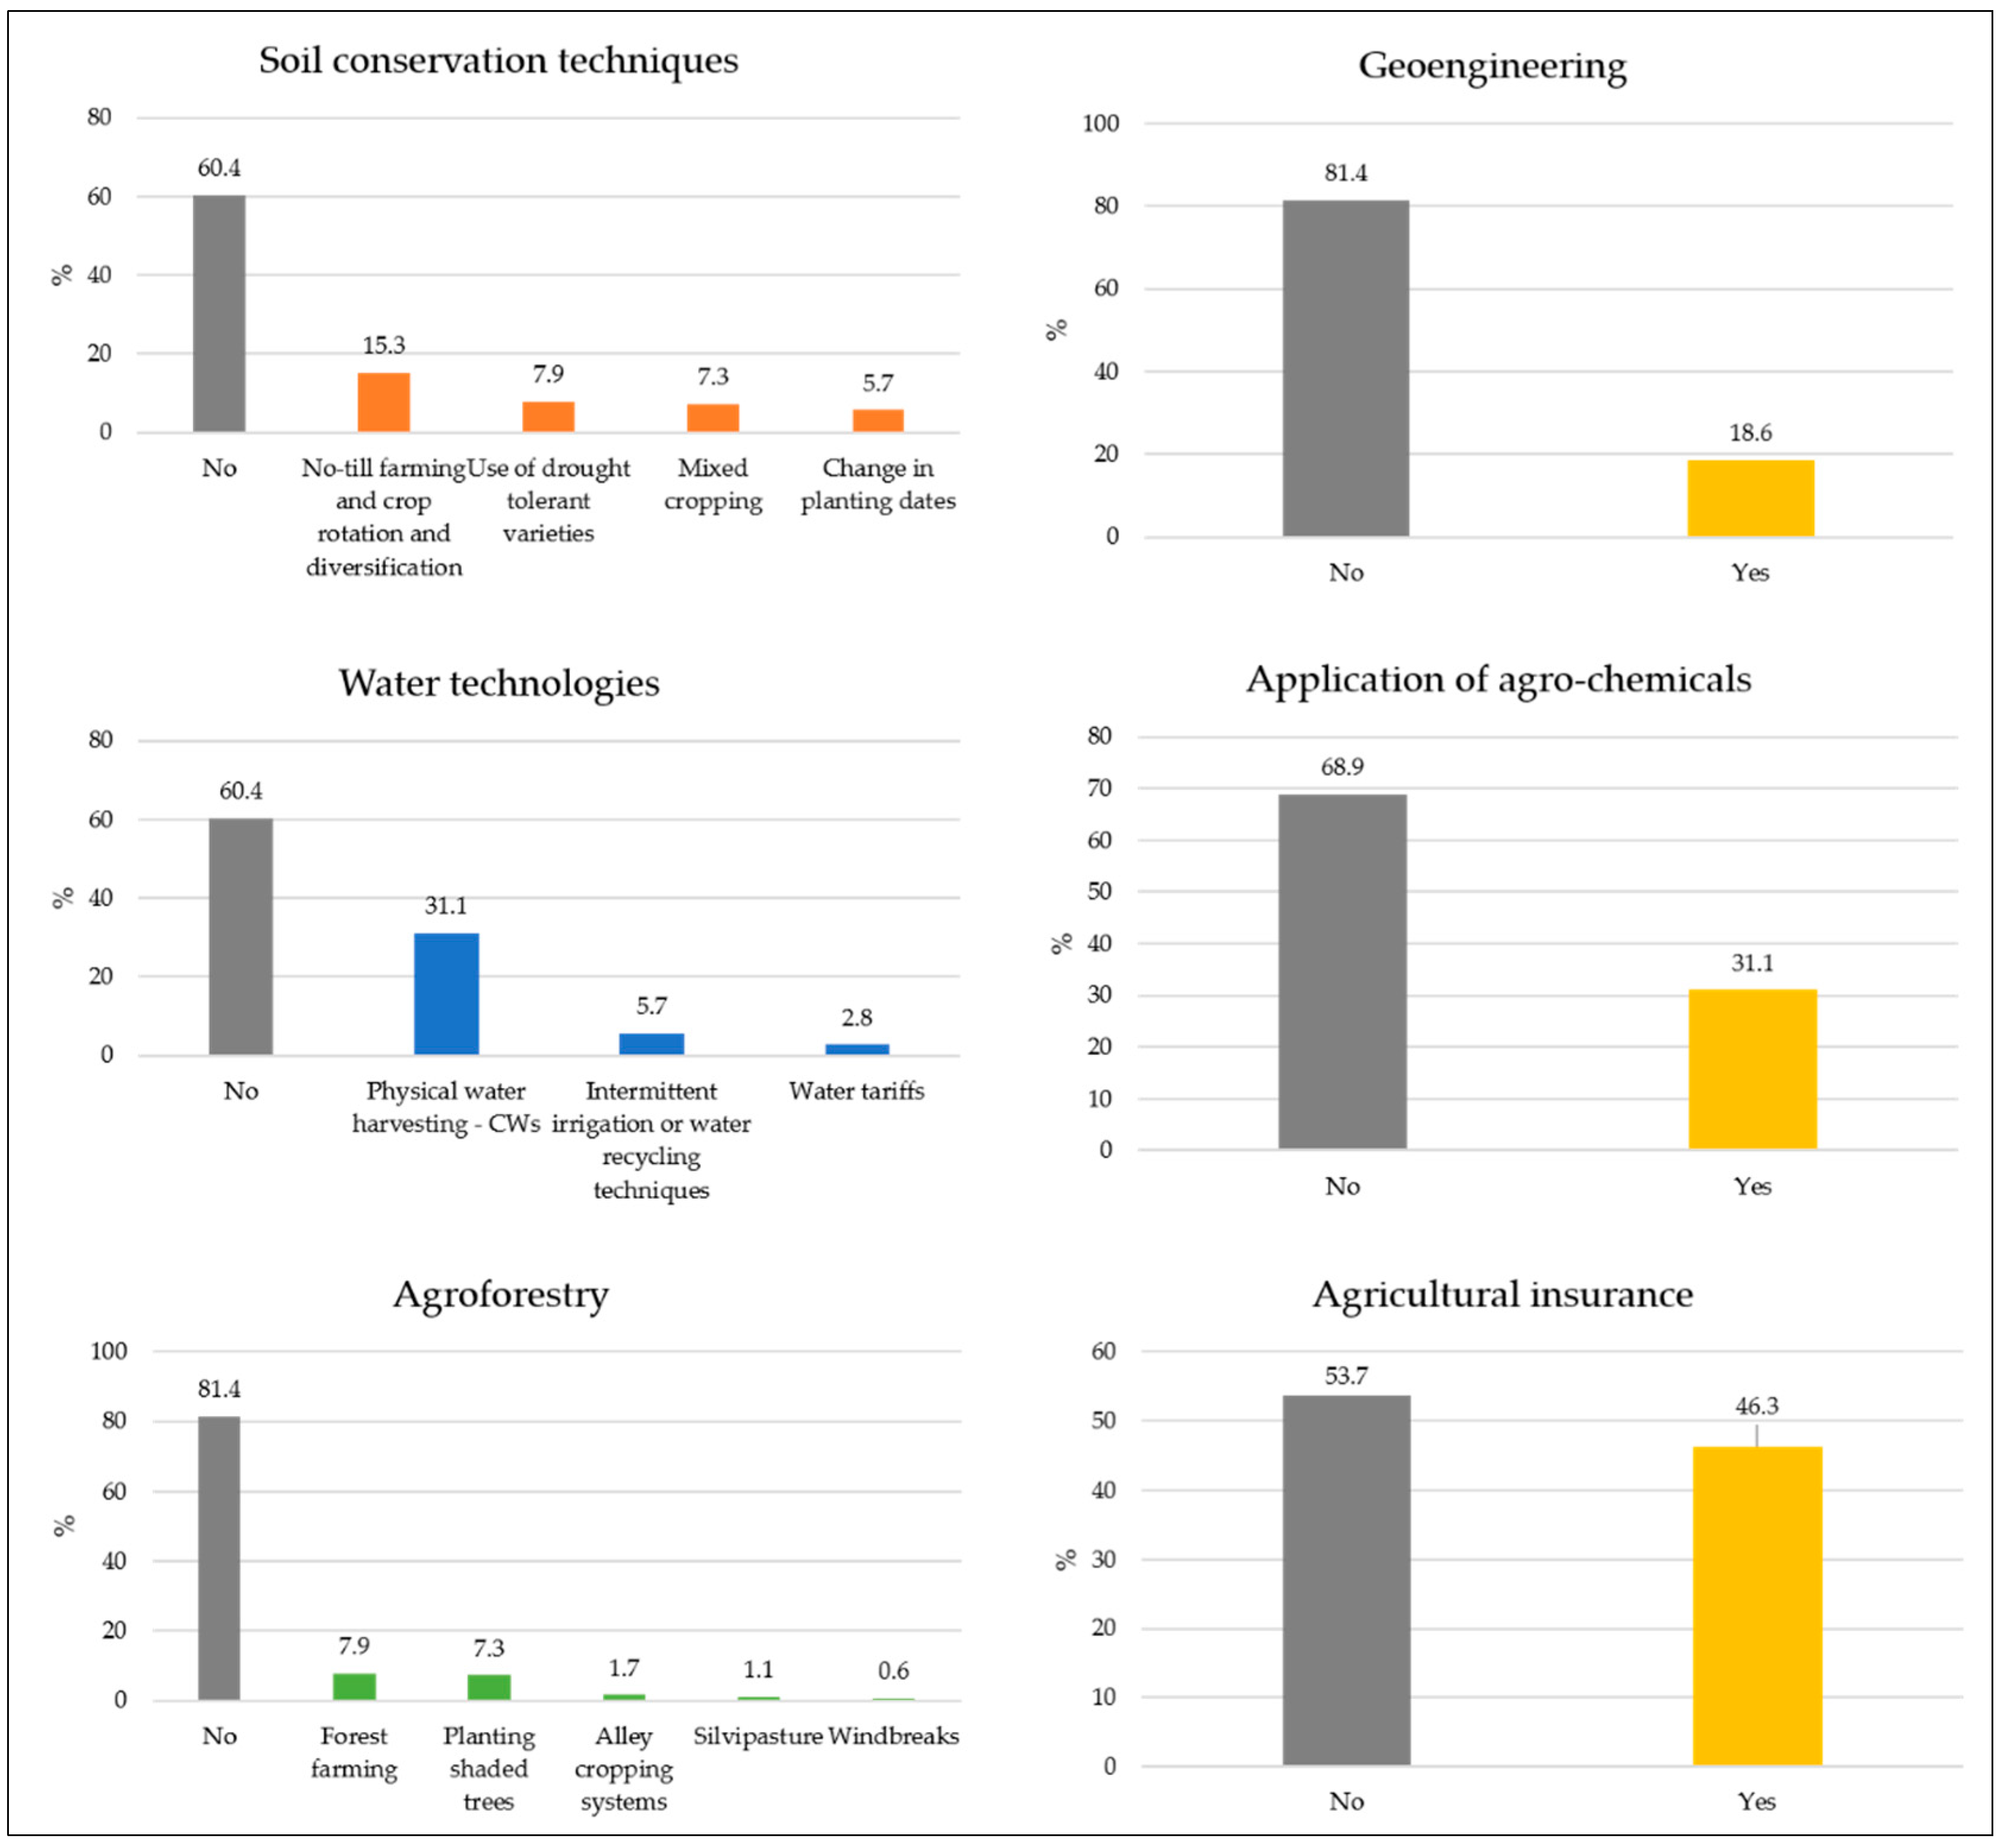
Most farmers (74.6%) agree on the need for adaptation to climate change, but only the use of treated wastewater was positively considered (68.4%) as an adaptation measure. Overall, one-third of the respondents (36.2%) intended to change soil conservation techniques, mainly focused on no-till farming and crop rotation and diversification (15.3%) (Figure 2). Investing in water technologies is considered an option for about 40% of the respondents, being physical water harvesting (CWs) the favorite option (31.1%). Although less than 1 of 5 respondents promoted agroforestry practices, forest farming and planting shaded trees were positively considered (7.9% and 7.3%, respectively). Additional adaptive options, such as geoengineering or the application of agrochemicals, were discarded by about 70–80% of the respondents. Otherwise, agricultural insurance was considered for less than half of the farmers. Regarding main adaptation measures, soil conservation techniques and treated wastewater use are the preferred options for the respondents, while geoengineering is on the opposite side. However, the reliability and spread of data distribution highlighted significant dispersion among the set of values, especially regarding soil conservation techniques and agroforestry practices (Table 7).
The exploratory variables from farmers’ sociodemographic characteristics and climate change adaptation measures show a statistical insignificance pattern in almost all variables (Table 8). Succession intention and main crop are not affecting the promotion of adaptation measures to face climate change impacts. On the contrary, age is negatively signed and statistically significant with adopting soil conservation techniques. Consequently, younger farmers are more predisposed to implement some type of soil conservation techniques (e.g., changing cropping practices) to face climate change, while the oldest farmers prefer applying agrochemicals (although results are not statistically significant). Likewise, farmers applying irrigation mixed methods are more favorable in considering soil conservation techniques and investing in water technologies (e.g., CWs). Education influences the predisposition to use treated wastewater and agrochemicals: while farmers with formal education (e.g., professional studies) use treated wastewater to increase water supply and face water scarcity, illiterate farmers prefer agrochemicals. Moreover, those farmers who are members of a union farm, those with extended farm size, and those with the highest levels of annual water consumption prefer applying for agricultural insurance to reduce their vulnerability to climate change impacts.
Different barriers to adaptation have been identified (Table 9). These barriers are conditions and factors that hinder farmers’ experience and can divert or block developing and implementing adaptation strategies. Two main barriers to adaptation have been reported among the respondents: lack of government support (65%) and lack of cooperation between stakeholders (governance) (63.3%). In addition, more than half of the respondents agree on the lack of information and data from the scientific community (53.1%) and animosity towards attitude change (51.4%) as relevant constraints to increase farmers’ adaptation capacity. Otherwise, almost half of the respondents (49.7%) considered that climate change skepticism does not determine the promotion of adaptation measures, while 48% of farmers reported that their activity would not be directly affected by climate change (related to a low-risk perception). Near half of the respondents (49.2%) highlight the high cost of investment at the farm level and the unpredictability behavior of the food market as the factors making it difficult to adapt to climate change. Finally, almost two-thirds of the respondents (63.3%) reported their ignorance about climate change regulation and rules at the national and international levels and how its development and compliance could affect their adaptive capacity at the farm scale.
4.5. Sociodemographic Factors Influencing Treated Wastewater Use and CWs Promotion
This section investigates the sociodemographic factors influencing farmers’ behavior regarding treated wastewater use and CWs promotion as climate change adaptation measures. Explanatory variables presented in Table 2 were used, and binary logit models were applied. The association between treated wastewater use and quality standards has been statistically measured using Pearson’s parametric correlation. The obtained values (p-value: −0.765, p < 0.01) indicate that both variables are negatively correlated: as treated wastewater use increase, perception on water quality standards decrease, and vice versa. However, it must be considered that this trend includes the assessment of farmers who do not use treated wastewater but perceive it as of poor quality (perhaps due to previous experiences or because they are aware of some examples of poor or bad quality standards suffered by other farmers). In addition, Spearman’s non-parametric correlation coefficient has been calculated to analyze the monotonic or linear behavior of the existing correlation pattern between both variables. The result (Spearman rho: −0.808, p < 0.01) confirmed that the correlation is more monotonic than linear, that is, both variables increasing concurrently (as confirmed by the p-value), but not at the same rate (as defined by the rho value).
The regression results in Table 10 suggest that only main crop selection (citrus) influence treated wastewater use and the perception of their quality standards, but following an opposite tendency: the greater use of treated wastewater, the worse the perception of their quality standards. This trend comparing treated wastewater use and perception affects most farmers’ sociodemographic characteristics, except age, subsidy beneficiary, and the irrigation method. Maybe surprisingly, farm size and annual water consumption had no significant influence on the use of treated wastewater but in their quality standards: as farm size and annual water consumption increase, perception of good quality standards decreases, and vice versa.
Investment in water technologies is positively signed and statistically significant with farm size, irrigation methods, and annual water consumption. Accordingly, farmers with more than 20 ha of crop extension and 10.000 m3 of annual water consumption are predisposed to invest in water technologies (e.g., CWs) to face water scarcity. At the same time, water technologies are not influenced by farming experience, the guarantee of succession, being a member of a union farm, or subsidy beneficiary (Table 11). The regression model between CWs and treated wastewater use highlighted how greater the use of treated wastewater and inadequate quality standards, the greater the need to invest in CWs (p-value: 0.151, p < 0.01 and −0.147, p < 0.01, respectively). This entails the perception of CWs as mechanisms to improve both water supply and water pollution.
5. Discussion and Conclusions
Most of the 17 Sustainable Development Goals (SDGs) agreed upon by the United Nations in 2015 to balance the social, economic, and environmental dimensions of sustainable development are directly or indirectly affected by growing water scarcity and water pollution problems [65]. The combination of using treated wastewater and CWs for agriculture has been promoted to achieve SDG6, to ensure availability and sustainable management of water and sanitation for all. This goal includes global targets that should be addressed at the regional scale, including both technical (water quality standards and water efficiency) and social perspectives (water management and governance): treatment and reuse of wastewater and ambient water quality (6.3), water-use efficiency and scarcity (6.4), and integrated water resources management (6.5) [66]. However, SDG6 achievement is directly conditioned by the resilience of the agricultural sector to climate change, one of the most important concerns for socioeconomic development in semi-arid regions, such as southern Spain. Being severely dependent on natural water resources, socio-ecological systems, such as the case study in Alicante, are particularly vulnerable to further climate change. The growing body of evidence shows the inevitability of climate change and its effects and potential measures to face the situation. Hence, suitable adaptation measures to climate change are essential. Thus, timely adaptation is desirable to reduce potential losses at the farm level, and local experience contributes to comprehensively analyze which are the best options to increase farmers’ adaptation capacity [67]. This study reported how farmers perceived climate change and the specific role of treated wastewater use and CWs in facing water scarcity and water pollution risks.
RQ1: Are farmers favorable to the use of agricultural treated wastewater, which is the perception of treated wastewater quality standards?
According to the sample survey’s main sociodemographic characteristics, the farmers’ dominating profile is about 60 years old, with professional studies, a farming experience of no less than 30 years, without guarantee on succession rate, member of a union farm, and not benefiting from subsidies. Regarding the farm characteristics, the farmer had between 1 and 10 ha, with citrus or vegetables duly surface irrigated for not more than 5000 m3/year, including agricultural treated wastewater use, despite its poor-quality standards. Only main crop selection (e.g., citrus, vegetables) had a significant impact on treated wastewater acceptance and the perception of their quality standards, but following an opposite tendency: the greater use of treated wastewater in crops, the lower the quality standards perception. Maybe surprisingly, farm size and annual water consumption had no significant impact on the use of treated wastewater. Moreover, although farm size and annual water consumption increase, perception of good quality standards decreases, and vice versa.
RQ2: Are farmers aware of climate change occurrence and how they perceive climate change impacts?
Respondents agreed that climate change is occurring, is anthropogenic, and poses a risk to agriculture risk [68,69]. However, awareness is not homogeneous considering the sociodemographic characteristics of the respondents. For example, older farmers are constrained by climate change, but younger farmers are more likely to be concerned about warming temperatures than their older counterparts. Compared to older farmers, younger farmers had better participation in implementing climate change adaptation strategies. An explanation could be that younger farmers have better access to information sources and are more willing to take risks associated with relatively new adaptation strategies than older farmers [70]. Likewise, farmers with lower levels of education (e.g., illiterate, primary education), those out of union farm membership, and those applying crop diversification are more aware of climate change occurrence and the associated risk for irrigated crops [71].
The vast majority of farmers had indeed heard about listed impacts, although the change in the rate of land erosion and increase in weeds or invasive species are not sufficiency perceived by the respondents. The top three changes perceived by the majority of farmers were increased frequency or intensity of droughts [72], warmer temperatures and heat waves [73], and less reliable water supply (water scarcity) [74]. Education is positively signed and statistically significant with the perception of warmer temperatures and heatwaves, and increased frequency or intensity of droughts, while those farmers with less farming experience are more conscientious about the impact of warming temperatures. These results are consistent with those in other studies [75,76], in which higher levels of education resulted in more perceived impacts and acceptance of climate change adaptation actions.
RQ3: Are treated wastewater use and CWs considered as climate change adaptation measures?
The regression results reported that respondents’ perceptions of climate change have effects on choosing adaptation measures. However, although about 75% of farmers agree on the need for adaptation to climate change, only the respondents’ use of treated wastewater as a counterpoint to the Tajo-Segura water transfer was positively considered. Besides poor-quality standards, the use of treated wastewater is perceived as a less risky measure and more reliable option when addressing climate change impacts. Overall, one-third of the respondents intended to make changes regarding soil conservation techniques, mainly focused on no-till farming and crop rotation and diversification or investing in water technologies, being physical water harvesting (CWs) the favorite option. On the contrary, additional adaptive options, such as geoengineering, have not been recognized as measures to improve climate change adaptation. Although the application of agrochemicals was discarded by about 70–80% of the respondents, illiterate farmers prefer using them as the first adaptation measure. In contrast, farmers with formal education (e.g., professional studies) use treated wastewater to increase water supply and face water scarcity risks.
However, the respondents reported climate change adaptation barriers, highlighting the lack of government support to promote adaptation measures and the lack of cooperation between stakeholders and farmers (good governance) [77]. More than half of the respondents agree on the lack of information and data from the scientific community [78] and certain shock towards changing farmers’ behavior as relevant constraints to increase farmers’ adaptation capacity. The high cost of investment at the farm level [79], combined with the food market unpredictability scenario, generated a dual farmers’ profile in which nearly half of the respondents agree on both constraints while the rest do not have enough information to discuss it. Most respondents reported their ignorance about climate change regulation and rules at the national and international levels and how its development and compliance could affect their adaptive capacity at the farm scale. Investment in water technologies (including CWs) is positively signed and statistically significant with farm size, irrigation methods, and annual water consumption. Consequently, farmers with the largest farm size who apply surface irrigation and consume the highest annual water consumption are interested in promoting CWs to face water scarcity. Likewise, the greater the use of treated wastewater and the poorer the quality standards, the greater the need to invest in CWs. This entails the perception of CWs as mechanisms to improve both water supply and water pollution.
As with all research, there are some limitations to this study. The survey measured farmers’ attitudes and behaviors in a specific time frame, limiting causal inferences. In the same way, the study was based on a sample survey that limits the possibility of delving into respondents’ motivation. Future research should expand sample sizes to help solidify identifying and understanding of treated wastewater and CWs challenges, and to determine main gaps and driving factors of farmers’ perceptions. Likewise, future research should include a round of preliminary exploratory qualitative interviews to identify new explanatory variables, including well-known variables such as income or gender (although both perspectives tend to be limited to studies carried out in developing countries), or discuss recent adaptation barriers at the regional scale (instead of limiting the focus on a literature review). Promoting a balance between practices that are beneficial to address water scarcity and water pollution and appealing to farmers is a common-sense idea, but this balance is not always navigated properly at local and regional scale. In line with [80], our results suggest that asking farmers to participate in an engaging process is also a learning experience in and of itself that can increase trust in programs and policies to face water risks and climate change that would otherwise be unappealing to farmers if it were simply imposed upon them. Farmers, as main water consumers, are key stakeholders in the promotion of programs and potentially valuable resources to disseminate information; they should be fully engaged in determining when and how treated wastewater and CWs are efficient solutions to address water scarcity and water pollution risks in the context of climate change.
Moreover, obtained results should be checked according to the parameters defined by the national regulation on integrated water resources management and non-conventional water resources to ensure coherence between water availability and water supply but also consistency between farmers’ perception and policy makers’ decisions. For example, in the case study region, it should be considered the requirements from the National Water Treatment, Sanitation, Efficiency, Saving and Reuse Plan (Plan DSEAR 2014–2023), which includes a catalog of initiatives and criteria, including actions to encourage treated wastewater use in highly pressured water contexts by eliminating institutional and financial barriers and improving perception and social acceptance. However, as demonstrated in our results, treated wastewater acceptance is conditioned to good quality standards. Consequently, further research should focus on how technology and innovation and nature-based solutions, such as CWs, could contribute to overcoming, from farmers’ experience, the ‘yuck factor’ associated with treated wastewater while achieving the new EU Regulation 2020/741 on minimum water quality requirements for water reuse. Likewise, future research should look at the new Common Agricultural Policy currently under discussion and the proposal to allocate direct payments to eco-schemes (environmentally friendly initiatives such as organic farming) and projects that promote environmental and climate practices. In the same line, treated wastewater and CWs should be analyzed according to their role in reducing water scarcity and water pollution, especially in socio-ecological systems located in semi-arid regions. Additionally, results from farmers’ predisposition to use and positive experience with treated wastewater and CWs can be linked with broader environmental issues to re-think and outline future policy considerations by promoting qualitative studies focused on farmers’ perceptions to address knowledge gaps in the face of global risks, including climate change [81]. Incorporating this social data will contribute to improving the efficiency of agricultural and water resources programs to face climate change risks. However, it could also be helpful to discuss new forms of collaboration among stakeholders to face water scarcity and water pollution risks in semi-arid regions and reduce water conflicts. An example is the water exchange agreement between agricultural and urban-tourist water demands taking place in Benidorm (Alicante, Spain), for which during drought or water scarcity situations, reclaimed water from the wastewater treatment plant of Benidorm is supplied to the irrigation community in return for fresh water from the Algar-Guadalest watershed, whose water rights belong to the irrigators [82]. Likewise, water exchange agreements open up another opportunity for ensuring the good ecological status of coastal systems, such as wetlands, especially for highly pressured coastal environments [83].
Supplementary Materials
The following are available online at https://www.mdpi.com/article/10.3390/w13172431/s1. The questionnaire is provided as Table S1.
Author Contributions
Conceptualization, S.R. and A.M.R.-A.; methodology, S.R.; formal analysis, S.R.; investigation, S.R.; data curation, S.R.; writing—original draft preparation, S.R.; writing—review and editing, S.R. and A.M.R.-A.; supervision, A.M.R.-A.; funding acquisition, S.R. All authors have read and agreed to the published version of the manuscript.
Funding
This work was supported by the Spanish Ministry of Economy and Competitiveness (Juan de la Cierva postdoctoral research fellow, grant number FJCI-2015-24346) and by the Interuniversity Institute of Geography, University of Alicante (grant number I-PI-88-18), both awarded to the first author.
Institutional Review Board Statement
The study was conducted according to the guidelines of the Declaration of Helsinki. The Ethics Committee of the University of Alicante reviewed the data collection process without considering the need to establish a specific data protection protocol. Data collection process has been verified to guarantee anonymity and prevent the subsequent identification of the participants.
Informed Consent Statement
Oral and informed consent was obtained from all subjects involved in the study.
Conflicts of Interest
The authors declare no conflict of interest. The funders had no role in the design of the study; in the collection, analyses, or interpretation of data; in the writing of the manuscript, or in the decision to publish the results.
References
- Findlater, K.M.; Satterfield, T.; Kandlikar, M.; Donner, D.D. Six languages for a risky climate: How farmers react to weather and climate change. Clim. Chang. 2018, 148, 451–465. [Google Scholar] [CrossRef]
- Kim, G.U.; Seo, K.H.; Chen, D. Climate change over the Mediterranean and current destruction of marine ecosystem. Sci. Rep. 2019, 9, 18813. [Google Scholar] [CrossRef]
- Estrela, T.; Pérez-Martin, M.A.; Vargas, E. Impacts of climate change on water resources in Spain. Hydrol. Sci. J. 2012, 57, 1154–1167. [Google Scholar] [CrossRef]
- Ff Cardoso-Pereira, S.; Marta-Almeida, M.; Carvalho, A.C. Extreme precipitacion events under climate change in the Iberian Peninsula. Int. J. Climatol. 2020, 40, 1255–1278. [Google Scholar] [CrossRef]
- Mestre, I.; Casado, M.J.; Rodríguez, J. Tendencias observadas y proyecciones de cambio climático sobre España. Capítulo 2. In Impactos, Vulnerabilidades y Adaptación de los Bosques y la Biodiversidad de España Frente al Cambio Climático; Herrero, A., Zavala, M.A., Eds.; Ministerio de Agricultura, Alimentación y Medio Ambiente: Madrid, Spain, 2015; pp. 87–98. [Google Scholar]
- Semenza, J.C. Cascading risks of waterborne diseases from climate change. Nat. Immunol. 2020, 21, 484–487. [Google Scholar] [CrossRef]
- Brouziyne, Y.; Abouabdillah, A.; Hirich, A.; Bouabid, R.; Zaaboul, R.; Bernaabidate, L. Modeling sustainable adaptation strategies toward a climate-smart agriculture in a Mediterranean watershed under projected climate change scenarios. Agric. Syst. 2018, 162, 154–163. [Google Scholar] [CrossRef]
- Liu, J.; Liu, Q.; Yang, H. Assessing water scarcity by simultaneously considering environmental flow requirements, water quantity, and water quality. Ecol. Indic. 2016, 60, 434–441. [Google Scholar] [CrossRef] [Green Version]
- Rodell, M.; Famiglietti, J.S.; Wiese, D.N.; Reager, J.T.; Beaudoing, H.K.; Landerer, F.W.; Lo, M.-H. Emerging trends in global freshwater availability. Nature 2018, 557, 651–659. [Google Scholar] [CrossRef] [PubMed]
- Falkenmark, M. Growing water scarcity in agriculture: Future challenge to global water security. Philos. Trans. R. Soc. A 2013, 371, 20120410. [Google Scholar] [CrossRef] [PubMed] [Green Version]
- Evans, A.E.V.; Mateo-Sagasta, J.; Qadir, M.; Boelee, E.; Ippolito, A. Agricultural water pollution: Key knowledge gaps and research needs. Curr. Opin. Sust. 2019, 36, 20–27. [Google Scholar] [CrossRef]
- Grizzetti, B.; Vigiak, O.; Udias, A.; Aloe, A.; Zanni, M.; Bouraoui, F.; Pistocchi, A.; Dorati, C.; Friedland, R.; de Roo, A.; et al. How EU policies could reduce nutrient pollution in European inland and coastal waters. Glob. Environ. Chang. 2021, 69, 102281. [Google Scholar] [CrossRef] [PubMed]
- Sanchez-Colon, Y.M.; Schaffner, F.C. Identifying nonpoint sources of phosphorus and nitrogen: A case study of pollution that enters a freshwater wetland (Laguna Cartagena, Puerto Rico). J. Water Res. Protect. 2021, 13, 8. [Google Scholar] [CrossRef]
- Mateo-Sagasta, J.; Marjani, S.; Turral, H. More people, more food, worse water? In A Global Review of Water Pollution from Agriculture; FAO: Rome, Italy; IWMI: Gujarat, India, 2018. [Google Scholar]
- Okumah, M.; Chapman, P.J.; Marin-Ortega, J.; Novo, P. Mitigating agricultural diffuse pollution: Uncovering the evidence base of the awareness-behaviour-water quality pathway. Water 2019, 11, 29. [Google Scholar] [CrossRef] [Green Version]
- Boesch, D.F. Barriers and bridges in abating coastal eutrophication. Front. Mar. Sci. 2019, 6, 123. [Google Scholar] [CrossRef] [Green Version]
- De Jalon, S.; Iglesias, A.; Cunningham, R.; Perez-Diaz, J.I. Building resilience to water scarcity in southern Spain: A case study of rice farming in Doñana protected wetlands. Reg. Environ. Chang. 2014, 14, 1229–1242. [Google Scholar] [CrossRef] [Green Version]
- Aleisa, E.; Al-Zubari, W. Wastewater reuse in the countries of the Gulf Cooperation Council (GCC): The lost opportunity. Environ. Monit. Assess. 2017, 189, 553. [Google Scholar] [CrossRef]
- Licciardello, F.; Milani, M.; Consoli, N.; Pappalardo, N.; Barbagallo, S.; Cirelli, G. Wastewater tertiary treatment options to match reuse standards in agriculture. Agric. Water Manag. 2018, 210, 232–242. [Google Scholar] [CrossRef]
- Thebo, A.L.; Drechsel, P.; Lambin, E.F.; Nelson, K.L. A global, spatially-explicit assessment of irrigated croplands influenced by urban wastewater flows. Environ. Res. Lett. 2017, 12, 074008. [Google Scholar] [CrossRef]
- Khalid, S.; Shahid, M.; Tahir, N.; Bibi, I.; Sarwar, T.; Shah, A.H.; Niazi, N.K. A review of environmental contamination and health risk assessment of wastewater use for crop irrigation with a focus on low and high-income countries. Int. J. Environ. Res. Public. Health 2018, 15, 895. [Google Scholar] [CrossRef] [Green Version]
- Aziz, F.; Farissi, M. Reuse of treated wastewater in agriculture: Solving water deficit problems in arid areas. Ann. West Univ. Timisoara Ser. Biol. 2014, 17, 95. [Google Scholar]
- Tortajada, C.; Ong, C.N. Reused water policies for potable use. Int. J. Water Resour. Dev. 2016, 32, 500–502. [Google Scholar] [CrossRef] [Green Version]
- Zhang, Y.; Shen, Y. Wastewater irrigation: Past, present, and future. WIREs Water 2019, 6, e1234. [Google Scholar] [CrossRef]
- Licata, M.; Gennaro, M.C.; Tuttolomondo, T.; Leto, C.; La Bella, S. Research focusing on plant performance in constructed wetlands and agronomic application of treated wastewater—A set of experimental studies in Sicily (Italy). PLoS ONE 2019, 14, e0219445. [Google Scholar] [CrossRef]
- Moazeni, M.; Nikaeen, M.; Hadi, M.; Moghim, S.; Mouhebat, L.; Hatamzadeh, M.; Hassanzadeh, A. Estimation of health risks caused by exposure to enteroviruses from agricultural application of wastewater effluents. Water Res. 2017, 125, 104–113. [Google Scholar] [CrossRef]
- Inyinbor, A.A.; Bello, O.S.; Oluyori, A.P.; Inyinbor, H.E.; Fadiji, A.E. Wastewater conservation and reuse in quality vegetable cultivation: Overview, challenges and future prospects. Food Control. 2019, 98, 489–500. [Google Scholar] [CrossRef] [Green Version]
- Rice, J.; Stotts, R.; Wutich, A.; White, D.; Maupin, J.; Brewis, A. Motivators for treated wastewater acceptance across developed and developing contexts. Water Sanit. Hyg. Dev. 2019, 9, 1–6. [Google Scholar] [CrossRef]
- Ricart, S.; Rico, A.M.; Ribas, A. Risk-yuck factor nexus in reclaimed wastewater for irrigation: Comparing farmers’ attitudes and public perception. Water 2019, 11, 187. [Google Scholar] [CrossRef] [Green Version]
- Nan, X.; Lavrnic, S.; Toscano, A. Potential of constructed wetland treatment systems for agricultural wastewater reuse under the EU framework. J. Environ. Manag. 2020, 275, 111219. [Google Scholar] [CrossRef]
- Garfi, M.; Pedescoll, A.; Becares, E.; Hijosa-Valsero, M.; Sidrach-Cardona, R.; Garcia, J. Effect of climatic conditions, season and wastewater quality on contaminant removal efficiency of two experimental constructed wetlands in different regions of Spain. Sci. Total Environ. 2012, 437, 61–67. [Google Scholar] [CrossRef] [PubMed]
- Resende, J.D.; Nolasco, M.A.; Pacca, S.A. Life cycle assessment and costing of wastewater treatment systems coupled to constructed wetlands. Resour. Conserv. Recycl. 2019, 148, 170–177. [Google Scholar] [CrossRef]
- Almuktar, S.; Abed, S.N.; Scholz, M. Wetlands for wastewater treatment and subsequent recycling of treated effluent: A review. Environ. Sci. Pollut. Res. 2018, 25, 23595–25623. [Google Scholar] [CrossRef] [Green Version]
- Calheiros, C.S.C.; Pereira, S.I.A.; Franco, A.R.; Castro, P.M.L. Spatial-temporal changes in removal of fecal indicators and diversity of bacterial communities in a constructed wetland with ornamental plants. Appl. Sci. 2021, 11, 3875. [Google Scholar] [CrossRef]
- Lamori, J.G.; Xue, J.; Rachmadi, A.T.; Lopez, G.U.; Kitajima, M.; Gherba, C.P.; Pepper, I.L.; Brooks, J.P.; Sherchan, S. Removal of fecal indicator bacteria and antibiotic resistant genes in constructed wetlands. Environ. Sci. Pollut. Res. 2019, 26, 10188–10197. [Google Scholar] [CrossRef]
- Vymazal, J.; Zhao, Y.; Mander, U. Recent research challenges in constructed wetlands for wastewater treatment: A review. Ecol. Eng. 2021, 169, 106318. [Google Scholar] [CrossRef]
- Dias, S.; Mucha, A.P.; Crespo, R.D.; Rodrigues, P.; Almeida, C.M.R. Livestock wastewater treatment in constructed wetlands for agriculture reuse. Int. J. Env. Res. Public Health 2020, 17, 8592. [Google Scholar] [CrossRef]
- Guo, F.; Zhang, J.; Yang, X.; He, Q.; Ao, L.; Chen, Y. Impact of biochar on greenhouse gas emissions from constructed wetlands under various influent chemical oxygen demand to nitrogen ratios. Bioresour. Technol. 2020, 303, 122908. [Google Scholar] [CrossRef]
- Kochi, L.Y.; Freitas, P.L.; Maranho, L.T.; Juneau, P.; Gomes, M.P. Aquatic microphytes in constructed wetlands: A fight against water pollution. Sustainability 2020, 12, 9202. [Google Scholar] [CrossRef]
- Lavrnic, S.; Nan, X.; Blasioli, S.; Braschi, I.; Anconelli, S.; Toscano, A. Performance of a full scale constructed wetland as ecological practice for agricultural drainage water treatment in Northern Italy. Ecol. Eng. 2020, 154, 105927. [Google Scholar] [CrossRef]
- Guo, L.; Lv, T.; He, K.; Wu, S.; Dong, X.; Dong, R. Removal of organic matter, nitrogen and faecal indicators from diluted anaerobically digested slurry using tidal flow constructed wetlands. Environ. Sci. Pollut. Res. 2017, 24, 5486–5496. [Google Scholar] [CrossRef]
- Vymazal, J. Constructed wetlands for wastewater treatment. Water 2010, 2, 530–549. [Google Scholar] [CrossRef] [Green Version]
- Avila, C.; Bayona, J.M.; Martin, I.; Salas, J.J.; Garcia, J. Emerging organic contaminant removal in a full-scale hybrid constructed wetland system for wastewater treatment and reuse. Ecol. Eng. 2015, 80, 108–116. [Google Scholar] [CrossRef] [Green Version]
- Masi, F.; Rizzo, A.; Regelsberger, M. The role of constructed wetlands in a new circular economy, resource oriented, and ecosystem services paradigm. J. Environ. Manag. 2018, 216, 275–284. [Google Scholar] [CrossRef]
- Khanpae, M.; Karami, E.; Maleksaeidi, H.; Keshavarz, M. Farmers’ attitude towards using treated wastewater for irrigation: The question of sustainability. J. Clean. Prod. 2020, 243, 118541. [Google Scholar] [CrossRef]
- Dou, Y.; Liu, M.; Bakker, M.; Yu, X.; Carsjens, G.J.; De Groot, R.; Liu, J. Influence of human interventions on local perceptions of cultural ecosystems services provided by coastal landscapes: Case study of the Huiwen wetland, southern China. Ecosyst. Serv. 2021, 50, 101311. [Google Scholar] [CrossRef]
- Michetti, M.; Raggi, M.; Guerra, E.; Viaggi, D. Interpreting farmers’ perceptions of risks and benefits concerning wastewater reuse for irrigation: A case study in Emilia-Romagna (Italy). Water 2019, 11, 108. [Google Scholar] [CrossRef] [Green Version]
- Saliba, R.; Callieris, R.; D’Agostino, D.; Roma, R.; Scardigno, A. Stakeholders’ attitude towards the reuse of treated wastewater for irrigation in Mediterranean agriculture. Agric. Water Manag. 2018, 204, 60–68. [Google Scholar] [CrossRef]
- Lahlou, F.-Z.; Mackey, H.R.; Al-Ansari, T. Wastewater reuse for livestock feed irrigation as a sustainable practice: A socio-environmental-economic review. J. Clean. Prod. 2021, 294, 126331. [Google Scholar] [CrossRef]
- Deh-Haghi, Z.; Bagheri, A.; Fotourehchi, Z.; Damalas, C.A. Farmers’ acceptance and willingness to pay for using treated wastewater in crop irrigation: A survey in western Iran. Agric. Water Manag. 2020, 239, 106262. [Google Scholar] [CrossRef]
- Garin, P.; Montginoul, M.; Noury, B. Waste water reuse in France—Social perception of an unfamiliar practice. Water Supply 2021, 21, 1913–1926. [Google Scholar] [CrossRef]
- Gardezi, M.; Arbuckle, J.G. Techno-optimism and farmers’ attitudes toward climate change adaptation. Environ. Behav. 2020, 52, 82–105. [Google Scholar] [CrossRef] [Green Version]
- Ado, A.M.; Leshan, J.; Savadogo, P.; Bo, L.; Shah, A.A. Farmers’ awareness and perception of climate change impacts: Case study of Aguie district in Niger. Environ. Dev. Sustain. 2019, 21, 2963–2977. [Google Scholar] [CrossRef]
- Jha, C.K.; Gupta, V. Farmer’s perception and factors determining the adaptation decisions to cope with climate change: An evidence from rural India. Environ. Sustain. Indic. 2021, 10, 100112. [Google Scholar] [CrossRef]
- Jucar River Basin Management Plan 2022–2027. Draft Proposal in Public Consultancy. Available online: https://www.chj.es/es-es/medioambiente/planificacionhidrologica/Paginas/PHC-2022-2027-Plan-Hidrologico-cuenca.aspx (accessed on 16 July 2021). (In Spanish).
- Ricart, S.; Rico-Amorós, A.M. Water for food, water for birds: How to manage conflicting rural-natural interfaces? Deepening on the socio-ecological system of El Hondo Natural Park (Alicante, Spain). J. Rural. Stud. 2021, 86, 24–35. [Google Scholar] [CrossRef]
- Generalitat Valenciana. Memoria de Gestión 2019 Parque Natural El Hondo. Available online: https://parquesnaturales.gva.es/documents/80283153/172903970/Memoria+de+Gesti%C3%B3n+2019/0cdb44f9-46ee-4fb2-9ac1-5fc9fc8b3fd3 (accessed on 26 August 2021). (In Spanish).
- Generalitat Valenciana. Decreto 33/2020, de 6 de Marzo, del Consell, de Ampliacion de la Delimitación de la Zona Especial de Protección Para Las Aves (ZEPA) El Fondo d’Elx-Crevillent. DOCV 8734. Available online: https://noticias.juridicas.com/base_datos/CCAA/662022-d-33-2020-de-6-mar-ca-valenciana-ampliacion-de-la-delimitacion-de-la-zona.html (accessed on 26 August 2021). (In Spanish).
- Ricart, S.; Villar-Navascués, R.; Gil-Guirado, S.; Rico-Amorós, A.M.; Arahuetes, A. How to close the gap of desalinated seawater for agricultural irrigation? Confronting attitudes between managers and farmers in Alicante and Murcia (Spain). Water 2020, 12, 11–32. [Google Scholar] [CrossRef] [Green Version]
- Ricart, S.; Rico-Amorós, A.M. Gobernanza y ecología política en la gestión del regadío multifuncional. Aplicación al corredor agroecológico El Hondo-Los Carrizales (Alicante). Cuad. Geogr. 2019, 103, 25–46. [Google Scholar] [CrossRef] [Green Version]
- Tuel, A.; Eltahir, A.B. Why is the Mediterranean a climate change hot spot? J. Clim. 2020, 33, 5829–5843. [Google Scholar] [CrossRef]
- Michaelides, S.; Karacostas, T.; Sanchez, J.L.; Retalis, A.; Pytharoulis, I.; Homar, V.; Romero, R.; Zanis, P.; Giannakopoulos, C.; Buhl, J.; et al. Reviews and perspectives of high impact atmospheric processes in the Mediterranean. Atmos. Res. 2018, 208, 4–44. [Google Scholar] [CrossRef]
- Abd-Elmabod, S.K.; Muñoz-Rojas, M.; Jordan, A.; Anaya-Romero, M.; Phillips, J.D.; Jones, L.; Zhang, Z.; Pereira, P.; Fleskens, L.; van der Ploeg, M.; et al. Climate change impacts on agricultural suitability and yield reduction in a Mediterranean region. Geoderma 2020, 374, 114453. [Google Scholar] [CrossRef]
- Baiardi, D.; Morana, C. Climate change awareness: Empirical evidence for the European Union. Energ. Econ. 2021, 96, 105163. [Google Scholar] [CrossRef]
- Adshead, D.; Thacker, S.; Fuldauer, L.I.; Hall, J.W. Delivering on the Sustainable Development Goals through long-term infrastructure planning. Glob. Environ. Chang. 2019, 59, 101975. [Google Scholar] [CrossRef]
- Ricart, S.; Villar-Navascués, R.; Hernández-Hernández, M.; Rico-Amorós, A.M.; Olcina-Cantos, J.; Moltó-Mantero, E. Extending natural limits to address water scarcity? The role of non-conventional water fluxes in climate change adaptation capacity: A review. Sustainability 2021, 13, 2473. [Google Scholar] [CrossRef]
- Ricart, S. Water governance and social learning: Approaches, tools, and challenges. In Clean Water and Sanitation. Encyclopedia of the UN Sustainable Development Goals; Leal Filho, W., Azul, A.M., Brandli, L., Lange Salvia, A., Wall, T., Eds.; Springer: Cham, Switzerland, 2020. [Google Scholar] [CrossRef]
- Arbuckle, J.G.; Prokopy, L.S.; Haigh, T.; Hobbs, J.; Knoot, T.; Knutson, C.; Loy, A.; Mase, A.S.; McGuire, J.; Morton, L.W.; et al. Climate change beliefs, concerns, and attitudes toward adaptation and mitigation among farmers in the Midwestern United States. Clim. Chang. 2013, 117, 943–950. [Google Scholar] [CrossRef] [Green Version]
- Asfaw, A.; Simane, B.; Bantider, A.; Hassen, A. Determinants in the adoption of climate change adaptation strategies: Evidence from rainfed-dependent smallholder in north-central Ethiopia (Woleka sub-basin). Environ. Dev. Sustain. 2019, 21, 2535–2565. [Google Scholar] [CrossRef]
- Amir, S.; Saqib, Z.; Khan, M.I.; Ali, A.; Khan, M.A.; Bokhari, S.A.; Haq, A. Determinants of farmers’ adaptation to climate change in rain-fed agriculture of Pakistan. Arab. J. Geosci. 2020, 13, 1025. [Google Scholar] [CrossRef]
- Fadina, A.M.R.; Barjolle, D. Farmers’ adaptation strategies to climate change and their implications in the Zou Department of South Benin. Environments 2018, 5, 15. [Google Scholar] [CrossRef] [Green Version]
- Adzawla, W.; Kudadze, S.; Mohammed, A.R.; Ibrahim, I.I. Climate perceptions, farmers’ willingness-to-insure farms and resilience to climate change in Northern region, Ghana. Environ. Dev. 2019, 32, 100466. [Google Scholar] [CrossRef]
- Akhtar, R.; Masud, M.M.; Afroz, R. Perception of climate change and the adaptation strategies and capacities of the rice farmers in Kedah, Malaysia. Environ. Urban 2019, 10, 99–115. [Google Scholar] [CrossRef]
- Afriyie-Kraft, L.; Zabel, A.; Damnyag, L. Adaptation strategies of Ghanaian cocoa farmers under a changing climate. For. Policy Econ. 2020, 113, 102115. [Google Scholar] [CrossRef]
- Abid, M.; Schneider, U.A.; Scheffran, J. Adaptation to climate change and its impacts on food productivity and crop income: Perspectives of farmers in rural Pakistan. J. Rural Stud. 2016, 47, 254–266. [Google Scholar] [CrossRef]
- Zhang, C.; Jin, J.; Kuang, F.; Ning, J.; Wan, X.; Guan, T. Farmers’ perception of climate change and adaptation behavior in Wushen Banner, China. Environ. Sci. Poll. Res. 2020, 27, 26484–26494. [Google Scholar] [CrossRef]
- Iqbal, M.A.; Abbas, A.; Naqvi, S.A.A.; Rizwan, M.; Samie, A.; Ahmed, U.I. Drivers of farm households’ perceived risk sources and factors affecting uptake of mitigation strategies in Punjab Pakistan: Implications for sustainable agriculture. Sustainability 2020, 12, 9895. [Google Scholar] [CrossRef]
- Marie, M.; Yirga, F.; Haile, M.; Tquabo, F. Farmers’ choices and factors affecting adoption of climate change adaptation strategies: Evidence from northwestern Ethiopia. Heliyon 2020, 6, e03867. [Google Scholar] [CrossRef]
- Agyei, F.K. Sustainability of climate change adaptation strategies: Experiences from Eastern Ghana. Environ. Manag. Sustain. Dev. 2016, 5, 84. [Google Scholar] [CrossRef]
- Greenland-Smith, S.; Brazner, J.; Sherren, K. Farmer perceptions of wetlands and waterbodies: Using social metrics as an alternative to ecosystem service valuation. Ecol. Econ. 2016, 126, 58–69. [Google Scholar] [CrossRef]
- Oza, T.M.; Lane, R.; Adame, M.F.; Reef, R. Coastal wetland management in the Great Barrier Reef: Farmer perceptions. Geogr. Res. 2021. Early view. [Google Scholar] [CrossRef]
- Ricart, S.; Arahuetes, A.; Villar, R.; Rico-Amorós, A.M.; Berenguer, J. More water exchange, less water scarcity? Driving factors from conventional and reclaimed water swap between agricultural and urban-tourism activities in Alicante, Spain. Urban Water J. 2020, 16, 677–686. [Google Scholar] [CrossRef]
- Yang, J.; Wang, Z.-H. Planning for a sustainable desert city: The potential water buffering capacity of urban green infrastructure. Landsc. Urban Plan. 2017, 167, 339–347. [Google Scholar] [CrossRef]
Figure 1.
Location of El Hondo and Santa Pola CWs and the area irrigated by Riegos de Levante and Carrizales irrigation communities. Source: adapted from [56].
Figure 1.
Location of El Hondo and Santa Pola CWs and the area irrigated by Riegos de Levante and Carrizales irrigation communities. Source: adapted from [56].

Figure 2.
Main adaptation measures promoted by farmers. Note: Options at 95% CI.


Table 1.
Main characteristics of both irrigation communities.
| Irrigated Area (ha) | Irrigators (n) | Farm Size (ha, Mean) | Main Crops | Irrigation System | Water Sources | |
|---|---|---|---|---|---|---|
| Riegos de Levante | ≈24,000 | ≈22,000/800 * | ≥1 | Fruits, vegetables | Drip (45%) Flood (55%) | Tajo-Segura water transfer Segura River water rights |
| Carrizales | ≈1300 | ≈400 | ≈1 | Fruits, vegetables, cereals | Flood (99%) Drip (1%) | Segura River Surplus waters from El Hondo and Santa Pola |
Note: * Irrigators from Elche and Crevillente irrigation communities are about 800.
Table 2.
Descriptive statistics of farmers’ sociodemographic profile.
| Variable | Definition | Mean | STD |
|---|---|---|---|
| Age | If age of the farmer is between: less than 40 years 1 (1.7%), 41–50 years 2 (18.6%), 51–60 years 3 (25.4%), more than 60 years 4 (27.7%), retired 5 (26.6%) | 3.59 | 1.12 |
| Education | If the farmer is: illiterate 1 (9.6%), primary school graduate 2 (29.9%), secondary-high school graduate 3 (17.5%), professional studies 4 (30.5%), higher studies 5 (12.4%) | 3.06 | 1.22 |
| Farming experience | If the farmers experience is: less than 5 years 1 (2.8%), 5–15 years 2 (19.2%), 16–29 years 3 (23.7%), 30–45 years 4 (26.6%), more than 45 years 5 (27.7%) | 3.57 | 1.17 |
| Succession | If it is expected that someone (family member or outsider) will take care of the activity once the farmer was retired 1 (32.2%), if not 0 (42.4%) and unknown (25.4%) | 0.83 | 0.81 |
| Union farm membership | If the farmer is member of a union farm 1 (50.8%), if not 0 (49.2%) | 0.51 | 0.50 |
| Beneficiary of agricultural subsidy (e.g., CAP) | If the farmer receives any agricultural subsidy 1 (29.9%), if not 0 (70.1%) | 0.30 | 0.46 |
| Farm size | If the farmer’s activity is developed in: Less than 1 ha 1 (16.9%), 1–5 ha 2 (45.8%), 6–10 ha 3 (23.2%), 11–20 ha 4 (6.2%), more than 20 ha 5 (7.9%) | 2.42 | 1.09 |
| Main crop | If the farmer mainly produces: citrus 1 (27.7%), medlar 2 (1.1%), nuts-almonds 3 (3.4%), vegetables 4 (19.2%), oilseed-olives 5 (2.8%), ornamentals 6 (3.4%), pomegranate 7 (11.9%), melon 8 (9.6%), mixed 9 (20.9%) | 4.99 | 3.10 |
| Irrigation method | If the farmer applies: surface irrigation 1 (63.3%), drip irrigation 2 (20.9%), sprinkler irrigation 3 (0%), mixed methods 4 (15.8%) | 1.68 | 1.08 |
| Annual water consumption | If the farmer consumes (year): less than 1000 m3 1 (15.3%), 1001–2000 m3 2 (25.4%), 2001–5000 m3 3 (27.7%), 5001–10,000 m3 4 (17.5%), more than 10,000 m3 5 (9.6%), no data 0 (4.5%) | 2.94 | 1.36 |
| Treated wastewater use | If the farmer uses treated wastewater 1 (51.4%), if not 0 (48.6%) | 0.51 | 0.50 |
| Treated wastewater quality standards | If the farmer considers that treated wastewater quality standards are good 1 (31.1%), bad 0 (24.3%), or unknown 2 (44.6%) | 1.20 | 0.81 |
Note: STD = standard deviation. ‘Retired’ is applied to those who carry out their agricultural activity in a non-productive way.
Table 3.
Descriptive statistics of climate change awareness.
| Variable | Mean | STD |
|---|---|---|
| Climate change is occurring | 1.19 | 0.43 |
| Climate change is anthropogenic | 1.31 | 0.52 |
| Climate change poses agriculture at risk | 1.20 | 0.49 |
| Irrigated crops are exposed to climate change | 1.11 | 0.37 |
| Awareness of warming | 1.02 | 0.25 |
| Awareness of water shortage | 1.07 | 0.33 |
| Awareness of extreme events (drought, floods, etc.) | 1.09 | 0.81 |
Note: Answer options were Disagree/No (0), Agree/Yes (1) and Unknown (2).
Table 4.
Sociodemographic drivers of climate change awareness.
| Variable | OCC | ANT | RISK | IRR | WAR | WAT | EXT |
|---|---|---|---|---|---|---|---|
| Age | 0.230 ** | 0.100 | 0.112 | 0.086 | −0.219 ** | −0.047 | −0.096 |
| Education | −0.216 ** | −0.048 | −0.040 | −0.180 * | 0.108 | 0.074 | 0.086 |
| Farming experience | 0.126 | 0.067 | 0.005 | 0.074 | −0.170 * | −0.057 | −0.115 |
| Succession intention | −0.055 | −0.011 | −0.141 | −0.088 | 0.099 | 0.022 | −0.020 |
| Union farm membership | −0.152 * | −0.075 | −0.122 | −0.098 | −0.160 * | −0.141 | −0.179 * |
| Subsidy beneficiary | −0.111 | −0.075 | −0.120 | −0.101 | −0.094 | −0.210 ** | 0.003 |
| Farm size | −0.205 ** | −0.079 | −0.140 | −0.035 | −0.131 | −0.143 | −0.018 |
| Main crop | −0.160 * | −0.122 | −0.007 | −0.044 | −0.139 | −0.177 * | −0.063 |
| Irrigation method | 0.030 | 0.092 | 0.057 | 0.105 | −0.001 | 0.060 | −0.025 |
| Annual water consumption | −0.001 | −0.008 | −0.119 | 0.070 | −0.087 | −0.106 | −0.037 |
Note: Pearson and ANOVA tests. Legend: OCC: climate change is occurring, ANT: climate change is anthropogenic, RISK: irrigated crops are exposed to climate change, WAR: awareness of warming, WAT: awareness of water shortage, EXT: awareness of extreme events. Negative value indicates negative correlation between two variables in which one variable increases as the other decreases, and vice versa. * Significance at the 1% test level (p < 0.01) and ** Significance at the 5% level (p < 0.05).
Table 5.
Descriptive statistics of climate change perceived impacts.
| Variable | Mean | STD |
|---|---|---|
| Change in timing, intensity, or frequency of rainfall events | 1.02 | 0.39 |
| Warmer temperatures and heatwaves | 1.00 | 0.26 |
| Increased frequency or intensity of droughts | 1.01 | 0.24 |
| Less reliable water supply—water scarcity | 1.03 | 0.33 |
| Change in rate of land erosion | 1.25 | 0.74 |
| Decreased plant growth | 0.97 | 0.68 |
| New diseases or pests | 1.14 | 0.58 |
| Increase in weeds or invasive species | 1.13 | 0.80 |
Note: Answer options were No (0), Yes (1), and Unknown (2).
Table 6.
Sociodemographic drivers of climate change perceived impacts.
| Variable | RAIN | WARM | DROU | WAT | EROS | PLAN | DISE | WEED |
|---|---|---|---|---|---|---|---|---|
| Age | −0.036 | −0.136 | 0.018 | −0.053 | 0.072 | 0.007 | 0.104 | 0.003 |
| Education | 0.033 | 0.160 * | 0.154 * | 0.064 | −0.111 | −0.046 | −0.060 | 0.038 |
| Farming experience | −0.009 | −0.187 * | −0.064 | −0.079 | −0.018 | −0.066 | −0.090 | −0.098 |
| Succession intention | 0.009 | 0.054 | 0.010 | 0.126 | −0.070 | −0.009 | 0.001 | 0.034 |
| Union farm membership | 0.043 | −0.130 | −0.144 | −0.036 | −0.029 | −0.075 | −0.043 | 0.033 |
| Subsidy beneficiary | −0.028 | −0.047 | −0.031 | −0.140 | −0.091 | 0.027 | −0.047 | 0.064 |
| Farm size | −0.030 | −0.160 * | −0.062 | −0.133 | −0.112 | −0.191 * | −0.056 | −0.155 * |
| Main crop | −0.009 | −0.182 * | −0.054 | −0.256 ** | −0.044 | −0.108 | 0.032 | 0.044 |
| Irrigation method | 0.040 | 0.040 | 0.036 | 0.045 | 0.044 | −0.051 | −0.022 | −0.031 |
| Annual water consumption | −0.159 * | −0.096 | −0.016 | −0.096 | −0.166 * | −0.193 ** | 0.003 | −0.198 ** |
Note: Pearson and ANOVA tests. Legend: RAIN: change in timing, intensity, or frequency of rainfall events, WARM: warmer temperatures and heatwaves, DROU: increased frequency or intensity of droughts, WAT: less reliable water supply (water scarcity), EROS: change in rate of land erosion, PLAN: decreased plan growth, DISE: new diseases or pests, WEED: increase in weeds or invasive species. Negative value indicates negative correlation between two variables in which one variable increases as the other decreases, and vice versa. * Significance at the 1% test level (p < 0.01) and ** Significance at the 5% level (p < 0.05).
Table 7.
Descriptive statistics of climate change adaptation measures.
| Variable | Mean | STD |
|---|---|---|
| Soil conservation techniques | 0.76 | 1.21 |
| Use of treated wastewater | 0.68 | 0.47 |
| Invest in water technologies | 0.51 | 0.73 |
| Geoengineering | 0.19 | 0.39 |
| Agroforestry practices | 0.58 | 1.45 |
| Application of agrochemicals | 0.31 | 0.46 |
| Agricultural insurance | 0.46 | 0.50 |
Note: Answer options were No (0), Yes (1), and Unknown (2).
Table 8.
Sociodemographic drivers of climate change adaptation measures.
| Variable | SOIL | WASTE | TECH | ENGI | AGROF | CHEM | INS |
|---|---|---|---|---|---|---|---|
| Age | −0.196 ** | −0.066 | −0.089 | −0.031 | −0.098 | 0.139 | −0.103 |
| Education | 0.110 | 0.154 * | −0.004 | −0.144 | −0.008 | −0.155 * | 0.064 |
| Farming experience | −0.006 | −0.053 | 0.064 | 0.064 | −0.061 | 0.195 ** | −0.027 |
| Succession intention | 0.033 | 0.128 | 0.031 | −0.007 | 0.045 | 0.050 | 0.139 |
| Union farm membership | 0.139 | −0.061 | 0.128 | −0.023 | −0.054 | −0.048 | 0.211 ** |
| Subsidy beneficiary | 0.091 | −0.112 | 0.068 | 0.004 | 0.132 | 0.041 | 0.159 * |
| Farm size | 0.130 | −0.003 | 0.163 * | 0.080 | 0.140 | 0.131 | 0.336 ** |
| Main crop | 0.078 | −0.068 | −0.066 | −0.069 | −0.086 | −0.007 | 0.024 |
| Irrigation method | 0.205 ** | −0.019 | 0.219 ** | −0.061 | −0.046 | −0.007 | 0.094 |
| Annual water consumption | 0.009 | −0.019 | 0.178 * | 0.138 | 0.080 | 0.182 * | 0.257 ** |
Note: Pearson and ANOVA tests. Legend: SOIL: soil conservation techniques, WASTE: use of treated wastewater, TECH: invest in water technologies, ENGI: geoengineering, AGROF: agroforestry practices, CHEM: application of agrochemicals, INS: agricultural insurance. Negative value indicates negative correlation between two variables in which one variable increases as the other decreases, and vice versa. * Significance at the 1% test level (p < 0.01) and ** Significance at the 5% level (p < 0.05).
Table 9.
Descriptive statistics of climate change adaptation barriers.
| Variable | Mean | STD |
|---|---|---|
| Climate change skepticism | 0.79 | 0.86 |
| Low risk perception | 1.02 | 0.72 |
| Shock towards change | 1.17 | 0.68 |
| Lack of information and data | 1.24 | 0.64 |
| High cost of investment and changing market | 1.43 | 0.57 |
| Lack of government support | 1.21 | 0.55 |
| Regulations and rules are too complicated | 1.58 | 0.60 |
| Lack of cooperation between stakeholders | 1.25 | 0.55 |
Note: Answer options were No (0), Yes (1), and Unknown (2).
Table 10.
Regression model between wastewater use plus quality standards and farmers’ sociodemographic characteristics.
Table 10.
Regression model between wastewater use plus quality standards and farmers’ sociodemographic characteristics.
| Variable | AGE | EDU | EXP | SUC | MEM | SUB | SIZE | CROP | IRR | WAT |
|---|---|---|---|---|---|---|---|---|---|---|
| Treated wastewater use | 0.015 | 0.022 | 0.078 | 0.146 | 0.084 | 0.093 | 0.140 | 0.247 ** | 0.008 | 0.076 |
| Treated wastewater quality standards | 0.018 | −0.053 | −0.015 | −0.147 | −0.060 | 0.003 | −0.124 | −0195 ** | 0.042 | −0.015 |
Note: Student’s t-value. Legend: AGE: age, EDU: education, EXP: farming experience, SUC: succession intention, MEM: union farm membership, SUB: subsidy beneficiary, SIZE: farm size, CROP: main crop, IRR: irrigation method, WA: annual water consumption. Negative value indicates negative correlation between two variables in which one variable increases as the other decreases, and vice versa. ** Significance at the 5% test level (p < 0.05).
Table 11.
Regression model between CWs investment and farmers’ sociodemographic characteristics.
| Variable | AGE | EDU | EXP | SUC | MEM | SUB | SIZE | CROP | IRR | WAT |
|---|---|---|---|---|---|---|---|---|---|---|
| CWs (invest in water technologies) | −0.089 | −0.004 | 0.064 | 0.031 | 0.128 | 0.068 | 0.163 * | −0.066 | 0.219 * | 0.178 * |
Note: Student’s t-value. Legend: AGE: age, EDU: education, EXP: farming experience, SUC: succession intention, MEM: union farm membership, SUB: subsidy beneficiary, SIZE: farm size, CROP: main crop, IRR: irrigation method, WA: annual water consumption. Negative value indicates negative correlation between two variables in which one variable increases as the other decreases, and vice versa. * Significance at the 1% test level (p < 0.01).
Publisher’s Note: MDPI stays neutral with regard to jurisdictional claims in published maps and institutional affiliations. |
© 2021 by the authors. Licensee MDPI, Basel, Switzerland. This article is an open access article distributed under the terms and conditions of the Creative Commons Attribution (CC BY) license (https://creativecommons.org/licenses/by/4.0/).
Share and Cite
MDPI and ACS Style
Ricart, S.; Rico-Amorós, A.M. Constructed Wetlands to Face Water Scarcity and Water Pollution Risks: Learning from Farmers’ Perception in Alicante, Spain. Water 2021, 13, 2431. https://doi.org/10.3390/w13172431
AMA Style
Ricart S, Rico-Amorós AM. Constructed Wetlands to Face Water Scarcity and Water Pollution Risks: Learning from Farmers’ Perception in Alicante, Spain. Water. 2021; 13(17):2431. https://doi.org/10.3390/w13172431
Chicago/Turabian StyleRicart, Sandra, and Antonio M. Rico-Amorós. 2021. "Constructed Wetlands to Face Water Scarcity and Water Pollution Risks: Learning from Farmers’ Perception in Alicante, Spain" Water 13, no. 17: 2431. https://doi.org/10.3390/w13172431
Note that from the first issue of 2016, this journal uses article numbers instead of page numbers. See further details here.