1. Introduction
Dissolved oxygen (DO) involved in chemical and biological processes is one of the most important parameters of aquatic ecosystems [
1]. A decrease in the oxygen content worsens the quality of water and the habitat of aquatic organisms. The development of hypoxia and anoxia [
2] can lead to fatal consequences, such as mass death of fish [
3]. Moreover, under anaerobic conditions, the release and accumulation of greenhouse gases can occur [
4]. These factors determine the ecological significance of studying the oxygen regime of lakes.
During the open water period, oxygen conditions in lakes are largely formed through the gas exchange with the atmosphere and gas redistribution over the water column due to wind-wave mixing and convective movements. In the presence of photosynthesis, oxygen is released and organic matter is formed, which then settles to the bottom and creates the prerequisites for oxygen deficiency in the following winter season [
5,
6].
Continuous ice cover almost completely suppresses the exchange of heat, gas, and momentum between the water mass and the atmosphere. Snow on ice sharply reduces the penetration of photosynthetic radiation into the water column. Inhibited by low illumination, photosynthesis cannot be a significant source of oxygen as long as the snow layer on the ice exceeds 10–20 cm [
7,
8,
9,
10]. After the snow has melted and under-ice illumination has increased, a significant increase of oxygen due to photosynthesis of phytoplankton can be expected [
11,
12]. River runoff, underground springs, and melt water can be additional sources of oxygen in ice-covered lakes, but they can play a significant role in the oxygen budget only in small shallow lakes [
13,
14]. Thus, in the absence of significant sources of oxygen, its content decreases during the winter, mainly due to bacterial decomposition of organic matter, respiration of organisms, and chemical reactions near the surface of bottom sediments [
5,
6,
13,
14,
15,
16,
17,
18,
19].
Analysis of the data of long-term oxygen measurements shows that the degree of winter oxygen depletion differs in the same lake in different years (see, for example, [
11,
13,
14,
16,
20,
21,
22]). What factors influence the rate of oxygen consumption and production in an ice-covered lake in different years? And how does modern climate variability affect these factors?
First of all, the duration of the ice-covered period determines the duration of winter hypoxia and anoxia; hence, the dates of ice-on and ice-off should be taken into account. These dates on a particular lake being largely determined by meteorological conditions, so, air temperature, precipitation, wind speed, and solar radiation can be considered among the main factors influencing ice phenology [
23,
24,
25].
The rate of bacterial decomposition of organic matter, and, consequently, the rate of oxygen consumption, depends on the water temperature [
15], which can therefore be considered as a predictor of DO conditions. The temperature of water in lakes in winter, in turn, depends on the date of ice-on and heat transfer from bottom sediments. A prolonged pre-ice period contributes to the loss of heat accumulated by the water mass and bottom sediments in summer, and the winter water temperature in this case is lower. On the contrary, early formation of ice ensures the preservation of the heat accumulated in summer, and the water temperature during the winter season is higher [
26].
The thickness and structure of the snow-ice cover can be considered as a factor that can have a limiting effect on the photosynthesis of phytoplankton and, hence, on the release of oxygen. Snow not only effectively absorbs solar radiation, but can also turn into white ice or slush over black ice surface [
7,
8,
27]. White ice and slush also effectively absorb solar radiation [
7,
8]. Therefore, climatic changes thickness of snow, white ice and slush can cause long-term changes in phytoplankton environmental conditions and oxygen production.
Light, temperature, and hydrodynamic conditions favorable for the growth of phytoplankton and release of oxygen are usually observed in boreal lakes in late winter, during radiatively driven convection [
28]. Convective currents keep non-mobile phytoplankton within the photic zone and transport nutrients from the bottom layers to the surface [
9,
10,
21,
29,
30]. Therefore, the duration of radiatively driven convection can be considered as a factor influencing oxygen increase at the end of the ice-covered period.
Thus, oxygen conditions in ice-covered lakes are determined by many factors, which, in turn, may be influenced by climate change: weather conditions, dates of ice-on and ice-off, duration of the ice season and under-ice convection, under-ice solar radiation, water temperature, thickness and structure of the snow-ice cover.
In this study, we analyzed the variability of DO content in a small boreal Lake Vendyurskoe (northwest Russia, southern Karelia) in winters 2007–2020. We investigated the effect of long-term changes of climatic parameters (air temperature and precipitation) in 1994–2020 on the lake’s thermal, light, and ice regimes. The purpose of this work is to investigate the influence of various factors on the rate of oxygen consumption and production in an ice-covered lake under modern climatic conditions.
2. Materials and Methods
2.1. Study Site
Lake Vendyurskoe is located in the northwest of Russia, southern Karelia (62°10′ N, 33°10′ E) (
Figure 1a). The limnological description of Lake Vendyurskoe and characteristics of the climate in the study region are given in [
31,
32]. This is a typical lake of glacial origin; such lakes are widespread in Fennoscandia. The lake surface area is 10.4 km
2, length—7.0 km, width—1.5–2.0 km, water volume—5.5 × 10
7 m
3, mean and maximum depths are 5.3 m and 13.4 m. Despite its relatively large average and maximum depths, Lake Vendyurskoe is a typical polymictic lake. During the open water period, it can be fully mixed up to 5–6 times [
33]. There are several small inlet streams and one outlet, but their discharge is low. Precipitation and evaporation have a decisive influence on changes in the volume of the lake water mass during a year. Thermal stratification in summer and in winter leads to oxygen deficiency in the bottom layers of the central basin of the lake [
5,
6,
33]. Ice-on occurs from early November to mid-December, and ice-off occurs from late April to the third week of May [
34].
2.2. Climate Data
To analyze the climate variability in the study region in 1994–2020, we used data from the Petrozavodsk weather station (WMO station ID: 22820, coordinates 61°49′ N and 34°16′ E), which is located 75 km to the south-east from Lake Vendyurskoe. Data on air temperature and precipitations were obtained from the “Reliable Forecast” website [
35] and the website of the All-Russian Scientific Research Institute of Hydrometeorological Information—World Data Center (VNIIGMI-WDC) [
36]. Average monthly air temperature at the Petrozavodsk station for the baseline period of 1961–1990 was obtained from the website of the North Eurasian Climate Center [
37].
To characterize the variability of the regional climate of southern Karelia in 1994–2020, we used two parameters—air temperature and precipitation. Since the ice-covered period on Lake Vendyurskoe lasted from November to May, we analyzed the variability of the selected climatic parameters for the months from November of the previous year to May of the next year. We calculated the deviation of the air temperature of November, December, January, February, March, April, and May relative to the corresponding months of the baseline period 1961–1990 (
Table S1) and also analyzed the air temperature trends for each of these months in order to identify the climatic reasons for changes in the dates of ice-on and ice-off (
Table S2).
To describe how severe or mild each winter season was, we calculated the average temperature for the period from November of the previous year to April of the next year, and then compared it to the baseline values (the rightmost column in
Table S1). In this case, we did not take into account the temperature in May, since freezing temperatures in this month are extremely rare and cannot have a significant effect on the severity or mildness of the winter.
To track how the conditions of ice formation and ice melting changed in the winter seasons of 1994–2020 and to identify the climatic triggers for changes in the thickness and structure of the snow-ice cover, we calculated the number of days with an average positive daily air temperature (Days_TAIR > 0) and the number of days with precipitation (Days_P) in November–April for each winter season. If precipitation happened on a day with a positive average daily air temperature, then we assumed the precipitation was liquid or mixed; then the number of such days (Days_PLM) was calculated.
2.3. Under Ice Radiation
Measurements of solar radiation were carried out on different dates in spring months in 1995–2000, 2002–2018, and 2020; the duration of radiation measurements differed markedly from year to year—from one to 14 days, with measurement interval from one to five minutes. Dates of the first and last days of measurements in different years are shown in
Table S3. The downwelling E
d(0) and upwelling E
u(0) planar irradiances at the ice surface and downwelling irradiances E
d(z) under the ice were measured with Star-shaped pyranometers (Theodor Friderich & Co, Meteorologische Gerate und Systeme, Germany, resolution 0.2 W/m
2); two pyranometers were mounted on a tripod at one meter above ice surface, and the third one was fixed on a foam plate under the ice surface (
Figure 1b). In this study, we used only data from the third pyranometer. Data from the first and second pyranometers were analyzed in [
32]. For each day of radiation measurements, the maximum and average values of E
d(z) were calculated for the period from 8 a.m. to 8 p.m.
Table S3 shows the values of E
d(z) for the first and last days of radiation measurements for each year.
2.4. Ice Regime of Lake Vendyurskoe. Measurements and Modelling
Measurements of snow-ice cover thickness were carried out on the first and last days of radiation measurements in spring months of 1995–2000, 2002–2018 and 2020 at 22 stations (
Figure 1a), then the average and standard deviation of snow, total ice, white and black ice, and slush were calculated over all stations (
Table S3). We then calculated the snow-ice cover thickness for mid-April (H
APRIL_MEAS) for each year of measurements using linear interpolation.
Dates of ice-on and ice-off were determined using TR-chain data (
Table 1; see procedure in
Section 2.5).
Since field data have gaps for the dates of ice-on and ice-off in some years (
Table 1), we also investigate the ice regime of Lake Vendyurskoe using the one-dimensional thermohydrodynamic model FLake [
38,
39]. This model was developed jointly by the German Meteorological Service, the Institute of Limnology of the Russian Academy of Sciences, the Leibnitz-Institute of Water Ecology and Inland Fisheries (Germany), and the Northern Water Problems Institute of the Russian Academy of Sciences (Russia). The FLake model is used to solve a wide range of limnological problems, serves as a basic tool for developing models of the functioning of aquatic ecosystems and the formation of water quality. The standard meteorological parameters, namely short-wave solar radiation, air temperature, wind speed, absolute humidity, cloudiness, atmospheric pressure and precipitation, are used to reproduce the thermal regime and mixing conditions in a lake. In our case, meteorological data from the ERA 5 reanalysis [
40] were used to study the ice regime of Lake Vendyurskoe for the period from 1994 to 2019.
According to FLake model calculations, the dates of ice-on and ice-off on Lake Vendyurskoe in 1994–2019 were determined, and the ice thickness was calculated for each day of each ice season. Then, we calculated the average ice thickness (HICE_MODEL) for each winter season of 1995–2019.
2.5. Water Temperature and Dissolved Oxygen Measurements
Measurements of water temperature (1995–2020) and DO content (2007–2020) were carried out in the central deep-water basin of Lake Vendyurskoe, where the temperature chain was installed (
Figure 1b). The TR-1 temperature sensors (Aanderaa Instruments, Norway, accuracy 0.15 °C) were used in 1995–2006, and RBR temperature and DO loggers (RBR, Canada, temperature sensor accuracy 0.002 °C, oxygen range 0–150%, accuracy 1%) were used in 2007–2020. Sensors were fixed on a cable every 0.02–1.5 m, with a smaller spacing towards the bottom (
Figure 1b). The measurement interval was 1–3 h in 1995–2006 and one minute in 2007–2020.
During most of the research years, the chain was installed on the lake bottom before ice-on (October–early November) and was removed from the lake after ice-off (May–June). However, in some years the chain was installed after the ice formation and was removed from the lake before the ice degradation. For these years, we could not determine the dates of ice-on (1997, 2000–2002, 2006) and ice-off (1998, 2001–2003, 2007).
According to TR-chain data, the dates of ice-on and ice-off and the start of the spring radiatively driven convection were determined (
Table 1). The dates of ice-on were determined by the moment when the water temperature near the bottom starts to increase and DO concentration starts to decrease. The dates of ice-off were determined by the moment of a sharp drop in the bottom temperatures and sharp increase of DO concentrations (
Figure S1). The start of the radiatively driven convection was determined by the appearance of daily temperature variability in the upper chain temperature sensor and formation of the convectively mixed layer (CML).
We used the column-average water temperature on the day of ice-on (T
W_ICE-ON) and the near bottom water temperature at the end of the winter season (T
WB_MAX) (
Table 1) as factors that reflect the interannual variability of the lake’s thermal regime and can affect the oxygen consumption rate in winter.
The oxygen content over the water column was calculated for the first day of the ice period C
0 and then for each day of the ice period C
t; then the ratio C
t/C
0 was calculated for each day of the ice period (
Table 1). This indicator declined during the winter, reflecting the total oxygen consumption in the lake. For each winter season the extent of oxygen depletion during winter (C
t/C
0_MIN) was calculated. In some years, a pronounced increase in oxygen was observed by the end of the ice-covered period, C
t/C
0_END − C
t/C
0_MIN = C
t/C
0_PLUS, which reflected an increase in the oxygen content in the lake. We suppose that the most likely reason for this increase was the release of oxygen as a result of photosynthesis of phytoplankton, since this increase was observed before the ice-off and could not be associated with gas exchange with the atmosphere.
2.6. Statistical Data Analysis
Trend analysis was applied to: (1) air temperature in November, December, January, February, March, April, and May in 1994–2020, (2) number of days with positive air temperature (Days_TAIR > 0), with precipitation (Days_P), and with liquid or mixed precipitation (Days_PLM) in November–April in 1994–2020, (3) dates of ice-on and ice-off on Lake Vendyurskoe in 1995–2020, both measured and simulated, and (4) measured snow-ice thickness in mid-April (HIS_APRIL_MEAS) and simulated ice thickness averaged over the winter season (HICE_MODEL) in 1995–2019.
The level of statistical significance of the trends was assessed by Student’s t-statistics and the nonparametric Mann–Kendall test [
41]. Sen’s method was used to determine the slope of the trend and its confidence intervals [
41].
We investigated the regression between the days with positive air temperature (Days_TAIR > 0) and liquid or mixed precipitation (Days_PLM) in November–April and maximal thickness of the snow-ice cover of Lake Vendyurskoe in mid-April.
We analyzed the influence of the thickness of the snow-ice cover, as well as the thickness of snow, white ice, and slush on under-ice radiation in spring.
Then, we analyzed the relationship between the extent of oxygen depletion during winter (Ct/C0_MIN) and such factors as ice-on date, average water column temperature on the day of ice-on (TW_ICE-ON), water temperature in the bottom layer at the end of the winter season (TWB_MAX), and the number of days with positive air temperature during November–April as an indicator of the severity of the winter.
To understand which factors determine the oxygen increase in late winter, we looked for links between the increase in DO content (Ct/C0_PLUS) and factors such as the date of onset of radiatively driven convection and its duration, the number of days with positive air temperatures (Days_TAIR > 0) and days with liquid or mixed precipitation (Days_PLM) in March and April. The last two parameters could reflect the effect of weather conditions on snow-ice thickness and under-ice irradiance, assuming that the more days with thaws or days with liquid or mixed precipitation, the thinner the ice and the greater the under-ice irradiance. Statistical analysis of field and model data was carried out using the software packages STATISTICA and MatLab.
3. Results
3.1. Climatic Variability of Air Temperature and Precipitation at the Petrozavodsk Weather Station in 1994–2020
Average air temperatures of January, February, March, April, May, November, and December in the 1961–1990 baseline period were −11.4 °C, −9.8 °C, −4.4 °C, +1.5 °C, +8.4 °C, −2.5 °C, and −7.6 °C, respectively.
Table S1 shows the deviations of average monthly air temperatures of these months in 1994–2020 from the corresponding values of the baseline period. The months most often warmer than the baseline was January (22 years), April (20 years), December (19 years), May (18 years), and February (16 years). Positive deviation of 5 °C or more from the baseline (bold in
Table S1) most often occurred in December (8 years), January (7 years), and February (8 years). March was warmer than the baseline by 5 °C or more only in two years. In November, April, and May, the deviation from the baseline did not exceed 5 °C, with maximum values of 4.9 °C, 4.2 °C, and 4.3 °C, respectively. The greatest positive deviation from the baseline was recorded in January 2020 (9.4 °C). Positive trends were found for all months, but only November and May air temperature trends were statistically significant (
Table S2).
The average temperature for the period including January, February, March, April, November, and December in 1961–1990 was −5.7 °C. Seven winter seasons in 1994–2020 were colder than this value (numbers with asterisks in the rightmost column in
Table S1); other winter seasons in the considered period were warmer than the baseline. The period from November to April was the warmest in 2007–2008, 2013–2014, 2014–2015, and 2019–2020, with average temperatures of −2.2 °C, −1.6 °C, −2.1 °C, and −1.0 °C.
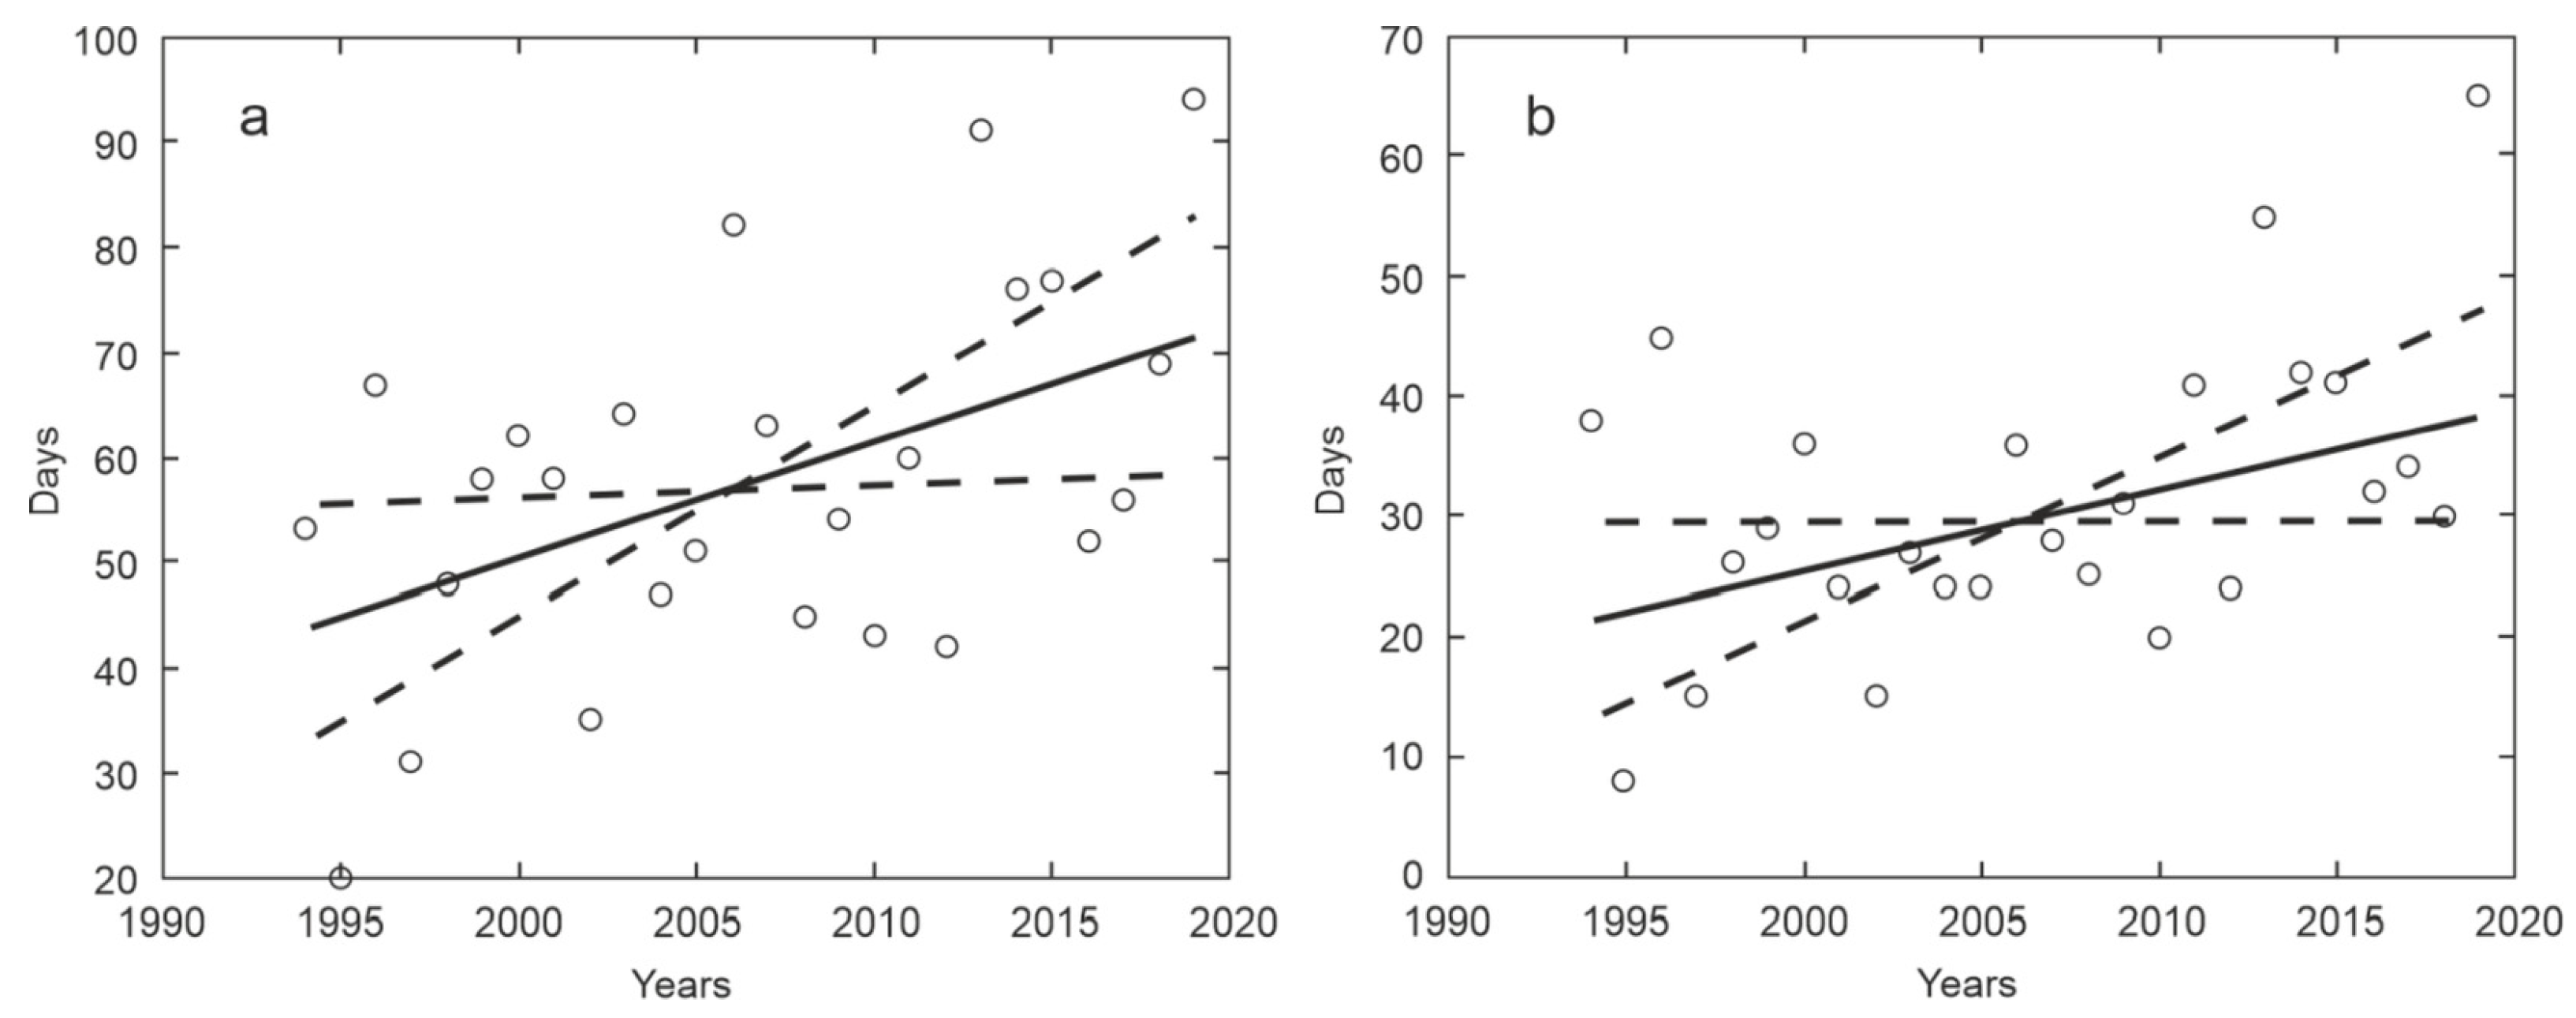
The number of days with precipitation in November–April in 1994–2020 did not demonstrate any significant trend (
Table 1). The number of days with a positive average daily air temperature (
Table 1,
Figure 2a) and the number of days with liquid or mixed precipitation (
Table 1,
Figure 2b) in November–April in 1994–2020 increased significantly during the considered period.
3.2. Ice Phenology and Thickness of the Snow and Ice Cover of Lake Vendyurskoe: Field Data and Model Calculations
The dates of ice-on and ice-off on Lake Vendyurskoe in 1994–2020 varied widely. Unstable ice formed on the lake, starting from the end of October, and stable ice formed from 7 November to 12 December. Ice-off took place between 29 April and 19 May (
Table 2). Thus, the dates of stable ice formation varied in different years within 5 weeks, and the dates of ice-off—within 3 weeks. Simulations yielded ice-on dates 5–20 days earlier than the observed dates in some years; simulated ice-off dates in some years were also 5–20 days ahead of the field data, but in some years simulated ice-off lagged 3–12 days behind. Both field data and model calculations show a positive trend for ice-on dates and a negative trend for ice-off dates, but these trends are not significant (
Table 1,
Figure S2).
Model calculations of ice thickness in 1994–2020 for the entire ice period and field measurements of ice thickness at different points in the winter seasons are shown in
Figure S3. For early winter, the model reproduces the ice thickness well, but for the spring period of some years the discrepancies can reach 10–15 cm (e.g., spring 1995 and 2008).
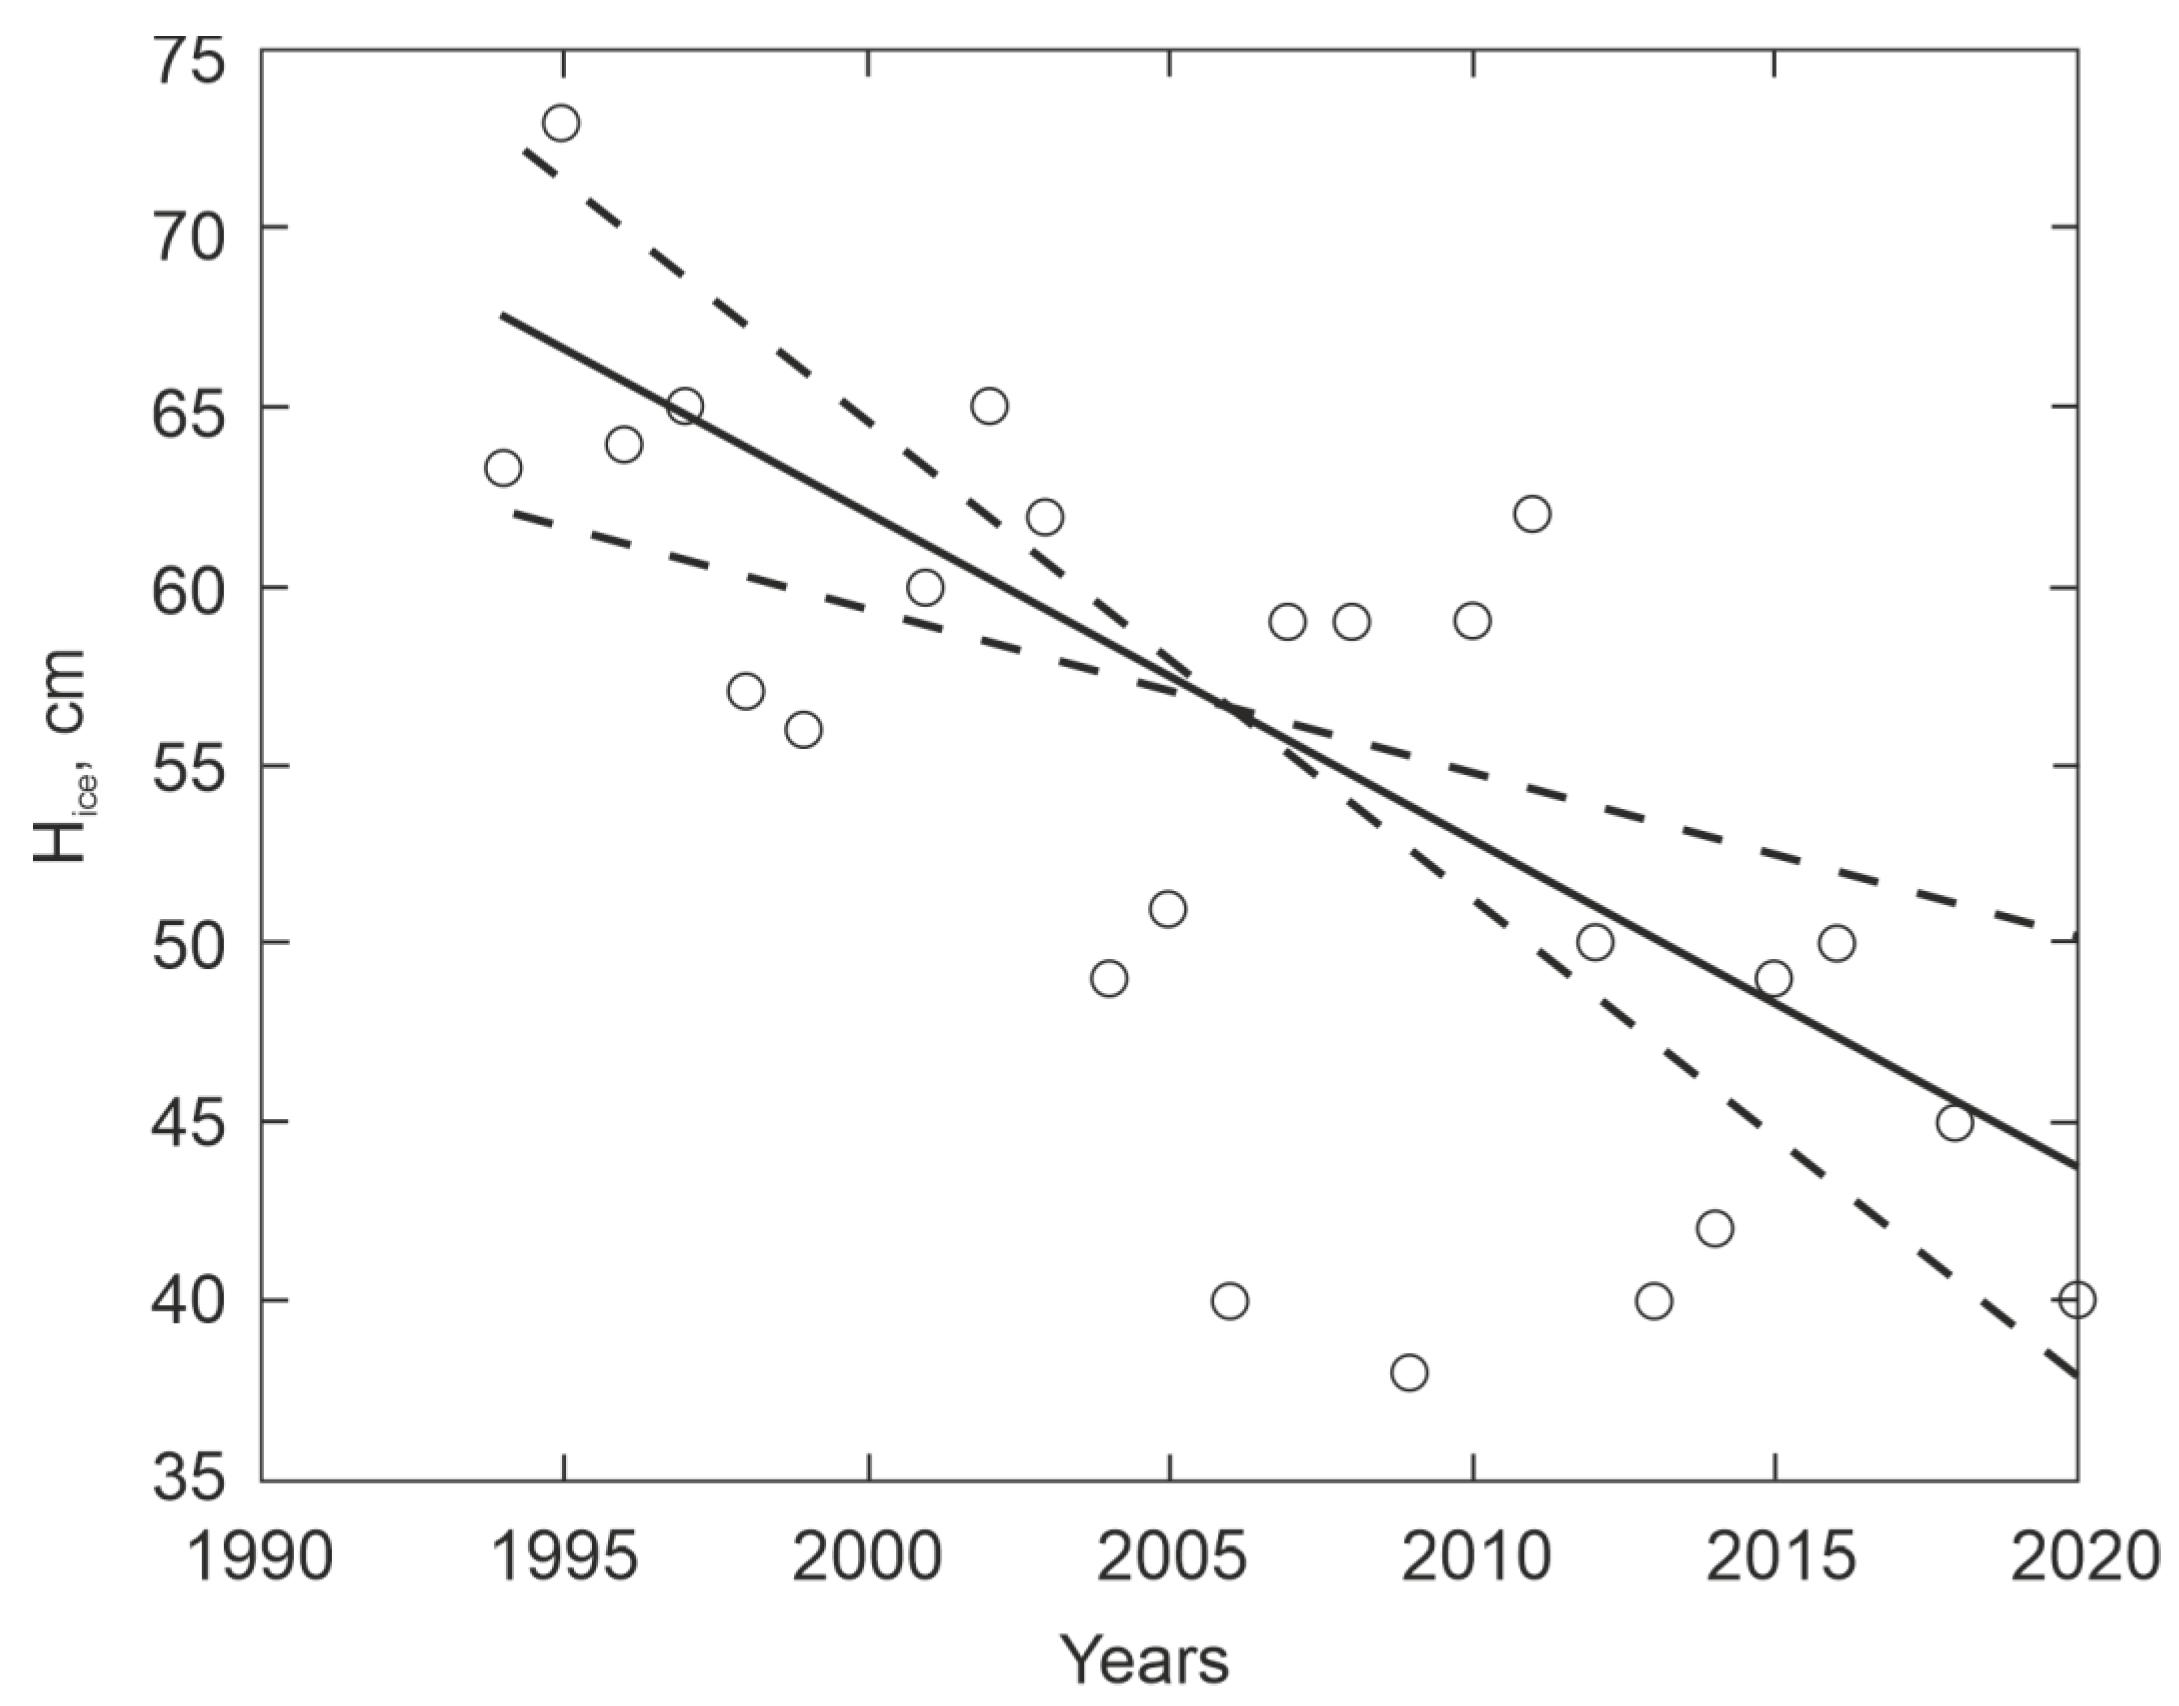
Statistical analysis of time series of the ice thickness of Lake Vendyurskoe in mid-April in 1995–2020 showed the presence of a significant negative linear trend (H
IS_
APRIL_MEAS,
Table 1,
Figure 3); the average rate of decrease of ice thickness for this period was 1.1 cm per year. A model calculation of the average ice thickness of Lake Vendyurskoe for the winter period (H
ICE_MODEL) also shows a negative trend, but the trend is not significant.
For all years of measurements, snow thickness on the ice of Lake Vendyurskoe in April rarely exceeded 10 cm (
Table S3), and in some years there was no snow during the measurements. In spring, the thickness of snow on ice sometimes changed quickly, decreasing as a result of intense melting, or increasing as a result of a fresh snowfall. In April, ice on Lake Vendyurskoe consisted of two layers, i.e., white ice and black ice. Black ice was usually thicker than white ice. In some years; however, white ice thickness was greater (2005, 2012 and 2017). In some years in April (2000, 2004, 2009–2012 and 2015), a 3–11 cm slush layer formed on the surface of white ice.
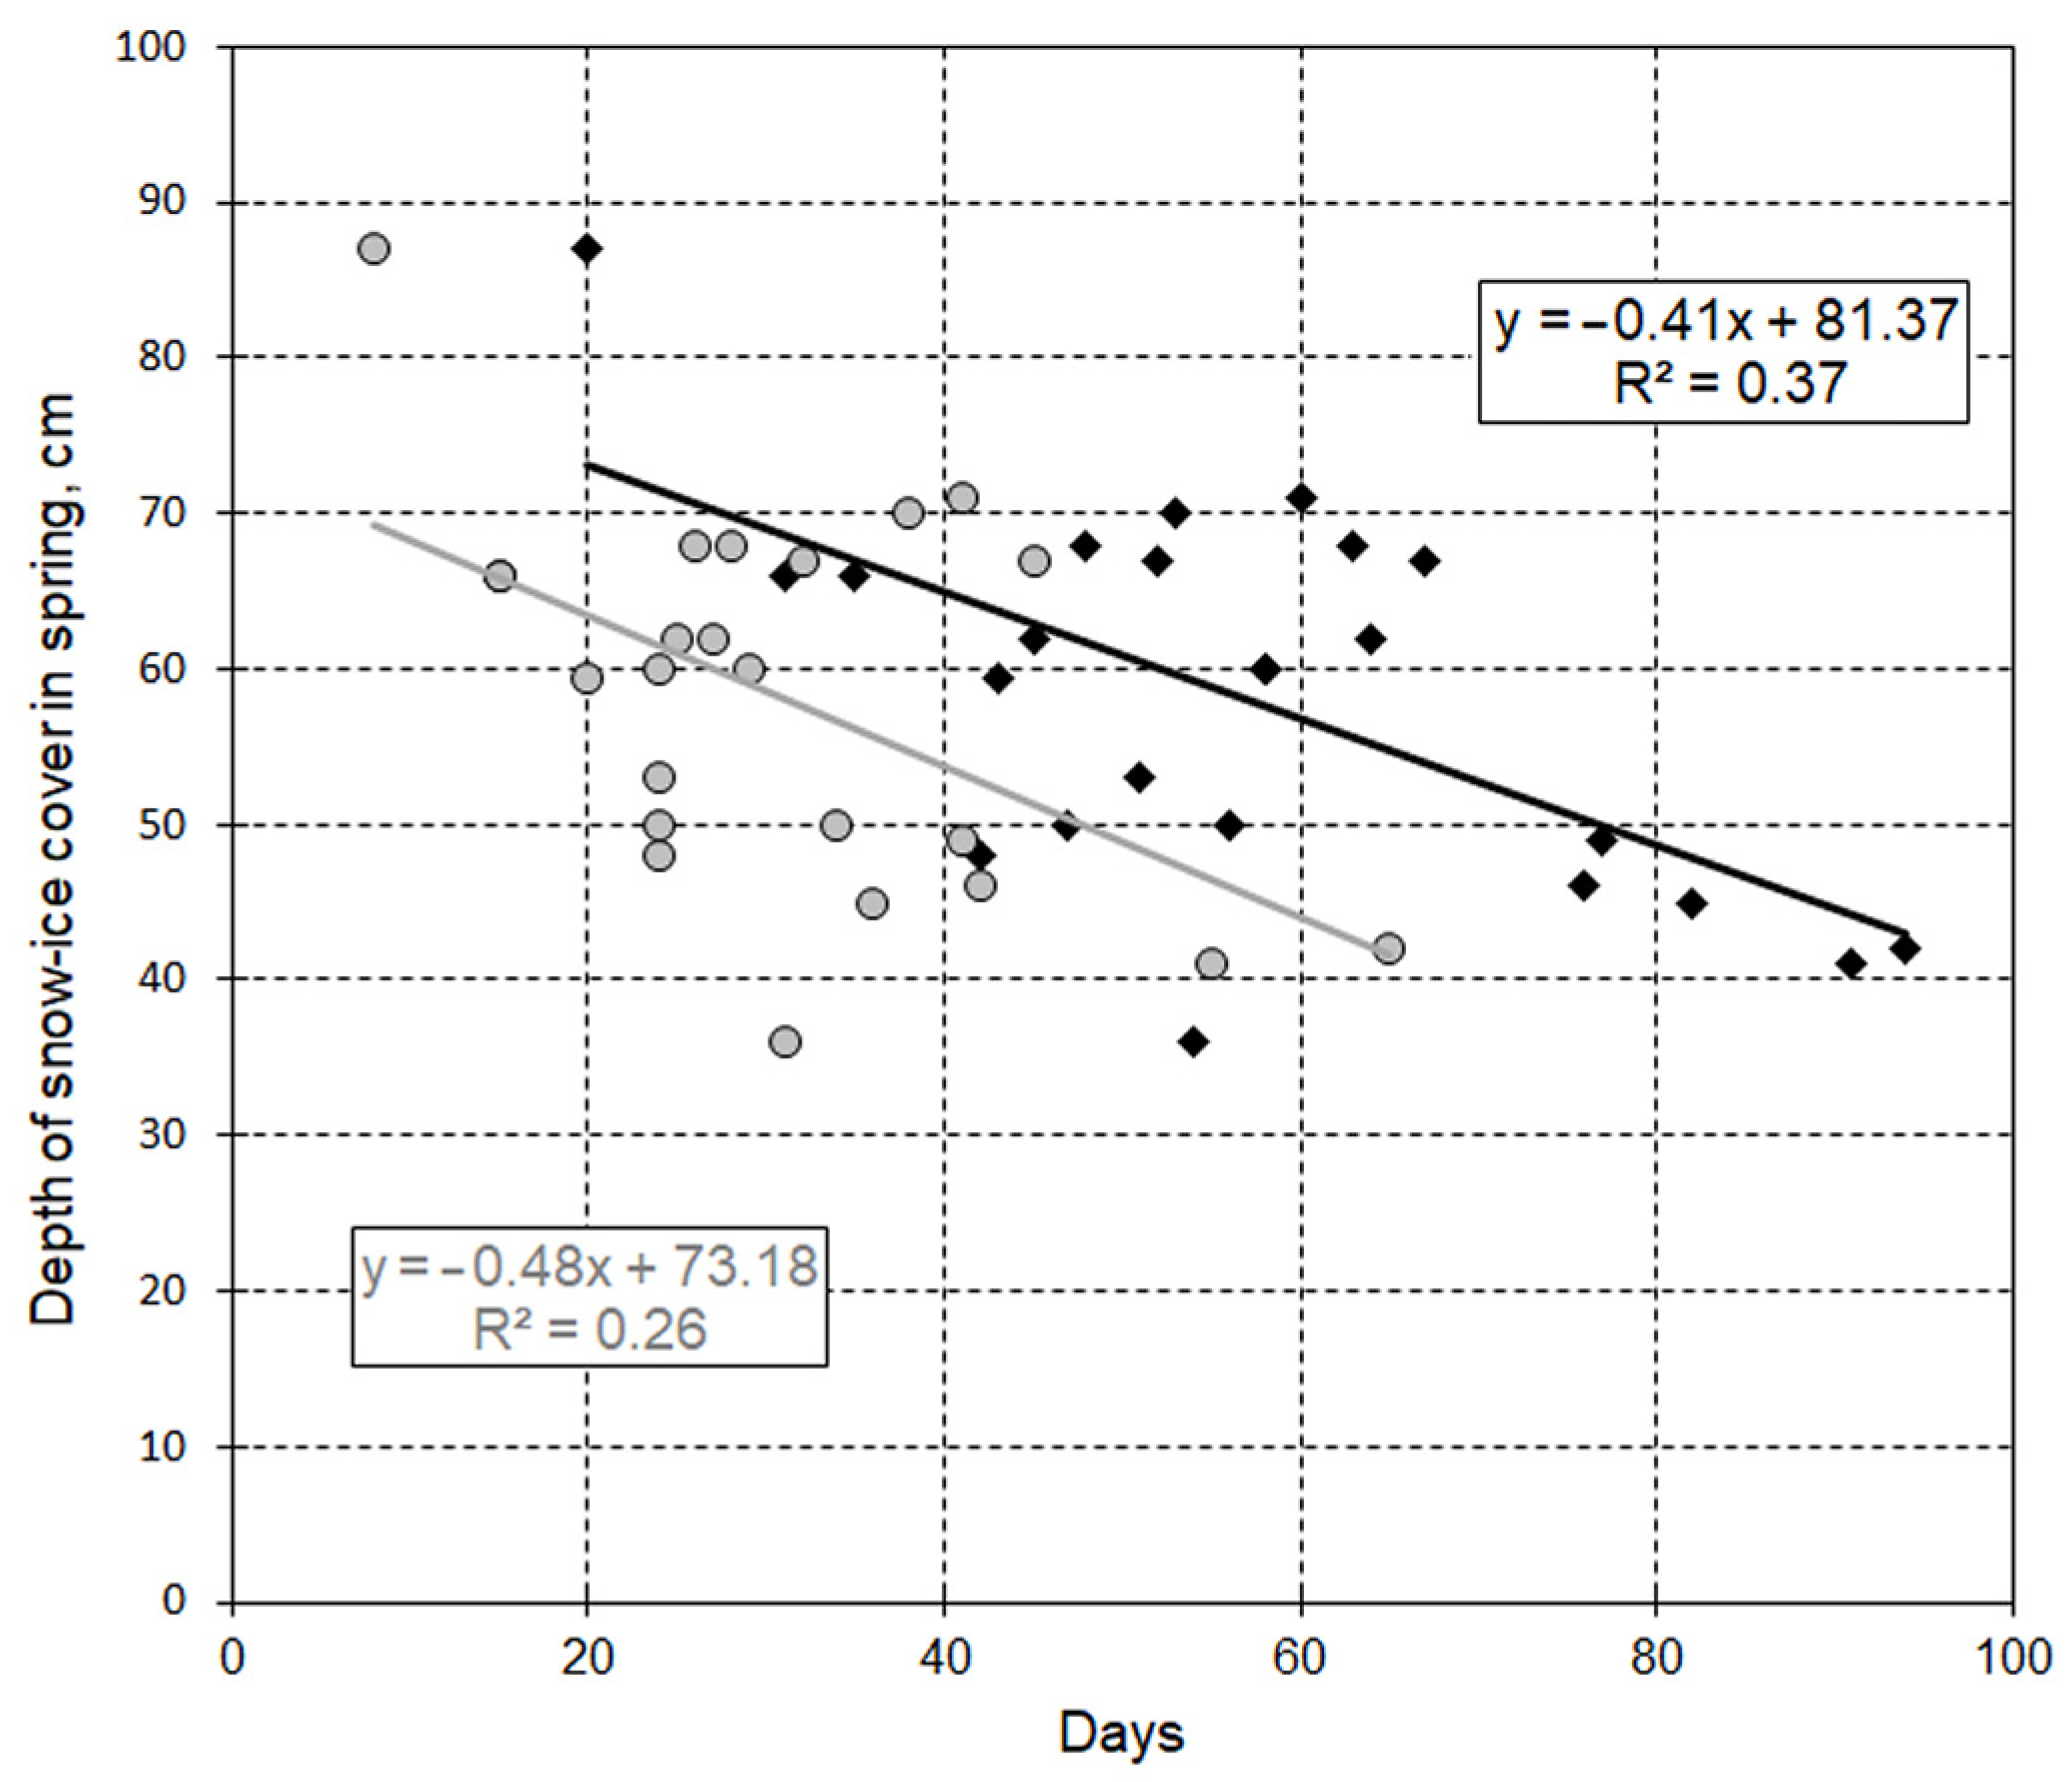
A significant negative relationship was found between the snow-ice cover thickness in April and the number of days with positive air temperatures in November–April (
p = 0.0015), as well as with the number of days with liquid or mixed precipitation in the same period (
p = 0.0103): the more such days there were, the thinner the snow-ice cover was in April (
Figure 4).
3.3. Under-Ice Solar Radiation in Spring in 1994–2020
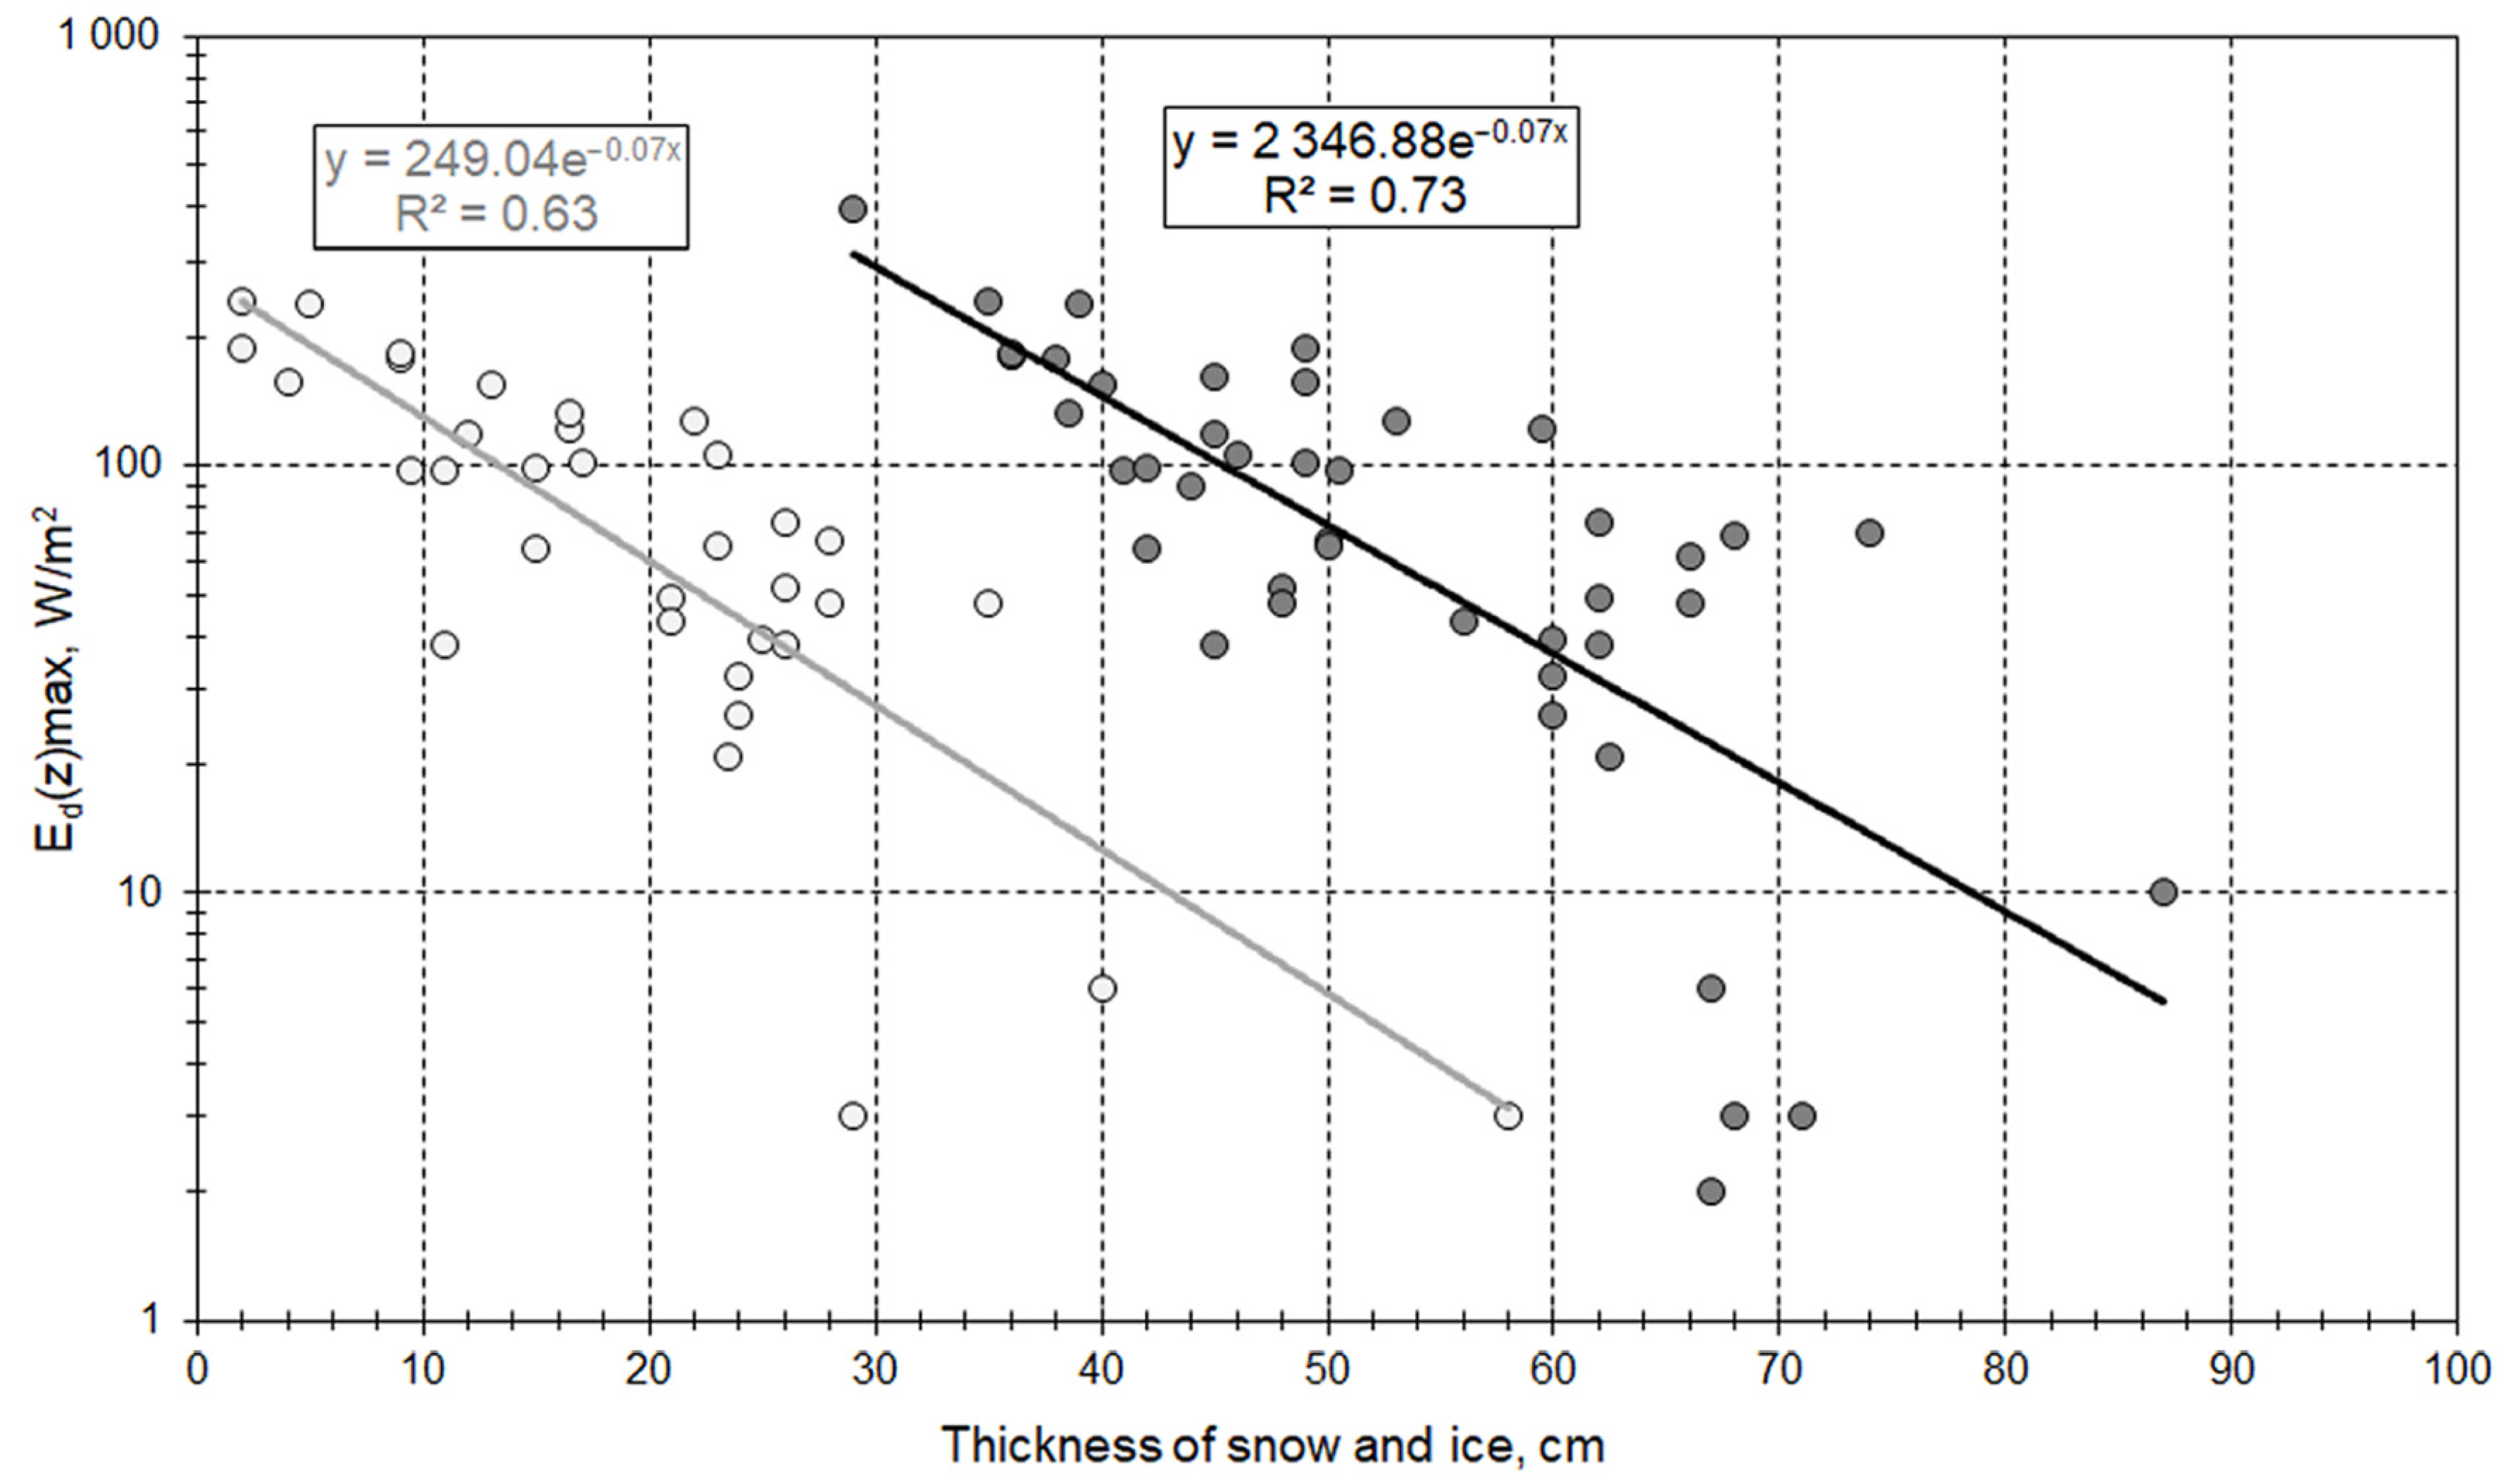
During the period of spring measurements, the daytime maxima of the incident radiation on the snow-ice cover surface E
d(0) reached 600–800 W/m
2 on sunny days [
32]. Depending on the thickness of snow and ice, as well as on meteorological conditions, the fluxes of under-ice radiation E
d(z) varied over a wide range from values close to zero to 350 W/m
2 and more (
Table S3). After the fall of fresh snow, the daytime maximum of under-ice radiation fluxes sharply declined to almost zero. Then, as the snow melted, it increased again. Since the weather conditions in spring are very unstable, a pronounced variability in the optical characteristics of the snow-ice cover of the lake and the fluxes of under-ice radiation was noted. A generalized analysis of the data from the spring period for all years of measurements showed a significant negative relationship between under-ice radiation and the snow-ice cover thickness during melting stage (
Figure 5).
3.4. Water Temperature in Winter in 1994–2020
According to the thermistor chain data, the mean water column temperature in the central part of the lake at ice-on varied from 0.13 to 2.3 °C (
Table 2). In some years, warm windy weather caused ice to fall apart after ice-on, for example, in 2009, 2011, 2014, 2015, and 2019 (see
Figure S1 for 2009). In most cases, ice formation after a transient ice-off occurred at a lower water temperature. For example, in autumn 2009 the first ice-on was on November 12, when the average temperature over the water column was 0.52 °C; the second ice formation was on December 5, at water temperature of 0.17 °C (
Table 2,
Figure S1a). By the end of the winter season, water temperature in the bottom layers of the central basin of the lake reached 4.20–5.85 °C. Spring under-ice convection began in the interval from March 10 to April 21 and lasted for 19 to 46 days. In some years, convection started very early, and then halted after cooling and snowfall, as happened, e.g., in April 2015 and 2020, and then, as the snow melted, convection continued to develop. For example, in the spring of 2020, under-ice convection began on March 10. The lower boundary of CML on March 20 was well identified at a depth of 3 m, and the temperature in this layer was 1.55 °C. During the 3rd–4th weeks of March, there was practically no snow on the ice surface and sunny weather activated convection. The temperature of the CML and the depth of its lower boundary increased rapidly and reached 2.26 °C and 6 m by March 31. On April 1 and 2, after snow fell, the solar radiation flux at the lower ice boundary dropped sharply to 5–10 W/m
2, and the convection slowed down. During the first week of April, the snow melted, but the weather being cloudy, the flux of under-ice radiation did not exceed 50–60 W/m
2. The depth of the CML lower boundary decreased to 3–4 m on April 6. During the second half of April, convection continued, sometimes increasing, sometimes weakening, depending on weather conditions and the presence of snow on ice, and by May 3 the temperature of CML rose to 4 °C, and the depth of its lower boundary was about 7.5 m.
The depth of the convective layer in different years reached 5.5–10.5 m, and its temperature was 2.5–4.0 °C. In some years (1994, 1996, 1997, 1999, 2016, 2020), an increase in water temperature above 4 °C was observed in the surface layers of the lake during the last days of the ice-covered period (before ice-off).
3.5. Dissolved Oxygen Content Change in the Winter Seasons of 2007–2020
In the pre-ice period (October, November), the water mass was quasi-homogeneous due to intensive wind mixing and was quite well saturated with oxygen (>90%). The DO content in the water column gradually grew as its solubility increased with decreasing water temperature. Maximal DO concentrations of >12.0 mg/L (saturation over 90%) were observed in the surface layer of the lake every autumn.
During the first 2–3 days after ice-on, DO concentration usually decreased by 0.5–1.0 mg/L (see, for example,
Figure S1b for early winter in 2009). During the winter, the oxygen concentration in the surface layers of the water column gradually decreased, and by the end of the winter it was 9.0–9.5 mg/L at a saturation of 75–80%. In the bottom layers of the central deep-water basin, a rapid decrease of DO was observed during the first weeks of the ice season, and by the end of the second month of the ice period DO concentration in the 0.5 m bottom layer decreased to 2 mg/L. The thickness of the bottom anaerobic zone (DO concentration less than 2 mg/L) can reach two meters at the end of the ice-covered period in some years. The anaerobic zone in the deep-water part of the lake usually persists until ice-off because the bottom layer of the central basin is rarely involved in convective mixing. After ice-off in spring, complete mixing of the water column of Lake Vendyurskoe usually occurs, and the bottom anaerobic zone is destroyed.
In the first few days after ice-on, the rate of oxygen decline is maximal in the bottom layers of central deep-water basin and can reach 0.5–0.7 (mg/L)/day (
Figure S1b).
Then, in the winter stagnation stage, the rate of DO decline in the surface layer did not exceed 0.01 (mg/L)/day. With depth, the rate of DO consumption gradually increased and reached 0.03–0.05 (mg/L)/day at 2–4 m above the bottom. The highest rates of DO decline are observed in the 0.2–0.3 m bottom layer, where they reached 0.1–0.4 (mg/L)/day during the first winter weeks.
In spring, as convection develops, the oxygen concentration gets equalized over CML. When convection develops, the underlying oxygen-depleted water is drawn into CML. As a consequence, the oxygen concentration in CML decreases.
Daily DO fluctuations with a distinct daytime maximum and a nighttime minimum were observed in spring in the surface layer of the lake during all winter seasons. For example, in the spring of 2020, such fluctuations were observed since the last ten days of March and continued until ice-off. The amplitude of these fluctuations can in some years reach 0.9 mg/L. After snowfall, under-ice radiation decreases, and the amplitude of daily oxygen fluctuations decreases too; as under-ice radiation increases, the amplitude of daily oxygen fluctuations also grows noticeably.
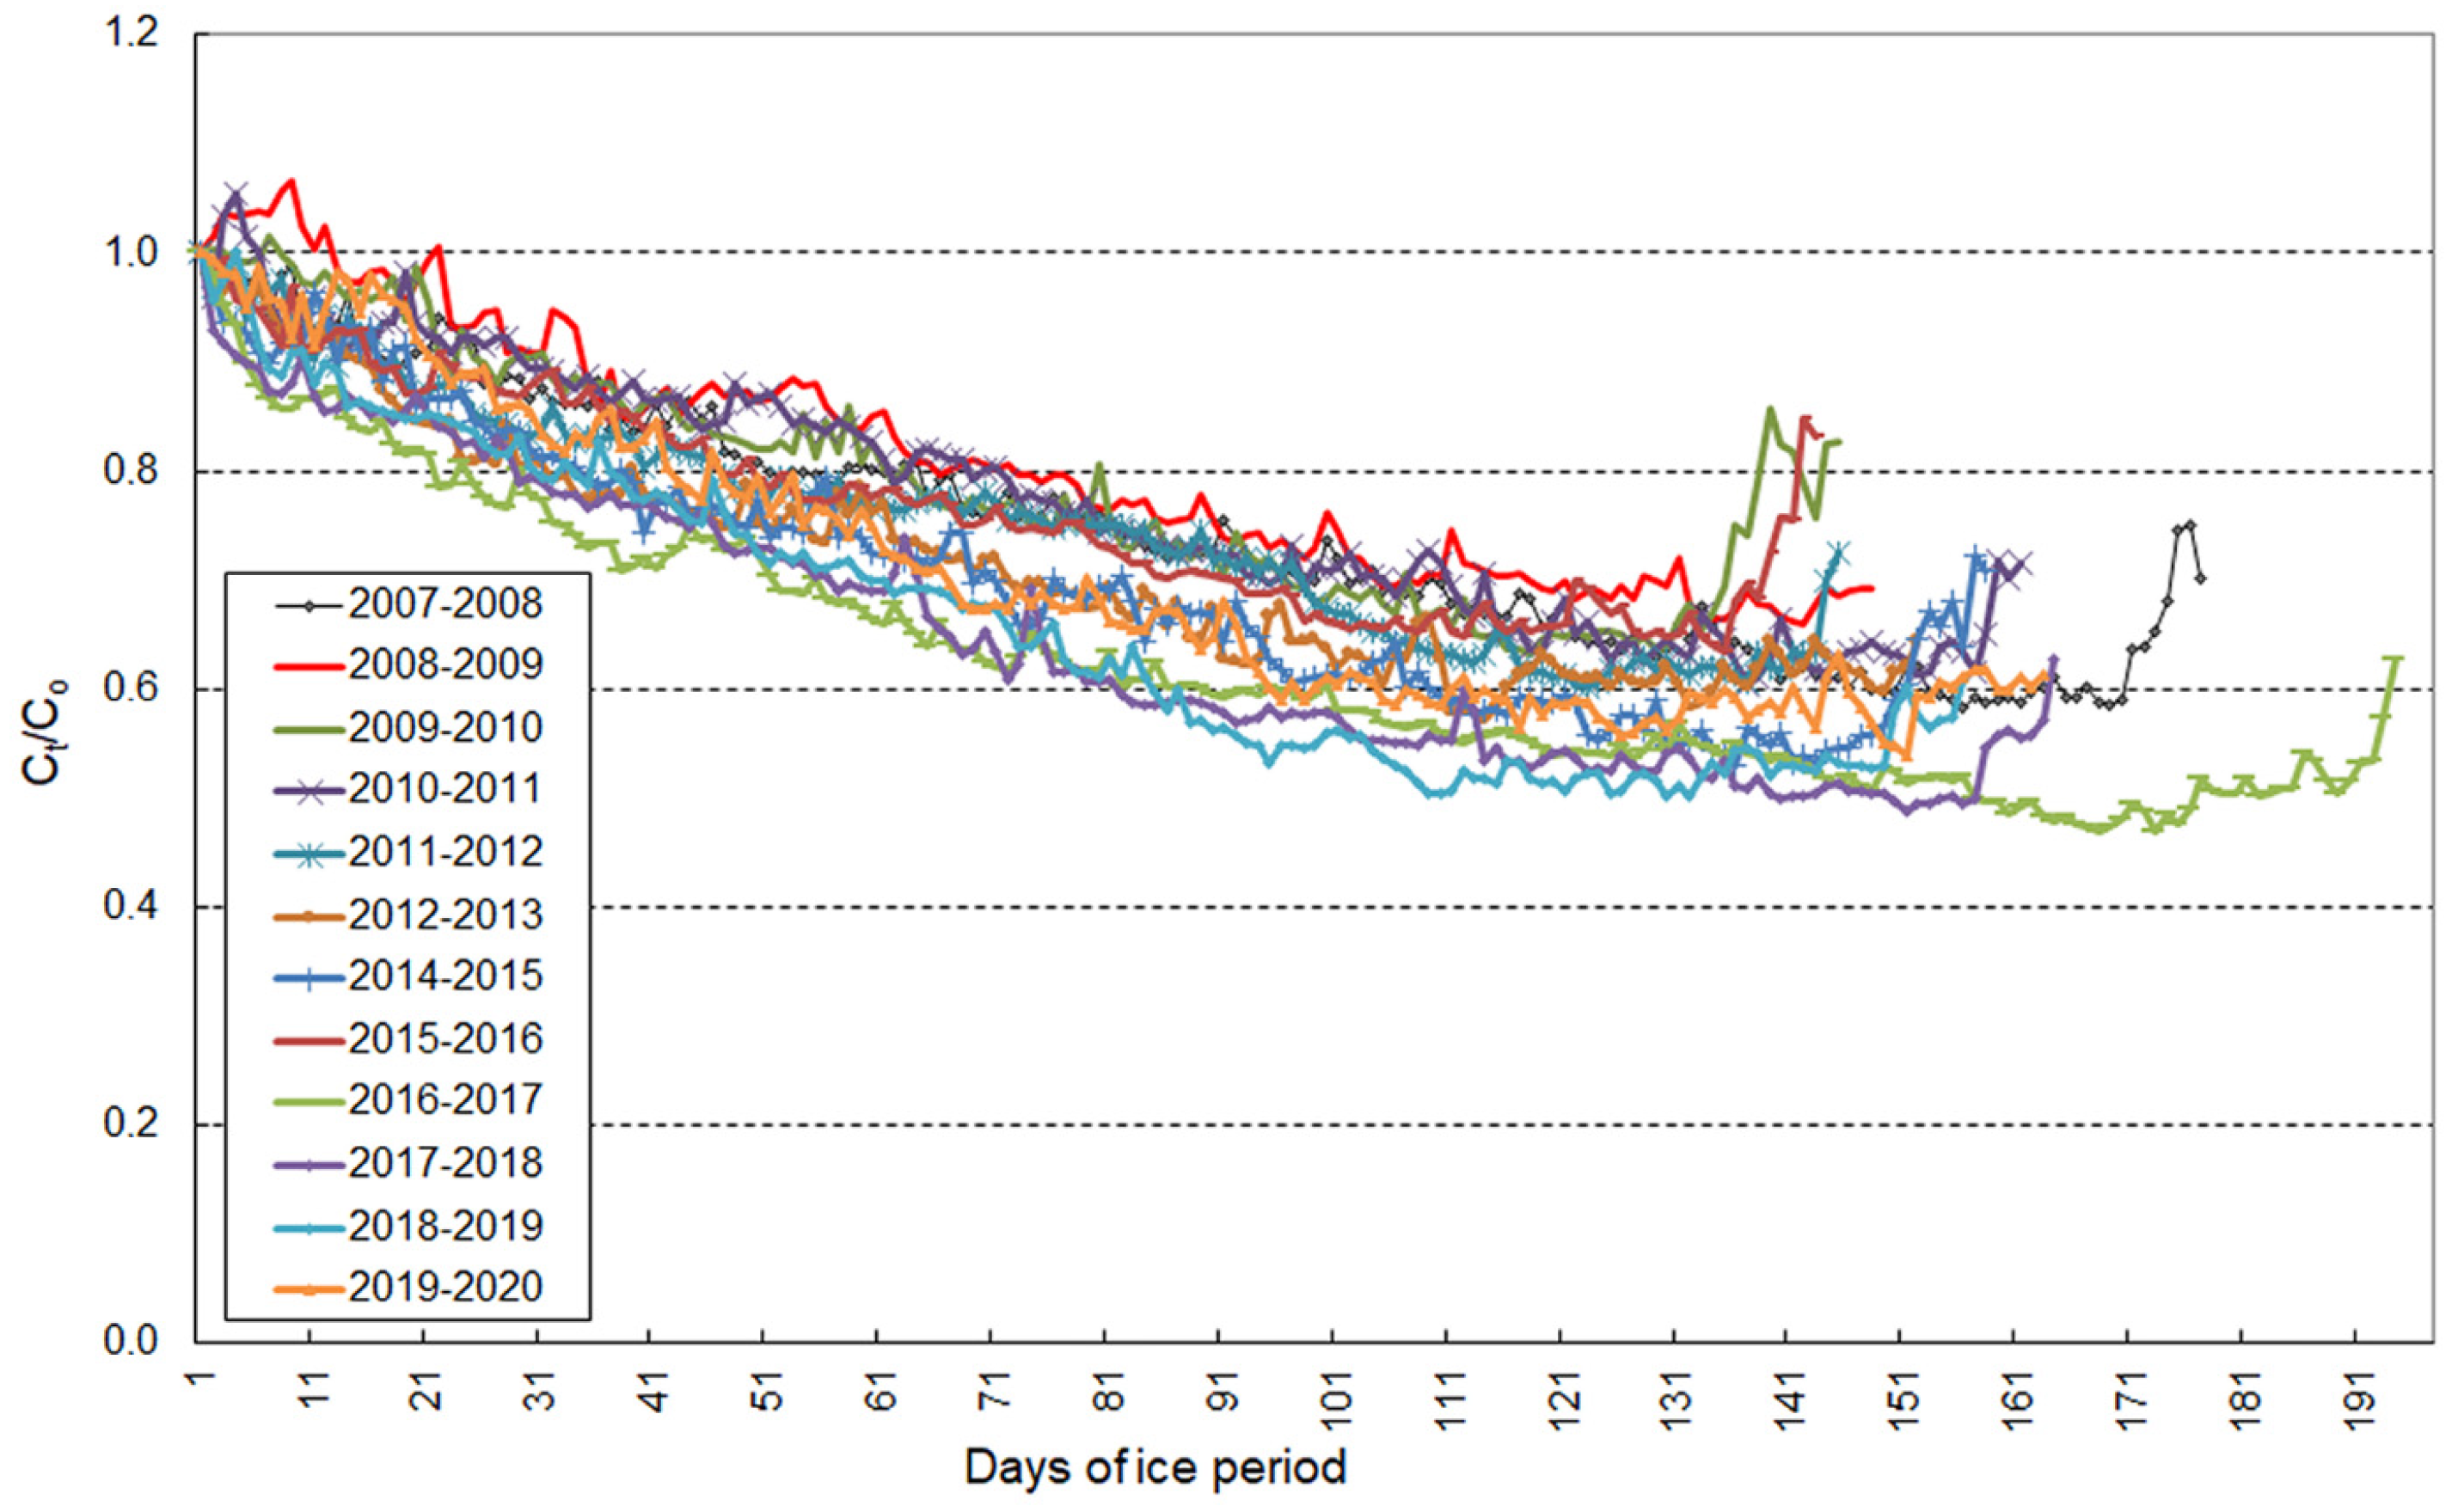
The decrease in the oxygen content of the water column during winter ranged from 53 to 39% in different years; the corresponding C
t/C
0_MIN value varied from 0.47 to 0.61 (
Table 2,
Figure 6). With the onset of under-ice convection, the decrease in the oxygen content ended, remained at approximately the same level for several days, and then began to increase (by 10–15% in some years).
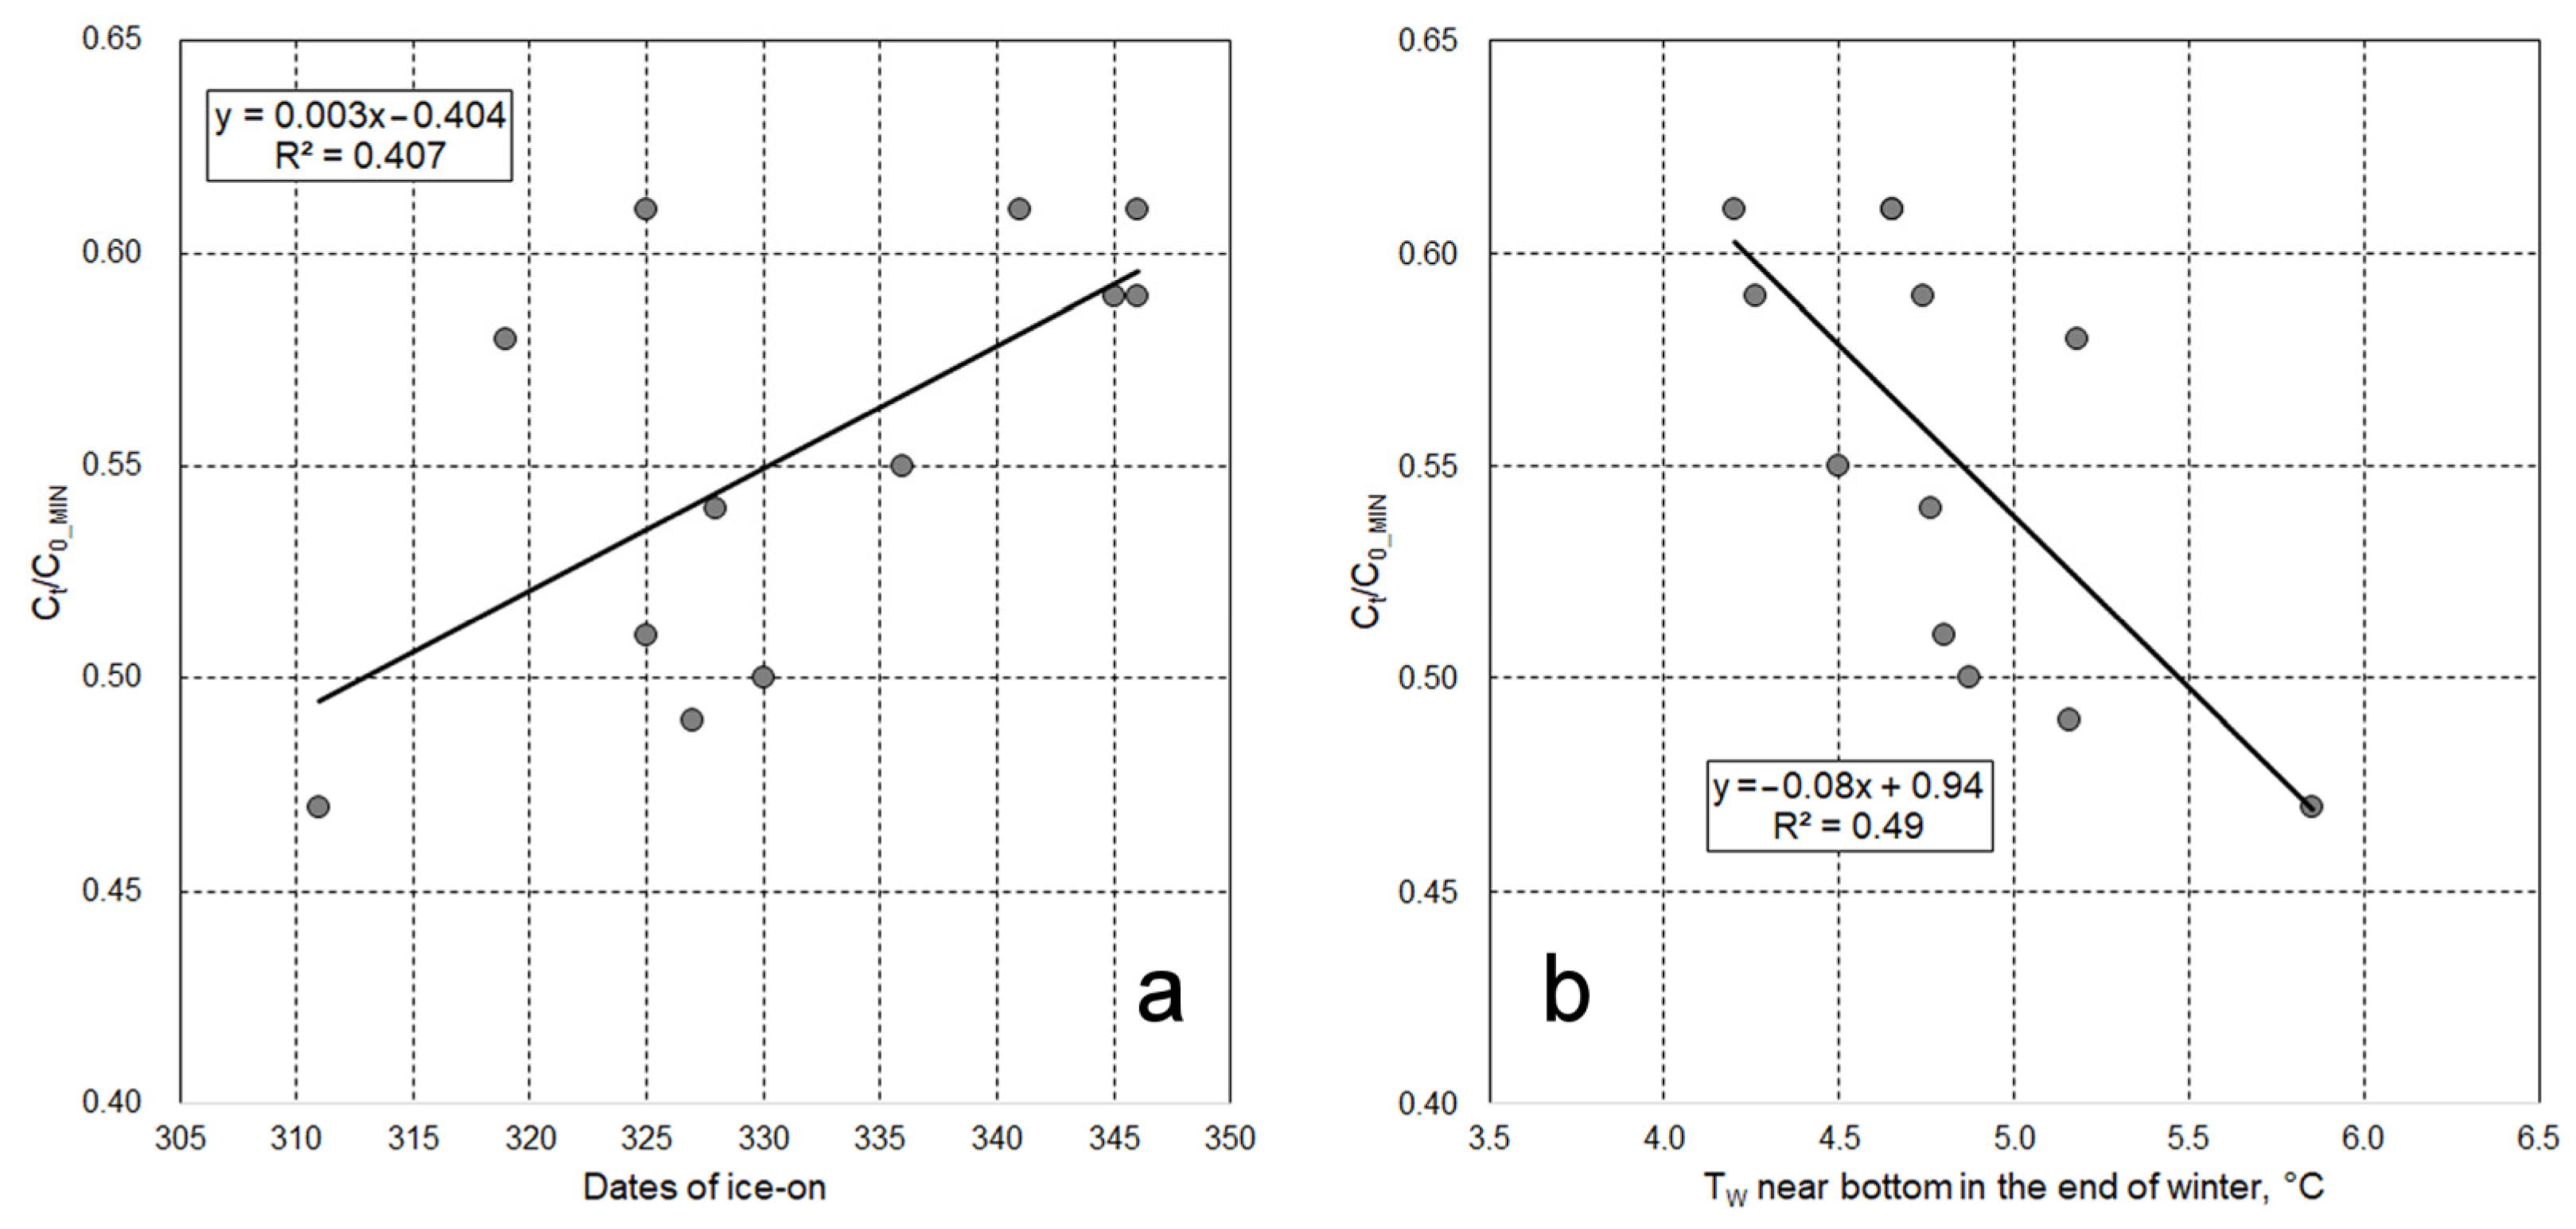
To understand which factors influence the rate of oxygen decrease in Lake Vendyurskoe in winter, we analyzed the relationship between the minimum values of Ct/C0_MIN during winter and the following factors: ice-on date, water temperature on the ice-on day, maximal bottom water temperature at the end of the winter, and the number of days with a positive average daily temperature in November–April.
The values of C
t/C
0_MIN correlated the most significantly with the date of ice-on (
p = 0.0256,
Figure 7a), and with the temperature of the bottom water at the end of the winter (
p = 0.0113,
Figure 7b): the earlier the ice formed and the higher the bottom water temperature at the end of the winter, the lower the C
t/C
0_MIN ratio. The highest values of C
t/C
0_MIN were observed in years with intermittent ice-off at the beginning of the winter (
Table 2). A less pronounced relationship (R
2 = 0.17) was found between C
t/C
0_MIN and the water temperature on the day of ice-on: the higher this temperature was, the lower the value of C
t/C
0_MIN was. No correlation was found between the degree of oxygen depletion in the lake in winter and the number of days with positive air temperatures in November–April.
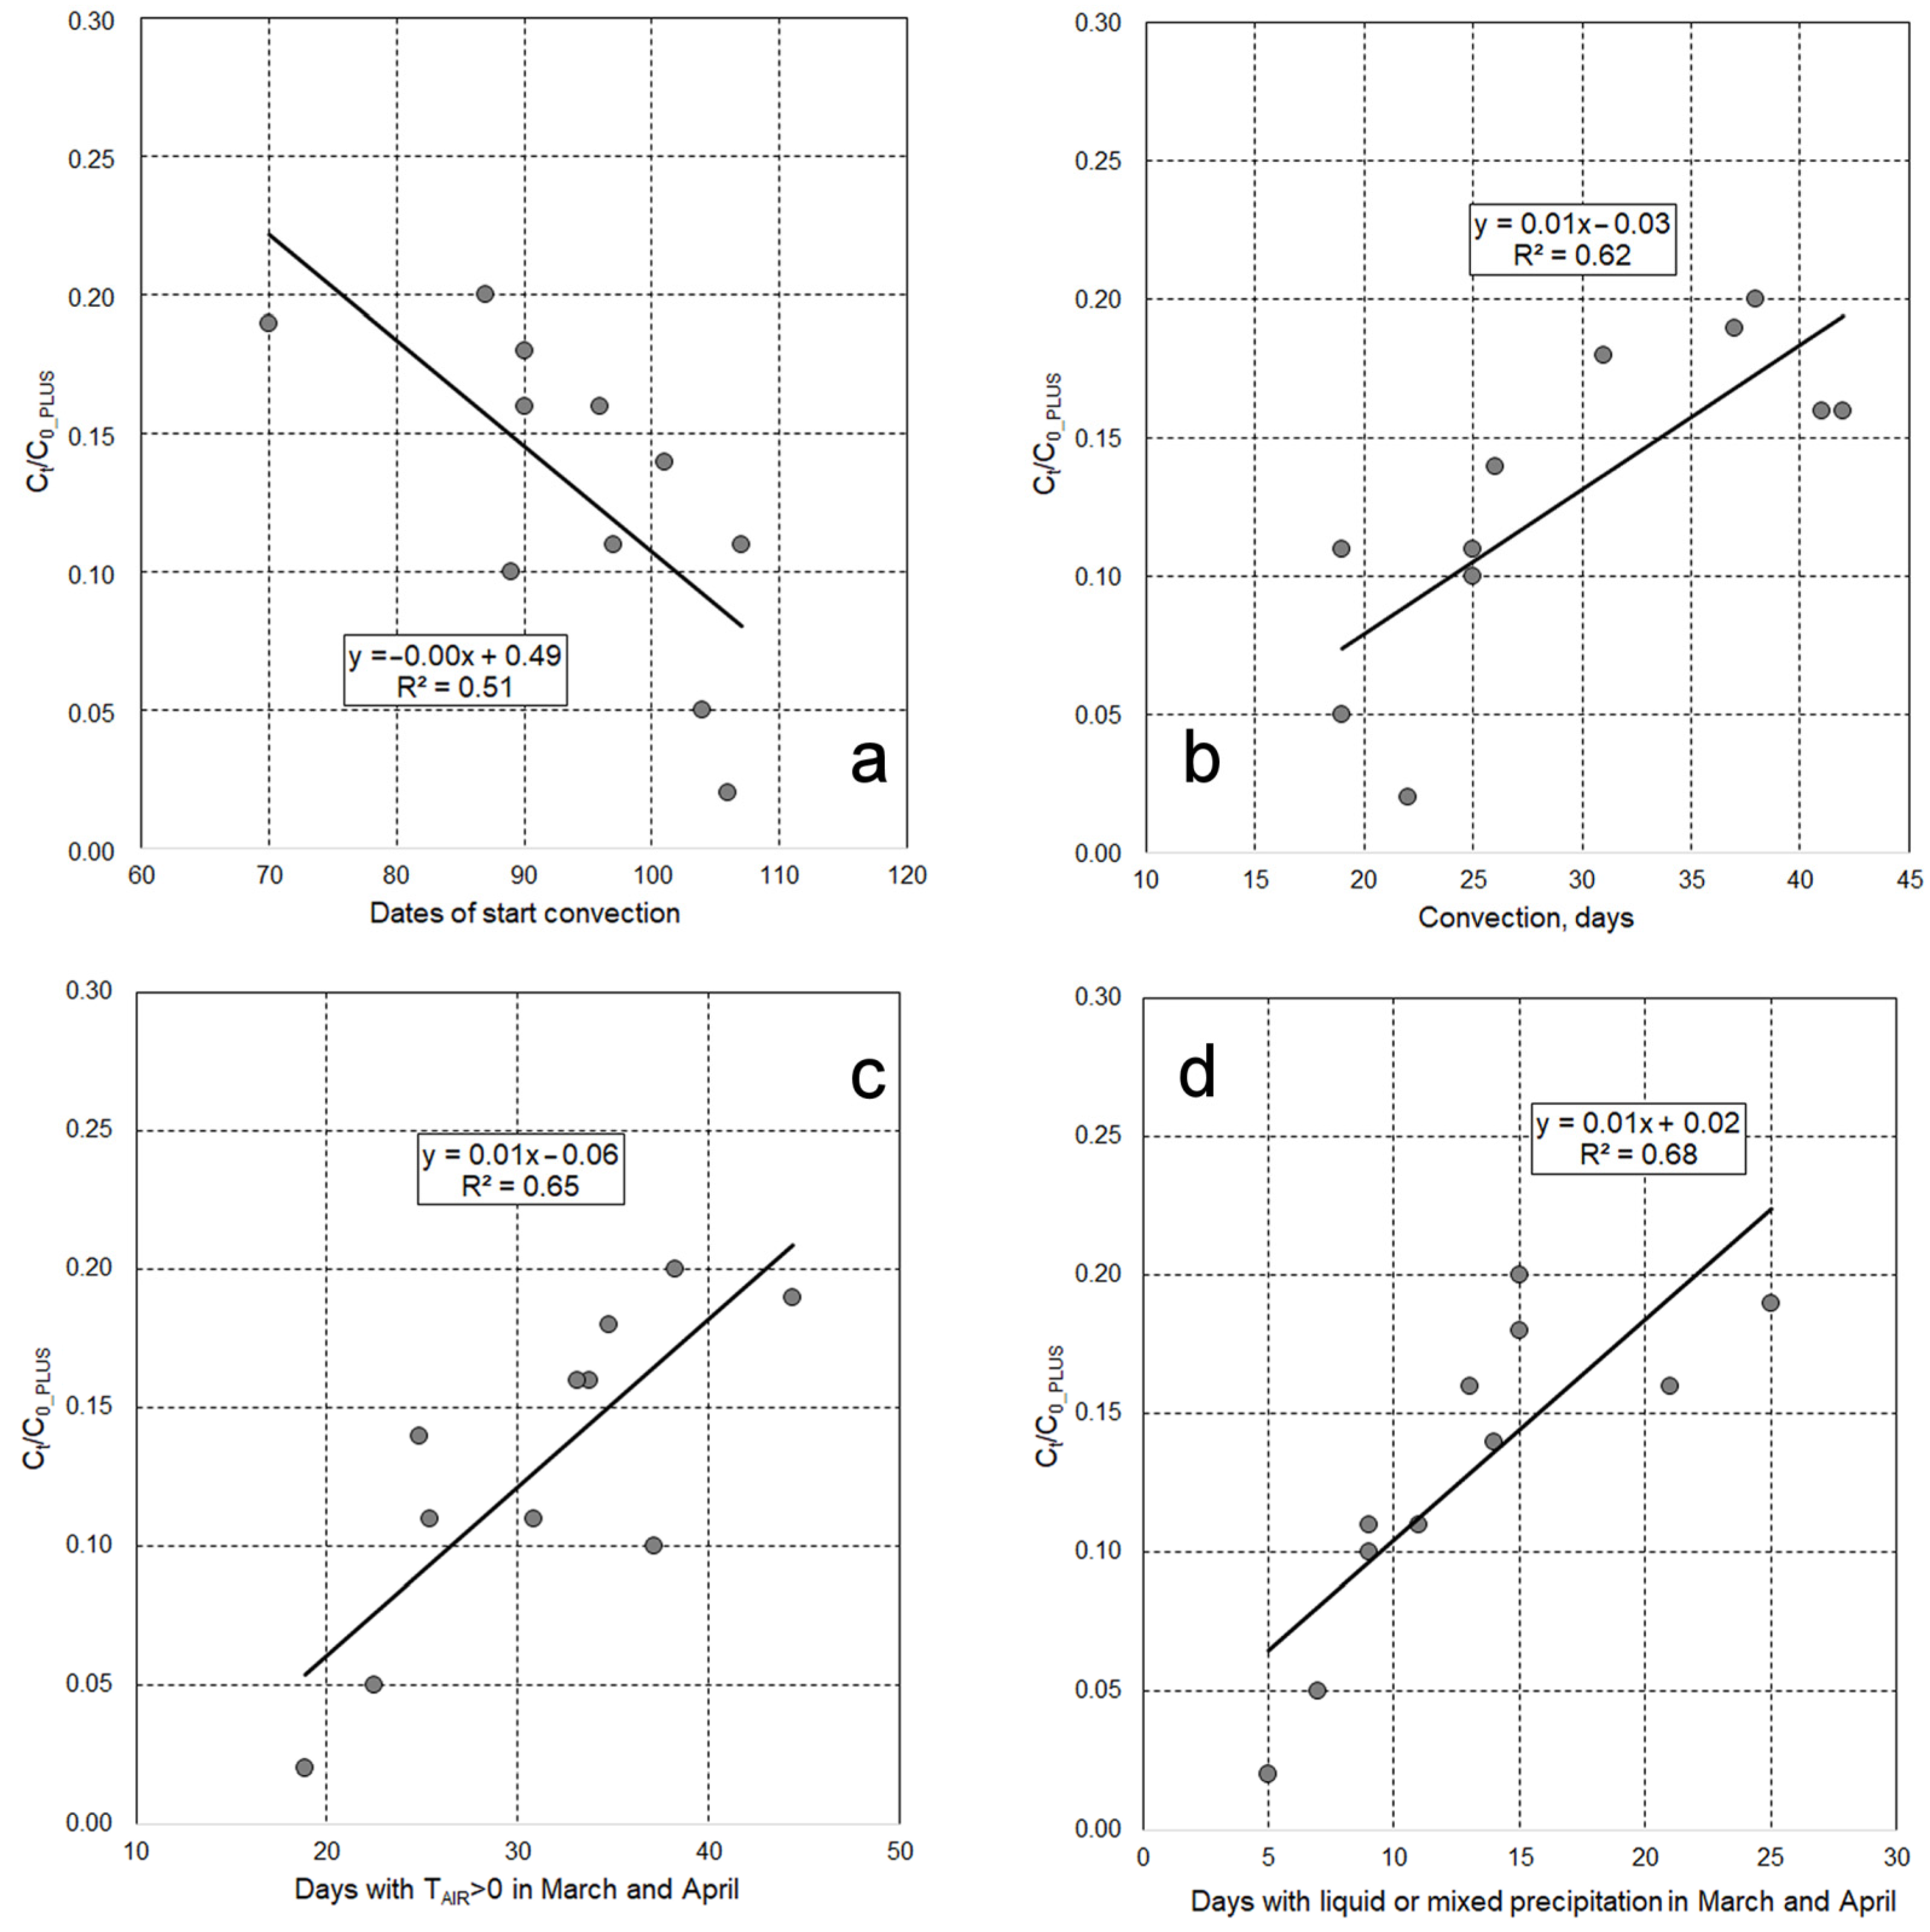
To find out which factors contribute to the increase in the DO content at the end of the winter season, we analyzed the relationship between C
t/C
0_PLUS and the onset date of convection (
Figure 8a) and its duration (
Figure 8b), the number of days with a positive air temperature in March–April (
Figure 8c), and the number of days with liquid or mixed precipitation in the same period (
Figure 8d).
There are good correlations between Ct/C0_PLUS and dates of start convection (p = 0.0139) and duration of convection (p = 0.0042). The greatest increase in the oxygen content in the lake occurred in years with an early onset and long duration of under-ice convection. The lowest values of Ct/C0_PLUS were observed in years with a short convection period.
There is also a good correlation between Ct/C0_PLUS and the number of days with a positive average daily temperature in March and April (0.0029) and several days with liquid or mixed precipitation (p = 0.0019).
4. Discussion
We analyzed the climate variability in southern Karelia (northwestern Russia) in 1994–2020 and revealed that the air temperature and precipitation in the colder half of the year (November–May) varied markedly during this period. The largest and most frequent positive deviation from the 1961–1990 baseline was recorded for the winter months (December, January, and February) (
Table S1). Positive trends were detected for all of these months, but the trend was significant only in November and May (
Table S2). During 19 of the 26 winter seasons in the series, the average air temperature in November–April period was higher than the baseline. The number of days with a positive average daily air temperature in November–April as well as the number of days with liquid or mixed precipitation increased significantly during 1994–2020 (
Table 1).
The revealed trends in air temperature and precipitation in the winter seasons of 1994–2020 in southern Karelia are consistent with the climate tendency in other regions of the temperate zone and high latitudes of the Northern Hemisphere over the past decades. Positive trends in precipitation in winter (November–March) during 1921–2015 have been shown for Northern Eurasia (statistically significant) and North America (statistically insignificant) [
42]. A rapid increase in air temperature (over 2 °C in 1847–2013 for annual air temperature, which amounts to 0.14 °C/decade) with the most pronounced increase in November, December, and January has been shown for Finnish territory [
43]. A statistically significant increase in air temperature and precipitation in winter in 1948–2016, as well as a decrease in the proportion of precipitation falling as snow (i.e., the ratio of snowfall to total precipitation) associated with warming has been recorded for the territory of Canada [
44]; the authors of said study emphasize that annual and winter precipitation may continue to increase everywhere in Canada over the course of the 21st century.
Climatic changes in air temperature and precipitation affect the ice and thermal regimes of lakes. Shortening of the ice period is observed and modelled on many temperate lakes [
23,
24,
25,
45,
46,
47,
48,
49,
50,
51]. An important consequence of shorter ice periods is a decrease in the duration of winter hypoxia and anoxia and, hence, improvement of oxygen conditions in the colder half of the year [
39,
52,
53].
The changes revealed in air temperature and precipitation in southern Karelia in 1994–2020 were reflected in a pronounced variability of the dates of ice-on and ice-off on Lake Vendyurskoe. Both field data and FLake model calculations show a positive trend for ice-on dates and a negative trend for ice-off dates, although these trends are not statistically significant. Large gaps in the field series of ice-on and ice-off dates do not allow us to analyze the trend of the of ice-covered period duration for Lake Vendyurskoe. We can only state that the duration of the ice-covered period on this lake in 1994–2020 varied widely from 145 days (winter season 2011–2012) to 193 days (winter seasons 1994–1995 and 2016–2017).
One important feature of the change of the ice regime of Lake Vendyurskoe in early winter was revealed that could enhance its oxygen conditions in the subsequent winter. The increase in air temperature in November and December causes ice to become less stable in the initial period of winter. To wit, since 2005, intermediate ice-offs have become more frequent in the early winter (
Table 2). In some years, there were two or three intermediate ice-off events. After an intermediate ice-off, the water temperature most often continued to decline until the ice set in again that lead to a lower water temperature and smaller bacterial oxygen consumption in the subsequent winter. In addition, aeration and oxygenation of the bottom layers of the lake occurred after an intermediate ice-off (
Figure S1b). Presumably, the organic matter accumulated in the bottom layers of the lake were partially oxidized during the temporary existence of ice, and the rate of oxygen consumption in the subsequent ice-covered period decreased.
The climate variability has also affected the thickness of the lake’s snow-ice cover, and, consequently, the under-ice illumination, which is an important factor for phytoplankton growth and oxygen release. A climatic decrease in snow-ice cover thickness is observed on different lakes in the temperate zone and high latitudes [
46,
51].
A statistically significant decrease in the thickness of the snow-ice cover of Lake Vendyurskoe during the spring periods of 1994–2020 (by 1.1 cm per year) was revealed (
Table 1,
Figure 3). We assume that this decrease is associated both with an increase in air temperature, namely, an increase in the number of days with positive air temperatures and liquid or mixed precipitation in winter and spring months (
Figure 4). It should be kept in mind that ice and snow thickness measurements on Lake Vendyurskoe in spring were carried out in different stages of snow and ice melting in different years. This complicates the joint analysis of spring ice and snow thickness with climatic parameters. Measurements in spring during the period of intensive thawing do not allow estimating the average ice thickness over the winter season and investigating its climatic variability. FLake model calculations indicate that the average ice thickness over the winter season has most likely also decreased in 1994–2019 (
Figure S3), but the trend of this parameter is not significant (
Table 1).
The climatic decrease in the thickness of the snow-ice cover should lead to a long-term increase in the under-ice illumination. A decrease in the thickness of snow on the ice surface is often considered to be a major factor in increase in under-ice irradiation [
7,
9]. The critical role of the snow cover for the limitation of under-ice irradiation, primary production and oxygen release was shown for a lake of the Mongolian Plateau [
12]. A significant inverse relationship between under-ice irradiation and snow depth in winter has been revealed for four lakes in Canada [
9].
The ongoing climate changes of Northwestern Russia in the winter months, namely, an increase in the number of thaw days and an increase in days with liquid and mixed precipitation in November–April (
Table 1), should contribute to a decrease in snow thickness. Indeed, there was often no snow at all when measurements were taken on Lake Vendyurskoe in spring (
Table 2).
Another important component of the snow-ice cover of lakes in the temperate zone is white ice, which forms in winter as a result of snowfall on the surface of black ice [
8]. Frequent thaws, alternating freeze–thaw cycles, and liquid or mixed precipitation also contribute to the formation of white ice and slush on the surface of black ice. White ice and slush are noticeably less transparent than black ice [
7,
8]. Therefore, formation of white ice and slush on the surface of black ice must have a limiting effect on under-ice irradiation. Some studies indicate that increased precipitation in winter, namely increased snowfall, inhibits the growth of black ice and contributes to the growth of white ice [
8,
27,
51].
For each year of measurements in 1994–2020, the ice cover of Lake Vendyurskoe included both white and black ice. In some spring periods white ice was thicker than black ice; from time to time, slush was observed on the surface of white ice. Thus, despite the noticeable climatic decrease in the thickness of the snow-ice cover of Lake Vendyurskoe in spring in 1994–2020, the increase of under-ice radiation may be smoothed out by changes in the ice structure (namely, an increase in the thickness of white ice and slush), which can occur due to an increase in air temperature and change of precipitation.
During the period of intense spring thawing, a rapid decrease in the thickness of snow and ice occurs. Measurements of under-ice radiation and the thickness of snow and ice, carried out over several days during intense melting, make it possible to trace how the under-ice radiation increases depending on the decrease in the thickness of snow and ice (
Figure 5). A joint analysis of the observational data on the thickness of snow, white and black ice, and under-ice radiation during the intensive spring thawing period showed that not only the complete disappearance of snow, but also a decrease in the thickness of white ice plays an important role in increasing under-ice radiation (see, for example, 1999, 2000, and 2004 in
Table S3).
Long-term measurements of oxygen at autonomous stations create unique opportunities for studying high-frequency DO variability, providing new knowledge of the processes occurring in ice-covered lakes, which can affect the rate of DO consumption or production [
9,
11,
12,
13,
16,
20,
22,
23,
39,
54,
55,
56,
57,
58].
We used data from long-term high-frequency DO measurements in 2007–2020, and measurements of under-ice irradiation and water temperature in 1994–2020, which allowed us to study the change in oxygen content over the winter and reveal the interannual variability of oxygen conditions in the lake in relation to changes in light, water temperature and ice.
We found that the strongest oxygen depletion during the winter season in Lake Vendyurskoe occurred in years with early ice-on and high bottom water temperature at the end of the winter season. This is due to earlier ice-on, longer ice period, and, hence, longer period of oxygen absorption. In addition, high water temperature promotes oxygen consumption near bottom sediments [
5,
6,
15]. Therefore, bottom-layer water temperature in a lake in winter can be an important predictor of the rate of oxygen consumption.
We saw an increase in oxygen content at the end of the winter season in all years of measurements (
Table 2). Since this increase occurred before the destruction of ice, it could not be associated with the resumption of gas exchange with the atmosphere. We assume that the most likely reason for this increase may be the release of oxygen as a result of photosynthesis of phytoplankton. Aquatic ecosystems can have high productivity in winter [
21,
30,
59,
60]; consequently, some increase in DO content due to photosynthesis of phytoplankton can be expected [
11,
12,
14].
Daily oscillations of oxygen in the surface layer of Lake Vendyurskoe in spring can be considered an indicator of the circadian rhythms of phytoplankton. Some studies argue that the circadian rhythms of oxygen presumably reflect the metabolism of the lake—a combination of production and destruction processes [
12,
22,
57]. On the other hand, oxygen fluctuations over a 24-h period, which were observed in the surface layers of the ice-covered Lake Valkea-Kotinen (Finland) during the development of spring under-ice convection, were attributed by the authors to diurnal changes in water temperature due to radiative heating [
56].
The greatest increase in the oxygen content in the lake occurred in years with an early onset and long duration of under-ice convection. The lowest values of C
t/C
0_
PLUS were observed in years with a short convection period. The positive relationships we found for the duration of convection and the date of its onset with the increase in oxygen at the end of winter have a logical basis, since during the spring under-ice convection favorable light, temperature and hydrodynamic conditions are formed for the development of phytoplankton [
9,
10,
11,
29] and, hence, for the release of oxygen.
The correlation revealed between the increase of oxygen and the number of days with thawing and with liquid or mixed precipitation reflects the relationship between snow-ice thickness and under-ice solar radiation, since the more days with a thaw, the smaller the snow-ice thickness. With thinner ice, more solar radiation penetrates under the ice, creating favorable conditions for the development of phytoplankton and the production of oxygen as a result of photosynthesis.
5. Conclusions
A warming of the regional climate of southern Karelia (Northwest Russia) in 1994–2020 expressed itself in an increase in air temperature and the number of days with a thaw, and days with liquid or mixed precipitation in winter months. These changes have had an impact on the ice regime of the small shallow Lake Vendyurskoe, as well as on thermal, light, and oxygen conditions in this lake in the ice-covered period.
The main features of the ice regime of the lake in the modern climatic conditions are a substantial variability of ice-on (5 weeks) and ice-off dates (3 weeks), intermittent ice cover at the beginning of winter, as well as a noticeable thinning of the snow-ice cover in spring (a significant trend) in 1994–2020 and a change of its structure (low snow thickness, increase in the proportion of white ice and slush formation in some years). The positive trends detected in the dates of ice-on and negative trends in the dates of ice-off according to field data and FLake model calculations are statistically insignificant.
A significant negative trend of snow-ice cover thickness in the 1994–2020 springs is shown. This gives us grounds to assume that the long-term trend of snow-ice cover thinning potentially prolongs the period with favorable conditions for the development of radiatively driven convection, which, in turn, creates favorable light, temperature and mixing settings for the growth of phytoplankton and the associated oxygen release. It should be noted that the changes in the structure of the snow-ice cover observed in some years (an increase in the proportion of white ice and slush), which can reduce its transparency, may neutralize the effect of its thinning on the growth of under-ice radiation and DO production.
The seasonal DO decrease in the lake in winter is determined by two factors influencing by regional climate changes: ice-on date, and bottom-layer water temperature. Peak DO consumption can exceed 50% during winters with early ice-on and higher bottom-layer water temperature. In contrast, late ice-on, intermittent ice cover in early winter, and low water temperature result in a wintertime DO decrease by to less than 40%. It can be predicted that the future climatic shift to later ice-on dates will entail a reduction in oxygen consumption in lakes in winter.
The increase in oxygen content in the lake at the end of the ice-covered period, which in Lake Vendyurskoe is most likely associated with photosynthesis of phytoplankton, is the most significant in years with early onset and prolonged convection. The duration of convection can be expected to increase in the future, creating favorable conditions for the development of under-ice plankton and improving oxygen conditions in lakes in winter.


 ,
, 


