
Study on Total Control of Total Nitrogen in the Laizhou Bay


1
Key Laboratory of Physical Oceanography, Ministry of Education of China, Ocean University of China, Qingdao 266100, China
2
College of Oceanic and Atmospheric Sciences, Ocean University of China, Qingdao 266100, China
3
Key Laboratory of Marine Environment and Ecology, Ministry of Education of China, Ocean University of China, Qingdao 266100, China
4
College of Environmental Science and Engineering, Ocean University of China, Qingdao 266100, China
*
Authors to whom correspondence should be addressed.
Water 2021, 13(17), 2439; https://doi.org/10.3390/w13172439
Submission received: 10 August 2021
/
Revised: 25 August 2021
/
Accepted: 2 September 2021
/
Published: 5 September 2021
(This article belongs to the Special Issue Pollution in Estuaries and Coastal Marine Waters)
Abstract
:Human activity imposes a stronger and increasing impact on the coastal environment by land-based discharge and run-off pollution inputs. Land-based total nitrogen (TN) pollution, as the main cause of eutrophication in the Laizhou Bay, China, should be controlled effectively. Based on a three-dimensional pollution transport model, 20 groups of allocation schemes were designed under the requirement that the allocations of three estuaries in the inner bay were adjusted properly, while the two estuaries in the outer bay, i.e., the Yellow River and the Jiehe River, were kept unchanged. The statistical results show that the area ratio of heavily polluted seawater to the entire Laizhou Bay reached the maximum (35.14%) when the load allocation of the Xiaoqinghe River accounted for a high proportion (65%), and the Yuhe River and the Jiaolaihe River accounted for 15% and 20%, respectively. Overall, the pollution levels of the Laizhou Bay were positively associated with the allocation of the Xiaoqinghe River. Reducing pollutant allocation in the Xiaoqinghe River contributed most to the improvement of the seawater quality of the entire Laizhou Bay, and it was followed by a reduction in the Yuhe River and the Jiaolaihe River.
1. Introduction
It is widely recognized that human activity has a strong influence on the marine and coastal environment [1,2,3]. The coastal watersheds are increasingly impacted by nutrient inputs and resultant eutrophication, which will lead to habitat degradation as well as marine economy and water quality problems [4]. Over the past few decades, a strong consensus has evolved among the scientific community that nitrogen is the primary cause of eutrophication in many coastal ecosystems [5]. Human activity has greatly increased nitrogen fluxes to the coast, with run-off and land-based discharges as the main paths [2,5].
In order to control eutrophication and improve the water quality in coastal watersheds, in the 1970s, scholars in Japan and United States began to study the total control method to carry out effective coastal discharge management [6,7]. The total control method is commonly used in the Total Maximum Daily Load (TMDL) in the United States. The 2010 Chesapeake Bay TMDL allocates loadings of nitrogen, phosphorus and sediment to sources and areas of the watershed contributing those pollutants to remove impairments for aquatic life in the bay’s tidal tributaries and embayments [8]. The nutrient TMDL was established in the Newport Bay/San Diego Creek watershed for the reduction in total nitrogen load allocations for both point and nonpoint sources [7].
The TMDL in the US has made remarkable achievements over the past few decades and more researchers in other countries have begun to carry out load allocation research with the total control method theory. Many scholars combined numerical models with mathematical programming methods and applied them to water quality management widely, which improved the efficiency greatly [9,10,11]. Deng et al. [12] transformed the total pollutant load allocation (TPLA) in the Bohai Sea in China into an optimization problem with regard to water quality constraints and used the Trial and Error Method (TEM) to improve the optimization efficiency. The results showed that approximately 90% of the total nitrogen (TN) load should be reduced, emphasizing the significance and urgency of the pollution control of TN in the Bohai Sea [12]. Su et al. [13] improved the traditional method and proposed a variable response matrix approach (VRMA) for simulation–optimization load allocation to calculate the total nitrogen allocation loads of 48 main dischargers in Shandong Province, a typical coastal province in China. Similarly, the study also showed the need for a reduction in land-based TN load in pollution control management of Shandong Province, especially the coastal region along the Bohai Sea.
All the above methods and studies are of great reference value for the related research on pollutant discharge management in coastal ecosystems. This paper studies the allocation scheme of pollutant discharge in the Laizhou Bay, a seriously nitrogen-polluted bay in China, by a three-dimensional pollution transport model. To some extent, it further enriches the research methods of land-based pollution management and provides reference for policymakers. The transport equations and data materials are introduced in Section 2. The numerical experiments of total control are carried out in Section 3, and thereafter Section 4 presents results and discussion. A conclusion is presented in Section 5.
2. Model and Materials
2.1. Study Area
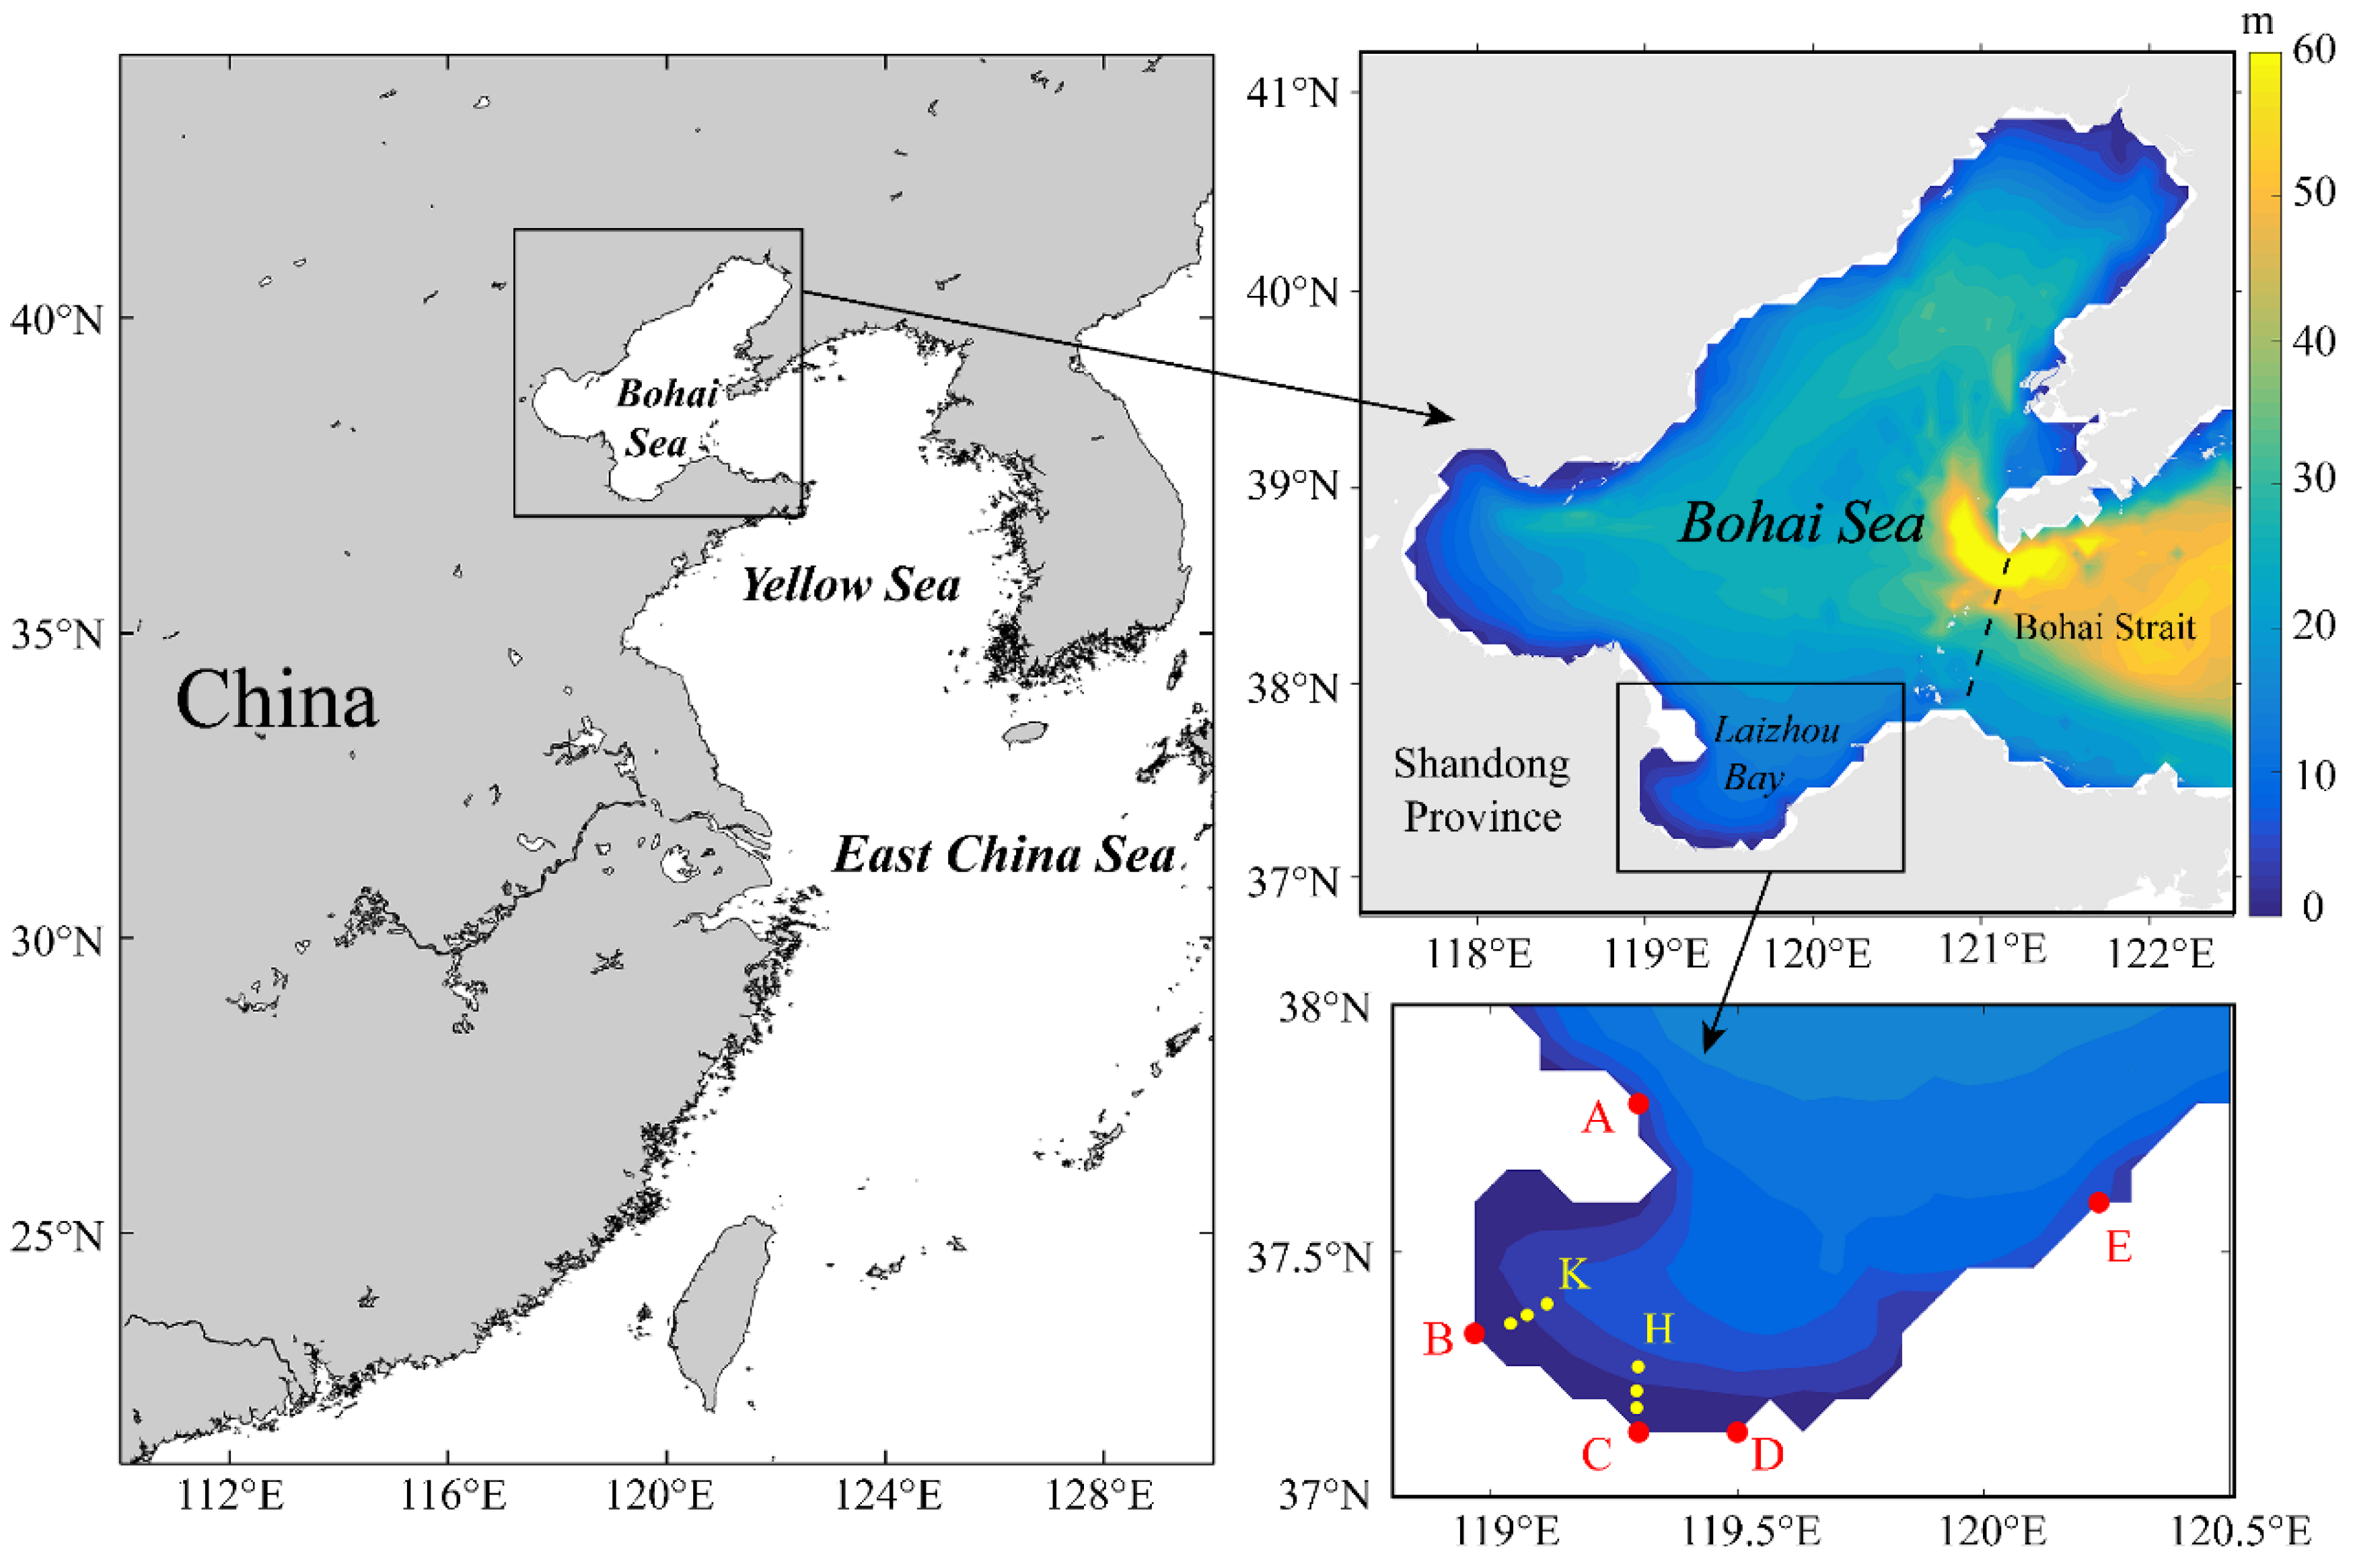
Located in the southern part of the Bohai Sea in China, the Laizhou Bay is a typical semi-enclosed continental shelf bay, and its ecosystem is fragile due to low exchange capacity (Figure 1) [14,15,16]. Land-based pollutants are the main pollution sources in the Bohai Sea, and river pollution accounts for the largest proportion [17]. Along the coast of the Laizhou Bay, the Yellow River, the Xiaoqinghe River and other rivers carry a large number of pollutants into the bay with obvious nitrogen imbalance [12,18,19,20]. The Laizhou Bay is an important fishing area in Shandong Province, which is a densely populated and rapidly developing region in China, and therefore, excessive amounts of nitrogen and resultant eutrophication have negatively affected the fishery economy and ecosystem [19,20]. The management of river pollutant discharge has been highly valued by the government of Shandong Province over the past few decades. Quantitative TN allocation schemes would be helpful to policymakers for the implementation of pollution control. Therefore, it is quite necessary to study the total control of TN in the Laizhou Bay.
2.2. Model
The equations of the pollution transport model can be written as follows:
where represents the concentration of pollution; and are horizontal and vertical eddy diffusivities, which are set as 100 m2/s and 10−5 m2/s, respectively; u, v, w is the velocity component in the direction of x, y, z, and r; is the degradation coefficient of pollution. When the pollution is a conservative substance, r = 0; otherwise, r ≠ 0. In this paper, we treat the pollution as a conservative substance, so r = 0. is the convection term and is the diffusion term.
The transport model has been used in previous studies and proven to be stable and reliable [21,22,23]. The region of the model is the Bohai Sea (37~41° N, 117.5~122.5° E). The horizontal resolution is 4′ × 4′, and there are 7 vertical layers. The integral time step is 1 h. The open boundary of the model is set at the Bohai Strait (121° E), where the non-gradient condition is used at the outflow boundary, and the constant condition at the inflow boundary:
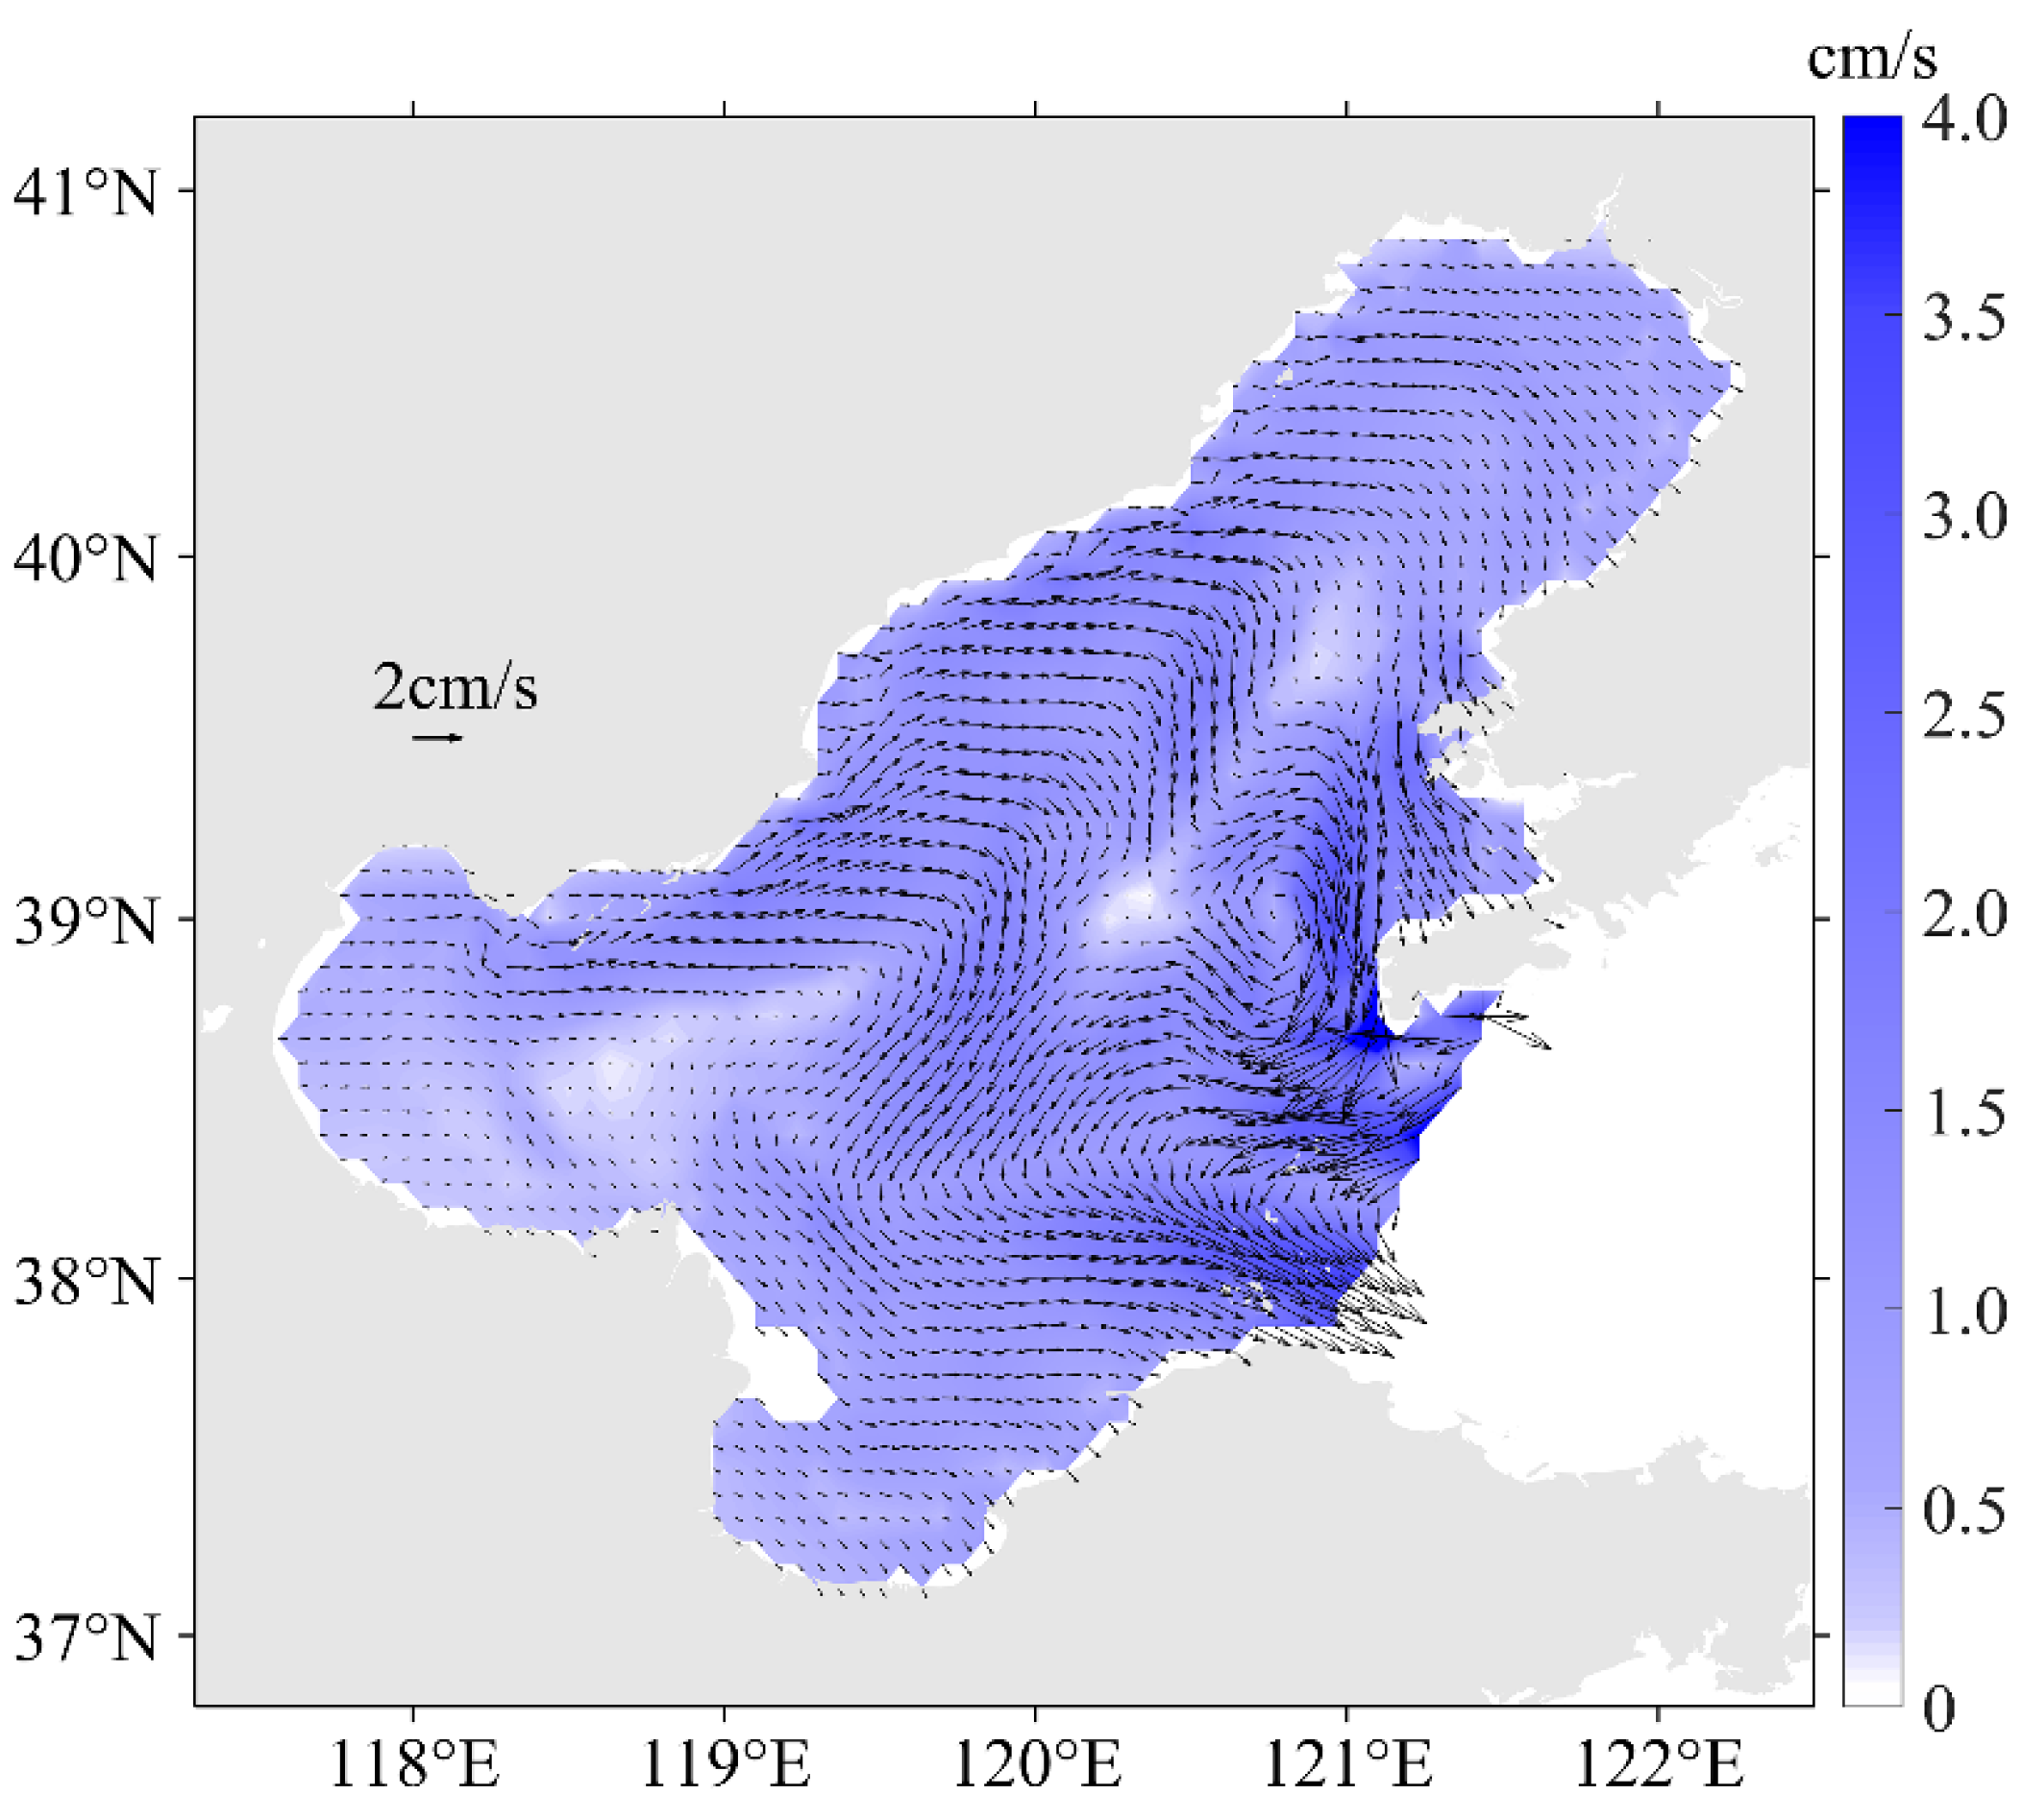
The current velocities are calculated by the three-dimensional Regional Ocean Model System (ROMS) and validated by former studies [21]. Monthly mean surface currents in the Bohai Sea in September are shown in Figure 2. Overall, there is a clockwise vortex in the east of the central Bohai Sea. The circulation in the Laizhou Bay is very weak, and there is an anticlockwise vortex in the mouth. Meanwhile, water flows out of the Bohai Sea through the south of the Bohai Strait and flows into the Bohai Sea through the north of the Bohai Strait.
2.3. Total Nitrogen
Total nitrogen (TN), discharged into the Laizhou Bay through five estuaries (Figure 1, the Yellow River, the Xiaoqinghe River, the Yuhe River, the Jiaolaihe River, and the Jiehe River) was considered in this paper as a point source. TN was the sum of nitrate–nitrogen (NO3-N), nitrite–nitrogen (NO2-N), ammonia–nitrogen (NH3-N) and organically bonded nitrogen. Here, we focused on the physical transport of TN with a simplified process in the model and all these forms of nitrogen were considered as a whole, which means the transition between these forms and the unquantified degradation caused by a biochemical process were not considered. Hence, we treated TN as a conservative substance ideally.
In the Laizhou Bay, except for the Yellow River and the Xiaoqinghe River, rivers were relatively smaller and seasonal, with few continuous data about the TN concentration. We collected relevant data from several studies and literature and found that there were relatively abundant measurements in September 2012. The mean values of the sampling sites at the estuaries of the Xiaoqinghe River (K-section, Figure 1) and the Yuhe River (H-section, Figure 1) were set as the concentration at these two estuaries, respectively [24]. The concentration of the sampling site at the tidal portion of the Jiaolaihe River was set [24]. The concentration of TN at the Yellow River estuary referred to the sampling station data from the Lijin station in the lower Yellow River [25]. The average value of the nearshore area (0.475 mg/L) was set as the concentration at the Jiehe River [26]. We set 0.38 mg/L as the initial field value of the TN concentration in the model [26]. More information is listed in Table 1.
The seawater quality standard for dissolved inorganic nitrogen (DIN) was set by the Ministry of Ecology and Environment (MEE) [27]. Zhang and Gao indicated that the ratio of DIN to TN was around 1.6 in the Laizhou Bay [24]. Hence, the seawater quality standard for DIN and TN can be obtained (Table 2).
3. Numerical Experiments of Total Control
3.1. Control Experiment
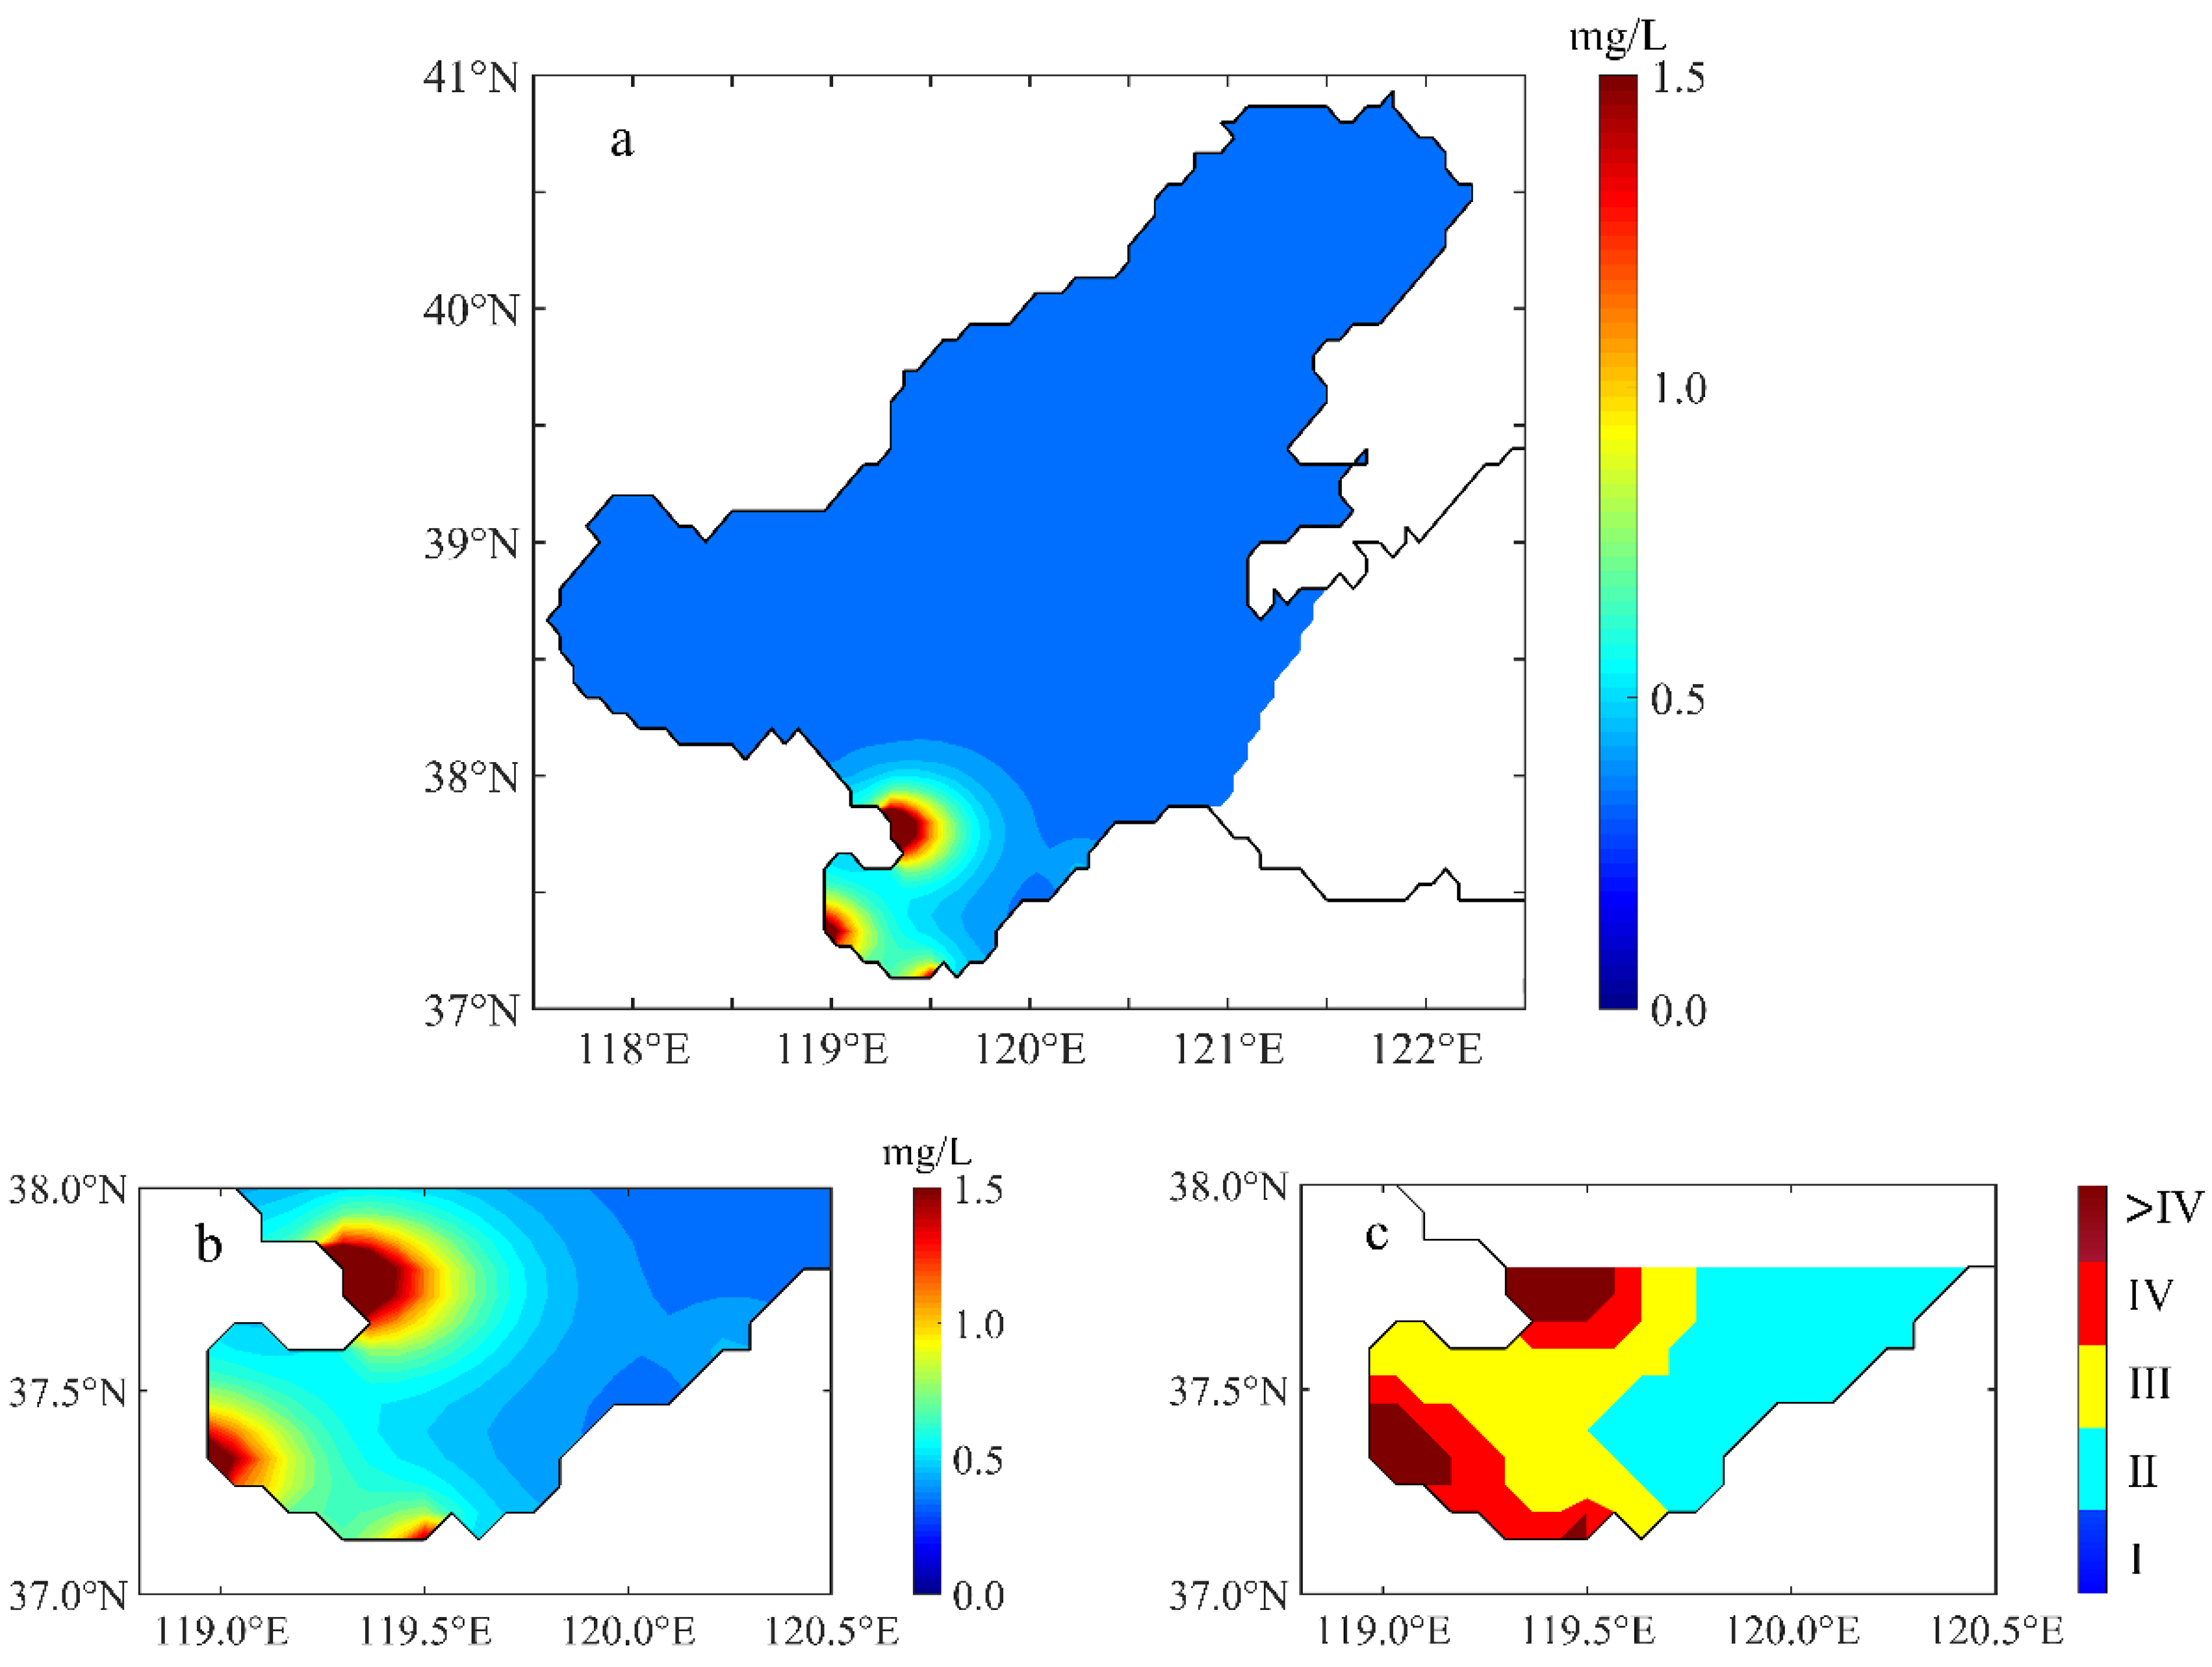
Based on the transport model, the distribution of TN from five selected estuaries in the Laizhou Bay in September was simulated (Figure 3). After one-month transport, the pollutant TN was mainly distributed in the estuaries area and the southwestern coast of the Laizhou Bay. The surface concentration in the west of the Laizhou Bay was higher than that in the eastern part. Some pollutants, mainly from the Yellow River, were transported out of the Laizhou Bay. Furthermore, the sea area of different quality grades was calculated and is shown in Table 3.
It can be found that surface seawater in the entire Laizhou Bay was not Grade I. The area proportion of the Grade II seawater was the largest: 39.25%. The ratio of the heavily polluted seawater (Grade IV and worse) to the entire Laizhou Bay reached 32.17%, which was close to the data (30%) reported by the State Oceanic Administration (SOA) [28]. The experimental results were basically consistent with the SOA report, indicating that our numerical simulation was reasonable and convincing.
3.2. Experiment Setting
The allocation of five estuaries in the control experiment (Section 3.1) was set as the initial allocation and the basic reference for adjustment in the following experiments. The total control schemes were mainly formulated in accordance with the following principles:
- The total amount of pollutants released from the five estuaries remained unchanged.
- The release of two estuaries in the outer bay, i.e., the Yellow River and the Jiehe River, were kept unchanged. The allocations of the three estuaries in the inner bay were adjusted and the sum of these three allocations should be 100% in order to keep the total amount conserved.
- According to the current pollution situation and relevant policies, the regulation of adjustment was set: the upper limit should not have exceeded 200% of the initial allocation, while the lower limit was 50%. Taking the Xiaoqinghe River as an example, the initial allocation was 48%, which means the allocation can be increased to a maximum of 96% and reduced to a minimum of 24%.
- Due to the discrepancy in proportion of the three rivers, the interval of the increment or decrement was not a constant and needed to be adjusted appropriately. Taking the Xiaoqinghe River as an example again, according to principle 3, the allocation could be increased to a maximum of 96%, but it would lead to the situation that the other two rivers were less than 50% of their initial allocation, respectively. Similar constraints existed throughout the process of the adjustment.
After several simulations and attempts, 20 groups of appropriate allocation schemes were developed for the experiments, as shown in Table 4. It should be mentioned that the initial allocation in the control experiment, illustrated in Section 3.1, was also listed in Table 4. For further explanation, in group 1, 70% of the total amount of the three estuaries was allocated to the Xiaoqinghe River, 10% to the Yuhe River and 20% to the Jiaolaihe River. The adjustment of each estuary fell in the range of 50% to 200%.
4. Results and Discussion
Based on the simulation of 20 groups, the area proportions of different seawater qualities were also calculated and statistically analyzed. In Figure 4, 20 experiments were ranked in order of the decreasing area proportions of the heavily polluted seawater (Grade IV and worse) to the entire Laizhou Bay.
The overall trend is that the less the pollutants allocated in the Xiaoqinghe River, the smaller the area’s proportion of the heavily polluted seawater would be. Yu et al. [29] indicated that the Xiaoqinghe River was the most important land-based source of nitrogen pollutants in the Laizhou Bay apart from the Yellow River, which was consistent with our results.
If allocation in the Xiaoqinghe River remained unchanged, it was better to reduce the pollutants allocation in the Yuhe River than in the Jiaolaihe River. In other words, pollutants discharged from the Xiaoqinghe River have the greatest influence on the seawater quality, followed by the Yuhe River, and then the Jiaolaihe River. When the amount of pollutant discharged from the Xiaoqinghe River was large, such as the 70% and 65% allocation in group 1 and group 18, even if the allocation of the Jiaolaihe River was greatly reduced (from 40% to 20%), the area of heavily polluted seawater still increased by 1.8% and 3%, respectively, which were the top two among all the groups.
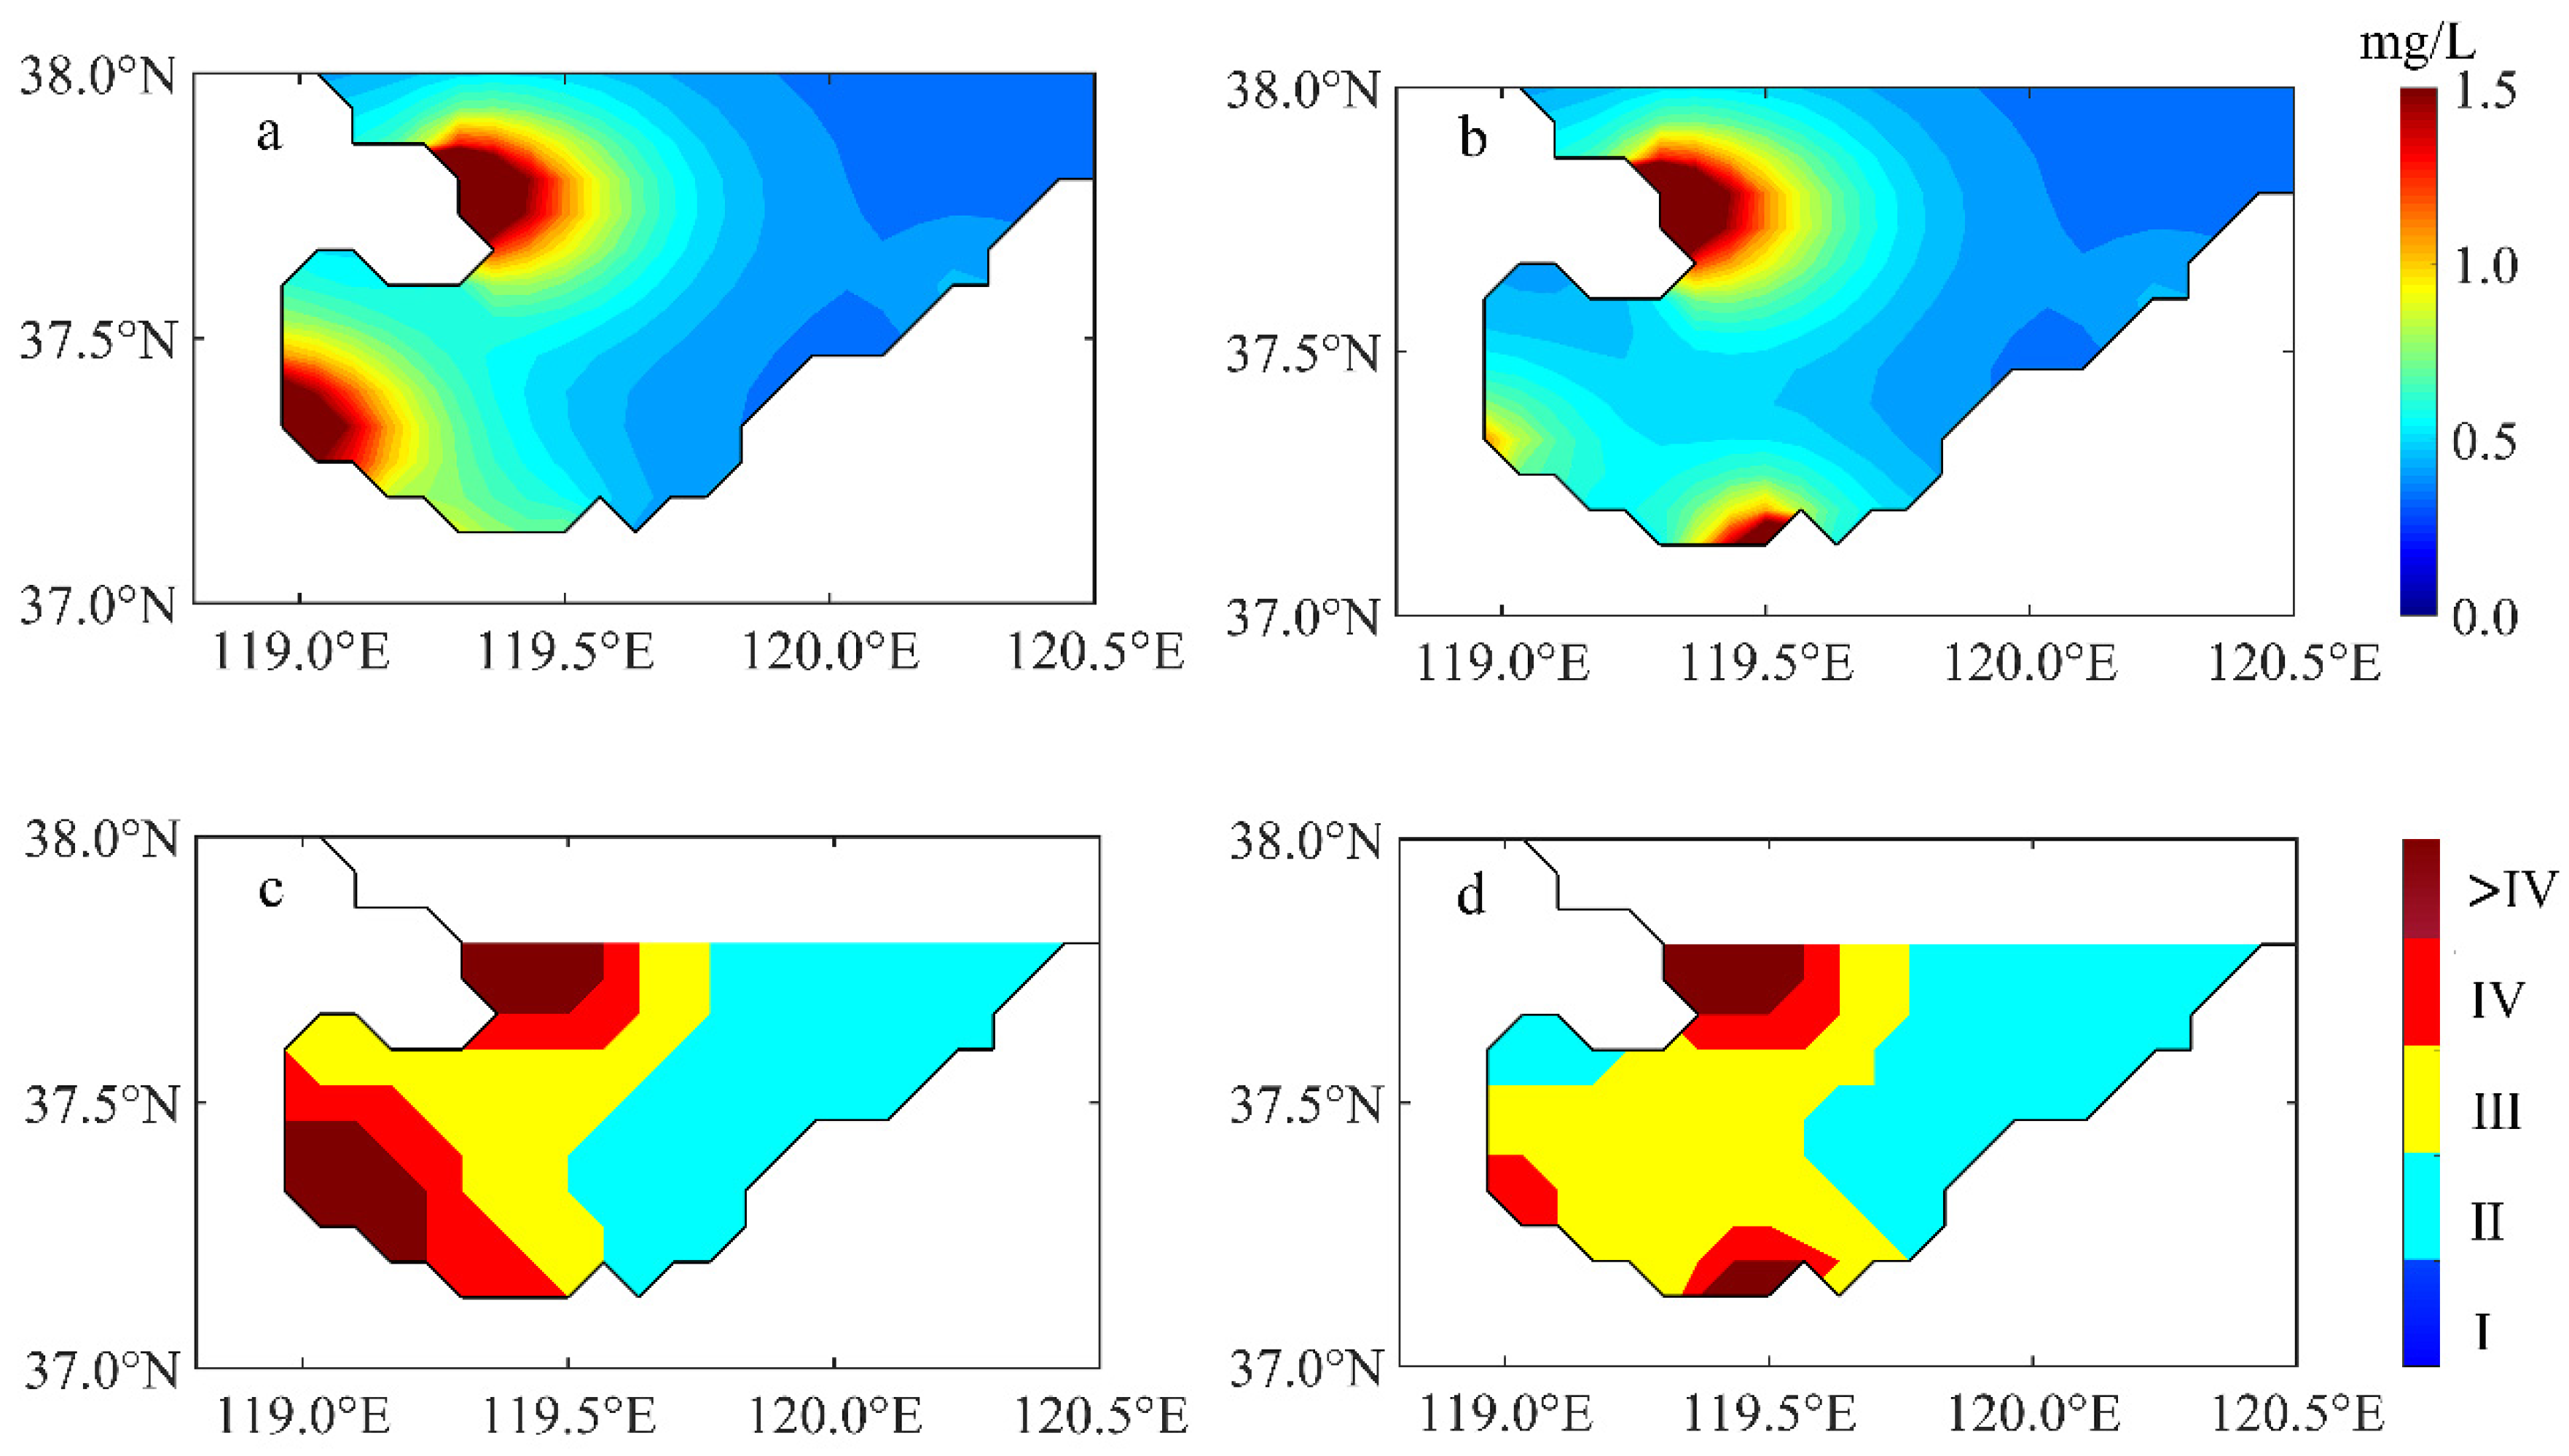
In group 18 (Figure 5a,c), the ratio of the heavily polluted seawater area to the entire Laizhou Bay reached the maximum, up to 35.14%. In this case, the pollutant allocations of the Xiaoqinghe River, the Yuhe River and the Jiaolaihe River were 65%, 15% and 20%, respectively. In group 8 (Figure 5b,d), while the Xiaoqinghe River accounted for the lowest proportion (25%) and the Jiaolaihe River accounted for the majority (65%), the area of heavily polluted seawater accounted for 22.62%, which was the smallest among all the experiments. Compared with the area ratio (32.17%) in the control experimental group, it was reduced by 10%, approximately.
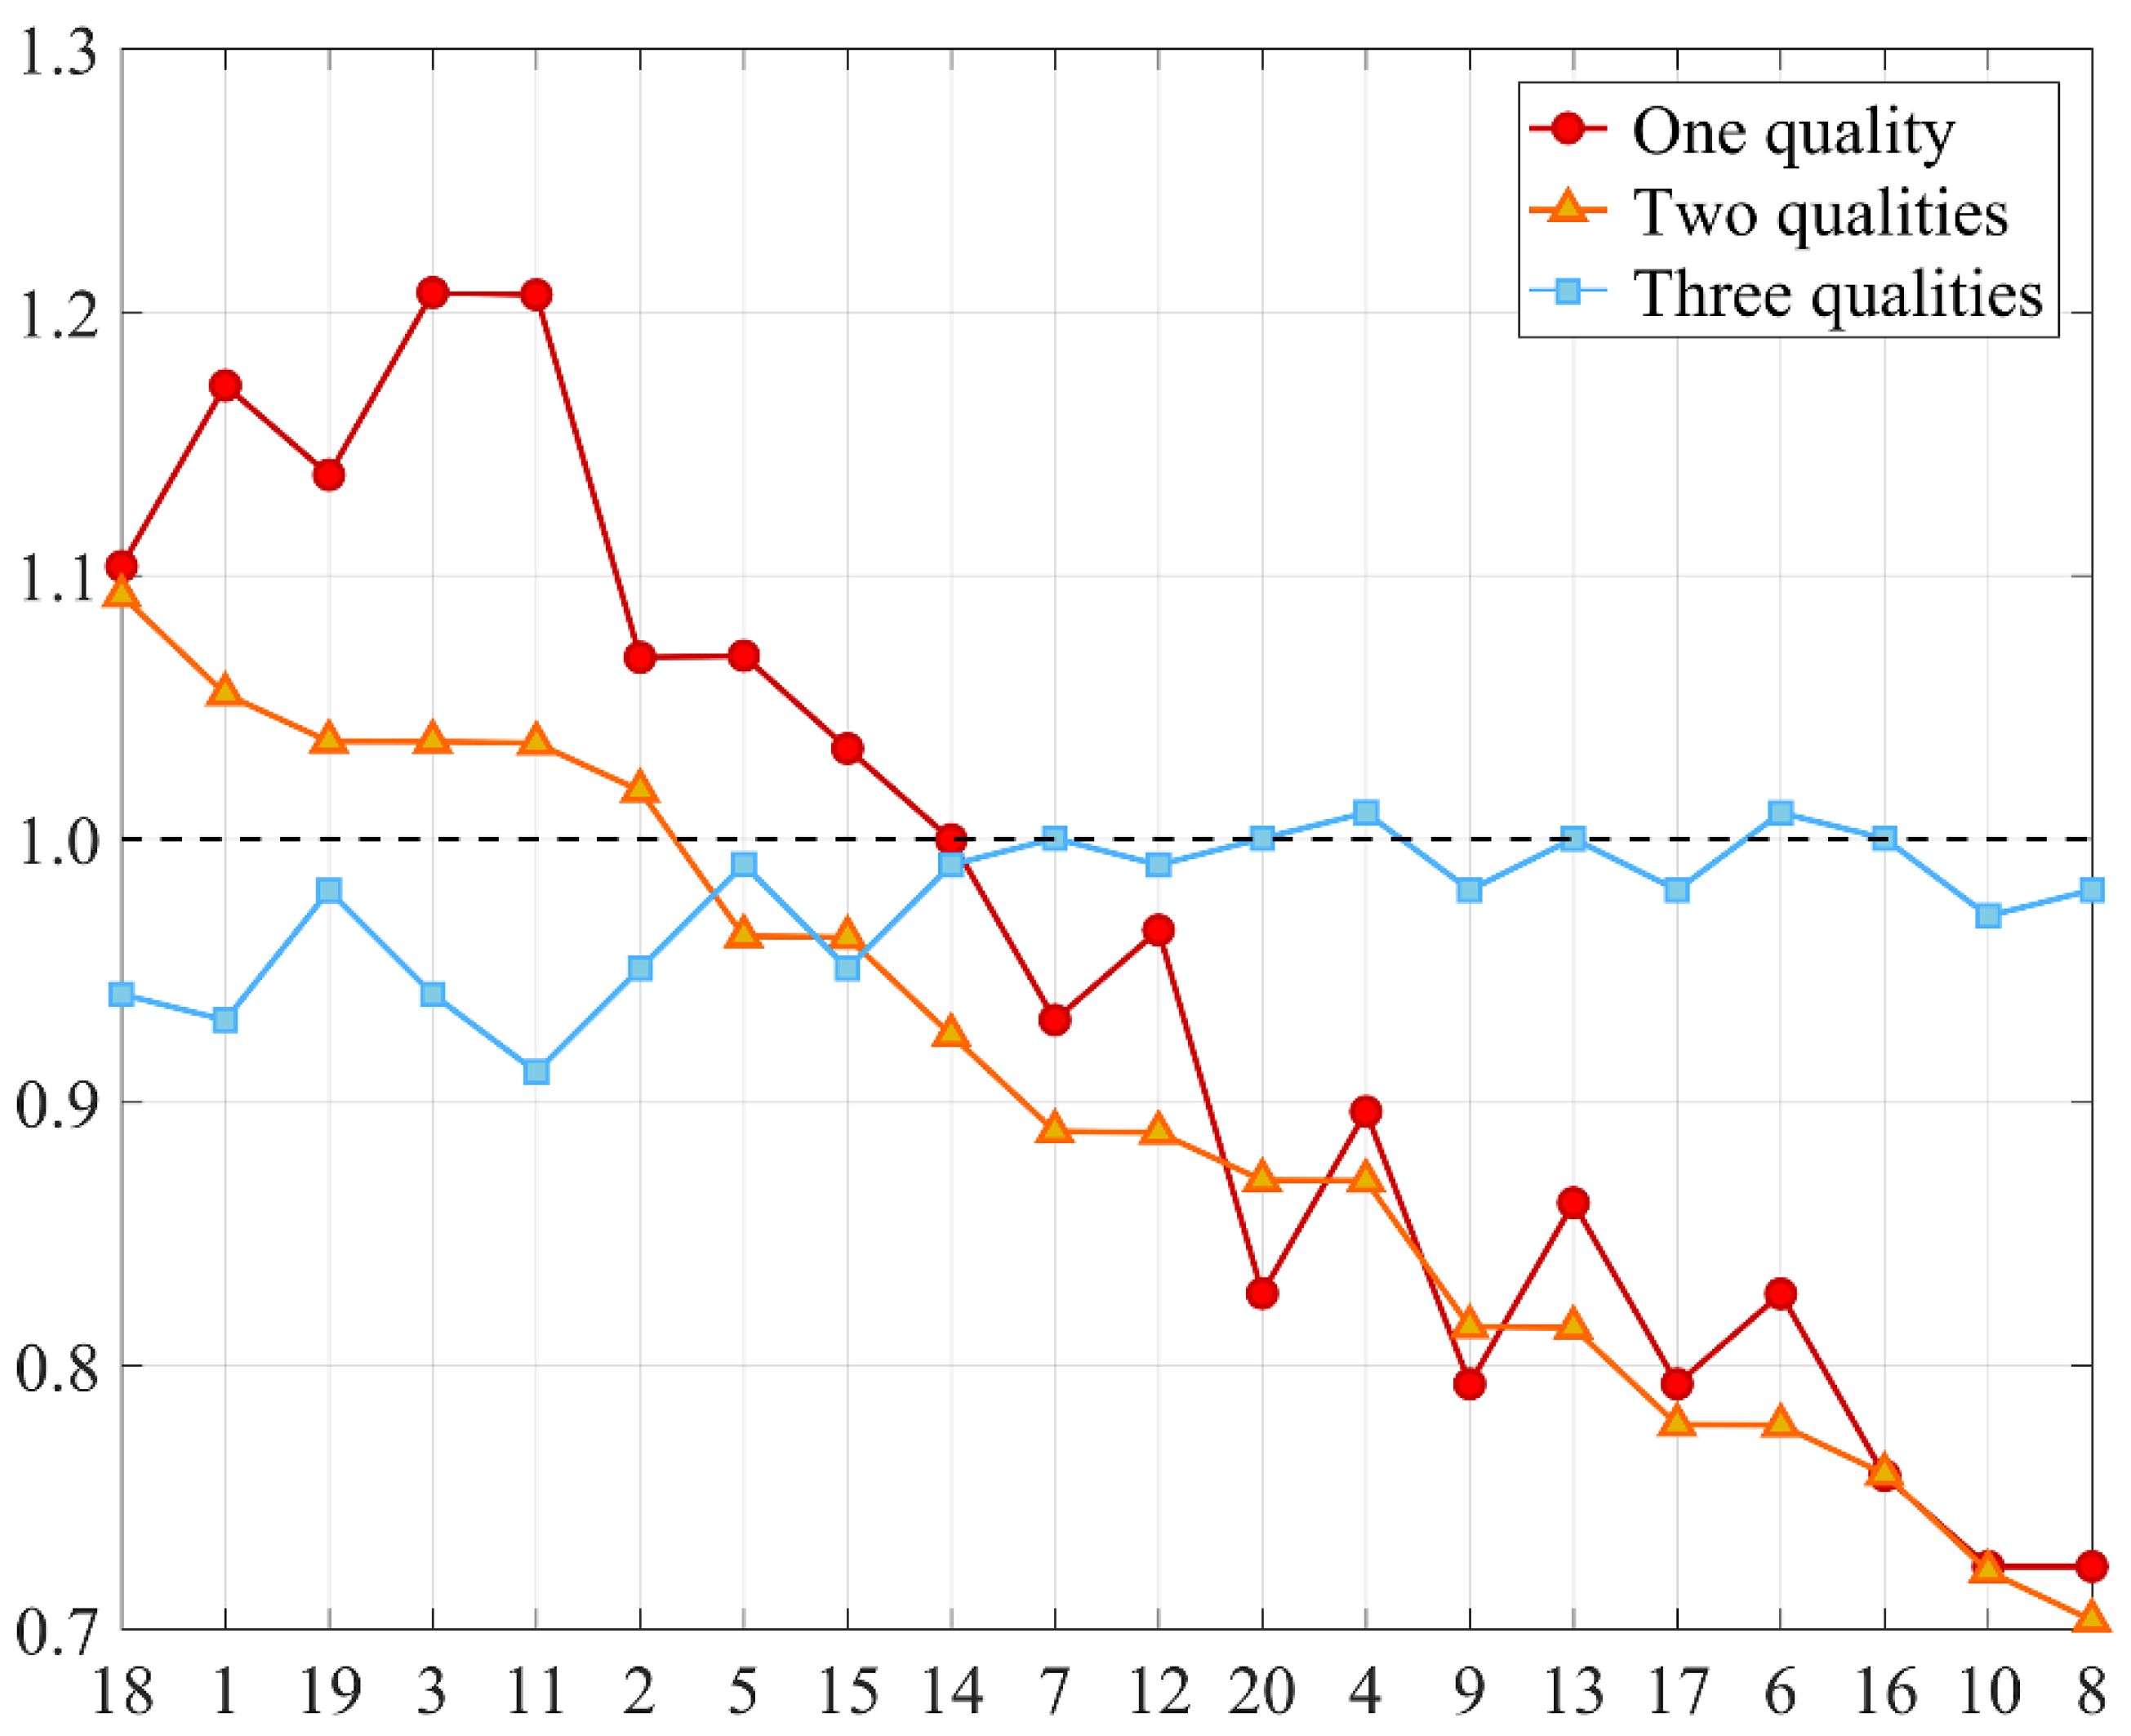
Then, we compared the area proportions of different seawater qualities in the 20 experiments with the control run (Figure 6). There was an obvious variation of the area proportion of the seawater that was worse than Grade IV (one quality), where the minimum appeared in group 8, and the maximum appeared in group 11 and group 3. The heavily polluted seawater (two qualities, Grade IV and worse than Grade IV) area proportion changed differently, where the minimum also appeared in group 8, while the maximum value appeared in group 18. In both cases, the allocation adjustment greatly affected the proportions, which gradually declined as the allocation of the Xiaoqinghe River was reduced. It can be also found that when the total allocation of the Xiaoqinghe River and the Yuhe River accounted for less than 70%, the red line and the orange line dropped to less than 1. When three seawater qualities (including Grade III, Grade IV, and worse than Grade IV) were considered as a whole, the ratio showed slight variation, fluctuating around the value of 1. In particular, the minimum value appeared in group 11, rather than in group 8. Additionally, when three lines were less than 1 at the same time, at least one of the Xiaoqinghe River and the Yuhe River reached the minimum allocation (25% and 6%, respectively). These results confirm the ranking of the three rivers in terms of influence on the seawater quality: the Xiaoqinghe River > the Yuhe River > the Jiaolaihe River.
Over the past decade, many scholars have studied the total control of TN in regard to the whole Bohai Sea, but few singled out the Laizhou Bay to study. Deng et al. [12] calculated the TN load allocation of 56 pollution sources around the whole Bohai Sea with a mathematical optimization method. In these 56 pollution sources, there were ten rivers located within the Laizhou Bay, including four rivers that were considered in our study. The optimized load allocation of the Xiaoqinghe River and the Yuhe River were 1.29% and 0.50%, respectively. The allocation ratio of these two rivers was 2.58, which was consistent with our results (2.50) in the best case, group 8. In addition, using a simulation–optimization approach, Su et al. [13] studied the TN load allocation of the Shandong Province from 48 pollution sources, including eight rivers in the Laizhou Bay. According to the results of the first method in the paper, the allocation load of the Xiaoqinghe River and the Jiaolaihe River were 752 and 1537 t/year, respectively, and the ratio was 48.93%, which was comparable to our results in group 8 (38.46%), in view of the difference in data sources, study area, etc. Dai et al. [11] calculated the total maximum allocated load of TN around the Bohai Rim by the optimization–simulation method, considering 59 pollution sources, with eight of them belonging to the rivers in the Laizhou Bay. From the results, it can be found that the actual TN load of the Xiaoqinghe River (537.55 t/year) was approximately twice that of the Yuhe River (273.00 t/year), which proved again that our allocation schemes in group 8 were reasonable and practical. It also indicated that the total maximum allocated load of the Jiaolaihe River can be increased substantially based on the actual load [11]. Our conclusion was confirmed by Dai’s study that the allocation of the Xiaoqinghe River should be reduced, and the Jiaolaihe River can take on more allocation appropriately.
In the case of group 8, the area of the heavily polluted seawater reached the minimum. Compared with the initial load (control group), the allocation load of the Xiaoqinghe River was nearly cut in half, a slight increase appeared in the Yuhe River, and the Jiaolaihe River showed a significant increase. The allocations of three rivers were consistent with both the former studies and the actual situation, which proved the rationality of our allocation schemes.
So far, most of the studies on total control in the coastal waters of China were carried out by using the complicated mathematical optimization method [10,11,12,13,30,31]. In this paper, we studied the total control of TN in the Laizhou Bay with a numerical pollution transport model. Our results echoed earlier research and the obtained quantitative allocation schemes were helpful for the management of pollution in the Laizhou Bay. It proved that the numerical method of transport simulation was effective and was also a good complement to other approaches in total control.
The government of Shandong Province published guidance for pollution control of the Laizhou Bay in June 2021. The document indicated that the river discharge of TN in the Laizhou Bay still needed to be controlled better [32]. Considering that the Laizhou Bay was surrounded by the region with high population growth and economic development, the implementation of discharge control would be of great importance. Thus, to some extent, our study provided a good reference for better control under the circumstances that the existing total amount of pollution remained unchanged. Further, it was also a helpful reference for the policymakers and implementers for determining the reduction and priority of each main river.
In addition, according to the document about marine function zoning in Shandong Province, the vast majority of the Laizhou Bay area belongs to fishery areas and marine protected areas, which require seawater quality to reach Grade II or above [33]. From our results (Figure 4 and Figure 6), the variation of the area meeting Grade II was not obvious, which meant that the allocation schemes with the invariable total amount of pollution was still not enough to meet the requirement of the marine function zoning. Thus, further studies about the total reduction schemes were needed. Preliminary experimental exploration shows that the numerical method of transport simulation can be considered as a reasonable and effective method to study the total control of pollution. More pollution sources can be considered in future research.
5. Conclusions
Excessive nitrogen inputs can result in severe pollution problems in coastal environments, such as eutrophication and the degradation of water quality. The Laizhou Bay is still one of the most seriously nitrogen-polluted bays in China, and better nitrogen control is an urgent need at present. In this paper, a three-dimensional pollutant transport model was used to simulate the discharge and transport of TN in the Laizhou Bay, considering five major rivers: the Yellow River, the Xiaoqinghe River, the Yuhe River, the Jiaolaihe River and the Jiehe River.
The area of different seawater quality in the Laizhou Bay was then calculated. The simulation results showed that the area of heavily polluted seawater accounts for 32.17%, which was in good agreement with the report issued by the SOA. To study the total control of TN, based on the numerical simulation, 20 allocation schemes were designed under the regulation that those three estuaries (the Xiaoqinghe River, the Yuhe River and the Jiaolaihe River) in the inner bay were adjusted from 50% to 200%, while the other two remained unchanged. The statistical results showed that the variation of sea areas reaching Grade II was slight. The area ratio of heavily polluted seawater to the entire Laizhou Bay area reached the maximum (35.14%) when the load allocations of the Xiaoqinghe River, the Yuhe River and the Jiaolaihe River were 65%, 15%, and 20%, respectively (group 18), while the minimum (22.62%) appeared with the allocation of 25%, 10%, and 65% (group 8).
The results verified that the Xiaoqinghe River was the most important land-based source of nitrogen pollution in the Laizhou Bay apart from the Yellow River. The pollution levels of the Laizhou Bay were positively associated with the allocation of the Xiaoqinghe River. On the whole, if the release of TN at the Yellow River and the Jiehe River remained unchanged, the area of the heavily polluted seawater in the Laizhou Bay was influenced mostly by pollutant allocation in the Xiaoqinghe River, followed by the Yuhe River, and then the Jiaolaihe River.
In this paper, based on the numerical simulation of pollutants transport, and using seawater quality grade as an indicator, the total control of TN in Laizhou Bay was studied, which was helpful to the policymakers and implementers for determining and implementing the schemes of the TN allocation discharge. Echoing former research, quantitative allocation schemes proved the effectiveness of the numerical method of transport simulation, which was also a good complement to other approaches in total control. The results also indicated the imperative necessity and priority of reduction in pollutants in the Xiaoqinghe River. Meanwhile, it laid a foundation for further research on the allocation schemes with the reduction in the total amount of pollutants.
Author Contributions
Conceptualization, X.M.; methodology, X.M.; software, H.P.; validation, X.M. and J.S.; formal analysis, H.P. and H.G.; investigation, J.S. and H.G.; data curation, H.G.; writing—original draft preparation, H.P.; writing—review and editing, X.M. and H.P.; supervision, X.L.; project administration, X.L. and J.S. All authors have read and agreed to the published version of the manuscript.
Funding
This paper was supported by the National Natural Science Foundation of China (U1806214, 41630966 and 41806219), the National key research and development program (2018YFC1407602 and 2019YFC1408405) and Innovation and Strengthen Project of Guangdong Province (2018KQNCX082).
Institutional Review Board Statement
Not applicable.
Informed Consent Statement
Not applicable.
Data Availability Statement
This study did not include any publicly available datasets.
Acknowledgments
The authors are grateful to all the group members for constant assistance and helpful advice.
Conflicts of Interest
The authors declare no conflict of interest.
References
- Freeman, L.A.; Corbett, D.R.; Fitzgerald, A.M.; Lemley, D.A.; Quigg, A.; Steppe, C.N. Impacts of Urbanization and Development on Estuarine Ecosystems and Water Quality. Estuaries Coasts 2019, 42, 1821–1838. [Google Scholar] [CrossRef]
- Jiang, Y.; Kirkman, H.; Hua, A. Megacity Development: Managing Impacts on Marine Environments. Ocean. Coast. Manag. 2001, 44, 293–318. [Google Scholar] [CrossRef]
- Cloern, J.E. Our Evolving Conceptual Model of the Coastal Eutrophication Problem. Mar. Ecol.-Prog. Ser. 2001, 210, 223–253. [Google Scholar] [CrossRef]
- Paerl, H.W.; Hall, N.S.; Peierls, B.L.; Rossignol, K.L. Evolving Paradigms and Challenges in Estuarine and Coastal Eutrophication Dynamics in a Culturally and Climatically Stressed World. Estuaries Coasts 2014, 37, 243–258. [Google Scholar] [CrossRef]
- Howarth, R.W.; Marino, R. Nitrogen as the Limiting Nutrient for Eutrophication in Coastal Marine Ecosystems: Evolving Views over Three Decades. Limnol. Oceanogr. 2006, 51, 364–376. [Google Scholar] [CrossRef] [Green Version]
- Tomita, A.; Nakura, Y.; Ishikawa, T. Review of Coastal Management Policy in Japan. J. Coast Conserv. 2015, 19, 393–404. [Google Scholar] [CrossRef]
- French, C.; Wu, L.; Meixner, T.; Haver, D.; Kabashima, J.; Jury, W.A. Modeling Nitrogen Transport in the Newport Bay/San Diego Creek Watershed of Southern California. Agric. Water Manag. 2006, 81, 199–215. [Google Scholar] [CrossRef]
- Linker, L.C.; Batiuk, R.A.; Shenk, G.W.; Cerco, C.F. Development of the Chesapeake Bay Watershed Total Maximum Daily Load Allocation. JAWRA J. Am. Water Resour. Assoc. 2013, 49, 986–1006. [Google Scholar] [CrossRef]
- Cho, J.H.; Ahn, K.H.; Chung, W.J.; Gwon, E.M. Waste Load Allocation for Water Quality Management of a Heavily Polluted River Using Linear Programming. Water Sci. Technol. 2003, 48, 185–190. [Google Scholar] [CrossRef]
- Liang, S.; Jia, H.; Yang, C.; Melching, C.; Yuan, Y. A Pollutant Load Hierarchical Allocation Method Integrated in an Environmental Capacity Management System for Zhushan Bay, Taihu Lake. Sci. Total Environ. 2015, 533, 223–237. [Google Scholar] [CrossRef]
- Dai, A.; Li, K.; Ding, D.; Li, Y.; Liang, S.; Li, Y.; Su, Y.; Wang, X. Total Maximum Allocated Load Calculation of Nitrogen Pollutants by Linking a 3D Biogeochemical–Hydrodynamic Model with a Programming Model in Bohai Sea. Cont. Shelf Res. 2015, 111, 197–210. [Google Scholar] [CrossRef]
- Deng, Y.; Lei, K.; Critto, A.; Qiao, F.; Li, Z.; Fu, G. Improving Optimization Efficiency for the Total Pollutant Load Allocation in Large Two-Dimensional Water Areas: Bohai Sea (China) Case Study. Mar. Pollut. Bull. 2017, 114, 269–276. [Google Scholar] [CrossRef] [PubMed]
- Su, Y.; Li, K.; Yang, B.; Liang, S.; Wang, X.; Bao, X.; Jiang, W.; Li, Y. Improving Land-Based Total Nitrogen Load Allocation Using a Variable Response Matrix-Based Simulation–Optimization Approach: A Case Study. Ecol. Indic. 2018, 91, 575–588. [Google Scholar] [CrossRef]
- Liu, H.; Yin, B. Numerical Investigation of Nutrient Limitations in the Bohai Sea. Mar. Environ. Res. 2010, 70, 308–317. [Google Scholar] [CrossRef] [Green Version]
- Shen, C.; Zheng, W.; Shi, H.; Ding, D.; Wang, Z. Assessment and Regulation of Ocean Health Based on Ecosystem Services: Case Study in the Laizhou Bay, China. Acta Oceanol. Sin. 2015, 34, 61–66. [Google Scholar] [CrossRef]
- Yu, L.; Yang, B.; Jiang, W.; Li, K. A Model Study on Dynamical Processes of Phytoplankton in Laizhou Bay. J. Ocean Univ. China 2014, 13, 23–31. [Google Scholar] [CrossRef]
- MEE (Ministry of Ecology and Environment of the People’s Republic of China). Report on the State of the Environment in China 2006–2016. Available online: http://english.mee.gov.cn/Resources/Reports/soe/ (accessed on 15 March 2021).
- Zhang, Z.; Zhu, M.; Wang, Z.; Wang, J. Monitoring and Managing Pollution Load in Bohai Sea, PR China. Ocean. Coast. Manag. 2006, 49, 706–716. [Google Scholar] [CrossRef]
- Zhuang, W.; Gao, X.; Zhang, Y.; Xing, Q.; Tosi, L.; Qin, S. Geochemical Characteristics of Phosphorus in Surface Sediments of Two Major Chinese Mariculture Areas: The Laizhou Bay and the Coastal Waters of the Zhangzi Island. Mar. Pollut. Bull. 2014, 83, 343–351. [Google Scholar] [CrossRef]
- Jiang, H.; Liu, D.; Song, X.; Ma, Y.; Wang, Y.; Liu, A.; Cheng, L.; He, J.; Sun, S. Response of Phytoplankton Assemblages to Nitrogen Reduction in the Laizhou Bay, China. Mar. Pollut. Bull. 2018, 136, 524–532. [Google Scholar] [CrossRef]
- Wang, C.; Li, X.; Lv, X. Numerical Study on Initial Field of Pollution in the Bohai Sea with an Adjoint Method. Math. Probl. Eng. 2013, 2013, 104591. [Google Scholar] [CrossRef] [Green Version]
- Zheng, Q.; Li, X.; Lv, X. Application of Dynamically Constrained Interpolation Methodology to the Surface Nitrogen Concentration in the Bohai Sea. Int. J. Environ. Res. Public Health 2019, 16, 2400. [Google Scholar] [CrossRef] [PubMed] [Green Version]
- Li, X.; Zheng, Q.; Lv, X. Application of the Spline Interpolation in Simulating the Distribution of Phytoplankton in a Marine NPZD Type Ecosystem Model. Int. J. Environ. Res. Public Health 2019, 16, 2664. [Google Scholar] [CrossRef] [Green Version]
- Zhang, J.; Gao, X. Nutrient Distribution and Structure Affect the Acidification of Eutrophic Ocean Margins: A Case Study in Southwestern Coast of the Laizhou Bay, China. Mar. Pollut. Bull. 2016, 111, 295–304. [Google Scholar] [CrossRef] [PubMed]
- Wu, N.; Liu, S.M.; Zhang, G.L. Impact of Water-Sediment Regulation and Rainstorm Events on Nutrient Transports in the Lower Huanghe River. Haiyang Xuebao 2017, 39, 114–128. (In Chinese) [Google Scholar] [CrossRef]
- Sheng, Y.; Sun, Q.; Shi, W.; Bottrell, S.; Mortimer, R. Geochemistry of Reduced Inorganic Sulfur, Reactive Iron, and Organic Carbon in Fluvial and Marine Surface Sediment in the Laizhou Bay Region, China. Environ. Earth Sci. 2015, 74, 1151–1160. [Google Scholar] [CrossRef]
- MEE (Ministry of Ecology and Environment of the People’s Republic of China). Sea Water Quality Standard (GB 3097-1997). Available online: http://www.mee.gov.cn/ywgz/fgbz/bz/bzwb/shjbh/shjzlbz/199807/t19980701_66499.shtml (accessed on 15 March 2021). (In Chinese)
- China Oceanic Information Network. Bulletin of China Marine Environmental Status 2012. Available online: http://www.nmdis.org.cn/c/2013-04-01/56998.shtml (accessed on 15 March 2021). (In Chinese).
- Yu, S.-X.; Pang, Y.-L.; Wang, Y.-C.; Li, J.-L.; Qin, S. Spatial Variation of Microbial Communities in Sediments along the Environmental Gradients from Xiaoqing River to Laizhou Bay. Mar. Pollut. Bull. 2017, 120, 90–98. [Google Scholar] [CrossRef] [PubMed]
- Ge, M.; Wu, F.-P.; You, M. A Provincial Initial Water Rights Incentive Allocation Model with Total Pollutant Discharge Control. Water 2016, 13, 525. [Google Scholar] [CrossRef] [Green Version]
- Zhang, B.; Liu, H.; Yu, Q.; Bi, J. Equity-Based Optimisation of Regional Water Pollutant Discharge Amount Allocation: A Case Study in the Tai Lake Basin. J. Environ. Plan. Manag. 2012, 55, 885–900. [Google Scholar] [CrossRef]
- People’s Government of Shandong Province. Guidelines for Pollution Control in Laizhou Bay. Available online: http://www.shandong.gov.cn/art/2021/6/2/art_107851_112599.html (accessed on 20 August 2021). (In Chinese)
- Department of Ecology and Environment in Shandong Province. Environmental Function Regionalization of Coastal Waters in Shandong Province. Available online: http://lyc.sdein.gov.cn/dtxx/201605/t20160529_716079.html (accessed on 20 August 2021). (In Chinese)
Figure 1.
Map of Laizhou Bay showing 5 estuaries and sampling sites (A: Yellow River, B: Xiaoqinghe River, C: Yuhe River, D: Jiaolaihe River, E: Jiehe River; yellow dots represent K-section and H-section of sampling sites, respectively).
Figure 1.
Map of Laizhou Bay showing 5 estuaries and sampling sites (A: Yellow River, B: Xiaoqinghe River, C: Yuhe River, D: Jiaolaihe River, E: Jiehe River; yellow dots represent K-section and H-section of sampling sites, respectively).

Figure 2.
Monthly mean horizontal currents in the surface layer of the Bohai Sea in September.

Figure 3.
Surface distribution of TN in the Bohai Sea (a) and Laizhou Bay (b) and distribution of seawater of different quality levels in the Laizhou Bay (c).
Figure 3.
Surface distribution of TN in the Bohai Sea (a) and Laizhou Bay (b) and distribution of seawater of different quality levels in the Laizhou Bay (c).

Figure 4.
Bar chart of area proportion of different seawater quality in both control and 20 allocation experiments. (Worse than Grade IV (red), Grade IV (orange), Grade III (yellow) and Grade II (green)).
Figure 4.
Bar chart of area proportion of different seawater quality in both control and 20 allocation experiments. (Worse than Grade IV (red), Grade IV (orange), Grade III (yellow) and Grade II (green)).

Figure 5.
Similar to Figure 3b,c, but for group 18 (left) and group 8 (right).
Figure 5.
Similar to Figure 3b,c, but for group 18 (left) and group 8 (right).

Figure 6.
The variation of the area ratio of different seawater quality to the corresponding value in the control experiment. (One quality: worse than Grade IV, Two qualities: Grade IV and worse than Grade IV, Three qualities: Grade III, Grade IV and worse than Grade IV).
Figure 6.
The variation of the area ratio of different seawater quality to the corresponding value in the control experiment. (One quality: worse than Grade IV, Two qualities: Grade IV and worse than Grade IV, Three qualities: Grade III, Grade IV and worse than Grade IV).


Table 1.
Concentration value setting at the estuaries.
| Longitude (°) | Latitude (°) | Concentration (mg/L) | |
|---|---|---|---|
| Yellow River | 119.3131 | 37.7923 | 3.3964 |
| Xiaoqinghe River | 118.9905 | 37.2968 | 2.2009 |
| Yuhe River | 119.2549 | 37.0933 | 0.7084 |
| Jiaolaihe River | 119.5570 | 37.0941 | 1.5011 |
| Jiehe River | 120.2423 | 37.5547 | 0.4750 |
Table 2.
Seawater quality standard for DIN and TN.
| Grade | I | II | III | IV |
|---|---|---|---|---|
| DIN (mg/L) | 0.20 | 0.30 | 0.40 | 0.50 |
| TN (mg/L) | 0.32 | 0.48 | 0.64 | 0.80 |
Table 3.
The area proportions of each seawater quality standard grade.
| I | II | III | IV | >IV |
|---|---|---|---|---|
| 0.0000% | 39.25% | 28.58% | 14.90% | 17.27% |
Table 4.
Experimental schemes of pollutant allocation.
| Xiaoqinghe River | Yuhe River | Jiaolaihe River | |
|---|---|---|---|
| Ctrl | 48.00% | 12.00% | 40.00% |
| 1 | 70.00% | 10.00% | 20.00% |
| 2 | 60.00% | 10.00% | 30.00% |
| 3 | 60.00% | 20.00% | 20.00% |
| 4 | 40.00% | 10.00% | 50.00% |
| 5 | 40.00% | 20.00% | 40.00% |
| 6 | 30.00% | 10.00% | 60.00% |
| 7 | 30.00% | 20.00% | 50.00% |
| 8 | 25.00% | 10.00% | 65.00% |
| 9 | 25.00% | 20.00% | 55.00% |
| 10 | 25.00% | 6.00% | 69.00% |
| 11 | 74.00% | 6.00% | 20.00% |
| 12 | 47.00% | 6.00% | 47.00% |
| 13 | 40.00% | 6.00% | 54.00% |
| 14 | 54.00% | 6.00% | 40.00% |
| 15 | 60.00% | 6.00% | 34.00% |
| 16 | 34.00% | 6.00% | 60.00% |
| 17 | 25.00% | 15.00% | 60.00% |
| 18 | 65.00% | 15.00% | 20.00% |
| 19 | 55.00% | 15.00% | 30.00% |
| 20 | 30.00% | 15.00% | 55.00% |
Publisher’s Note: MDPI stays neutral with regard to jurisdictional claims in published maps and institutional affiliations. |
© 2021 by the authors. Licensee MDPI, Basel, Switzerland. This article is an open access article distributed under the terms and conditions of the Creative Commons Attribution (CC BY) license (https://creativecommons.org/licenses/by/4.0/).
Share and Cite
MDPI and ACS Style
Peng, H.; Geng, H.; Mao, X.; Shi, J.; Lv, X. Study on Total Control of Total Nitrogen in the Laizhou Bay. Water 2021, 13, 2439. https://doi.org/10.3390/w13172439
AMA Style
Peng H, Geng H, Mao X, Shi J, Lv X. Study on Total Control of Total Nitrogen in the Laizhou Bay. Water. 2021; 13(17):2439. https://doi.org/10.3390/w13172439
Chicago/Turabian StylePeng, Haohong, Haoyi Geng, Xinyan Mao, Jie Shi, and Xianqing Lv. 2021. "Study on Total Control of Total Nitrogen in the Laizhou Bay" Water 13, no. 17: 2439. https://doi.org/10.3390/w13172439
Note that from the first issue of 2016, this journal uses article numbers instead of page numbers. See further details here.