Article

Inland and Coastal Bathing Water Quality in the Last Decade (2011–2020): Croatia vs. Region vs. EU

1
Laboratory of Microbiology, Institute of Oceanography and Fisheries, P.O. Box 500, 21000 Split, Croatia
2
Faculty of Medicine, University of Rijeka, Braće Branchetta 20, 51000 Rijeka, Croatia
3
Teaching Institute of Public Health of Primorje-Gorski Kotar County, Krešimirova 52a, 51000 Rijeka, Croatia
4
Faculty of Health Studies, University of Rijeka, Viktora Cara Emina 5, 51000 Rijeka, Croatia
5
Institute for Public Health of The Federation of Bosnia and Herzegovina, Tahtali Sokak 17, 71000 Sarajevo, Bosnia and Herzegovina
6
Faculty of Health Studies, University of Sarajevo, Stjepana Tomića 1, 71000 Sarajevo, Bosnia and Herzegovina
7
Institute for Public Health of Canton Sarajevo, Mustafe Pintola 1, Ilidža, 71000 Sarajevo, Bosnia and Herzegovina
8
Division for Marine and Environmental Research, Ruder Bošković Institute, Bijenička Cesta 54, 10000 Zagreb, Croatia
9
Center for Marine Research, Ruđer Bošković Institute, Giordano Paliaga 5, 52210 Rovinj, Croatia
*
Authors to whom correspondence should be addressed.
S.J. and V.B. equally contributed to work (both first authors).
Water 2021, 13(17), 2440; https://doi.org/10.3390/w13172440
Submission received: 15 August 2021 / Revised: 29 August 2021 / Accepted: 31 August 2021 / Published: 5 September 2021
(This article belongs to the Special Issue Healthy Recreational Waters: Sanitation and Safety Issues)

Abstract

:
Europe is one of the leading tourist destinations where tourism is one of the key economic sectors. The quality of bathing waters is a very important factor when choosing a vacation destination. Croatia recognized this early and was one of the first Mediterranean countries to start systematic monitoring of bathing waters. On the other hand, monitoring of inland bathing waters is relatively new and includes a much smaller number of sites (41) compared to coastal waters (894). The aim of this paper was to summarize and analyze the water quality of inland and coastal bathing sites of Croatia, closer regions (non-EU Member States) and in the EU for the last decade. The share of excellent water quality in EU Member States increased by 10.1% and 6.6% for inland and coastal waters, respectively (2011–2020). Germany recorded the highest proportion of excellent water quality for inland waters (92.2%) and Cyprus for coastal waters (99.3%). Looking at the 10-year average of the proportion of bathing waters with excellent quality, the proportion of coastal bathing sites exceeds that of inland waters by 7.1%. It is clear that additional efforts should be made to improve the management and monitoring of inland waters.

1. Introduction

Bathing water management in the European Union (EU) is regulated by Bathing Water Directive (BWD) 2006/7/EC [1]. The first Directive came into force in 1976 (76/160/EEC) [2] and set the standards for designated bathing waters to be met by all EU Member States. Its main objective was to safeguard public health and protect the aquatic environment in coastal and inland areas from pollution. The Directive was repealed in 2006 by the new, revised BWD 2006/7/EC [1]. The purpose of the new BWD is to preserve, protect and improve the quality of the environment and to protect human health. It lays down provisions for the monitoring and classification of bathing water quality, the management of bathing water quality and the procedures for informing the public about bathing water quality. All Member States were required to transpose the revised BWD into national law by 2008, with full implementation due by December 2014.
The new BWD has updated the measures of the previous Directive and simplified the management and surveillance methods. It also provides a more proactive approach to informing the public about water quality using four quality categories for bathing waters: ‘poor’, ‘sufficient’, ‘good’ and ‘excellent’ (EEA, 2005) [3]. One of the most important changes in the revised BWD is that the number of physical, chemical and microbiological parameters for water quality assessment has been limited to only two microbiological parameters, Escherichia coli and intestinal enterococci. In general, E. coli has been considered a better predictor of illness in bathers using freshwater, while enterococci have been considered a better predictor in bathers using seawater [4,5]. However, numerous studies have shown that these bacterial indicators do not provide adequate evidence of viral (adenoviruses, noroviruses) and protozoal (Cryptosporidium, Giardia) contamination of recreational water [6,7,8,9]. Although data show that a large number of recreational illnesses are viral in origin, viral indicators (coliphages) or pathogens have not yet been included in the proposal for a new Directive, due to the complexity of the methods. Other microbiological indicators or pathogens, such as Clostridium perfringens, Pseudomonas aeruginosa, Staphylococcus aureus, Bacteroidales, Salmonella and Vibrio, have also been widely considered as potential additional indicators of pollution of an aquatic environment [6,7,8,9,10].
Bathing Water Directive (2006/7/ EC) [1] prescribes two reference methods for each fecal indicator bacteria. For enumeration of Escherichia coli, ISO 9308-1 and ISO 9308-3 [11,12], and for intestinal enterococci, ISO 7899-1 and ISO 7899-2 [13,14], respectively, were specified. The ISO 9308-1:2014 method includes only drinking water (with low background bacterial flora) in its scope, thus questioning the use of this method for monitoring bathing water quality (with potentially higher background bacterial flora) [15,16]. Therefore, the use of this method for monitoring bathing water quality has certain limitations. However, Member States may use alternative methods if they demonstrate equivalence with the reference methods. Croatia has made use of this option in the case of E. coli, which since 2018 has been determined using the temperature-modified method ISO-9308-1 [15,17]. Finland has also demonstrated the equivalence of the alternative Colilert-18 Quanti-Tray (ISO 9308-2) [18] with reference method ISO 9308-3 [19].
The BWD set minimum criteria for bathing water categories based on indicator bacteria levels, but Member States were free to set more stringent criteria. This may have led to inconsistent bathing water quality assessments across the EU for the same levels of indicator bacteria.
In addition, BWD introduces a new procedure for assessing bathing water quality. The assessment shall be carried out: in relation to each bathing water site (assessment after each sampling), after the end of each bathing season (annual assessment) and on the basis of the set of bathing water quality data compiled in relation to that particular bathing season and the three previous bathing seasons (final assessment). However, a Member State may decide to carry out the bathing water quality assessment only on the basis of the set of bathing water quality data compiled for the three previous bathing seasons. The datasets used for bathing water assessment of bathing water quality always include at least 16 samples, or 12 samples if a bathing water is located in a region subject to specific geographical constraints (BWD 2006/7/EC) [1]. The BWD does not specify the frequency of sampling (e.g., biweekly, fortnightly, monthly), only the number of samples per bathing season. As the length of the bathing season varies greatly among Member States, ranging from two months in Sweden to six months in Cyprus (EEA, 2016) [20], it is clear that Member States can collect very different amounts of data for the same period and with the same sampling frequency. This can affect the final assessment as a small amount of data can lead to misclassification of bathing sites (WHO, 2003, 2018) [21].
The new BWD also requires Member States to report to the EU Commission the results of monitoring and assessment of bathing water quality for each bathing water and a description of the main management measures. The Commission publishes an annual summary report on bathing water quality in the Community, including bathing water classification, compliance with the BWD and key management measures undertaken (BWD 2006/7/EC) [1].
Coastal bathing water quality has been continuously analyzed in Croatia since 1989, and the country was one of the first Mediterranean countries to introduce an official monitoring program. Inland bathing water quality has been monitored since 2011. Croatia is the only EU Member State that has implemented the new BWD through two different national legislations: The Regulation On Sea Bathing Water Quality (OG, 2008) [22] for coastal waters and The Regulation On Bathing Water Quality (OG, 2014) [23] for inland waters. Monitoring of coastal bathing waters has been carried out in Croatia since 2009 under a new regulation, while monitoring of inland waters has been carried out since 2011.
Croatia is located in the southeastern region of Europe. It borders three countries that are not EU members and have not implemented the EU BWD: Bosnia and Herzegovina, Serbia and Montenegro. This complicates the implementation of Article 10 of the BWD, which requires Member States to cooperate on transboundary waters, including appropriate information exchange and joint measures to control transboundary impacts on river water quality.
For inland waters, Croatia has set the same values for bathing water quality criteria as recommended in the BWD. However, for coastal bathing water categories, much stricter criteria were set, focusing on E. coli levels. This decision was based on the results of 20 years of monitoring of coastal bathing waters. This was also the result of the desire to highlight the high quality of bathing waters along the entire coast of the Croatian Adriatic and to encourage more people to enjoy particularly clean water and the beauty of natural beaches in Croatia.
The main objectives of this paper are:
  • To summarize the results of a 10-year period (2011–2020) of inland and coastal bathing water quality monitoring in the Republic of Croatia, EU Member States and the group of non-EU countries in the region;
  • Comparison of 10-year bathing water quality data in Croatia with inland and coastal bathing water quality data in the countries of the region (Bosnia and Herzegovina, Serbia and Montenegro) and EU Member States;
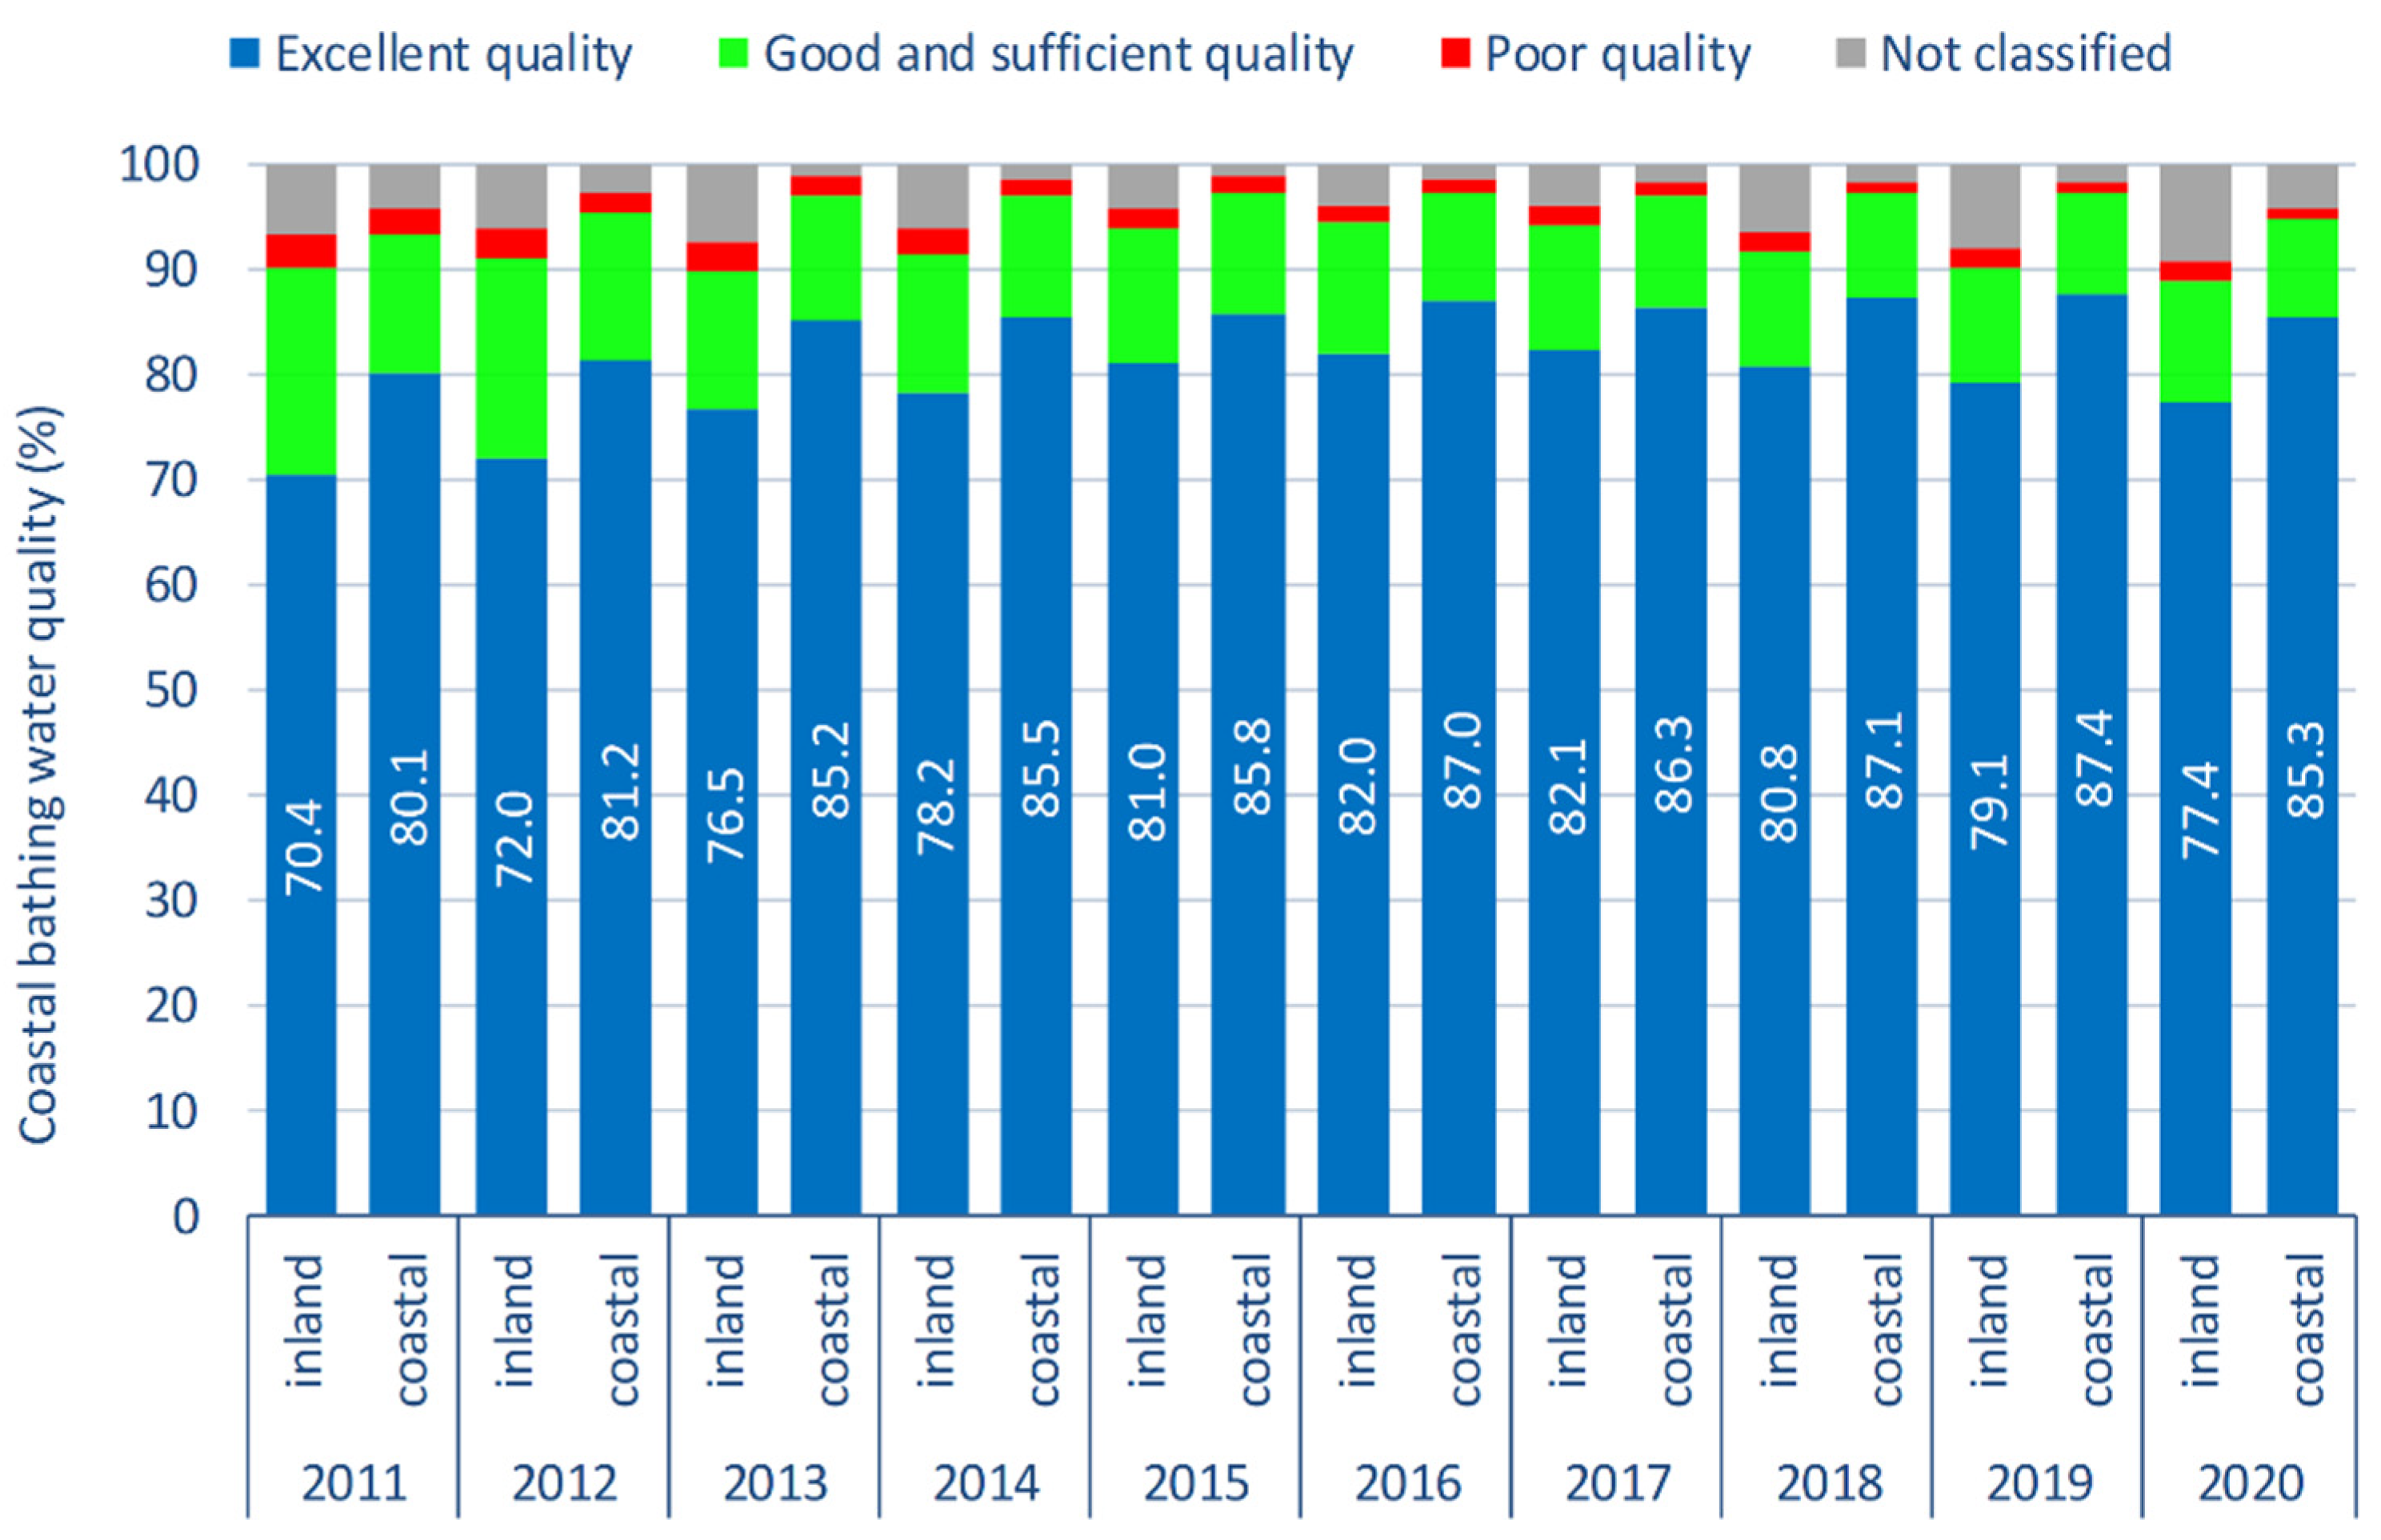
  • Analysis of 10-year trend in bathing water quality data and presentation of Croatia’s position in terms of bathing water quality and number of bathing sites compared to these countries;
  • Comparison of 10-year data on inland and coastal bathing water quality in the EU;
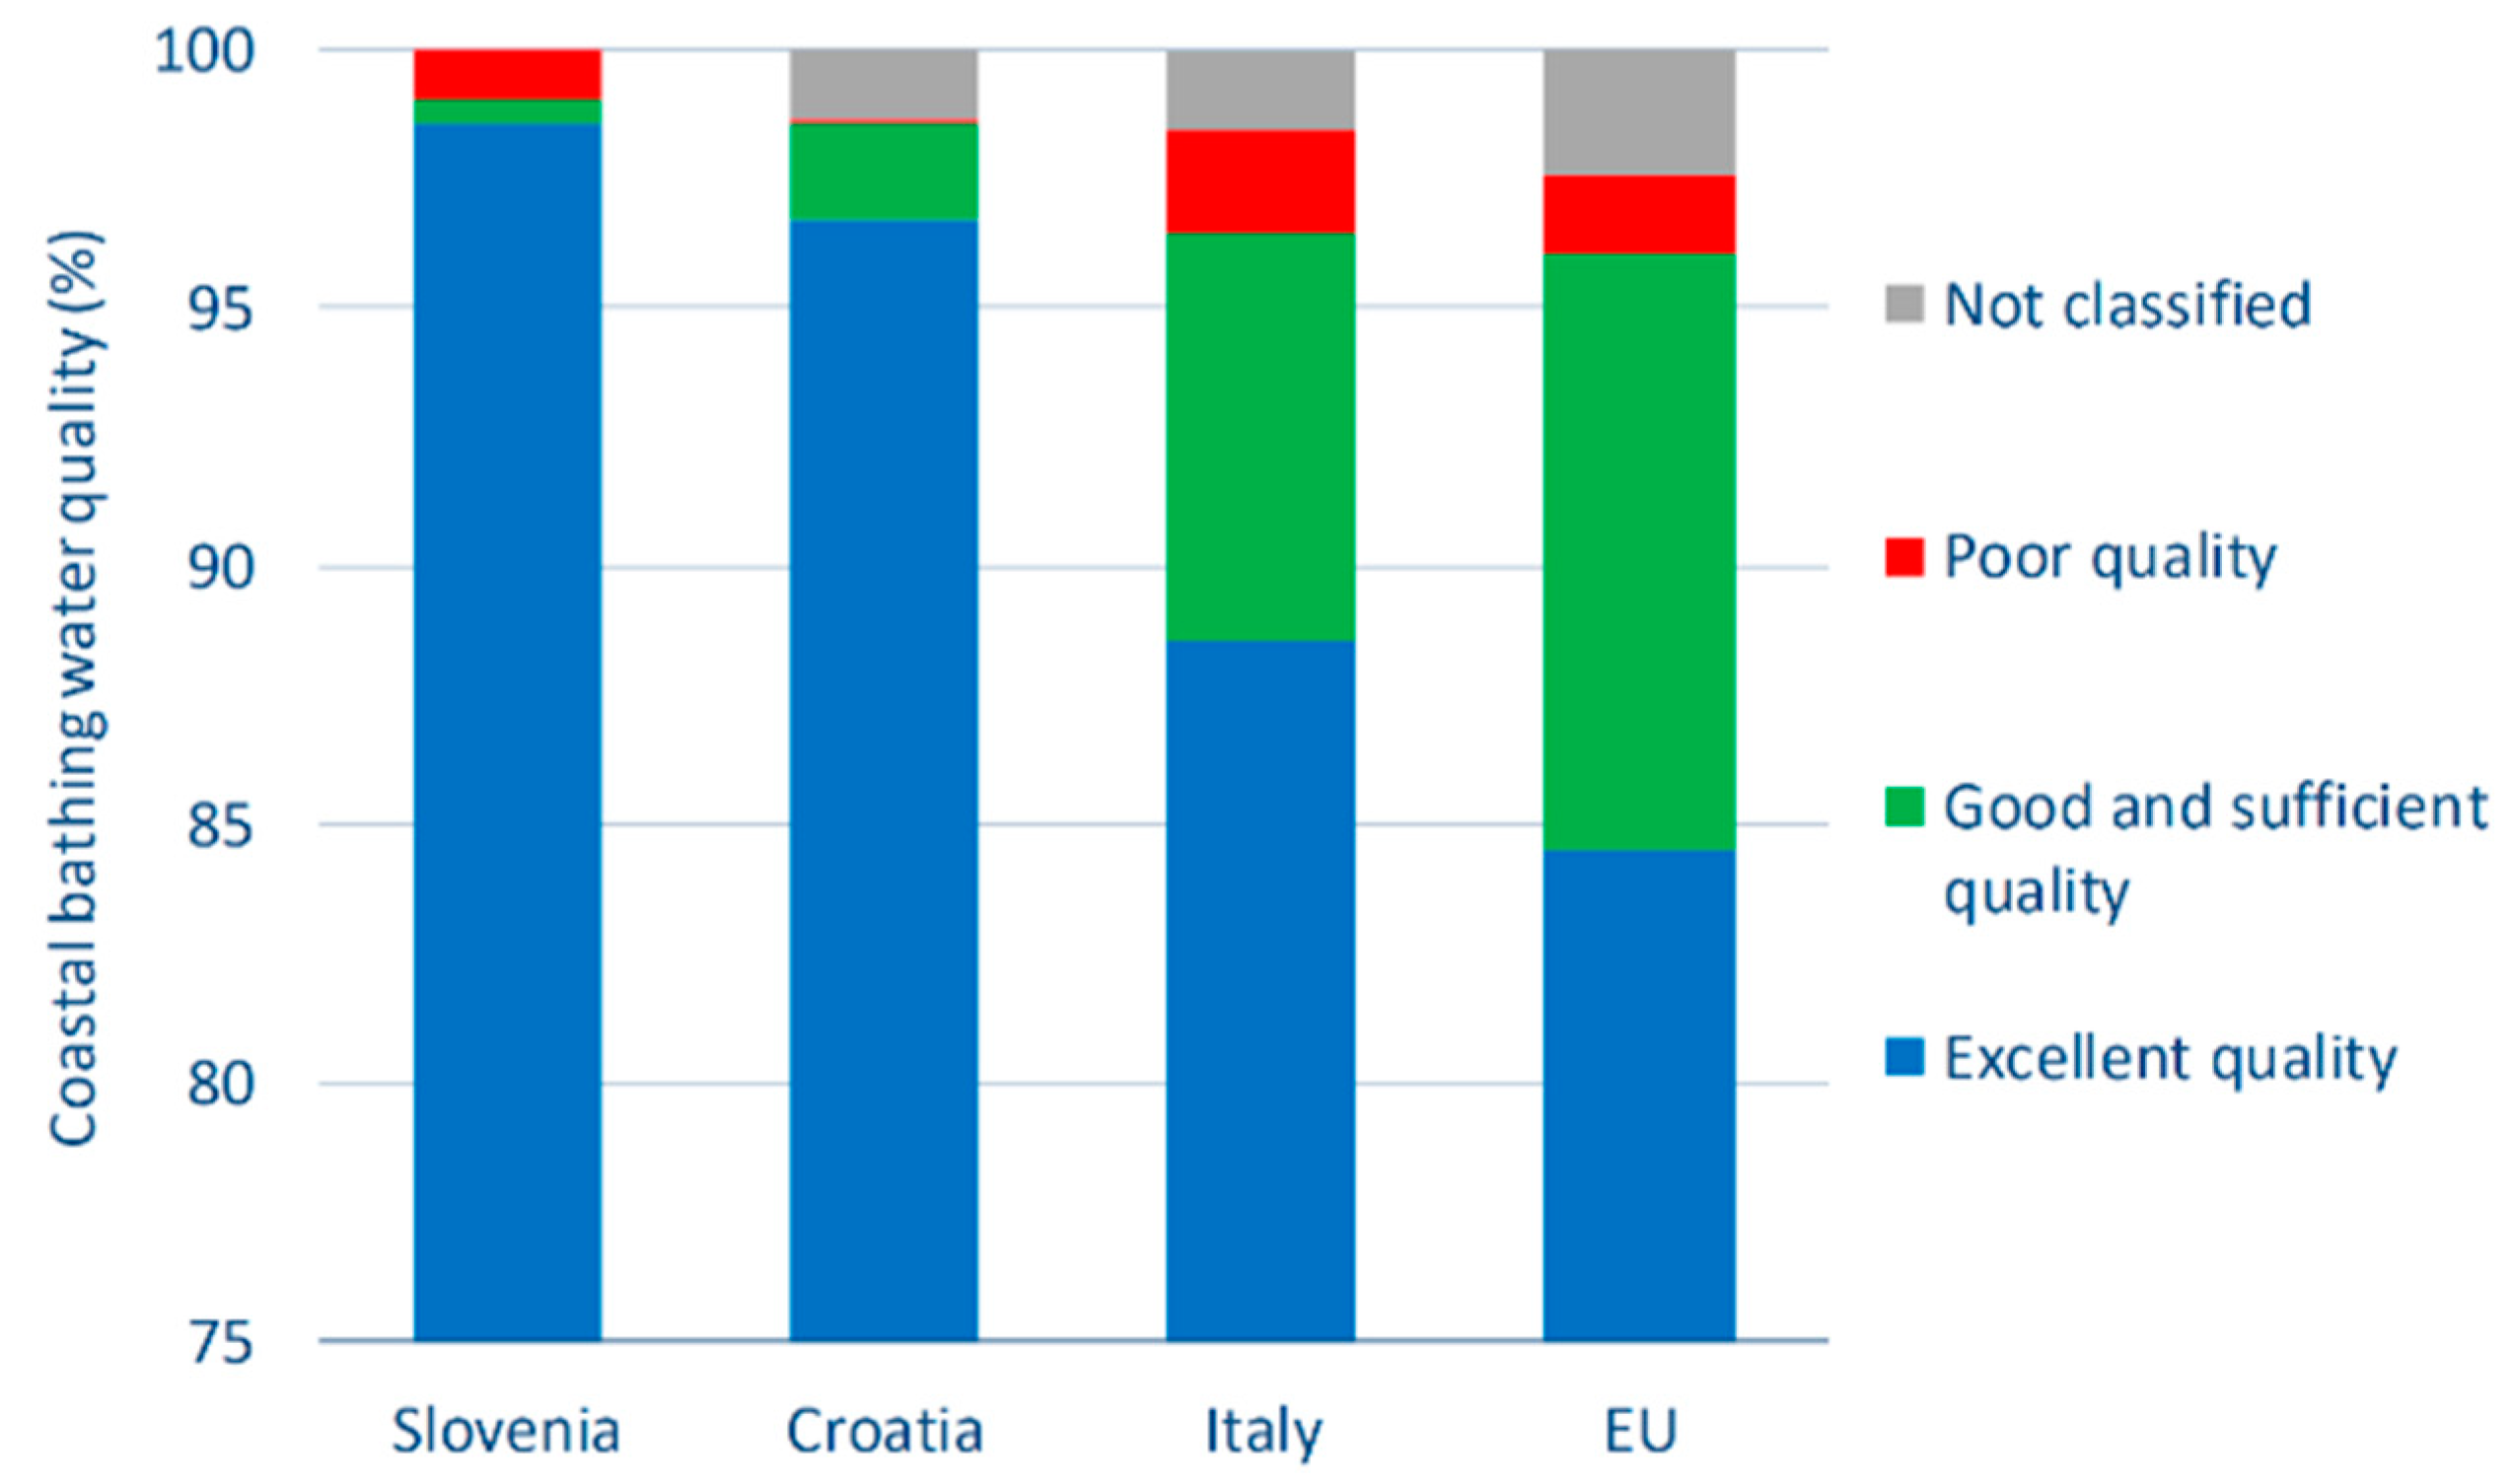
  • Provide an individual overview of water quality in the last year of the observed period (2020) and further explain the differences between inland and coastal bathing sites’ assessment criteria.

2. Materials and Methods

Data on bathing water quality in EU Member States are taken from the publicly available official annual reports of the European Environment Agency (EEA) on inland and coastal bathing water quality in the EU [24]. Data for the non-EU countries, Montenegro [25,26], Bosnia and Herzegovina (only for the Federation of Bosnia and Herzegovina) [27] and Serbia [28], are from the publicly available official reports on bathing water quality at national or entity level.
In analyzing the results of the ten-year period, the ‘good’ and ‘sufficient’ categories were merged. This allowed comparability with the criteria of the previous Directive (76/160/EEC), for which the assessment dataset did not yet allow quality assessment against the criteria of BWD 2006/7/EC (which was monitored and reported in 2014 and before). The analysis of EU bathing water quality data also included bathing water quality data from the United Kingdom (UK) for 2020, taking into account that this was the transition period (pre-Brexit) when EU legislation was still in force in the United Kingdom as it was still a Member State.
Descriptive statistical methods (relative frequency, average), graphs and tables are used to present the results of this study.

3. Results and Discussion

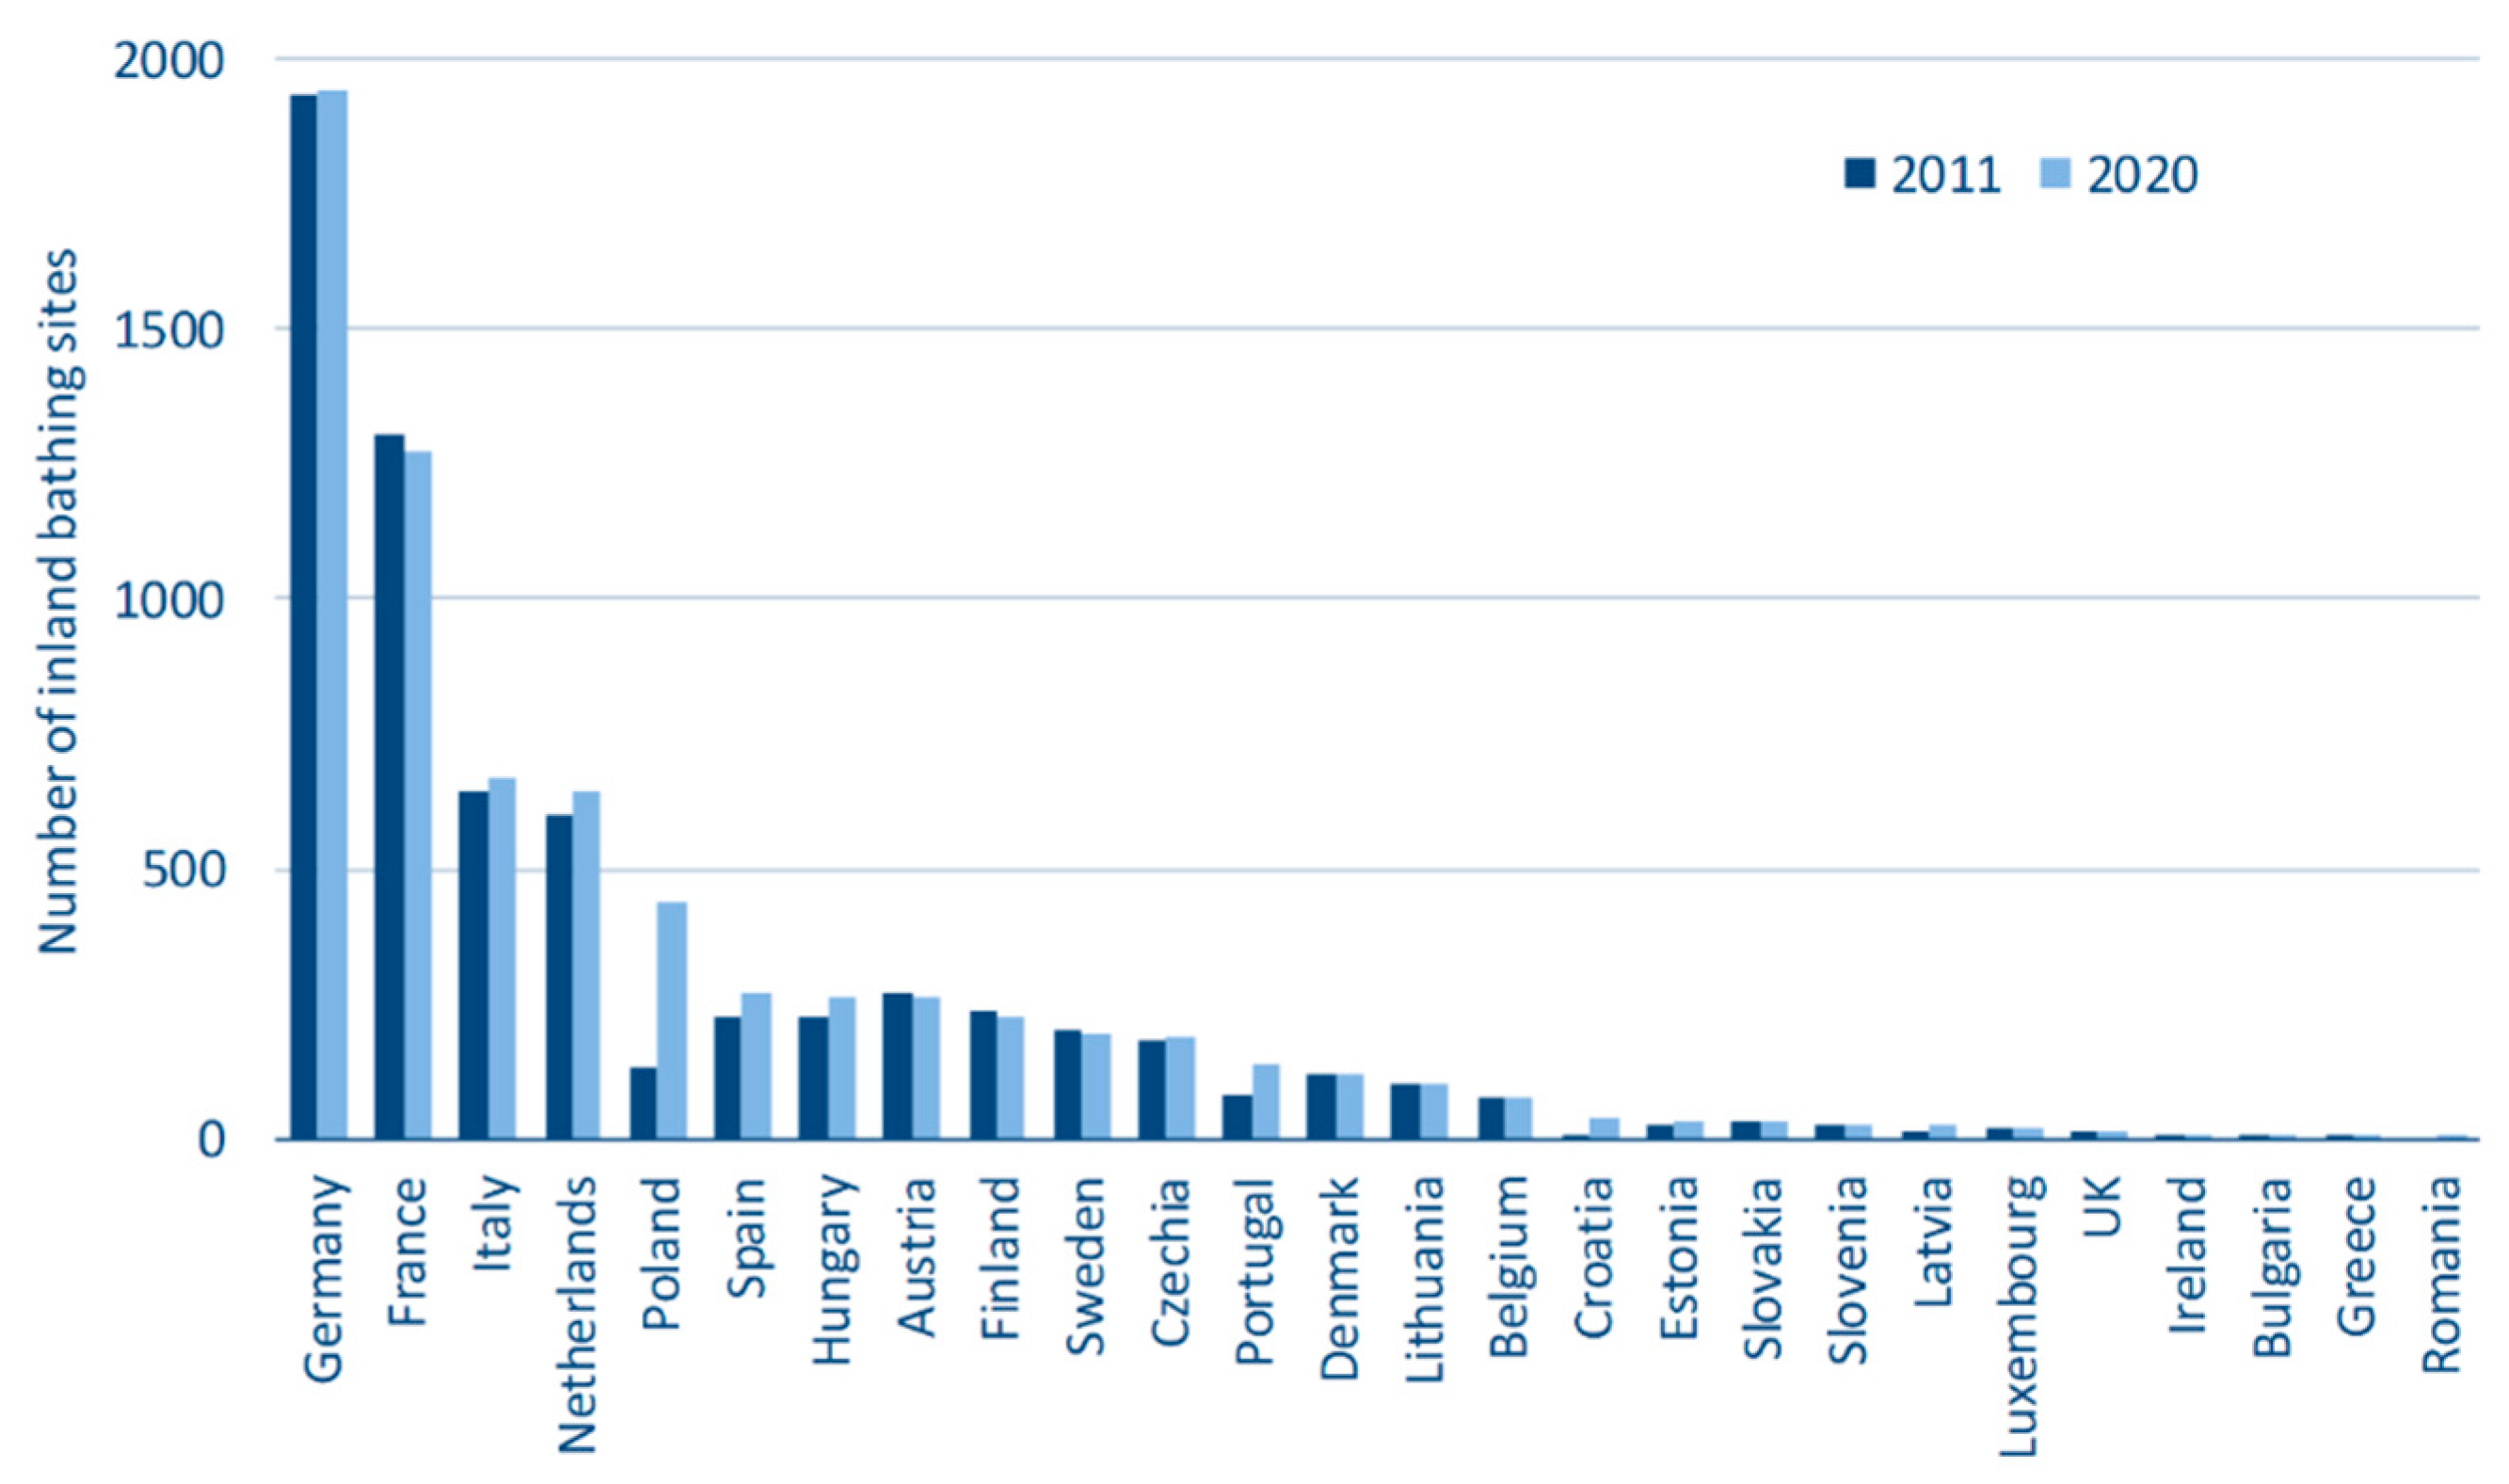
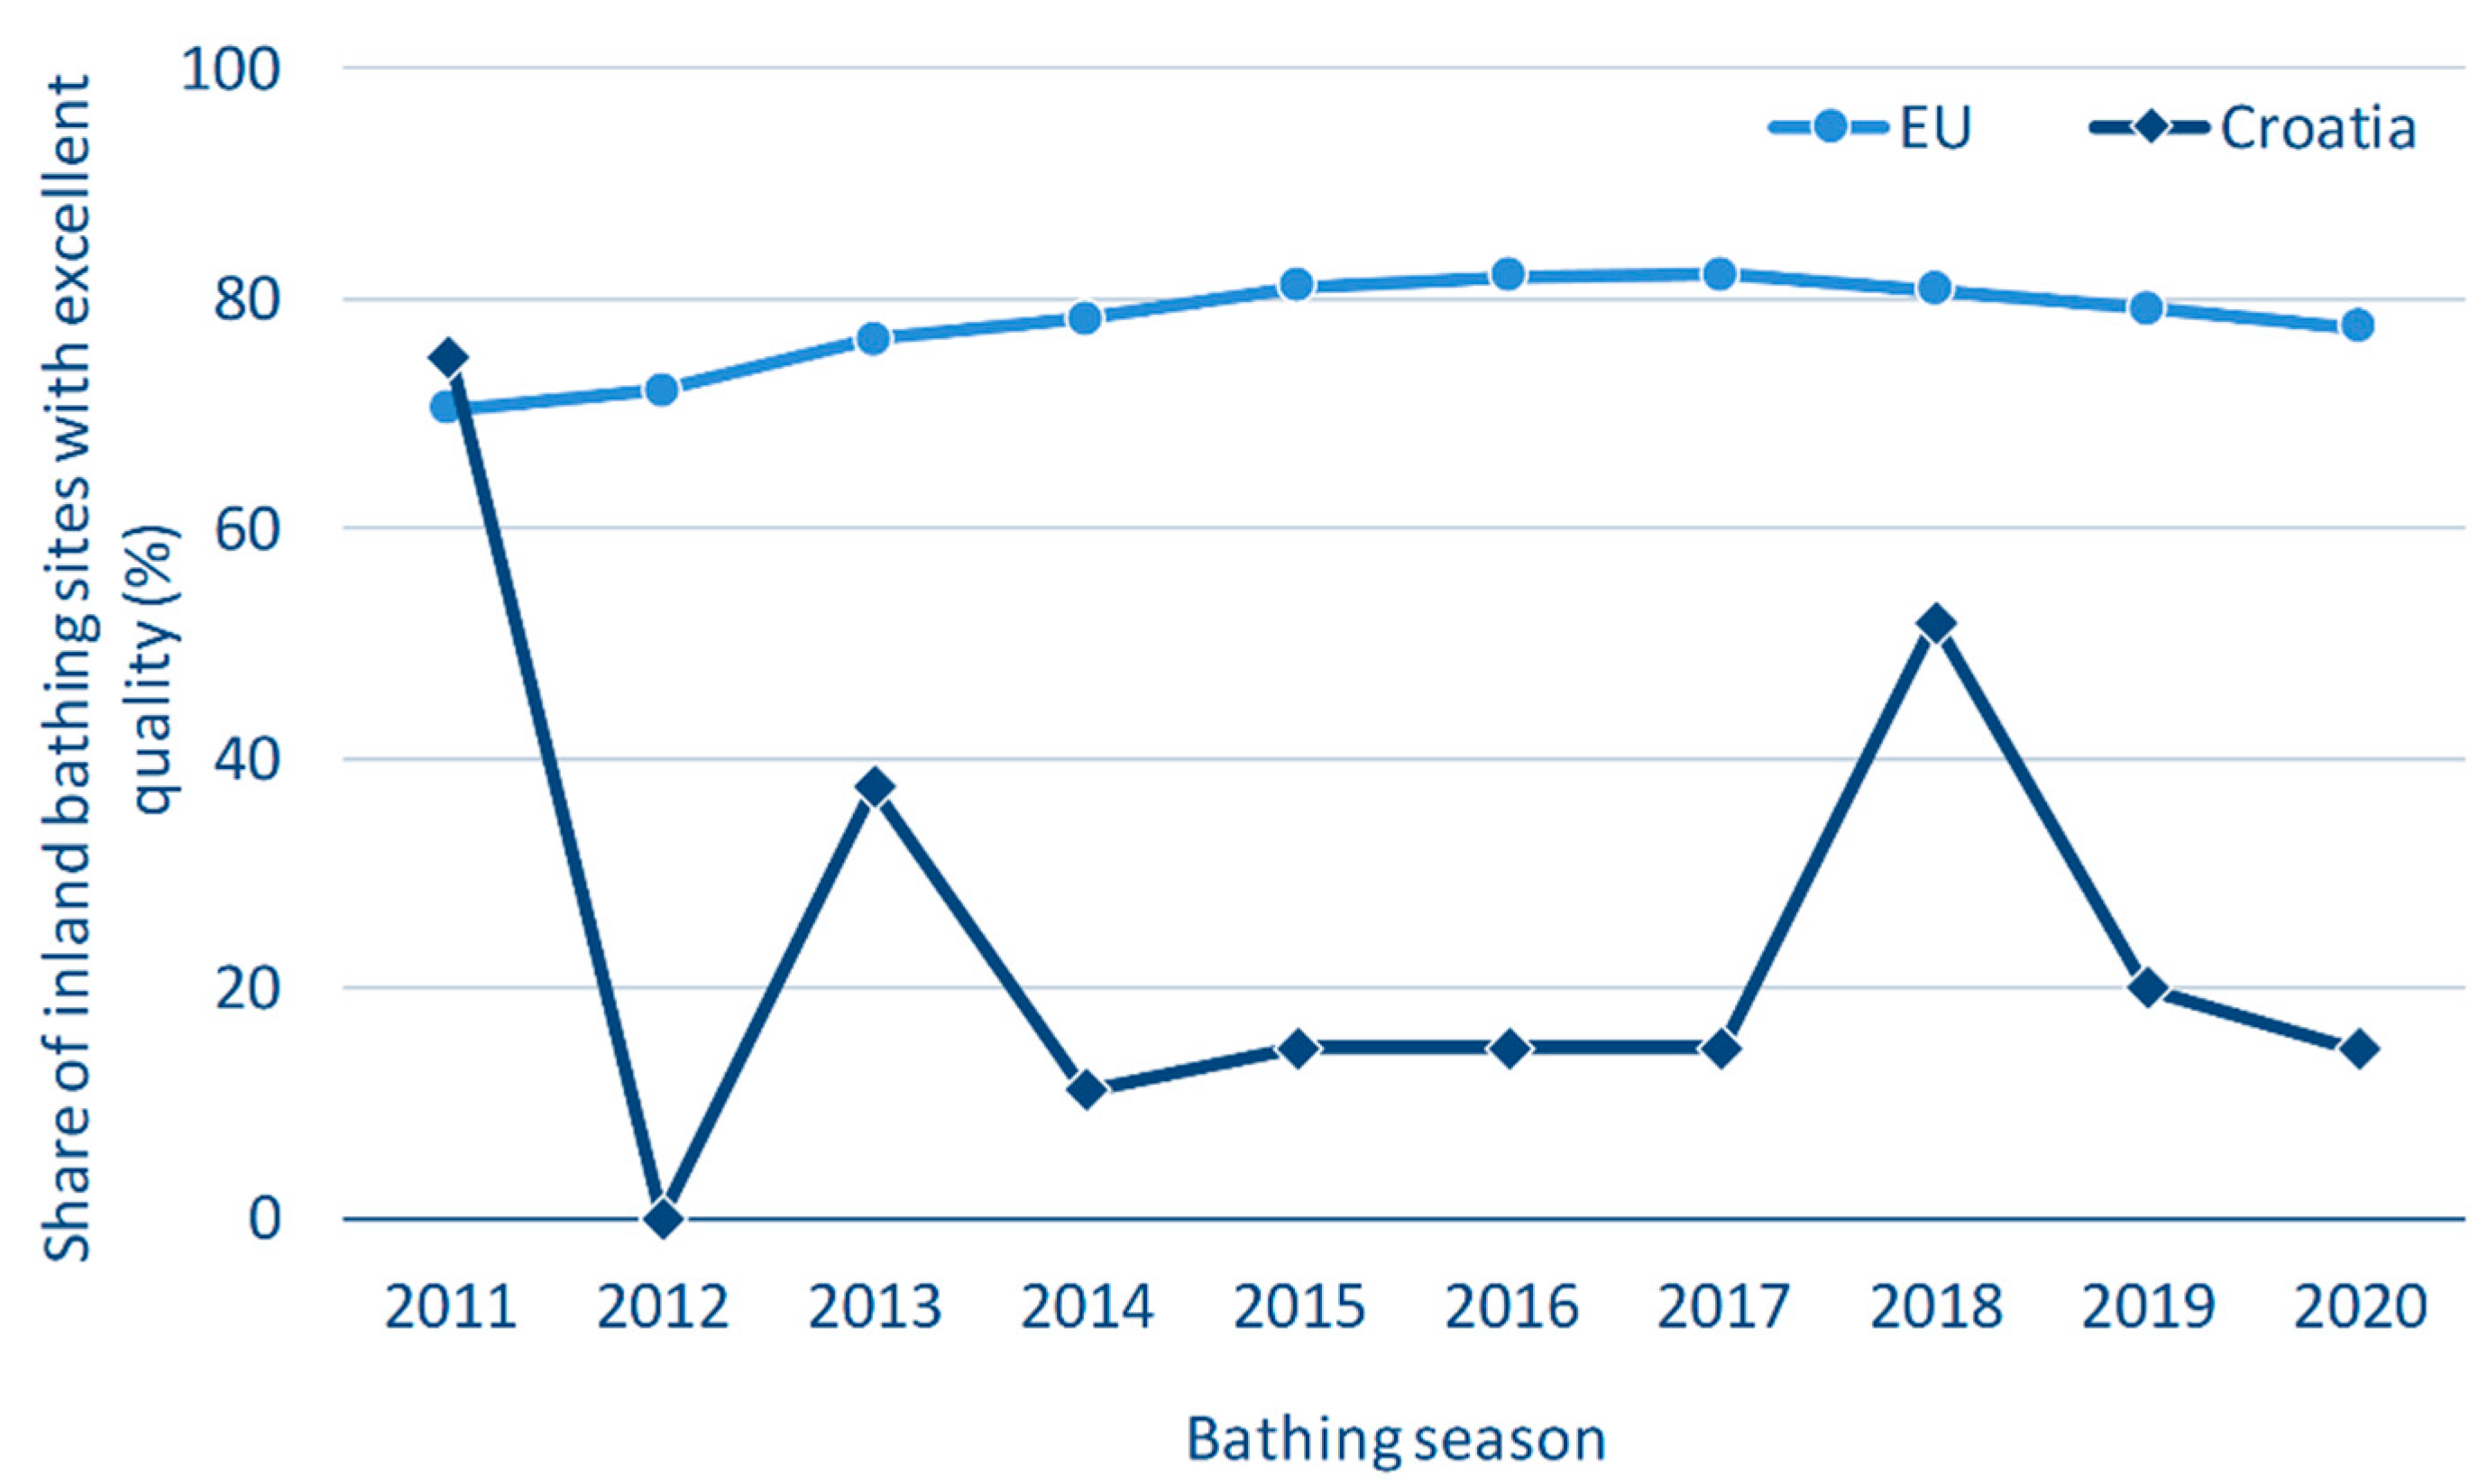
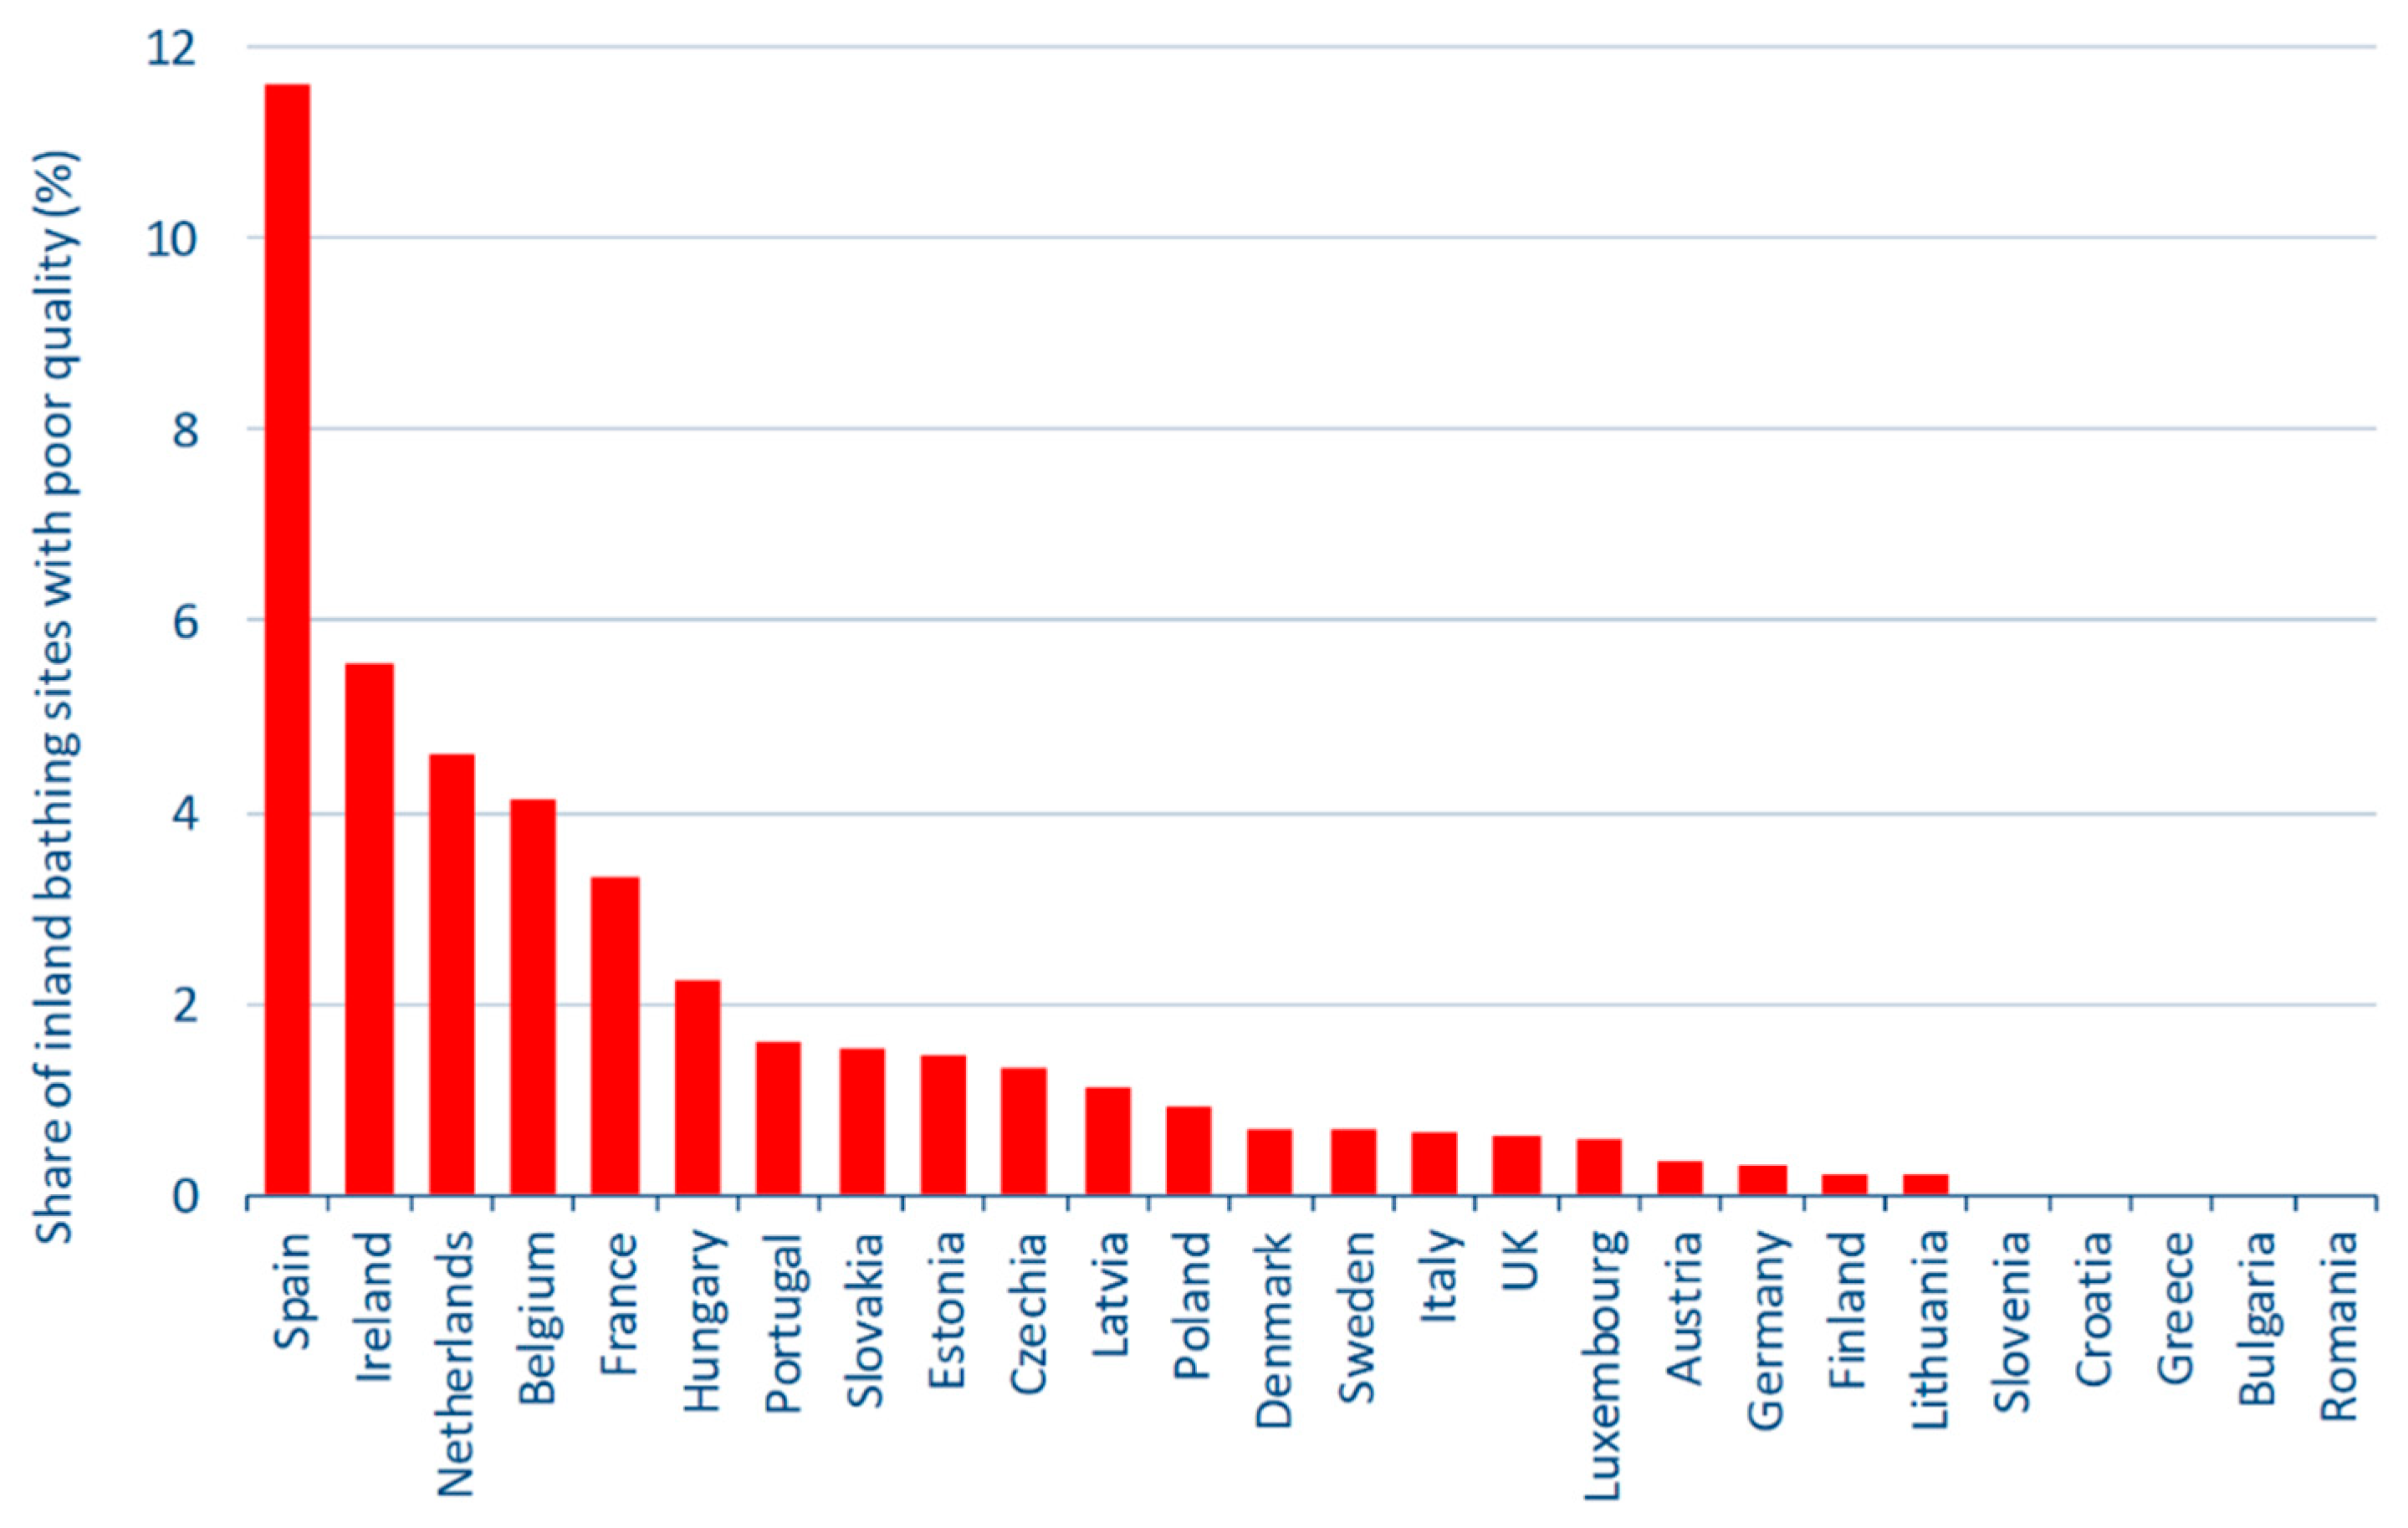
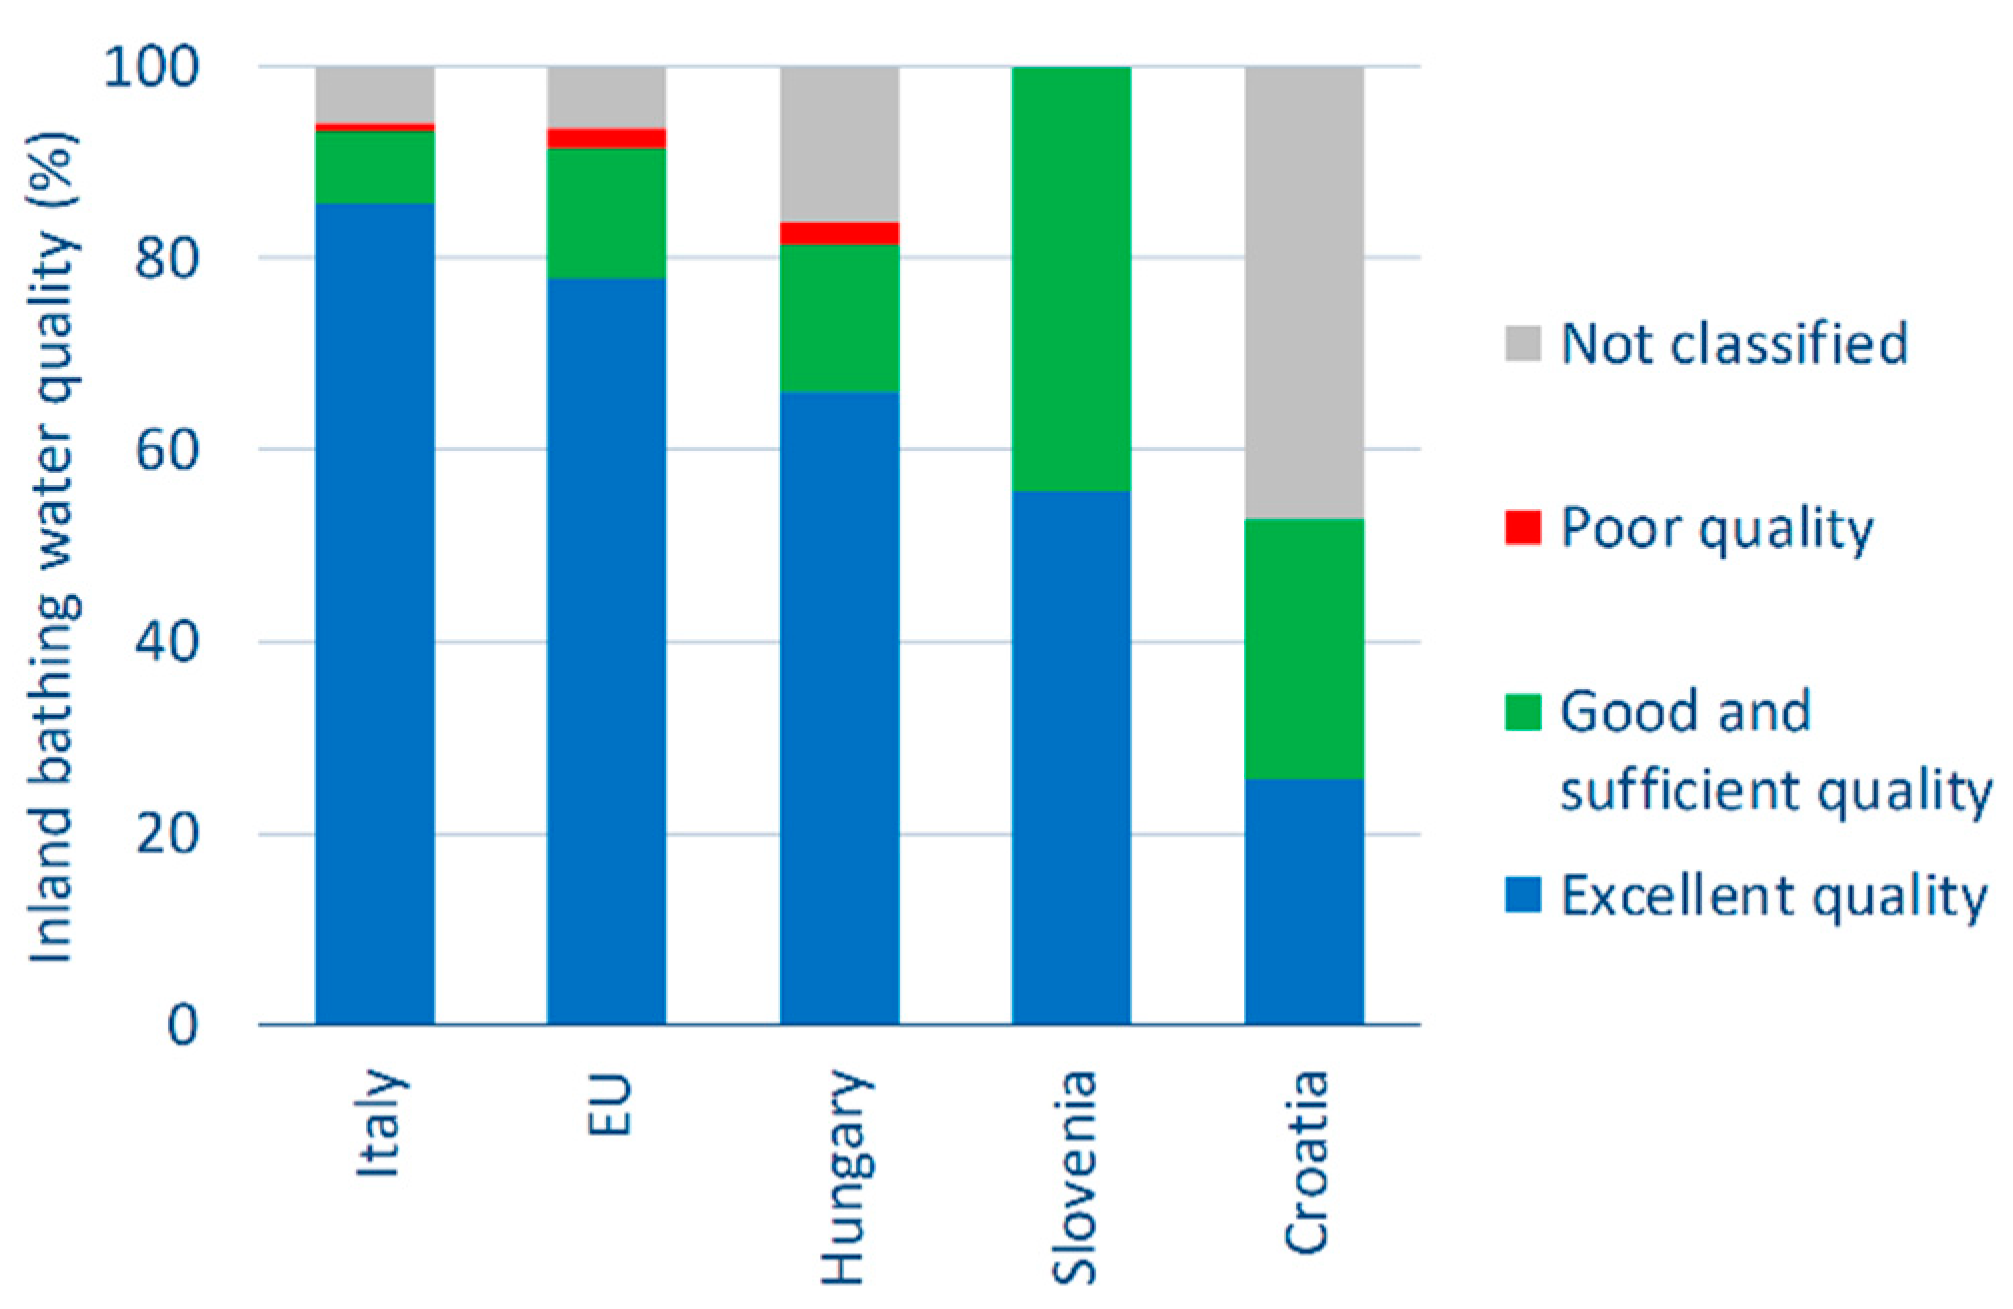
3.1. Inland Bathing Sites

In the first year of the period covered by this study (2011), only four bathing sites were included in the official monitoring program for inland bathing water quality in Croatia. Over time, the number of sites grew, and in the last observed year (2020), 41 sites were monitored (Figure 1). One of the main reasons for the low number of bathing sites in the first monitoring period was the lack of legislation for inland bathing water management, as the Regulation on Bathing Water Quality (OG, 2014) [23] only came into force in 2014. This year coincides with a year when the number of inland bathing sites increased significantly. As Croatia is rich in water bodies, many of which are suitable for bathing and recreation, it is obvious that the country has not even come close to exploiting its potential in the field of inland bathing tourism. With better management and use of inland bathing waters, Croatia would not only expand its tourist offer but also relieve the coastal areas during the bathing season.
During the observed period (2011–2020), the number of inland bathing sites (N) in the EU was highest in Germany (N2011 = 1938; N2020 = 1941), followed by France (N2011 = 1304; N2020 = 1941), Italy (N2011 = 647; N2020 = 672) and the Netherlands (N2011 = 603; N2020 = 645) (Figure 2). In contrast, the lowest number of bathing sites was in Romania (N2011 = 0; N2020 = 1), Greece (N2011 = 6; N2020 = 3) and Bulgaria (N2011,2020 = 4) (Figure 2). Looking at the total number of inland bathing sites for all EU Member States, this increased by 8.0% from 2011 to 2020, from 6497 to 7019 sites.
Looking at the EU as a whole, the first seven years of the monitoring period show a constant increase in the proportion of bathing sites with excellent water quality (70.4% in 2011, 82.1% in 2017) and a decrease of 4.6% in the last three years (80.8% in 2018, 79.1% in 2019 and 77.5% in 2020). On the other hand, the Croatian share fluctuated significantly during the observed period (75% in 2011, 0% in 2012, 51.9% in 2018 and 14.6% in 2020) (Figure 3). The reason for this is that Croatian monitoring of inland waters is relatively new (since the 2011 season), so the number of sites has not yet stabilized [29].
During the ten-year study period, Germany had the highest proportion of excellent water quality (92.2%), while Spain had the highest proportion of poor water quality (11.6%), an average of 31 bathing sites per year. This was followed by Ireland with 5.6% of bathing sites with poor water quality (an average of 0.5 bathing sites per year), the Netherlands with 4.6% (an average of 30 bathing sites per year), Belgium with 4.2% (an average of three bathing sites per year) and France with 3.3% (an average of 42 bathing sites per year). Apart from Croatia, Slovenia, Greece, Bulgaria and Romania also belong to the group of countries without bathing sites with poor water quality (Figure 4).
The highest proportion of bathing sites with excellent water quality for the last year of the study period (2020) was recorded in Greece (100%, N = 3). The percentage of bathing sites with excellent water quality ≥90% was also achieved by Austria (97.7%, N = 261), Finland (94.7%, N = 225), Denmark (93.3%, N = 120) and Germany (91.1%, N = 1941) (Figure 5). The percentage of bathing sites with excellent quality <50% was recorded by Poland (18.8%, N = 436), Croatia (14.6%, N = 41), the United Kingdom (12.5%, N = 16), Bulgaria (0%, N = 4) and Romania (0%, N = 1) (Figure 5). It is interesting to note that the lowest proportion of bathing sites with excellent water quality is found in the new EU Member States. This is probably due to the fact that these countries have not yet reached the high standards of wastewater collection, treatment and environmental protection that the “old” members, in particular Finland, Denmark and Germany, have achieved. This suggests that the new EU members need to make additional efforts in the efficient management of waste water and the protection of surface waters, including bathing waters, by using new technologies and the experience of the “old” Member States.
The largest amount of freshwater resources (lakes, rivers, streams and groundwater) exist in France, Sweden and Germany [30]. If we look at freshwater resources per inhabitant, the most water-rich EU countries are Croatia, Finland and Sweden. Among these countries, Finland and Germany have the highest proportion of excellent inland water quality. Countries experiencing “water stress” are Poland, Czech Republic, Cyprus and Malta, of which Cyprus and Malta do not monitor inland bathing water quality.
Looking at the EU Member States bordering Croatia, the best water quality over the 10-year period was recorded in Italy, where on average 85.8% of bathing sites had excellent water quality (Figure 6). Italy was the only country where the proportion of bathing sites with excellent quality was higher than the EU average (78%). This was followed by Hungary with 66.2%, Slovenia with 55.8% and Croatia with 25.5% of bathing sites with excellent water quality. The highest percentage of bathing sites with good and satisfactory water quality was found in Slovenia (44.3%), while the percentage of bathing sites with poor water quality was highest in Hungary (2.2%). The highest percentage of non-designated bathing areas was recorded in Croatia (47.2%).
Croatia’s neighbors, which are not EU members, and that also monitor inland bathing water quality, are Serbia and Montenegro. Bathing water management in the Republic of Serbia is regulated by two legal acts, the “Regulation On the Parameters of Ecological Additionally, Chemical Status of Surface Waters and Parameters of Chemical Status and Quantitative Status of Groundwaters” (Official Gazette of the Republic of Serbia 74/2011)” [31] and the “Regulation on Emission Limit Values of Polluting Substances In Surface and Groundwater and Deadlines for Their Achievement (Official Gazette of the Republic of Serbia 50/2012)” [32].
Since the parameters and standards for bathing water quality in Serbia are not in line with those of the BWD, it is very difficult to compare the results with those of the EU Member States. In any case, the quality of inland bathing waters in the Republic of Serbia was analyzed in 2019 (latest available data) [28] at a total of 78 bathing sites; 42 in Central Serbia and 36 in Vojvodina. A total of 777 samples were analyzed for microbiological quality, of which 65 (8.4%) did not meet the requirements of national standards for acceptable quality. The highest percentage of non-compliant water samples was found in the district North Banat (97.4%).
The management of bathing waters in Montenegro is regulated by two legal regulations: Water Law (OG of the Republic of Montenegro, 27/2007) [33] and the Regulation on Surface and Subsurface Waters Classification and Categorization (OG of the Republic of Montenegro, 2/2007) [34]. As a country in accession negotiations with the EU, Montenegro has harmonized its legislation on bathing water management with the BWD. Data obtained through the monitoring program in Montenegro are comparable to those of EU Member States. According to the latest available dataset for Montenegro (2018) [25], the analysis of surface waters used for bathing included 13 rivers (36 monitoring points) and 3 lakes (11 monitoring points). In the 2018 bathing season, 79.7% of the analyzed lake water samples met the requirements of the national regulation, while this percentage was 69.4% for river waters. In the study by Kolarević et al. [35], the data on microbiological quality of Rijeka in Montenegro in the period (2009–2019) were analyzed. It was generally found that the microbiological water quality of rivers in Montenegro is quite good and only four sites are microbiologically polluted.
Although the Water Law of the Republic of Bosnia and Herzegovina (70/2006) [36] defines the zones of water bodies intended for bathing and recreation, these zones have not been officially proclaimed. Consequently, there is no classical monitoring program in Bosnia and Herzegovina. The Adriatic Sea Water Agency has organized bathing water quality testing at the so-called “Traditional baths”. The monitoring plan for 2019 included a total of 15 inland bathing sites on rivers and lakes. Seven of the fifteen traditional bathing sites had excellent quality, two had good quality, two had sufficient quality and four had poor quality.
The data showed that the quality of inland bathing waters in Croatia and neighboring countries (which are not members of the EU) was generally worse than the EU average. The results of a study by Markovski et al. [37] which covered four countries, Bosnia and Herzegovina, Macedonia, Montenegro and Serbia, pointed to the difficulties in managing water resources in the region. One of the main reasons was the availability of reliable data on the quality of water bodies in these non-EU countries. This confirms the fact that these countries need additional investments in environmental protection and better and responsible wastewater management. Considering that these countries share many water bodies, it is obvious that efforts to protect these waters from pollution need to be coordinated and reciprocal.

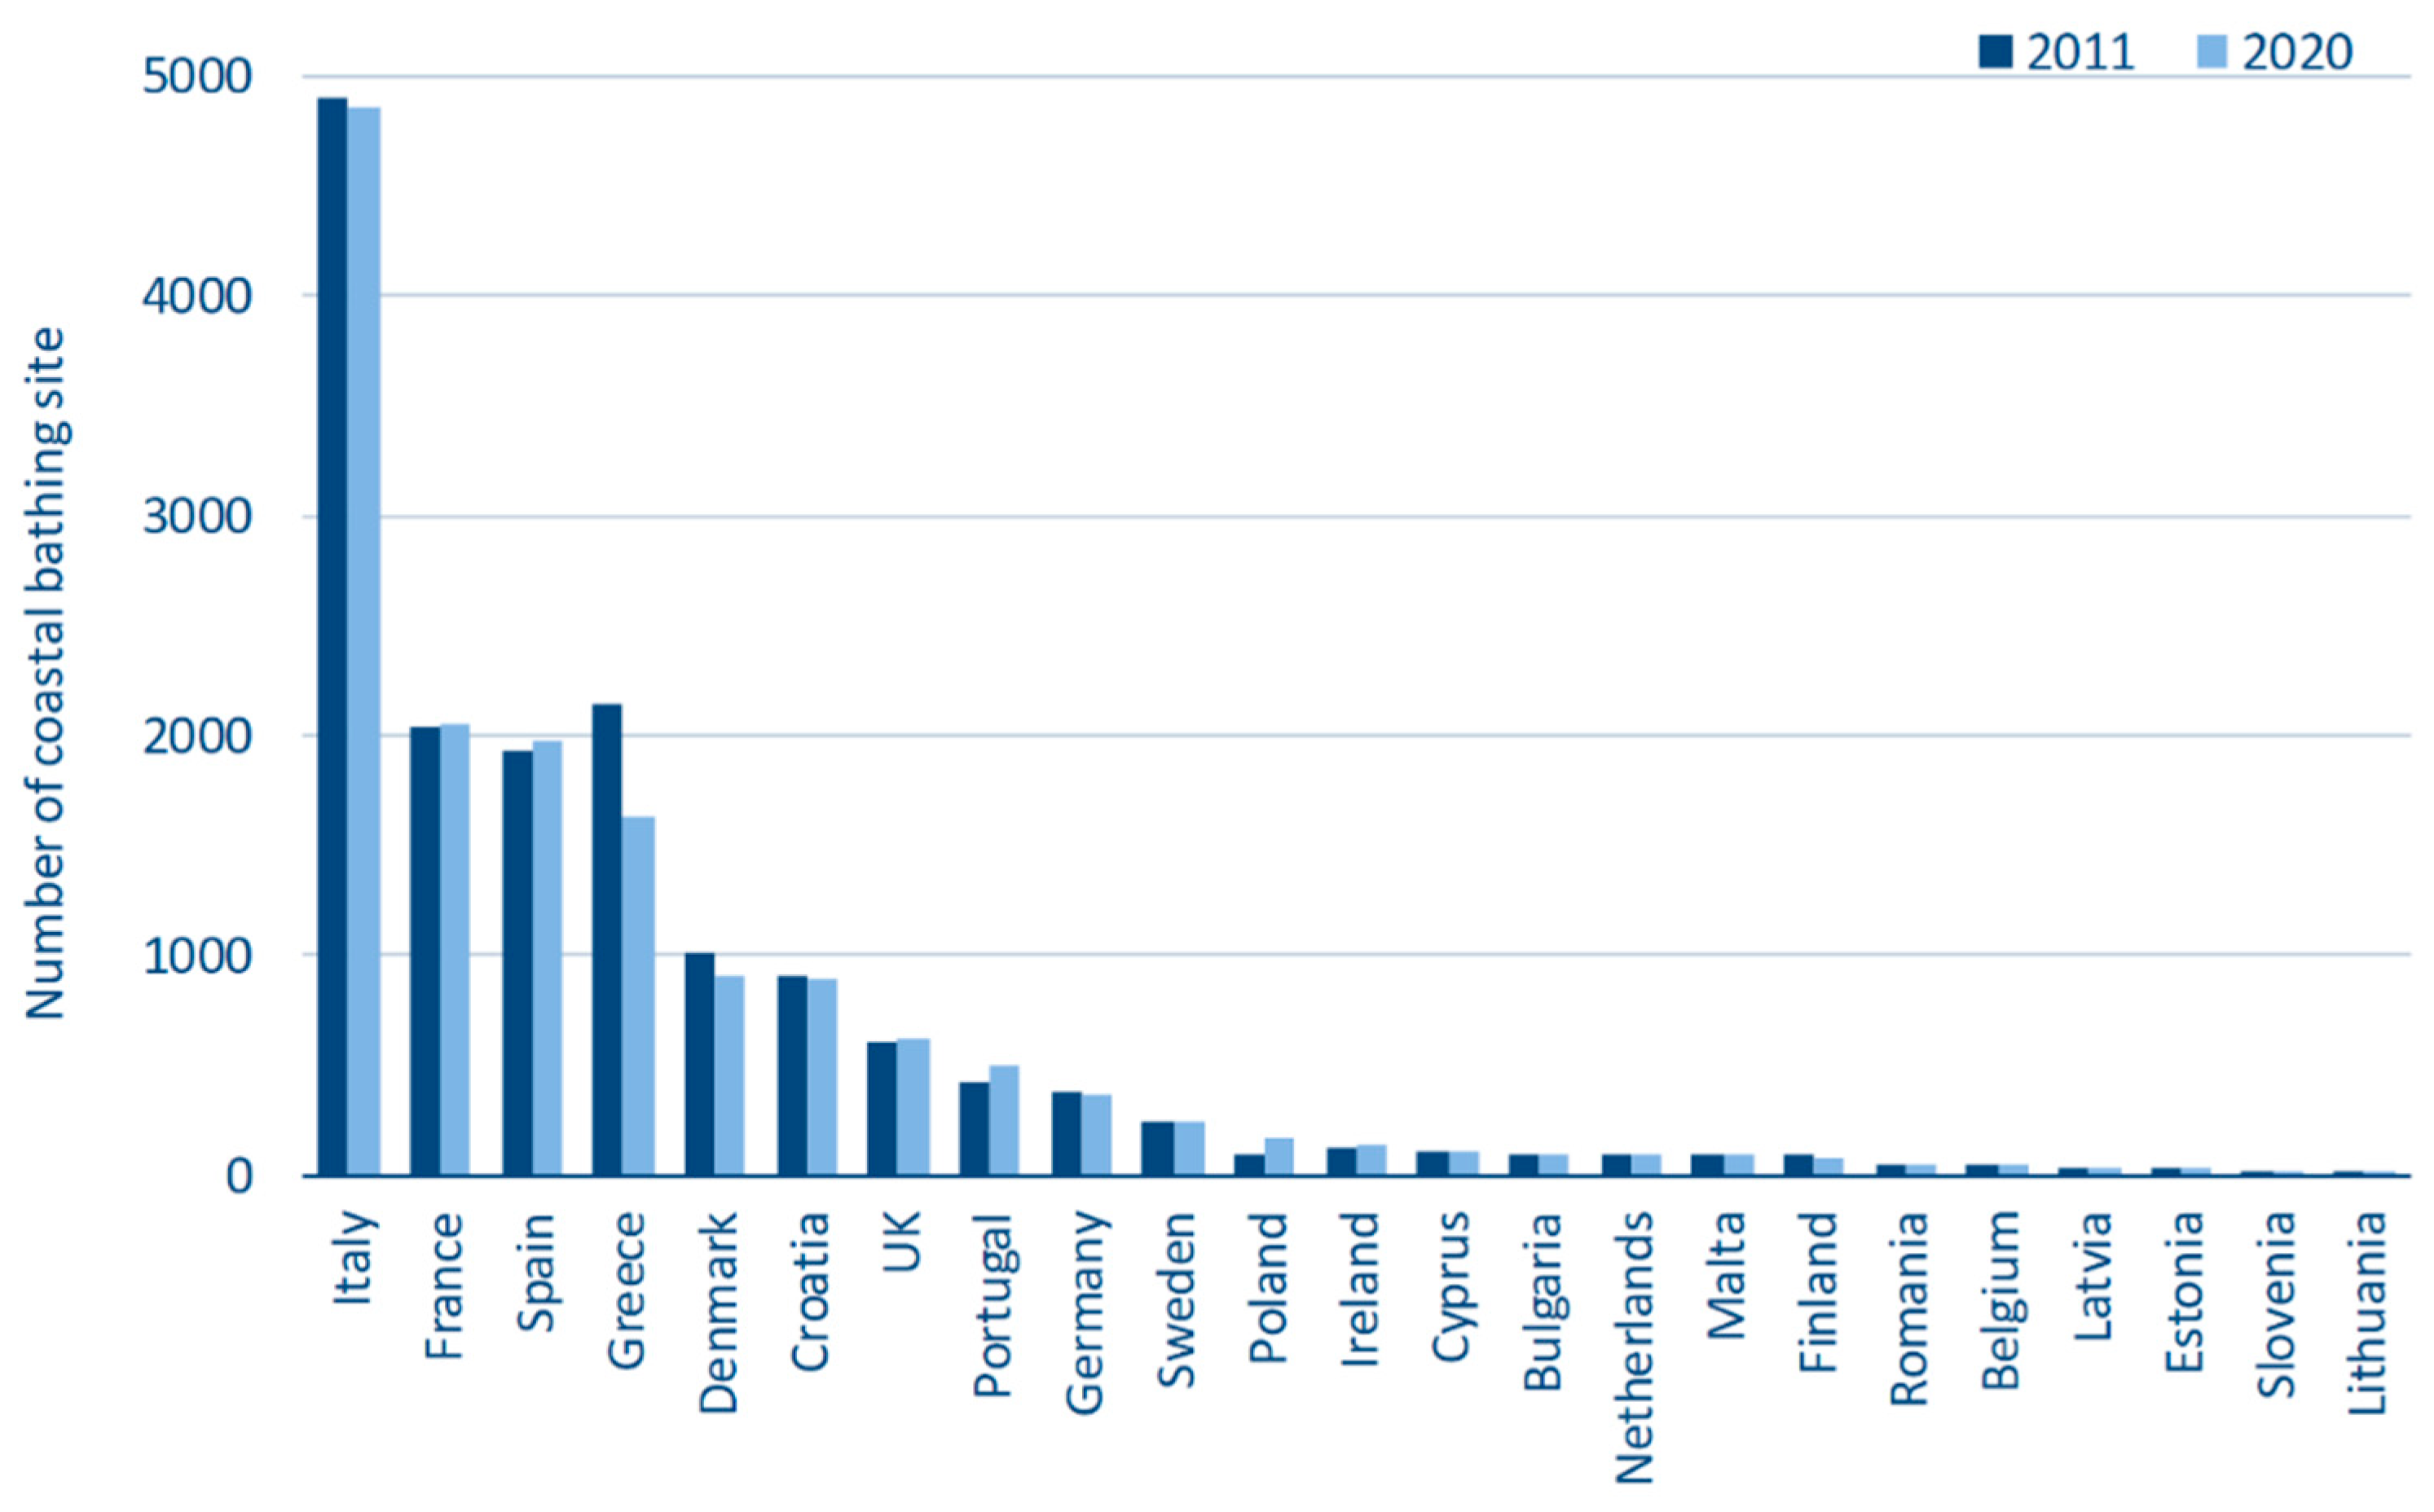
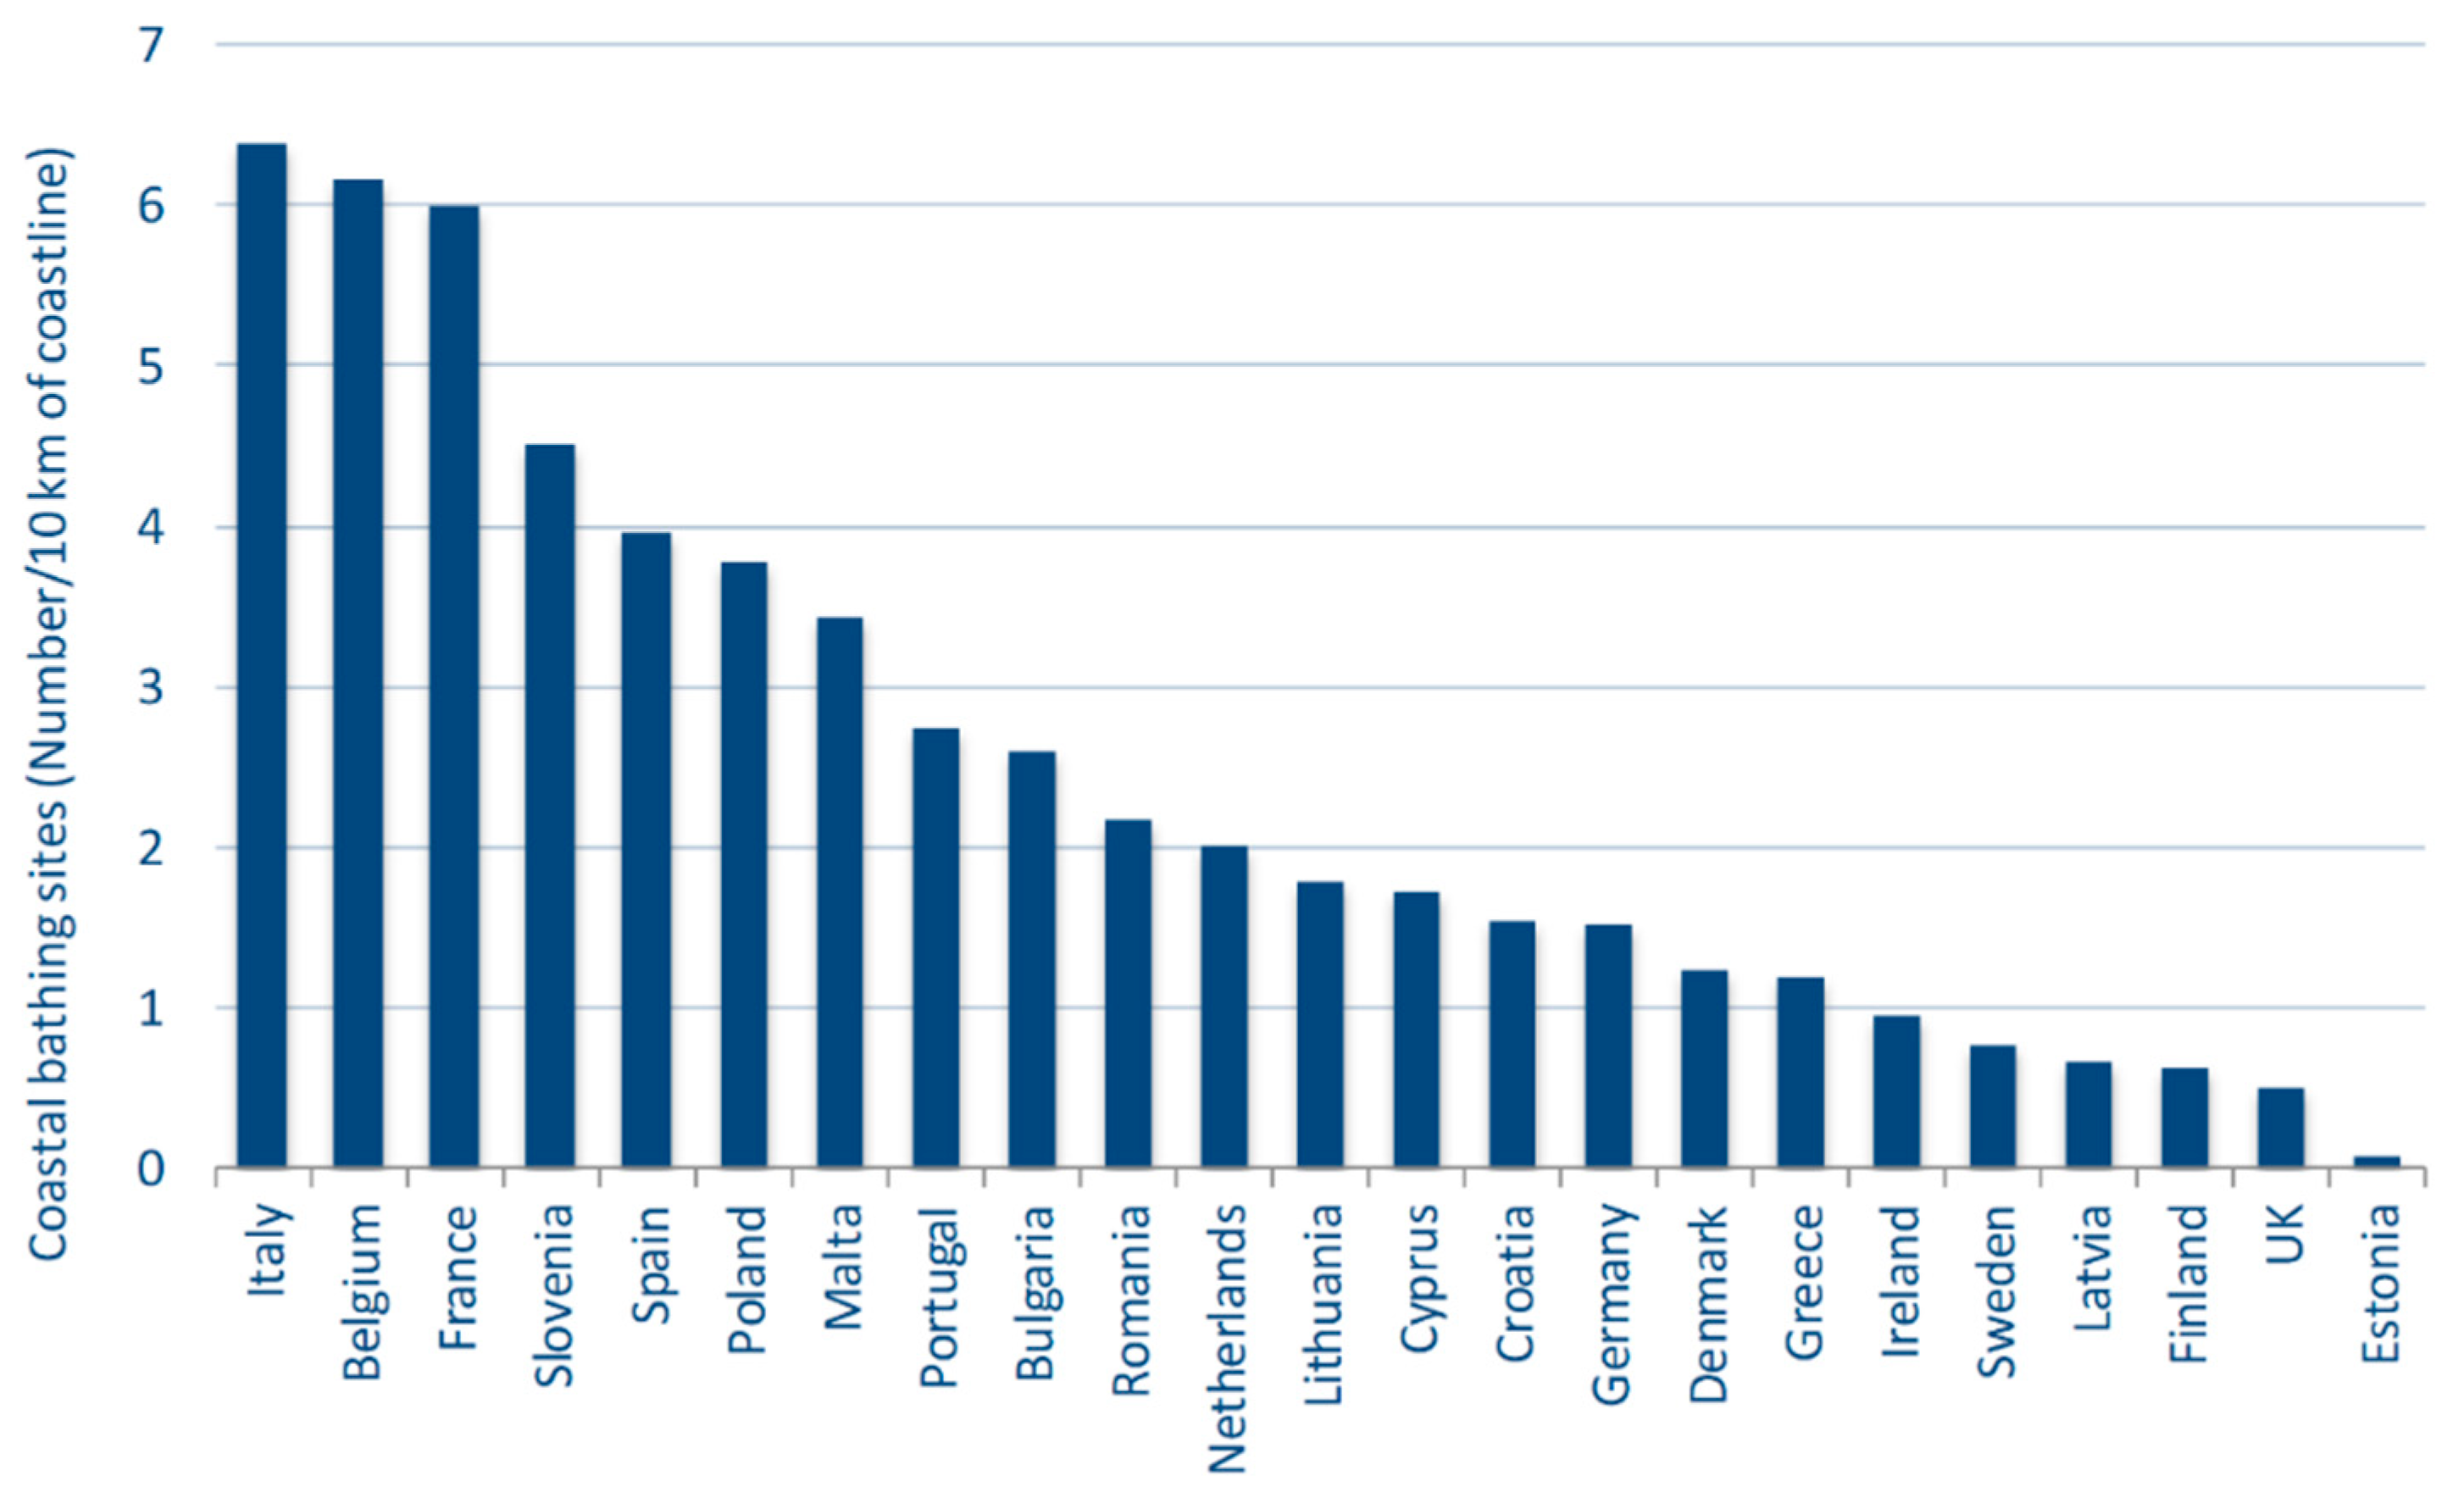
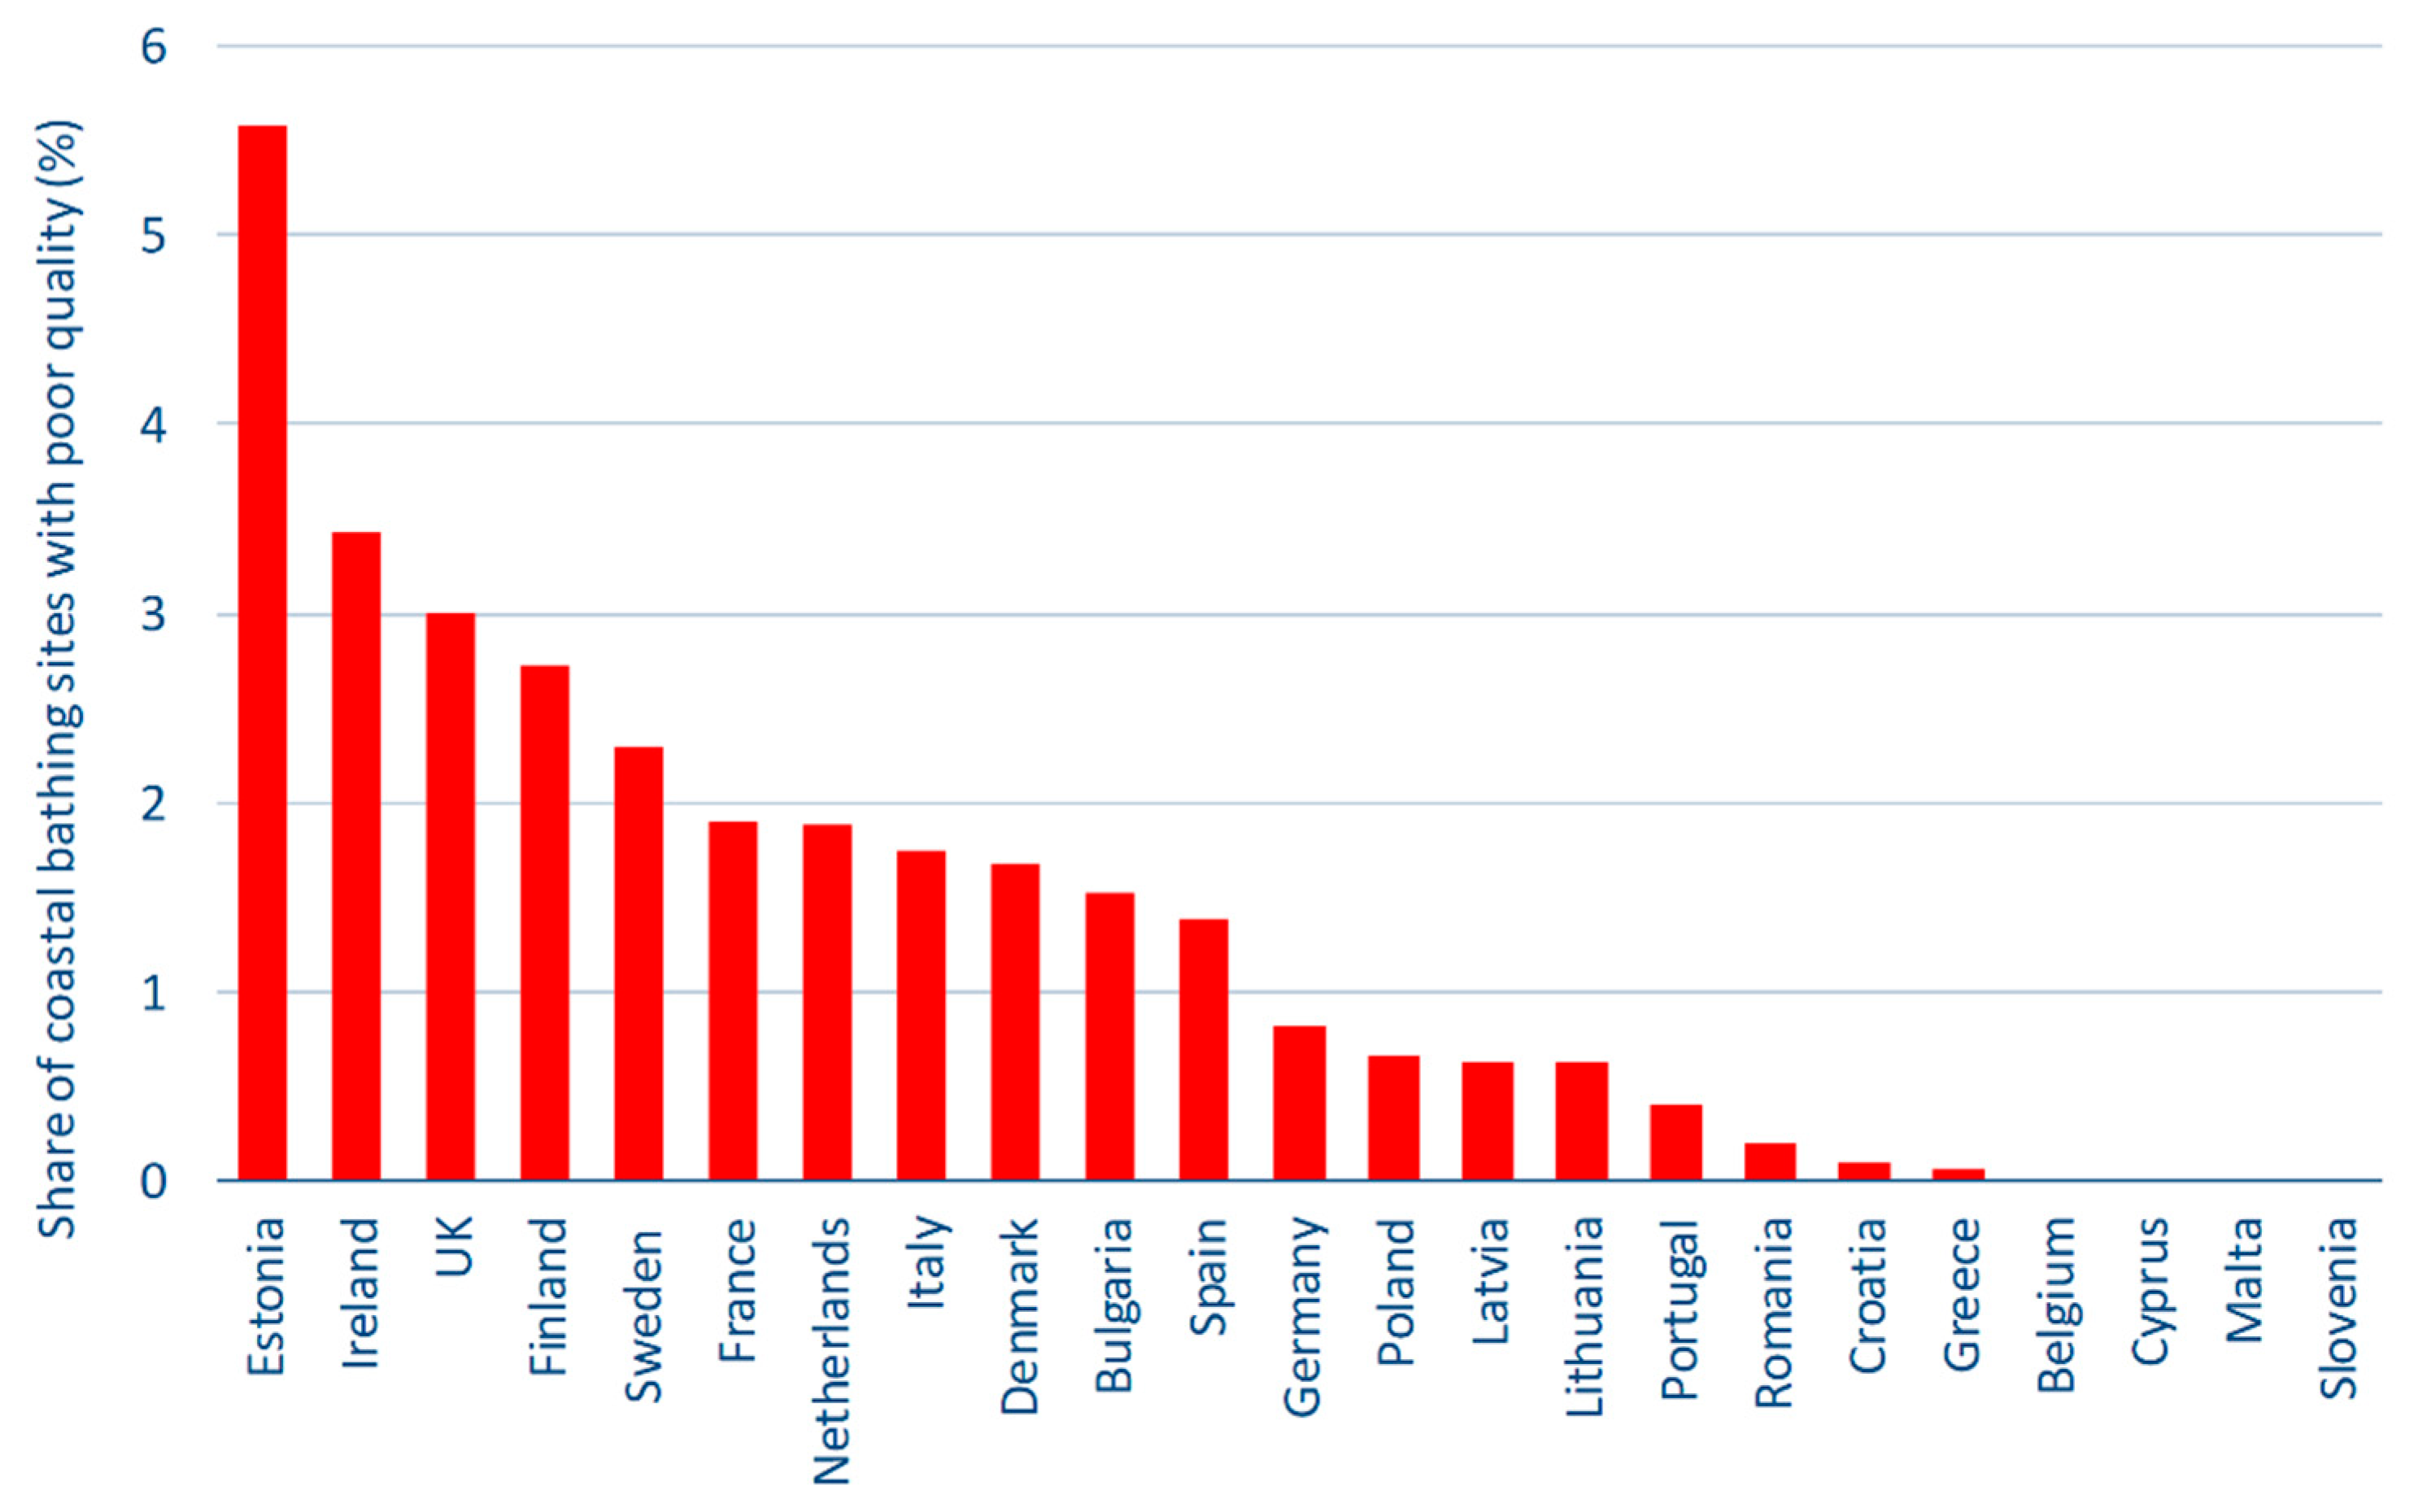
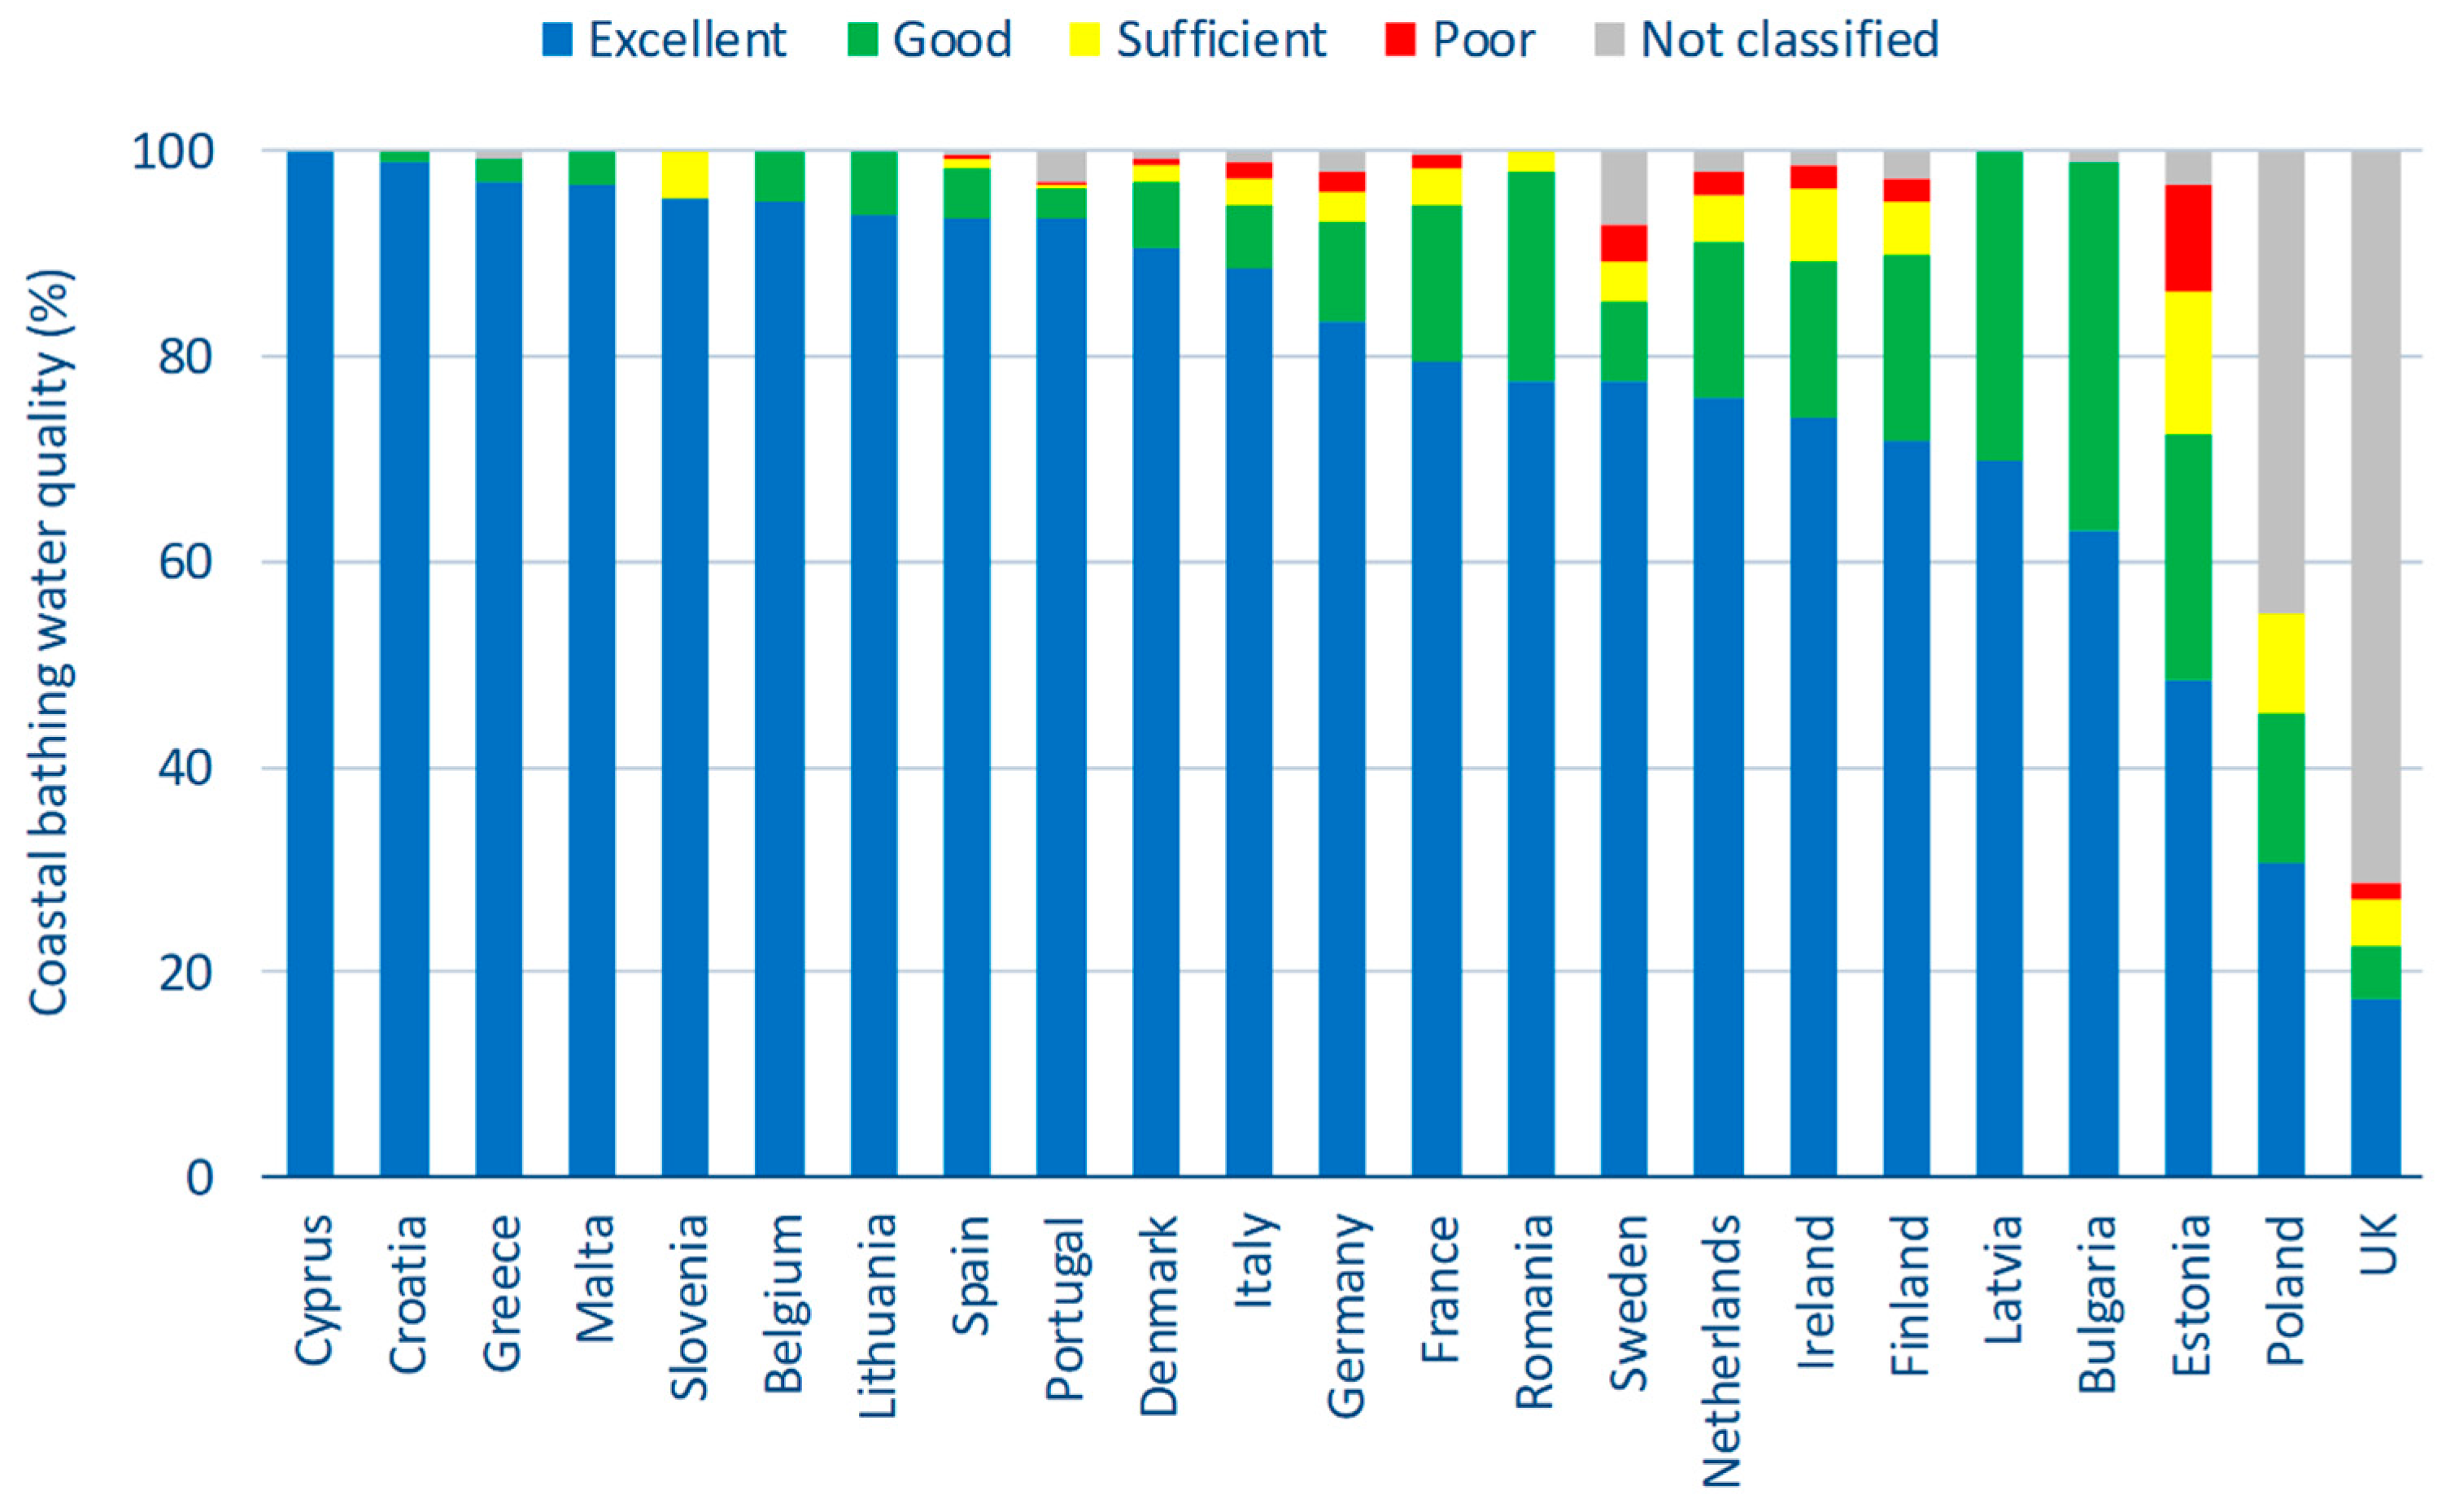
3.2. Coastal Bathing Sites

In the first year of the period covered by this study (2011), 906 bathing sites were included in the official Croatian coastal bathing water quality monitoring program. In the following years, the total number of bathing sites fluctuated within 100 sites. In the last observed year (2020), Croatia recorded the lowest total number of official coastal bathing sites (894).
During the 2011 bathing season, the quality of coastal bathing waters in EU Member States was monitored at a total of 14,538 bathing sites. The number increased steadily and reached 14,985 in the last year of the study period (2020) [38], representing an increase of 3.1%. The highest number of coastal bathing sites was recorded in Italy (N2011 = 4902; N2020 = 4848), France (N2011 = 2029; N2020 = 2055), Spain (N2011 = 1927; N2020 = 1969) and Greece (N2011 = 2149; N2020 = 1631) (Figure 7). All these Member States are “large” Mediterranean countries with a long coastline. These are also the countries that are highly dependent on marine tourism, as they all have a relatively high share of tourism revenues in GDP [39]. On the other hand, the lowest number of coastal bathing sites was recorded in Lithuania (N2011,2020 = 16), Slovenia (N2011, 2020 = 21), Estonia (N2011 = 27; N2020 = 29) and Latvia (N2011 = 32; N2020 = 33), which was to be expected given the short length of their coastline and/or their geographical location.
Looking at the number of bathing sites along the coastline of EU Member States, Italy has the most bathing sites per 10 km of coastline (6.4). This is due to the flat and sandy western Adriatic coast with many wide and long sandy beaches. Belgium (6.2) and France (6.0) follow behind. Member States with ≥4 sites per 10 km are Slovenia (4.5) and Spain (4.0) (Figure 8). On the other hand, Estonia (0.1), the United Kingdom (0.5), Sweden (0.8), Finland (0.6) and Latvia (0.7) have less than one site per 10 km of coastline. This is to be expected as these are mainly northern countries with steeper, less accessible and rocky coasts and a much shorter bathing season than in the southern EU Member States.
Looking at the period from 2011 to 2020, it is noticeable that the share of bathing sites with excellent quality in Croatia was significantly higher than the EU average. This proportion was below 96% only in the 2013 (95.4%), 2017 (95.8%) and 2018 (95.6%) bathing seasons. At the EU level, the proportion of bathing sites with excellent quality ranged from 85.2% to 87.4% during this period, with the exception of 2011 and 2012, when it was 80.1% and 81.2%, respectively (Figure 9). The highest proportion of excellent water quality was recorded in Cyprus (99.3%).
Looking at the 10-year average number of poor-quality bathing sites in the EU Member States, the highest proportion was recorded in Estonia (5.6%), with an average of two sites per year. This was followed by Ireland (3.4%) with an average of five sites per year and the United Kingdom (3.0%) with an average of 19 sites per year. Member States with ≥2% poor-quality bathing sites were Finland (2.7%) and Sweden (2.3%), with an average of two and six sites per year, respectively. Croatia recorded 0.1% poor-quality bathing sites, an average of one site per year. During the same period, Belgium, Cyprus, Malta and Slovenia were among the group with no poor-quality bathing sites (Figure 10).
In the last year of the observed period (2020), Cyprus recorded the highest proportion of excellent-quality bathing sites (100%, N = 112). It was followed by Croatia (98.8%, N = 894), Greece (97.1%, N = 1631), Malta (96.6%, N = 87), Slovenia (95.2%, N = 21) and Belgium (95.1%, N = 41) (Figure 11). In all other EU Member States, the proportion of sites with excellent quality was >60%. Exceptions were Estonia (48.3%, N = 29), Poland (30.7%, N = 166) and the United Kingdom (17.3%, N = 624). It should be highlighted that Poland and the United Kingdom had a high proportion of unclassified bathing sites (45.2% and 71.2%, respectively). This resulted in a significant decrease in bathing sites with excellent water quality. In Poland, this was due to the fact that a large number of bathing sites were newly designated, so that the data set needed for the assessment was not yet available. In the United Kingdom, a large number of samples were not taken during the 2020 bathing season due to circumstances related to the COVID-19 pandemic. Countries with a low number of bathing sites per 10 km of coastline (Estonia, United Kingdom, Sweden, Finland, and Latvia) generally have a lower proportion of excellent-quality bathing sites or a high proportion of unclassified bathing sites.
Looking at the share of bathing sites with excellent water quality over the ten-year period for the EU Member States bordering Croatia, Slovenia recorded the highest share of 98.6% (Figure 12). The average share of bathing sites with excellent water quality in all EU Member States was 84.5%. Italy had a higher proportion (88.6%) than the EU average, as did Croatia. With regard to this criterion, Croatia was just behind Slovenia with 96.7% of bathing sites with excellent quality. Of the three countries, Italy had the highest percentage of bathing sites of good and satisfactory quality (7.9%) and poor quality (2.0%), as well as unclassified bathing sites (1.6%).
Croatia’s neighboring country, which is not a member of the EU and also carries out official monitoring of coastal bathing water quality, is Montenegro. As part of the 2020 bathing water quality management, Montenegro monitored coastal water quality at a total of 110 bathing sites. Of all sites, 105 (95.5%) had excellent quality, and 5 (4.5%) were of good quality [26].
The Republic of Bosnia and Herzegovina has three coastal sites where three samples were taken during the bathing season, all of which were of excellent quality [27].

3.3. Inland vs. Coastal Bathing Water Quality

In the 2020 season, bathing water quality in the EU was monitored at 22,276 bathing sites, two-thirds of which were coastal waters. Compared to 2011, this represents an increase of 5.9% (N2011 = 21,031). In general, water quality at coastal sites is better than at inland sites. Figure 13 shows the quality of bathing waters at inland and coastal sites in the period 2011–2020.
The 10-year average of the proportion of bathing waters with excellent quality shows that coastal bathing sites outperform inland bathing waters by 7.1%. The reason for the better microbiological quality of coastal bathing waters can be attributed to the higher natural self-purification capacity and higher salinity of the seawater. In addition, many inland bathing sites in the EU are located in smaller lakes and rivers with limited flow. This makes these sites very vulnerable to pollution, especially after heavy rainfall [38].
Considering that the BWD [1] prescribes stricter criteria for coastal bathing waters than for inland waters, this may seem surprising, especially if one assumes the better purification capacity of seawater. However, studies [40,41] have shown that the incidence of swimming-associated diseases is about five times higher in seawater than in freshwater. This is thought to be because fecal indicator bacteria die-off faster than pathogens in seawater compared to freshwater. At the same time, viruses die-off at a similar rate in both water bodies [42]. This means that at similar concentrations of fecal indicator bacteria, the concentration of pathogens in seawater is higher than in freshwater, which increases the health risk for bathers in seawater.

4. Conclusions

The total number of inland bathing sites of all EU Member States increased by 8.0% from 2011 to 2020 (from 6497 in 2011 to 7019 sites in 2020), with the share of excellent-quality waters increasing by 10.1% (from 70.4 % in 2011 to 77.5 % in 2020). Germany, France, Italy and the Netherlands have the highest number of inland bathing waters. The highest proportion of excellent-quality waters was recorded in Germany (92.2%) and the highest proportion of poor-quality waters in Spain (11.6%). In the same period (2011–2020), the number of inland bathing waters in Croatia fluctuated significantly (from 4 in 2011 to 41 in 2020), as did the proportion of bathing waters classified as excellent (from 75.0% in 2011 to 14.6% in 2020). Among the EU Member States bordering Croatia, Italy had the highest proportion of excellent-quality bathing sites on a 10-year average (85.8%). In the last observed season (2020), the highest proportion of inland bathing sites with excellent water quality was recorded in Bulgaria and Greece (100%).
The total number of coastal bathing sites for all EU Member States increased by 3.1% from 2011 to 2020 (from 14,538 in 2011 to 14,985 in 2020), with the proportion of excellent-quality waters increasing by 6.6% (from 80.1 % in 2011 to 85.4 % in 2020). Italy, France, Spain and Greece had the highest number of coastal bathing waters. The highest percentage of excellent water quality was recorded in Cyprus (99.3%) and the highest percentage of poor water quality in Estonia (5.6%). During the study period (2011–2020), Croatia recorded a slight decrease in the number of official coastal bathing sites (by 1.3%, from 906 to 894), while the proportion of coastal bathing waters with excellent quality increased by 1.0 percentage points to 98.8%. In the 2020 season, the highest proportion of coastal bathing sites with excellent water quality was recorded in Cyprus (100%), followed by Croatia (98.8%), while among the neighboring EU Member States, Italy reached 85.8%. In the last observed season (2020), the highest percentage of coastal bathing sites with excellent water quality was recorded in Cyprus (100%).
Over the last 10 years, the total number of bathing waters increased by 5.9% (from 21,031 to 22,276). The 10-year average of the proportion of bathing waters with excellent quality shows that coastal bathing waters are 7.1% better than inland bathing waters. The non-EU Member States bordering Croatia (Montenegro, Serbia and Bosnia and Herzegovina) are still establishing or developing their bathing water quality monitoring programs. Overall, it is clear that there is considerable room for improvement in inland bathing water management and water quality monitoring.

Author Contributions

Conceptualization, S.J., D.V.L. and D.L.; methodology, A.C. and M.G.; data curation, D.G., V.B., S.M.-P., D.M. and N.M.; writing—original draft preparation, D.G., V.B., S.M.-P., D.M. and N.M.; writing—review and editing, S.J., D.K., D.V.L. and R.K.; supervision, D.K. and R.K.; project administration, D.L. and A.C.; funding acquisition, D.L., D.V.L., M.G., A.C. and S.J. All authors have read and agreed to the published version of the manuscript.

Funding

This work was supported by two research projects: The University of Rijeka “Adaptation to the new EU Bathing Water Directive” (project code: uniri-biomed-18-292) and Croatian Science Foundation “Towards the New European Union Bathing Water Directive”, EUROBATH, (IP-2020-02-1880).

Institutional Review Board Statement

Not applicable.

Informed Consent Statement

Not applicable.

Data Availability Statement

The data supporting the findings of this study are available within the article.

Acknowledgments

The authors would like to thank colleague Nemanja Malovrazić, Public Enterprise for Coastal Zone Management, Montenegro, for help with data collection.

Conflicts of Interest

The authors declare no conflict of interest.

References

  1. The European Parliament and the Council of the European Union. Directive 2006/7/EC of 15 February 2006 Concerning the Management of Bathing Water Quality and Repealing Directive 76/160/EEC; European Union: Brussels, Belgium, 2006. [Google Scholar]
  2. The Council of the European Communities. Council Directive 76/160/EEC of 8 December 1975 Concerning the Quality of Bathing Water; European Communities: Brussels, Belgium, 1975. [Google Scholar]
  3. European Environment Agency (EEA). Indicator Specification. Bathing Water Quality. Archived on 9 February 2021. Available online: https://www.eea.europa.eu/data-and-maps/indicators/bathing-water-quality (accessed on 28 July 2021).
  4. Anderson, K.L.; Whitlock, J.E.; Harwood, V.J. Persistence and differential survival of fecal indicator bacteria in subtropical waters and sediments. Appl. Environ. Microbiol. 2005, 71, 3041–3048. [Google Scholar] [CrossRef] [PubMed] [Green Version]
  5. Wade, T.J.; Pai, N.; Eisenberg, J.N.; Colford, J.M., Jr.; Do, U.S. Environmental Protection Agency water quality guidelines for recreational waters prevent gastrointestinal illness? A systematic review and meta-analysis. Environ. Health Perspect. 2003, 111, 1102–1109. [Google Scholar] [CrossRef] [PubMed]
  6. Korajkic, A.; McMinn, B.R.; Harwood, V.J. Relationships between Microbial Indicators and Pathogens in Recreational Water Settings. Int. J. Environ. Res. Public Health 2018, 15, 2842. [Google Scholar] [CrossRef] [PubMed] [Green Version]
  7. Rodrigues, C.; Cunha, M.Â. Assessment of the microbiological quality of recreational waters: Indicators and methods. Euro-Mediterr. J. Environ. Integr. 2017, 2, 25. [Google Scholar] [CrossRef] [Green Version]
  8. World Health Organization (WHO). WHO Recommendations on Scientific, Analytical and Epidemiological Developments Relevant to the Parameters for Bathing Water Quality in the Bathing Water Directive (2006/7/EC). Available online: https://circabc.europa.eu/d/d/workspace/SpacesStore/9e89152c-7cfe-4391-9bcf-c173519e8181/WHO-Recommendations-on-EC-BWD.pdf (accessed on 28 August 2021).
  9. Xiao, S.; Zhang, Y.; Zhao, X.; Sun, L.; Hu, S. Presence and molecular characterization of Cryptosporidium and Giardia in recreational lake water in Tianjin, China: A preliminary study. Sci. Rep. 2018, 8, 2353. [Google Scholar] [CrossRef] [PubMed] [Green Version]
  10. U.S. Environmental Protection Agency. Recreational Water Quality Criteria. EPA—820-F-12e058. Available online: https://www.epa.gov/sites/production/files/2015-10/documents/rwqc2012.pdf (accessed on 29 August 2021).
  11. ISO 9308-1. Water Quality—Enumeration of Escherichia coli and Coliform Bacteria—Part 1: Membrane Filtration Method for Waters with Low Bacterial Background Flora (ISO 9308-1:2014; EN ISO 9308-1:2014); International Organization for Standardization: Geneva, Switzerland, 2014. [Google Scholar]
  12. ISO 9308-3. Water Quality—Detection and Enumeration of Escherichia coli and Coliform Bacteria—Part 3: Miniaturized Method (Most Probable Number) for the Detection and Enumeration of E. coli in Surface and Waste Water; International Organization for Standardization: Geneva, Switzerland, 1998. [Google Scholar]
  13. ISO 7899-1. Water Quality—Detection and Enumeration of Intestinal Enterococci—Part 1: Miniaturized Method (Most Probable Number) for Surface and Waste Water; International Organization for Standardization: Geneva, Switzerland, 1988. [Google Scholar]
  14. ISO 7899-2. Water Quality—Detection and Enumeration of Intestinal Enterococci—Part 2: Membrane Filtration Method; International Organization for Standardization: Geneva, Switzerland, 2000. [Google Scholar]
  15. Jozić, S.; Vukić Lušić, D.; Ordulj, M.; Frlan, E.; Cenov, A.; Diković, S.; Kauzlarić, V.; Fiorido Đurković, L.; Stilinović Totić, J.; Ivšinović, D.; et al. Performance characteristics of the temperature-modified ISO 9308-1 method for the enumeration of Escherichia coli in marine and inland bathing waters. Mar. Pollut. Bull. 2018, 135, 150–158. [Google Scholar] [CrossRef] [PubMed]
  16. Tiwari, A.; Oliver, D.M.; Bivins, A.; Sherchan, S.P.; Pitkänen, T. Bathing Water Quality Monitoring Practices in Europe and the United States. Int. J. Environ. Res. Public Health 2021, 18, 5513. [Google Scholar] [CrossRef] [PubMed]
  17. Jozić, S.; Vukić Lušić, D. Report on Validation of Temperature Modified ISO 9308–1:2014 Method for the Enumeration of Escherichia coli in Bathing Water Sample; Institute of Oceanography and Fisheries: Split, Croatia, 2018. [Google Scholar]
  18. ISO 9308-2. Water Quality—Enumeration of Escherichia coli and Coliform Bacteria—Part 2: Most Probable Number Method; International Organization for Standardization: Geneva, Switzerland, 2012. [Google Scholar]
  19. Tiwari, A.; Niemelä, S.I.; Vepsäläinen, A.; Rapala, J.; Kalso, S.; Pitkänen, T. Comparison of Colilert-18 with miniaturised most probable number method for monitoring of Escherichia coli in bathing water. J. Water Health 2015, 14, 121–131. [Google Scholar] [CrossRef] [PubMed] [Green Version]
  20. European Environment Agency (EEA). European Bathing Water Quality in 2015. EEA Report No 9/2016. Available online: https://www.eea.europa.eu/publications/european-bathing-water-quality-2015 (accessed on 26 June 2021).
  21. World Health Organization (WHO). Guidelines for Safe Recreational Water Environments. Volume 1: Coastal and Fresh Waters; World Health Organization: Geneva, Switzerland, 2003. [Google Scholar]
  22. Official Gazette of the Republic of Croatia ”Narodne Novine” 73/2008. Regulation on Sea Bathing Water Quality; The Government of The Republic of Croatia: Zagreb, Croatia, 2008.
  23. Official Gazette of the Republic of Croatia ”Narodne Novine” 51/2014. Regulation on Bathing Water Quality; The Government of The Republic of Croatia: Zagreb, Croatia, 2014.
  24. European Environmental Agency (EEA). State of Bathing Water. Available online: https://www.eea.europa.eu/themes/water/europes-seas-and-coasts/assessments/state-of-bathing-water (accessed on 1 August 2021).
  25. Institute of Hydrometeorology and Seismology (IHMS). The State of Water Quality in Montenegro in 2018. Available online: http://www.meteo.co.me/page.php?id=57 (accessed on 26 June 2021).
  26. Public Enterprise for Coastal Zone Management. Monitoring of Bathing Water Quality on Public Beaches in Montenegro. Available online: http://www.monitoring.morskodobro.com/kupalista/prikaz/2020/?opstina=0& (accessed on 29 June 2021).
  27. Agency for Watershed of the Adriatic Sea (AWAS). Report on the State of Surface and Groundwaters Quality of the Adriatic Sea Basin in the FBiH for 2019. Available online: https://avpjm.jadran.ba/uploads/Izv_st_voda_19.pdf (accessed on 1 August 2021).
  28. Institute for Public Health of Serbia “Dr. Milan Jovanovic Batut. Report on the Hygiene Safety on the Surface Water Captured for Watersuply Used for Recreational Purpose in 2018. Available online: https://www.batut.org.rs/index.php?content=1419 (accessed on 27 July 2021).
  29. Galić, D.; Cenov, A.; Lušić, D.; Glad, M.; Jozić, S.; Cvetković, B.; Maestro, D.; Maestro, N.; Mance, D.; Vukić Lušić, D. Quality of Croatian inland bathing areas: Reference to the region and European Union. J. Health Sci. 2021, 11, 37–46. [Google Scholar] [CrossRef]
  30. European Statistical Office (EUROSTAT). Water Statistics. Water as a Resource. Available online: https://ec.europa.eu/eurostat/statistics-explained/index.php?title=Water_statistics#Water_as_a_resource (accessed on 29 August 2021).
  31. Official Gazette of the Republic of Serbia 74/2011. Regulation on the Parameters of Ecological and Chemical Status of Surface Waters and Parameters of Chemical Status and Quantitative Status of Groundwaters; Službeni glasnik Republike Srbije: Belgrade, Serbia, 2011.
  32. Official Gazette of the Republic of Serbia 50/2012. Regulation on Emission Limit Values of Polluting Substances in Surface and Groundwaters and Deadlines for Their Achievement; Službeni glasnik Republike Srbije: Belgrade, Serbia, 2012.
  33. Official Gazette of the Republic of Montenegro 27/2007. Water Law; Constitutional Assembly of the Republic of Montenegro: Republic of Montenegro, 2007.
  34. Official Gazette of Montenegro 2/2007. Regulation on Classification and Categorization of Surface and Groundwater; The Government of the Republic of Montenegro: Podgorica, Montenegro, 2007.
  35. Kolarević, S.; Kračun-Kolarević, M.; Jovanović, J.; Ilić, M.; Paunović, M.; Kostić-Vuković, J.; Martinović, R.; Jokanović, S.; Joksimović, D.; Pešić, V.; et al. Microbiological Water Quality of Rivers in Montenegro. In The Rivers of Montenegro; Pešić, V., Paunović, M., Kostianoy, A.G., Eds.; Springer International Publishing: Cham, Switzerland, 2020; pp. 135–155. [Google Scholar] [CrossRef]
  36. Official Gazette of the Federation of Bosnia and Herzegovina 70/2006. Water Law; Parliament of the Federation of BiH: Sarajevo, Bosnia and Herzegovina, 2006.
  37. Markovski, J.; Hristovski, K.D.; Olson, L.W. Chapter Eight—Comparative Analysis of Existing Water Resources Data in the Western Balkan States of Bosnia and Herzegovina, Macedonia, Montenegro, and Serbia. In Chemistry and Water; Ahuja, S., Ed.; Elsevier: Amsterdam, The Netherlands, 2017; pp. 301–327. [Google Scholar] [CrossRef]
  38. European Environmental Agency (EEA). European Bathing Water Quality in 2020. Available online: https://discomap.eea.europa.eu/bathingwaterstory/ (accessed on 3 August 2021).
  39. Mediterranean Action Plan Convention. Mediterranean 2017 Quality Status Report. Tourism. Available online: https://www.medqsr.org/mediterranean-2017-quality-status-report (accessed on 5 August 2021).
  40. Ferley, J.; Zmirou, D.; Balducci, F.; Fera, P.; Larbaight, G.; Jacq, E.; Moissonier, B.; Blineau, A.; Boudot, J. Epidemiological significance of microbial pollution criteria for river recreational waters. Int. J. Epidemiol. 1989, 18, 198–205. [Google Scholar] [CrossRef] [PubMed]
  41. Kay, D.; Fleisher, J.M.; Salmon, R.L.; Jones, F.; Wyer, M.D.; Godfree, A.F.; Zelenauch-Jacquotte, Z.; Shore, R. Predicting likelihood of gastroenteritis from sea bathing: Results from randomised exposure. Lancet 1994, 344, 905–909. [Google Scholar] [CrossRef]
  42. World Health Organization. Sustainable Development and Healthy Environments. Health Based Monitoring of Recreational Water: The Feasibility of a New Spproach. Available online: https://apps.who.int/iris/bitstream/handle/10665/66477/WHO_SDE_WSH_99.1.pdf?sequence=1&isAllowed=y (accessed on 2 August 2021).
Figure 1. The number of inland bathing sites in Croatia in the period 2011–2020.
Water 13 02440 g001
Figure 2. The number of inland bathing sites in the EU in the 2011 and 2020 bathing season.
Water 13 02440 g002
Figure 3. The share of inland bathing waters with excellent water quality in HR and the EU during the period 2011–2020.
Water 13 02440 g003
Figure 4. The average share of inland bathing sites of poor water quality in EU countries during the 2011–2020 period.
Water 13 02440 g004
Figure 5. The quality of inland bathing waters in EU Member States in 2020.
Water 13 02440 g005
Figure 6. Ten-year average of inland bathing water quality in HR and neighboring EU Member States.
Water 13 02440 g006
Figure 7. The number of coastal bathing sites in EU in the 2011 and 2020 bathing seasons.
Water 13 02440 g007
Figure 8. Number of coastal bathing sites in relation to the length of the coastline in EU Member States.
Water 13 02440 g008
Figure 9. The share of coastal bathing waters with excellent water quality for HR and EU during the period 2011–2020.
Water 13 02440 g009
Figure 10. The average share of coastal bathing sites of poor quality in the EU countries during the period 2011–2020.
Water 13 02440 g010
Figure 11. The quality of coastal bathing waters in EU Member States during 2020.
Water 13 02440 g011
Figure 12. Ten-year average of coastal bathing water quality in Croatia and neighboring EU Member States.
Water 13 02440 g012
Figure 13. Inland and coastal bathing water quality in the EU between 2011 and 2020.
Water 13 02440 g013
Publisher’s Note: MDPI stays neutral with regard to jurisdictional claims in published maps and institutional affiliations.

