
Application of Stage-Fall-Discharge Rating Curves to a Reservoir Based on Acoustic Doppler Velocity Meter Measurement Data


1
K-Water Research Institute, Daejeon 34045, Korea
2
Forecast and Control Division, Geum River Flood Control Office, Ministry of Environment, Gongju 32595, Korea
3
Division for Integrated Water Management, Korea Environmental Institute, Sejong 30147, Korea
4
Department of Agricultural and Rural Engineering, Chungnam National University, Daejeon 34134, Korea
*
Authors to whom correspondence should be addressed.
†
These authors equally contributed to this study as corresponding authors.
Water 2021, 13(17), 2443; https://doi.org/10.3390/w13172443
Submission received: 16 July 2021
/
Revised: 31 August 2021
/
Accepted: 2 September 2021
/
Published: 5 September 2021
(This article belongs to the Section Hydraulics and Hydrodynamics)
Abstract
:The applicability of the stage-fall-discharge (SFD) method in combination with acoustic Doppler velocity meter (ADVM) data, upstream of a hydraulic structure, specifically, the Sejong-weir located in the Geum River, Korea, was examined. We developed three rating curves: a conventional simple rating curve with the data measured using an acoustic Doppler current profiler (ADCP) and floating objects, an SFD rating curve with the data measured using the ADCP and floating objects, and an SFD rating curve with the data measured using an ADVM. Because of the gate operation effect, every rating curve involved many uncertainties under 1000 m3/s (3.13 m2/s, specific discharge). In terms of the hydrograph reconstruction, compared with the conventional simple rating curve, the SFD developed using ADVM data exhibited a higher agreement with the measured data in terms of the pattern. Furthermore, the measured discharge over 1000 m3/s primarily ranged between 97.5% and 2.5% in the graph comparing the ratio of the median and observed discharge. Based on this experiment, it is confirmed that the SFD rating curve with data to represent the backwater effect, such as ADVM data, can reduce the uncertainties induced by the typical rating curve
1. Introduction
River discharge data from watersheds are of significance in establishing a water resource management plan. Nevertheless, the continuous measurement of the flow discharge is challenging, and thus, the corresponding data can be determined by measuring the water stage with a rating curve, which is a regression curve to represent the relationship between the water stage and discharge. Although the simple form in which the rating curve is expressed as a power function is useful for hydrologic analysis when the gauging points satisfy the assumption of the rating curve, the river geomorphology changes continuously if a river hydraulic structure is installed to ensure flood control and water supply. Moreover, because river hydraulic structures are installed at key locations for water resource management, the relationship between the water stage and discharge becomes more complex with channel or section control.
Thus, estimating the discharge upstream of hydraulic structures is becoming increasingly important, as these data are essential to ensure reservoir operation and water resource management. Various studies have been conducted to estimate the discharge. Wesphal et al. [1] proposed a looped rating curve considering unsteady flow characteristics, and Gergov and Karagiozova [2] used the channel width as a variable for a rating curve to reproduce the non-linear relationship between the water stage and discharge. In addition, Retian and Petersen-Øverleir [3] proposed a looped rating curve to consider unsteady flow characteristics based on the Ornstein–Uhlenbeck process.
However, these typical rating curves involve certain limitations in reflecting unsteady flow characteristics, backwater effects, and flow control in rivers because they are based on a one-to-one function in the form of a logistic regression curve. To solve these problems, several approaches such as those involving the stage-fall-discharge (SFD) relation [4,5,6], hydraulic performance graph (HPG) [7], or hydraulic modeling [8,9,10] have been proposed.
The SFD approach, also known as the twin-gauge approach, was developed to represent the change in the water surface between two gauging stations [4,6,11,12]. Petersen-Øverleir and Retian [6] proposed a method to estimate the parameters of the rating curve by considering the backwater effect based on the Bayesian approach. In their method, the parameters of the simplified hydraulic equation (rating curve) were estimated based on the Bayesian approach, with the prior and posterior probabilities based on their experience and measured data, respectively. Unlike a data-driven model or an artificial neural network (ANN) model, the rating curve with estimated parameters can be driven by the SFD, although the SFD approach is less physically representative compared to the former two approaches, because it is a stochastic method.
An HPG is composed of multiple hydraulic performance curves (HPCs), which represent the relation between the water stage and discharge under the backwater condition and unsteady flow, among other cases. Schmidt [7] developed an HPG based on the shallow water equation, neglecting the acceleration term. When determining the flow discharge using an HPG, data regarding the predefined reference discharge, Froude number, actual pressure gradient and additional information regarding the cross-section are required. Thus, the HPG does not tend to represent the relationship between the water stage and discharge as a simple equation, as in the case of the general rating curve, which limits its practical application. Furthermore, compared to the SFD, the HPG requires more data and involves a more complex process to develop the relevant equation.
In the hydraulic modeling approach, a rating curve is established based on the result of a hydraulic model with a particle filter considering the uncertainties in the water stage and discharge [8]. In addition, the looped rating curve based on unsteady flow characteristics can be identified considering the result of a two-dimensional hydraulic model. Lee and Kwon [9] utilized a two-dimensional hydraulic model (RMA2) to examine the transition of the rating curve. Moreover, Lee and Gang [10] tried to estimate the discharge and Manning’s n by applying the DWOPER model to the location in which the water stage is measured at three consecutive gauging stations. The hydraulic modeling approach involves the same limitation as that of the HPG approach, and thus a simple form of the stage–discharge relationship cannot be derived. Moreover, two-dimensional hydraulic modeling requires considerably larger amounts of data and effort compared to the other two methods.
Among these three approaches, the SFD is the most robust method in the practical sense because the simple form of the rating curve can be derived, which has been widely used in the relevant domain. However, the existing literature [6] involves only a limited number of case studies of the SFD because its verification against reliable data is challenging. In this study, the SFD approach proposed by Petersen-Øverleir and Retian [6] is applied to the region upstream of the Sejong weir in Korea, and the applicability of this approach is verified. Verification against reliable data is not trivial because this process is necessary to improve the reliability or investigate the limitation of methodology. Two sets of data, measured using an acoustic Doppler current profiler (ADCP) with floating objects and acoustic Doppler velocity meters (ADVMs) are used. ADVMs adopt the Doppler principle to measure the water velocities in a two-dimensional plane of stream. The river discharge can be converted from the stage, with the mean velocity measured using ADVMs. In general, ADVMs have an advantage over the typical rating curve in the respect of real-time base discharge data considering the unsteady flow characteristics and backwater effect. However, the costs for installation and maintenance, as well as technical issues for measurement of data calibration considering regional flow characteristics, are obstacles to the practical applications of ADVMs. The SFD approach is an attractive alternative because it considers backwater or unsteady flow effect with less cost as compared to ADVM. The performance of the SFD rating curve was compared with ADVM measurement data.
2. Methods
SFD Rating Curves
The SFD method proposed by Petersen-Øverleir and Retian [6] is adopted. The approach calculates the slope of the water surface between a certain gauging station and the auxiliary upstream or downstream gauging station. Two cases exist, in which the backwater effect is considered and not considered, as shown in Equation (1). Moreover, it is assumed that no lateral inflows occur between the twin gauges, and the channel morphology and vegetation remain constant.
where is the discharge, and are the vectors of the hydraulic/geometric parameters functions and , respectively, is a vector of the parameter shared by functions and , and and represent the water stage upstream and downstream, respectively.
When the downstream water stage () lies lower than the gauge height of zero flow (GZF) of the upstream region (), and the slope of the twin gauging station is sufficiently large, it is assumed that backwater effect does not occur. Thus, Equation (1) can be rewritten considering the GZF as in Equation (2).
where and indicate the GZF of the upstream and downstream regions, respectively. Note that Petersen-Øverleir and Retian [6] simplified the equation based on the assumption that and are equal; however, Mansanarez et al. [12] indicated that the rating curve may become unrealistic under such assumption. Thus, in this study, the original equation [13], Equation (3), is utilized for the case in which the flow is affected by the variable backwater.
To estimate the parameters of Equations (2) and (3), the Bayesian method is applied, as described by Retian and Petersen-Øverleir [14]. The prior distribution of each parameter is set as follows: Log() is positive and follows a normal distribution with the expectation and standard deviation parameters being and , respectively. Moreover, is independent of , but it is also the positive and follows a normal distribution, with the expectation and standard deviation parameters being and , respectively. This relationship between Log() and can be calculated by considering the bivariate normal distribution with parameters , , , , and , where is a correlation parameter. In addition, another exponent , , and are also positive and follow a normal distribution with the expectation and standard deviation parameters being , , and and , , and , respectively. The measurement error is generated considering an inverse gamma distribution, with the rate and shape hyper parameters being and , respectively.
To estimate the parameters, the likelihood of the calculated discharge against the measured discharge is calculated based on the assumption that the error follows the normal distribution. Finally, the parameters of the distribution can be estimated by estimating the posterior distribution in comparison with the observed data based on a Markcov chain Monte Carlo simulation. Detailed information regarding the estimation process can be found in the works of Petersen-Øverleir and Reitan [6] and Retian and Petersen-Øverleir [14].
3. Study Area and Data
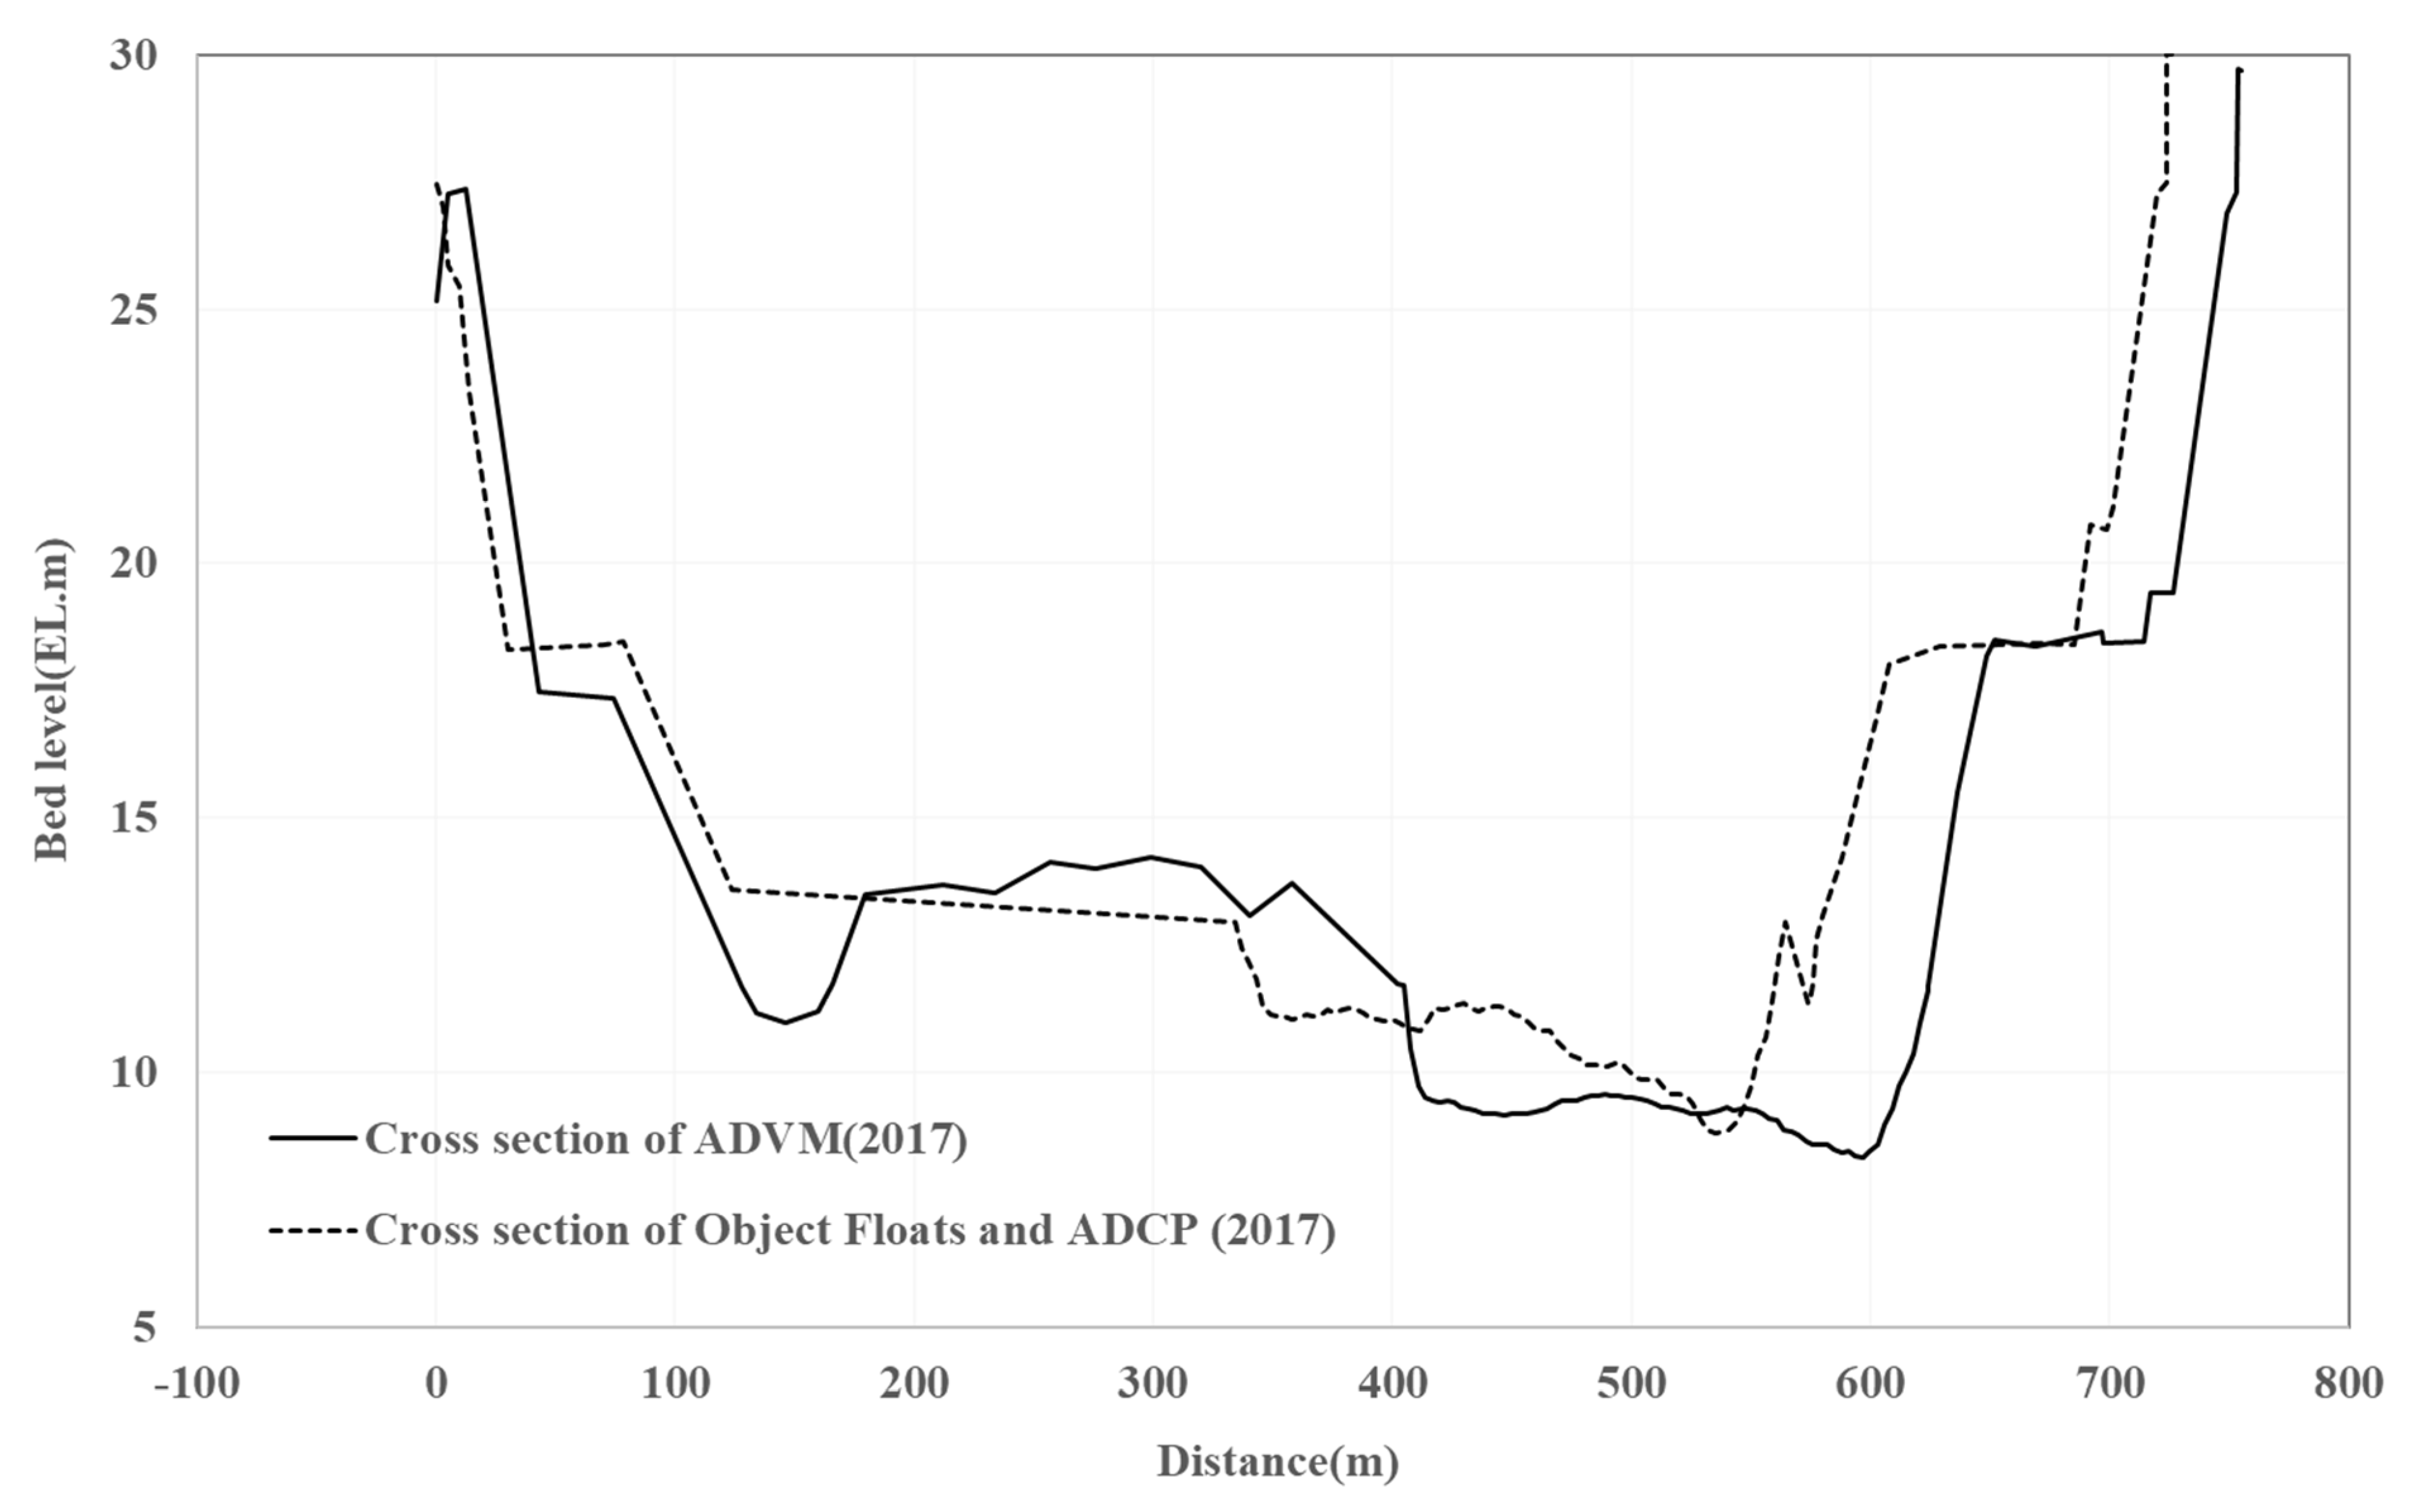
The study area is the upstream region of the Sejong weir located in the Geum River in Korea (Figure 1). The river includes two water stage gauging stations that also measured the discharge. Specifically, the water stage is measured at Sejong-ri (upstream) and Geum nam Br., and the discharge is measured using ADVMs between Sejong-ri and Haetmuri Br. and an ADCP and floating objects at Haetmuri Br. As shown in Table 1, Geum nam Br. is 1 km upstream of Sejong weir, and Sejong-ri is 4.5 km upstream of Geum nam Br. Therefore, the water stages of Geum nam Br. and Sejong-ri are considered as the downstream and upstream water stages in the proposed method, respectively. Because the water stages of Geum nam Br. and Sejong-ri are directly affected by the gate operation of the Sejong weir, conversion from the water stage to discharge through a typical rating curve cannot effectively consider the backwater effect. In addition, Figure 2 shows the cross sections of measuring discharge using ADVM and ADCP or floating objects.
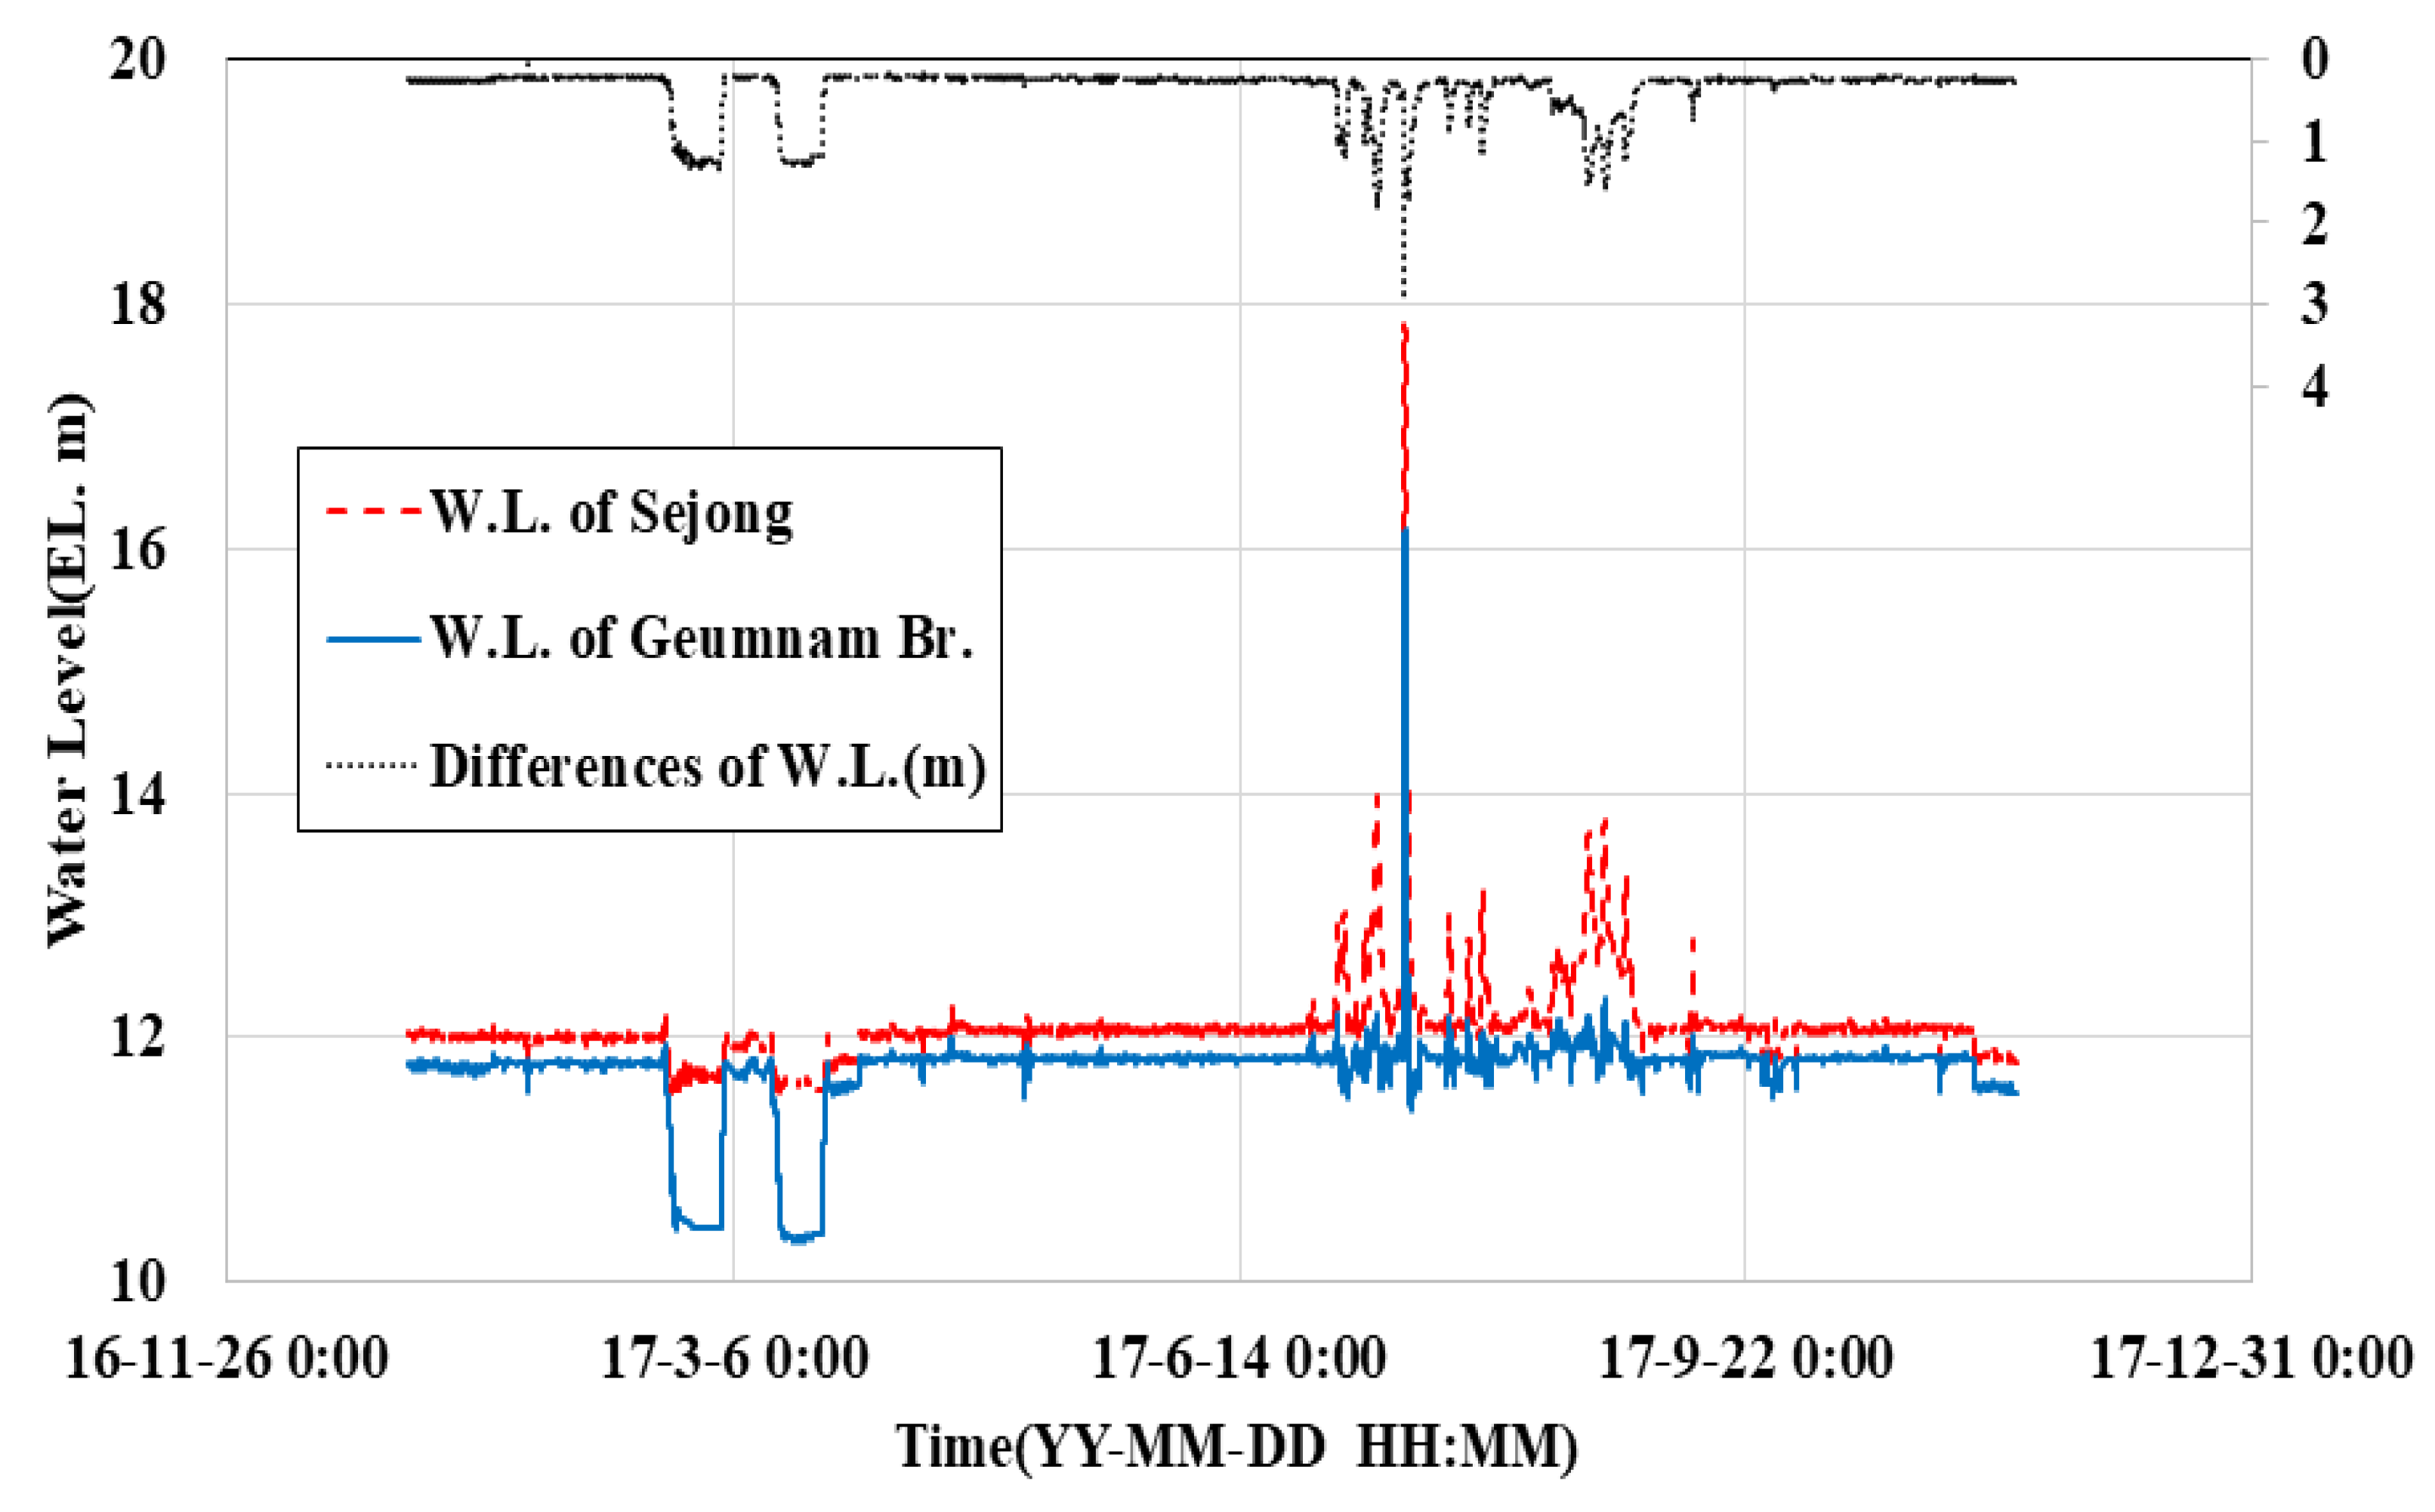
The gap in the water stages of Geum nam Br. and Sejong-ri in 2017 is shown in Figure 3. The large differences in the water stages in March 2017 can be attributed to the gate operation of the Sejong weir, and the change in the discharge can be attributed to the sudden change in the flow velocity.
To apply the method, two sets of discharge data are used. The discharge for the first set is measured using floating objects (over 1000 m3/s, 14 data points) and the ADCP (under 1000 m3/s, 23 data points) at Geum nam Br. from 21 February 2017 to 14 November 2017. The water stage is the average value at the start time and end time of the discharge measurement at each water stage gauging station. These data are referred to as “ADCP data”. The second set of data are ADVM data obtained at 10 min intervals from 1 January 2017 to 14 November 2017. When applying the proposed method based on the Bayesian approach, the use of an excessive amount of data may lead to memory and computational problems. Therefore, the available data points (45,513) are reduced to 356 points by excluding certain data. (1) The data observed in July are only used since the largest flood occurred in July. (2) The data with discharge over 750 m3/s (3.23 m2/s, specific discharge) was used without data reduction. (3) Among the data with discharge under 750 m3/s, the data with water level change of less than 5 cm in time series was removed.
4. Results
4.1. SFD Rating Curves
The rating curve derived based on the ADCP data can be expressed as in Equation (4) and is shown in Figure 4. In Figure 4, the vertical axis indicates the upstream water stage (Sejong-ri) and the horizontal axis indicates the discharge to intuitively illustrate the change in the flow discharge according to the water stage change. Each line indicates the water stage of the downstream station (Geum nam Br.). Therefore, the discharge estimation considering the backwater effect can be performed using Equation (4) when the water stages of the two gauging stations are known.
where is the discharge, and and are represent the water stages at Sejong-ri and Geum nam Br., respectively.
The rating curve derived based on the ADVM data can be expressed as in Equation (5) and is shown in Figure 5.
To evaluate the uncertainties in the equations, the mean absolute percentile error (MAPE), root mean square error (RMSE), ratio of the root mean square error to the standard deviation of measured data (RSR), and coefficient of determination (R2) are introduced. The calculation results are presented in Table 2.
where is the number of samples, and are the measured discharge and calculated discharge, respectively, and are the average of the measured discharge and calculated discharge, respectively, and indicates the order of samples.
For a smaller RMSE, RSR and R2 are closer to zero and one, respectively, indicating a higher agreement between the calculated and observed values. As shown in Table 2, the MAPE of the rating curve derived using the ADVM data is larger than that of the rating curve derived by the ADCP data because the errors in the ADVM data in the low flow range are relatively large. The maximum percentile errors for each sample in the ADCP and ADVM data are 52.8% and 133.8%, respectively. However, the indicators, namely, MAPE, RMSE, RSR, and R2, indicate that the rating curve derived from the ADVM data is reasonable.
The GZF of the upstream and downstream regions in Equation (4) based on ADCP data is larger than that in Equation (5) based on ADVM data, and the parameters of the equation are different. This phenomenon occurs because the ADCP data does not consider gate operations. The water level at Geum nam Br., upstream of the Sejong weir, is generally maintained at approximately 11.8 m, but the water level is occasionally reduced to 10.3 m due to the gate operation. Thus, the errors in the rating curve derived using the ADVM data can be attributed to the sample data measured at a low water level.
Most of the 10-min-interval ADVM data were measured at low water levels, and thus the effect of the data concentrated at the low water level can be minimized by removing the sample data for overlapping water levels to increase the regression accuracy. To construct a rating curve by using automatic flow rate measurement data, additional research must be performed on a sampling technique to develop the SFD rating curve.
4.2. Error Distribution of SFD Rating Curves
Figure 6 shows the upper limit (97.5%), lower limit (2.5%), and measured data divided by the calculated value derived from the ADCP data. Most of the measured data are located between the upper and lower limits, and the ratio of the measured data to the calculated value ranges from 1.6 to 0.68. The large differences between the observed and calculated values are observed mainly below 1000 m3/s, likely because of the effect of the opening and closing of the sluice gate.
Figure 7 shows the upper limit (97.5%), lower limit (2.5%), and measured data divided by the calculated value derived from ADVM data. Most of the measured data are located between the upper and lower limits, and the ratio of the measured data to the calculated value ranges from 1.45 to 0.44. As in the results shown in Figure 6, large difference between the observed and calculated values can be noted mainly below 1000 m3/s. The difference between the calculated and observed values in the case of the ADVM data is larger than that for the field data because of the automatic flow rate measurement uncertainty and because a large part of the ADVM data pertains to low flow rate sections. In addition, when automatic flow rate measurement data are used, considerable changes in the flow rate may occur even when the upstream and downstream water levels are the same. Therefore, future research must be focused on calculating the representative flow rate.
4.3. Comparison between SFD and the General-Regression-Based Rating Curve
Equation (10) represents the typical multi-segmented rating curve, which is proposed by Kim et al. [15], derived from field data without considering the backwater effect.
where is the discharge, and is the water stage.
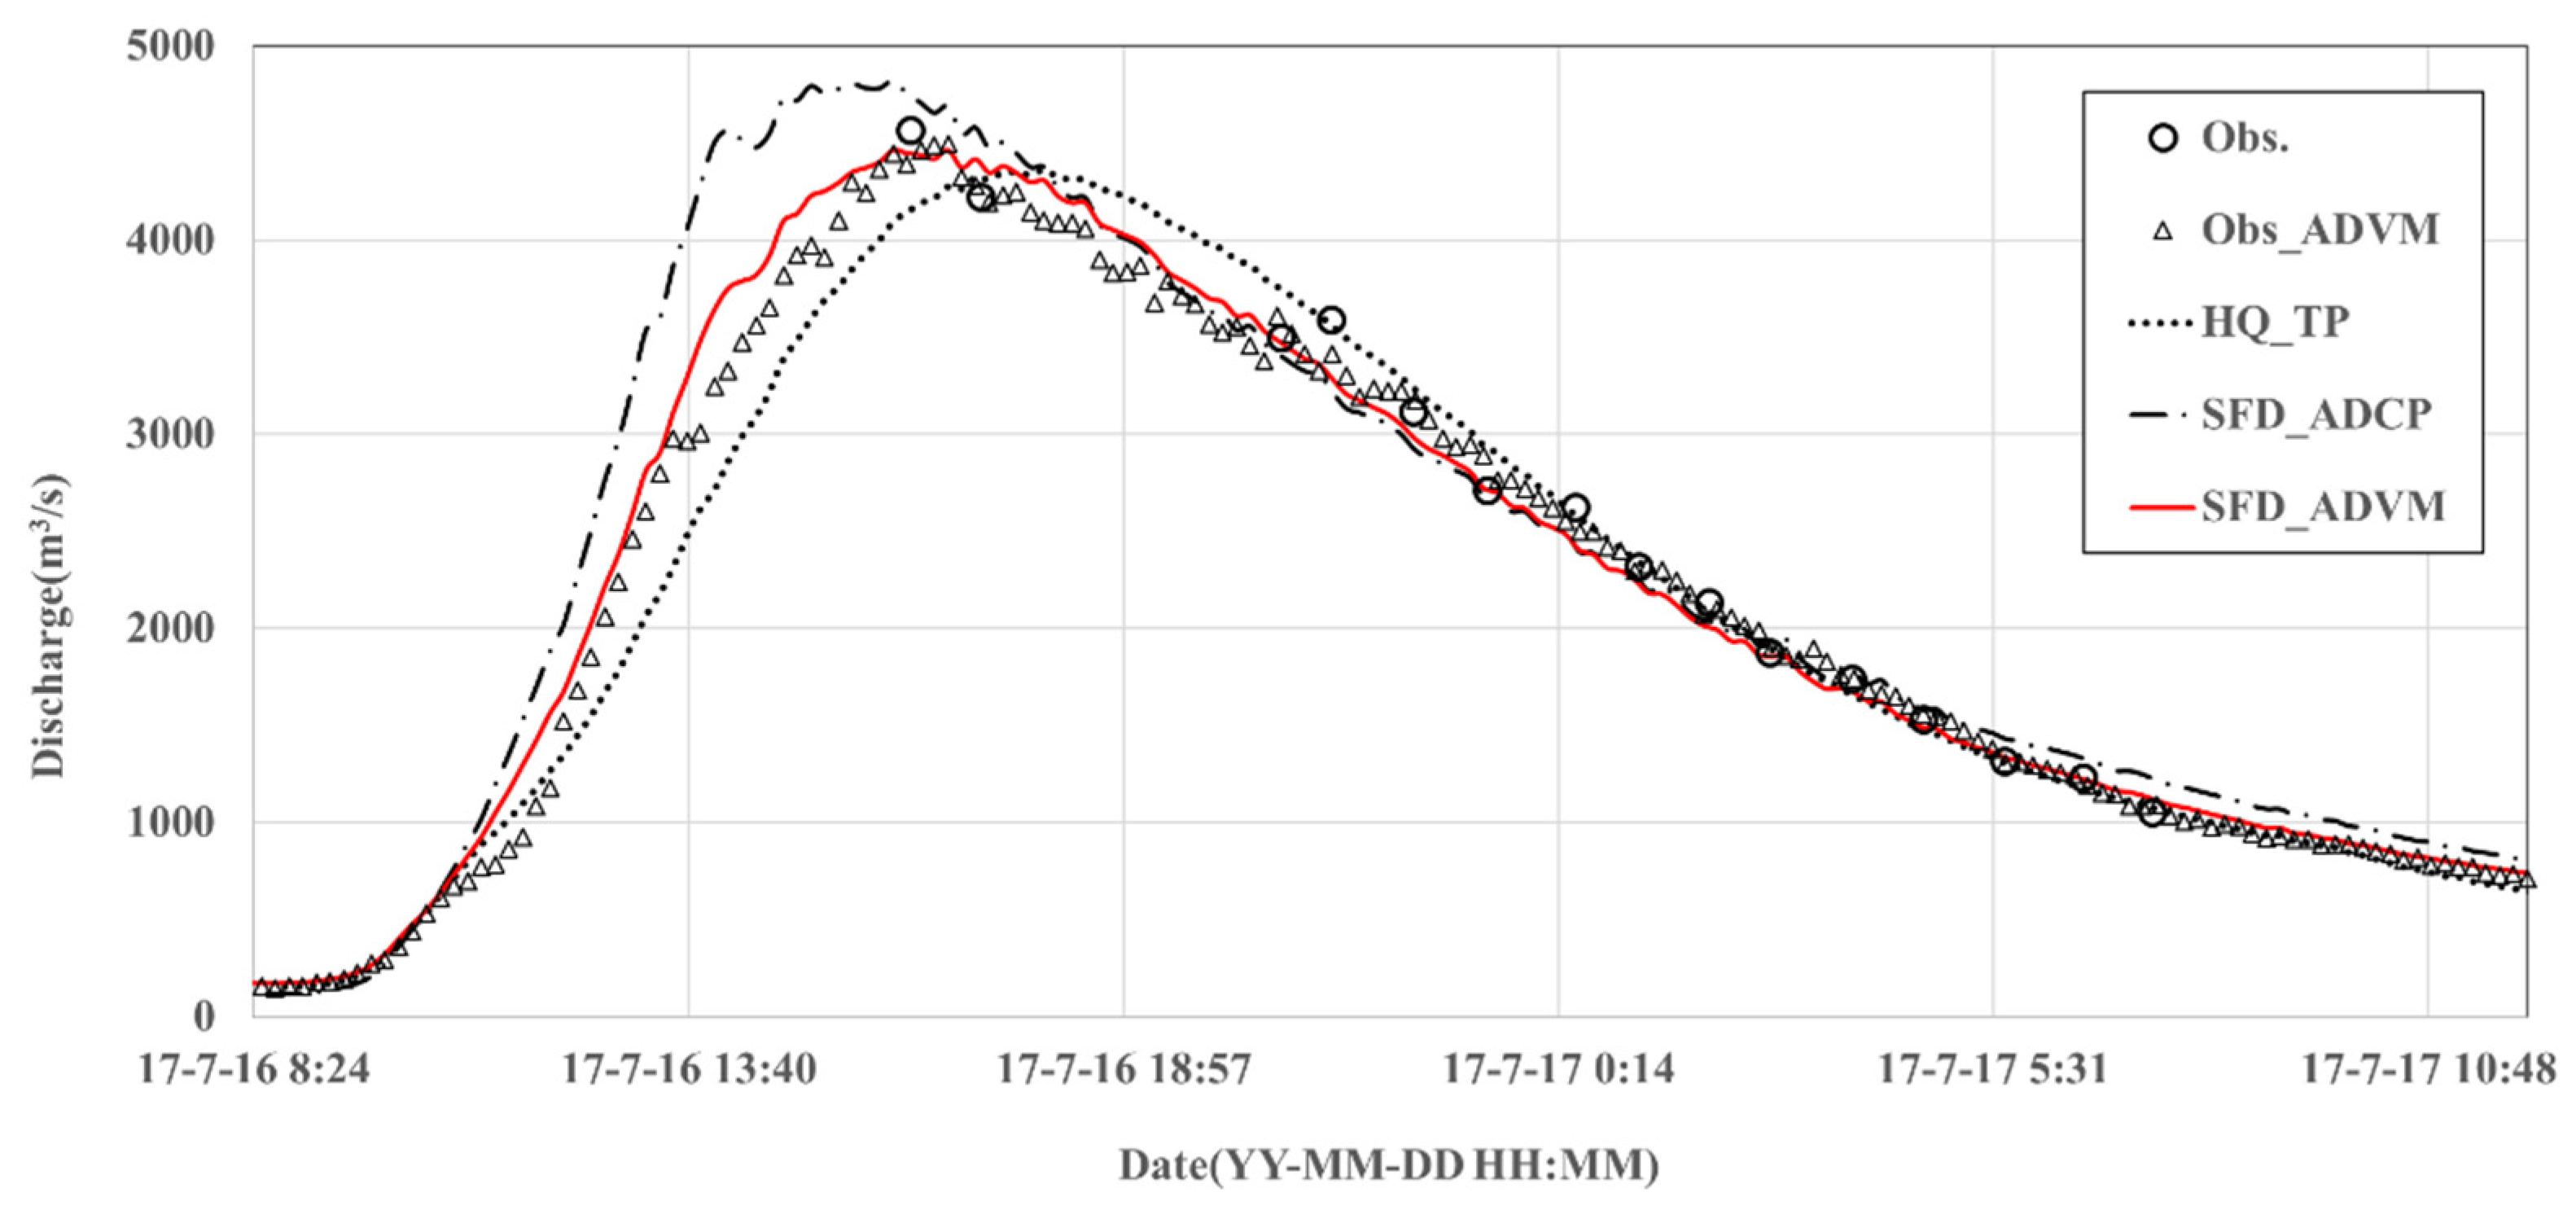
To evaluate the reproducibility of the hydrograph, the hydrograph (Obs_ADVM) based on the data measured in 10-min-intervals by the ADVM at Sejong station is compared with the hydrographs converted from the water stage by the rating curves shown in Figure 8. HQ_TP indicates the hydrograph from the typical rating curve without considering the backwater effect (Equation (10)), and SFD_ADCP and SFD_ADVM indicate the hydrographs generated using the SDF rating curve based on ADCP and ADVM data, respectively. The hydrographs (SFD_ADCP and SFD_ADVM) considering the backwater effect exhibit a similar peak time to that of the measured hydrograph; however, the hydrograph (HQ_TP) based on the typical method exhibits a different peak time compared to that of the measured hydrograph. This finding shows that the typical method cannot be effectively applied in the region in which the backwater effect occurs (Table 2). As shown in Table 3, even when the water level at Sejong-ri station is high (17.8 m), the discharge is smaller than that at the lower water level (17.65 m) because the water surface slope (difference in the upstream and downstream water levels) at the lower water level is high.
Table 4 lists the estimated errors of the hydrograph reproduced by each rating curve against ADCP and ADVM data. The error calculated based on the ADCP data is rather large in the rating curve without considering the backwater effect, although that for the ADVM data is small. This finding demonstrates that the rating curve considering the backwater effect, based on enough data, can express the pattern of the hydrograph in a more representative manner. For the rating curve established based on the resampled ADVM data, the shape of the hydrograph is similar to that shown in Figure 8; then, the quantitative error is relatively small compared to other methods. To apply the proposed rating curve using ADVM data, additional research must be performed on the appropriate sampling methods.
5. Conclusions
Several years ago, many hydraulic structures were installed in the major rivers in Korea. Consequently, the previously derived typical rating curves are no longer valid due to the backwater effect and operation of hydraulic structures. SFD rating curves represent an attractive alternative approach to the conventional rating curve in practical aspects because they derive a simple form of the equation, which is similar to the typical rating curve equation. In this study, the SFD approach proposed by Petersen-Øverleir and Retian [6] is applied to the upstream region of the Sejong-weir in Korea, and the applicability of this approach is verified.
SFD rating curves are constructed using two sets of data pertaining to the ADCP and ADVM. Subsequently, the hydrographs reconstructed using the rating curves, SFD_ADCP, SFD_ADVM and the typical rating curve (HQ_TP), are compared with the ADCP and ADVM data. The hydrograph generated using SFD_ADVM is in agreement with the observed data. In contrast, a lag phenomenon can be observed in the hydrograph generated by HQ_TP, and the hydrograph generated using SFD_ADCP exhibits an overestimation tendency in the rising limb. The different patterns against the observed data can be attributed to the time difference at water level gauging stations and lack of observation data (ADCP). The results of the experiments confirmed that the SFD approach may be particularly useful when sufficient data are available to explain phenomena such as the variable backwater due to the hydraulic structure.
However, the SFD approach can not consider the effect of the gate operation, and thus, the adaptable distance from the hydraulic structure and the water level gauging station must be examined to apply this method. In this study, a criterion involving a value of approximately 1000 m3/s is considered to evaluate the influence of the gate operation and flow regime on the variable slope. This aspect is determined using the graph comparing the ratio of the median and observed discharge.
In practical applications, the simple formulation based on the SFD approach is of significance in estimating the reservoir inflow at the upstream hydraulic structure. Further research must be focused on the sampling, outlier detection, and parameter estimation for the SFD approach.
Author Contributions
Analysis and writing—original draft preparation, Y.K.; investigation, S.L.; resources and data curation, S.O.; writing—review and editing, J.B.; supervision, H.A. All authors have read and agreed to the published version of the manuscript.
Funding
This research is supported by Korea Ministry of Environment as “The SS projects; 2019002830001”.
Institutional Review Board Statement
Not applicable.
Informed Consent Statement
Not applicable.
Data Availability Statement
The Korean stage-fall-discharge data measured by the Flood control office in Korea were used in the case studies, and the source code, downloadable at http://www.folk.uio.no/trondr/hydrasub/ratingcurve.html (accessed on 30 July 2020), was adopted.
Conflicts of Interest
The authors declare no conflict of interest.
References
- Westphal, J.A.; Thompson, D.B.; Stevens, G.T., Jr.; Strauser, C.N. Stage-Discharge Relations on the Middle Mississippi River. J. Water Resour. Plan. Manag. 1999, 125, 48–53. [Google Scholar] [CrossRef]
- Gergov, G.; Karagiozova, T. Unique discharge rating curve based on the morphology parameter Z. Int. Assoc. Hydrol. Sci. Publ. 2003, 278, 3–8. [Google Scholar]
- Reitan, T.; Petersen-Øverleir, A. Dynamic rating curve assessment in unstable rivers using Ornstein-Uhlenbeck processes. Water Resour. Res. 2011, 47. [Google Scholar] [CrossRef]
- Fenton, J.D.; Keller, R.J. The Calculation of Streamflow from Measurements of Stage; CRC for Catchment Hydrology: Boca Raton, FL, USA, 2001. [Google Scholar]
- Herschy, R.W. Streamflow Measurement; CRC Press: Boca Raton, FL, USA, 2002. [Google Scholar]
- Petersen-Øverleir, A.; Reitan, T. Bayesian analysis of stage-fall-discharge models for gauging stations affected by variable backwater. Hydrol. Process. 2009, 23, 3057–3074. [Google Scholar] [CrossRef]
- Schmidt, A.R. Analysis of stage-discharge relations for open channel flow and their associated uncertainties. Ph.D. Thesis, University of Illinois at Urbana-Champaign, Champaign, IL, USA, 2002. [Google Scholar]
- Kim, Y.; Tachikawa, Y.; Kim, S.; Shiiba, M.; Yorozu, K.; Noh, S.J. Simultaneous estimation of inflow and channel roughness using 2D hydraulic model and particle filters. J. Flood Risk Manag. 2013, 6, 112–123. [Google Scholar] [CrossRef]
- Lee, J.J.; Kwon, H.H. A basic study of stage-discharge rating stabilization at the Ssang-chi Gauging station. J. Korean Soc. Civ. Eng. 2010, 30, 81–87. [Google Scholar]
- Lee, S.H.; Gang, S.U. Stream discharge estimation by hydraulic channel routing and stage measurement. J. Korea Water Resour. Assoc. 2001, 34, 543–549. [Google Scholar]
- Corbett, D.M. Stream-Gaging Procedure, a Manual Describing Methods and Practices of the Geological Survey; US Government Printing Office: Washington, DC, USA, 1943. [Google Scholar] [CrossRef]
- Mansanarez, V.; Le Coz, J.; Renard, B.; Lang, M.; Pierrefeu, G.; Vauchel, P. Bayesian analysis of stage-fall-discharge rating curves and their uncertainties. Water Resour. Res. 2016, 52, 7424–7443. [Google Scholar] [CrossRef] [Green Version]
- Bayesian Hydraulic Rating Curve Programs. Available online: http://folk.uio.no/trondr/hydrasub/ratingcurve.html (accessed on 30 July 2020).
- Reitan, T.; Petersen-Øverleir, A. Bayesian power-law regression with a location parameter, with applications for construction of discharge rating curves. Stoch. Environ. Res. Risk Assess. 2008, 22, 351–365. [Google Scholar] [CrossRef]
- Kim, Y.; Kim, J.Y.; An, H.U.; Jung, K.S. Improvement of the method using the coefficient of variation for automatic multi-segmentation method of a rating curve. J. Korea Water Resour. Assoc. 2015, 48, 807–816. [Google Scholar] [CrossRef]
Figure 1.
Locations of measuring water level and discharge.

Figure 2.
Cross sections of measuring discharge.

Figure 3.
Water levels at Sejong-ri and Geum nam Br. gauging stations and the differences between the values.
Figure 3.
Water levels at Sejong-ri and Geum nam Br. gauging stations and the differences between the values.

Figure 4.
Rating curve considering the backwater effect based on 38 measured data points.

Figure 5.
Rating curve considering the backwater effect based on ADVM data.

Figure 6.
Ratio of median and observed discharge measured using ADCP.

Figure 7.
Ratio of median and observed discharge measured using ADVM.

Figure 8.
Comparison of hydrographs at the Sejong station.


Table 1.
Location and specifications of the gauging station.
| Location | Latitude | Longitude | Gauge Height of Zero Flow | Distance from Outlet (km) |
|---|---|---|---|---|
| Geum nam Br. | 127-16-15 | 36-28-40 | 10.308 | 102.49 |
| Sejong-ri | 127-18-09 | 36-30-20 | 11.336 | 106.99 |
Table 2.
Error in the equations for each data set.
| Classification | MAPE | RMSE | RSR | R2 |
|---|---|---|---|---|
| SFD_ADCP | 12.72% | 149.922 | 0.119 | 0.994 |
| SFD_ADVM | 11.43% | 114.245 | 0.091 | 0.996 |
Table 3.
Measured water level and discharge.
| Time | W.L. at Geum Nam Br. (EL. m) | W.L. at Sejong-ri (EL. m) | Measured Q |
|---|---|---|---|
| 2017.7.16 21:19 | 15.72 | 17.08 | 3594.04 |
| 2017.7.16 20:45 | 15.87 | 17.32 | 3498.74 |
| 2017.7.16 16:15 | 15.64 | 17.65 | 4566.66 |
| 2017.7.16 17:09 | 15.97 | 17.8 | 4223.44 |
Table 4.
Estimated RMSE of the hydrograph from July to September, reproduced considering the rating curves with ADCP data and ADVM data measured from July to September.
Table 4.
Estimated RMSE of the hydrograph from July to September, reproduced considering the rating curves with ADCP data and ADVM data measured from July to September.
| Classification | ADVM Data | ADCP Data |
|---|---|---|
| HQ_TP (Typical rating curve) | 68 | 102 |
| SFD_ADCP (SFD using ADCP data) | 84 | 136 |
| SFD_ADVM (SFD using ADVM data) | 61 | 99 |
Publisher’s Note: MDPI stays neutral with regard to jurisdictional claims in published maps and institutional affiliations. |
© 2021 by the authors. Licensee MDPI, Basel, Switzerland. This article is an open access article distributed under the terms and conditions of the Creative Commons Attribution (CC BY) license (https://creativecommons.org/licenses/by/4.0/).
Share and Cite
MDPI and ACS Style
Kim, Y.; Oh, S.; Lee, S.; Byun, J.; An, H. Application of Stage-Fall-Discharge Rating Curves to a Reservoir Based on Acoustic Doppler Velocity Meter Measurement Data. Water 2021, 13, 2443. https://doi.org/10.3390/w13172443
AMA Style
Kim Y, Oh S, Lee S, Byun J, An H. Application of Stage-Fall-Discharge Rating Curves to a Reservoir Based on Acoustic Doppler Velocity Meter Measurement Data. Water. 2021; 13(17):2443. https://doi.org/10.3390/w13172443
Chicago/Turabian StyleKim, Yeonsu, Sungryul Oh, Seungsoo Lee, Jisun Byun, and Hyunuk An. 2021. "Application of Stage-Fall-Discharge Rating Curves to a Reservoir Based on Acoustic Doppler Velocity Meter Measurement Data" Water 13, no. 17: 2443. https://doi.org/10.3390/w13172443
Note that from the first issue of 2016, this journal uses article numbers instead of page numbers. See further details here.