
Pilot-Scale Groundwater Monitoring Network for Earthquake Surveillance and Forecasting Research in Korea


1
Earth System Sciences Research Center, Yonsei University, Seoul 03722, Korea
2
Department of Geological Sciences, Pusan National University, Busan 46241, Korea
3
Department of Earth System Sciences, Yonsei University, Seoul 03722, Korea
*
Author to whom correspondence should be addressed.
Water 2021, 13(17), 2448; https://doi.org/10.3390/w13172448
Submission received: 24 July 2021
/
Revised: 26 August 2021
/
Accepted: 2 September 2021
/
Published: 6 September 2021
(This article belongs to the Special Issue Earthquakes and Groundwater)
Abstract
:Although there is skepticism about the likelihood of predictive success, research on the prediction of an earthquake through precursory changes in natural parameters, including groundwater, has continued for decades. One of the promising precursors is the changes in groundwater, i.e., the level and composition of groundwater, and the monitoring networks are currently operated to observe earthquake-related changes in several countries situated at the seismically active zone. In Korea, the seismic hazards had not been significantly considered for decades since the seismic activity was relatively low; however, the public demands on the management and prediction of earthquakes were raised by two moderate-size earthquakes which occurred in 2016 and 2017. Since then, a number of studies that were initiated in Korea, including this study to establish a pilot-scale groundwater-monitoring network, consisted of seven stations. The network is aimed at studying earthquake-related groundwater changes in the areas with relatively high potentials for earthquakes. Our study identified a potential precursory change in water levels at one particular station between 2018 and 2019. The observed data showed that most monitoring stations are sufficiently isolated from the diurnal natural/artificial activities and a potential precursory change of water level was observed at one station in 2018. However, to relate these abnormal changes to the earthquake, continuous monitoring and analysis are required as well as the aid of other precursors including seismicity and geodetic data.
1. Introduction
The forecasting or predicting of earthquakes includes forewarnings on the time of occurrence, location, and scale of future earthquakes. Notably, the difference between the two terms lies in their specific approach, with forecasting referring to the probability of future earthquakes, and earthquake predictions offering specific information on target earthquakes, including the related range of magnitude and Spatio-temporal window [1]. Although there is skepticism about the prediction of earthquakes [2], attempts to predict or forecast the occurrence of earthquakes have continued in recent decades. Research on earthquake prediction or forecasting relies upon methods of distinguishing the presence and characteristics of precursory changes from observational data of geophysical or geochemical factors as well as seismic activities in a particular region. These parameters include electric and magnetic fields, gas emissions from the earth, as well as water levels and temperature, surface temperature, surface deformations, and seismicity [3,4]. In addition, changes in the ionosphere were investigated regarding their potential for earthquake predictions or early warnings [5,6,7,8]. Based on those observation, countries situated in seismically active zones regularly conduct monitoring and research in an attempt to reduce the impacts of earthquakes [4,9,10,11,12].
Among the various precursors of earthquakes, groundwater is considered one of the most promising predictive parameters [13], with changes in water levels prior to earthquakes having been recorded from early historic times [14]. Notably, the success of the Haicheng earthquake prediction relates to observations of changes in groundwater as well as the abnormal behavior of animals [15]. Currently, studies on earthquake surveillance and prediction using groundwater monitoring data are referred to as earthquake hydrology or hydroseismology, and being conducted in seismically active zones in the United States [9,16], China [12], Japan [17], Taiwan [18,19], and India [20].
However, there remains a somewhat pessimistic view of the usefulness of precursory studies on groundwater. For example, Bakun et al. [21] commented that no precursory changes were observed prior to the occurrence of certain earthquakes in the United States, even at long-term monitoring sites. In addition, the responses of groundwater relating to earthquakes result from the complex interaction of various factors such as the magnitude of the earthquake, distance from the epicenter, hydrogeological settings, and design of monitoring well as well as instrument failure and human error; the hydrogeological settings include the types of aquifers, bedrocks, and the existence of faults in vicinity area. In addition, the precursory signals have seldom provided their reproducibility as Skelton et al. [10] pointed out. King et al. [22] considered the main difficulties in finding the true precursors as the followings: (1) the unrisen anticipated earthquake in the densely monitored area, (2) discordances in monitoring sites of related parameters, (3) sensitivity of monitoring sites, (4) the influences of various environmental variables, (5) limitation of observation periods for producing data and information on the instrumental failures, and (6) lack of understanding on underlying mechanisms. In addition, a study on the occurrence of precursory changes including seismicity, surface deformation, geo-electromagnetism, and underground fluids indicated that the precursory changes do not occur before every earthquake [23].
Although no successful prediction has been addressed since the Haicheng earthquake in China, residents of towns in Sichuan Province were successfully evacuated before the M7.9 Wenchuan earthquake after abnormal groundwater changes were observed in wells [24]. Besides that, Yue [23] investigated 24 earthquakes that had been successfully or partially predicted in China between 1975 and 2001 to investigate the forecasting of earthquakes through seismicity, ground deformation, geo-electric/magnetic fields, groundwater, and other data. Of the 24 investigated earthquakes, 17 included observations of pre-earthquake variations in groundwater. Furthermore, groundwater played a key role in 13 earthquakes. In addition, changes in seismicity sequences, ground deformation, and geo-electric/magnetic fields were observed for earthquakes 22, 16, and 14, respectively [23]. These results indicate that groundwater monitoring could be a promising tool for the prediction of earthquakes, and highlight the necessity for multidisciplinary studies with other parameters. In addition, the precursory changes in groundwater are thought to be related to the changes of crustal volumetric strain [9], or the static and dynamic stress changes [25].
Within this context, several studies have suggested that the occurrence time, variation pattern, degree, and spatial distribution of changes in water level and quality could assist in predicting the occurrence time, location, and magnitude of earthquakes [4,26,27,28]. Based on the experimental results, empirical equations were developed to estimate the earliest time that precursory water level and/or quality changes by the magnitude of the earthquake based on observational data in some countries [29,30,31,32]. However, there are still challenges to groundwater monitoring for earthquake surveillance. The water level, an indicator of pressure changes in the aquifer, can be influenced by various parameters as well as earthquakes [33]. Therefore, the analysis and explanation of abnormal changes in water level require numerous supportive data to exclude the effects of other causes. In addition, though the changes in geochemical components can more easily be related to earthquakes, there is still a difficulty in the quantitative explanation of varied concentration and the relationship between magnitudes.
In Korea, genuine researches on earthquake-related groundwater changes had been started in the late 2000s by independent researchers. Hamm et al. [34] investigated changes in groundwater levels of Jeju Island, Korea during the 2004 Sumatra and 2008 Wenchuan earthquakes. Later, co-seismic water-level changes caused by inland or off-shore earthquakes were investigated using a pre-existing governmental monitoring system [35,36,37,38,39,40,41,42]. Although Woo et al. [43] and Lee et al. [44] attempted to distinguish precursory abnormal water-level fluctuations, the most of studies in Korea have focused on the co-seismic responses of groundwater to distant and large earthquakes. Since the start of instrumental monitoring of earthquakes in 1978, a total of 1687 seismic events of magnitude 2.0 or higher were recorded in Korea. Of these, 424 were felt earthquakes. In 2016 and 2017, Korea experienced ML5.8 and ML5.4 earthquakes, respectively, which struck the southeastern province of the Korean peninsula. Although these earthquakes had a magnitude of less than six, they represent the two largest events in Korea since the initiation of instrumental monitoring.
Pre-existing monitoring networks, which were used in previous research in Korea, were established by the government for regional water management with the purpose of simultaneously monitoring several aquifers. For example, the National Groundwater Monitoring Network of Korea (MGMN) has three sections to monitor the average status of regional groundwater level and quality for water management [45]. On the other hand, the screen is equipped for the fractured aquifer beneath the alluvial layer in the Rural Groundwater Monitoring Network (RGMN) and Seawater Intrusion Monitoring Network (SIMN) [46]. Therefore, the changes in groundwater relating to earthquakes could be masked, overestimated or underestimated by the interaction between aquifers. Subsequently, the demands were raised on the monitoring wells which monitor the specific aquifer or fault zone among researchers who are interested in earthquake hydrology or hydroseismology.
Recently, several projects were initiated for the prediction of earthquakes and hazard management responding to the public demand in Korea after two moderate-scale earthquakes occurred in 2016 and 2017. One of those projects is the establishment of a pilot-scale groundwater monitoring network in the areas showing relatively high potentials for earthquakes. The network consists of seven wells that were installed between late 2017 and March 2019 at staggered times. Currently, one of them is closed in October 2019 at the request of the landlord. Although the groundwater fluctuation is recorded every minute, the system is operated as a pseudo-real-time system of which data is hourly transmitted. This groundwater monitoring network eventually aims at the demonstration of earthquake hydrology in Korea for earthquake surveillance and prediction. In this paper, we introduce the pilot-scale monitoring system of Korea and present the notable changes observed between 2018 and 2020.
2. Materials and Methods
After taking social and scientific variables into consideration, pilot-scale monitoring stations were installed in the following three areas: Seoul, Yangsan, and Pohang (Figure 1). Seoul is the capital city of Korea, with a population of 9.66 million (2020) or 26 million, if considering the larger metropolitan area [47]. Historical reports during the Chosen dynasty refer to several seismic events that possibly caused damage to the greater Seoul region [48]. The second monitoring region, the Yangsan area, is intersected by the Yangsan fault zone, the largest lineament in the southeastern province of the Korean Peninsula. This strike-slip fault stretches approximately 200 km from Pusan to Yeongdeok [49]. The fault was recently identified as an active fault after detailed investigation [50] and was related to the 2016 M5.8 Gyeongju earthquake, the largest seismic event since 1978. The economic damage caused by the Gyeongju earthquake amounted to 9.2 million dollars [51]. The northern margin of the Yangsan Fault passes through the western part of Pohang City. Fourteen months after the Gyeongju event, an M5.4 earthquake occurred in eastern Pohang, resulting in economic losses of 46 million dollars [52]. Liquefaction occurred together with building failures and water-level changes in the region [53], with 3–4 cm of surface deformation measured through the analysis of satellite images [54]. The activity of an unknown fault contributed to the Pohang earthquake, while several hydraulic injections were conducted for the enhanced geothermal system between 2015 and 2017 [55], at the site where apart 600 m from the epicenter.
With the support of the local government and individuals, the location for each station was selected, and monitoring stations were installed. Monitoring stations were numbered according to the order of installation (Table 1). Each station was equipped with an automatic conductivity, temperature, and depth of water (CTD) logger (OTT PLS-C, manufactured by OTT HydroMet, Kempten Germany), and electric power was supplied through a solar power system. In mid-2019, electric equipment was installed at MW4, MW6, and MW7 for a stable power supply. Of the seven stations, the first one, MW1, was established at Yangsan in 2017 and used as a primary test station before the installation of the remaining stations. In 2018 and 2019, another four and two stations were installed, respectively; MW2 was installed in Seoul, while MW3–MW7 were installed in Pohang city, approximately 80 km northeast of Yangsan. During the installation of the later six stations, core samples were collected from the bedrock through rotary washing drilling to investigate the local geology. The obtained NX-size (54.7 mm diameter) core samples were stored in MW5 with the exception of MW2, which was kept at Yonsei University, Seoul. Once the loggers were installed, the stations were fenced with metallic frames. Water level, temperature, and electrical conductivity (EC) were recorded every minute and automatically sent to a server at Yonsei University every hour. However, EC data are only used as a secondary index because of the complexity of the composition-change mechanism. To prevent alteration of water-level and composition, we do not conduct the water sampling except MW2 which was used as the educational station. In addition, the waters of MW3–MW5 were sampled once for gas sampling in February 2018.
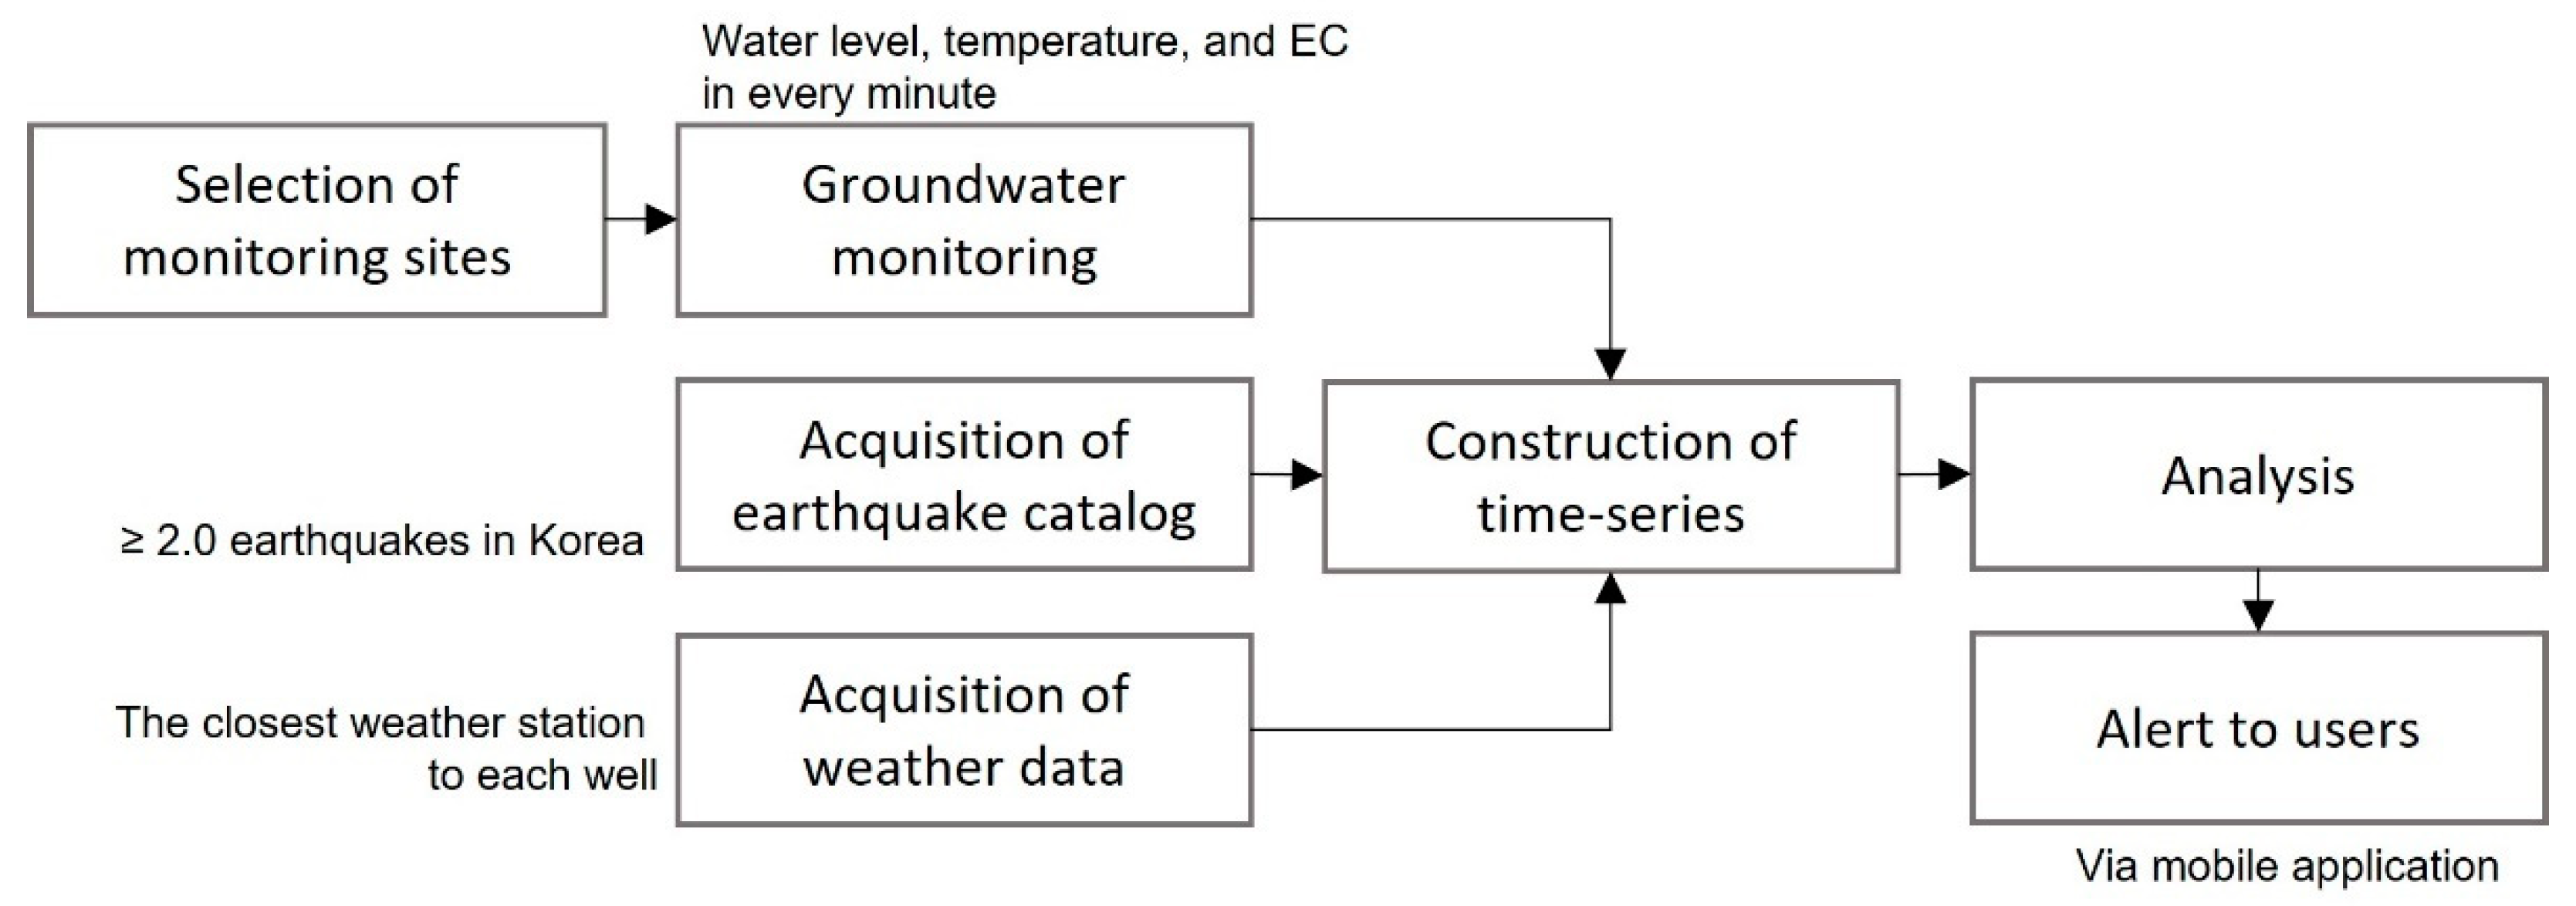
Figure 2 shows the overall workflow in this study. After the site was selected, we installed a borehole to monitor groundwater. Once the observation data are sent to the server, they are copied to the database established by MySQL. Then, the data analysis is automatically started using the displacement between observational intervals, relative changes for the mean amplitude of fluctuation in specific time windows, and trends in different time scales. If the data are not sent to the server or abnormal changes are detected, the notice is pushed via the mobile application to users; currently, the mobile application was developed only for the android system. We also can show and analyze the groundwater data with GUI (graphic user interface) program. More detailed information can be found on the Figures S1–S3.
Station MW1 is located on the Yangsan Campus of Pusan National University, which lies within the Yangsan fault zone. Specifically, the station is located 1.9 km from the fault line [56]. The Yangsan stream flows along the fault, at approximately 1.8 km from MW1. In this area, the Triassic intrusive rock penetrated the Triassic Bulguksa granite and the alluvial layer is superposed along the Yangsan stream. As the well was originally installed to observe the development of fractures in the fault zone, the borehole is open to the bedrock, which starts from 42.5 m below the surface. The casing was set inside the upper alluvial part to protect the well. As a result of optic logging, the predominant dip of the fractures was identified as 60NE A diver-type CTD logger was installed by a research team of Pusan National University in 2010 to record groundwater levels. The logging interval was originally set at either 1 or 3 min. Using the CTD logger, a potential precursory anomaly was observed before the Gyeongju earthquake [57], with water levels increasing continuously from July 2015, although the water level before 2014 showed a decline in the winter season. As part of the pilot-scale groundwater monitoring system for earthquake surveillance, a new automatic logger replaced the CTD logger on 20 October 2017, at a depth of 97.5 m. Notably, data recording was discontinued from late May 2020 owing to a power supply issue.
Station MW2 is one of four stations installed in 2018 and is located near a trail on Mt. Ansan (296 m above mean sea water level) at Yonsei University, Seoul. The Jurassic granite penetrated the Precambrian banded gneiss in the northern part around the well and the alluvial layer is developed along the Han River. The thickness of unsaturated zone was 3.7 m near the well. During coring, a fault was identified between 93.8 and 94.1 m below the surface and groundwater-related fracture zones were confirmed at zones from 38.0–48.3 m and 93.5–95.0 m with log tests using EC, resistivity, and temperature. Based on these results, open tube was installed between 92 and 97 m, penetrating fractured granite. One of the tributaries of the Han River runs approximately 1.16 km west of the well.
The bedrock of western bank of the Yangsan fault in the Pohang area consists of the Cretaceous granites and sedimentary rocks with intrusive rocks, while the eastern bank is composed of the Yeonil Group, the Miocene sedimentary rocks. Stations MW3, MW6, and MW7 were installed near the Yangsan Fault, which cuts across the center of the western Pohang area. Station MW3 was installed in the fault damage zone and fractured or weathered Cretaceous biotite granite and granite gneiss were observed during drilling. The groundwater-related fractures were observed at 38.5–41.5, 50.5–54.5, 72.0–75.8, 82.7–85.7, and 91.5–96.5 m below the ground surface, and then, the screening interval of 91 and 100 m was determined to observe the changes in the deeper groundwater flows. A small stream, 50 m away from the borehole MW3, runs into a reservoir approximately 330 m south of the well. The land was used for the church at the time of installation, surrounded by rural fields and residences. Station MW6 was established on the west bank of the Yangsan Fault, while MW7 was located on the east bank of the fault. Station MW6 penetrates unconsolidated sandstone and conglomerate underlying gravel and sand layers in the mid-slope of Mt. Doeum (383 m from mean sea water level), while station MW7 was drilled in the upper catchment of Mt. Bihak (764 m from mean sea water level), with bedrock consisting of diorite porphyrite, tuff, and andesite. In the MW6 station, fractures were developed well below 36.70 m, therefore, the screen section was installed between 75.5 and 84.5 m below the surface. On the other hand, the potential flow paths of groundwater in MW7 were observed in 21.2–24.0, 40.5–42.2, 54.5–62.5, 67.0–72.0 m sections. However, during the borehole drilling, the weathered wall was collapsed to the bottom, and subsequently, the screen was inserted between 63 and 68 m below the surface. Both the MW6 and MW7 are included in city land for recreational facilities. Groundwater is used by the Doeumsan Forest Experience Center’s public pool in summer as well as for neighboring domestic residences and restaurants. In addition, the Bihak Recreational Forest operates a pool during the summer season with 18 accommodation units. Although the wells are located in the public area, the approaches by the public are limited. Notably, the depths of MW6 and MW7 are shallower than those of the other monitoring wells because of borehole collapse during drilling due to the fractured bedrock.
Stations MW4 and MW5 were installed in the vicinity of a public gymnasium and the Pohang Accelerator Laboratory (PAL) in the eastern region of Pohang, respectively. The site selection of both sites was based on the epicenter of the 2017 M5.4 Pohang earthquake, which occurred in the east of the Pohang area and caused damage to the area. Station MW4 is located 2.2 km from the epicenter on the flat ground, while MW5 is situated on the mid-slopes of Mt. Jigoksan (96 m above mean sea water level) and the Hyeongsan River, which flows eastwards. An unconsolidated Quaternary alluvial layer lies on igneous and sedimentary rocks of the Jurassic, Cretaceous, and Tertiary periods by an unconformity in the region [58]. The unconsolidated sand underlies 90 m-thick mud at MW4; therefore, the screening interval was decided to be installed between 90 and 100 m. On the other hand, the property abnormal zones of MW5 were observed in 19.0–21.0, 24.5–26.0, 37.6–39.5, 57.3–60.0, 85.4–88.0, 91.0–94.0 m. Thus, the open tubes were inserted between 91–100 m, penetrating the Tertiary claystone. The surface of the public gymnasium is concrete-paved, while MW5 is situated near a road at the laboratory. In terms of water usage, laboratories and dormitories of PAL and Pohang University of Science and Technology (POSTECH), as well as downstream regions, rely on the public water-supply facilities as a primary water source; the groundwater is used for mainly agricultural activities in this area including the valley area beyond Mt. Jigoksan where are used for agricultural purposes.
Currently, six of the seven stations are operational as MW3 was closed after changes to land ownership in October 2019. With the exception of MW1, which was excavated in 2010, well logging was conducted at each station to identify potential flow paths. Logging data included results of electric resistivity, natural gamma rays, temperature, and electric conductivity tests (Figure S4, Table S1). Based on the results of well logging, a range of screen sections for each station was determined. The length of the screening interval was set at 5 or 10 m based on the condition of the bedrock. The bottom of the well was closed. Besides that, optical imaging was used to obtain images of borehole walls prior to the insertion of perforate and imperforate tubes for station MW1–MW4.
3. Results
3.1. Aquifer Types
In this study, harmonic analyses on water level data were used to identify aquifer types. Of all tidal components, the principal lunar diurnal O1 (25.819 h), lunisolar diurnal K1 (23.934 h), principal lunar M2 (12.421 h), principal solar S2 (12.000 h), and larger lunar elliptic N2 (12.658 h) are considered significant for analyzing water level fluctuations [59]. Rahi and Halihan [60] developed a method of using these five components to determine the confinement of aquifers. According to their method, the M2 component is related to confined aquifers as the signature of tidal effects, while it is negligible in unconfined aquifers. In semi-confined aquifers, the M2 component can also be identified in the frequency domain, but the power of M2 is smaller than that of the S2 component. While water-level data at 15-min intervals were used in the original study, in this study we used 1-min interval data obtained in the dry season to minimize the influence of precipitation, with the exception of MW6 and MW7, where 0.1 mm precipitation was recorded. Instrumental failure up to a few minutes was corrected by interpolation before harmonic analysis, with the differencing filter applied to eliminate linear trends as follows:
where d and h are the filtered and original data, respectively. Calibration and analyses were conducted using MATLAB 2019b (MathWorks Inc., Natick, Massachusetts, United States).
d(i) = h(i) − h(i − 1) i = 2, …, length(h),
Our results indicate that stations MW1 and MW7 showed the signature of confined aquifers, while the others could not be determined in the given period (Table 2, Figure S5). In MW1, the M2 component was the dominant signal. The diurnal components O1 and K1 were not identified in the frequency domain, while the effects of M2 and S2 could be distinguished clearly. The dominant signal of MW7 was M2 and the diurnal component was identified in the frequency domain as well as MW1. The ratios between noise and signal were low in MW2–6. However, considering the results of the harmonic analyses, water level fluctuations of MW2 and MW6 appeared to be controlled by longer-period factors, which are expressed in cycles per day. On the other hand, the results of MW3–5 showed relatively small and unclear signals, although the power of the M2 signal seemed larger than that of the S2 signal in both MW3 and MW4. Station MW4 was initially assumed to be a confined aquifer since the thick layer of clay overlaid the unconsolidated sands and water level fluctuation was not sensitive to precipitation events. However, the results of harmonic analyses indicated that further investigation is necessary to identify the aquifer type. In addition, the dominant signal of MW6 had a period of 40 h, which did not seem related to natural parameters and subsequently, continuous monitoring is required for longer-term.
3.2. Water-Level Fluctuations
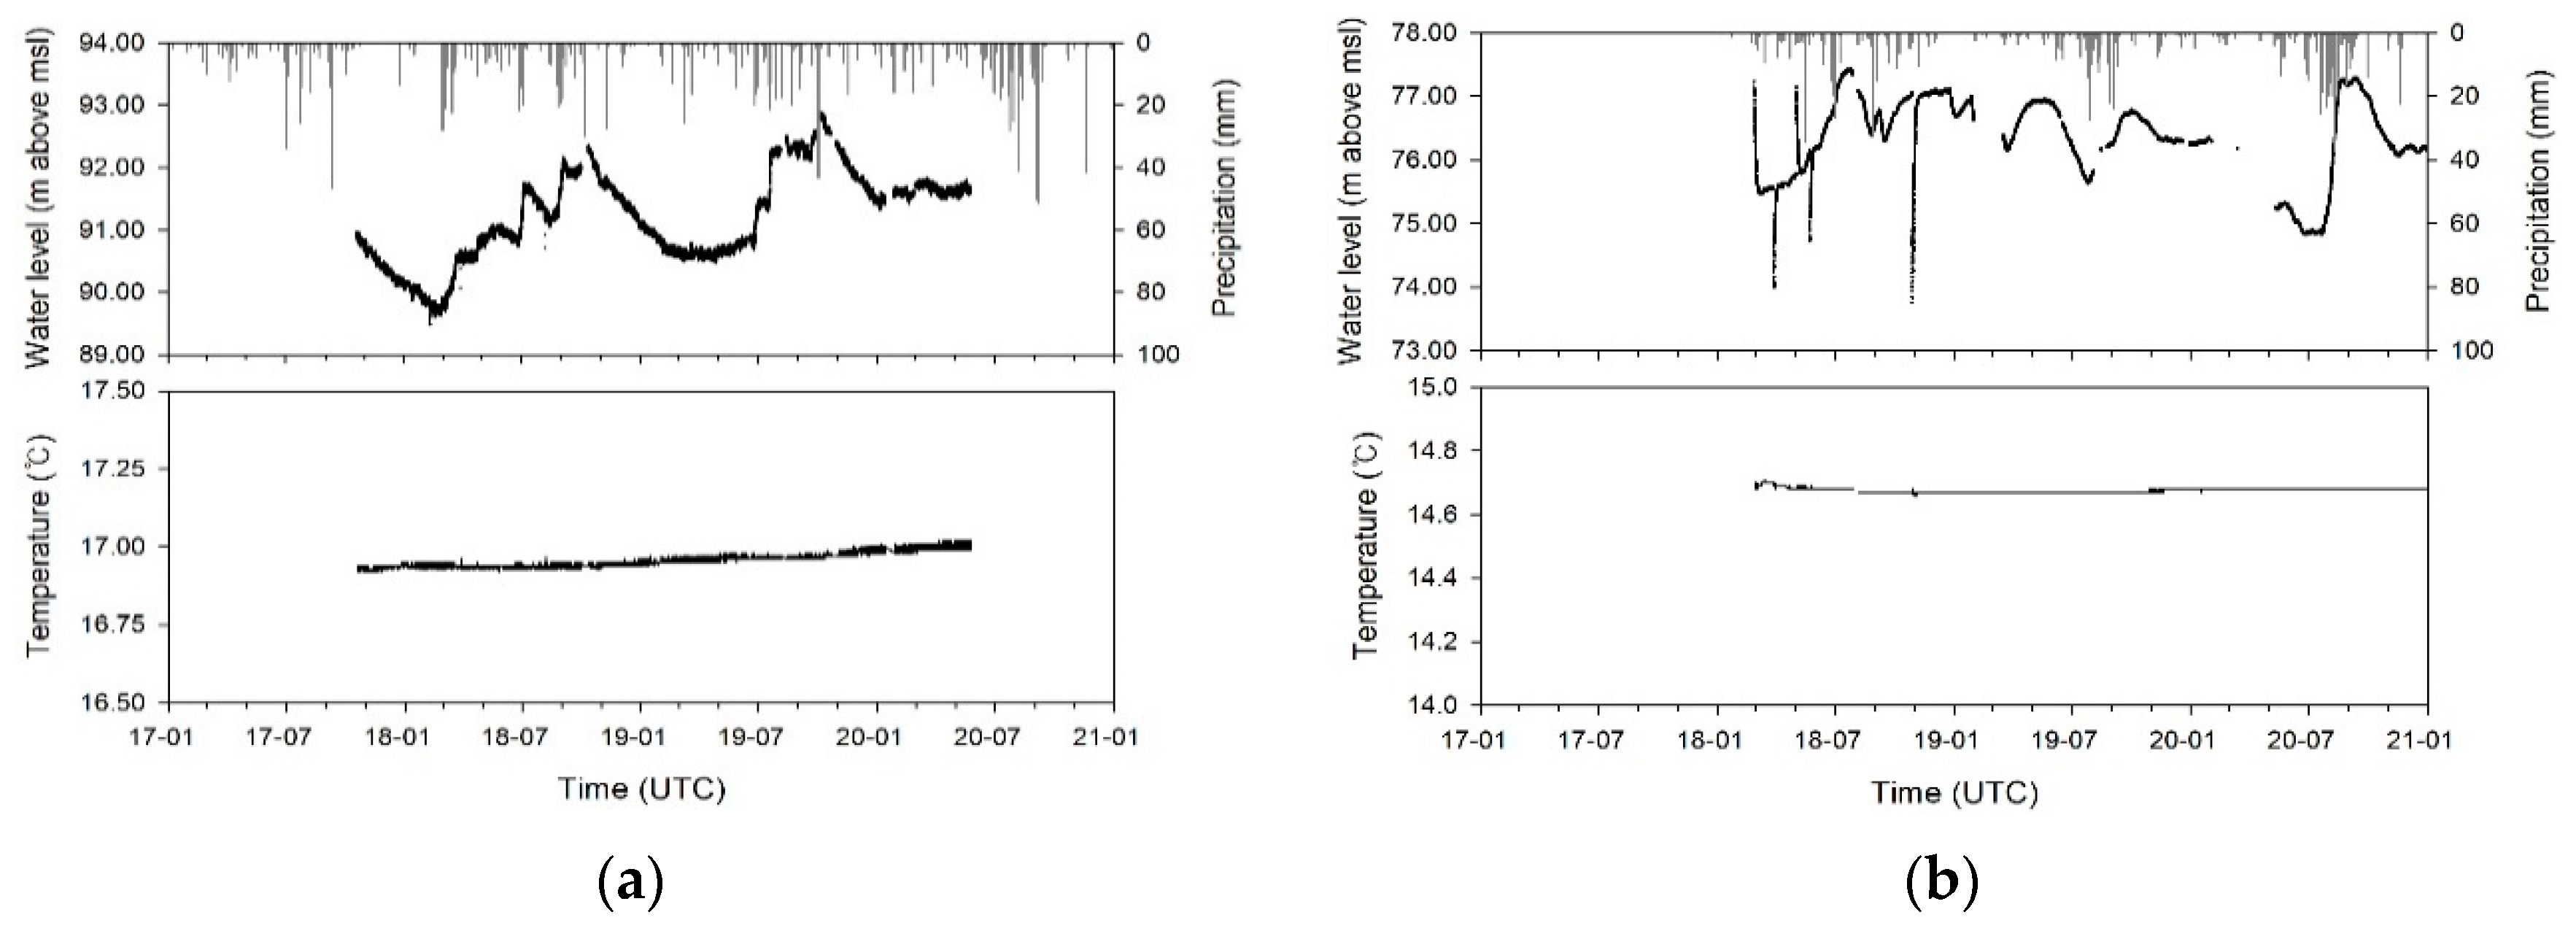
During the study period, water levels at station MW1 showed seasonal variation with an increase in spring and summer and a decrease in autumn and winter (Figure 3a). As the recording was discontinued in May 2020 owing to power supply issues, the data in this study are limited to the period between January 2018 and May 2020. The water level of MW1 in the summer monsoon season seemed to fluctuate due to precipitation, although water-level changes did not depend on each event but rather on the total amount or intensity, reflecting the characteristics of open boreholes. After the monsoon season, the water level decreased by the end of next February. The water level remained above 8 m in 2018, and the base level changed to approximately 9 m above the mean sea water level after June 2019. Increases in water levels during the study period can be attributed to decreases in local water use, increases in recharge, inflow from streams or adjunct areas after rainfall events, or increases in head pressure by overlaid structures. During the same period, the water-level fluctuation in Yangsan-Woongsang station of the National Groundwater Monitoring Network, which is installed in the opposite bank of the stream, showed a similar trend of increases. The water temperature slowly increased with time, indicating that continuous mixing with warmer waters; MW1 has opened the fracture rocks 42.5 below the surface which the waters in different depths can move and mix easily. Notably, a co-seismic water-level change was observed in MW1 1 min after the Pohang earthquake, which occurred 89 km northeastwards.
The water levels observed in MW2 ranged from 75.48 to 77.39 m from March 2018 until the end of 2020 (Figure 3b). Water levels showed weak responses to precipitation owing to the effects of rainfall and trees (i.e., canopy and stem-flow effects) as the station is located in the middle regions of Mt. Ansan (296 m). Water sampling was conducted four times to determine the chemical composition. Unfortunately, several periods of data were lost due to internal anomalies in DataTaker. Therefore, water levels showed irregular variations in response to rainfall and disturbance. However, water temperature remained constant, with the exception of October 2018.
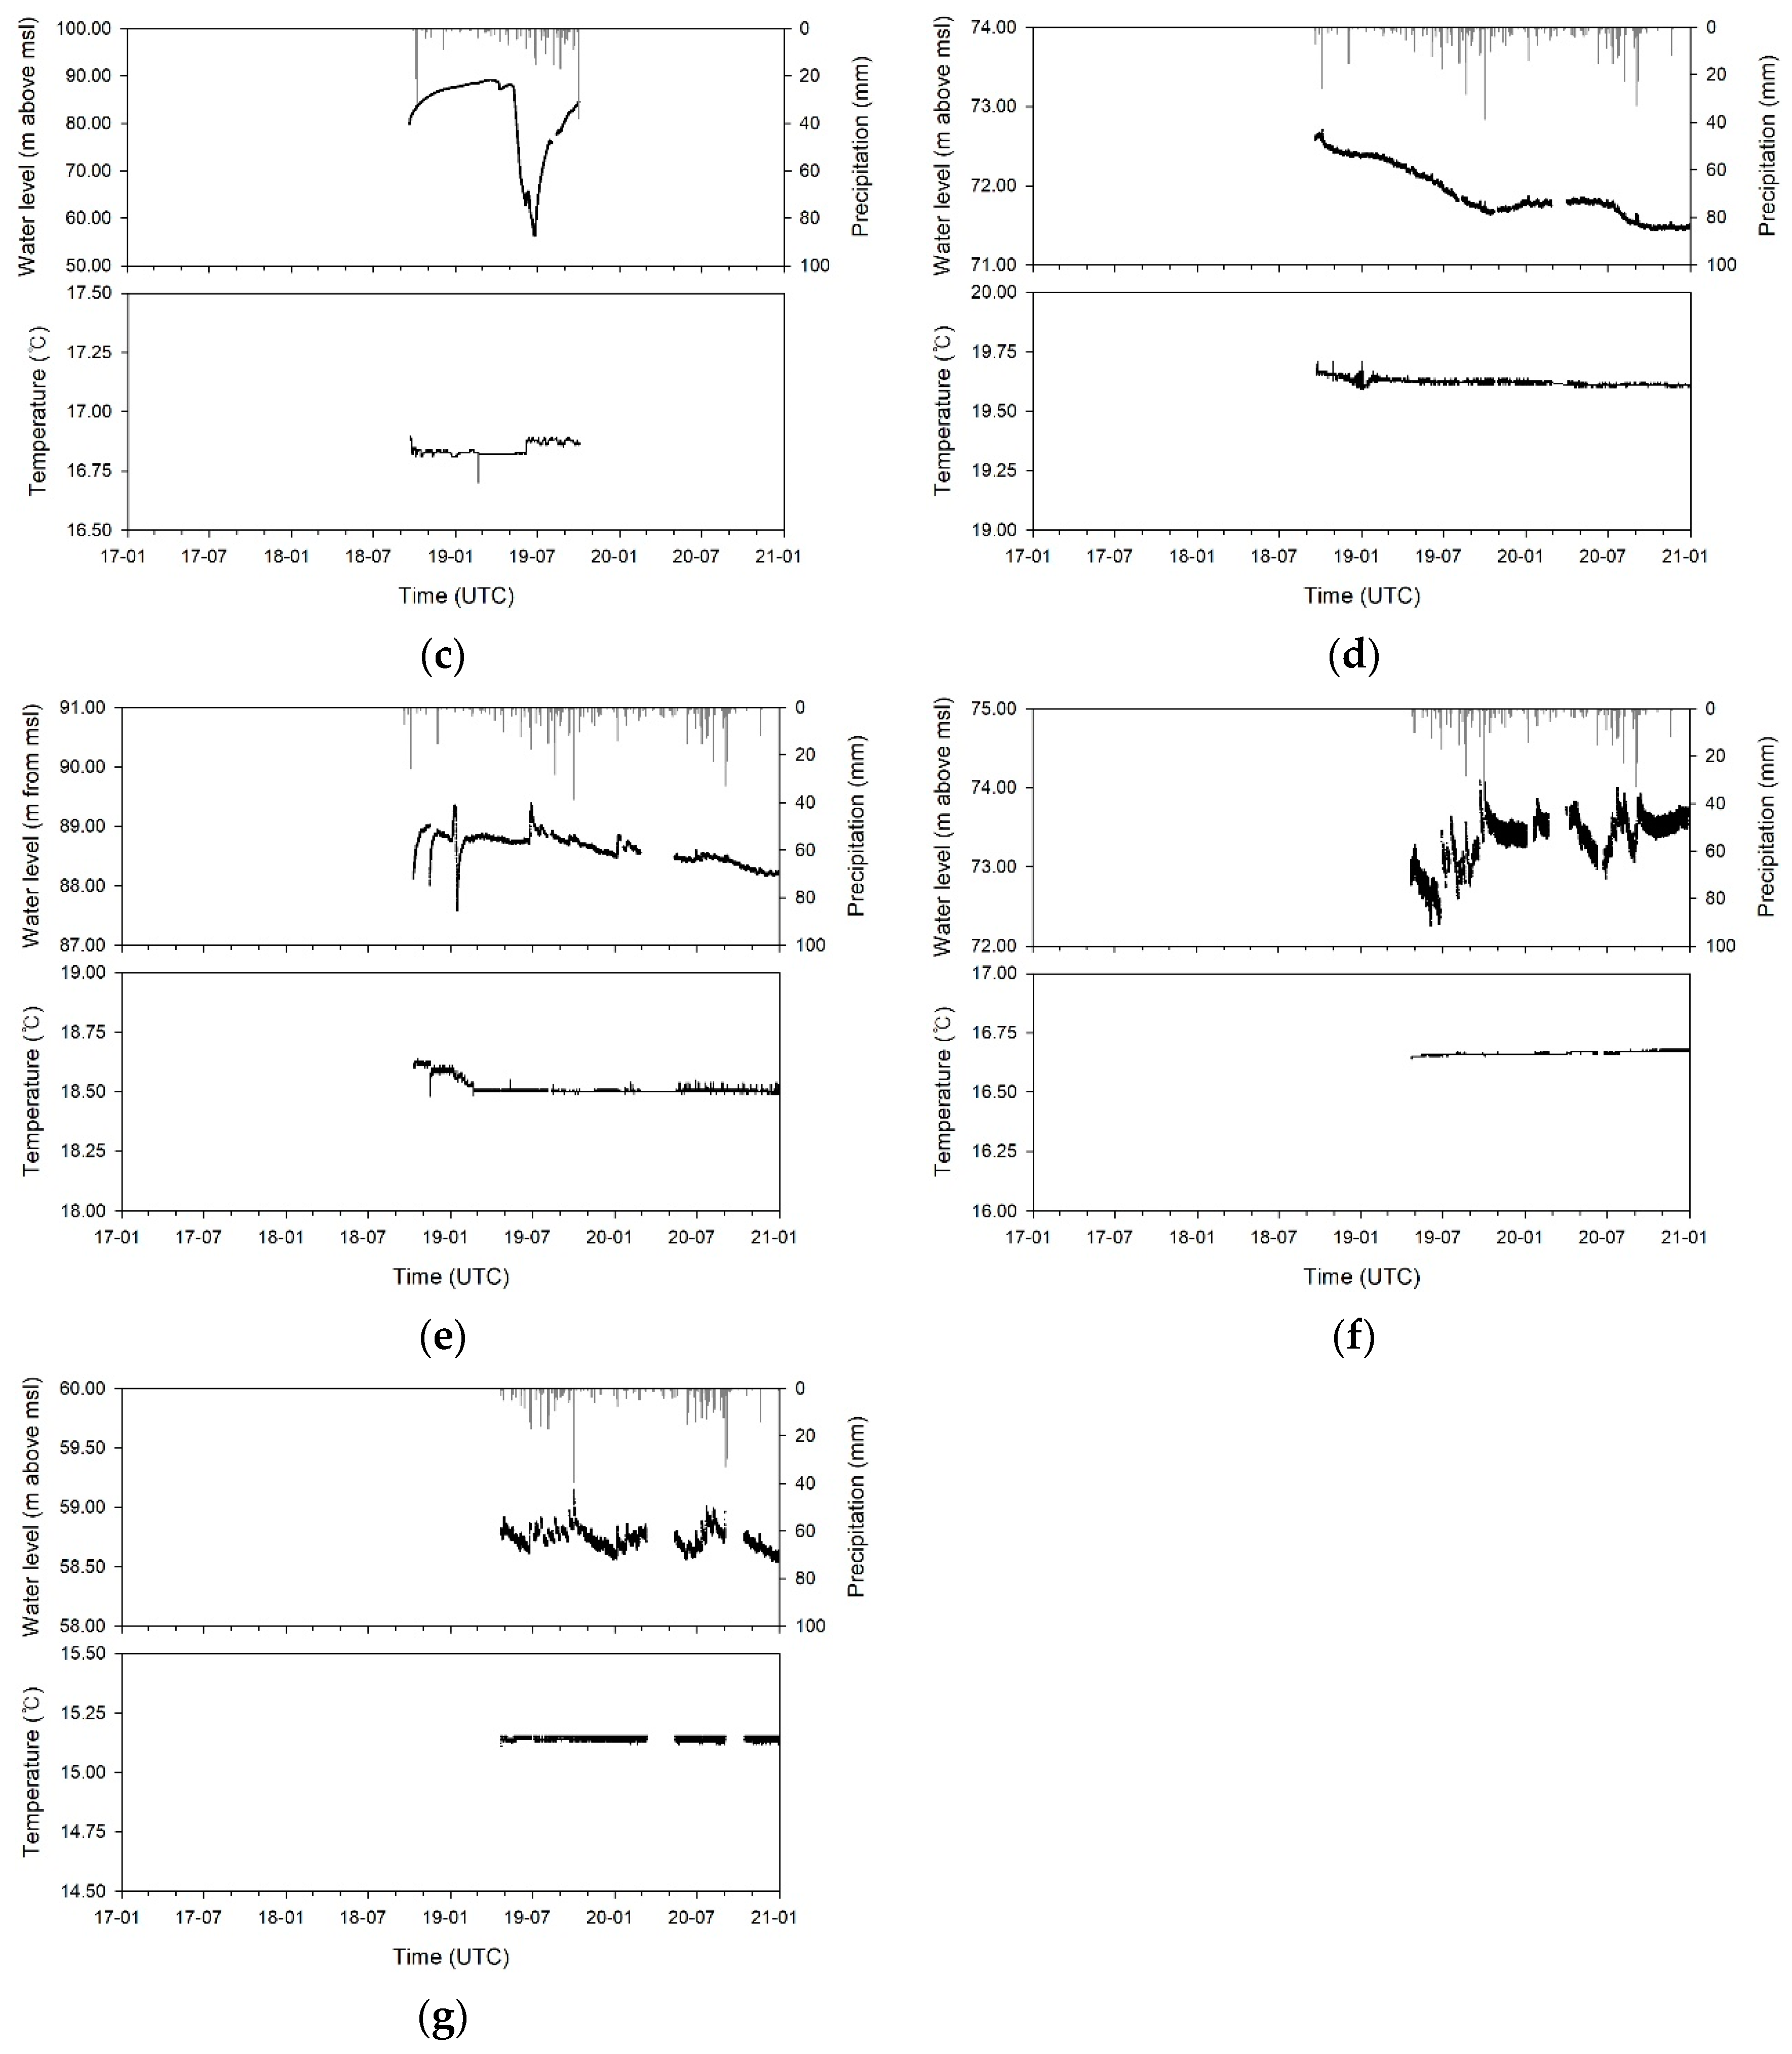
At MW3, a number of changes in water level and temperature were recorded (Figure 3c). The water level decreased during well installation (excavation and cleaning) and then slowly increased. This slow increase between October 2018 and March 2019 indicates the slow movement of water through fractures at the depth of the screen. Although we originally predicted that water levels would remain at a certain level from March 2019, water levels fell by more than 15 m from early April to the end of June. From July, the water level continuously increased until the well was closed. Besides that, no anomalous changes were recorded in water temperature, with the exception of an increase in June 2019, with a brief rebound in water levels after a rainfall event.
At MW4 (Figure 3d), water levels declined throughout the study period, with a 1.13 m difference between maximum and minimum levels. The water level rarely responded to precipitation, with the exception of heavy rainfall events of 256.5 mm and 322.3 mm in October 2018 and October 2019, respectively. The insensitive characteristic of the deep groundwater aquifer in MW4 could be caused by a 90 m-thick layer of unconsolidated mudstone. In 2020, the water level decreased, even during the summer monsoon season. Initially, we assumed this to be related to increases in groundwater usage. However, the groundwater usage of the administrative section, Heunghae-eup, totaled 1,268,867 m3/year from 212 wells in 2017 [61] and decreased to 939,723 m3/year from 207 wells in 2019 [62]. Although irregular temperature fluctuations in January 2019 were detected with the anomaly-check procedure, their amplitudes were not significant. The abnormal changes would be caused by the mixing with groundwater from neighboring regions (i.e., water pumping, water injection, or inflow of the deeper aquifer system), or the precursory changes of the M4.1 earthquake that occurred offshore of Pohang on February 10 (d = 50.6 km).
The water levels of MW5 (Figure 3e) recovered to a natural level a month after the completion of the well and sensor installation at the end of August 2018. The groundwater of the stations was sampled twice, once in November 2018 for a water-quality study and once in February 2019 to record dissolved gasses. In January 2019, abnormal water-level changes were detected through the real-time monitoring system and later identified as related to the installation of the seismometer and GPS sensors near the well for multifactorial earthquake prediction/forecasting. The comparison between water levels and temperatures in June 2019 and February 2020 did not show consistent responses to precipitation. The water temperature was nearly constant since the sensor reinstallation after the dissolved gas collection, being different from its former tendency of decreases. Based on these results, the possibility of the aquifer system being disturbed by the drilling of the well and the installation of the sensor cannot be ruled out. In addition, a 60 cm decrease in water level during the study period can be explained by the decrease in recharge volume; there was less precipitation in 2020 (1238.9 mm) than in 2019 (1425.1 mm).
The water level in MW6 appeared to be sensitive to precipitation and showed regular changes in the 40 h cycle, as identified by simultaneous harmonic analysis (Figure 3f). The mean fluctuation of the 40 h-cycle between 1 May and 15 May 2019, was 33.1 cm. As the stream that is located near the well flows through farmland, a few small manufactures, and large apartment complexes, the 40 h-cycle will reflect the combined interactions of pumping, recharging, external loading, streamflow, and unconsolidated fluvial layer. However, variations in water temperature did not seem to be qualitatively affected by the external inflow of water, including rainfall events. In general, water levels tended to increase over the study period.
The water level fluctuation of MW7 varied within a small range of 0.4 m (Figure 3g) and was sensitive to precipitation, as it was installed in the upper catchment of Mt. Bihak, and the screen was opened to weathered crystalline rock 60 m below the surface. Over approximately two years, the water level was raised by heavy rainfalls during the monsoon period and then fell during the dry season. During periods of no rainfall, water levels fluctuated regularly within 24- and 12-h cycles, as identified by harmonic analysis. Meanwhile, the water temperature remained constant at 15.2 °C.
4. Discussion
4.1. Potential Precursory Changes
Since the stations were installed, recorded data were compared with the earthquake catalog of Korea using the concept of effective strain radius [63]. The effective strain radius indicates the radius of the cracked rock zone (i.e., the earthquake preparation zone), which is formed by increasing tectonic stress and in which precursory changes can be observed [63]. The radius can be estimated using the following equation:
where M indicates the magnitude of the future earthquake.
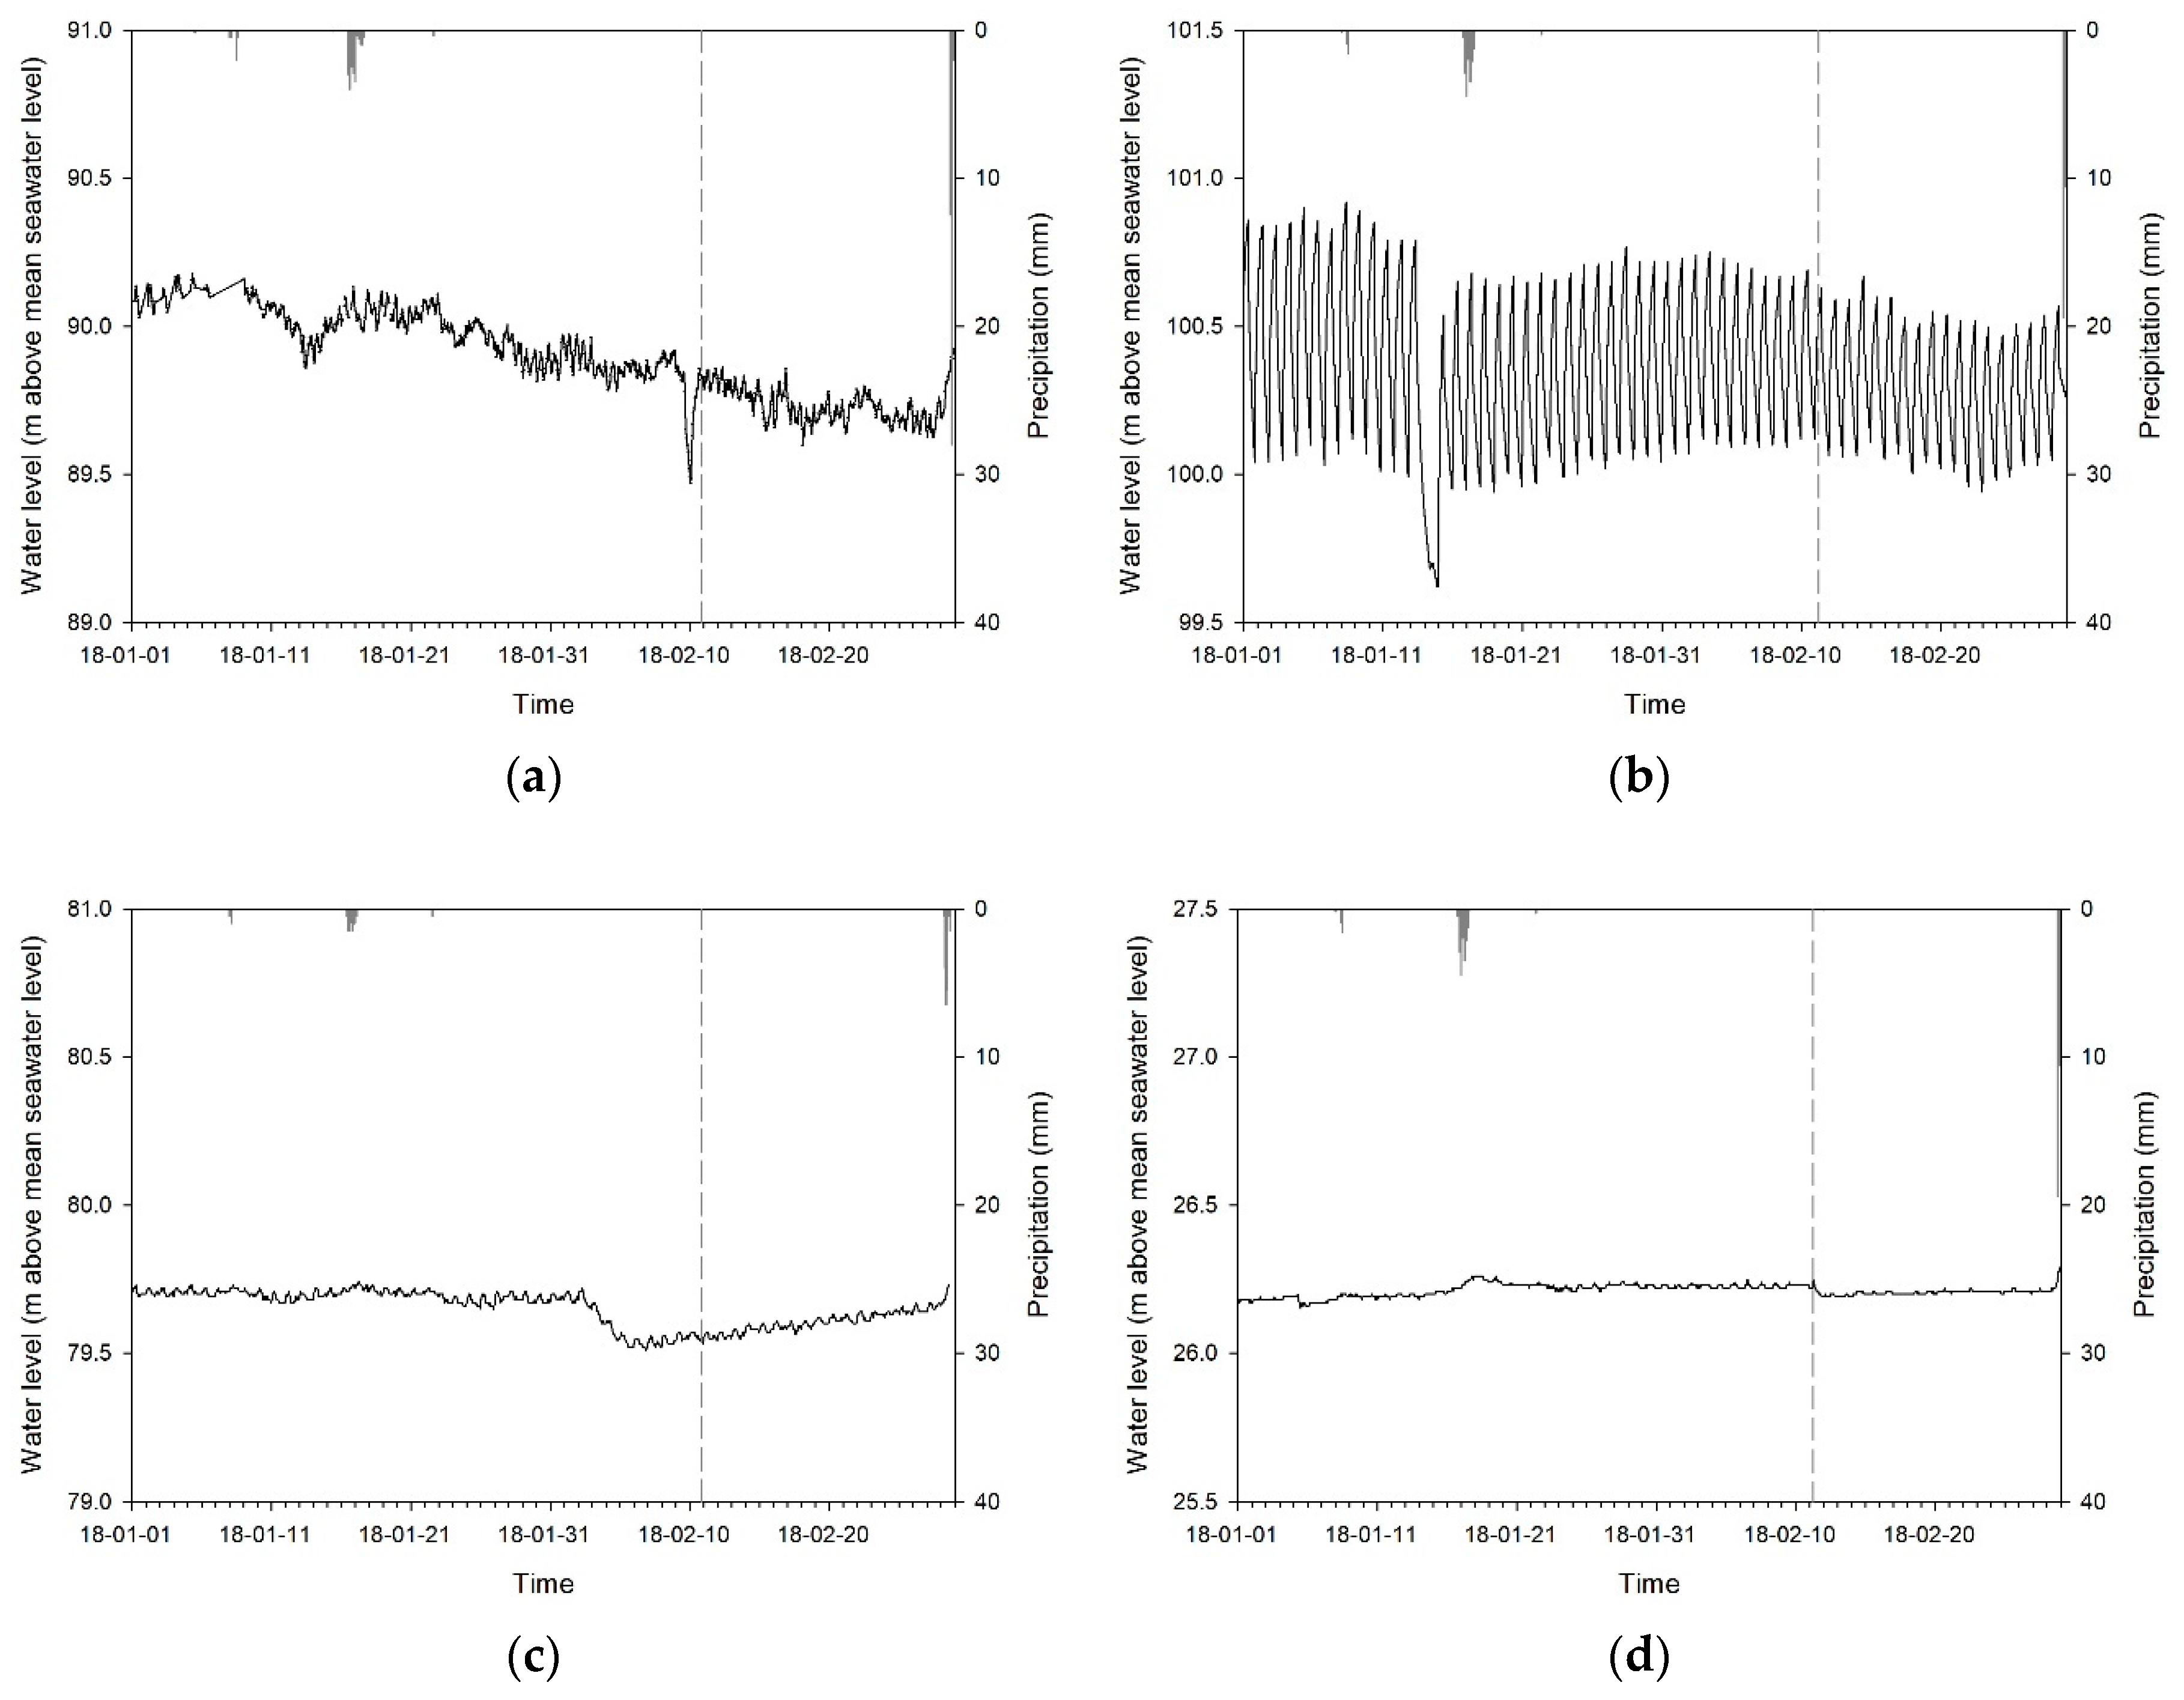
During the study period, station MW1 showed abnormal changes that appeared to be related to the occurrence of an earthquake. At this station, irregular water-level fluctuations were detected on 10 February 2019 (Figure 4a). The water level dropped by 40 cm and then increased to its previous level. The following day, the M4.6 earthquake, the largest aftershock of the 2017 M5.4 Pohang earthquake, occurred in Pohang on 11 February 2018. MW1 is located 88.9 km from the epicenter of the earthquake and thus, falls within the effective strain radius; the effective strain radius of the M4.6 event was 95.1 km. According to a study by Liu et al. (2020) in China [64], the location of precursors could recede from the future epicenter close to the time of earthquake occurrence.
Changes in water level can be induced by various natural and artificial events [33]: groundwater recharge by rainfall, trapping of air in the vadose zone during recharge, evapotranspiration, storage effects of stream bank, tidal effects in a coastal area, air pressure, external loading, earthquake, pumping, direct injection to aquifers, artificial recharge, irrigation, and geoengineering projects. MW1 observes the fractured aquifer, thus the recharge effects are limited. Storage effects of stream bank and tidal effects can also be excluded by the location. Barometric effects are automatically calibrated in the sensor. The regular external loading is caused by the parking lot beside the well, while the groundwater pumping in the area is restricted to prevent subsidence. In addition, there was no direct injection, artificial recharge, or geoengineering activities reported in this area. Notably, 203 earthquakes with magnitudes of 2.0 or greater were recorded in the Korean Peninsula between 2018 and 2019, including the aftershocks of the 2017 Pohang earthquake. Of the 203 events, 83 occurred inland or offshore of Gyeongsang Province, in the vicinity of the Yangsan fault. Of these 83 earthquakes, the M4.6 earthquake was the largest. The previous studies using MW1 showed the monitoring well is sufficiently sensitive to monitor the responses of groundwater to the local and distant earthquakes [56]. A potential precursory change in groundwater was also observed in MW1 before the 2016 Gyeongju earthquake [57]. Within this context, it would be reasonable to consider the abnormal changes on February 10 as a potential precursor for the M4.6 Pohang earthquake. For reference, three stations of the local groundwater monitoring network of Yangsan are established around MW1; the groundwater in those wells showed different fluctuations by well (Figures S6 and S7). Within this context, it would be reasonable to consider the abnormal changes on 10 February as a potential precursor for the M4.6 Pohang earthquake.
The data obtained from stations of other networks located in Pohang were also examined (Figures S8 and S9). The NGMN, RGMN, and SIMN have six, six, and four stations in Pohang, respectively, by the end of February 2018, and observational data between 1 January 2018, and 11 February 2018, were used in this study. As the result, Pohang4 and Pohang5 RGMN stations, located 16.1 and 11.9 km apart from the epicenter, showed abnormal changes in water level prior to the earthquake (Figure 4b,c). However, it should be mentioned that Pohang4 and Pohang5 are established in the vicinity of the agricultural reservoirs to manage the regional agriculture waters. On the other hand, the co-seismic changes were observed in the Pohang-Jangheung NGMN station, 11.9 km apart from the epicenter (Figure 4d); however, the observation was made hourly (i.e., the sensor measured the water level at 5 a.m. and 6 a.m.). Therefore, the actual fluctuation by the propagation of seismic was unknown. In addition, the displacement was small (3 cm). For reference, co-seismic changes by the Pohang earthquake were observed in water-level [57,65] and geochemical composition [66].
Several studies on the co-seismic or pre-seismic groundwater changes indicate that there are sensitive and insensitive wells even in the same region [22,67]. For example, 31 wells in southeastern Taiwan showed no co-seismic water-level changes for the ML7.3 Chi-Chi earthquake in 1999 [68]. For another instance, 73 out of 280 monitoring wells showed no significant changes in water level by the M7.9 Wenchuan earthquake in 2018 [69]. Besides, out of 320 NGMN stations in Korea, 15 and 46 stations were responded to the Wenchuan and Tohoku earthquakes, respectively [70]. On the other hand, the water-level changes prior to four earthquakes were observed in the Koyna-Warna region, India; however, not all well in the region showed changes [71]. There is a challenge that precursory change could not be easily determined whether it is related to earthquakes or not, being different from the co-seismic changes which can be easily correlated with. However, based on the previous results, we only can say what has not been observed elsewhere does not mean it cannot be supposed as a precursor.
4.2. Abnormal Changes in Water Levels during the Study Period
Notably, the water level at MW3, located in an agricultural field, showed a gradual decline of more than 15 m from 1 April until the end of July 2019, after which it began to rebound (Figure 3c). The decrease in water level was possibly caused by groundwater withdrawal, depletion of surface water, and the opening of new water paths. Agricultural groundwater usage in the Shingwang-myeon area was reported as 366,199 m3 (94 wells) for 2018 and 397,436 m3 (111 wells) for 2019, while the total usage was recorded as 494,039 m3 (138 wells) for 2018 and 526,623 m3 (156 wells) for 2019 [62,72]. The increase in usage contributed to the shortage of surface water, which resulted in excessive pumping. In a downstream reservoir, located 330 m from the well, stored water levels dropped by approximately 60% between May 2018 and June 2019 and were restored to their previous levels after July. Three wells are located within a 300-m radius of MW3 for cultivation. However, there were no data on monthly usage to identify the effects of pumping. In addition, changes in the fracture network of the bedrock at the site might be a possible cause for the dramatic changes in water levels, as the well was installed in the damage zone of the Yangsan fault. However, as the well was closed in October 2019, observational data from public and national monitoring systems are required for further research.
The MW4 station also showed a declining trend in water levels, with the exception of the period from mid-October 2018 to May 2019, when water levels increased by 18 cm (Figure 3d). The continuous decrease in this area can be attributed to the effects of the Pohang earthquake. The sustained changes in water levels after the earthquake may have resulted from the redistribution of geological stress [73,74,75] and the alteration of groundwater pathways [76]. In addition, water in shallow aquifers can be reduced by liquefaction. The modeling of groundwater in response to earthquakes suggests that groundwater storativity decreases after earthquakes [77]. Considering that MW4 was located 4.3 km away from the epicenter of the Pohang earthquake, the continuous decrease in water levels could be partly attributed to liquefaction. The decline in groundwater possibly also resulted from a shortage of agricultural water in 2019, as reported by farmers in the northern Heunghae area during the same period. Since the northern part of Heunghae is adjacent to a small stream, the alteration of the aquifer system by the earthquake would be a reasonable explanation for this phenomenon.
In general, sustained decreases in water levels are correlated with land subsidence or sinkholes, as well as aquifer compaction, a shortage of available water resources, and changes in water quality [78,79]. Furthermore, decreasing trends over extended periods are indirect indicators of storage reduction in the region. The effective stress in the region can be changed by the removal of water from the pore spaces of aquifers. If this exceeds a critical point, the medium loses the mechanical support of the pore-fluid pressure and can become permanently compacted [80]. Subsidence by groundwater depletion is a slow and gradual process that may affect a large area in various ways [81], while earthquakes can rapidly increase the rate of change in water levels and aquifer systems through the creation of various hazards including erosion and landslides [76]. In addition, considering that groundwater is rarely a renewable resource in the short term, water shortages will intensify if the demand for groundwater continues along the current trajectory. Therefore, continuous observation is required for the Pohang area to monitor trends in water-level fluctuations and to prevent possible geohazards related to the earthquakes and water-level decline, as well as for the installation of additional monitoring stations.
4.3. Comparison with Other Experiences and Future Developments
Co-seismic and pre-seismic groundwater changes by earthquakes have been studied with nationwide or local monitoring networks for decades in countries situated in the seismically active zone, as briefly mentioned in the Introduction. In the United States, comprehensive earthquake prediction has been studied since the 1980s in Parkfield, California, where earthquakes of magnitude six or greater occurred repeatedly with a cycle of about 22 years [9,82]. At present, seven wells are under operation on the Parkfield site. In addition, water-level monitoring was conducted in Long Valley Caldera [83], Mojave Desert [84], and Yreka Blue Horn Mine [85]. China has established monitoring networks for earthquake surveillance and prediction since mid of the 1950s. Currently, the China Earthquake administration operates a ground-fluid monitoring network of 1287 stations observing water level, temperature, EC, and gases and chemical components are also regularly monitored [12]. In Japan, the geochemical approaches were actively conducted to earthquake prediction since the early 1970s after the methodological study had been conducted [86], and comprehensive studies including water level were initiated. Presently, 47 monitoring stations are operated in Tokai, Izu, Kawasaki, and Kanto areas to observe water pressure changes related to earthquakes by the Geological Survey of Japan at present of 2017. On the other hand, Taiwan has installed 179 stations in Choshui River fan to monitor earthquake-related groundwater changes [87] and in India, 21 groundwater and 21 monitoring stations are established in the Koyna-Warna region, where the continuous seismic events occur due to a reservoir made by Koyna Dam [88,89].
In addition to those countries, earthquake hydrogeological studies have also been conducted in Russia/USSR, Italy, and Iceland. Since the Soviet Union period, the groundwater changes related to earthquakes had been conducted in the clustered monitoring stations at seismically active zones [9], including the Kamchatka region [28]. In the context of scale and monitoring period, this study could be compared with the HydroQuake project, Italy. The HydroQuake is focusing on hydrogeochemical components, and it consists of 11 springs and one borehole located in Sulmona and Matese areas [90]. Currently, the physicochemical parameters, major and minor ions, and stable isotopes of hydrogen and oxygen are measured monthly, while dissolved radon and dissolved carbon dioxides are monitored continuously by automatic instruments. On the other hand, in Iceland, chemical composition was continuously monitored at Húsavík since 2002 and at Hafralækur since 2008 to study the pre-seismic and co-seismic changes [91,92].
The monitoring networks above record regularly water level and quality at the seismically active zone, specifically along with faults, where the sensitive sites are generally situated in. Then, observed data are gathered in the server automatically or passively, and then, analyzed. Although all the stations are not installed at the vicinity of seismic stations, the monitoring data were compared with catalog or recorded seismic waves to correlate and explain the groundwater change in geophysical aspects. The monitoring network in this study was focused on the automatic observation and analysis of water level changes nearby faults with relatively low activity. To relate the abnormal changes to earthquakes and to explain mechanisms, it is necessary to collect long-term data through extended monitoring stations along active faults and to compare them with other observation data such as seismicity. In addition, hydrogeochemical analysis on regions with the possibility of earthquake occurrence is required on regular basis. At present, a Global Navigation Satellite System station is established close by MW4. The monitoring stations for geomagnetism and seismicity will be installed in foreseeable future. When all installations are complete, comprehensive observation and analysis are expected to be possible.
5. Conclusions
A pilot-scale monitoring network was established for observing earthquake-related groundwater changes at Seoul, the capital city of Korea, and the Gyeongsang area, where the active 170 km long Yangsan fault is developed. The observed water level fluctuation between 2018 and 2020 indicates that most stations are sufficiently isolated from the effects of precipitation, recharge, and diurnal natural/artificial activities. Of the seven monitoring stations, one station, situated 1.9 km away from the Yangsan fault, showed potential precursory changes in water levels before the M4.6 earthquake, which occurred on 11 February 2018, during short-term monitoring between 2018 and 2019. In addition, the MW3 station in the Yangsan fault damage zone showed abnormal water-level changes of more than 20 m, while the water level in the MW4 and MW5 at the eastern Pohang showed a tendency to decline continuously since installation in spring 2019. However, MW1 has no closed monitoring stations and MW3, which showed abnormal changes, was shut down in October 2019. Thus, detailed observations could not be continued.
Despite the short monitoring period, the studied monitoring network has demonstrated its effectiveness as the very first study of earthquake surveillance in relation to groundwater monitoring in Korea. Continuous monitoring and analyses are still being carried out through six stations in the network to monitor long-term groundwater changes related to regional strain changes. In addition, the integrated study is under preparation with geodetic, seismic, and geoelectromagnetism. Based on these observations, we expect to verify that anomalies in the groundwater system could be useful precursors of earthquakes and thus warrant long-term and systematic monitoring as a viable tool for earthquake hazard prevention.
Supplementary Materials
The following are available online at www.mdpi.com/2073-4441/13/17/2448/s1, Figure S1. The groundwater monitoring system for surveillance of earthquake: (a) a schematic diagram of monitoring well structure (for example, MW2), and (b) the front view of the station. Pictures above the front view shows the monitoring sensor and the control box equipped at each station. Figure S2. The interface of the GW-EQ program developed in this study (Displays are in Korean). The water-level (green line) and temperature (red line) or EC is shown in the main frame and the earqhaue catalog is plotted in the bottom as the distance from epicenter and magnitude. The magnitude ≥3.0 earthquakes are highlighed with box. The vertical dashed line in red color indicates the precursor-expected events based on the effectiveness radius by Dobrovolsky et al. (1979). Figure S3. The typical screen of the mobile application developed in this study (Displays are in Korean): (a) the status of monitoring well, and (b) the water level fluctuation in a station with precipitation data. The green dot in (a) indicates that the monitoring station is normally in operation, meanwhile the red one means the data transmission is not recognized at the server. Figure S4. The results of well logging obtained from (a) MW2, (b) MW3, (c) MW4, (d) MW5, (e) MW6, and (f) MW7. Figure S5. The results of harmonic analyses in frequency domain to identify the aquifer type: (a) MW1, (b) MW2, (c) MW3, (d) MW4, (e) MW5, (f) MW6, and (g) MW7. Figure S6. Location map of MW1 and the local groundwater monitoring stations. The distances between monitoring stations and MW1 are shown on the lines. The Yangsan stream runs southward on the right side of this figure, indicating the blue arrow. The map was edited from the location map provided by the National Groundwater Information Management and Service Center (GIMS) of Korea (http://www.gims.go.kr/). Figure S7. The water level fluctuations observed at (a) MG1, (b) MG2, and (c) MG3 stations between 1 January 2018, and 28 February 2018 (KST). The vertical dashed line indicates the occurrence time of the M4.6 earthquake. Figure S8. The water level fluctuations observed at (a) Pohang-Donghae, (b) Pohang-Gibuk, (c) Pohang-Guryongpo, (d) Pohang-Jangheung, (e) Pohang-Shingwang, and (f) Pohang-Yeonil stations of NGMN between 1 January 2018, and February 28 2018 (KST). The vertical dashed line indicates the occurrence time of the M4.6 earthquake. Figure S9. The water level fluctuation observed at (a) Pohang1 RGMN, (b) Pohang2 RGMN, (c) Pohang3 RGMN, (d) Pohang4 RGMN, (e) Pohang5 RGMN, (f) Pohang6 RGMN, (g) Gokgang1 SIMN, (h) Gokgang2 SIMN, (i) Yeonil1 SIMN, and (j) Yeonil2 SIMN stations between 1 Jzanuary 2018, and 28 February 2018 (KST). The data of Gokgang2 The vertical dashed line indicates the occurrence time of the M4.6 earthquake. Please note that the data of Gokgang2 in this plot only contains the observation between 0 o’clock AM January 1 and seven o’clock AM February 11 (KST). Table S1. The results of optic imaging observed at (a) MW1, (b) MW2, (c) MW3, (d) MW4.
Author Contributions
Conceptualization, N.C.W.; Data curation, H.A.L.; Funding acquisition, N.C.W.; Project administration, N.C.W.; Writing—original draft, H.A.L.; Writing—review and editing, S.-Y.H. All authors have read and agreed to the published version of the manuscript.
Funding
This research was funded by the National Research Foundation of Korea (grant number: 2017R1A6A1A07015374) and the Korea Meteorological Administration (grant number KMI2017-9050).
Institutional Review Board Statement
Not applicable.
Informed Consent Statement
Not applicable.
Data Availability Statement
The groundwater monitoring data in this study can be found at http://165.132.43.186:8000/. The meteorological data refers to the monitoring data of automatic weather stations (AWSs), operated by the Korea Meteorological Administration (http://www.weather.go.kr/, last accessed: 30 June 2021). The stations used in this study are Mulgeum (MW1), Seodaemoon (MW2), Gigye (MW3), Pohang (MW4–6), and Jukjang (MW7). Groundwater usage was obtained from K-Water Co., the public enterprise on water management. Reports can be found at the website (http://www.gims.go.kr/waterAnnals.do, last accessed: 15 August 2021). The geological map of Korea was provided by HIGAM through web map service of OneGeology (http://onegeology-geonetwork.brgm.fr/geonetwork3/srv/eng/catalog.search#/metadata/0fe907f345826b2f48455d1f26f94b26cc920241, last accessed: 3 September 2021).
Acknowledgments
We deeply appreciate Pohang City and residents for their cooperation in the installation of the monitoring system.
Conflicts of Interest
The authors declare no conflict of interest.
References
- Ismail-Zadeh, A. Earthquake prediction and forecasting. In Encyclopedia of Earth Sciences Series; Bobrowsky, P.T., Ed.; Springer: Dordrecht, The Netherlands, 2013; pp. 22–31. [Google Scholar]
- Geller, R.J. Earthquake prediction: A critical review. Geophys. J. Int. 1997, 131, 425–450. [Google Scholar] [CrossRef] [Green Version]
- Rikitake, T. Earthquake precursors. Bull. Seismol. Soc. Am. 1975, 65, 1133–1162. [Google Scholar]
- Cicerone, R.D.; Ebel, J.E.; Britton, J. A systematic compilation of earthquake precursors. Tectonophysics 2009, 476, 371–396. [Google Scholar] [CrossRef]
- Chen, Y.-I.; Liu, J.-Y.; Tsai, Y.-B.; Chen, C.-S. Statistical tests for pre-earthquake ionospheric anomaly. Terr. Atmos. Ocean. Sci. 2004, 15, 385–396. [Google Scholar] [CrossRef] [Green Version]
- Kunitsyn, V.; Andreeva, E.; Nesterov, I.; Padokhin, A.; Gribkov, D.; Rekenthaler, D.A. Earthquake prediction research using radio tomography of the ionosphere. In Universe of Scales: From Nanotechnology to Cosmology; Springer: Dordrecht, The Netherlands, 2014; pp. 109–132. [Google Scholar]
- Lin, J.-W. Early warning from seismic ionospheric anomaly of the 24 May 2014, Mw = 6.4 Aegean-Sea earthquake: Two-dimensional principal component analysis (2DPCA). Geofísica Int. 2015, 54, 191–198. [Google Scholar] [CrossRef] [Green Version]
- Ulukavak, M.; Inyurt, S. Detection of possible ionospheric precursor caused by Papua New Guinea earthquake (Mw 7.5). Environ. Monit. Assess. 2020, 192, 1–15. [Google Scholar] [CrossRef]
- Roeloffs, E.A. Hydrologic precursors to earthquakes: A Review. Pure Appl. Geophys. 1988, 126, 177–209. [Google Scholar] [CrossRef]
- Skelton, A.; Andrén, M.; Kristmannsdóttir, H.; Stockmann, G.; Mörth, C.-M.; Sveinbjörnsdóttir, Á.; Jónsson, S.; Sturkell, E.; Guðrúnardóttir, H.R.; Hjartarson, H. Changes in groundwater chemistry before two consecutive earthquakes in Iceland. Nat. Geosci. 2014, 7, 752–756. [Google Scholar] [CrossRef] [Green Version]
- Martinelli, G. Hydrogeologic and geochemical precursors of earthquakes: An assessment for possible applications. Boll. Geofis. Teor. Appl. 2015, 56, 83–94. [Google Scholar]
- Huang, F.; Li, M.; Ma, Y.; Han, Y.; Tian, L.; Yan, W.; Li, X. Studies on earthquake precursors in China: A review for recent 50 years. Geod. Geodyn. 2017, 8, 1–12. [Google Scholar] [CrossRef]
- Wang, C.M. Dynamic Anomaly of Underground Fluid Is Powerful Weapon for Earthquake Prediction. In Earthquake is Predictable; Zhao, D., Ed.; Northwestern Polytechnical University Press Co. Ltd.: Xi’an, China, 2016; pp. 213–228. [Google Scholar]
- Martinelli, G. Contributions to a history of earthquake prediction research. Seismol. Res. Lett. 2000, 71, 583–588. [Google Scholar] [CrossRef]
- Wallace, R.E.; Teng, T.-L. Prediction of the Sungpan-Pingwu earthquakes, August 1976. Bull. Seismol. Soc. Am. 1980, 70, 1199–1223. [Google Scholar] [CrossRef]
- Merifield, P.; Lamar, D. Possible strain events reflected in water levels in wells along San Jacinto fault zone, southern California. Pure Appl. Geophys. 1984, 122, 245–254. [Google Scholar] [CrossRef]
- Koizumi, N. Earthquake prediction research based on observation of groundwater—Earthquake forecasting based on crustal deformation estimated from groundwater level change—. Synthesiology (English Ed.) 2013, 6, 27–37. [Google Scholar] [CrossRef] [Green Version]
- Song, S.-R.; Ku, W.-Y.; Chen, Y.-L.; Lin, Y.-C.; Liu, C.-M.; Kuo, L.-W.; Yang, T.F.; Lo, H.-J. Groundwater chemical anomaly before and after the Chi-Chi earthquake in Taiwan. Terr. Atmos. Ocean. Sci. 2003, 14, 311–320. [Google Scholar] [CrossRef] [Green Version]
- Yeh, T.K.; Chen, C.H.; Wang, C.H.; Wen, S. Frequency anomaly of groundwater level before major earthquakes in Taiwan. Proc. IAHS 2015, 372, 101–104. [Google Scholar] [CrossRef] [Green Version]
- Kumar, A.; Singh, S.; Mahajan, S.; Bajwa, B.S.; Kalia, R.; Dhar, S. Earthquake precursory studies in Kangra valley of North West Himalayas, India, with special emphasis on radon emission. Appl. Radiat. Isot. 2009, 67, 1904–1911. [Google Scholar] [CrossRef]
- Bakun, W.H.; Aagaard, B.; Dost, B.; Ellsworth, W.L.; Hardebeck, J.L.; Harris, R.A.; Ji, C.; Johnston, M.J.S.; Langbein, J.; Lienkaemper, J.J.; et al. Implications for prediction and hazard assessment from the 2004 Parkfield earthquake. Nature 2005, 437, 969–974. [Google Scholar] [CrossRef] [Green Version]
- King, C.Y.; Azuma, S.; Ohno, M.; Asai, Y.; He, P.; Kitagawa, Y.; Igarashi, G.; Wakita, H. In search of earthquake precursors in the water-level data of 16 closely clustered wells at Tono, Japan. Geophys. J. Int. 2000, 143, 469–477. [Google Scholar] [CrossRef] [Green Version]
- Yue, M. Thoughts about the strategy for the development of earthquake prediction. Recent Developments in World Seismology. Recent Dev. World Seismol. 2005, 5, 7–21. [Google Scholar]
- Che, Y.T.; Liu, C.-L.; Yu, J.Z.; Guan, Z.J.; Li, J. Underground fluid anomaly and macro anomaly of Ms 8.0 Wenchuan earthquake and opinions about earthquake prediction. Seismol. Geol. 2008, 30, 828–838. [Google Scholar]
- Wang, C.-Y.; Manga, M. Hydrologic responses to earthquakes and a general metric. Geofluids 2010, 10, 206–216. [Google Scholar] [CrossRef] [Green Version]
- Rikitake, T. Classification of earthquake precursors. Tectonophysics 1979, 54, 293–309. [Google Scholar] [CrossRef]
- Igarashi, G.; Wakita, H.; Sato, T. Precursory and coseismic anomalies in well water levels observed for the February 2, 1992 Tokyo Bay earthquake. Geophys. Res. Lett. 1992, 19, 1583–1586. [Google Scholar] [CrossRef]
- Kingsley, S.; Biagi, P.; Piccolo, R.; Capozzi, V.; Ermini, A.; Khatkevich, Y.; Gordeev, E. Hydrogeochemical precursors of strong earthquakes: A realistic possibility in Kamchatka. Phys. Chem. Earth Part C: Sol. Terr. Planet. Sci. 2001, 26, 769–774. [Google Scholar] [CrossRef]
- Sultankhodzhayev, A. Dependence of hydrogeoseismological anomalies on the energy and epicentral distance of earthquakes. Dokl. AN Uzb. SSR 1980, 5, 57–59. [Google Scholar]
- Rikitake, T. Earthquake precursors in Japan: Precursor time and detectability. Tectonophysics 1987, 136, 265–282. [Google Scholar] [CrossRef]
- Che, Y.; Yu, Z. The statistical characteristics of groundwater level anomaly before some moderate-strong earthquakes in the Eastern China continent. Seismol. Geol. 1992, 14, 23–29. [Google Scholar]
- Hartmann, J.; Levy, J.K. Hydrogeological and gasgeochemical earthquake precursors—A review for application. Nat. Hazards 2005, 34, 279–304. [Google Scholar] [CrossRef]
- Freeze, R.A.; Cherry, J.A. Groundwater; Prentice-Hall Inc.: Englewood Cliffs, NJ, USA, 1979; p. 604. [Google Scholar]
- Hamm, S.-Y.; Lee, S.; Park, Y.; Koh, K.; Cheong, J.; Lee, J. Relationship between earthquake and groundwater change observed in Jeju Island. In Proceedings of the Korea, Asia Oceania Geosciences Society (AOGS) 6th Annual Meeting, Singapore, 11–15 August 2009. [Google Scholar]
- Ok, S.-I.; Hamm, S.-Y.; Kim, B.-S.; Cheong, J.-Y.; Woo, N.-C.; Lee, S.-H.; Koh, G.-W.; Park, Y.-S. Characteristics of aquifer system and change of groundwater level due to earthquake in the western half of Jeju Island. Econ. Environ. Geol. 2010, 43, 359–369. [Google Scholar]
- Lee, H.-A.; Kim, M.-H.; Hong, T.-K.; Woo, N.-C. Earthquake observation through groundwater monitoring: A case of M4. 9 Odaesan Earthquake. J. Soil Groundw. Environ. 2011, 16, 38–47. [Google Scholar] [CrossRef]
- Lee, H.A.; Woo, N.C. Influence of the M9.0 Tohoku Earthquake on groundwater in Korea. Geosci. J. 2012, 16, 1–6. [Google Scholar] [CrossRef]
- Lee, S.H.; Ha, K.; Hamm, S.Y.; Ko, K.S. Groundwater responses to the 2011 Tohoku earthquake on Jeju Island, Korea. Hydrol. Process. 2013, 27, 1147–1157. [Google Scholar] [CrossRef]
- Lee, S.H.; Ha, K.; Soo Shin, J.; Ko, K.S.; Hamm, S.Y. Successive Groundwater Level Changes on Jeju Island due to the M w 9.0 Off the Pacific Coast of Tohoku Earthquake. Bull. Seismol. Soc. Am. 2013, 103, 1614–1621. [Google Scholar] [CrossRef]
- Lee, J.Y. Gyeongju Earthquakes Recorded in Daily Groundwater Data at National Groundwater Monitoring Stations in Gyeongju. J. Soil Groundw. Environ. 2016, 21, 80–86. [Google Scholar] [CrossRef] [Green Version]
- Hong, T.K.; Lee, J.; Kim, W.; Hahm, I.K.; Woo, N.C.; Park, S. The 12 September 2016 ML5. 8 midcrustal earthquake in the Korean Peninsula and its seismic implications. Geophys. Res. Lett. 2017, 44, 3131–3138. [Google Scholar] [CrossRef]
- Lee, S.-H.; Lee, J.M.; Moon, S.-H.; Ha, K.; Kim, Y.; Jeong, D.B.; Kim, Y. Seismically induced changes in groundwater levels and temperatures following the ML 5.8 (ML 5.1) Gyeongju earthquake in South Korea. Hydrogeol. J. 2021, 29, 1679–1689. [Google Scholar] [CrossRef]
- Woo, N.C.; Piao, J.; Lee, J.-M.; Lee, C.-J.; Kang, I.-O.; Choi, D.-H. Abnormal changes in groundwater monitoring data due to small-magnitude earthquakes. J. Eng. Geol. 2015, 25, 21–33. [Google Scholar] [CrossRef]
- Lee, H.A.; Hamm, S.-Y.; Woo, N.C. The Abnormal Groundwater Changes as Potential Precursors of 2016 M L 5.8 Gyeongju Earthquake in Korea. Econ. Environ. Geol. 2018, 51, 393–400. [Google Scholar]
- Ministry of Environment. National Ground Water Monitoring Network in Korea Annual Report 2020 (Korean); Ministry of Environment: Seoul, Korea, 2020; p. 865.
- Lee, B.S.; Kim, Y.I.; Choi, K.-J.; Song, S.-H.; Kim, J.H.; Woo, D.K.; Seol, M.K.; Park, K.Y. Rural Groundwater Monitoring Network in Korea. J. Soil Groundw. Environ. 2014, 19, 1–11. [Google Scholar]
- Korean Statistical Information Service. Available online: https://kosis.kr/ (accessed on 28 May 2021).
- Houng, S.E.; Hong, T.K. Probabilistic analysis of the Korean historical earthquake records. Bull. Seismol. Soc. Am. 2013, 103, 2782–2796. [Google Scholar] [CrossRef]
- Cheon, Y.; Cho, H.; Ha, S.; Kang, H.-C.; Kim, J.-S.; Son, M. Tectonically controlled multiple stages of deformation along the Yangsan Fault Zone, SE Korea, since Late Cretaceous. J. Asian Earth Sci. 2019, 170, 188–207. [Google Scholar] [CrossRef]
- National Emergency Management Agency. Active Fault Map and Seismic Hazard Map (Korean); National Emergency Management Agency: Sejong, Korea, 2012; p. 935. [Google Scholar]
- Ministry of Interior and Safety. 9.12 Gyeongju Earthquake White Paper (Korean); Ministry of Interior and Safety: Sejong, Korea, 2017; p. 405.
- Ministry of Interior and Safety. 2017 Pohang Earthquake White Paper (Korean); Ministry of Interior and Safety: Sejong, Korea, 2018; p. 503.
- Korea Meteorological Administration. KMA Report on Pohang Earthquake (Korean); Korea Meteorological Administration: Seoul, Korea, 2018; pp. 1–89. [Google Scholar]
- Naik, S.P.; Gwon, O.; Porfido, S.; Park, K.; Jin, K.; Kim, Y.-S.; Kyung, J.-B. Intensity Reassessment of the 2017 Pohang Earthquake Mw = 5.4 (South Korea) Using ESI-07 Scale. Geosciences 2020, 10, 471. [Google Scholar] [CrossRef]
- Grigoli, F.; Cesca, S.; Rinaldi, A.P.; Manconi, A.; Lopez-Comino, J.A.; Clinton, J.; Westaway, R.; Cauzzi, C.; Dahm, T.; Wiemer, S. The November 2017 Mw 5.5 Pohang earthquake: A possible case of induced seismicity in South Korea. Science 2018, 360, 1003–1006. [Google Scholar] [CrossRef] [PubMed] [Green Version]
- Yun, S.-M.; Hamm, S.-Y.; Cheong, J.-Y.; Lee, C.-M.; Seo, W.-S.; Woo, N.-C. Analyzing groundwater level anomalies in a fault zone in Korea caused by local and offshore earthquakes. Geosci. J. 2019, 23, 137–148. [Google Scholar] [CrossRef]
- Lee, H.A.; Hamm, S.E.; Woo, N.C. Groundwater Monitoring Network for Earthquake Surveillance and Prediction. Econ. Environ. Geol. 2017, 50, 401–414. [Google Scholar]
- Park, J.-Y.; Kim, J.-M.; Yoon, S.-H. Three-dimensional geologic modeling of the Pohang Basin in Korea for geologic storage of carbon dioxide. J. Geol. Soc. Korea 2015, 51, 289–302. [Google Scholar] [CrossRef]
- Bredehoeft, J.D. Response of well-aquifer systems to earth tides. J. Geophys. Res. 1967, 72, 3075–3087. [Google Scholar] [CrossRef]
- Rahi, K.A.; Halihan, T. Identifying aquifer type in fractured rock aquifers using harmonic analysis. Groundwater 2013, 51, 76–82. [Google Scholar] [CrossRef]
- Ministry of Environment. 2018 Groundwater Annual Report (Korean); Ministry of Environment: Daejeon, Korea, 2018; p. 662.
- Ministry of Environment. 2020 Groundwater Annual Report (Korean); Ministry of Environment: Daejeon, Korea, 2020; p. 366.
- Dobrovolsky, I.; Zubkov, S.; Miachkin, V. Estimation of the size of earthquake preparation zones. Pure Appl. Geophys. 1979, 117, 1025–1044. [Google Scholar] [CrossRef]
- Liu, Y.; Lu, M.Y.; Fu, H.; Huang, P.Q.; Li, S.L. The Researches on Extraction of Information in the Groundwater and Prediction of the Strong Earthquakes (Chinese); Dizhen Publishing House: Beijing, China, 2010; pp. 1–317. [Google Scholar]
- Choi, M.-R.; Lee, H.-J.; Kim, G.-B. Characteristics of short-term changes of groundwater level and stream flow rate during 2017 Pohang earthquakes. J. Geol. Soc. Korea 2018, 54, 10. [Google Scholar] [CrossRef]
- Kim, J.; Joun, W.-T.; Lee, S.; Kaown, D.; Lee, K.-K. Hydrogeochemical Evidence of Earthquake-Induced Anomalies in Response to the 2017 MW 5.5 Pohang Earthquake in Korea. Geochem. Geophys. Geosystems 2020, 21, e2020GC009532. [Google Scholar] [CrossRef]
- King, C.-Y.; Zhang, W.; Zhang, Z. Earthquake-induced Groundwater and Gas Changes. Pure Appl. Geophys. 2006, 163, 633–645. [Google Scholar] [CrossRef]
- Chia, Y.; Chiu, J.J.; Chiang, Y.-H.; Lee, T.-P.; Liu, C.-W. Spatial and Temporal Changes of Groundwater Level Induced by Thrust Faulting. Pure Appl. Geophys. 2008, 165, 5–16. [Google Scholar] [CrossRef]
- He, A.; Singh, R.P. Groundwater level response to the Wenchuan earthquake of May 2008. Geomat. Nat. Hazards Risk 2019, 10, 336–352. [Google Scholar] [CrossRef] [Green Version]
- Lee, H.A. Investigation of Groundwater Response to Earthquakes Using the National Groundwater Monitoring Data of Korea. Ph.D. Thesis, Yonsei University, Seoul, Korea, February 2013. [Google Scholar]
- Chadha, R.K.; Pandey, A.P.; Kuempel, H.J. Search for earthquake precursors in well water levels in a localized seismically active area of Reservoir Triggered Earthquakes in India. Geophys. Res. Lett. 2003, 30. [Google Scholar] [CrossRef]
- Ministry of Environment. 2019 Groundwater Annual Report (Korean); Ministry of Environment: Sejong, Korea, 2019; p. 829.
- Roeloffs, E.A. Persistent water level changes in a well near Parkfield, California, due to local and distant earthquakes. J. Geophys. Res. Solid Earth 1998, 103, 869–889. [Google Scholar] [CrossRef]
- Montgomery, D.R.; Manga, M. Streamflow and water well responses to earthquakes. Science 2003, 300, 2047–2049. [Google Scholar] [CrossRef] [PubMed] [Green Version]
- Liu, C.-Y.; Chia, Y.; Chuang, P.-Y.; Chiu, Y.-C.; Tseng, T.-L. Impacts of hydrogeological characteristics on groundwater-level changes induced by earthquakes. Hydrogeol. J. 2018, 26, 451–465. [Google Scholar] [CrossRef] [Green Version]
- Sneed, M.; Galloway, D.L.; Cunningham, W.L. Earthquakes: Rattling the Earth’s Plumbing System; US Department of the Interior: Washington, DC, USA; US Geological Survey: Reston, VA, USA, 2003.
- Ward, N.F.D. On the mechanism of earthquake induced groundwater flow. J. Hydrol. 2015, 530, 561–567. [Google Scholar] [CrossRef]
- Galloway, D.L.; Burbey, T.J. Regional land subsidence accompanying groundwater extraction. Hydrogeol. J. 2011, 19, 1459–1486. [Google Scholar] [CrossRef]
- Scanlon, B.R.; Faunt, C.C.; Longuevergne, L.; Reedy, R.C.; Alley, W.M.; McGuire, V.L.; McMahon, P.B. Groundwater depletion and sustainability of irrigation in the US High Plains and Central Valley. Proc. Natl. Acad. Sci. USA 2012, 109, 9320–9325. [Google Scholar] [CrossRef] [Green Version]
- Alley, W.M.; Healy, R.W.; LaBaugh, J.W.; Reilly, T.E. Flow and storage in groundwater systems. Science 2002, 296, 1985–1990. [Google Scholar] [CrossRef] [PubMed] [Green Version]
- Herrera-García, G.; Ezquerro, P.; Tomás, R.; Béjar-Pizarro, M.; López-Vinielles, J.; Rossi, M.; Mateos, R.M.; Carreón-Freyre, D.; Lambert, J.; Teatini, P. Mapping the global threat of land subsidence. Science 2021, 371, 34–36. [Google Scholar] [CrossRef] [PubMed]
- Roeloffs, E. The Parkfield, California earthquake experiment: An update in 2000. Curr. Sci. 2000, 79, 1226–1236. [Google Scholar]
- Roeloffs, E.; Sneed, M.; Galloway, D.L.; Sorey, M.L.; Farrar, C.D.; Howle, J.F.; Hughes, J. Water-level changes induced by local and distant earthquakes at Long Valley caldera, California. J. Volcanol. Geotherm. Res. 2003, 127, 269–303. [Google Scholar] [CrossRef]
- Healy, J.H.; Urban, T.C. In-situ fluid-pressure measurements for earthquake prediction: An example from a deep well at Hi Vista, California. Pure Appl. Geophys. 1984, 122, 255–279. [Google Scholar] [CrossRef]
- Brodsky, E.E.; Roeloffs, E.; Woodcock, D.; Gall, I.; Manga, M. A mechanism for sustained groundwater pressure changes induced by distant earthquakes. J. Geophys. Res. Solid Earth 2003, 108. [Google Scholar] [CrossRef] [Green Version]
- Wakita, H. Geochemistry as a tool for earthquake prediction. J. Phys. Earth 1977, 25, S175–S183. [Google Scholar] [CrossRef]
- Chia, Y.; Wang, Y.-S.; Chiu, J.J.; Liu, C.-W. Changes of Groundwater Level due to the 1999 Chi-Chi Earthquake in the Choshui River Alluvial Fan in Taiwan. Bull. Seismol. Soc. Am. 2001, 91, 1062–1068. [Google Scholar] [CrossRef] [Green Version]
- Singh, C.; Ramana, D.V.; Chadha, R.K.; Shekar, M. Coseismic responses and the mechanism behind MW 5.1 earthquake of March 14, 2005 in the Koyna–Warna region, India. J. Asian Earth Sci. 2008, 31, 499–503. [Google Scholar] [CrossRef]
- Reddy, D.V.; Nagabhushanam, P. Groundwater electrical conductivity and soil radon gas monitoring for earthquake precursory studies in Koyna, India. Appl. Geochem. 2011, 26, 731–737. [Google Scholar] [CrossRef]
- Franchini, S.; Agostini, S.; Barberio, M.D.; Barbieri, M.; Billi, A.; Boschetti, T.; Pennisi, M.; Petitta, M. HydroQuakes, central Apennines, Italy: Towards a hydrogeochemical monitoring network for seismic precursors and the hydro-seismo-sensitivity of boron. J. Hydrol. 2021, 598, 125754. [Google Scholar] [CrossRef]
- Skelton, A.; Liljedahl-Claesson, L.; Wästeby, N.; Andrén, M.; Stockmann, G.; Sturkell, E.; Mörth, C.M.; Stefansson, A.; Tollefsen, E.; Siegmund, H. Hydrochemical changes before and after earthquakes based on long-term measurements of multiple parameters at two sites in northern Iceland—A review. J. Geophys. Res. Solid Earth 2019, 124, 2702–2720. [Google Scholar] [CrossRef]
- Barbieri, M.; Franchini, S.; Barberio, M.D.; Billi, A.; Boschetti, T.; Giansante, L.; Gori, F.; Jónsson, S.; Petitta, M.; Skelton, A.; et al. Changes in groundwater trace element concentrations before seismic and volcanic activities in Iceland during 2010–2018. Sci. Total. Environ. 2021, 793, 148635. [Google Scholar] [CrossRef] [PubMed]
Figure 1.
Location of groundwater monitoring stations in Korea with geological map. The subfigures are numbered along the latitude of well location: (a) MW2, (b) MW3-7, and (c) MW2. The map is based upon the digital geology map of 1M-scale by the Korean Institute of Geosciences and Mineral Resources through the web mapping service on OneGeology (http://onegeology-geonetwork.brgm.fr/geonetwork3/srv/eng/catalog.search#/metadata/0fe907f345826b2f48455d1f26f94b26cc920241).

Figure 2.
The flowchart of the pilot-scale pseudo-real-time groundwater monitoring system established in this study.
Figure 2.
The flowchart of the pilot-scale pseudo-real-time groundwater monitoring system established in this study.

Figure 3.
Groundwater data, including water levels and temperature, observed between 2018 and 2019 at monitoring stations (a) MW1, (b) MW2, (c) MW3, (d) MW4, (e) MW5, (f) MW6, and (g) MW7. The vertical bar chart represents hourly precipitation data and “msl” is the abbreviation of mean seawater level.


Figure 4.
Groundwater fluctuations observed at (a) monitoring station MW1, (b) Pohang4 RGMN station, (c) Pohang5 RGMN station, and (d) Pohang-Jangheung NGMN station between January and February 2018. The vertical dashed line indicates the occurrence time of the M4.6 earthquake. The MW1, Pohang4, Pohang5, and Pohang-Jangheung stations were 88.9 km, 16.1 km, 11.9 km, and 11.9 km apart from the epicenter.


Table 1.
Description of groundwater monitoring stations in Korea.
| Station | Installed Date | Elevation (m) | Depth (m) | Screen Interval a | Sensor Depth (m) | K (m/s) b |
|---|---|---|---|---|---|---|
| MW1 | 20 October 2017 | 14.0 | 300.0 | 42.5–300.5 | 97.5 | 1.25 × 10⁻⁵ |
| MW2 | 26 February 2018 | 104.0 | 100.0 | 92–97 | 95.0 | 1.70 × 10⁻⁵ |
| MW3 | 21 September 2018 | 89.0 | 100.5 | 91–100 | 95.0 | 1.0 × 10⁻⁵ |
| MW4 | 21 September 2018 | 30.0 | 100.0 | 95–100 | 95.33 | 3.77 × 10⁻⁴ |
| MW5 | 21 September 2018 | 54.5 | 100.0 | 91–100 | 95.49 | 2.11 × 10⁻⁵ |
| MW6 | 22 April 2018 | 100.0 | 85.0 | 75.5–84.5 | 80.75 | 1.05 × 10⁻⁴ |
| MW7 | 23 April 2018 | 240.0 | 90.0 | 63–68 | 65.02 | 6.90 × 10⁻⁴ |
a presented in m below the ground surface. b Hydraulic conductivity.
Table 2.
Results of aquifer type tests using harmonic analysis.
| Station | Analyzed Periods | Aquifer Type | Comments |
|---|---|---|---|
| MW1 | 1 November 2017–30 November 2017 | Confined | |
| MW2 | 1 January 2019–31 January 2019 | - | |
| MW3 | 16 November 2018–30 November 2018 | - | |
| MW4 | 16 November 2018–30 November 2018 | - | |
| MW5 | 16 November 2018–30 November 2018 | - | |
| MW6 | 1 May 2019–15 May 2019 | - | Precipitation in 19.05.14 (0.1 mm) |
| MW7 | 1 May 2019–15 May 2019 | Confined |
Publisher’s Note: MDPI stays neutral with regard to jurisdictional claims in published maps and institutional affiliations. |
© 2021 by the authors. Licensee MDPI, Basel, Switzerland. This article is an open access article distributed under the terms and conditions of the Creative Commons Attribution (CC BY) license (https://creativecommons.org/licenses/by/4.0/).
Share and Cite
MDPI and ACS Style
Lee, H.A.; Hamm, S.-Y.; Woo, N.C. Pilot-Scale Groundwater Monitoring Network for Earthquake Surveillance and Forecasting Research in Korea. Water 2021, 13, 2448. https://doi.org/10.3390/w13172448
AMA Style
Lee HA, Hamm S-Y, Woo NC. Pilot-Scale Groundwater Monitoring Network for Earthquake Surveillance and Forecasting Research in Korea. Water. 2021; 13(17):2448. https://doi.org/10.3390/w13172448
Chicago/Turabian StyleLee, Hyun A, Se-Yeong Hamm, and Nam C. Woo. 2021. "Pilot-Scale Groundwater Monitoring Network for Earthquake Surveillance and Forecasting Research in Korea" Water 13, no. 17: 2448. https://doi.org/10.3390/w13172448
Note that from the first issue of 2016, this journal uses article numbers instead of page numbers. See further details here.