Dolomitization of Paleozoic Successions, Huron Domain of Southern Ontario, Canada: Fluid Flow and Dolomite Evolution


1
School of the Environment, University of Windsor, 401 Sunset Avenue, Windsor, ON N9B 3P4, Canada
2
Nuclear Waste Management Organization, 22 St. Clair Avenue, East, Toronto, ON M4T 2S3, Canada
*
Author to whom correspondence should be addressed.
Water 2021, 13(17), 2449; https://doi.org/10.3390/w13172449
Submission received: 3 August 2021
/
Revised: 29 August 2021
/
Accepted: 30 August 2021
/
Published: 6 September 2021
(This article belongs to the Special Issue Effects of Diagenetic Alterations on Hydrocarbon Reservoirs and Water Aquifers)
Abstract
:Integrated petrographic, isotopic, fluid inclusion microthermometry, and geochemical analyses of Paleozoic carbonate successions from multiple boreholes within the Huron Domain, southern Ontario were conducted to characterize the diagenetic history and fluid composition, on a regional scale, and evaluate the nature and origin of dolomitized beds. Multiple generations of non-stochiometric dolomite have been observed. These dolomites occur as both replacement (D1 and D2) and cement (saddle dolomite; SD) and formed either at near-surface to shallow burial zone (D1) or intermediate burial (D2 and SD). Petrographic and geochemical data of dolomite types and calcite cement suggest that these carbonates have experienced multiple fluid events that affected dolomite formation and other diagenetic processes. Cambrian and Ordovician strata have two possibly isolated diagenetic fluid systems; an earlier fluid system that is characterized by a pronounced negative shift in oxygen and carbon isotopic composition, more radiogenic Sr ratios, warm and saline signatures, higher average ∑REE compared to warm water marine brachiopods, negative La anomaly, and positive Ce anomaly; and a later Ordovician system, characterized by less negative shifts in oxygen and carbon isotopes, comparable Th, hypersaline, a less radiogenic, less negative La anomaly, and primarily positive Ce anomaly but also higher average ∑REE compared to warm water marine brachiopods. Ordovician, Silurian, and Devonian Sr isotopic ratios, however, show seawater composition of their respective age as the primary source of diagenetic fluids with minor rock/water interactions. In contrast, the isotopic data of the overlying Silurian and Devonian carbonates show overlaps between δ13C and δ18O values. However, δ18O values show evidence of dolomite recrystallization. D2 shows wide Th values and medium to high salinity values. Higher Th and salinity are observed in SD in the Silurian carbonates, which suggest the involvement of localized fluxes of hydrothermal fluids during its formation during Paleozoic orogenesis. Geochemical proxies suggest that in both age groups the diagenetic fluids were originally of coeval seawater composition, subsequently modified via water-rock interaction possibly related to brines, which were modified by the dissolution of Silurian evaporites from the Salina series. The integration of the obtained data in the present study demonstrates the linkage between fluid flux history, fluid compartmentalization, and related diagenesis during the regional tectonic evolution of the Michigan Basin.
1. Introduction
As part of an ongoing investigation into the occurrence of strata-bound dolomite layers within sedimentary, Paleozoic-age formations of southern Ontario an initial study using core acquired from the site of a formerly proposed deep geological repository (Bruce nuclear site) was conducted [1]. This initial study provided a site-specific analog to examine fluid migration and rock-formation barrier integrity at geological timescales. Results showed that hydrothermal alterations were minimal, burial-related, and lacked isotopic signatures associated with fault-controlled diagenesis, as observed in other regions of southern Ontario. This program was then expanded to a regional scale, to determine if the conditions observed at the Bruce nuclear site were consistent across the Huron Domain of southern Ontario. Core samples from multiple deep boreholes within the Huron Domain of southern Ontario were analyzed for petrographic, stable, and Sr isotopic composition, fluid inclusion microthermometry, and major, trace, and REE to characterize diagenetic history, fluid composition, and sedimentary provenance (e.g., [2,3]).
Extensive fluid flow occurs during tectonic thrusting, sedimentary loading, uplift, and compression in many sedimentary basins [4]. These fluids can affect the redistribution of mass, heat, petroleum migration, and formation of sediment-hosted ore deposits [5,6,7]. A fundamental problem in geology is to constrain the composition of the fluids within the context of thermal and tectonic evolution (i.e., changes of stress regimes) of hosting sedimentary basins. The composition and evolution of ancient sedimentary fluids have been successfully reconstructed using recent advances in stable and radiogenic isotopes, trace and rare-earth element geochemistry, fluid inclusion analyses, and paleomagnetic techniques (e.g., [7,8,9,10,11,12,13]). The fluids identified in these studies ranged in composition from evaporative brines, marine, mixed marine-meteoric, to deep brines and hydrothermal waters.
Dong et al. [14] showed that strata-bound dolostones form in a broad range of geologic and geochemical processes and generally result from large-scale fluid flow. Important aspects of dolomitization that need further thorough investigation are: (1) the source and supply of Mg [15,16]; (2) the plumbing mechanism necessary to transport Mg-bearing solutions to the site of dolomitization [17]; (3) the stoichiometry and recrystallization of dolomite [18,19,20,21,22,23], and (4) the effect of tectonics on the fluid flow [5,24,25,26,27]. An understanding of the genesis of ancient dolomites is only possible through detailed petrographic and geochemical studies of dolomitized sequences where the geologic history of the rocks is also reasonably well constrained.
There are several models suggested explaining the formation of dolomite over a broad range of geologic and geochemical processes. These models include [28,29,30,31]: (1) sabkha dolomitization model, (2) seepage-reflux dolomitization model, (3) mixing zone dolomitization model, (4) seawater dolomitization model (5) burial-dolomitization model, and (6) structurally-controlled hydrothermal dolomitization model.
Geological and geochemical processes lead to a change in formation density that can alter the physical properties of the bedrock, including increased porosity and permeability. In this sense, dolomitization can influence groundwater system evolution through the creation of permeable pathways following lithification, especially along localized geologic structures suitable for the accumulation of hydrocarbons. These models are dependent on three criteria [30]: (1) Thermodynamic: the fluids must be supersaturated with respect to dolomite and undersaturated with respect to calcite. Thus, dolomite cement will precipitate, and calcite cement will dissolve. (2) Kinetic: the rate of dolomite precipitation must be equal to or greater than the rate of calcite dissolution. (3) Hydrologic: Mg-rich fluids must be pumped continuously in the limestone pore system, faults, and fractures [30].
Recent studies by Haeri–Ardakani et al. [32,33] identified three distinct dolomite types within southwestern Ontario: a microcrystalline dolomite (D1) formed during early diagenesis from Middle Ordovician seawater and recrystallized during progressive burial, a medium crystalline dolomite (D2) formed by hydrothermal fluids (68 to 99 °C) and a late-stage saddle dolomite cement (D3) related to fault controlled, high temperature fluids (>125 °C).
Most recently, Al-Aasm [1], Al-Aasm and Crowe [2] and Tortola et al. [3] assessed the nature and origin of strata bound dolomitization occurring in rock samples from Cambrian through Devonian carbonates and siliciclastics beneath the Bruce nuclear site and adjacent areas within southern Ontario. These latter studies better supported the notion of fluid compartmentalization between different stratigraphic successions.
Hence, the main purpose of this study is to thoroughly examine all data gathered in both previous and new studies by the authors to further evaluate, on a regional scale, the nature and origin of dolomitized beds within Paleozoic carbonates of the Huron Domain with the intention on deciphering the nature of dolomitization processes, evolution of diagenetic fluids, the nature of paleohydrogeological system(s) and whether they are connected on not, the source of heat for hydrothermal fluids (if any) and the driving force for diagenetic fluid(s) migration, in contrast to previous studies in southwestern Ontario.
2. Regional Geologic, Tectonics, and Stratigraphic Framework
The study area is located on the northeastern margin of the Michigan Basin (Figure 1 and Figure 2). It represents a portion of the northwestern flank of the Algonquin Arch that consists of Paleozoic sediments overlying the subsurface basement [34]. The thickness of the Paleozoic sequence is estimated to range from a maximum of 4800 m at the center of the Michigan Basin to 850 m on the flank of the Algonquin Arch.
Southern Ontario separates two major Paleozoic sedimentary basins, the Appalachian Basin to the southeast and Michigan Basin to the west (Figure 1A). The Algonquin Arch, which separates the two basins, extends from northeast of the Canadian shield to the southwest near the city of Chatham. Near the Windsor area, another structural high named the Findlay Arch begins and extends to the southwest into Michigan and Ohio states [39]. The Michigan basin is a nearly circular intracratonic basin dominated by carbonate and evaporite sediments, whereas the Appalachian Basin is an elongate foreland basin developed because of the collisional tectonic event along the eastern margin of the North American continent during the Paleozoic and is mainly characterized by deposition of siliciclastic sediments [40].
During Precambrian to Cambrian, a rifting event that separated North America and Africa initiated subsidence (approximately 1100 Ma) and deposition within the Michigan Basin (Figure 1B; [37]). Thermal subsidence of the Precambrian basement followed approximately 580 Ma to 500 Ma after the cooled lithosphere increased in density [41]. The subsequent and continuous deposition of sediment into the Michigan Basin caused the bending of the basement [42,43,44]. However, the development of the basin is not the result of a continuous subsidence but represents the outcome of a series of tectonic events that characterized the Paleozoic [45,46].
The Taconic and Acadian Orogenies (Figure 1B) had a dominant control on the Paleozoic strata of the eastern flank of Michigan [47]. In fact, during the Taconic Orogeny (Ordovician), a large-scale eastward tilting of the Laurentian margin has been produced with the consequent disappearance of the concentric depositional geometry of the Michigan Basin and with the subsequent deposition of Ordovician limestone and overlying shale successions [46,48,49].
The Middle Devonian Acadian Orogeny (Figure 1B) determined the reactivation of the Algonquin-Findlay Arch system with consequent return of the concentric geometry of the Michigan Basin [45]. During the Upper Silurian where restricted marine conditions dominated, the deposition was mainly characterized by the evaporites of the Salina Group [50,51]. In addition, the presence of an unconformity reveals emergent conditions at the end of the Silurian [47].
The Caledonian (Devonian) and Alleghenian (Carboniferous) Orogenies (Figure 1B) played a major role in terms of diagenetic fluid migration [5]. The regional maximum principal stress at that time was northwesterly oriented in accordance with the main direction of the thrust motion along the Appalachian tectonic front [47,52].
The Paleozoic sequence is separated from underlying Precambrian rocks of the ca. 1.1 Ga old Grenville orogeny by an unconformity overlain by a relatively thin Cambrian sandstone, which represents an aquifer [53,54]. The depositional environment of the Ordovician and Cambrian formations encompasses various facies assemblages, including supratidal, lagoonal to subtidal environments (e.g., [55,56]). The diverse facies changes observed in these formations were controlled by relative sea-level changes and sources of detritus, related to the regional tectonic setting during the Paleozoic [37,46]. In the study area, many of the Cambrian units along the Algonquin Arch (Figure 1) were absent due to arch rejuvenation and uplift during early Paleozoic times (e.g., [56]). Ordovician formations consist of thin, decimeter-scale, alternating shale, and carbonate beds; some of which have been dolomitized [47]. The Michigan Basin has been characterized by a typical tropical climate during mid to late Silurian because it was located at 25° south of the equator [57] leading to the development of shallow waters reef complexes. Moreover, the Michigan Basin has been isolated and is becoming an evaporative basin in which alternation of evaporites and carbonates is deposited during the rest of the Silurian [58]. Conversely, in the Middle Devonian, the Michigan basin has been characterized by an extremely arid climate with consequent deposition of shallow intertidal and supratidal lithofacies such as Amherstburg and Lucas formations [59]. The Devonian sequences are represented by limestones, shales, dolostones, and sandstones [39] with arid climate and deposition of shallow intertidal and supratidal lithofacies (e.g., Amherstburg and Lucas formations).
3. Sampling and Analytical Methods
This section may be divided into subheadings. It should provide a concise and precise description of the experimental results, their interpretation, as well as the experimental conclusions that can be drawn.
Cores (n = 91) from specific sections from deep boreholes (n = 10) from Bruce Nuclear Site (Tiverton, Ontario) and across the Huron Domain of southern Ontario were sampled (Figure 2). These samples encompass formations ranging from Cambrian to Devonian age successions and representing a wide range of rocks including dolomitized limestones, dolostones, sandy dolostones, and sandstones (Figure 2). These core samples were examined and photographed prior to their selection for making thin sections and fluid inclusion wafers. Petrographic examination of 145 thin sections was performed under a standard petrographic microscope to compliment core descriptions and by cathodoluminescence microscopy (CL) using a Technosyn cold cathodoluminescence stage with a 12–15 kV beam and a current intensity of 0.42–0.43 mA.
Samples for oxygen and carbon isotopic analyses were extracted from calcite and dolomite samples (n = 259) from polished slabs using a microscope-mounted drill assembly. The samples were reacted in a vacuum with 100% pure phosphoric acid for four hours at 25° and 50 °C for calcite and dolomite, respectively. CO2 gas from samples that contained a mixture of calcite and dolomite was extracted using the chemical separation method of Al-Aasm et al. [60]. The evolved CO2 gas was analyzed for isotopic ratios on a Delta Plus mass spectrometer. Delta (δ) values for oxygen and carbon are reported per mil (‰) relative to the PeeDee Belemnite (VPDB) standard. Precision was better than 0.05‰ for both δ18O and δ13C.
Twenty-six core samples were selected for Sr isotopic analyses from various calcitic and dolomitic components representing host rock, skeletal components, and diagenetic phases. Prior to 87Sr/86Sr analysis, powdered samples (n = 78) were extracted employing a microscope-mounted drill assembly to extract 1–10 mg of powdered calcite or dolomite from polished slabs. Care was taken to avoid contamination from other components such as later cement fill. These samples were initially dissolved in 2.5 N HCl suprapure for 25 h in sealed PFA vessels at room temperature. They were then passed through cation exchange quartz columns. To remove the eventual pore salts that may contain Sr, these samples were, after crushing and pulverization were washed twice with MilliQ water. Strontium isotopic ratios were measured on a Finnigan MAT 261 mass spectrometer. All analyses were performed in the static multi-collector mode using Re filaments. NBS and ocean water were used as standard references and 87Sr/86Sr ratios were normalized to 87Sr/86Sr = 8.375209. The mean standard error was 0.00003 for NBS-987.
Thirty-one samples were analyzed for fluid inclusion microthermometric studies. Petrographic work was done with a conventional petrographic microscope. Careful and detailed observations of size, occurrence habit, and paragenetic contexts of the fluid inclusions were conducted in the double polished wafers. Distinctions were made between primary, secondary, and pseudo-secondary fluid inclusions. This was followed by a determination of the number of phases (i.e., the liquid to vapor ratio) and their ratios entrapped in each of the fluid inclusions. Then determination of the composition (aqueous or hydrocarbon fluids) of the inclusion using fluorescence microscopy; most oil-filled inclusions fluoresce, while the aqueous inclusions do not. Finally, microthermometric measurements of the homogenization (Th) and final ice melting temperatures (Tmice) of fluid inclusions were measured. These measurements were conducted using a Linkam THMGS600 heating-freezing stage, which was calibrated using synthetic fluid inclusions of known compositions. Homogenization temperatures (Th), and ice-melting temperatures (Tm-ice) were measured with a precision (reproducibility) of ±1 °C and ±0.1 °C, respectively. The salinities for inclusions in which ice was the last melting phase were calculated using the program of Chi and Ni [61], and those for inclusions with hydrohalite as the last melting phase was done with the program of Steele-MacInnis et al. [62].
Deformation of inclusion walls, necking-down of single inclusions into smaller inclusions, or leakage of fluid can all lead to changes in homogenization temperature. To limit the possibility of measuring deformed aqueous inclusions, only primary inclusions from the same field of view were measured during a single heating or freezing run. By restricting measurements to inclusions within the same field of view, any sudden changes in liquid/vapor ratios due to inclusion deformation could be observed and removed from consideration. This does not exclude the possibility of subtle deformation in the z-axis, which is difficult to detect. Heating runs were conducted before freezing runs to reduce the possibility of inclusion stretching by freezing [63].
Major (Ca, Mg), minor, trace elements (Sr, Na, Mn, and Fe) and rare-earth element (REE) analyses (n = 95) were performed using ICP-MS. The procedure used for the sample digestion has been adapted to digest carbonates only. Around 50–100 mg of powdered carbonate samples from different calcite and dolomite phases were digested utilizing 5% v/v acetic acid. Measurements were carried employing an Agilent 8800 inductively coupled mass spectrometer at the University of Waterloo. All results we reported in part per million (ppm).
For rare-earth (REE) element analysis, samples were analyzed using external calibration, internal standard, and standard addition methods, following the procedure described in Jenner et al. [64]. Measured REE values were normalized to Post Archean Australian Shale (PAAS). Rare-earth element anomalies such as CeSN [(Ce/Ce*)SN = CeSN/(0.5LaSN + 0.5PrSN)], LaSN [(Pr/Pr*)SN = PrSN/0.5CeSN + 0.5NdSN)], EuSN [(Eu/Eu*)SN = EuSN/(0.5SmSN + 0.5GdSN)], and GdSN [(Gd/Gd*)SN = GdSN/(0.33SmSN + 0.67TbSN)] were calculated employing the equations proposed by Bau and Dulski [65]. The proportions of LREE(La-Nd) over HREE (Ho-Lu) were calculated via (La/Yb)SN ratios as proposed by Kucera et al. [66]. The proportions of MREE (Sm-Dy) was calculated using (Sm/La)SN and (Sm/Yb)SN ratios [67] over LREE and HREE, respectively.
An environmental scanning electron microscope (ESEM) coupled with an EDAX detector was utilized to analyze selected carbon-coated thin section samples to investigate the nature of dolomitization and subsequent recrystallization.
4. Results
4.1. Petrographic Analysis
Cambrian strata are dominated by mixed carbonate-siliciclastic lithofacies (Figure 3). The carbonate lithofacies is composed of dolomitized and silicified crinoidal and bryozoan components. The siliciclastic facies consist of silicified ooids and other coated grains as well as detrital carbonates with large detrital quartz, cemented by carbonates.
The Middle Ordovician carbonates in the subsurface are divided into the Black River Group and the overlying Trenton Group ([47]; Figure 3). The original depositional facies of the investigated Ordovician formations (Shadow Lake, Gull River, Coboconk, Kirkfield, Sherman Fall, Cobourg, and Collingwood) consists of nodular, bioturbated, micritic, and bioclastic facies—now partly dolomitized. In the Coboconk Formation, a thin fossiliferous layer (grainstone facies) occurs with a sharp contact with the nodular facies. This layer is also pervasively dolomitized. Skeletal components include bryozoans and echinoderms. In the Gull River Formation, the matrix is highly dolomitized but fossils such as brachiopods, crinoids, and trilobites are dolomitized but their textural integrity is preserved.
The Silurian formations in the Huron Domain are characterized by several lithofacies of partially to fully dolomitized carbonates, such as dolommudstone with abundant fenestrae, sometimes brecciated, and coated and bioclastic grainstone lithofacies. These carbonate lithofacies alternate with evaporite units, such as A-1, A-2, and B (Figure 3).
The Devonian carbonates contain nodular and bioturbated lithofacies, partially dolomitized (e.g., Lucas Formation; Figure 3), algal laminated dolomudstone, dolomitized bioclastic grainstone, undolomitized bioclastic grainstone, and brecciated, cherty dolostone lithofacies.
The diagenetic history of the Cambrian, Ordovician, Silurian, and Devonian successions in the Huron Domain encompasses multiple episodes of calcite cementation, dolomitization, anhydrite cementation, mechanical and chemical compaction, dissolution, and silicification. It is understood (e.g., [2,3]) that these diagenetic processes occurred during deposition and continued upon burial. The paragenetic sequence shown in Figure 4 is based on petrographic relationships, spatial distribution, and geochemical evidence. Due to the significance of dolomitization in these carbonates, the discussion in this paper will be concentrated on the most significant and relevant diagenetic events.
4.1.1. Dolomite Types
In this study, multiple generations of dolomite have been observed (Figure 4).
The dolomite types occur as both replacements (D) and cement (SD) (cf. [2,3]). According to Sibley and Gregg’s classification [68] and based on petrographic characteristics (e.g., crystal size, shape, extinction, fabric, and paragenetic relationships), several types of dolomite development are distinguished. Table 1 summarizes the main types of dolomite and their petrographic and CL characteristics.
Cambrian:
In the mixed carbonate-siliciclastic lithofacies of the Cambrian strata, the presence of dolomite is restricted to the dolomitized bioclastic lithofacies and scattered dolomite crystals within the silicified lithofacies (Figure 5). Two replacive dolomite types occur in the Cambrian rocks (microcrystalline subhedral-D1 and medium to coarse crystalline subhedral to anhedral, zoned- D2; Figure 5) and minor amounts of saddle dolomite (SD) cement present in vugs (Table 1; Figure 5). This dolomite cement is succeeded by large blocky calcite cement (Figure 5I) in fractures and vugs. D2 mimically replaces allochems, such as fossils and ooids.
Ordovician:
Two types of replacive dolomite are recognized in the Gull River, Coboconk, and Cobourg formations (Table 1; Figure 6): (1) microcrystalline dolomite replacing skeletal components and matrix (D1), and (2) medium crystalline replacive matrix dolomite (D2), which is fabric destructive, partly zoned and replaces the intranodular micritic matrix (Figure 6). D2 dolomite is volumetrically more abundant than D1 and it is also observed along dissolution seams in partially dolomitized limestones, usually characterized by cloudy-dark cores and clear rims (Figure 6C). A minor presence of saddle dolomite (SD) occludes pores and fractures and postdates D1 and D2 (Figure 6D,E). Anhydrite cement postdates saddle dolomite (Figure 6E,F). In other Ordovician formations, such as the Shadow Lake, Kirkfield and Sherman Fall, Silurian, which are mostly dominated by limestones of varied lithologies, no significant dolomitization is observed. However, the scattered occurrence of D1 dolomite is observed in Sherman Fall Formation replacing the calcitic muddy matrix.
Silurian:
Dolomite in the Silurian succession occurs mostly in the Guelph, Salina (A1-carbonates, A2-carbonates, Figure 3), and Bass Island formations. Two types of replacive matrix dolomite and one of dolomite cement are observed (Table 1; Figure 7). These are: D1 which is a pervasive replacive micro to fine crystalline matrix dolomite and D2, which consists of medium crystalline, subhedral, zoned dolomite (Figure 7B,C). It also occurs as a less abundant selective replacive medium (>50–100 µm) euhedral crystalline dolomite, only observed along dissolution seams in partially dolomitized limestones and usually characterized by cloudy-dark cores and clear rims (Figure 7C). Ferroan saddle dolomite (SD; Figure 7D–F) occludes fractures and vugs predating late blocky calcite cement (Figure 7E,F).
Devonian:
Two types of dolomites occur in the Devonian formations (Figure 3). These are: a pervasive replacive euhedral to subhedral micro to fine crystalline matrix dolomite (D1) and a pervasive replacive euhedral to subhedral medium crystalline, zoned matrix dolomite (D2) that is also associated sometimes associated with dissolution seams (Figure 8E). They are primarily observed in the Lucas and Amherstburg formations (Table 1; Figure 8).
4.1.2. Calcite Cementation
Early and late calcite type of cement are present in the investigated Paleozoic formations. These types of cement display various crystal habits and sizes and occlude both primary as well as secondary porosity, pre- and post-dolomitization (Figure 4 and Figure 9). The types of calcite cement identified include isopachous, syntaxial overgrowth, equant, dog-tooth, and blocky cement (Table 1).
Within Cambrian strata, fractures are occluded by a coarse, equant/ blocky calcite cement with strong, bright CL (Figure 9). In contrast, calcite cementation in the Ordovician formations is represented by an early equant calcite cement surrounding fossil allochems, isopachous rims around fossils and occluding hairline fractures (Figure 9), and later blocky calcite in fractures and vugs. The blocky calcite (BKC) in fractures postdates saddle dolomite cement (Figure 9).
In the Silurian successions, isopachous calcite cement growing around coated grains and exhibits microcrystalline, bladed texture (Figure 9; Table 1). Syntaxial calcite overgrowth cement (SXC; Figure 9D) forms ferroan, bright-luminescent crystals. Void-filling equant, pore-lining drusy calcite cement is observed in intergranular and intraskeletal pores, molds, and fractures. Late fracture and void-filling blocky calcite cement (BKC) postdate saddle dolomite cement. In terms of paragenesis, early calcite cement predated D1 and D2 and predated fracture- and pore-filling saddle dolomite which is postdated by late blocky calcite (BKC; Figure 4, Figure 7F and Figure 9) and evaporite cement.
In the Devonian formations, four types of calcite cement occlude the pore spaces represented by syntaxial overgrowth, dog-tooth, equant/drusy, and blocky. Paragenetically, early calcite cement (e.g., syntaxial overgrowth, dog-tooth; Figure 4 and Figure 9) predate replacive dolomite matrix D1 and predate the late fracture- and pore-filling blocky calcite (BKC) cement.
4.1.3. Other Diagenetic Phases
Together with the calcite and dolomite diagenetic phases reported above, silica-bearing minerals and sulfate minerals are also present in the studied successions (Figure 10).
Quartz is common in the Cambrian rocks typically replacing skeletal and nonskeletal components such as corals in coral-bearing facies and coated grains, such as ooids (Figure 5G). Silicification pre-dates dolomitization but postdates early isopachous calcite cementations (Figure 4). In the Ordovician strata, silicification replaced part of the muddy calcitic matrix, with microcrystalline dolomite (D1) replacing the silicified micrite and fossils. Anhydrite and gypsum are present in Cambrian, Ordovician, and Silurian rocks as fracture-fill, which postdates replacive dolomite (Figure 10). The rare occurrence of authigenic K-feldspar is observed by SEM filling some pores in Ordovician and Silurian rock but predated D2. Also, very minor pyrite and fluorite are observed in Silurian dolostones.
4.2. Geochemical and Fluid Inclusion Results
4.2.1. Oxygen, Carbon and Sr Isotopes
Table 2 summarizes the stable and radiogenic isotope results of dolomite and calcite cement types. Figure 11, Figure 12, Figure 13, Figure 14 and Figure 15 show the relationships among these isotopes with respect to their petrographic characteristics.
Fine-crystalline matrix dolomite in the Cambrian carbonates (D1) has a wide range of δ18O values from −16.9 to −2.9‰, δ13C values from −7.6 to −0.3‰ and 87Sr/86 Sr ratios from 0.70928 to 0.71716, respectively. Medium crystalline dolomite (D2) δ18O values vary from −8.2 to −6.9 ‰, δ13C values vary from −2.9 to −1.5‰, and 87Sr/86 Sr ratios from 0.70927 to 0.71100. Saddle dolomite cement δ18O values range between −10.7 to −8.7‰, from −4.2 to −0.5‰ for δ13C, respectively. In all dolomite types there is a co-variant relationship between both isotopes (Figure 11). Blocky calcite cement (BKC) occluding fractures have δ18O values ranging from −15.2 to −7.9‰ for δ18O and δ13C values −5.3 to −3.5‰. Its 87Sr/86 Sr ratios range from 0.71000 to 0.71031 (Figure 12).
The fine crystalline replacive matrix dolomite (D1) in the Ordovician carbonates has δ18O values vary from −12.4 to −5.3‰, and less negative δ13C values compared to the Cambrian D1 dolomite (ranging from −1.2 to 1.1‰; Figure 11). Its 87Sr/86 Sr ratios range from 0.70808 to 0.72346, respectively. The highly enriched ratios are samples that occur along dissolution seams (Figure 13). D2 overlaps with D1 with δ18O values ranging from −9.6 to −4.1‰, δ13C values from −0.4 to 2.2‰, and 87Sr/86 Sr ratios from 0.70814 to 0.71255, respectively. The enriched ratio also represents a sample occurring along dissolution seams (Figure 13). The δ18O values for saddle dolomite (SD) vary from −10.8 to −8.3‰, and δ13C values from −2.5 to 2.2‰, respectively. Its 87Sr/86 Sr ratios vary from 0.70844 to 0.71066. The δ18O values for the early calcite matrix ranging from −9.2 to −3.8‰, and from −3.9 to 2.1‰ for carbon isotopes. One sample 87Sr/86 Sr ratios for matrix calcite is 0.70809. For late blocky calcite cement (BKC) the δ18O values vary from −9.8 to −3.9 and from −1.8 to 1.4‰ for δ13C. The 87Sr/86 Sr ratios for this cement vary from 0.70797 to 0.70809.
There is a significant overlap in δ18O and δ13C values in D1, D2, and SD. Fine-crystalline matrix dolomite in the Silurian carbonates (D1) has δ18O values ranging from −8.0 to −4.4‰, δ13C values from −2.8 to 3.9‰ and 87Sr/86 Sr ratios from 0.70871 to 0.71201, respectively. Medium crystalline dolomite (D2) δ18O values vary from −8.3 to −3.8, δ13C values vary from −0.3 to 4.0‰, and 87Sr/86 Sr ratios from 0.708447 to 0.70891. Saddle dolomite cement δ18O values range between −9.6 to −6.1‰, from 0.1‰ to 3.69 for δ13C, respectively. Its 87Sr/86 Sr ratios vary from 0.70852 to 0.70872. The δ18O values for the early calcite matrix ranging from −8.8 to −4.7‰, and from −0.8 to 3.5‰ for carbon isotopes. In one sample, 87Sr/86 Sr ratios for the matrix calcite is 0.70815. Blocky calcite cement occluding fractures has δ18O values ranging from −10.1 to −4.5 for δ18O and δ13C values −3.75 to 3.1‰. Its 87Sr/86 Sr ratios range from 0.70805 to 0.70838.
Most of the δ18O values for D1 in the Devonian carbonates are slightly more enriched than D2 and they vary between −7.0 to −4.4 for δ18O and from 0.5 to 4.2 for δ13C, respectively. Its 87Sr/86 Sr ratios range from 0.70788 to 0.70937. Medium crystalline dolomite (D2) δ18O values vary from −10.3 to −3.9, δ13C values vary from 0.6 to 4.6‰, and 87Sr/86 Sr ratios from 0.70809 to 0.70937. The δ18O values for the early calcite matrix ranging from −9.6 to −4.4‰, and from 2.4 to 4.1‰ for carbon isotopes. The one analysis of Sr isotopes of this calcite yields a ratio of 0.70805. Blocky calcite cement (BKC) occluding fractures and vugs has δ18O values ranging from −10.5 to −8.0 for δ18O and δ13C values −2.4 to −1.2‰. Its 87Sr/86 Sr ratios range from 0.70798 to 0.70806.
4.2.2. Major, Minor, Trace and REE Elements Content
Analytical results of major, trace, and rare-earth (REE) element concentrations for the dolomites and calcites from various age groups are summarized in Table 3. All analyzed replacement and cement dolomite types are non-stoichiometric, consistently calcium-rich (average CaCO3 ranging from 54.3 to 61.8 mol% for D1 and D2, and from 57.7 to 63.3 mol% for SD, respectively; Figure 16). There are no significant differences in Mg content in zoned D2 and SD between the cores and rims, as evidenced from the semiquantitative EDX analysis. In general, Mn and Fe contents in the Cambrian and Ordovician dolomites are much higher than the Silurian and Devonian dolomites (Table 3). There is also a covariant trend between Mn and Fe for these dolomites (Figure 17). However, the average of Sr content in all dolomites does not show large variations among the investigated dolomite types (vary between 83 and 253 ppm, Table 3), but many samples from the Ordovician dolomites show high Sr content and covariant trends with Fe and Mn (Figure 17). Such a relationship is not apparent in the dolomites from other age groups.
Samples of dolomite and fracture- and vug-filling calcite cement from different age groups were analyzed for REE content (Table 4). The ∑REE of Cambrian dolomite types and calcite cement is significantly higher than those in Ordovician, Silurian, and Devonian strata (Table 4) compared with the average of warm water brachiopods shown by Azmy et al. [70]. ∑REE of Devonian samples record the lowest values among the rest.
Replacive dolomite D1 and D2 sampled from Cambrian formations show different trends (Figure 18) compared to the pattern of warm water brachiopods shown by Azmy et al. [70], with a dominant-negative La anomaly and positive Ce anomalies (Figure 19).
Both dolomite D1 and D2 (Figure 18) sampled from Ordovician formations show different trends compared to the pattern of warm water brachiopods shown by Azmy et al. [70], with a negative La anomaly and both cases of positive and negative Ce anomalies (Figure 19). Both D1 and D2 exhibit higher average ΣREE (11.63 ± 21.56 ppm, and 8.54 ± 7.36 ppm, respectively) compared with the average of warm water brachiopods shown by Azmy et al. [70]. Saddle dolomite cement (SD) patterns show lower average ΣREE (9.55 ± 4.36 ppm) than D1 but slightly higher than D2. It also shows, similarly to D1 and D2, slightly different patterns compared to warm water brachiopod’s pattern with both negative La and Ce anomalies.
Replacive dolomite D1 and D2 sampled from Silurian formations show different trends compared to the pattern of warm water brachiopods shown by Azmy et al. [70] (Figure 18), with a minor negative La anomaly and both cases of positive and negative Ce anomalies (Figure 19). Brachiopods, D1, and D2 patterns with both negative La and Ce anomalies as well as a slight negative Eu anomaly (Figure 19).
Both fine and medium dolomite matrix samples (D1 and D2, respectively) from Devonian formations have shale-normalized patterns sub-parallel to those of modern warm water brachiopods from Azmy et al. [70]. They both show the typical characteristics of seawater patterns such as depletion of LREE over HREE and slightly positive La and Gd anomalies (Figure 19).
There is a subtle difference in Cambrian and Ordovician dolomite vs. Silurian and Devonian samples in terms of Sm/Yb vs. Eu/Sm (Figure 20A), La/Yb vs. La/Sm (Figure 20B), Y/Ho vs. Sm/Yb (Figure 20C) and Y/Ho vs. Eu/Sm (Figure 20D) ratios. For example, higher Sm/Yb ratios (Figure 20A), lower Sm/Yb, Eu/Sm (Figure 20C,D) in the Cambrian and Ordovician dolomites than Silurian and Cambrian dolomites.
4.2.3. Fluid Inclusions Microthermometry
Microthermometric measurements of primary fluid inclusions from D2, SD, and BKC from each age group provide melting and homogenization temperatures (Th) and estimates of salinity (cf. [61,71] for each phase (Table 5 and Figure 21). Primary fluid inclusions within D1 crystals were too small to measure (cf. [71]). However, monophase fluid inclusions are present in this dolomite. For calcite, measurements were taken for coarse crystalline cements (BKC) in vugs and fractures. The measured Th provides an estimate of minimum entrapment temperatures. The low first melting temperatures and ice-melting temperatures suggest that the fluid within the fluid inclusions may approximate a H2O-NaCl-CaCl2 system. The examined inclusions are parallel to crystal facets and the vapor bubble size for the two-phase (liquid-vapor) fluid inclusions. There is a notable overlap in Th and salinity values among all dolomite types in Cambrian, Ordovician and Silurian samples (Figure 21), showing high Th and salinity. However, lower Th and salinity values are recorded for D2 in the Devonian samples. Fluid inclusions within D2 from Cambrian crystals yielded Th that range from 75° to 132 °C (102.9 °C, n = 19), with salinity estimates based on final ice-melting temperatures (Tmice) that correspond to salinities range from 23.2 to 27.2 wt.% (25.4 wt.%, n = 10). Fluid inclusions in SD crystals have Th ranging from 111° to 156 °C (131.6 °C, n = 5). Measurable 2-phase fluid inclusions in BKC giving Th ranging between 85° and 141 °C (108 °C, n = 11), and salinities from 22.1 to 23.6 wt.% (22.9 wt.%, n = 2).
Fluid inclusions within D2 from Ordovician samples yielded Th that range from 66° to 132 °C (96.3 °C, n = 41), with salinity, estimates that range from 21.6 to 30.5 wt.% (26.5 wt.%, n = 12; Table 5). Fluid inclusions in BKC giving Th ranging between 68° and 153 °C (109.7 °C, n = 27), and salinities from 24.8 to 30.3 wt.% (27.2 wt.%, n = 7).
In Silurian sample Th values for D2 are ranging between 49.7 ° and 134.1 °C (93.4 °C, n = 42), and salinities from 15.1 and 25.2 (23.1, n = 15). Fluid inclusions in SD crystals have Th ranging from 101.2° to 193.4 °C (123.5 °C, n = 53), and salinities from 25.2 to 32.6 (28.5 wt%, n = 29). Measurable 2-phase fluid inclusions in BKC giving Th ranging between 70.2° and 194.3 °C (129.1 °C, n = 53), and salinities from 21.4 to 32.3 wt.% (27.6 wt.%, n = 25).
Fluid inclusions within D2 from Devonian samples yielded Th that range from 69.9° to 102.3°C (83.7 °C, n = 29), with salinity range from 18.9 to 21.8 wt.% (20.7 wt.%, n = 12). For BKC higher Th values than samples from other age groups are measured and vary between 146.2° and 255.1 (202.0 °C, n = 48), and lower salinity values vary between 15.1 and 23.9 wt.% (20.7 wt.%, n = 25).
5. Data Analysis and Discussion
Petrographic investigations, stable-isotope, elemental analyses, and fluid-inclusion microthermometry provide important clues regarding dolomitization and other diagenetic processes, fluid chemistry, and the history of fluids migration in the sedimentary basin. The Paleozoic successions in the Huron Domain of Michigan Basin were affected by early (marine to shallow eogenetic zone; [72]) and deeper (mesogenetic zone) diagenetic processes [72]. These include early calcite cementation, silicification, partial dissolution, early dolomitization and later dolomitization, recrystallization, fracturing, stylolitization, late calcite, and sulphate cementation. There are similarities in the diagenetic processes in Cambrian and Ordovician carbonates and Silurian and Devonian carbonates which allow us to consider and discuss these carbonates together (Figure 4).
5.1. Constraints from Petrography-Paragenetic Sequence
The paragenetic sequence of the main diagenetic events in the studied Paleozoic successions (Figure 4), which was constructed originally based on textural relationship and geochemical and fluid inclusion evidence, provides a useful platform for further discussion of the data obtained in this study.
As reviewed in Section 2 above, the depositional environments of the Cambrian and Ordovician carbonates encompass various lithofacies assemblages, including supratidal, lagoonal to subtidal environments (e.g., [47,55]). The diverse lithofacies changes observed in these formations are directly controlled by relative sea-level changes and sources of detritus. These were evident especially in the Cambrian strata where mixed siliciclastic-carbonate facies are common. Ultimately, these depositional processes also affected the diagenetic changes encountered in these sediments during shallow and deeper burial stages. In carbonate-rich units, the bioclastic grainstone facies has been influenced by early stabilization of calcitic/aragonitic components and dolomite replacement at shallow burial (D1; Figure 5B) to be succeeded by medium to coarse crystalline dolomite (D2; Figure 5B–D,I), possibly at an intermediate burial. Minor presence of saddle dolomite (SD) occluding vugs postdates D2 but predates BKC, which is occluding fractures; both of which probably formed later than D2 in the intermediate burial stage (Figure 4; Figure 5E). In the ooid grainstone lithofacies, which is extensively silicified (Figure 5G), the early isopachous calcite cement was silicified. However, the silicified ooids are well preserved and show evidence of very early diagenetic, the pre-compaction origin of these allochems. The siliciclastic-dominated facies were cemented earlier by calcite cement later to be compacted with the creation of some minor fractures occluded by equant calcite cement, which was partly dolomitized. The basal Cambrian sandstone is assumed to have been a major migratory path for diagenetic fluids [73,74]. Strata in the eastern region of the basin pinches out towards the margins. These thin fingers of clastic material which have large amounts of bioclastic material increase the likelihood for extensive dolomitization of a thin layer.
In the Ordovician formations (e.g., Coboconk Formation) diagenesis was initiated by early cementation that produced the nodular facies on the seafloor. Burial and compaction affected the formation of these nodules and may have created hairline fractures, later occluded by dolomite. Dolomitization (D1; Figure 6) occurred by selective early replacement of skeletal components such as bryozoans and echinoderms and the micritic matrix, as well as, pervasively replacing the intra-nodule matrix during shallow burial. These dolomites were crosscut by hairline fractures and stylolites during a burial at a later stage, suggesting the formation of D1 at a shallow burial. Silicification, which occurs in some facies of the Coboconk Formation occurred prior to dolomitization as evidenced by silica replacing the matrix and fossils that later were selectively dolomitized. In the Gull River Formation, a similar paragenetic sequence to the Coboconk Formation is observed (Figure 4). Initially, dolomitization proceeded with fine crystalline (D1) and medium to coarse crystalline matrix replacement dolomite (D2). The minor saddle dolomite (SD) cement postdates earlier dolomite formation and occludes vugs and fractures and is also postdated by late, blocky calcite cement (BKC), which is occluding vugs and fractures (Figure 6). Other compaction features such as stylolites postdate or sometimes appear to be contemporaneous with the medium to coarse crystalline dolomite (D2; Figure 6C). In both the Coboconk and Gull River formations, the intra and internodule dolomites typically present as petrographically distinct. These distinctions reflect differences in the underlying substrate that was originally dolomitized and relate to permeability, not fluid chemistry, or timing (notwithstanding some evolution of brine chemistry over time). An early, shallow burial origin is suggested for the fine crystalline (D1) dolomite as evidenced by the selective replacement of this dolomite, its shape and size, and it predates stylolite formation, consistent with a shallow burial diagenetic environment. In contrast, the medium and coarse crystalline (D2) dolomite may have formed at medium burial stages as evidenced by its increasing crystal size, subhedral and anhedral shape (e.g., [26]), and close association sometimes with compaction features, such as stylolites. The stylolites observed in the samples all occur at ~90° to the fractures. This relationship may be explained by compressive stress, imposed by the Taconic Orogeny, which was occurring concurrently with deposition. These stylolites may have acted as conduits for Mg-rich fluids (e.g., [75]).
In contrast, the depositional environments of the Silurian and Devonian successions encompass various lithofacies assemblages, including shallow marine ramp and deeper water subtidal lithofacies dominated by limestone and dolostone lithofacies with intercalations of shales and evaporite deposits in both age groups (e.g., [47,76,77]). In the Silurian and Devonian carbonates early calcite cementation (e.g., ISC and SXC; Table 1) and micritization initiated on the seafloor to be followed during burial by occlusion or porosity by later calcite cementing vugs and fractures (e.g., DC, and BKC; [78]). BKC postdates saddle dolomite (SD; Figure 4). Evaporite minerals, such as gypsum and anhydrite represent the final stage of cementation in the Silurian rocks. Dolomitization commenced early (D1) formed replacing calcitic and aragonitic allochems and muddy calcitic matrix [3]. This dolomite may have formed at a shallow burial, in a reflux evaporative setting (e.g., [33,79,80]). This is supported by its fine crystalline crystal size [68] and the cross-cutting relationship with compactional features, such as dissolution seams and stylolites which crosscut this dolomite. This dolomitization phase is followed by the formation of medium to coarse crystalline replacive dolomite (D2) at the medium burial stage. The increase in crystal size of D2 may reflect dolomitization of coarser lithofacies (such as grainstones) and/or recrystallization of precursor dolomite matrix (D1; [23]). In the Silurian carbonates, only saddle dolomite (SD) is observed occluding fractures, postdating D1 and D2 but predating blocky calcite (BKC; Figure 7). This dolomite formed possibly in an intermediate burial setting.
Evaporite minerals (gypsum and anhydrite; Figure 10) represent the last diagenetic phases and form in a deeper burial realm. These minerals occlude fractures and vugs in Cambrian, Ordovician, and Silurian, carbonates.
5.2. Controls of Dolomitization-Geochemical Evidence
5.2.1. Stable and Radiogenic Isotopes
Cambrian:
The stable isotopic composition of D1, D2, and SD in Cambrian rocks (Figure 11) are notably lighter than the postulated dolomite precipitated in equilibrium with marine waters (e.g., [69]). These values are also distinct from other age groups (Figure 11). There is little isotopic fractionation of 13C/12C with temperature, and hence the δ13C values of these dolomite reflect isotopic fractionation of C related to fluids that are enriched in lighter CO2 originated from oxidized carbon, which can be related to seawater-sourced, reduced, bacterial sulfate reduction process for D1 and hydrocarbon sources for D2 and SD [2].
However, the δ18O values of the dolomites reflect both the temperature and the composition of the parent fluids, and thus the departure from equilibrium values reflects precipitation of these dolomite under a different diagenetic regime [81]. The negative shift in δ18O of D1 and D2 (Figure 11) signifies the effect of temperature increase during burial, change in fluid composition, or both [81]. Recrystallization of D1 with increasing temperature/change in fluid chemistry can also result in a negative shift in D1 (e.g., [23]). This recrystallization is also observed petrographically, as shown by the increasing crystal size of D1 and the presence of overgrowth zonation in D2 (Figure 5). The co-variant trend between carbon and oxygen isotopes in these dolomites reflect varied water-rock interaction with increasing burial (cf. [82]). Water-rock interaction is also evidenced by the presence of more radiogenic 87Sr/86Sr ratios in D1 and D2 (Figure 13 and Figure 15) in comparison to the postulated range for Cambrian seawater. This can be related to the presence of more siliciclastics, rich in clays and feldspars, in the Cambrian rocks as well as can be sourced from the Precambrian shield [74,83]. The same trend and comparable negative isotopic values are evident in late calcite cement (BKC; Figure 12) and thus reflecting similar diagenetic conditions during later fluid flow events for these carbonates unique to Cambrian paleohydrologic flow system. Similarly, BKC also shows more radiogenic Sr isotope ratios than the Cambrian seawater values (Figure 14).
Ordovician:
Most of the oxygen and carbon isotopic values of the Ordovician replacive dolomites (D1 and D2) show overlapping signatures with a departure by at least 3‰ from their coeval postulated seawater equilibrium values with respect to their age (Figure 11), especially for oxygen isotopes. This can be related to the recrystallization of D1 to D2 at elevated temperatures during the intermediate burial stage (Figure 4). C isotope values are closer to their seawater equilibrium values reflecting the buffering of this isotope with original carbonate values (e.g., [26,29]). However, δ13C values of saddle dolomite show slight negative shifts compared to the postulated equilibrium values. This may reflect an oxidized organic C source during burial. The 87Sr/86Sr ratios of many samples of D1 and D2 show comparable and/or slight radiogenic signature to seawater values (Figure 13; [69]) with the exception of few dolomites that show highly radiogenic rations (Figure 13 and Figure 14). These dolomite samples occur along dissolution seams and thus reflecting a radiogenic fluid source of Sr, perhaps from Cambrian siliciclastic fluid. In contrast, the isotopic composition of early calcite cement shows preservation of the original seawater signature (Figure 12), while late calcite cement shows some negative trend in both oxygen and carbon isotopes relative to the postulated values in Ordovician calcite. This reflects the diagenetic progression and precipitation of this cement from fluids modified at the burial. This is also shown by 87Sr/86Sr ratios of BKC which show seawater signature (Figure 14).
Silurian and Devonian:
The isotopic data of the overlying Silurian and Devonian carbonates show overlaps between δ13C and δ18O values (Figure 11). Dolomite samples from both age groups show similar δ13C values compared to those of carbonates deposited in equilibrium with seawater of respective age except for few D1 samples from the Silurian carbonates that show a slight negative shift, which can be related to a depleted carbon source related to bacterial sulfate reduction at the shallow burial [84]. This is supported by the presence of minute framboidal pyrite crystals embedded within RD1 (this study and Tortola et al. [3]). Also, few BKC samples from the Silurian carbonates show a negative shift from the equilibrium values (Figure 12). This can be related to an oxidized organic carbon source, possibly related to interaction with hydrocarbons (e.g., [2]). However, δ18O values of D1 show evidence of dolomite recrystallization as these values depart from their respective age equilibrium values. This negative shift in oxygen isotopes also reflects increasing temperature and/or changes in the diagenetic fluid composition with increasing burial (cf., [3,26]). 87Sr/86Sr ratios of many samples, both dolomite and calcite, from these age groups cluster close to their coeval seawater composition (Figure 13). However, a few dolomite samples show slight enrichment of radiogenic Sr ratios. This can be related to the presence of modified seawater fluids upon burial.
5.2.2. Major, Minor, and REE Elements
The average values of CaCO3 in all analyzed replacement and cement dolomite types show that all dolomite types are non-stoichiometric, consistently calcium-rich (Table 4, average CaCO3 range from 54.3 to 61.8 mol% for D1 and D2, and from 57.7 to 63.3 mol% for SD, respectively; Figure 16). This suggests that the precursor mineralogy of these dolomites is of high-Mg calcites and aragonite and the stabilization of these minerals to dolomite occur in semi-closed diagenetic systems with less fluid mobility and limited supply of Mg ions (cf., [18,85]). Hence, dolomitizing fluids reflect a lowering Mg/Ca ratio in these fluids which encourages Ca-rich, non-stoichiometric dolomite to form. In general, Mn and Fe contents in the Cambrian and Ordovician dolomites, which are indicators of redox conditions during dolomitization, are much higher than the Silurian and Devonian dolomites (Table 3) reflecting a decrease in oxidizing conditions in the older successions. There is also a covariant trend between Mn and Fe for these dolomites (Figure 17) reflecting the geochemical affinity of these two elements [86]. However, the average of Sr content in all dolomites does not show large variations among the investigated dolomite types (vary between 83 and 253 ppm, Table 3) and are comparable to those of other ancient dolomites but lower than the estimated values for dolomite in equilibrium with seawater (~500–800 ppm, (e.g., [87]). However, many samples from the Ordovician dolomites show high Sr content and covariant trends with Fe and Mn (Figure 17), perhaps reflecting the aragonitic precursor mineralogy of these dolomites. Such a relationship is not apparent in dolomites from other age groups.
Rare earth elements (REEs) have been commonly utilized for the reconstruction of a paleoenvironmental history of ancient seawater [88,89,90], diagenetic alteration, and the temperature of fluids precipitating carbonate minerals [70]. REE can also provide information about the relative water depth and the proximity to hydrothermal sources [91]. Some workers indicate that carbonates might preserve their REE compositions and/or patterns during diagenetic processes [89,92]. However, many studies have revealed that consequent diagenetic alteration modifies REE concentrations and/or patterns [70,93]. Therefore, the redistribution of REE in carbonates is an indicator that can be utilized to ascertain the potential contributing factor to observed REE concentrations in diagenetic minerals, especially in high water/rock ratio diagenetic systems [70]. The rare earth elements generally exist in the stable trivalent (3+) oxidation state, whereas Eu (Eu2+, Eu3+) and Ce (Ce3+, Ce4+) exhibit distinct behavior due to the redox state of the natural system (e.g., [93]). Ce (Ce3+) can be oxidized to Ce (Ce4+) in marine systems under surface conditions, whereas high temperature and/or high reducing conditions cause Eu (III) to be reduced to Eu (II) [65,94]. These characteristics provide the utilization of REEs as tracers of chemical processes during the diagenetic history of carbonates [89,95,96,97].
The ∑REE of Cambrian dolomite types and calcite cement (Table 3) is significantly higher than those in Ordovician, Silurian, and Devonian strata when compared with the average of warm water brachiopods shown by Azmy et al. [70]. ∑REE of Devonian samples record the lowest values among those examined in this study. The higher concentration of ∑REE of Cambrian dolomites signify that the dolomitizing fluids contained higher concentrations of REE, likely related to the interaction of these fluids with basement rocks.
Replacive dolomite D1 and D2 sampled from Cambrian formations show different trends (Figure 18) compared to the pattern of warm water brachiopods shown by Azmy et al. [70], with a dominant-negative La anomaly and positive Ce anomalies (Figure 19). These dolomites may have formed under suboxic to anoxic conditions [70]) from early crustal fluids highly enriched in REE particularly MREE and HREE relative to dolomites from other age groups. Saddle dolomite from the Cambrian rocks show evidence of different fluids that produced D1 and D2 are likely related to hydrothermal fluids that originated from deeper sources and transported via fractures and faults [2]. The flat Ce* anomaly, slightly positive Eu*, flat LREE over HREE, and sight MREE enrichment with low La/Sm in saddle dolomite reflect higher temperature fluids of seawater origin under low oxic conditions modified by siliciclastic contamination.
Both D1 and D2 (Figure 18) sampled from Ordovician formations show different trends compared to the pattern of warm water brachiopods shown by Azmy et al. [70], with a flat to slight Eu anomaly, negative La anomaly, and both cases of positive and negative Ce anomalies (Figure 19). Both, D1 and D2 exhibit higher average ΣREE (11.59 ± 22.44 ppm, and 8.54 ± 7.36 ppm, respectively) compared with the average of warm water brachiopods shown by Azmy et al. [70]. Saddle dolomite cement (SD) patterns show lower average ΣREE (9.55 ± 4.36 ppm) than D1 but slightly higher than D2. It also shows, similarly to D1 and D2, slightly different patterns compared to Warm water Brachiopod’s pattern with both negative La and Ce anomalies. High Eu*, high La/YbN* and Y/Ho can indicate interaction with hydrothermal fluids [90].
Silurian replacive dolomites (D1 and D2) show different trends compared to the pattern of warm water brachiopods shown by Azmy et al. ([70]; Figure 18), with a minor negative La anomaly and both cases of positive and negative Ce anomalies (Figure 19). Brachiopods, D1 and D2 show patterns with both negative La and Ce anomalies as well as a slight negative Eu anomaly (Figure 18). These data suggest a seawater-dominated source of diagenetic fluids evolved during burial and increasing water/rock interaction [3]. The higher ΣREE and a more pronounced enrichment in LREE in SD and BK reflect a different source of REEs and/or involvement of saline fluids.
Both, fine and medium dolomite matrix samples (D1 and D2, respectively) from Devonian formations have shale-normalized patterns sub-parallel to those of modern warm water brachiopods from Azmy et al. [70]. They both show the typical characteristics of seawater patterns such as slight depletion of LREE over HREE and slightly positive La and Gd anomalies (Figure 19) potentially modified from the interaction of meteorically derived fluids and fluids of marine parentage. This can occur at near-surface, slightly reducing conditions. Although there is no evidence of karstification in the samples collected and analyzed in this study, a previous study [98] suggested that dissolution processes were mostly active in the shallow subsurface, usually <200 m depth in south-western Ontario. Thus, the possibility of meteoric water influence cannot be discounted completely.
There is a subtle difference in Cambrian and Ordovician dolomite vs. Silurian and Devonian samples in terms of Sm/Yb vs. Eu/Sm (Figure 20A), La/Yb vs. La/Sm (Figure 20B), Y/Ho vs. Sm/Yb (Figure 20C) and Y/Ho vs. Eu/Sm (Figure 20D) ratios. These differences may reflect changes in fluid composition, temperature, and/or redox conditions [99,100]. For example, Y/Ho vs. Sm/Yb ratios showing two possible fluids (marine and hydrothermal), and their interactions more evident in Cambrian and Ordovician dolomites. In contrast, the effect of seawater on the formation of Silurian and Devonian dolomites is more important. Other ratios document the presence of modified seawater as the primary fluid type in the formation of these dolomites [100].
5.2.3. Fluid Inclusions
Previous studies on fluid inclusions in Cambrian to Devonian dolomite and calcite in both central and marginal parts of the Michigan basin demonstrated fairly a wide range of Th and salinity values (e.g., [2,3,32,33,101,102,103]). These investigations reported high Th and salinity values in the central part of the basin compared to the margin of the basin, which some of them attributed to hydrothermal fluids which originated from the central part of the basin. Haeri-Ardakani et al. [33] further suggest a thermal anomaly related to the mid-continent rift under the Michigan Basin during late Devonian-Mississippian is the major source of heat for hydrothermal fluids.
The presence of single-phase fluid inclusions in D1 suggests very low temperatures, up to 50 °C [71]. However, the salinity-homogenization temperature plots (Figure 21A,B) for both dolomite (D2 and SD) and calcite (BKC) demonstrated a clear and subtle difference between age groups. For instance, higher Th and salinity values are recorded in SD and some D2 in Ordovician and Silurian samples compared to Devonian dolomite. In Cambrian, D2 overlaps with Ordovician samples. In contrast, BKC in Devonian samples show the highest Th and lowest salinity values compared to the rest (Figure 21B). High salinity and homogenization temperatures values are shown by Silurian dolomite and calcite. This reflects the effect of fluids sourced from saline brines related to evaporite dissolution in the Silurian rocks (e.g., [3,32]). The differences in homogenization temperature and salinity values in BKC (Figure 21) between Silurian and Devonian may reflect divergent fluid systems, such as a fluid that is characterized by high temperature and high salinity in the Silurian rocks and much higher temperature and lower salinity fluids in the Devonian rocks. These phenomena can also reflect the effect of Alleghenian Orogeny in Carboniferous time (Figure 1) as a factor that affected the fluid composition and sources.
In all analyzed D2 and SD dolomite and late BKC in the investigated age groups the high Th values are significantly higher than the maximum burial temperatures suggested by other studies (e.g., [2,32,33,101,102]). This may suggest an involvement of hydrothermal fluids during the formation/recrystallization of dolomite and precipitation of late calcite cement. Increasing temperature of formation/recrystallization, as well as water/rock interaction, can explain the negative departures from equilibrium δ18O values of dolomite.
5.3. Dolomite Recrystallization
Dolomite crystal shape, its boundaries, and its characteristics are directly related to the crystallization environment in which they formed [104]. Recrystallization of earlier formed dolomite (e.g., [23,105,106,107]) can involve change in texture, such as coarsening of crystal size or increase in nonplanar boundaries, change in structure (progressive ordering and strain), change in composition, which include isotopes, trace elements, stoichiometry, fluid inclusions, and zonation. It can also include a change in paleomagnetic properties [11].
Recrystallization of D1and D2 dolomites in the studied rocks has been invoked because of petrographic and geochemical data. Alteration of early formed dolomite is a common diagenetic process during progressive burial and/or increasing water/rock interactions (e.g., [8,108,109]). SEM and petrographic evidence for recrystallization of D1 include: (1) increase of crystal size (Figure 22); (2) lack of zonation (e.g., overgrowth) under CL, especially in D2; (3) lack of stoichiometry in D1 and D2 can be related to recrystallization of D1 to D2 by Ca-rich, warmer basinal fluids, perhaps under a semi-isolated diagenetic system (e.g., [3,13,110]). Geochemical and isotopic evidence for recrystallization with increasing burial include: (1) a negative shift of δ18O from postulated values of marine dolomite of respective ages (Figure 11), (2) a slight enrichment of Sr isotopic ratios (Figure 13), (3) high Th values in D2 (Figure 21), and (4) trace elements fractionation in D1 and D2 (Figure 17).
5.4. Evolution and Origin of the Diagenetic Fluids
Fluid flow in sedimentary basins can be linked to the tectonic evolution of the basin which can involve tectonic thrusting, sedimentary loading, uplift, and compression [4]. These fluids can transfer dolomitizing fluids as well as metals and hydrocarbons. Recent studies on diagenetic fluid flow in southern Ontario provided models on the fluid composition and its source(s). Coniglio and Williams-Jones [111], Middleton et al. [55] and Coniglio et al. [112] advocated that lateral and vertical movement of Mg-bearing fluids in Michigan Basin resulting from the transformation of clay minerals, originating from younger, older, or correlative argillaceous sediments from deeper in the Michigan and Appalachian basins towards the basin margin was considered as a mechanism for migration of dolomitizing fluids. Yoo et al. [113] also considered compaction driven flow to explain the mass and heat from the Michigan Basin. Haeri-Ardakani et al. [32,33] suggested that hot brines in the central part of the basin migrated through the basal Cambrian sandstone and ascended through a fracture network precipitating dolomite and late-stage calcite while carrying hydrocarbons.
Hobbs et al. [114] suggested two geochemical systems present on a regional scale; a shallow system (<200 m) below ground surface containing fresh through brackish waters and an intermediate to deep (>200 m) system containing brines associated with hydrocarbon reservoirs. Petts et al. [115] using microthermometric and isotopic data of secondary minerals in Cambrian and Ordovician strata suggested the presence of hydrothermal brines mixed with connate water. Al-Aasm and Crowe [2] in their investigations of dolomitization in the Cambrian and Ordovician carbonates in the Huron Domain identified two somewhat isolated digenetic fluid systems; an earlier Cambrian system and a later Ordovician system, both displaying unique geochemical attributes. Bouchard et al. [116] suggested that the fluids in the Ordovician low permeability sequences in the eastern part of Michigan Basin have originated as Ordovician seawater that was chemically overprinted by evaporated seawater that infiltered during the late Silurian and mixed with pre-existing brines from a deeper part of the hydrostratigraphic section. More recently, Tortola et al. [3] suggested the presence of a diagenetic fluid system that affected Silurian carbonates and was altered by salt dissolution post-Silurian and a Devonian fluid system that affected by the Alleghanian orogeny and resulted in a different fluid source and composition.
Petrographic relationships and isotope data can be used to infer changes in the composition of pore fluids in the Paleozoic successions during progressive diagenesis. Using the mean Th values and the range of δ18O for D2 and SD from the investigated time frames, the δ18O composition of the precipitating fluids was determined. The relationships among mineral δ18O values, pore water δ18O values, and temperature for diagenetic phases from the investigated carbonates are shown in Figure 23A,B. The suggested pathways for pore water evolution reflect changes in temperature, changes in fluid chemistry, or both. For dolomite types/generations (Figure 23A), there is a subtle difference in temperature and hence fluid composition between D2 and SD in Cambrian strata. The dolomitizing fluids for D2 reflect marine parentage, while for SD it is more enriched in δ18O values suggesting the modified brines formed under higher temperatures. In contrast, there is a significant overlap in the δ18O composition of dolomitizing fluids for Ordovician D2, SD, and Devonian D2 and a comparable range of formation/recrystallization temperatures. However, there is a measurable difference between D2 and SD in Silurian samples, as D2 formed under lower temperatures and comparable seawater δ18O values but higher temperatures and more enriched values for SD formation. This can be related to an increase in salinity with burial, which can be linked to the Salina salt (dissolution) in the Upper Silurian, and the incursion of hydrothermal fluids during the formation of SD (e.g., [117]).
The formation of blocky calcite (BKC) later in the diagenetic sequence reflects variations in formation temperatures and fluid composition in the investigated age groups (Figure 23B). All calcites formed at higher temperatures and deviate from the seawater composition of corresponding ages. However, similarities in δ18O fluid composition between BKC and D2 in the Cambrian samples suggest the fluids could have originated from the Precambrian rocks below and migrated to the overlying porous Cambrian strata (cf. [74]). In contrast, the composition and temperatures of fluids that formed the late calcite in other age groups changed, becoming more enriched and thus reflecting evolved basinal brines [2]. The pathways of these fluids are shown by increasing both δ18O values and temperature with time (from older to younger systems). Variations in pore fluid isotopic composition in the Paleozoic age groups suggest compartmentalization of these diagenetic fluids resulting in the formation and/or recrystallization of dolomite and calcite cementation. This phenomenon is also supported by radiogenic Sr isotopic ratios of these diagenetic phases as well as REE distribution of these carbonates (Figure 14 and Figure 23).
Fluid compartmentalization in carbonate strata in the Huron Domain is also illustrated in Figure 24, which shows some of the important geochemical parameters used in this study vs. their stratigraphic position. There is a subtle difference in stable isotopic composition between different age groups, especially in the Cambrian samples. In all dolomite types there is a significant departure in δ18O values from the postulated range of dolomite that was precipitated in equilibrium with seawater of respective ages. This can be related to increasing temperature during burial as well as modification of pore fluid isotopic composition, in SD this negative shift can be related to the effects of hydrothermal fluid interaction with host rocks; perhaps limited in extent and distribution. Salinity and Th measurements in the Silurian also show a distinctive pattern with higher and salinity temperatures of formation comparing to other rock units, which suggest the effect of evaporite dissolution and migration of fluids in these rocks.
The conceptual model for fluid flow mechanism in the Huron Domain shown in Figure 25 illustrates the concept of fluid compartmentalization in different stratigraphic rock units suggested in this study. The current burial depth is shown also in the model based on various studies [80,111,120]. As mentioned earlier this region of the Michigan Basin has experienced multiple stages of tectonic evolution, both passive and active tectonic events which affected fluid composition and migration pathways (e.g., [2,5,32,37]). Migration of warm, basinal brines from the center of Michigan Basin towards the margin [32] transported dolomitizing fluids and other solutes. The source of heat of these fluids could be related to the reactivation of the buried mid-continental rifts during late Devonian to Mississippian time [121]. A limited influx of hydrothermal fluids moved upwards from the Precambrian basement via fractures and faults [2,47] results in minor precipitation of saddle dolomite in fractures and vugs and altered earlier formation of matrix dolomite. This likely occurred during Taconian and Acadian Orogenies. Interaction of connate fluids of marine parentage with warm, basinal brines controlled the formation of dolomite and calcite cement at a shallow to intermediate burial depth. We believe that diagenesis is horizontally (stratabound) uniform across the Huron domain, displaying few signs of significant vertical connectivity beyond formation tops, except in areas with local heterogeneity (faults; [122]).
Downward migration of saline fluids that originated from the dissolution of Silurian evaporites and possible interaction with basinal brines moving up-dip for the center of the basin was responsible for the modification of diagenetic phases [33]. In the Devonian hydrogeochemical system, the interaction of basinal brines with possible infiltration of younger fluids, perhaps of meteoric water origin, resulted in the formation of late dolomite and calcite cement (e.g., [55,111,112]). This probably occurred during the Alleghenian Orogeny (e.g., [3]). Sutcliff et al. [124] in their study of late calcite cement recovered from sub-horizontal fractures near the base of the Silurian sequence dated show U–Pb ages of 318 ± 10 Ma determined by LA-ICP-MS and 313 ± 1 Ma by ID-TIMS. Hence, these authors also suggested that the fluid flow of hydrothermal brines was influenced by the Alleghanian Orogeny which caused the migration of hydrothermal fluids westwards from high-level Alleghanian plutons through the basal Cambrian rocks.
6. Conclusions
Based on petrographic, geochemical, and fluid inclusion data presented, the following conclusions have been drawn with regards to the diagenetic evolution of the Huron Domain of southern Ontario:
- Dolomitization of Cambrian to Devonian carbonates occurred through multiple events, with the formation of the earliest replacive dolomite phase (D1) occurring at shallow burial depths. This was followed by the precipitation of a later replacive dolomite phase (D2) and the formation of dolomite cement (SD) occluding vugs and fractures, which were formed at an intermediate burial depth. Evaporite and late blocky calcite cement followed the formation of these dolomite phases.
- These types of dolomite types display unique geochemical and microthermometric signatures suggesting the flow of diagenetic fluids that were driven by tectonic processes over the history of the Michigan Basin. The diagenetic fluid composition was dominated initially by seawater and later modified upon burial and interaction with basinal brines. For Cambrian and Ordovician carbonates two possibly isolated diagenetic fluid systems affected them. These are: (i) an earlier fluid system that is characterized by a pronounced negative shift in oxygen and carbon isotopic composition, more radiogenic ratios, warm and saline signature with higher average ∑REE, negative La anomaly and positive Ce anomaly; and (ii) a later Ordovician system, characterized by less negative shifts in oxygen and carbon isotopes, comparable homogenization temperature, hypersaline, a less radiogenic fluid system, less negative La anomaly and positive and negative Ce anomaly, but also higher average ∑REE compared to warm water marine brachiopods.
- There is a significant overlap of δ13C and δ18O values and 87Sr/86Sr ratios in Silurian and Devonian carbonates reflecting both a modified marine source of fluids as well recrystallization of earlier formed dolomite. High homogenization temperatures and salinity in saddle dolomite (SD) in the Silurian sequences and its REE shale-normalized patterns suggest that in both age groups the diagenetic fluids were originally of coeval seawater composition and were subsequently modified via water-rock interaction. The different evolution of the diagenetic fluids is more prominent in REESN patterns from Silurian samples and it is possibly related to brines, which were modified by the dissolution of Silurian evaporites from the Salina series.
Author Contributions
Conceptualization, I.S.A.-A.; writing—original draft preparation, I.S.A.-A.; supervision, I.S.A.-A.; writing, review and editing, R.C.; writing, review and editing, M.T. All authors have read and agreed to the published version of the manuscript.
Funding
This research is funded by Nuclear Waste Management Organization (NWMO) contract #816150 to ISA.
Institutional Review Board Statement
Not applicable.
Informed Consent Statement
Not applicable.
Data Availability Statement
The data will be available with the authors.
Acknowledgments
I.S.A.-A. and M.T. acknowledge the help from M. Price during isotope analysis. The critical review by M. Hobbs is greatly appreciated. Thanks to two anonymous reviewers for their constructive comments.
Conflicts of Interest
The authors declare no conflict of interest.
References
- Al-Aasm, I.S. Dolomitization: Cambrian and Ordovician Formations in the Huron Domain; Report NWMO-TR-2016-05; Nuclear Waste Management Organization: Toronto, ON, Canada, 2016. [Google Scholar]
- Al-Aasm, I.S.; Crowe, R. Fluid compartmentalization and dolomitization in the Cambrian and Ordovician successions of the Huron Domain, Michigan Basin. Mar. Pet. Geol. 2018, 92, 160–178. [Google Scholar] [CrossRef]
- Tortola, M.; Al-Aasm, I.S.; Crowe, R. Diagenetic Pore Fluid Evolution and Dolomitization of the Silurian and Devonian Carbonates, Huron Domain of Southwestern Ontario: Petrographic, Geochemical and Fluid Inclusion Evidence. Minerals 2020, 10, 140. [Google Scholar] [CrossRef] [Green Version]
- Muchez, P.; Slobodnik, M.; Sintubin, M.; Viaene, W.; Keppens, E. Origin and migration of palaeofluids in the Lower Carboniferous of southern and eastern Belgum. Zent. Geol. Palaeontol. 1997, 11 Pt 1, 1107–1112. [Google Scholar]
- Bethke, C.M.; Marshak, S. Brine migrations across North America—The plate tectonics of groundwater. Annu. Rev. Earth Planet. Sci. 1990, 18, 287–315. [Google Scholar] [CrossRef]
- Kharaka, Y.K.; Hanor, J.S. Deep fluids in the continents: I. sedimentary basins. In Treatise on Geochemistry; Drever, J.I., Holland, H.D., Turekian, K.K., Eds.; Elsevier: Amsterdam, The Netherlands, 2004; Volume 5, pp. 499–540. [Google Scholar] [CrossRef]
- Morad, S.; Al-Ramadan, K.; Ketzer, J.M.; De Ros, L.F. The impact of diagenesis on the heterogeneity of sandstone reservoirs: A review of the role of depositional facies and sequence stratigraphy. AAPG Bull. 2010, 94, 1267–1309. [Google Scholar] [CrossRef]
- Durocher, S.; Al-Aasm, I.S. Dolomitization and neomorphism of Mississippian (Visean) upper Debolt Formation, Blueberry Field, NE British Columbia, Canada: Geologic, petrologic and chemical evidence. Am. Assoc. Pet. Geol. Bull. 1997, 81, 954–977. [Google Scholar]
- Lonnee, J.; Al-Aasm, I.S. Dolomitization and fluid evolution in the Middle Devonian Sulphur. Point Formation, Rainbow South Field, Alberta: Petrographic and geochemical evidence. Bull. Can. Soc. Pet. Geol. 2000, 90, 262–283. [Google Scholar] [CrossRef]
- Machel, H.G.; Lonnee, J. Hydrothermal dolomite—A product of poor definition and imagination. Sediment. Geol. 2002, 152, 163–171. [Google Scholar] [CrossRef]
- Cioppa, M.T.; Al-Aasm, I.S.; Symons, D.T.A.; Gillen, K.P. Dating penecontemporaneous dolomitization in carbonate reservoirs: Paleomagnetic, petrographic, and geochemical constraints. AAPG Bull. 2003, 87, 71–88. [Google Scholar]
- Wendte, J.; Chi, G.; Al-Aasm, I.; Sargent, D. Fault/fracture controlled hydrothermal dolomitization and associated diagenesis of the Upper Devonian Jean Marie Member (Redknife Formation) in the July Lake area of northeastern British Columbia. Bull. Can. Pet. Geol. 2009, 57, 275–322. [Google Scholar] [CrossRef]
- Al-Aasm, I.S.; Mrad, C.; Packard, J. Fluid compartmentalization of Devonian and Mississippian dolostones, Western Canada Sedimentary Basin: Petrologic and geochemical evidence from fracture mineralization. Can. J. Earth Sci. 2019, 56, 265–305. [Google Scholar] [CrossRef]
- Dong, S.; Chen, D.; Zhou, X.; Qian, Y.; Tian, M.; Qing, H. Tectonically driven dolomitization of Cambrian to Lower Ordovician carbonates of the Quruqtagh area, north-eastern flank of Tarim Basin, north-west China. Sedimentology 2016, 64, 1079–1106. [Google Scholar] [CrossRef]
- Land, L.S. The origin of massive dolomite. J. Geol. Educ. 1985, 33, 112–125. [Google Scholar] [CrossRef]
- Morrow, D.W. Dolomite—Part 2: Dolomitization Models and Ancient Dolostones. In Diagenesis; Mcllreath, I.A., Morrow, D.W., Eds.; Geoscience Canada Series 4; Geological Association of Canada: St John’s, NL, Canada, 1990; pp. 125–139. [Google Scholar]
- Packard, J.J.; Pellegrin, G.J.; Al-Aasm, I.S.; Samson, I.; Gagnon, J. Diagenesis and dolomitization associated with hydrothermal karst in Famennian upper Wabamun ramp sediments, northwestern Alberta. The development of porosity in carbonate reservoirs. In Canadian Society of Petroleum Geologists Short Course; The Development of Porosity in Carbonate Reservoirs: Calgary, AB, Canada, 1990; Volume 9-1. [Google Scholar]
- Sperber, C.M.; Wilkinson, B.H.; Peacor, D.R. Rock composition, dolomite stoichiometry, and rock/water reactions in dolomitic carbonate rocks. J. Geol. 1984, 92, 609–622. [Google Scholar] [CrossRef]
- Gregg, J.M.; Shelton, K.L. Dolomitization and dolomite Neomorphism in the back-reef facies of the Bonneterre and Davis formations (Cambrian), southwestern Missouri. J. Sediment. Res. 1990, 60, 549–562. [Google Scholar]
- Gao, G.; Land, L.S. Early Ordovician cool creel dolomite, middle Arbuckle group, silick Hills, SW Oklahoma, USA: Origin and modification. J. Sediment. Res. 1991, 61, 161–173. [Google Scholar]
- Mazzullo, S.J. Geochemical and neomorphic alteration of dolomite: A review. Carbonate Evaporites 1992, 7, 21–37. [Google Scholar] [CrossRef]
- Kupecz, J.A.; Land, L.S. Progressive recrystallization and stabilization of early-stage dolomite: Lower Ordovician Ellenburger Group, west Texas. In Dolomites. A Volume in Honor of Dolomieu; Purser, B., Tucker, M., Zenger, D., Eds.; International Association of Sedimentologists: Gent, Belgium, 1994; pp. 155–166. [Google Scholar]
- Al-Aasm, I.S. Chemical and isotopic constraints for recrystallization of sedimentary dolomites from the Western Canada Sedimentary basin. Aquat. Geochem. 2000, 6, 227–248. [Google Scholar] [CrossRef]
- Oliver, J. Fluids expelled tectonically from orogenic belts: Their role in hydrocarbon migration and other geologic phenomena. Geology 1986, 14, 99–102. [Google Scholar] [CrossRef]
- Nesbitt, B.E.; Muehlenbachs, K. Paleohydrogeology of the Canadian Rockies and origins of brines, Pb-Zn deposits and dolomitization in the Western Canada Sedimentary Basin. Geology 1994, 22, 243–246. [Google Scholar] [CrossRef]
- Al-Aasm, I.S. Origin and characterization of hydrothermal dolomite in the Western Canada Sedimentary Basin. J. Geochem. Explor. 2003, 78, 9–15. [Google Scholar] [CrossRef]
- Kareem, H.K.; Al-Aasm, I.S.; Mansurbeg, H. Stucturally-controlled hydrothermal fluid flow in an extensional tectonic regime: A case study of Cretaceous Qamchuqa Formation, Zagros Basin, Kurdistan Iraq. Sediment. Geol. 2019, 386, 52–78. [Google Scholar] [CrossRef]
- Tucker, M.E.; Wright, V.P. Carbonate Sedimentology; Blackwell Scientific Publications: Oxford, UK, 1990; 482p. [Google Scholar]
- Warren, J. Dolomite: Occurrence, evolution, and economically important associations. Earth Sci. Rev. 2000, 52, 1–81. [Google Scholar] [CrossRef]
- Machel, H.G. Concepts and models of dolomitization: A critical reappraisal. In The Geometry and Petrogenesis of Dolomite Hydrocarbon Reservoirs; Braithwaite, C.J.R., Rizzi, G., Drake, G., Eds.; Geological Society Special Publication: London, UK, 2004; Volume 235, pp. 7–63. [Google Scholar]
- Davies, G.R.; Smith, L.B., Jr. Structurally controlled hydrothermal dolomite reservoir facies: An overview. Am. Assoc. Pet. Geol. 2006, 90, 1641–1690. [Google Scholar] [CrossRef]
- Haeri-Ardakani, O.; Al-Aasm, I.S.; Coniglio, M. Fracture mineralization and fluid flow evolution: An example from Ordovician-Devonian carbonates, southwestern Ontario, Canada. Geofluids 2013, 13, 1–20. [Google Scholar] [CrossRef]
- Haeri-Ardakani, O.; Al-Aasm, I.S.; Coniglio, M. Petrologic and geochemical attributes of fracture-related dolomitization in Ordovician carbonates and their spatial distribution in southwestern Ontario, Canada. Mar. Pet. Geol. 2013, 43, 409–422. [Google Scholar] [CrossRef]
- Carter, T.R.; Fortner, L.D.; Russell, H.J.A.; Skuce, M.E.; Longstaffe, F.J.; Sun, S. A Hydrostratigrapic Framework for the Paleozoic Bedrock of Southern Ontario. Geosci. Can. 2021, 48, 23–58. [Google Scholar] [CrossRef]
- Ontario Geological Survey. Bedrock Geology of Ontario, Southern Sheet, Map 2544, Scale 1:1,000,000; Ontario Geological Survey: Sudbury, ON, Canada, 1991.
- Ontario Power Generation’s (OPG). Deep Geologic Repository for Low and Intermediate Level Waste: Preliminary Safety Report; Program Document n 00216-SR-01320-00001; OPG: Thunder Bay, ON, Canada, 2011. [Google Scholar]
- Sanford, B.V.; Thompson, F.J.; McFall, G.H. Plate tectonics—A possible controlling mechanism in the development of hydrocarbon traps in southwestern Ontario. Bull. Can. Pet. Geol. 1985, 33, 52–71. [Google Scholar]
- Cruden, A. Outcrop Fracture Mapping; NMWO DGR-TR-2011-43; Nuclear Waste Management Organization: Toronto, ON, Canada, 2011. [Google Scholar]
- Hamilton, D.G.; Coniglio, M. Reservoir Development in the Middle Devonian of southwestern Ontario. In Proceedings of the Ontario Petroleum Institute Thirty-First Annual Conference, Niagara Falls, ON, Canada, 28–30 October 1992; Technical Paper No. 9. Volume 32. 20p. [Google Scholar]
- Armstrong, D.K.; Carter, T.R. The Subsurface Paleozoic Stratigraphy of Southern Ontario; Ontario Geological Survey: Sudbury, ON, Canada, 2010; Special Volume 7, 301p.
- Klein, G.V.; Hsui, A.T. Origin of Cratonic Basins. Geology 1987, 15, 1094–1098. [Google Scholar] [CrossRef]
- Sleep, N.H. Thermal effects of the formation of Atlantic continental margins by continental break up. Geophys. J. R. Astron. Soc. 1971, 24, 325–350. [Google Scholar] [CrossRef]
- Sleep, N.H.; Snell, N.S. Thermal contraction and flexure of mid-continent and Atlantic marginal basins. Geophys. J. R. Astron. Soc. 1976, 45, 125–154. [Google Scholar] [CrossRef] [Green Version]
- Nunn, J.A.; Sleep, N.H.; Moore, W.E. Thermal subsidence and generation of hydrocarbon in Michigan Basin. AAPG Bull. 1984, 68, 296–315. [Google Scholar]
- Howell, P.D.; van der Pluijm, B.A. Early history of the Michigan basin: Subsidence and Appalachian tectonics. Geology 1990, 18, 1195–1198. [Google Scholar] [CrossRef]
- Howell, P.D.; van der Pluijm, B.A. Structural sequences and styles of subsidence in the Michigan basin. Geol. Soc. Am. Bull. 1999, 111, 974–991. [Google Scholar] [CrossRef]
- AECOM; Itasca Consulting Canada. Regional Geology—Southern Ontario; Report NWMO DGR-TR-2011-15 R000; Nuclear Waste Management Organization: Toronto, ON, Canada, 2011. [Google Scholar]
- Coakley, B.J.; Nadon, C.; Wang, H.F. Spatial variations in tectonic subsidence during Tippecanoe I in the Michigan Basin. Basin Res. 1994, 6, 131–140. [Google Scholar] [CrossRef]
- Coakley, B.; Gurnis, M. Far-field tilting of Laurentia during the Ordovician and constraints on the evolution of a slab under an ancient continent. J. Geophys. Res. Solid Earth 1995, 100, 6313–6327. [Google Scholar] [CrossRef] [Green Version]
- Johnson, M.D.; Armstrong, D.K.; Sanford, V.V.; Telford, P.G.; Rutka, M.A. Paleozoic and Mesozoic Geology of Ontario. In Geology of Ontario; Ontario Geologic Survey: Peterborough, ON, Canada, 1992; Special Volume 4, Part 2, pp. 907–1008. [Google Scholar]
- Armstrong, D.K.; Carter, T.R. An updated guide to the subsurface Paleozoic stratigraphy of Southern Ontario. Ont. Geol. Surv. 2006, 6191, 214. [Google Scholar]
- Beaumont, C.; Quinlan, G.; Hamilton, J. Orogeny and stratigraphy: Numerical models of the Paleozoic in the eastern interior of North America. Tectonics 1988, 7, 389–416. [Google Scholar] [CrossRef]
- Nuclear Waste Management Organization. Deep Geologic Repository, Geoscientific Site Characterization. 2011. Available online: http//www.nmwo.ca/dggeoscientifcsitecharaterization (accessed on 29 August 2021).
- Nuclear Waste Management Organization. Geosynthesis: Nuclear Waste Management Organization. Report NWMO DGR-TR-2011-11. Toronto, Canada. 2011. Available online: http//www.nmwo.ca/uploads.DGR%20PDF/Geo/Geosynthesis/pdf (accessed on 29 August 2021).
- Middleton, K.; Coniglio, M.; Sherlock, R.; Frape, S.K. Dolomitization of Middle Ordovician carbonate reservoirs, southwestern Ontario. Bull. Can. Pet. Geol. 1993, 41, 150–163. [Google Scholar]
- Intera Engineering. Descriptive Geosphere Site Model; Report NWMO DGR-TR-2011-24 R000; Nuclear Waste Management Organization: Toronto, ON, Canada, 2011. [Google Scholar]
- Van der Voo, R. Paleozoic paleogeography of North America, Gondwana, and intervening displaced terranes: Comparison of paleomagnetism with paleoclimatology and biogeographical patterns. Geol. Soc. Am. Bull. 1988, 100, 311–324. [Google Scholar] [CrossRef]
- Sonnenfeld, P.; Al-Aasm, I.S. The Salina evaporites in the Michigan Basin. In Early Sedimentary Evolution of the Michigan Basin; Special Paper, 256; Catacosinos, P.A., Daniels, P.A., Jr., Eds.; Geological Society of America: Boulder, CO, USA, 1991; pp. 139–153. [Google Scholar]
- Birchard, M.C.; Rutka, M.A.; Brunton, F.R. Lithofacies and Geochemistry of the Lucas Formation in the Subsurface of Southwestern Ontario: A High Purity Limestone and Potential High Purity Dolostone Resource; Open File Report 6137; Ontario Geological Survey: Sudbury, ON, Canada, 2004; 57p.
- Al-Aasm, I.S.; Taylor, B.; South, B. Stable isotope analysis of multiple carbonate samples using selective acid extraction. Chem. Geol. 1990, 80, 119–125. [Google Scholar] [CrossRef]
- Chi, G.; Ni, P. Equations for calculation of NaCl/(NaCl+CaCl2) ratios and salinities from hydrohalite-melting and ice-melting temperatures in the H2O-NaCl-CaCl2 system. Acta Petrol. Sin. 2007, 23, 33–37. [Google Scholar]
- Steele-MacInnis, M.; Bondnar, R.J.; Naden, J. Numerical model to determine the composition of H2O-NaCl-CaCl2 fluid inclusions based on microthermometirc and microanalytical data. Geochem. Cosmochim. Acta 2011, 75, 21–41. [Google Scholar] [CrossRef] [Green Version]
- Lawler, J.P.; Crawford, M.L. Stretching of fluid inclusions resulting from a low temperature microthermometric technique. Econ. Geol. 1983, 78, 527–529. [Google Scholar] [CrossRef]
- Jenner, G.A.; Longerich, H.P.; Jackson, S.E.; Fryer, B.J. ICP-MS—A powerful tool for high-precision trace-element analysis in Earth sciences: Evidence from analysis of selected USGS refence samples. Chem. Geol. 1990, 83, 133–148. [Google Scholar] [CrossRef]
- Bau, M.; Dulski, P. Distribution of yttrium and rare-earth elements in the Penge and Kuruman iron-formations, Transvaal Supergroup, South Africa. Precambrian Res. 1996, 79, 37–55. [Google Scholar] [CrossRef]
- Kucera, J.; Cempirek, J.; Dolnicek, Z.; Muchez, P.; Prochaska, W. Rare earth elements and yttrium geochemistry of dolomite from post-Variscan vein-type mineralization of the Nizky Jesenik and Upper Silesian Basins, Czech Republic. J. Geochem. Explor. 2009, 103, 69–79. [Google Scholar] [CrossRef]
- Felitsyn, S.; Morad, S. REE patterns in latest Neoproterozoic–early Cambrian phosphate concretions and associated organic matter. Geochem. Geol. 2002, 187, 257–265. [Google Scholar] [CrossRef]
- Sibley, D.F.; Gregg, J.M. Classification of dolomite rock textures. J. Sediment. Petrol. 1987, 57, 967–975. [Google Scholar]
- Veizer, J.; Ala, D.; Azmy, K.; Bruckschen, P.; Buhl, D.; Bruhn, F.; Carden, G.A.F.; Diener, A.; Ebneth, S.; Godderis, Y.; et al. 87Sr ⁄ 86Sr and δ13C and δ18O evolution of Phanerozoic seawater. Chem. Geol. 1999, 161, 59–88. [Google Scholar] [CrossRef] [Green Version]
- Azmy, K.; Brand, U.; Sylvester, P.; Gleeson, S.A.; Logan, A.; Bitner, M.A. Biogenic and abiogenic low-Mg calcite (bLMC and aLMC): Evaluation of seawater-REE composition, water masses and carbonate diagenesis. Chem. Geol. 2011, 280, 180–190. [Google Scholar] [CrossRef] [Green Version]
- Goldstein, R.H.; Reynolds, T.J. Systematics of Fluid Inclusions in Diagenetic Minerals. Society of Economic Paleontologists and Mineralogists; Society for Sedimentary Geology: Tulsa, OK, USA, 1994; 199p. [Google Scholar]
- Morad, S.; Al-Aasm, I.S.; Nader, F.H.; Ceriani, A.; Gasparrani, M. Impact of diagenesis on the spatial and temporal of reservoir quality in C and D Members of the Arab Formation (Jurassic), offshore Abu Dhabi oilfield. GeoArabia 2012, 17, 17–56. [Google Scholar]
- Harper, D.A.; Longstaffe, F.J.; Wadleigh, M.A.; McNutt, R.H. Secondary K-feldspar at the Precambrian-Paleozoic unconformity, southwestern Ontario. Can. J. Earth Sci. 1995, 32, 1432–1450. [Google Scholar] [CrossRef]
- Ziegler, K.; Longstaffe, F.J. Clay mineral anthogenesis along a mid-continental scale fluid conduit in Palaeozoic sedimentary rocks from southern Ontario, Canada. Clay Miner. 2001, 35, 239–260. [Google Scholar] [CrossRef]
- Paganoni, M.; Al Harthi, A.; Morad, D.; Morad, S.; Ceriani, A.; Mansurbeg, H. Impact of stylolitization on diagenesis of a Lower Cretaceous carbonate reservoir from a giant oilfield, Abu Dhabi, United Arab Emirates. Sediment. Geol. 2016, 335, 70–92. [Google Scholar] [CrossRef]
- Sanford, B.V. Devonian of Ontario and Michigan. Int. Symp. Devonian Syst. 1968, 1, 973–999. [Google Scholar]
- Armstrong, D.K.; Goodman, W.R. Stratigraphy and Depositional Environments of Niagaran Carbonates, Bruce Peninsula, Ontario. In Proceedings of the Spring Eastern Section Meeting, University Park, PA, USA, 7–8 April 1990; Field Trip No. 4 Guidebook; American Association of Petroleum Geologists: London, ON, Canada; Ontario Petroleum Institute: Tulsa, OK, USA, 1990. [Google Scholar]
- James, N.P.; Jones, B. Origin of Carbonate Sedimentary Rocks; John Wiley & Sons: West Sussex, UK, 2016; p. 446. [Google Scholar]
- Cercone, K.R. Evaporative sea-level drawdown in the Silurian Michigan Basin. Geology 1988, 16, 109–130. [Google Scholar] [CrossRef]
- Zheng, Q. Carbonate Diagenesis and Porosity Evolution in the Guelph Formation, Southwestern Ontario. Ph.D. Thesis, University of Waterloo, Waterloo, ON, Canada, 1999. [Google Scholar]
- Swart, P.K. The geochemistry of carbonate diagenesis: The past, present and future. Sedimentology 2015, 62, 1233–1304. [Google Scholar] [CrossRef]
- Frank, T.D.; Lohmann, K.C. Chronostratigraphic significance of cathodoluminescence zoning in syntaxial cement: Mississippian Lake Valley Formation, New Mexico. Sediment. Geol. 1996, 105, 29–50. [Google Scholar] [CrossRef] [Green Version]
- McNutt, R.H.; Frape, S.K.; Dollar, P. A strontium, oxygen and hydrogen isotopic composition of brines, Michigan and Appalachian Basins, Ontario and Michigan. Appl. Geochem. 1987, 2, 495–505. [Google Scholar] [CrossRef]
- Baldermann, A.; Deditius, A.; Dietzel, M.; Fichtner, V.; Fischer, C.; Hippler, D.; Leis, A.; Baldermann, C.; Mavromatis, V.; Stickler, C.P.; et al. The role of bacterial sulfate reduction during dolomite precipitation: Implications from Upper Jurassic platform carbonates. Chem. Geol. 2015, 412, 1–14. [Google Scholar] [CrossRef]
- Azomani, E.; Azmy, K.; Blemey, N.; Brand, U.; Al-Aasm, I.S. Dolomitization of the Catoche Formation in Daniel’s Harbour, Northern Peninsula, western Newfoundland. Mar. Pet. Geol. 2013, 40, 99–114. [Google Scholar] [CrossRef] [Green Version]
- Al-Aasm, I.; Veizer, J. Diagenetic stabilization of aragonite and low-Mg calcite-1: Trace elements in rudists. J. Sed. Petrol. 1986, 56, 138–152. [Google Scholar] [CrossRef]
- Land, L.S. The isotopic and trace element geochemistry of dolomite: The state of the art. In Concepts and Models of Dolomitization; Zenger, D.H., Dunham, J.B., Ethington, R.L., Eds.; SEPM Special Publication: Tulsa, OK, USA, 1980; Volume 28, pp. 87–110. [Google Scholar]
- Nothdurft, L.; Webb, G.; Kamber, B. Rare earth element geochemistry of Late Devonian reefal carbonates, Canning Basin, Western Australia: Confirmation of a seawater REE proxy in ancient limestones. Geochim. Cosmochim. Acta 2004, 68, 263–283. [Google Scholar] [CrossRef]
- Webb, G.E.; Nothdurft, L.; Kamber, B.; Kloprogge, T.; Zhao, J.-X. Rare earth element geochemistry of scleractinian coral skeleton during meteoric diagenesis: A before and-after sequence through neomorphism of aragonite to calcite. Sedimentology 2009, 56, 1433–1463. [Google Scholar] [CrossRef]
- Özyurt, M.; Kirmachi, M.Z.; Al-Aasm, I.; Hollis, C.; Tasli, K.; Kandemir, R. REE Characteristics of Lower Cretaceous Limestone Succession in Gümüshane, NE Turkey: Implications for Ocean Paleoredox Conditions and Diagenetic Alteration. Minerals 2020, 10, 683. [Google Scholar] [CrossRef]
- Sholkovitz, E.; Shen, G.T. The incorporation of rare earth elements in modern coral. Geochim. Cosmochim. Acta 1995, 59, 2749–2756. [Google Scholar] [CrossRef]
- Allwood, A.C.; Kamber, B.S.; Walter, M.R.; Burch, I.W.; Kanik, I. Trace elements record depositional history of an Early Archean stromatolitic carbonate platform. Chem. Geol. 2010, 270, 148–163. [Google Scholar] [CrossRef]
- Shields, G.; Stille, P. Diagenetic constraints on the use of cerium anomalies as paleoseawater redox proxies: An isotopic and REE study of Cambrian phosphorites. Chem. Geol. 2001, 175, 29–48. [Google Scholar] [CrossRef]
- Sverjensky, D.A. Europium equilibria in aqueous solution. Earth Planet. Sci. Lett. 1984, 67, 70–78. [Google Scholar] [CrossRef]
- Zaky, A.H.; Brand, U.; Azmy, K. A new sample processing protocol for procuring seawater REE signatures in biogenic and abiogenic carbonates. Chem. Geol. 2015, 416, 36–50. [Google Scholar] [CrossRef]
- Caetano-Filho, S.; Paula-Santos, G.M.; Dias-Brito, D. Carbonate REE + Y signatures from the restricted early marine phase of South Atlantic Ocean (late Aptian—Albian): The influence of early anoxic diagenesis on shale-normalized REE + Y patterns of ancient carbonate rocks. Palaeogeogr. Palaeoclimatol. Palaeoecol. 2008, 500, 69–83. [Google Scholar] [CrossRef] [Green Version]
- Hood, A.S.; Planavsky, N.J.; Wallace, M.W.; Wang, X. The effects of diagenesis on geochemical paleoredox proxies in sedimentary carbonates. Geochim. Cosmochim. Acta 2018, 232, 265. [Google Scholar] [CrossRef]
- Worthington, S.R.H. Karst Assessment; Report NWMO DGR-TR-2011-22; Nuclear Waste Management Organization: Toronto, ON, Canada, 2011. [Google Scholar]
- Banner, J.L.; Hanson, G.N. Calculation of simultaneous isotopic and trace element variations during water-rock interaction with applications to carbonate diagenesis. Geochim. Cosmochim. Acta 1990, 54, 3123–3137. [Google Scholar] [CrossRef]
- Özyurt, M.; Kirmachi, M.Z.; Al-Aasm, I.S. Geochemical characteristics of Late Jurassic-Early Cretaceous Berdiga carbonates in Hazine Mağara, Gümüşhane (NE Turkey): Implications for dolomitization and recrystallization. Can. J. Earth Sci. 2019, 56, 306–320. [Google Scholar]
- Luczaj, J.A. Evidence against the Dorag (mixing-zone) model for dolomitization along the Wisconsin arch-A case for hydrothermal diagenesis. Am. Assoc. Pet. Geol. Bull. 2006, 90, 1719–1738. [Google Scholar] [CrossRef] [Green Version]
- Barnes, D.A.; Parris, T.M.; Grammer, G.M. Hydrothermal Dolomitization of Fluid Reservoirs in the Michigan Basin, USA. Search and Discovery Article #50087. In Proceedings of the AAPG Annual Convention, San Antonio, TX, USA, 20–23 April 2008. [Google Scholar]
- Simo, J.A.; Johnson, C.M.; Vandrey, M.R.; Brown, P.E.; Castro Giovanni, E.; Drzewiecki, P.E.; Valley, J.W.; Boyer, J. Burial dolomitization of the Middle Ordovician Glenwood Formation by evaporitic brines, Michigan Basin. In Dolomites—A Volume in Honour of Dolomieu; Purser, B., Tucker, M., Zenger, D., Eds.; The International Association of Sedimentologists, Blacwell Scientific Publications: Hoboken, NJ, USA, 1994; pp. 169–186. [Google Scholar]
- Braithwaite, C.J.R.; Rizzi, G.; Darke, G. The geometry and petrogenesis of dolomite hydrocarbon reservoirs: Introduction. Geol. Soc. Lond. Spec. Publ. 2004, 235, 1–6. [Google Scholar] [CrossRef]
- Machel, H.G. Recrystallization versus neomorphism, and the concept of “significant recrystallization” in dolomite research. Sediment. Geol. 1997, 113, 161–168. [Google Scholar] [CrossRef]
- Kaczmarek, S.E.; Sibley, D.F. Direct physical evidence of dolomite recrystallization. Sedimentology 2014, 61, 1862–1882. [Google Scholar] [CrossRef]
- Adam, J.; Al-Aasm, I.S. Petrologic and geochemical attributes of calcite cementation, dolomitization and dolomite recrystallization: An example from the Mississippian Pekisko Formation, west-central Alberta. Bull. Can. Pet. Geol. 2017, 65, 235–261. [Google Scholar] [CrossRef]
- Hardie, L.A. Perspectives—dolomitization: A critical view of some current views. J. Sediment. Petrol. 1987, 57, 166–183. [Google Scholar] [CrossRef]
- Al-Aasm, I.S.; Clarke, J.D. The effect of hydrothermal fluid flow on early diagenetic dolomitization: An example from the Devonian Slave Point Formation, northwest Alberta, Canada. In Deformation, Fluid Flow, and Reservoir Appraisal in Foreland Fold and Thrust Belts: AAPG Hedberg Series; Swennen, R., Roure, F., Granath, J.W., Eds.; American Association of Petroleum Geologists: Tulsa, OK, USA, 2004; pp. 297–316. [Google Scholar]
- Malone, M.J.; Baker, P.A.; Burns, S.J. Recrystallization of dolomite: An experimental study from 50–200 °C. Geochim. Cosmochim. Acta 1996, 60, 2189–2207. [Google Scholar] [CrossRef]
- Coniglio, M.; William-Jones, A.E. Diagenesis of Ordovician carbonates from the northeast Michigan Basin, Manitoulin Island area, Ontario: Evidence from petrography, stable isotopes and fluid inclusions. Sedimentology 1992, 39, 813–836. [Google Scholar] [CrossRef]
- Coniglio, M.; Sherlock, R.; Williams-Jones, A.E.; Middleton, K.; Frape, S.K. Burial and hydrothermal diagenesis of Ordovician carbonates from the Michigan Basin, Ontario, Canada. Int. Assoc. Sedimentol. 1994, 21, 231–254. [Google Scholar]
- Yoo, C.M.; Gregg, J.M.; Shelton, K.L. Dolomitization and dolomite neomorphism: Trenton and Black River limestone (Middle Ordovician) Northern Indiana, U.S.A. J. Sediment. Res. 2000, 70, 265–274. [Google Scholar] [CrossRef]
- Hobbs, M.Y.; Frape, S.K.; Shouakar-Stash, O.; Kennell, L.R. Regional Hydrochemistry-Southern Ontario; Report NMWO-DGR-TR-2011-12; Nuclear Waste Management Organization: Toronto, ON, Canada, 2011. [Google Scholar]
- Petts, D.; Saso, J.; Diamond, L.; Aschwanden, L.; Al, T.; Jensen, M. The source and evolution of paleofluids responsible for secondary minerals in low-permeability Ordovician limestones of the Michigan Basin. Appl. Geochem. 2017, 86, 121–137. [Google Scholar] [CrossRef]
- Bouchard, L.; Veizer, J.; Kennell-Morrison, L.; Jensen, M.; Raven, K.G.; Clark, I.D. Origin and 87Rb–87Sr age of porewaters in low permeability Ordovician sediments on the eastern flank of the Michigan Basin, Tiverton, Ontario, Canada. Can. J. Earth Sci. 2019, 56, 201–208. [Google Scholar] [CrossRef]
- Nagia, N.G.; Hu, M.; Gao, D.; Hu, Z.; Sun, C.-Y. Application of stable strontium isotope geochemistry and fluid inclusion microthermometry to studies of dolomitization of the deeply buried Cambrian carbonate successions in west-central Tarim Basin, NW China. J. Earth Sci. 2019, 30, 176–193. [Google Scholar] [CrossRef]
- Land, L.S. The application of stable isotopes to studies of the origin of dolomite and to problems of diagenesis of clastic sediments. In Stable Isotopes in Sedimentary Geology; Arthur, M.A., Anderson, T.F., Kaplan, I.R., Veizer, J., Land, L.S., Eds.; SEPM Society for Sedimentary Geology: Tulsa, OK, USA, 1983. [Google Scholar]
- Friedman, I.; O’Neil, J.R. Compilation of stable isotope fractionation factors of geochemical interest. In Data of Geochemistry, 6th ed.; Chapter, K.K., Ed.; U.S. Government Printing Office: Washington, DC, USA, 1977. [Google Scholar]
- Wang, H.F.; Crowley, K.D.; Nadon, G.C. Thermal history of the Michigan Basin from Apatite fission-track analysis and vitrinite reflectance. Am. Assoc. Petrol. Geol. Mem. 1994, 61, 167–177. [Google Scholar]
- Ma, L.; Castro, M.C.; Hall, C.M. Atmospheric noble gas signatures in deep Michigan Basin brines as indicators of a past thermal event. Earth Planet Sci. Lett. 2009, 277, 137–147. [Google Scholar] [CrossRef]
- Slater, B.; Smith, L. Outcrop Analogue for Trenton-Black River Hydrothermal Reservoirs, Mohawk Valley, New York. AAPG Bull. 2012, 96, 1369. [Google Scholar] [CrossRef]
- Beauheim, R.L.; Roberts, R.M.; Avis, J.D. Hydraulic testing of low-permeability Silurian and Ordovician strata, Michigan Basin, southwestern Ontario. J. Hydrol. 2014, 509, 163–178. [Google Scholar] [CrossRef]
- Sutcliffe, C.N.; Thibodeau, A.M.; Davis, D.W.; Al-Aasm, I.S.; Parmenter, A.; Zajacz, Z.; Jensen, M. Hydrochronology of a proposed deep geological repository for Low and Intermediate nuclear waste in southern Ontario from U-Pb dating of secondary minerals: Response to Alleghanian events. Can. J. Earth Sci. 2019, 57, 494–505. [Google Scholar] [CrossRef]
Figure 1.
(A) Generalized Paleozoic bedrock geology of southern Ontario (modified from [35,36]); (B) Tectonic history of the Phanerozoic successions in southern Ontario (modified from [37]).

Figure 2.
Bedrock geology of southern Ontario showing the location of boreholes used for this study within the Bruce Nuclear site and other areas in southern Ontario (modified from [38]).
Figure 2.
Bedrock geology of southern Ontario showing the location of boreholes used for this study within the Bruce Nuclear site and other areas in southern Ontario (modified from [38]).

Figure 3.
Paleozoic stratigraphy of the studied successions also showing the listing of the studied cores (modified from AECOM [47]).
Figure 3.
Paleozoic stratigraphy of the studied successions also showing the listing of the studied cores (modified from AECOM [47]).

Figure 4.
Paragenesis of the Cambrian-Ordovician formations (modified from Al-Aasm and Crowe [2]) and paragenesis of the Silurian-Devonian formations (modified from Tortola et al. [3]).

Figure 5.
(A) Photomicrograph (XPL) of fracture-filling coarse saddle dolomite cement (SD) postdating anhedral, replacive medium to coarse crystalline dolomite matrix (D2). Sample: DGR2-CR279- 840.20 Cambrian. (B) Photomicrograph (PPL) of fracture-filling coarse saddle dolomite cement (SD) postdating planar-s, pervasive replacive medium to coarse crystalline (D2) and fine crystalline (D1) dolomite matrix. Sample: DGR2-CR139-2-844.87 Cambrian. (C) Photomicrograph (XPL) of fracture-filling coarse saddle dolomite cement (SD) postdating anhedral, replacive medium to coarse crystalline dolomite matrix (D2). Sample: DGR2-CR139-2-844.87 Cambrian. (D) Photomicrograph (CL) of fracture-filling, bright luminescent blocky calcite cement (BKC) postdating non-luminescent to red luminescent, zoned medium to coarse crystalline dolomite matrix (D2). Sample: DGR4-CR274-2-844.39 Cambrian. (E) Photomicrograph (CL) of vug-filling, bright luminescent blocky calcite cement (BKC) postdating non-luminescent saddle dolomite cement (SD) and replacive medium crystalline dolomite matrix (D2) showing dull to red luminescence. Sample: DGR2-CR139-2-844.87 Cambrian. (F) Photomicrograph (UV-light) of planar-e pervasive replacive medium to coarse crystalline dolomite matrix (D2) showing dull fluorescent cores and bright rims. Sample: DGR4-CR274-2-844.39 Cambrian. (G) Photomicrograph (PPL) of fracture-filling coarse saddle dolomite cement (SD) in an oolitic sandstone. Sample: DGR2-CR134-1-844.54 Cambrian. (H) Photomicrograph (CL) of medium to coarse crystalline dolomite matrix (D2) partially replacing coated grains in an oolitic sandstone. Sample: DGR2-CR134-2-844.54 Cambrian. (I) Photomicrograph (PPL) of fracture-filling coarse blocky calcite cement (BKC) postdating planar-s, pervasive replacive medium to coarse crystalline (D2) and fine crystalline (D1) dolomite matrix. Sample: DGR2-CR133-1-843.96 Cambrian.

Figure 6.
(A) Photomicrograph (PPL) of fracture-filling coarse saddle dolomite cement (SD) postdating planar-e to planar-s, replacive medium to coarse crystalline(D2) dolomite matrix. Sample: DGR3-CR279-2-839.80 Gull River. (B) Photomicrograph (PPL) of fracture-filling coarse saddle dolomite cement (SD) postdating, pervasive replacive micro to fine crystalline dolomite matrix (D1). Sample: DGR3-CR279-2-839.80 Gull River. (C) Photomicrograph (XPL) of planar-e replacive medium to coarse crystalline dolomite matrix (D2) and fine crystalline dolomite matrix (D1). Sample: T001925-1-890 (1-5) Cobourg. (D) Photomicrograph (XPL) of fracture-filling coarse saddle dolomite cement (SD) postdating planar-s, pervasive, replacive medium to coarse (D2) and fine crystalline (D1) dolomite matrix. Sample: DGR4-CR265-817.12 Gull River. (E,F) Paired photomicrographs (PPL and CL, respectively) of anhydrite cement postdating zoned, dull (rims) to dark red (cores) luminescent, coarse saddle dolomite cement (SD). Sample: DGR3-CR279-2-839.80 Gull River.

Figure 7.
(A) Photomicrograph (PPL) of planar-s replacive micro to fine crystalline dolomite matrix (D1). The yellow arrow indicates the presence of framboidal pyrite in the matrix. Sample: DGR3-CR61-194.02 (3-11) Salina G-Unit. (B) Photomicrograph (PPL) of planar-s fine crystalline dolomite matrix (D1) and planar-e to planar-s, replacive medium crystalline dolomite matrix (D2), showing increasing intercrystalline porosity. Sample: DGR4-CR100-327.98 (4-11) Salina A1-Unit (Carbonate). (C) Photomicrograph (PPL—after staining) of planar-s fine crystalline dolomite and planar-e to planar-s, pervasive replacive medium crystalline dolomite matrix (D2) showing increasing intercrystalline porosity and non-ferroan cores followed by later iron-rich rims. Sample: DGR3-CR128-388.45 (3-16) Guelph. (D) Photomicrograph (PPL—after staining) of fracture-filling blocky calcite cement (BKC) postdating fracture-filling coarse saddle dolomite cement (SD) and fine crystalline (D1) dolomite matrix. Sample: DGR8-CR139-382.40 (8-13) Guelph. (E) Photomicrograph (CL) of fracture-filling, bright luminescent blocky calcite cement (BKC) postdating dull to non-luminescent coarse saddle dolomite cement (SD) and dark red luminescent fine crystalline dolomite matrix (D1). Sample: DGR8-CR139-382.40 (8-13) Guelph. (F) Photomicrograph (XPL) of fracture-filling blocky calcite cement (BKC) postdating fracture-filling coarse saddle dolomite cement (SD), replacive medium to coarse crystalline dolomite matrix (D2) and fine crystalline dolomite matrix (D1). Sample: DGR8-CR116-313.31 (8-9) Salina A2-Unit (Carbonate).

Figure 8.
(A) Photomicrograph (XPL) of planar-s fine crystalline dolomite matrix (D1) and planar-e to planar-s, replacive medium crystalline dolomite matrix (D2), showing increasing intercrystalline porosity. DGR8-CR22-59.06 (8-4) Amherstburg. (B) Photomicrograph (XPL) of chert (Sil) and silicified skeletal fragment partially replaced by fine crystalline dolomite (D1). Sample: DGR4-CR26-105.11 (4-5) Bois Blanc. (C) Photomicrograph (PPL) of planar-e to planar-s, medium crystalline dolomite matrix (RD2) pervasively replacing precursor limestone and partially replacing allochems and skeletal fragments. Sample DGR1-CR2-3-27.75 (1-4) Lucas. (D) Photomicrograph (PPL) of micro to fine crystalline dolomite matrix (D1) and planar-e to planar-s, replacive medium crystalline dolomite matrix (D2) associated with dissolution seams showing dark cores and clear rims. Sample: DGR3-CR6-42.30 (3-4) Lucas. (E) Photomicrograph (PPL—after staining) of planar-e, replacive medium crystalline dolomite matrix (D2) associated with dissolution seams Characterized by cloudy cores and clear rims. The undolomitized limestone matrix (LM) shows a pink color after staining. Sample: DGR1-CR3-2-31.85 (1-6) Amherstburg. (F) Photomicrograph (CL) of fracture-filling authigenic quartz (Qz) postdating dull to dark red luminescent medium crystalline dolomite matrix (D2). Sample: DGR4-CR26-105.11 (4-5) Bois Blanc.

Figure 9.
(A) Photomicrograph (CL) of fracture-filling, zoned, blocky calcite cement (BKC) characterized by dull to non-luminescent cores and bright luminescent rims. Sample: T006056- 57-396.1 (2-15) Coboconk. (B) Photomicrograph (CL) of fracture-filling, bright luminescent blocky calcite cement (BKC) postdating zone, dull to non-luminescent coarse saddle dolomite cement (SD) and dark red luminescent medium crystalline dolomite matrix (D2). Sample: DGR2-CR133-1-843.96 Cambrian. (C) photomicrograph (XPL) of bladed vug-lining isopachous calcite cement (ISC) predating vug-filling blocky calcite cement (BKC). Sample: DGR6-CR243-898.24 Gull River. (D) Photomicrograph (XPL) of syntaxial overgrowth calcite cement (SXC) on crinoidal and echinoid skeletal fragments in a bioclastic grainstone. Sample: DGR1-CR154-440.92 (1-33) Manitoulin. (E) Photomicrograph (XPL) of drusy calcite cement (DC) and micro to fine crystalline dolomite matrix (D1) in fenestral dolostone. Sample: DGR1-CR49-142.28 (1-17) Bass Island. (F) Photomicrograph (XPL) of bladed isopachous calcite cement (ISC) filling interparticle pores between coated grains in a partially dolomitized grainstone. DGR8-CR122-332.26 (8-10) Salina A1-Unit (Carbonate). (G) Photomicrograph (XPL) of bladed vug-lining isopachous calcite cement (ISC) predating vug-filling blocky calcite cement (BKC) and gypsum (Gy). Sample: DGR1-CR119-337.32 (1-27) Salina A1-Unit (Carbonate). (H) Photomicrograph (CL) of fracture-filling, zoned, blocky calcite cement (BKC) postdating dark red luminescent fine crystalline dolomite matrix (D1). Sample: DGR3-CR10-51.60 (3-5) Lucas. (I) Photomicrograph (PPL—after staining) of non-ferroan, drusy calcite cement (DC) lining a fine crystalline dolostone. The coarser crystals show zonation characterized by iron-rich cores followed by non-ferroan rims. Sample: DGR3-CR335.35 (3-2) Lucas.

Figure 10.
(A) Photomicrograph (XPL) of anhydrite cement (ANH) postdating coarse saddle dolomite cement (SD) and planar-s medium crystalline dolomite matrix (D2). Sample: DGR3-CR279-840.20 Cambrian. (B) Photomicrograph (XPL) of anhydrite cement (ANH) postdating coarse saddle dolomite cement (SD) and planar-e to planar-s medium crystalline dolomite matrix (D2). Sample: DGR3-CR279-2-839.80 Gull River. (C) Photomicrograph (XPL) of gypsum cement (Gy) postdating coarse saddle dolomite cement (SD) and micro to fine crystalline dolomite matrix (D1). Sample: DGR8-CR116-313.31 (8-9) Salina A2-Unit (Carbonate).

Figure 11.
Cross plot of δ13CVPDB vs. δ18OVPDB of different generations of dolomite. Note the overlap in many values and the shift from the postulated range for respective seawater composition.
Figure 11.
Cross plot of δ13CVPDB vs. δ18OVPDB of different generations of dolomite. Note the overlap in many values and the shift from the postulated range for respective seawater composition.

Figure 12.
Cross plot of δ13CVPDB vs. δ18OVPDB of different generations of calcite cement of different ages. Note the overlap in many values and the negative shift of late calcite from the postulated range for respective seawater composition.
Figure 12.
Cross plot of δ13CVPDB vs. δ18OVPDB of different generations of calcite cement of different ages. Note the overlap in many values and the negative shift of late calcite from the postulated range for respective seawater composition.

Figure 13.
Cross plot of δ18OVPDB values vs. 87Sr/86Sr ratios of different generations of dolomite. Note the overlap in many values and the shift from the postulated values for respective seawater composition except for dolomite associated with dissolution seams.
Figure 13.
Cross plot of δ18OVPDB values vs. 87Sr/86Sr ratios of different generations of dolomite. Note the overlap in many values and the shift from the postulated values for respective seawater composition except for dolomite associated with dissolution seams.

Figure 14.
Cross plot of δ18OVPDB values vs. 87Sr/86Sr ratios of different generations of calcite cement. Note the highly radiogenic ratios in Cambrian blocky calcite.
Figure 14.
Cross plot of δ18OVPDB values vs. 87Sr/86Sr ratios of different generations of calcite cement. Note the highly radiogenic ratios in Cambrian blocky calcite.

Figure 15.
Comparison between 87Sr/86Sr secular variation [69] and 87Sr/86Sr ratios of the investigated dolomite.
Figure 15.
Comparison between 87Sr/86Sr secular variation [69] and 87Sr/86Sr ratios of the investigated dolomite.

Figure 16.
Histogram plots of CaCO3 (mol%) of: (A) D1; (B) D2, and (C) SD.

Figure 17.
Cross plots of the investigated dolomites: (A) between Fe and Mn; (B) Sr vs. Mn concentrations, and (C) Sr vs. Fe.
Figure 17.
Cross plots of the investigated dolomites: (A) between Fe and Mn; (B) Sr vs. Mn concentrations, and (C) Sr vs. Fe.

Figure 18.
Post-Archean Australian Shale (PAAS) normalized rare-earth element (REE) pattern for average values of fine (D1) and medium (D2) crystalline dolomite, and saddle dolomite (SD) samples, compared with average PAAS normalized REE pattern of water brachiopods [70].
Figure 18.
Post-Archean Australian Shale (PAAS) normalized rare-earth element (REE) pattern for average values of fine (D1) and medium (D2) crystalline dolomite, and saddle dolomite (SD) samples, compared with average PAAS normalized REE pattern of water brachiopods [70].

Figure 19.
Cross plot Ce (Ce/Ce*)SN–La (Pr/Pr*)SN anomaly of D1, D2, and SD samples of different age groups.
Figure 19.
Cross plot Ce (Ce/Ce*)SN–La (Pr/Pr*)SN anomaly of D1, D2, and SD samples of different age groups.

Figure 20.
(A) Plots of Sm/Yb vs. Eu/Sm; (B) La/Yb vs. La/SmN; (C) Y/Ho vs. Sm/Yb, and (D) Y/Ho vs. Eu/Sm of dolomite samples from different age groups.
Figure 20.
(A) Plots of Sm/Yb vs. Eu/Sm; (B) La/Yb vs. La/SmN; (C) Y/Ho vs. Sm/Yb, and (D) Y/Ho vs. Eu/Sm of dolomite samples from different age groups.

Figure 21.
Cross plots of (A) Homogenization temperature vs. salinity of dolomite types; (B) calcite phases; (C) Histogram plot of Th for dolomite samples; (D) Histogram plot of Th for calcite samples; (E) Histogram plot of salinity of late calcite; and (F) Histogram plot of salinity for dolomite types.

Figure 22.
SEM and BSE images of D1 (A), D2 (B,C) and SD (D).

Figure 23.
(A) Oxygen isotope values of dolomite the investigated formations plotted on the temperature-dependent, dolomite-water oxygen fractionation curve [118]. (B) Oxygen isotope values of calcite cement from the investigated formations plotted on the temperature-dependent, calcite-water oxygen fractionation curve [119].

Figure 24.
Stratigraphy vs. isotopic and microthermometric data for the investigate age groups.

Figure 25.
Conceptual model for fluid flow in the study area illustrating fluid compartmentalization in different stratigraphic rock units and migration pathways. These fluid pathways vary with time and effect of tectonic setting (stratigraphic setting is modified from [123]).
Figure 25.
Conceptual model for fluid flow in the study area illustrating fluid compartmentalization in different stratigraphic rock units and migration pathways. These fluid pathways vary with time and effect of tectonic setting (stratigraphic setting is modified from [123]).


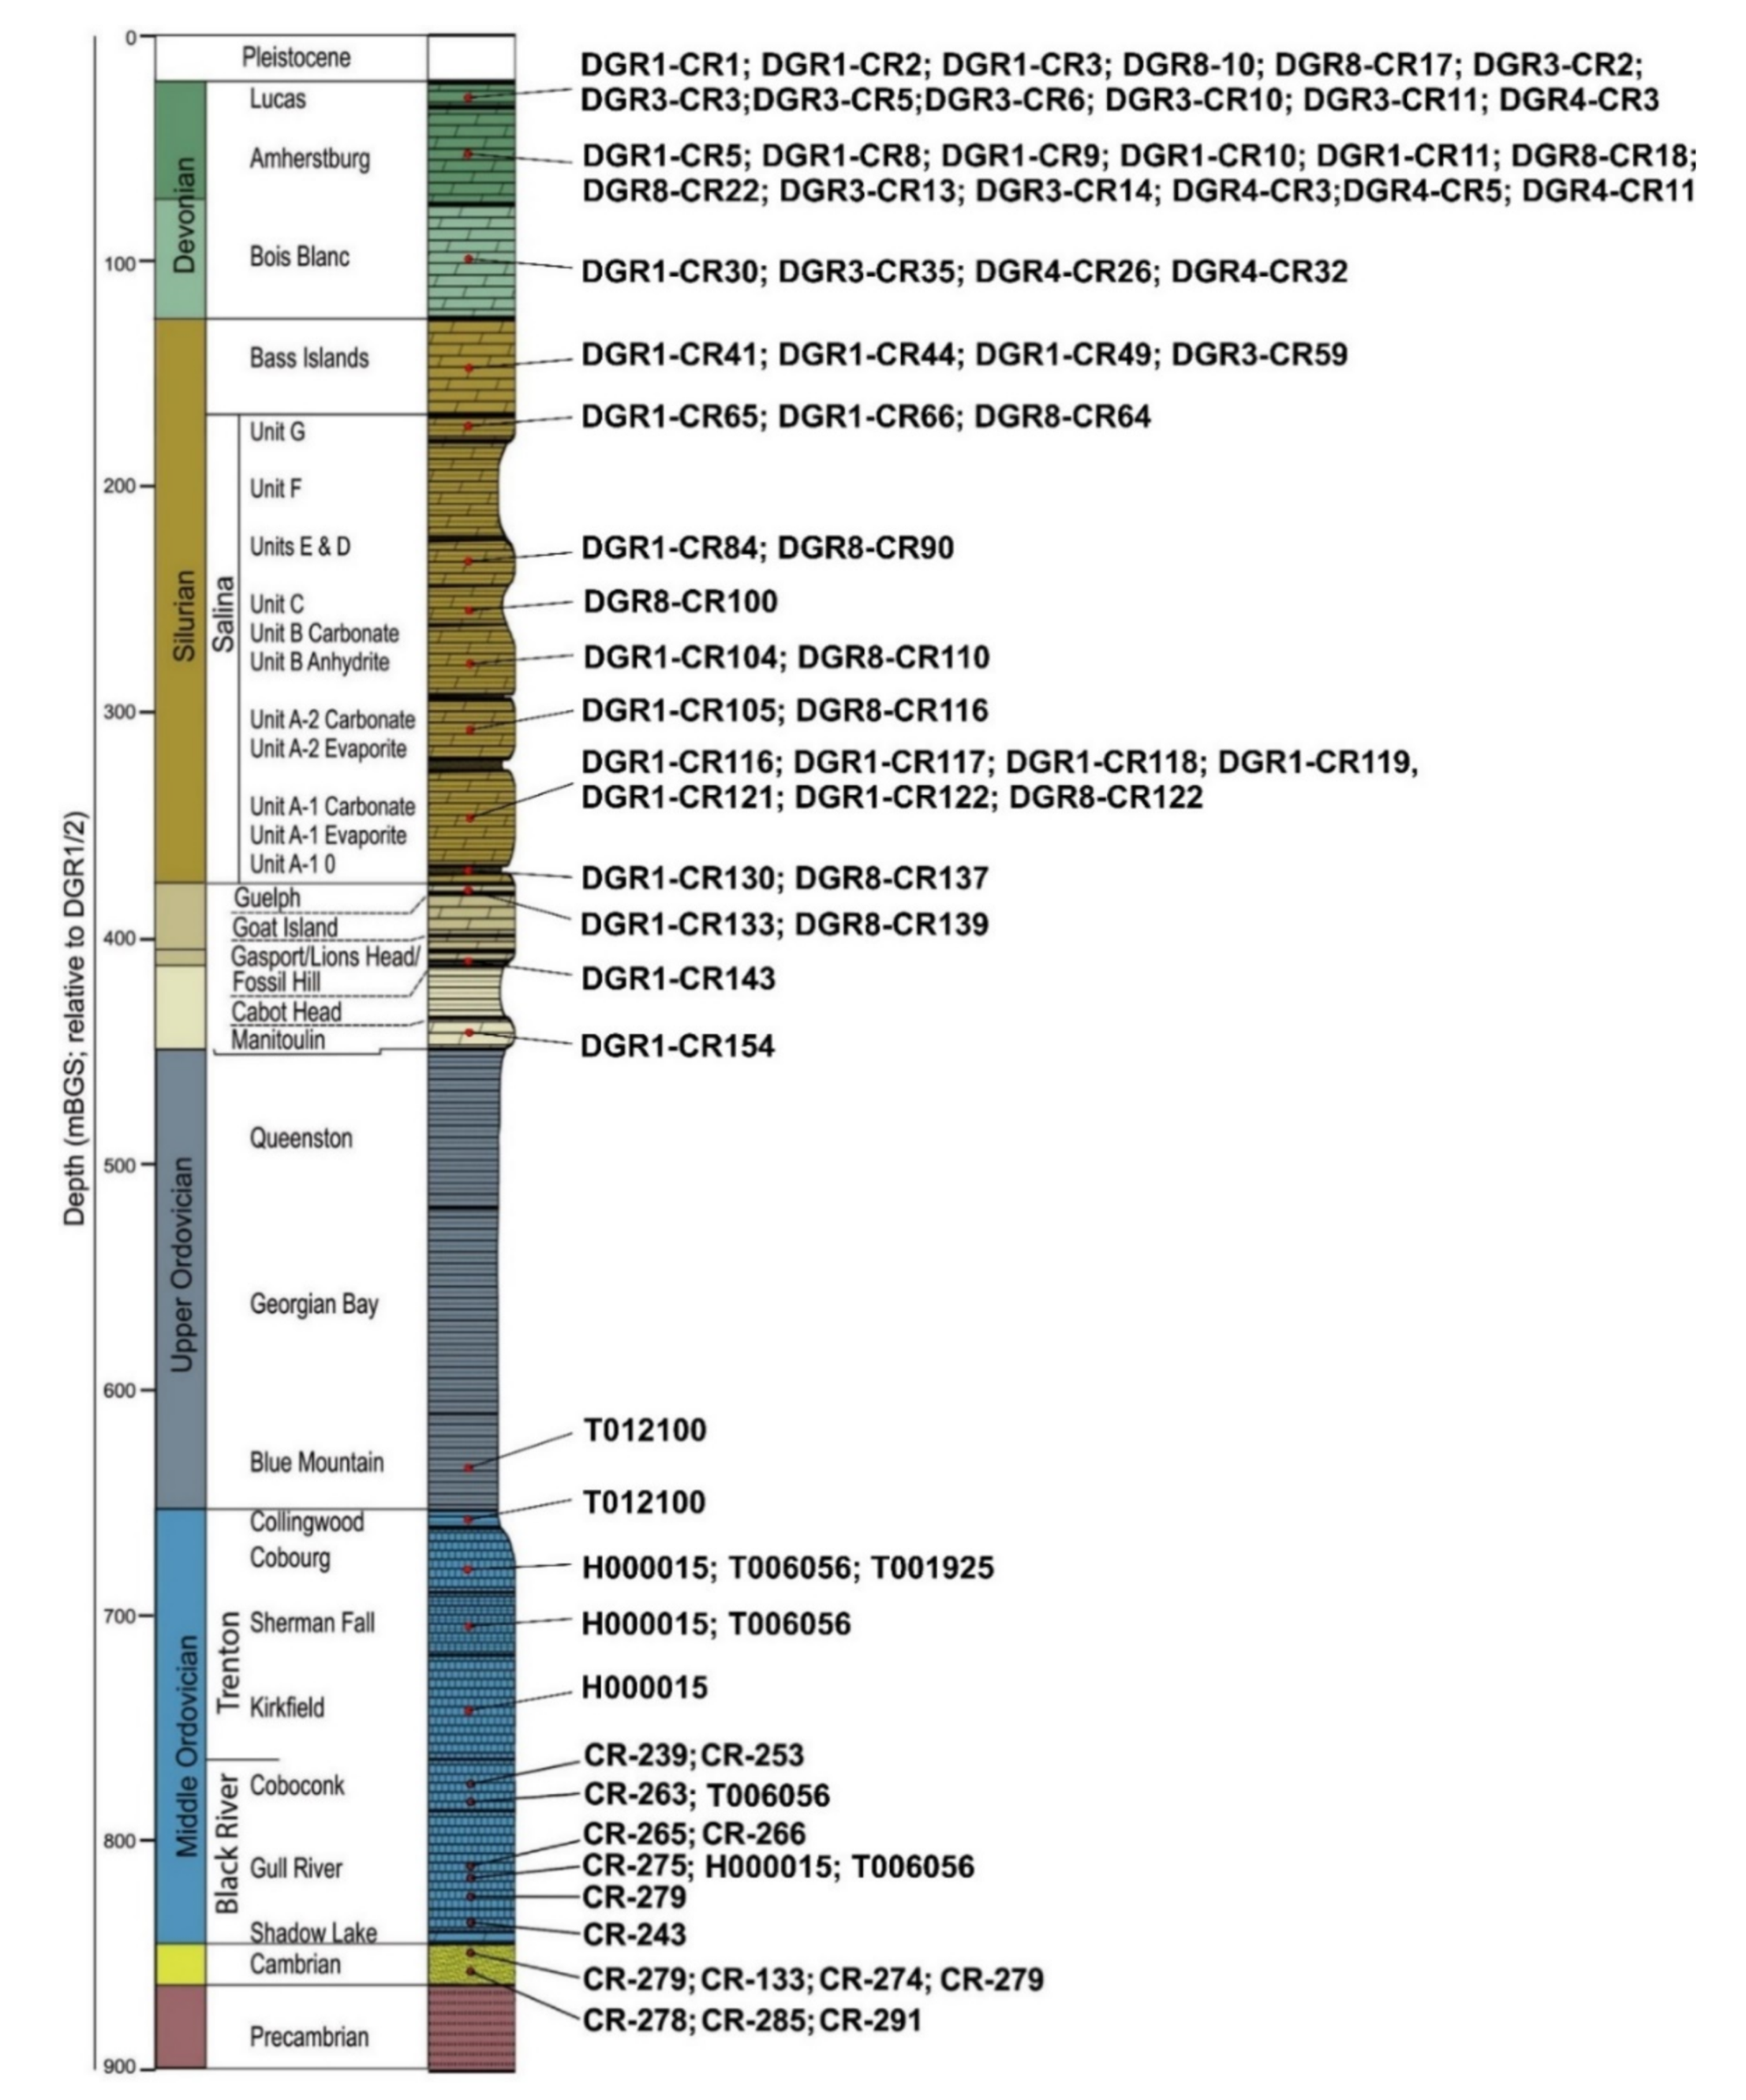
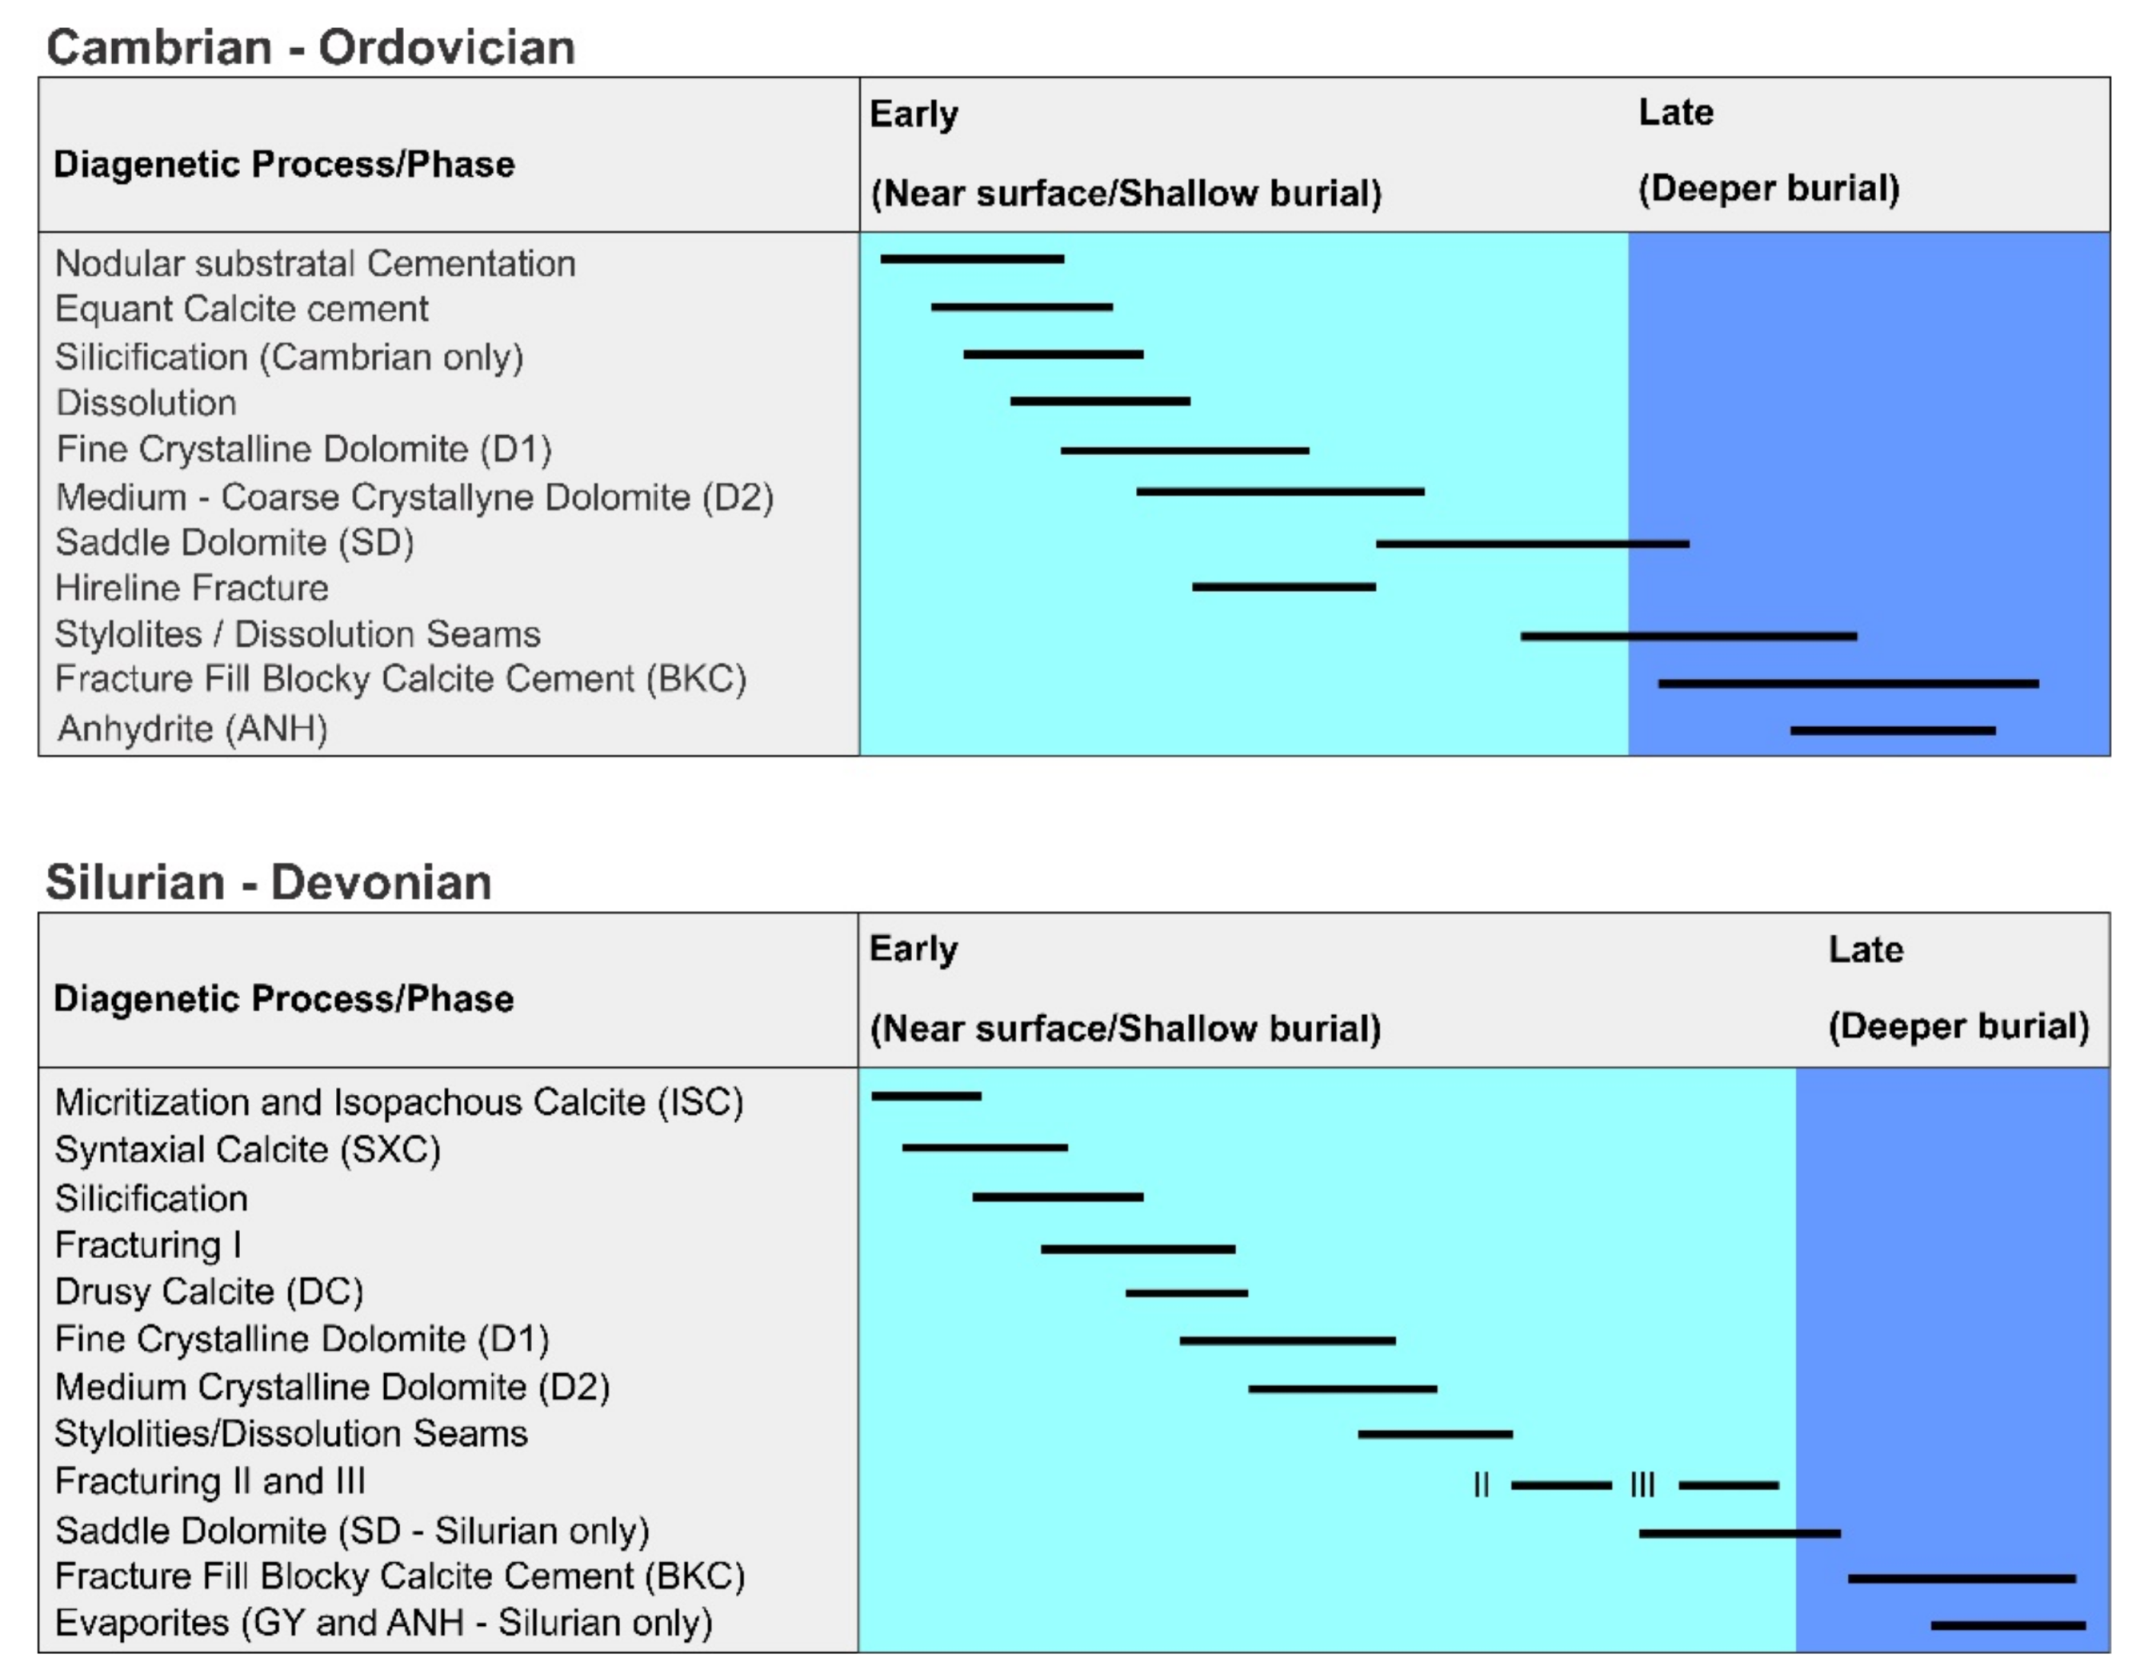
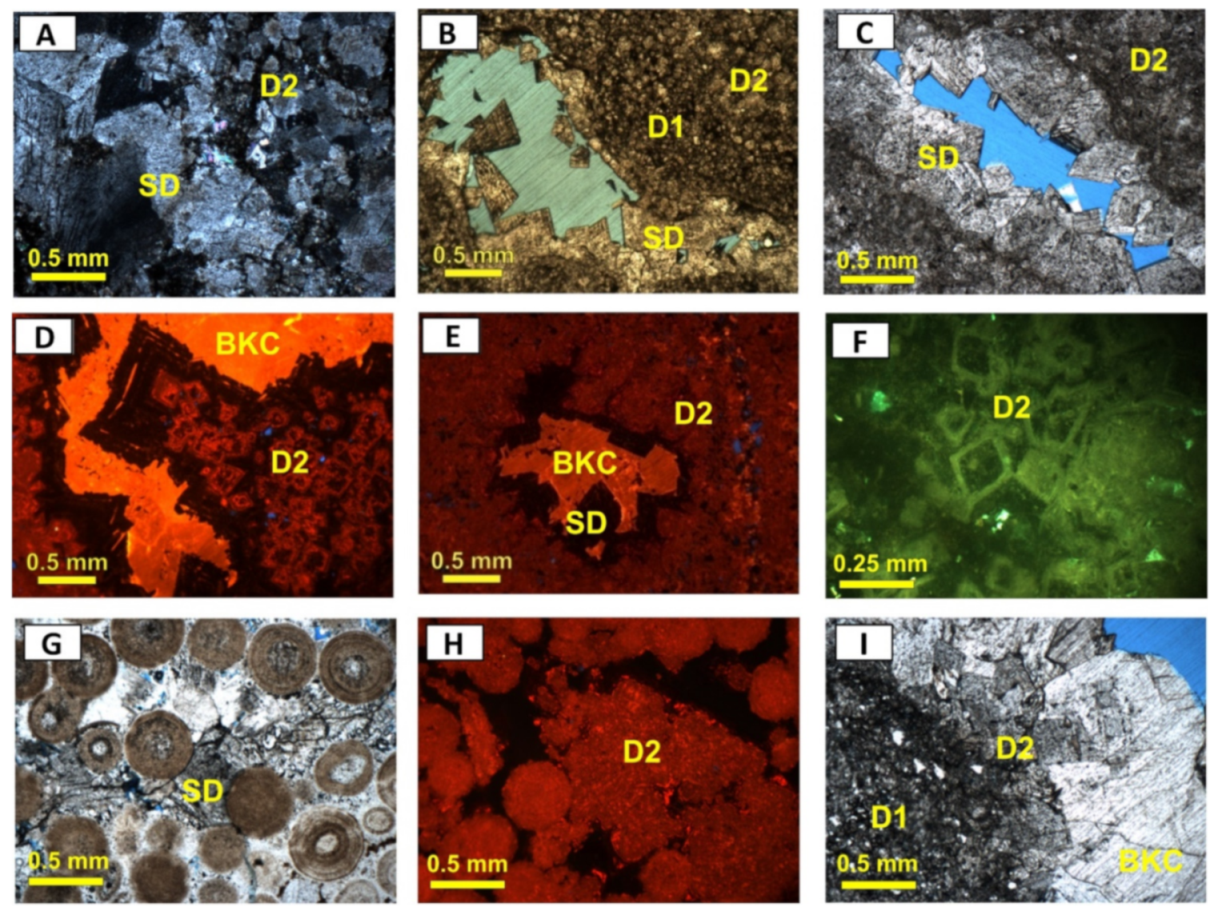
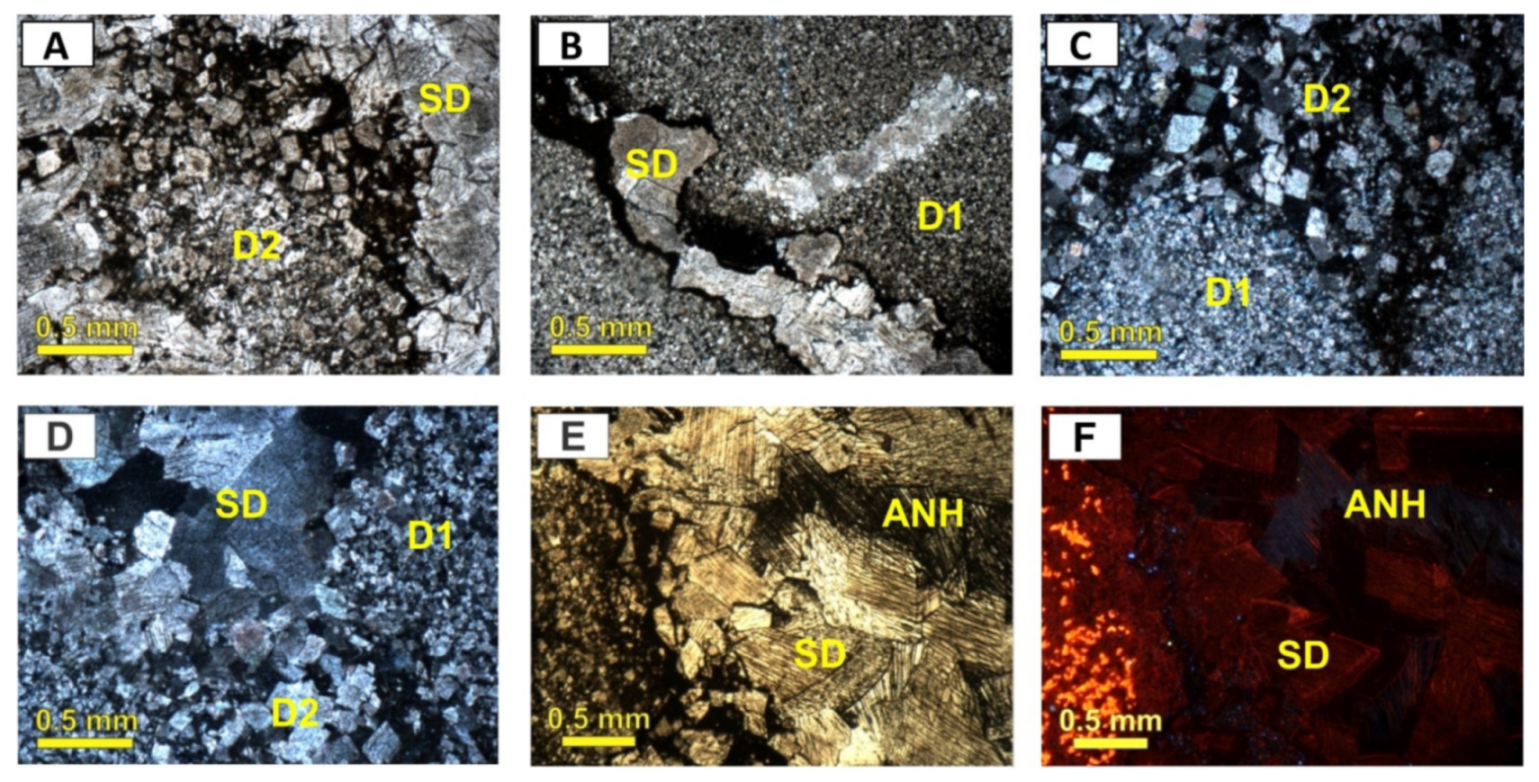
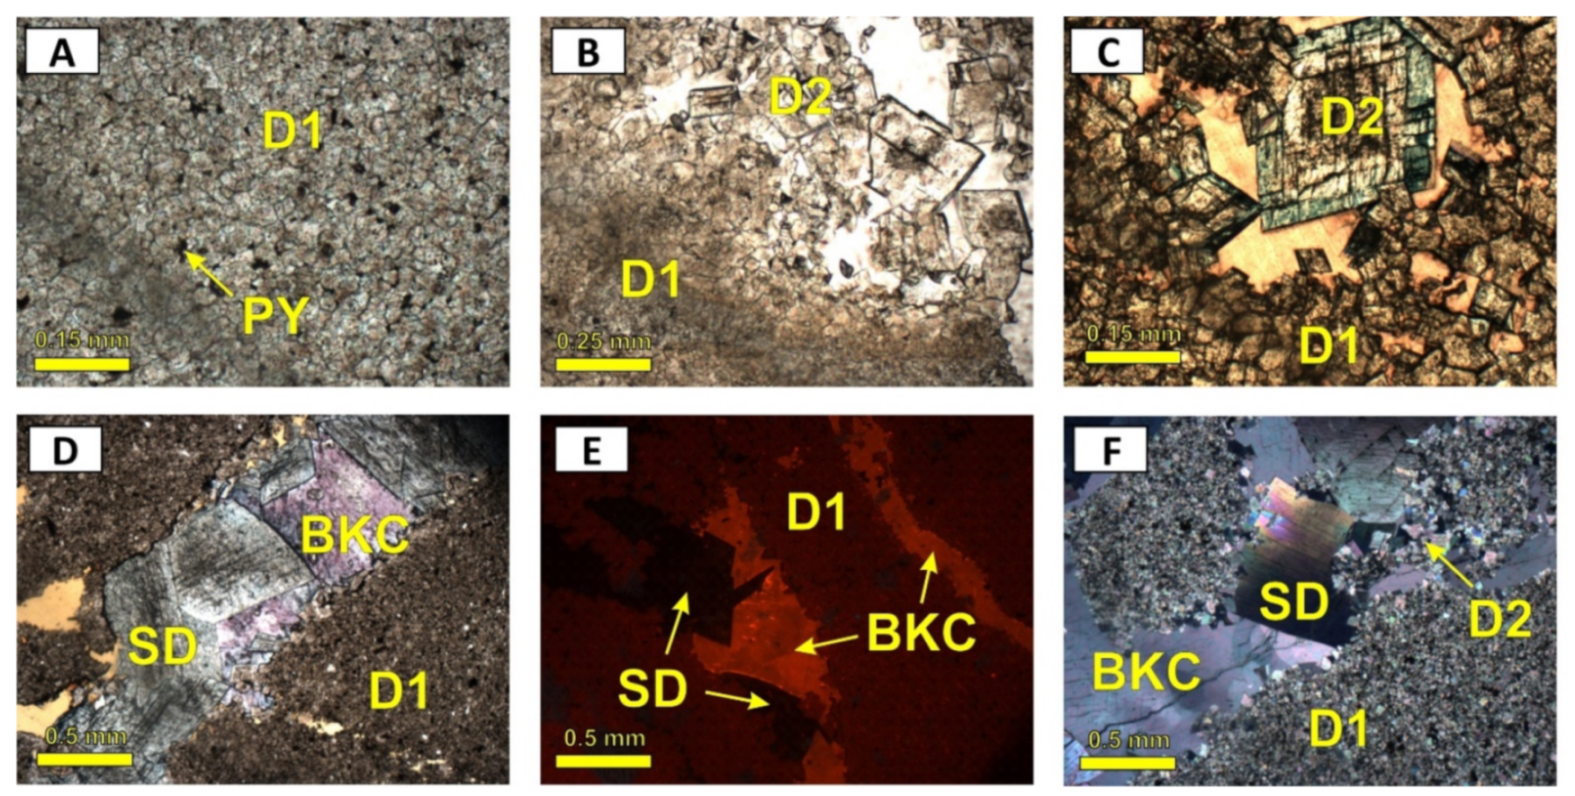
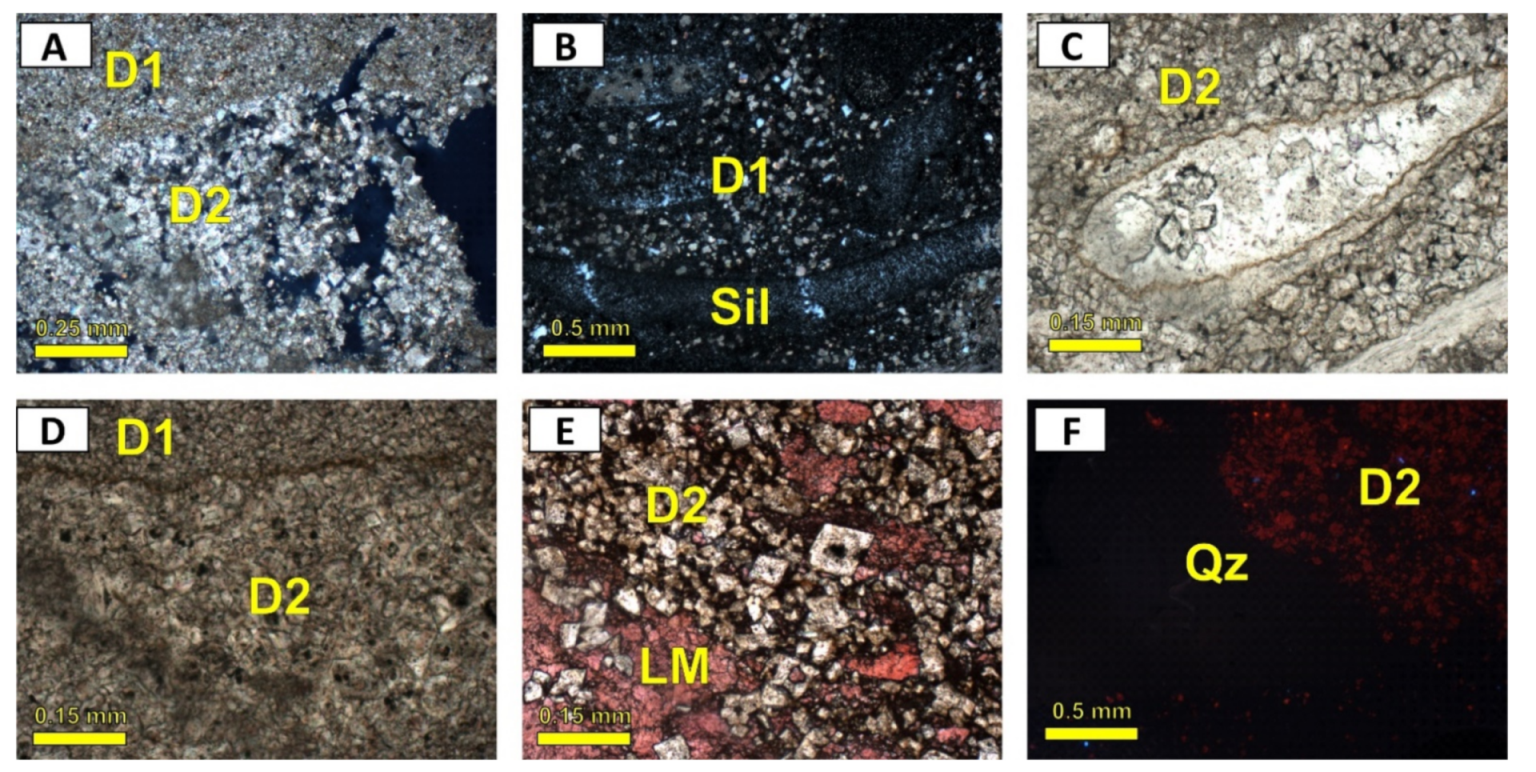
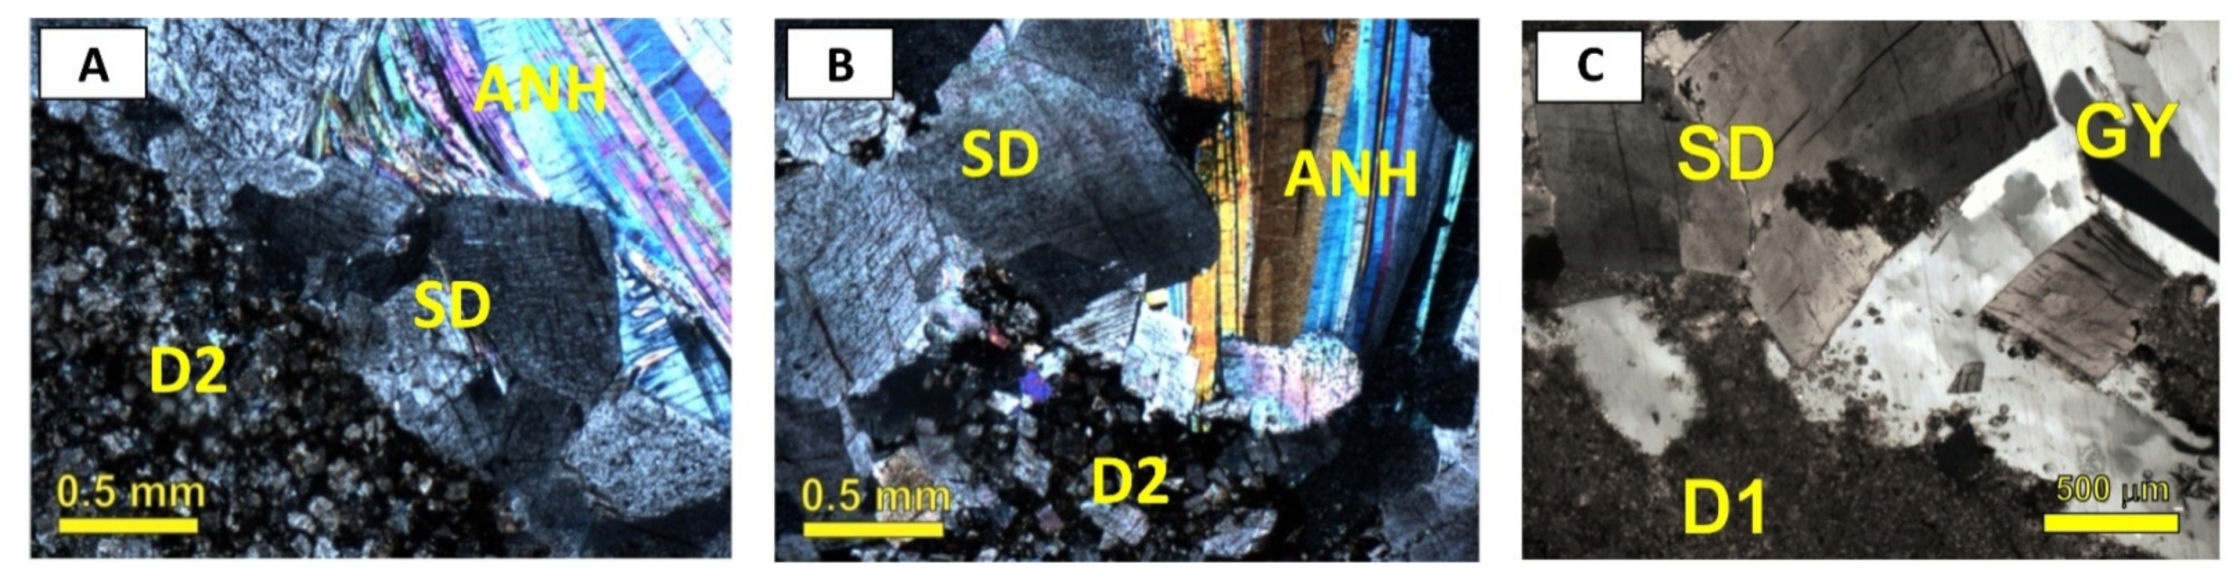
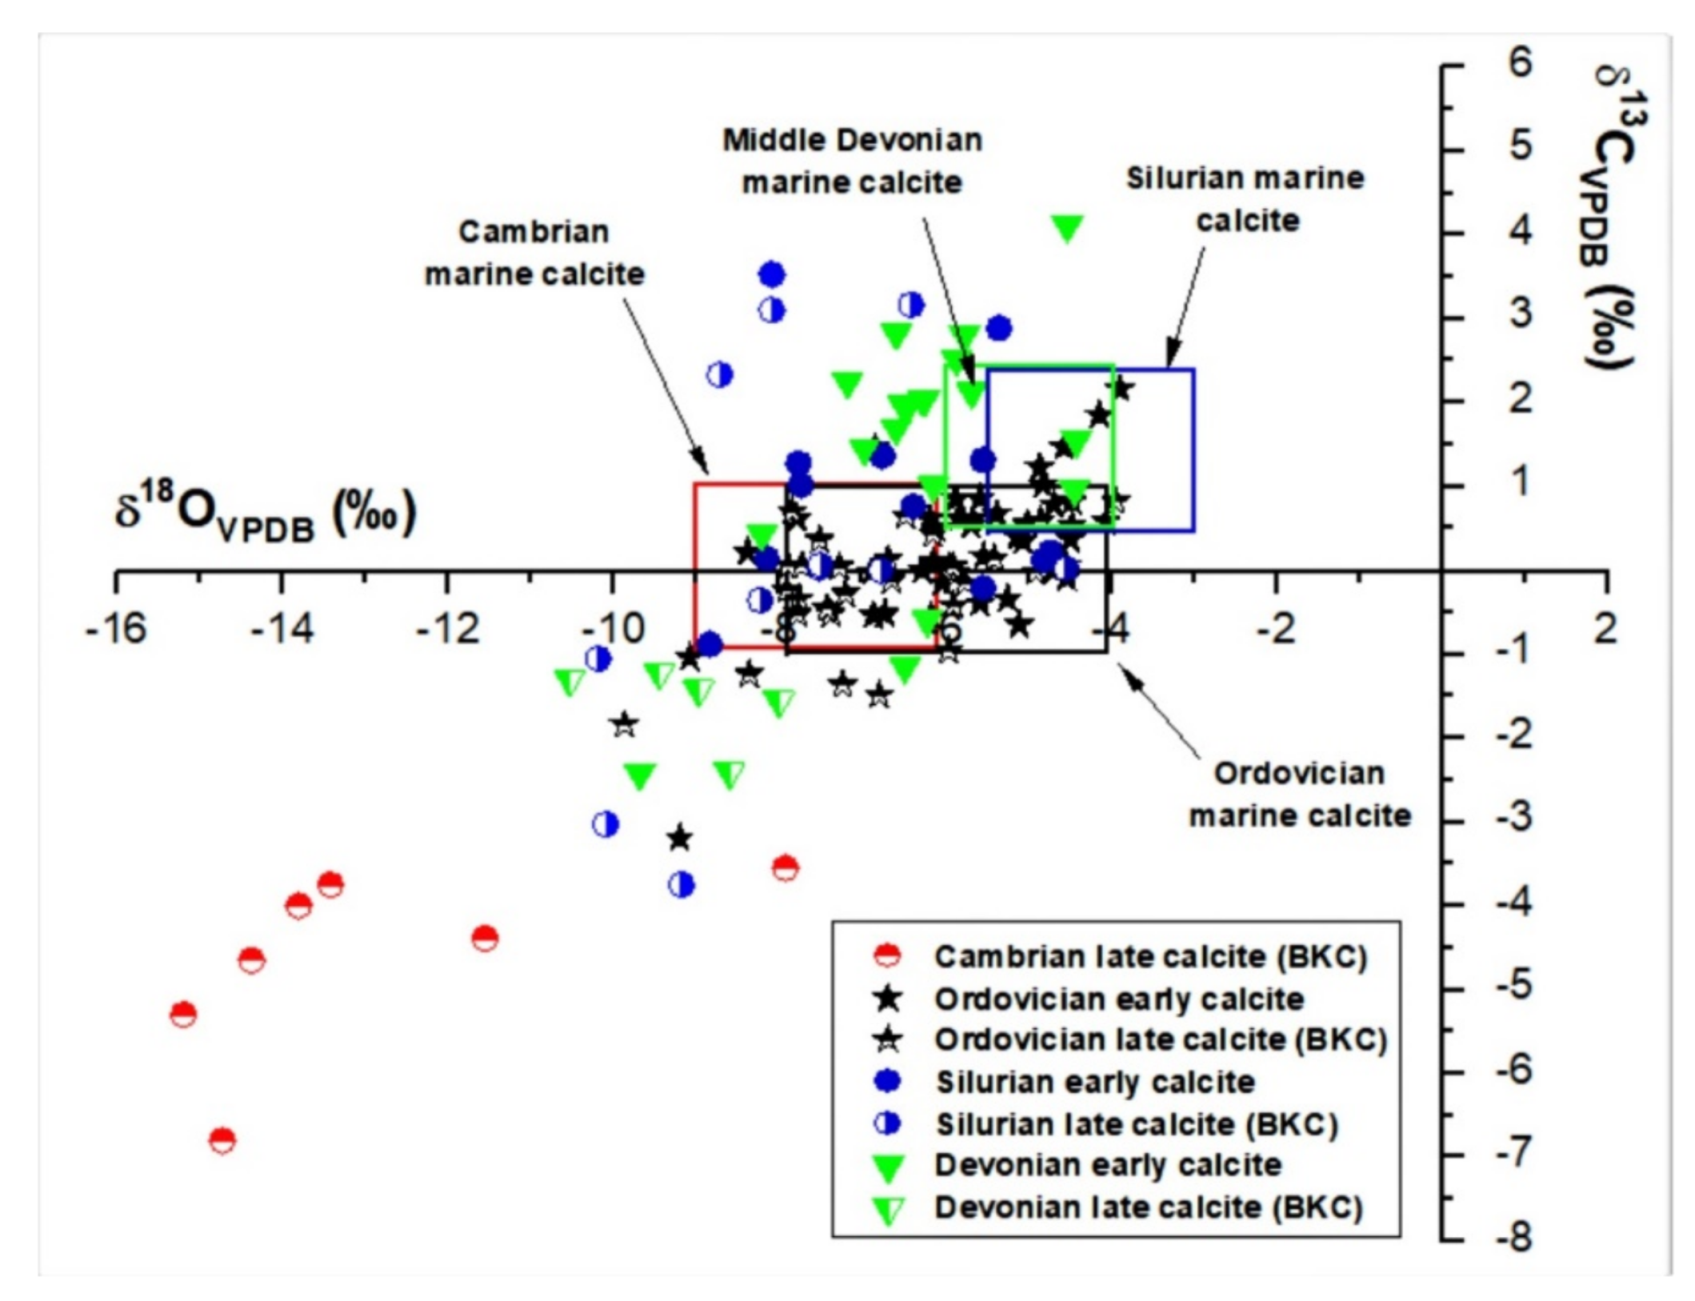
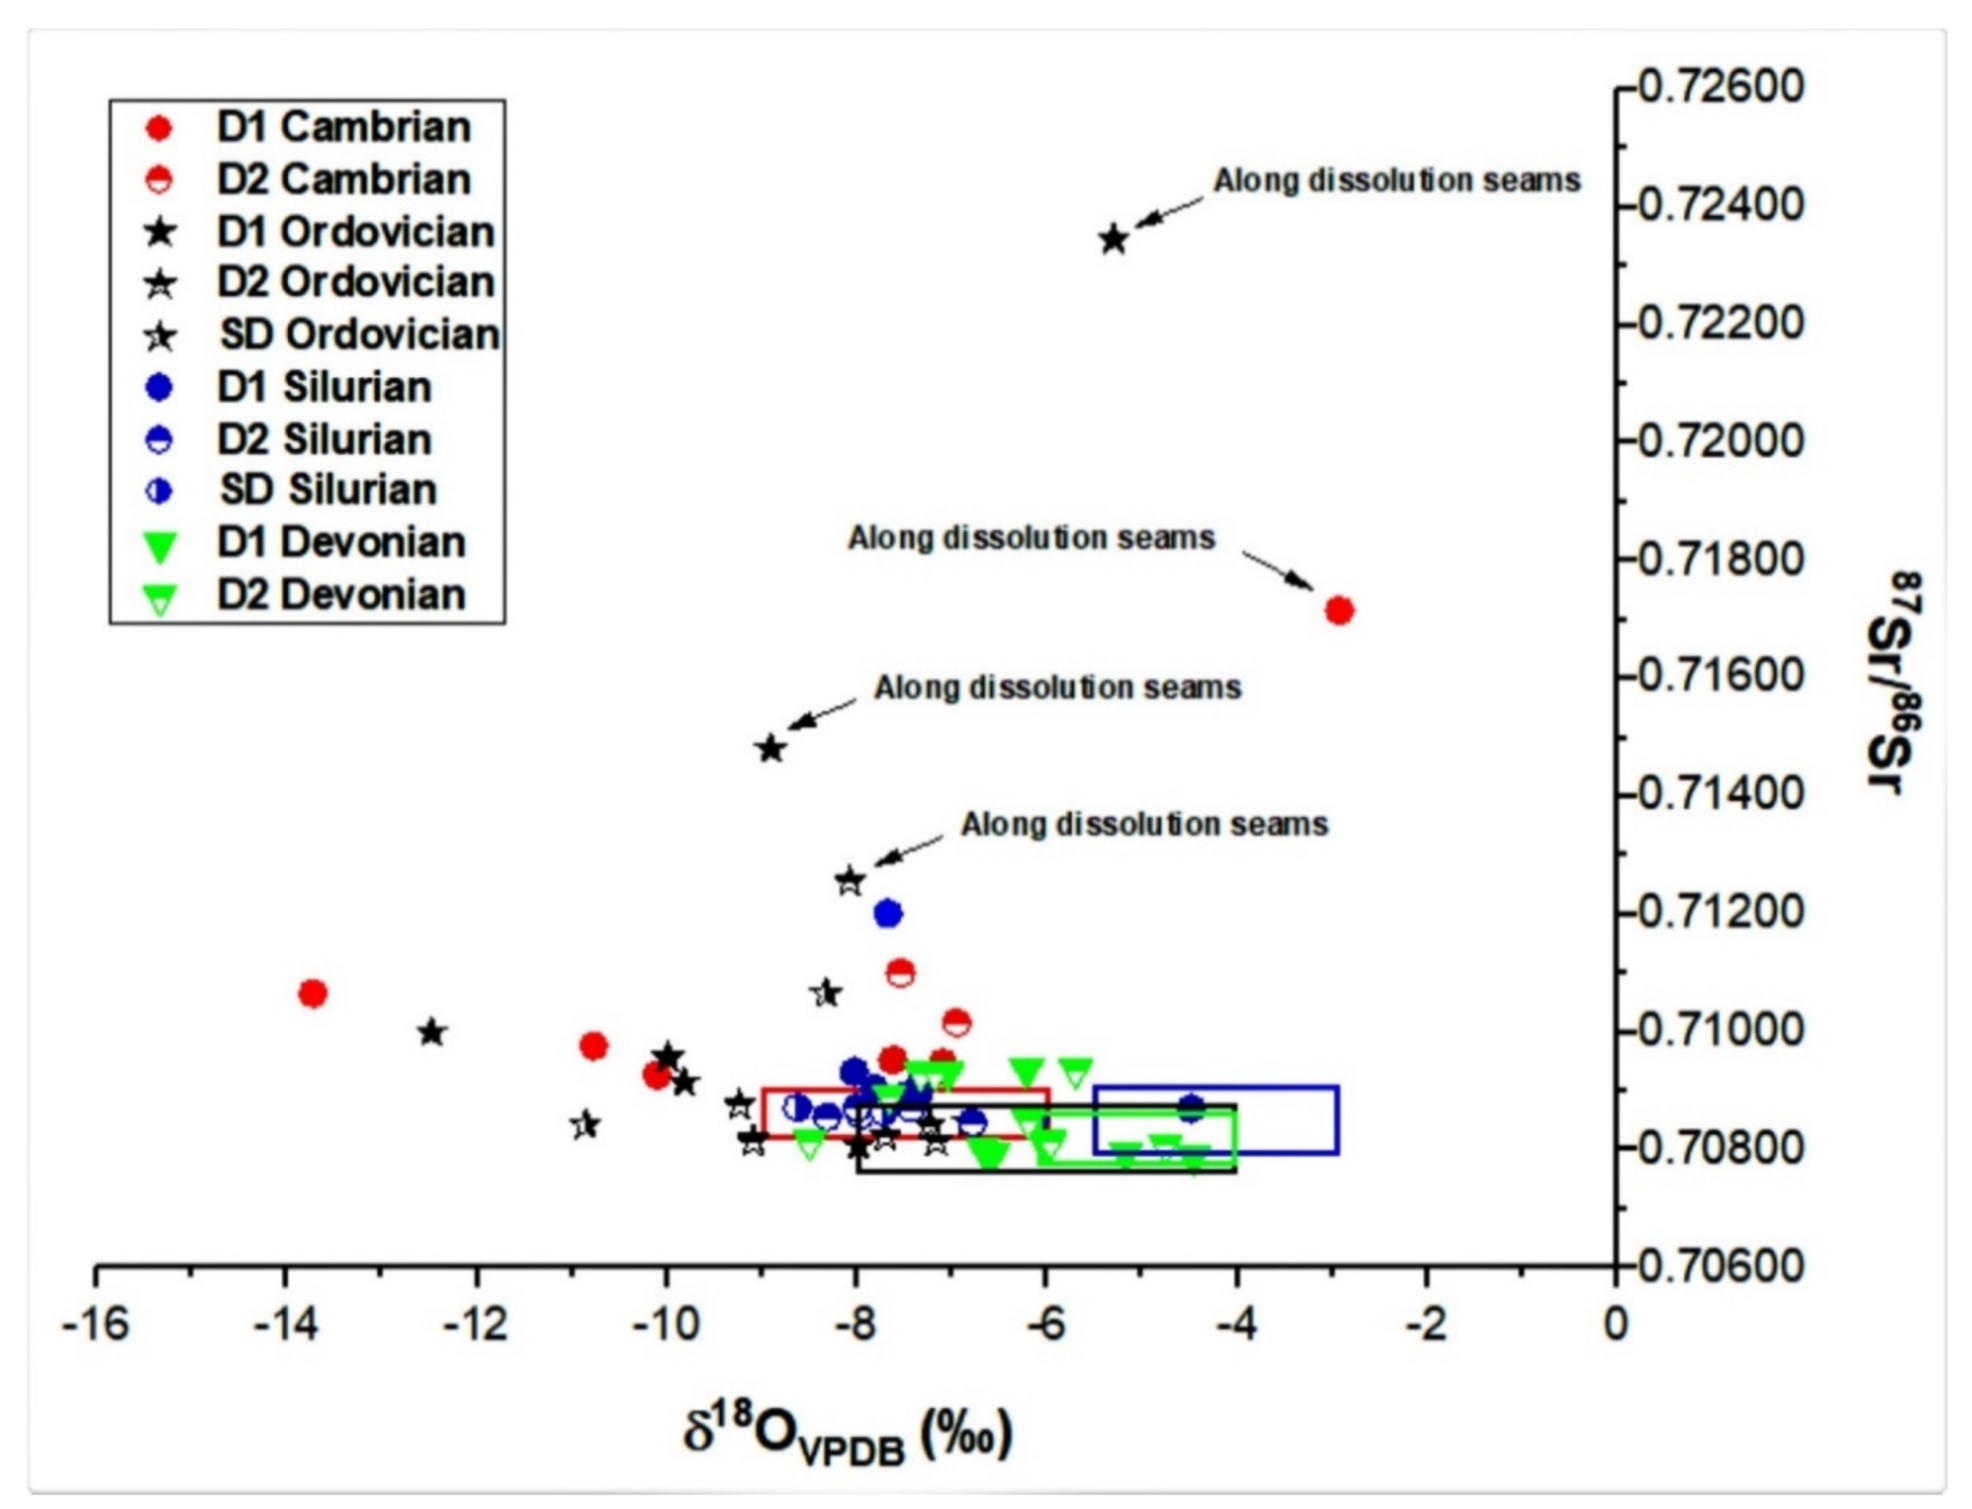
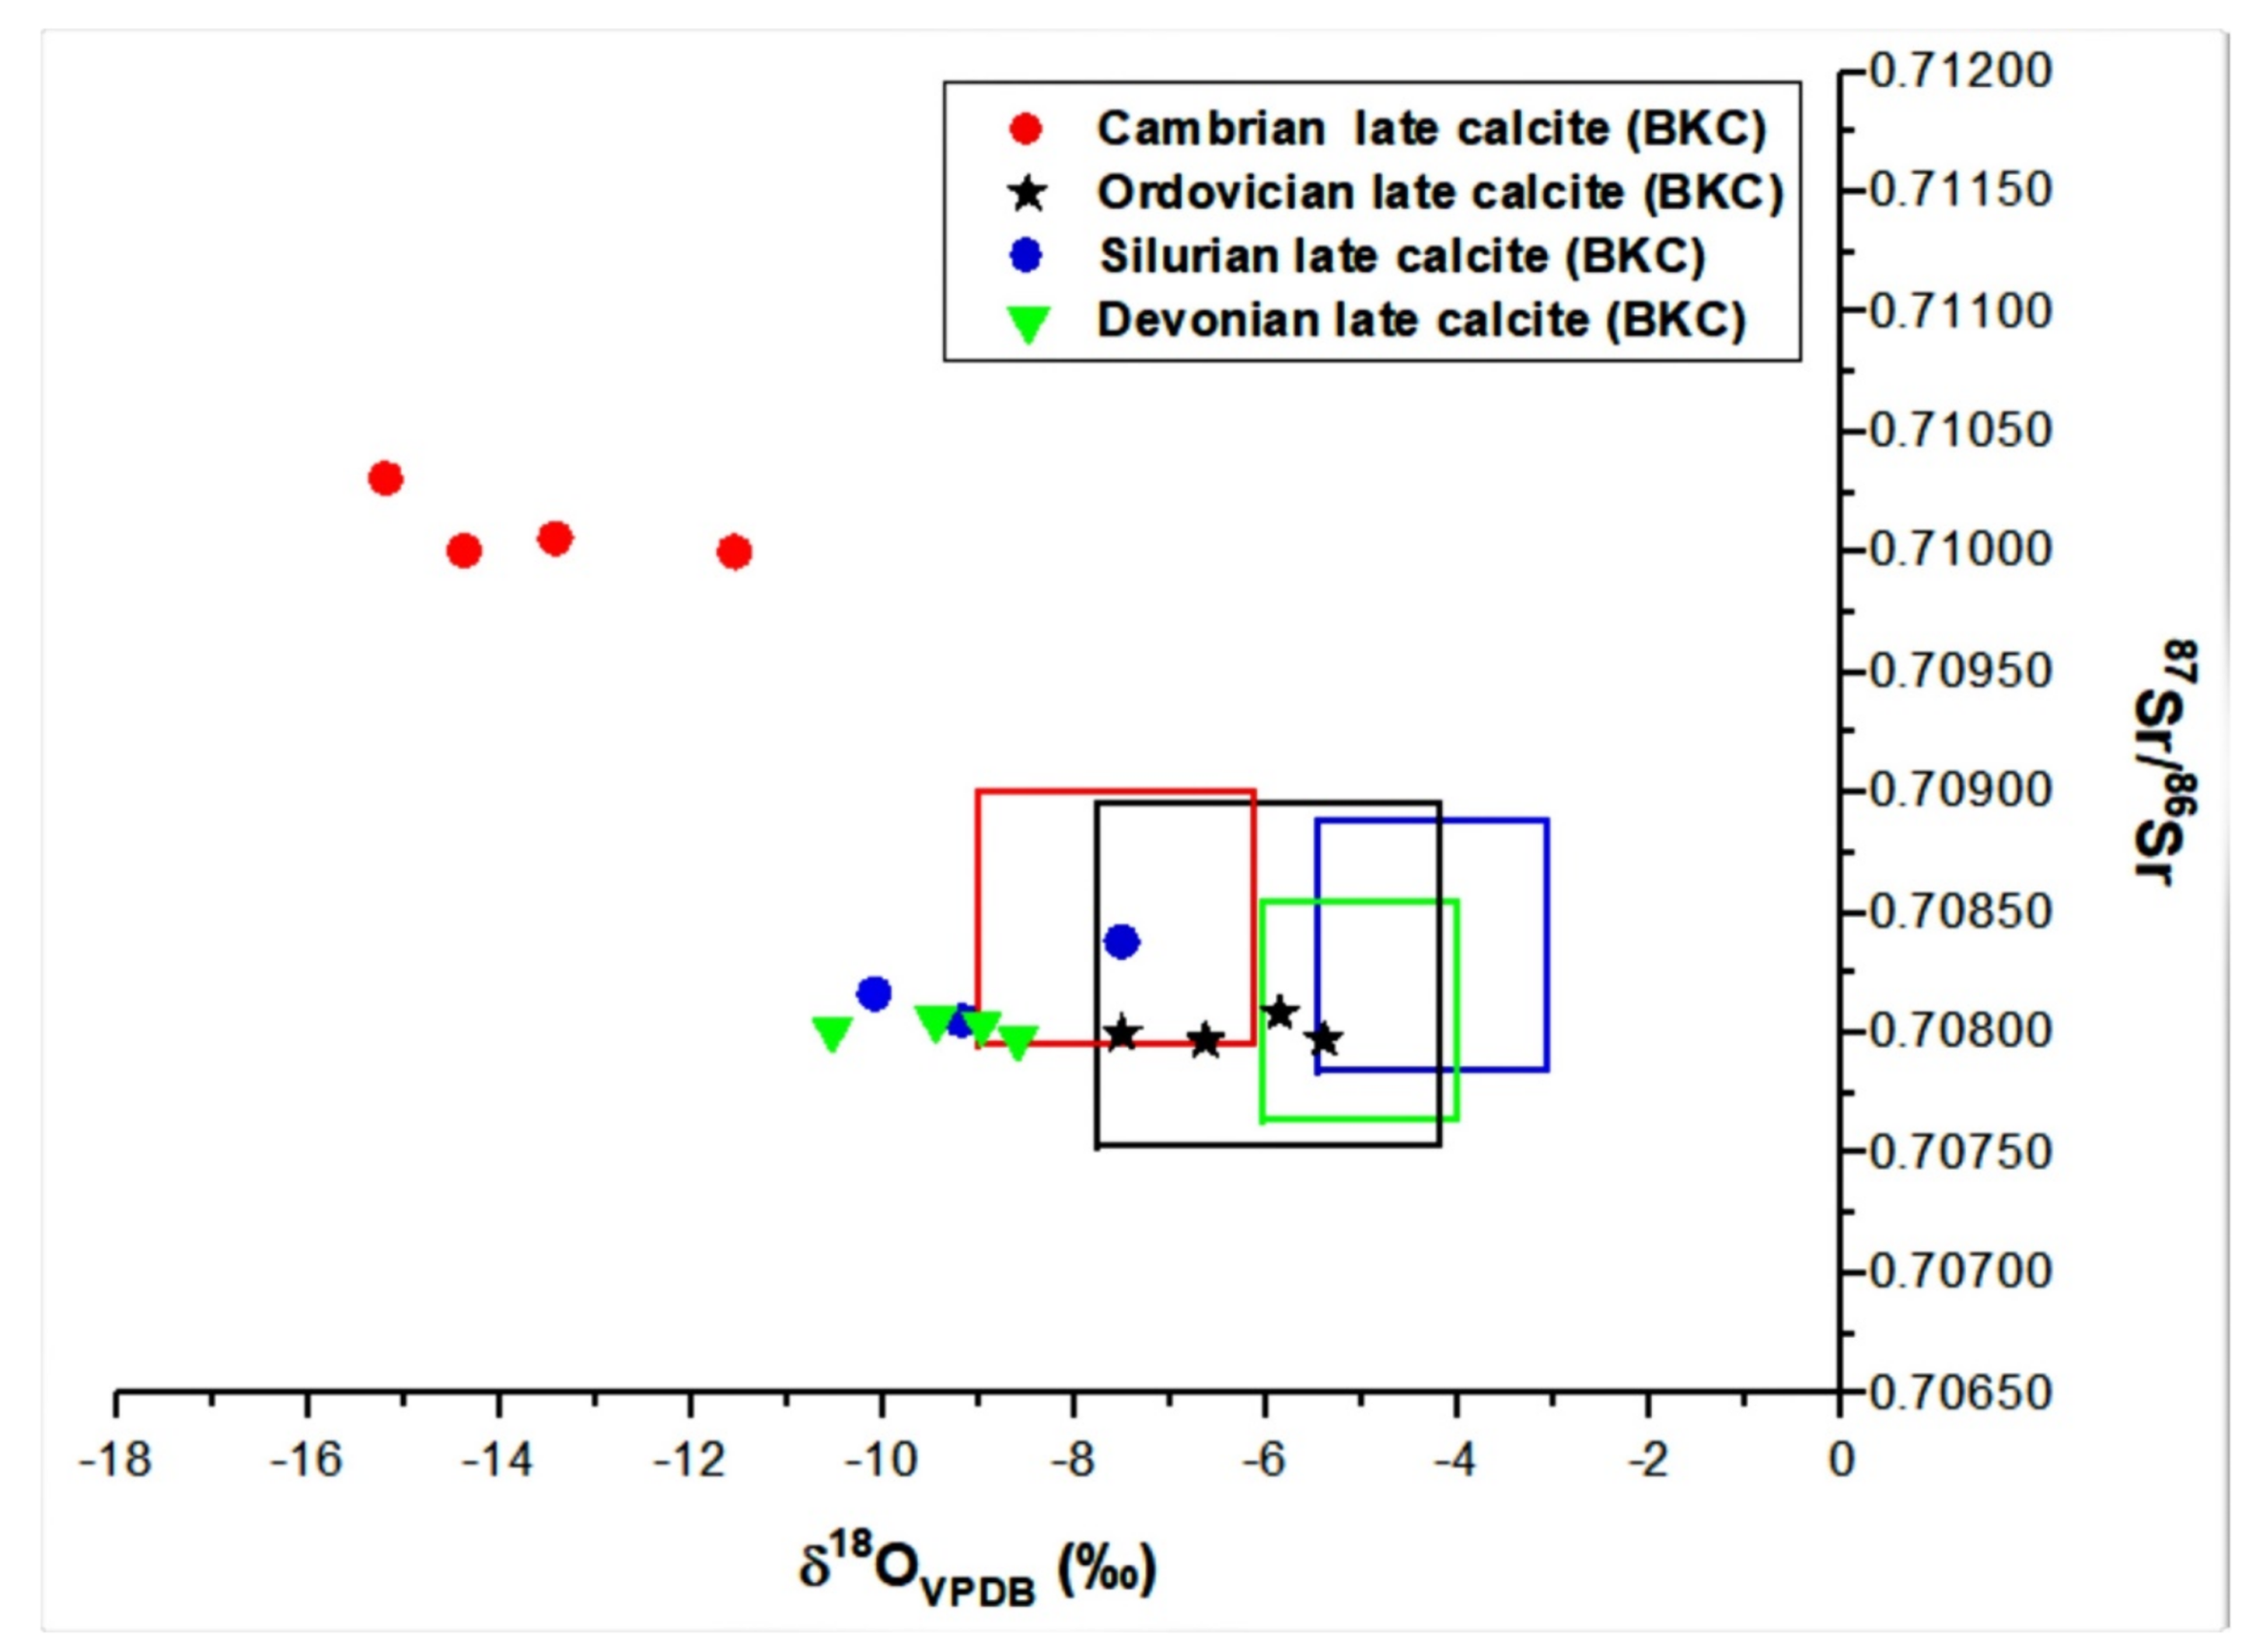
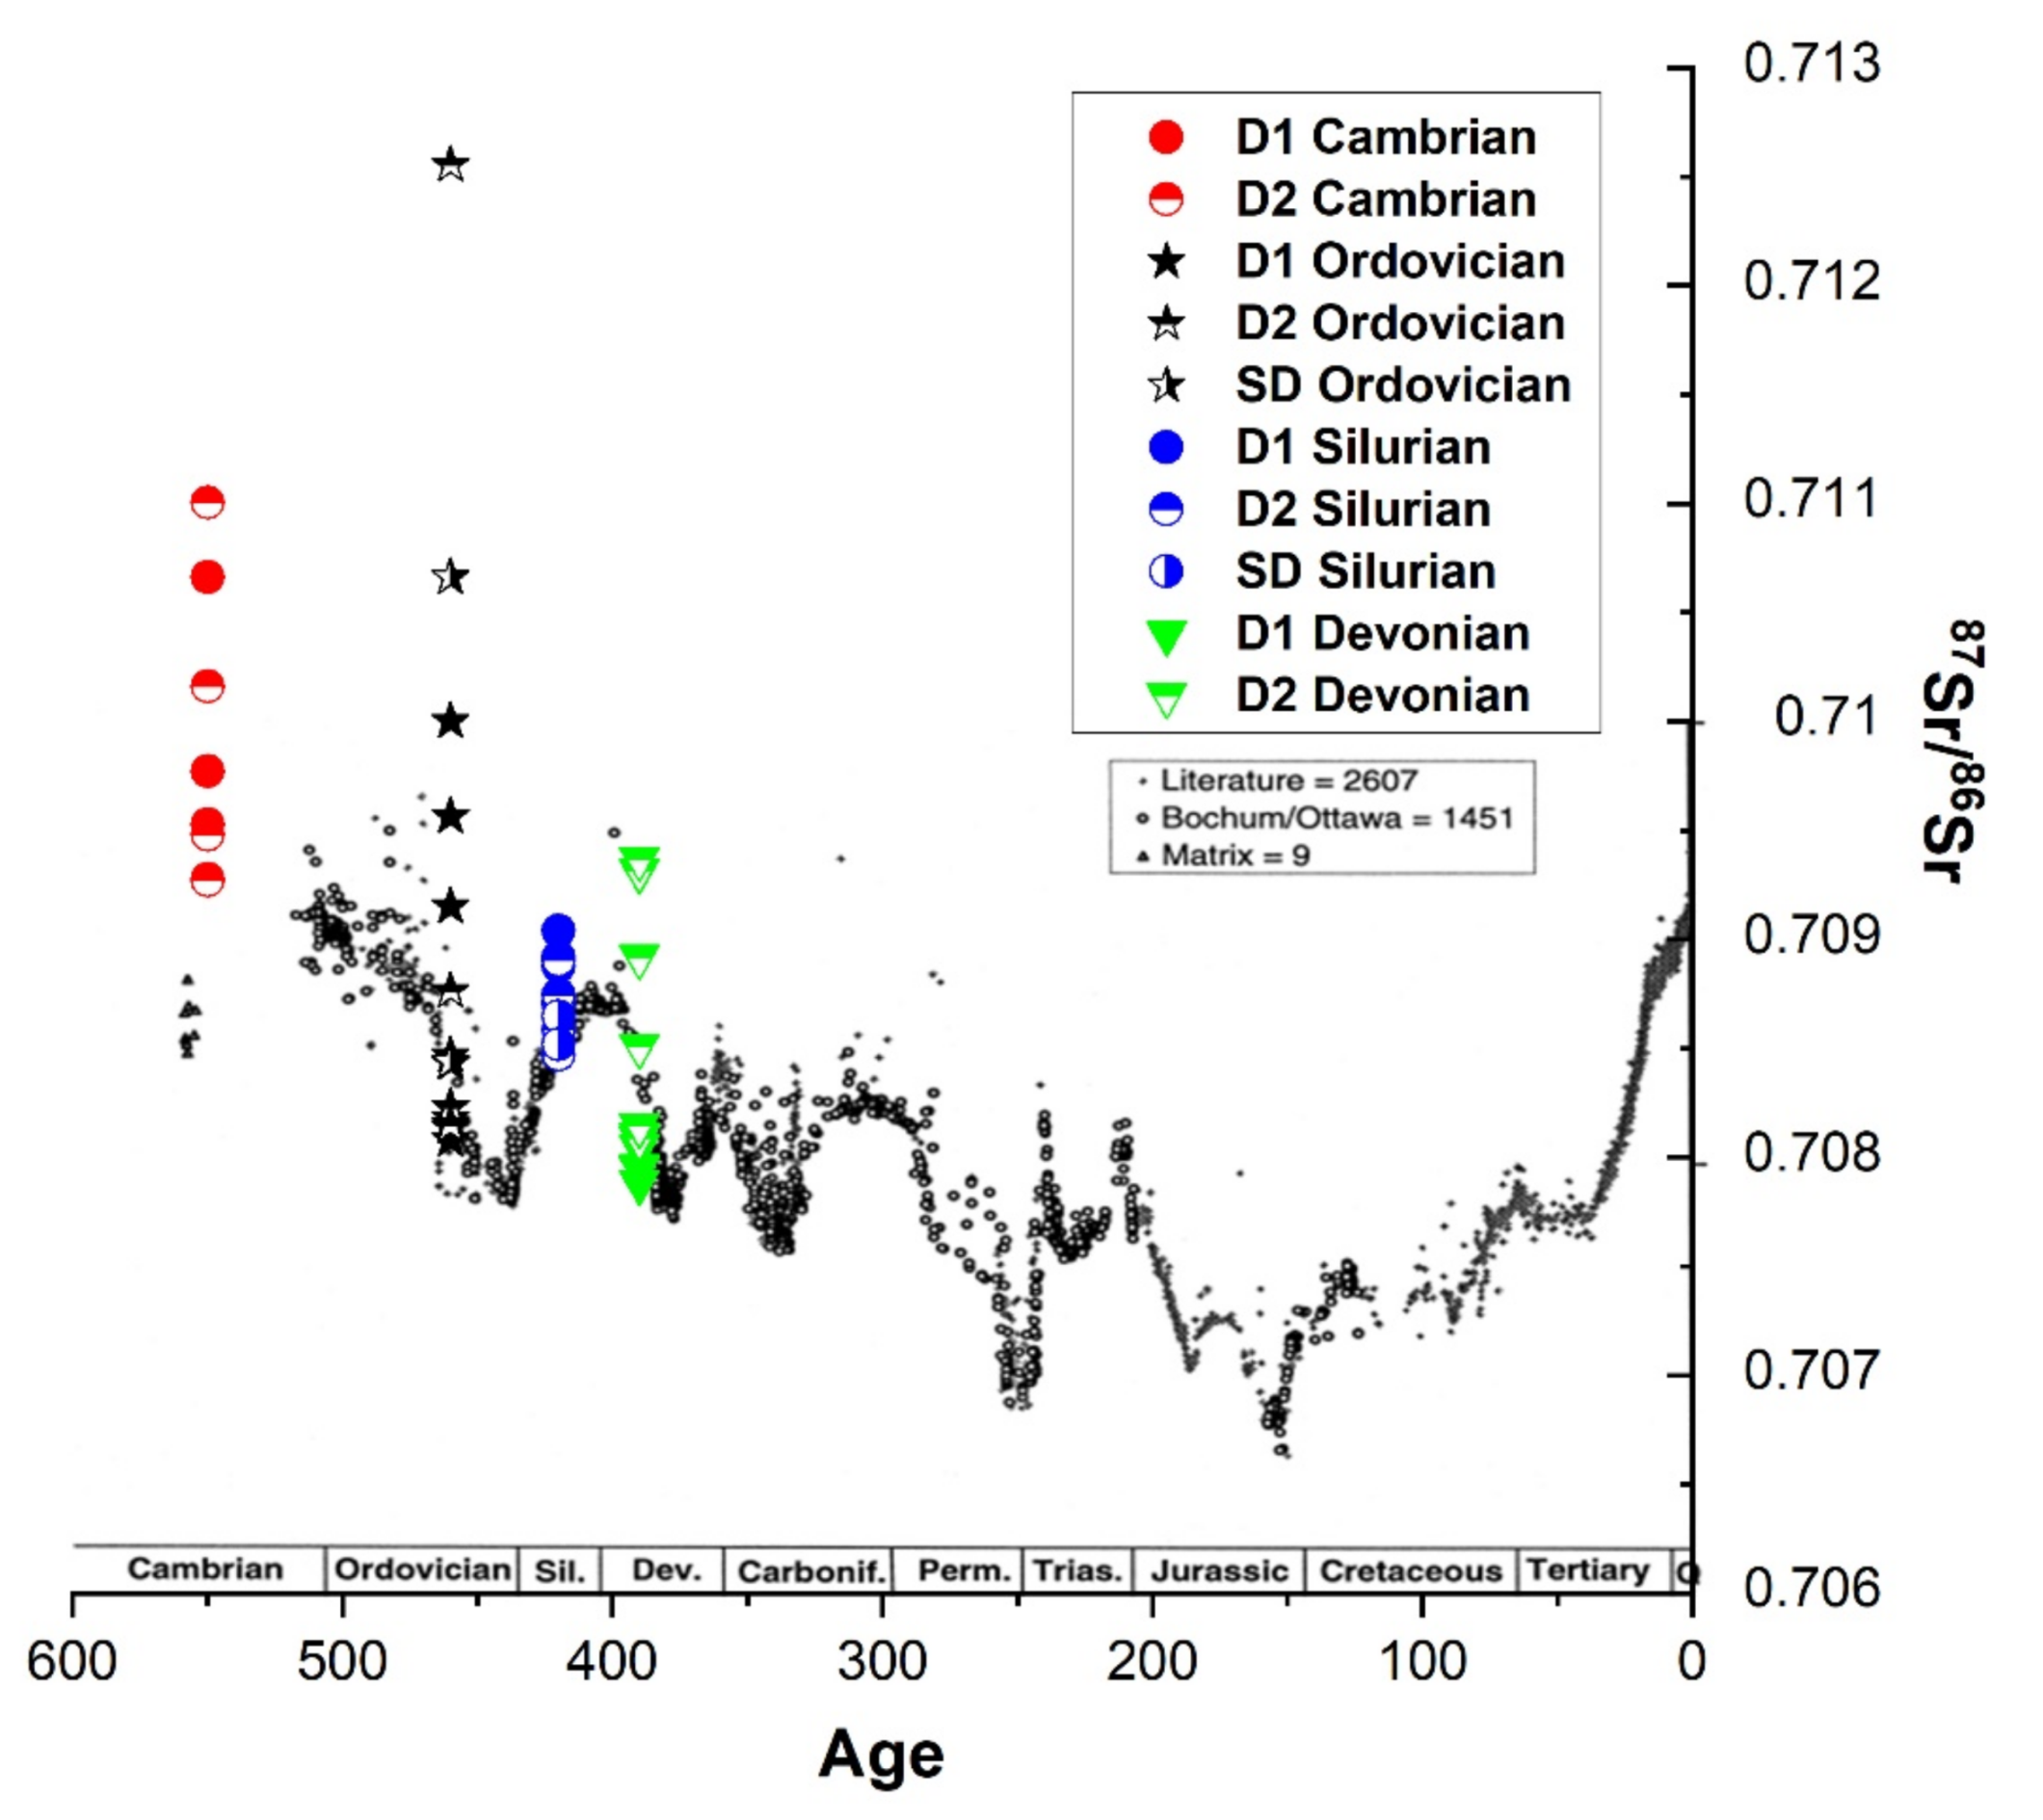
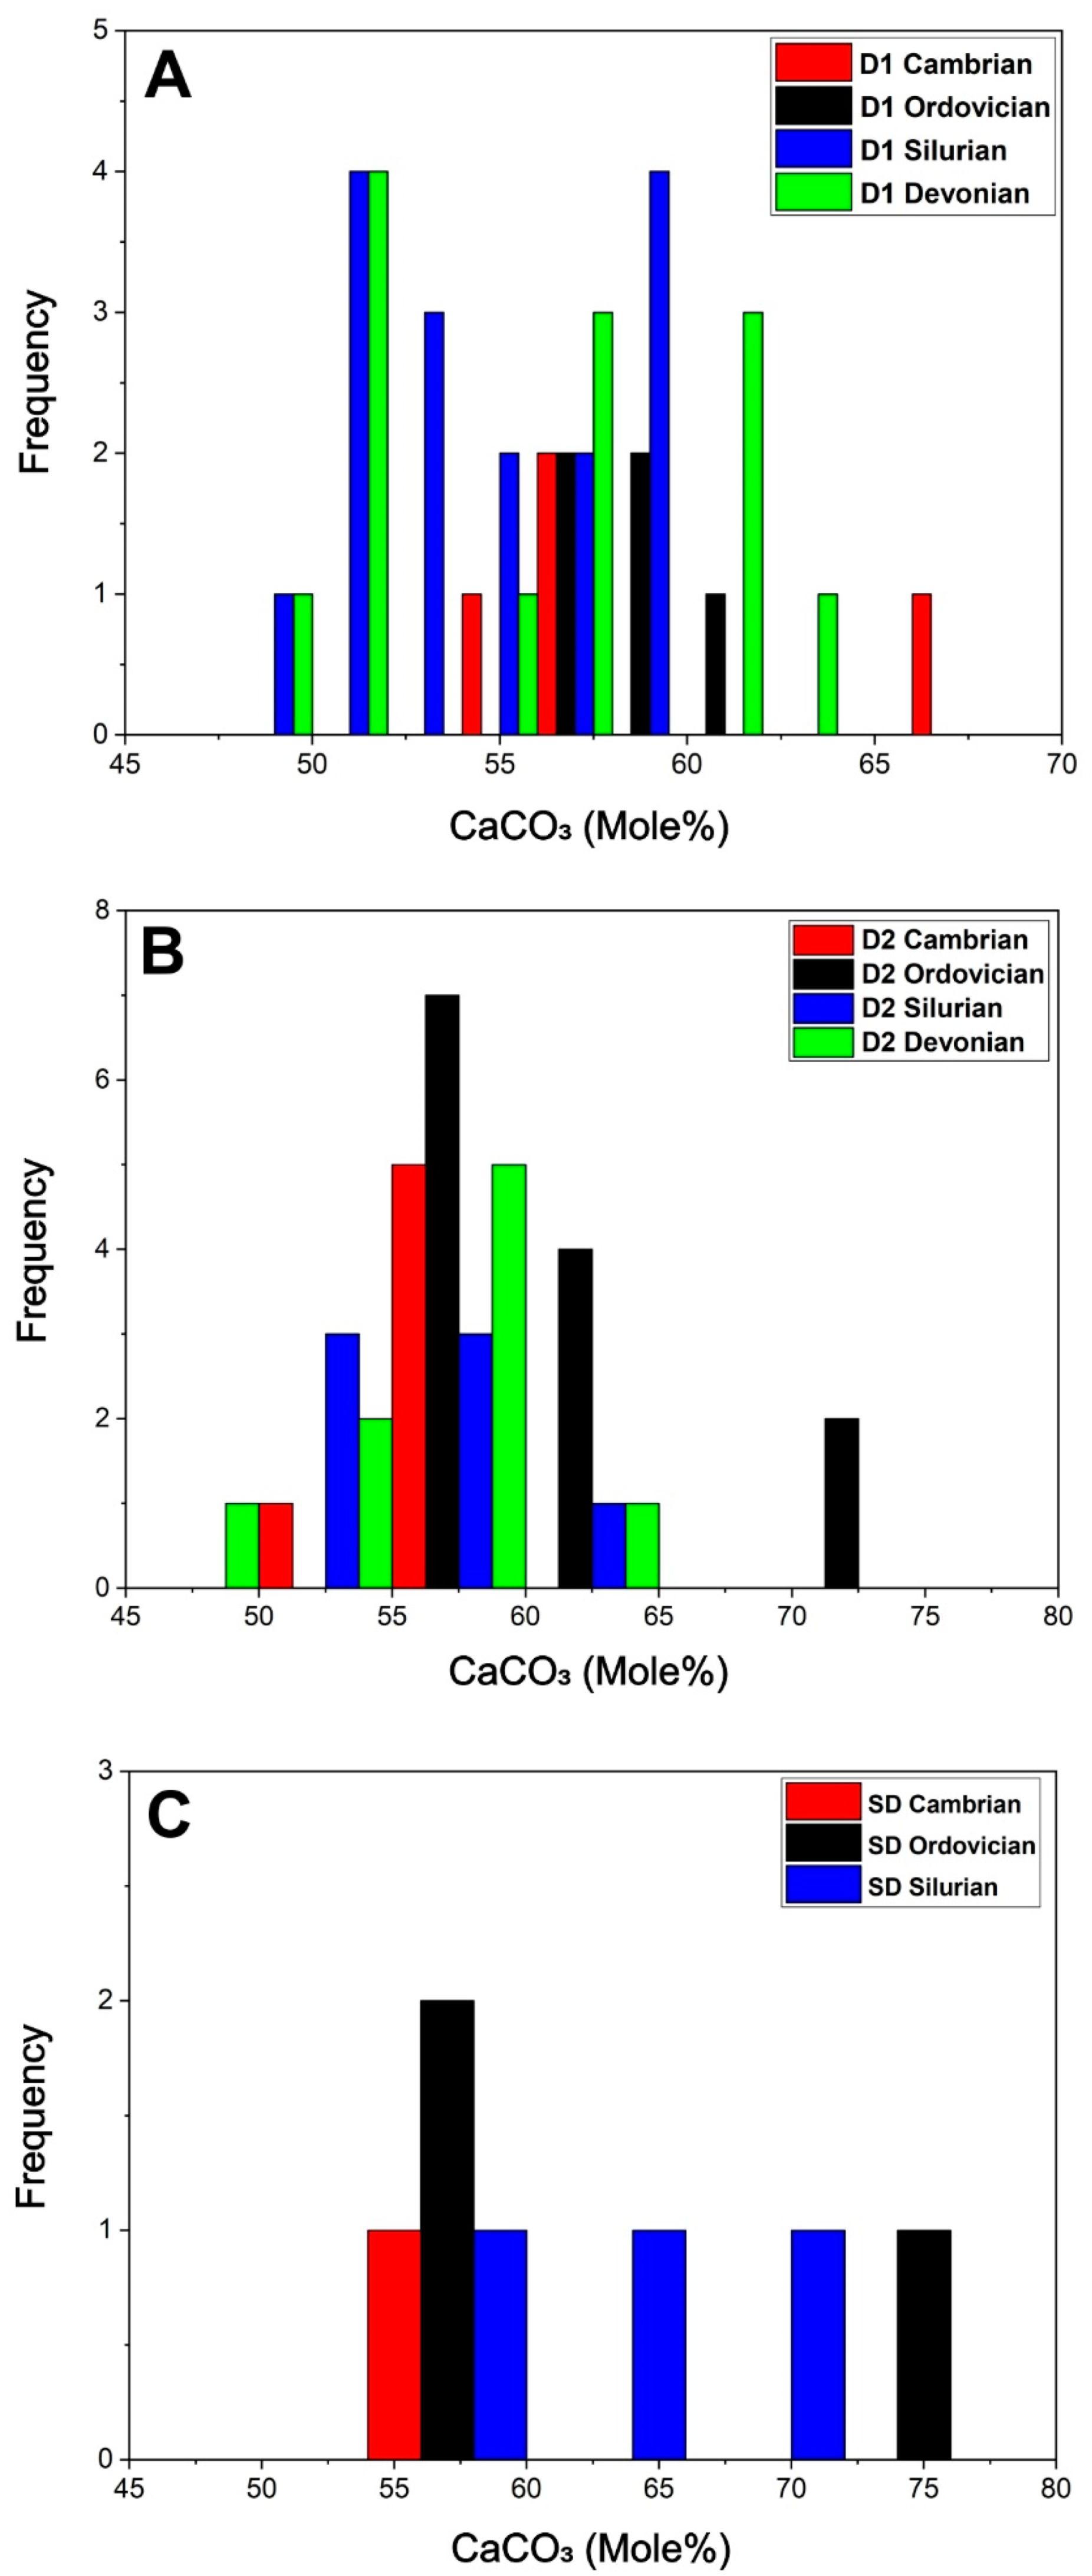
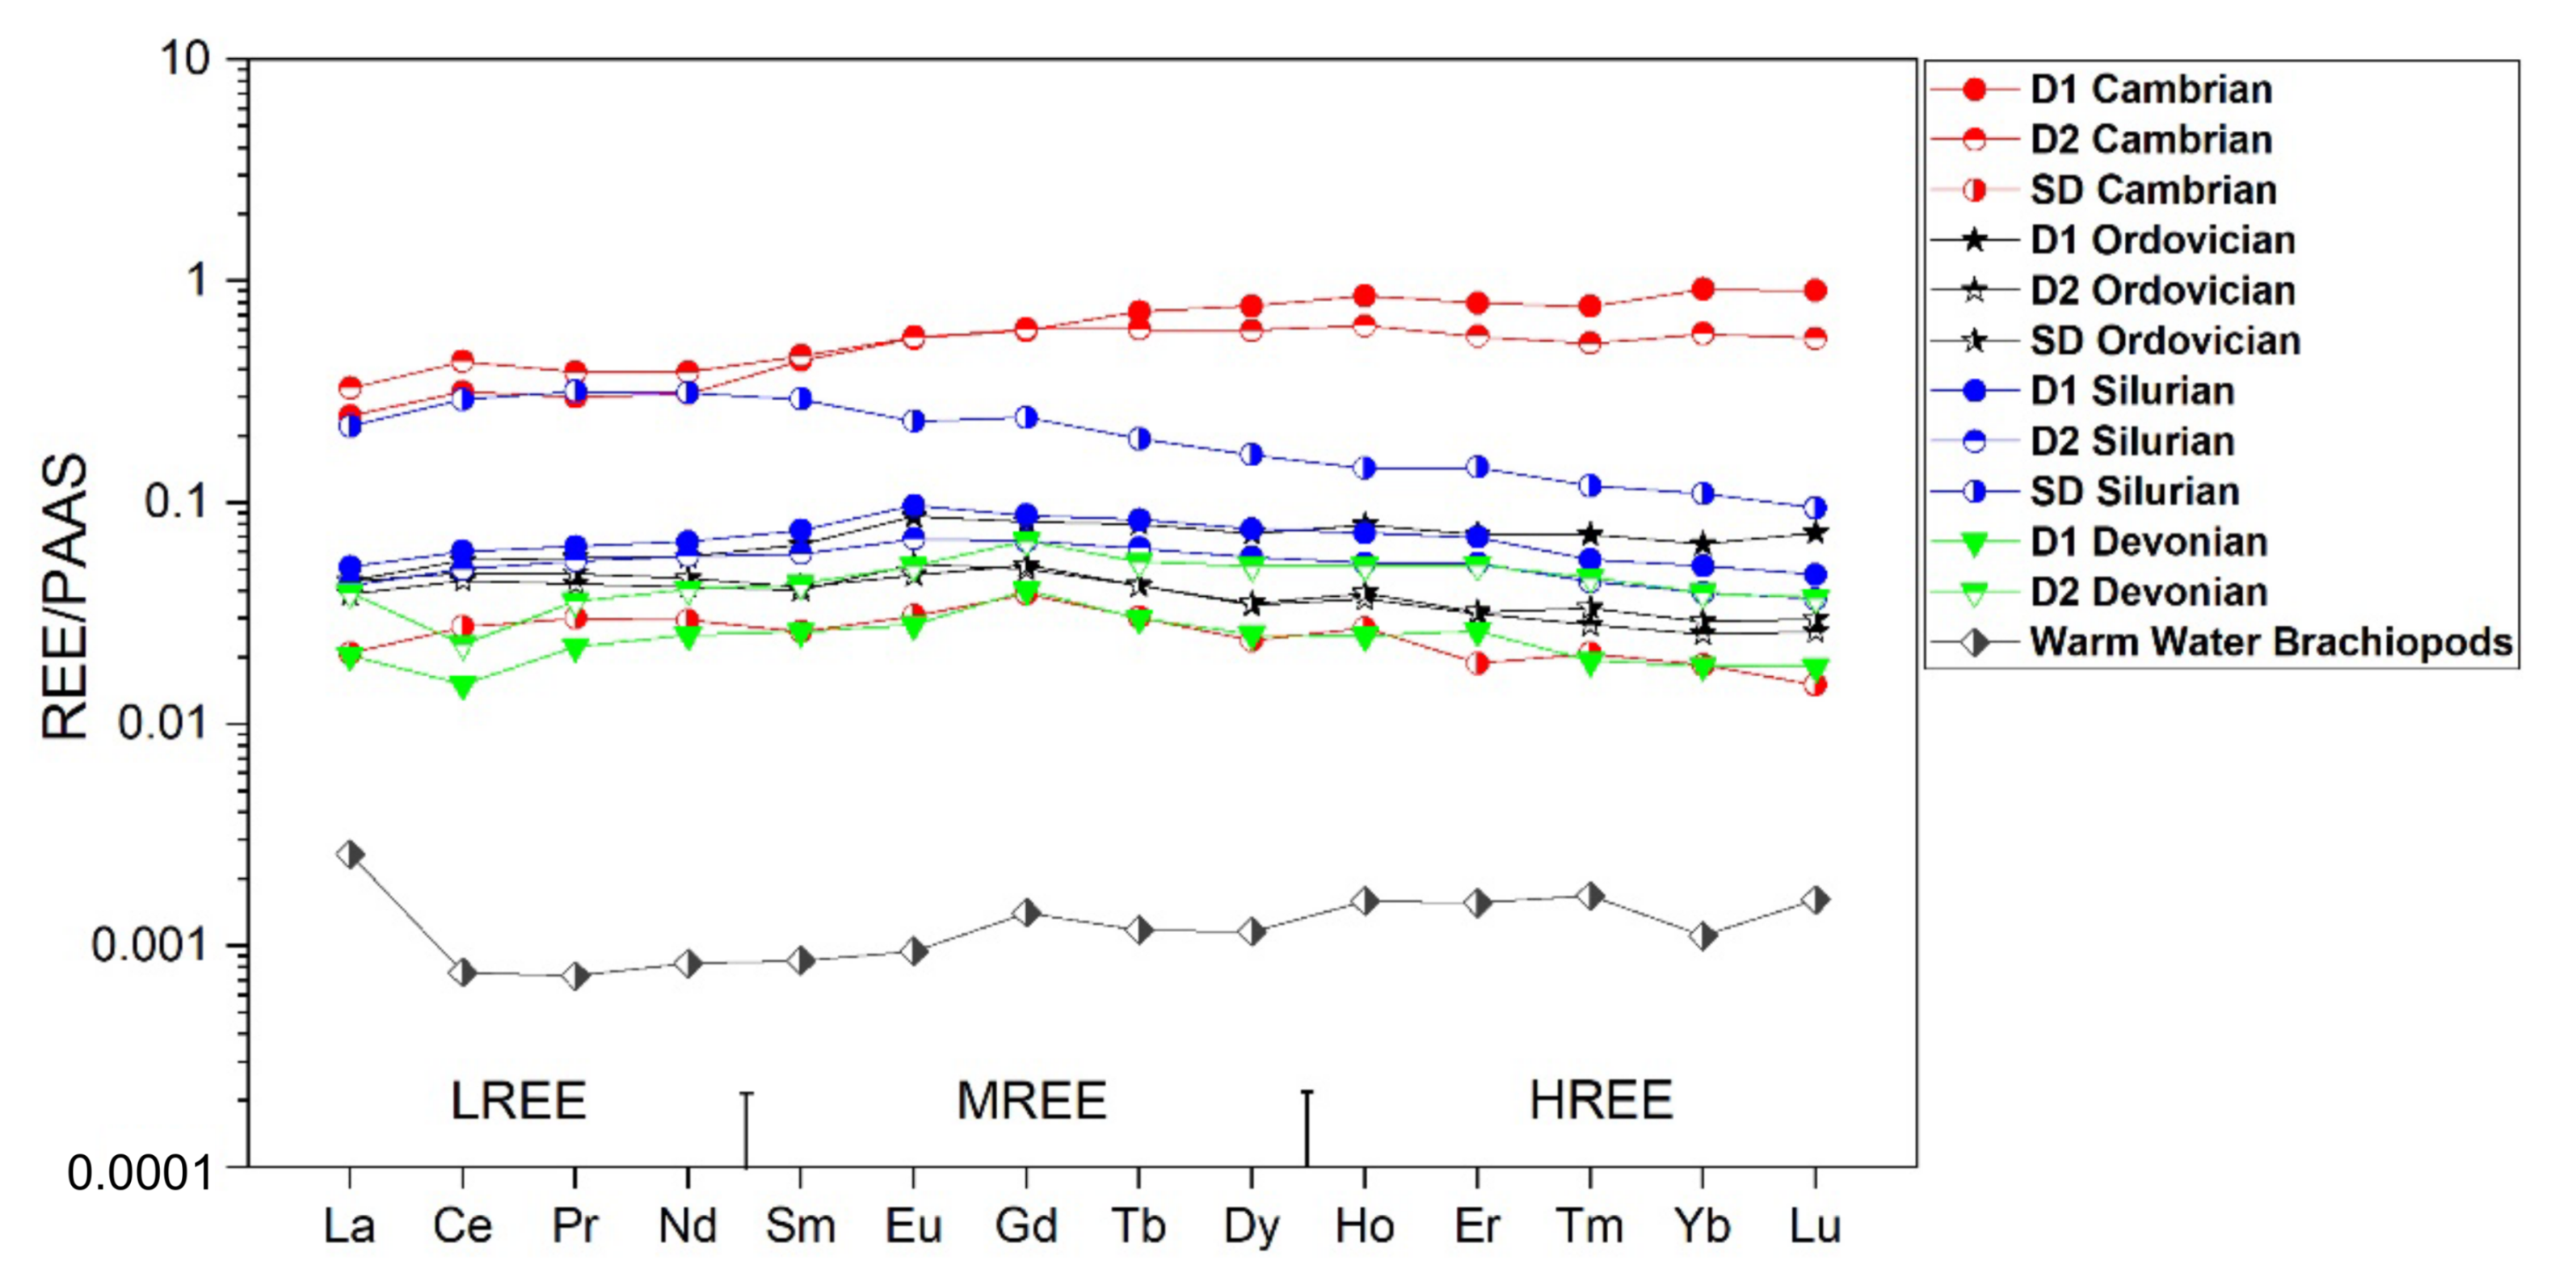
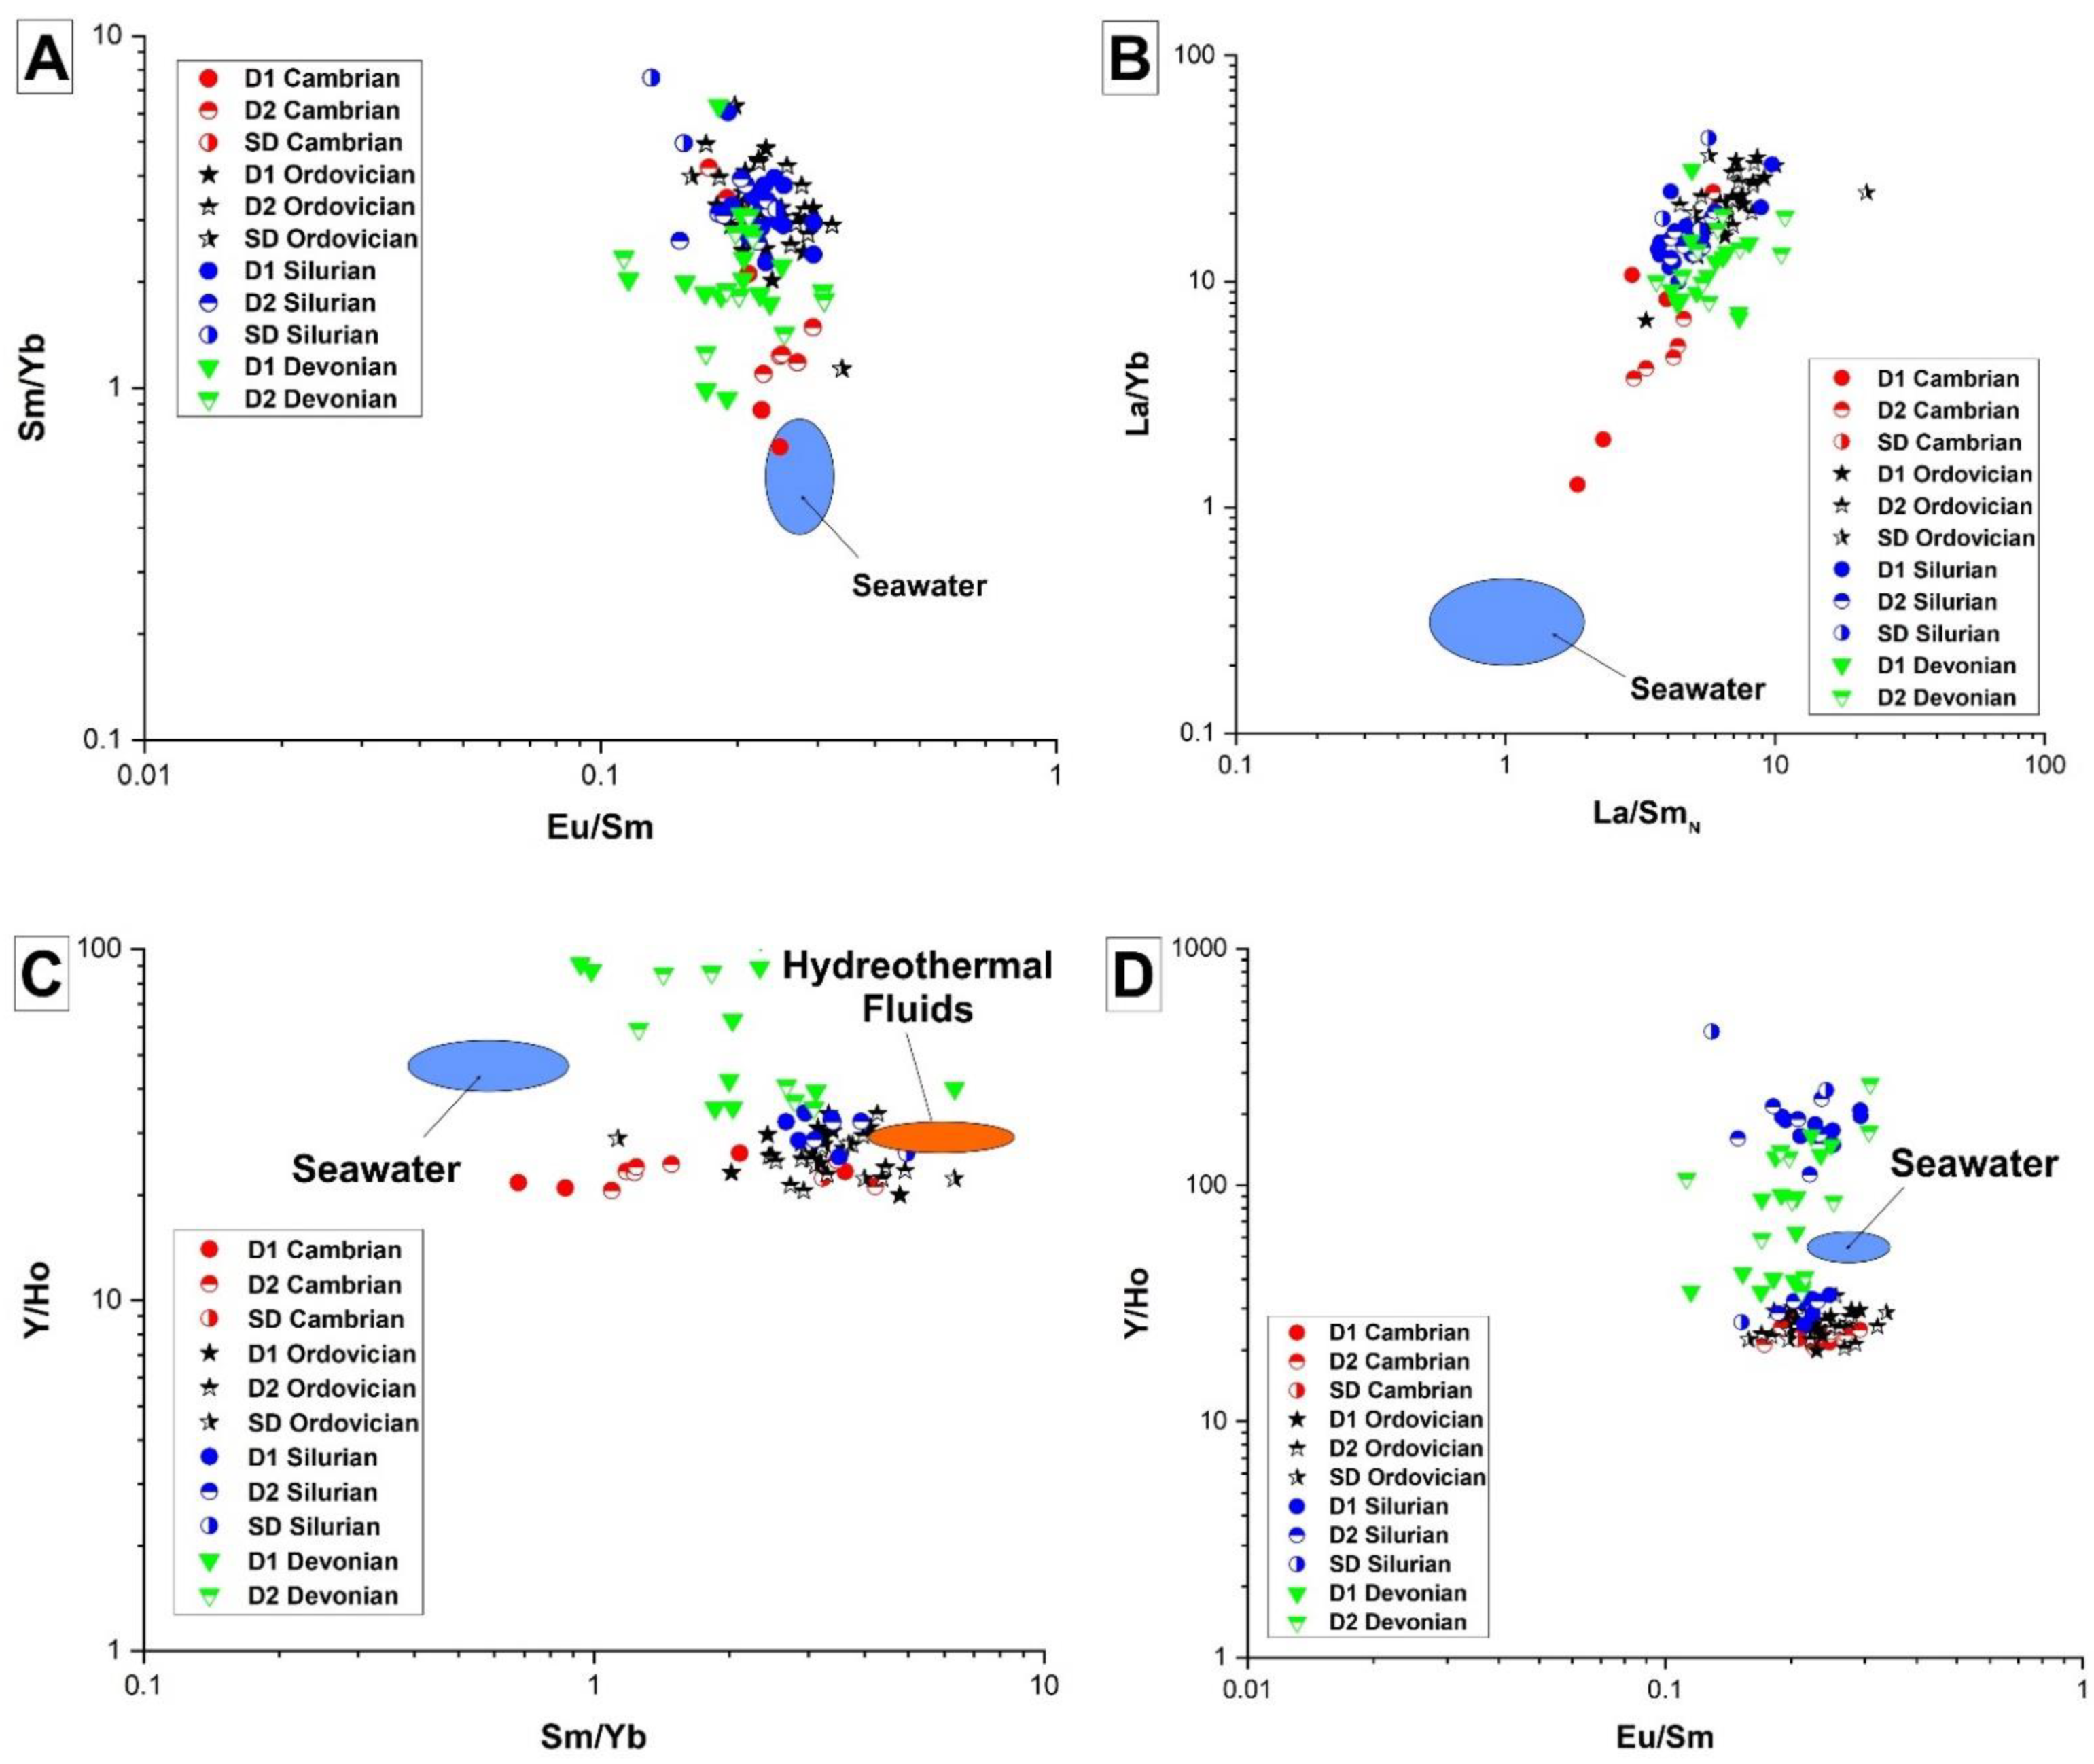
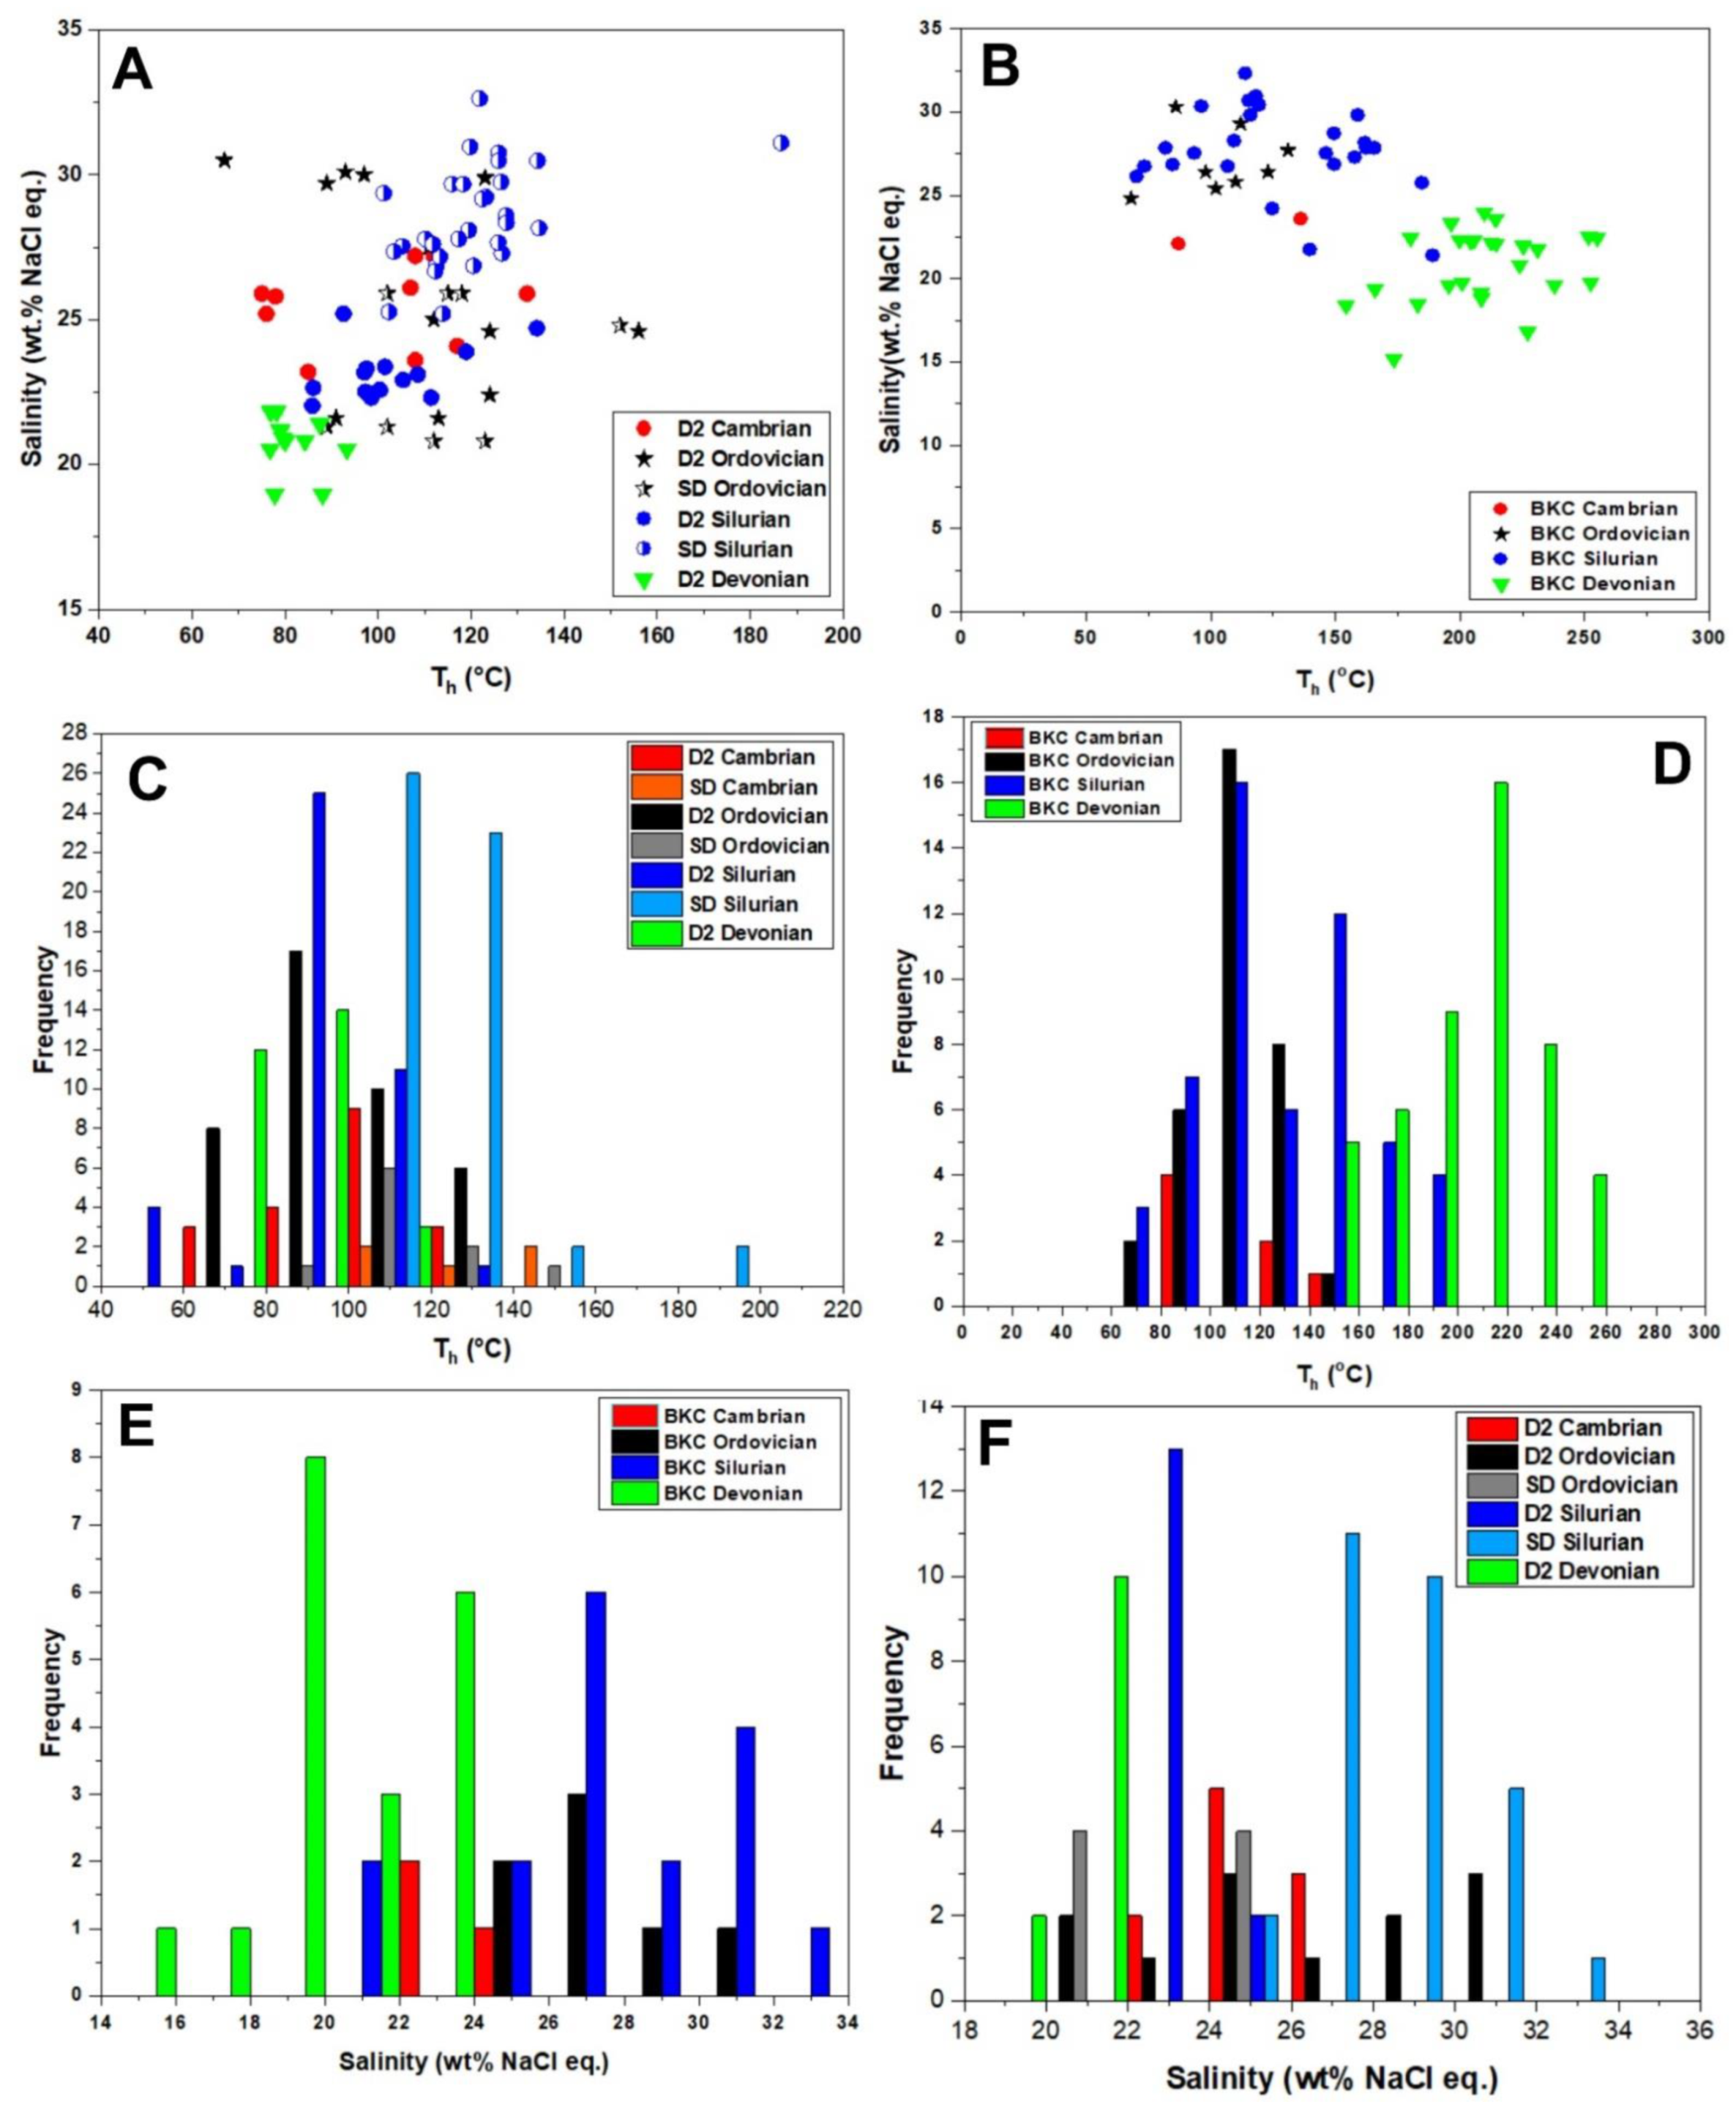
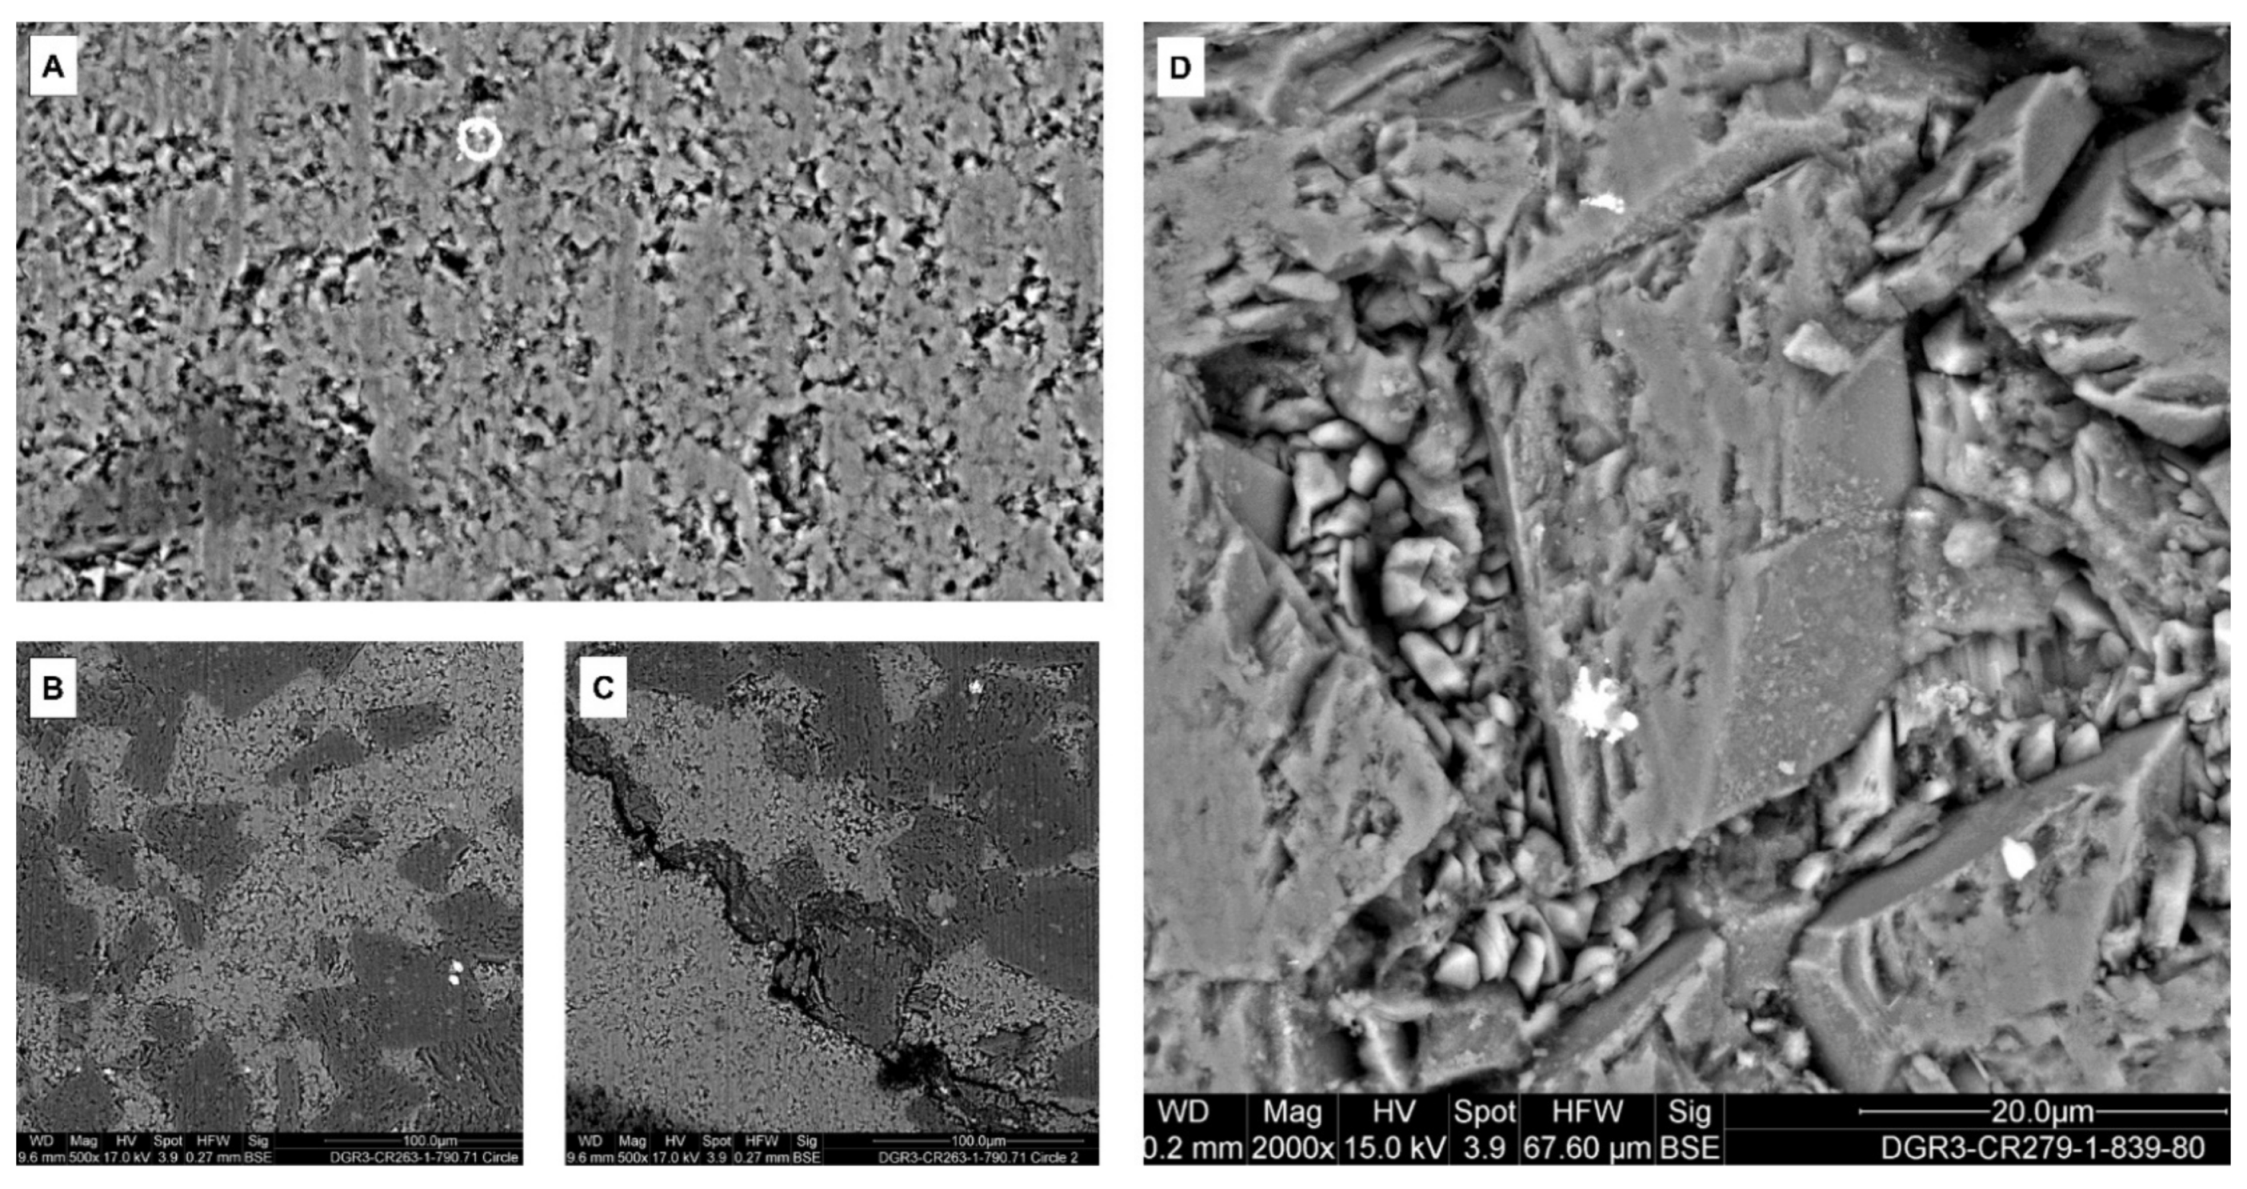
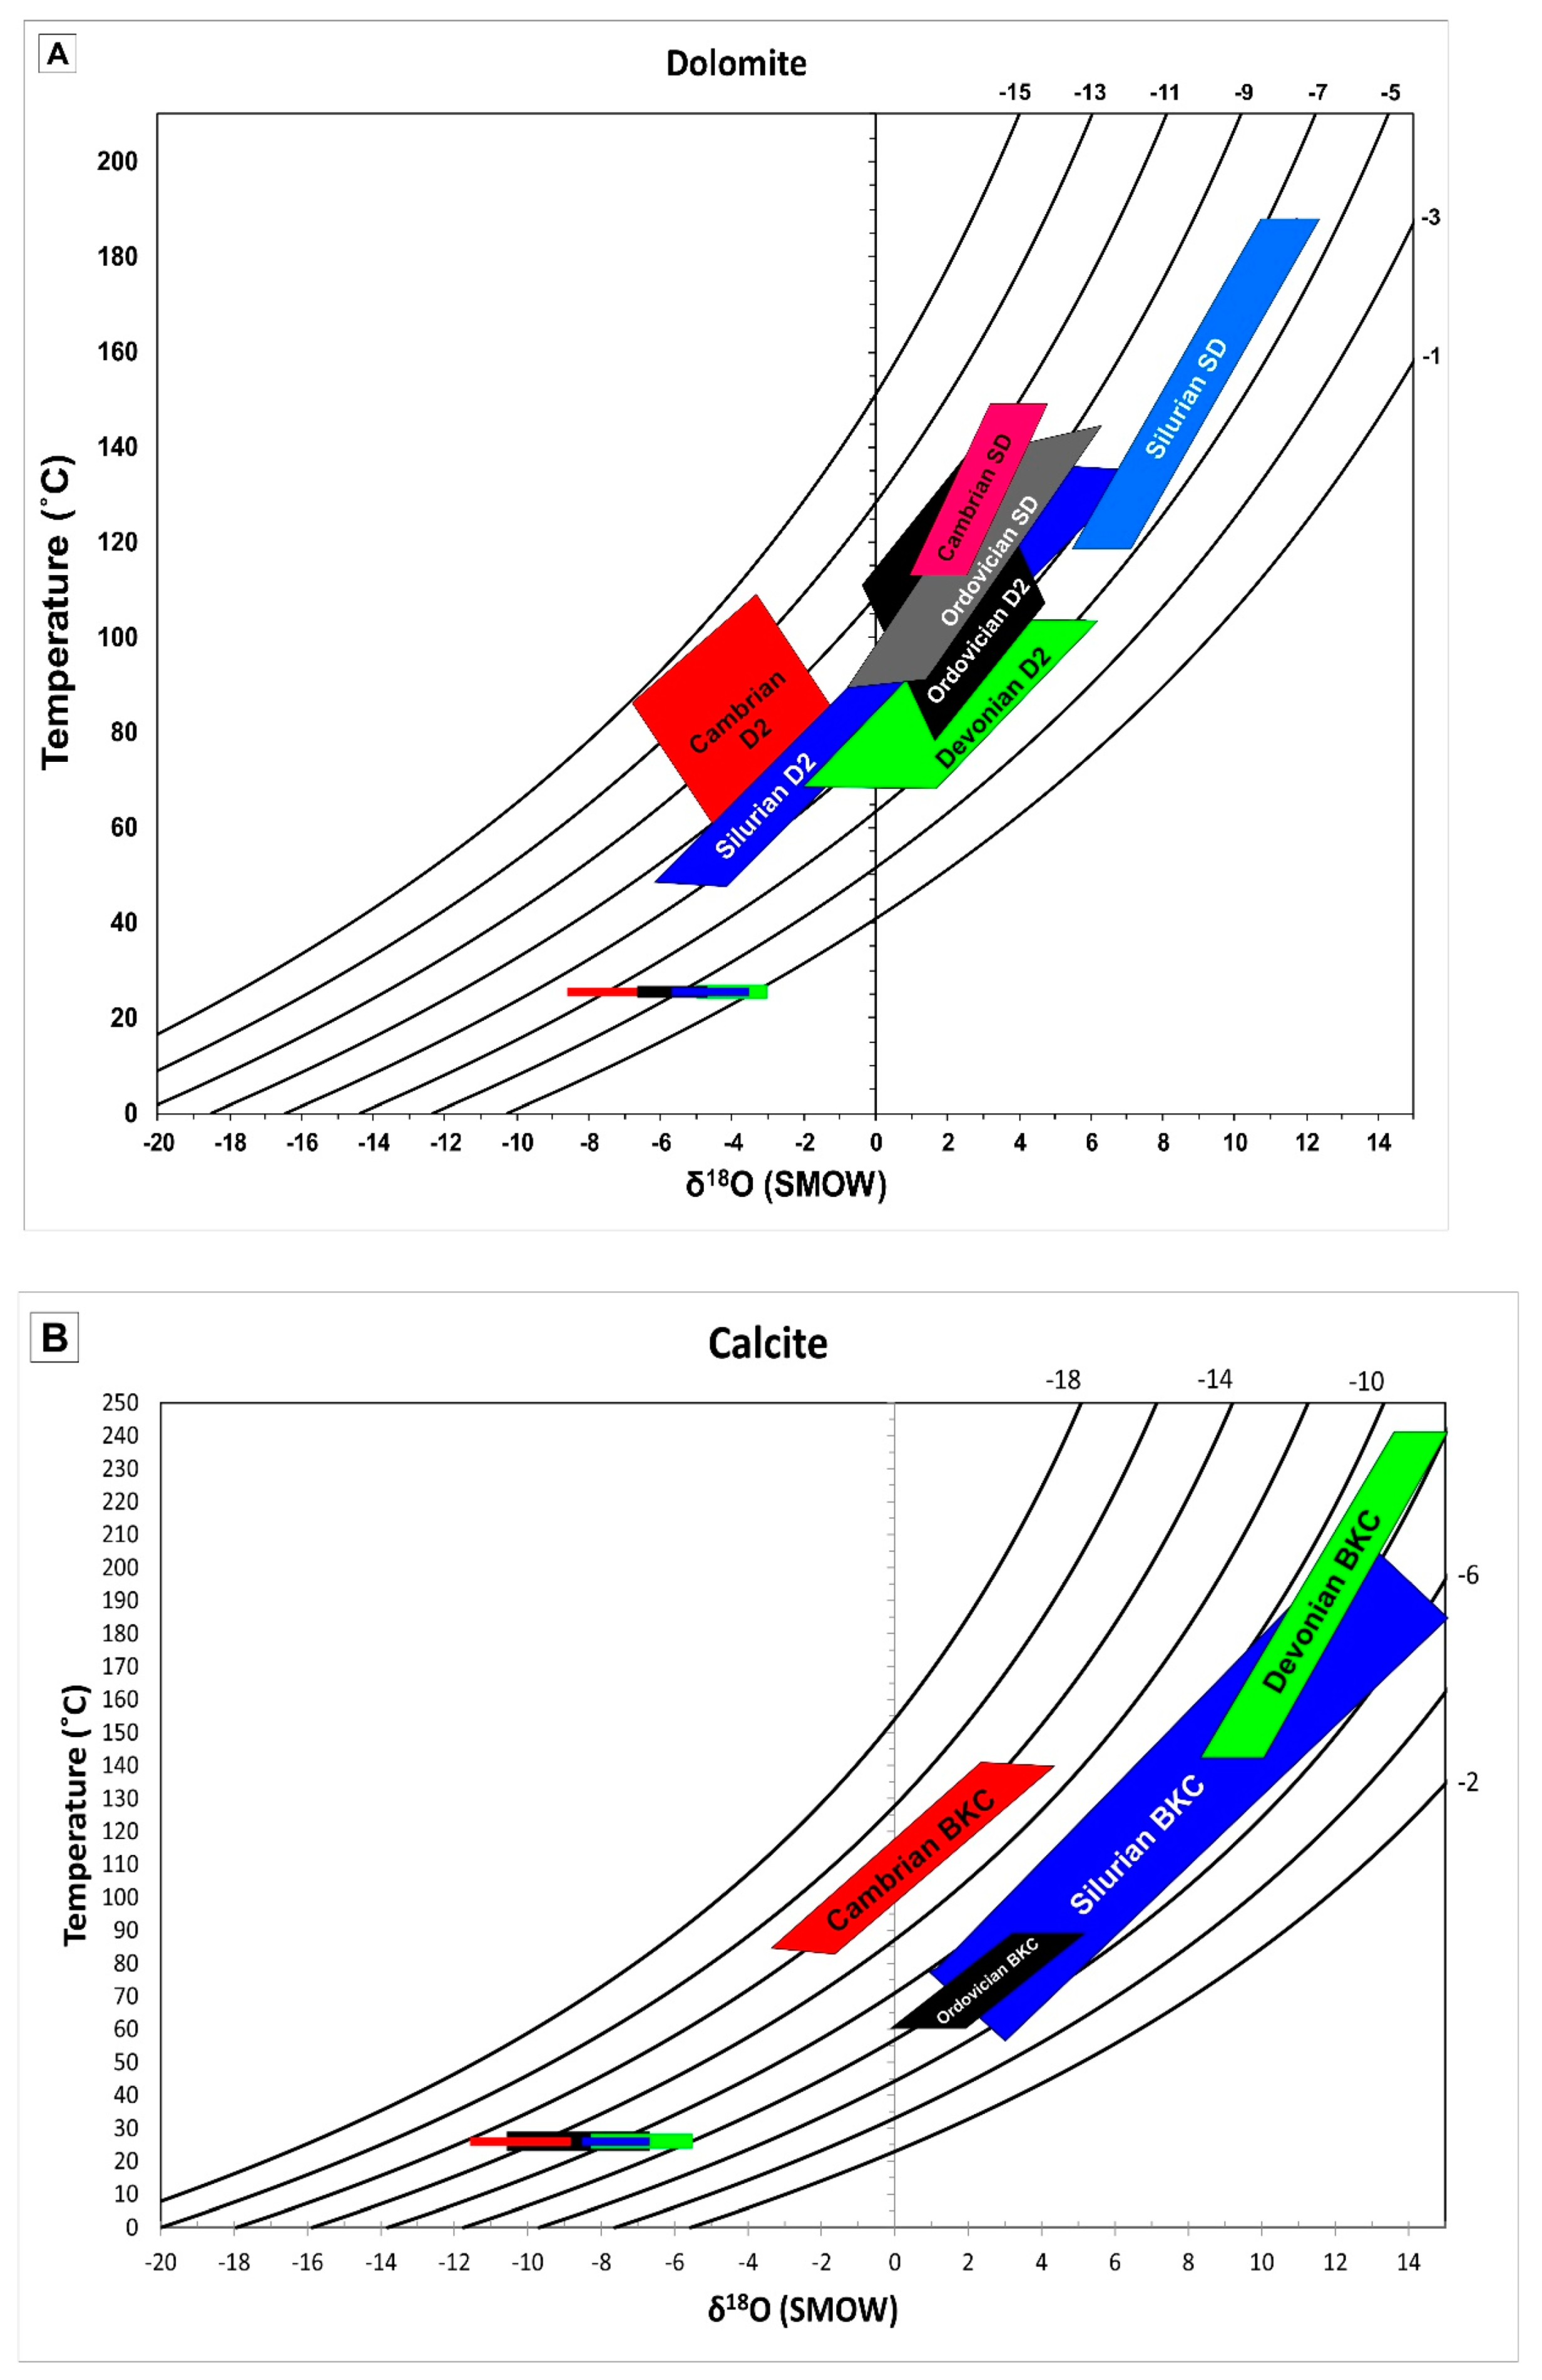
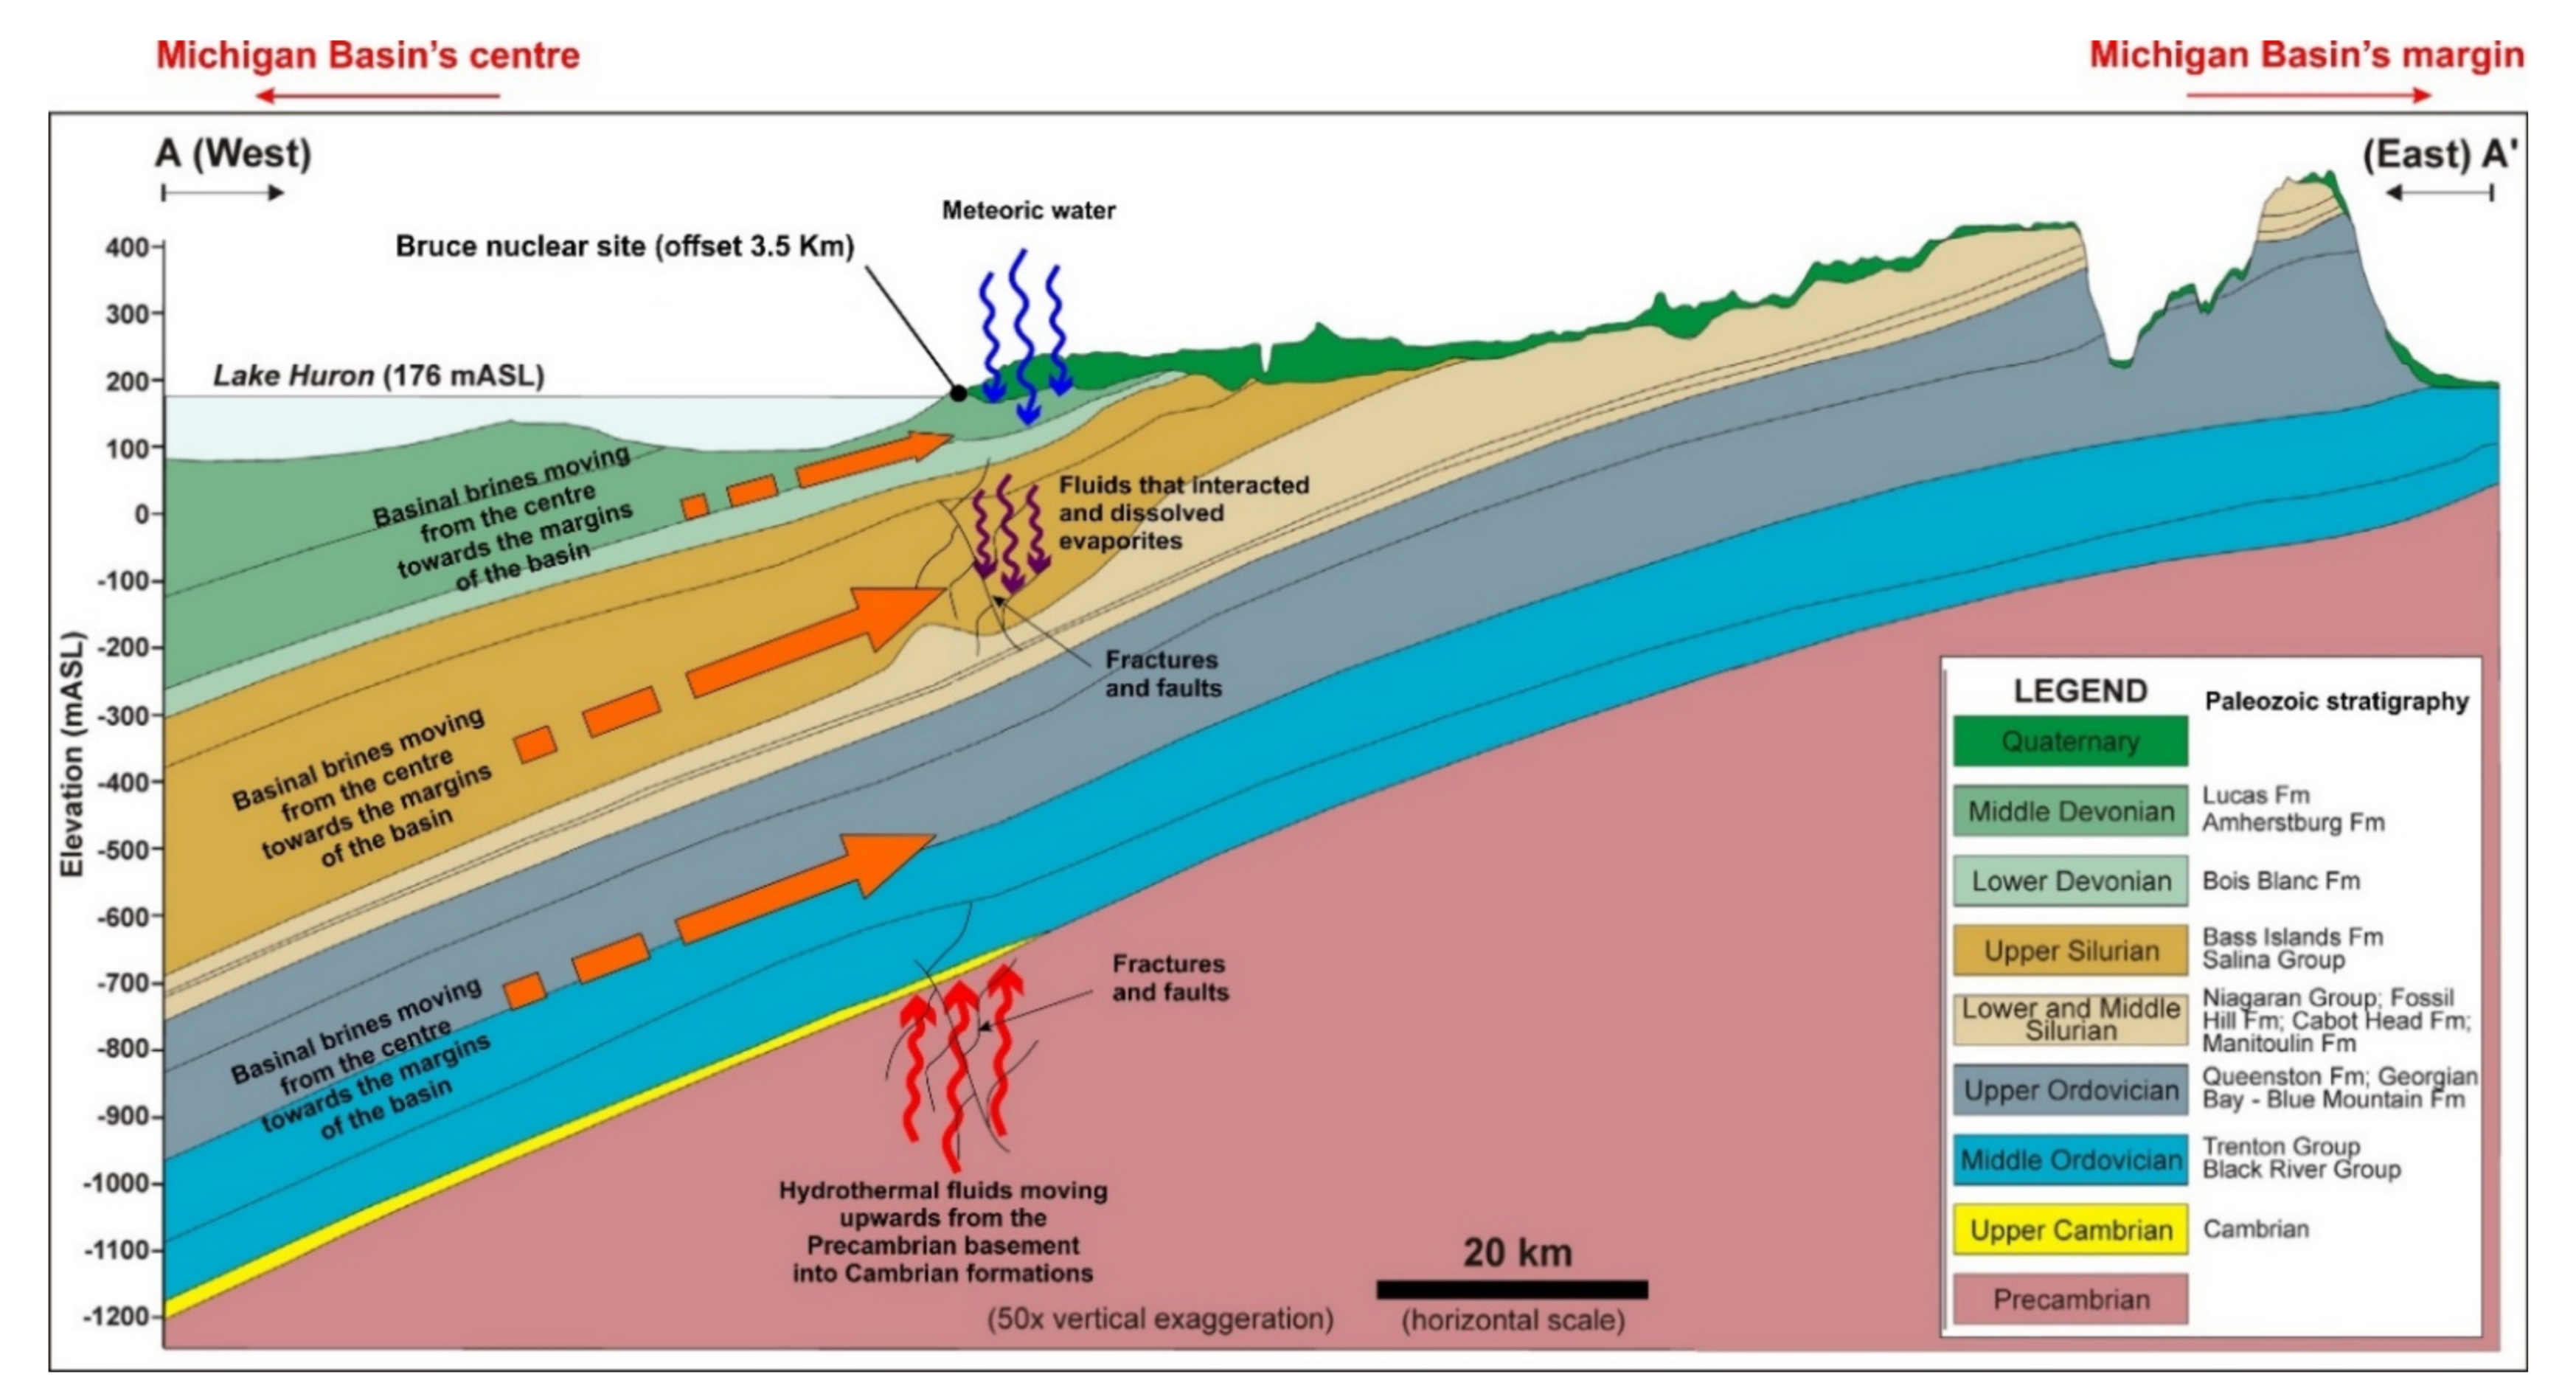
Table 1.
Summary of the main petrographic characteristics of the main diagenetic minerals in the Paleozoic successions.
Table 1.
Summary of the main petrographic characteristics of the main diagenetic minerals in the Paleozoic successions.
| Age | Mineral | Description | Texture | Size | Luminescence |
|---|---|---|---|---|---|
| Cambrian | D1 | Non-ferroan replacive microcrystalline dolomite matrix | Planar-s | <50 μm | Dull red |
| Cambrian | D2 | Non-ferroan medium crystalline dolomite matrix | Planar-s | >50 μm up to 500 μm | Dull red/bright |
| Cambrian | SD | Minor coarse crystalline saddle dolomite cement filling vugs | Curved crystal faces and undulose extinction | >500 μm | Dull/non-luminescent |
| Cambrian | BKC | Non ferroan/ferroan calcite cement mainly filling fractures and voids | Blocky/equant | 200 μm to >500 μm | Red/bright orange |
| Ordovician | D1 | Non-ferroan replacive microcrystalline dolomite matrix | Non-planar to planar-s | 25–50 μm | Dull red |
| Ordovician | D2 | Non-ferroan medium crystalline, partly zoned dolomite matrix | Planar e/planar-s | >50 μm up to 500 μm | Dull red |
| Ordovician | SD | Minor coarse crystalline saddle dolomite cement filling vugs | Curved crystal faces and undulose extinction | >500 μm | Dull/non-luminescent |
| Ordovician | SXC | Ferroan syntaxial calcite overgrowth cement around echinoderm fragments | 100 μm to >500 μm | Bright red | |
| Ordovician | BKC | Non ferroan/ferroan calcite cement mainly filling fractures and voids | Blocky/equant | 200 μm to >500 μm | Red/bright Orange, zoned |
| Silurian | D1 | Non-ferroan pervasive replacive micro to fine crystalline dolomite matrix | Non-planar to planar-s | <50 μm | Dull red/bright |
| Silurian | D2 | Non-ferroan pervasive replacive medium to coarse crystalline dolomite matrix | Planar-e/planar-s | >50 μm up to 150 μm | Dull red/non-luminescent |
| Silurian | D2 (Dissolution seams) | Selective replacive medium crystalline dolomite matrix (commonly associated with dissolution seams) | Planar-e | >50 μm up to 150 μm | Dull red |
| Silurian | SD | Ferroan coarse crystalline saddle dolomite cement filling fractures and vugs | Curved crystal faces and undulose extinction | >500 μm | Dull/non-luminescent |
| Silurian | ISC | Non-ferroan isopachous calcite cement rimming coated grains | bladed | 50–100 μm | Dull red |
| Silurian | SXC | Ferroan syntaxial calcite overgrowth cement around echinoderm fragments | - | 100 μm to >500 μm | Bright red |
| Silurian | DC | Ferroan void-filling and pore-lining cement in intergranular and intraskeletal pores, molds and fractures | Equant to elongate, anhedral to subhedral | 75–250 μm Size increase towards the center | Dull red |
| Silurian | BKC | Non ferroan/ferroan calcite cement mainly filling fractures and voids | blocky | 200 μm to >500 μm | Red/bright orange zoned |
| Devonian | D1 | Non-ferroan pervasive replacive micro to fine crystalline matrix dolomite | Non-planar to planar-s | <50 μm | Dull/red |
| Devonian | D2 | Non-ferroan pervasive replacive medium crystalline matrix dolomite | Planar-e/planar-s | >50 μm up to 100 μm | Dull/non-luminescent |
| Devonian | D2 (Dissolution seams) | Non-feroan selective replacive medium crystalline dolomite matrix (commonly associated with dissolution seams) | Planar-e | >50 μm up to 100 μm | Red/bright |
| Devonian | SXC | Non-ferroan syntaxial calcite overgrowth cement | - | 100 μm to >500 μm | Non-luminescent |
| Devonian | DTC | Non-ferroan dogtooth calcite cement growing normal to the substrate (mainly skeletal grains) | Elongate scalenohedral or rhombohedral | 50 μm | Red/bright mostly zoned |
| Devonian | DC | Non-ferroan void-filling and pore-lining cement in intergranular and intraskeletal pores, molds and fractures | Equant to elongate, anhedral to subhedral | 75–250 μm Size increase towards the center | Dull red to bright, zoned in most cases |
| Devonian | BKC | Non-ferroan calcite cement mainly filling fractures and voids | blocky | 200 μm to >500 μm | Red/bright zoned |
Table 2.
Summary of the isotopic composition of dolomite and calcite components in the studied successions.
Table 2.
Summary of the isotopic composition of dolomite and calcite components in the studied successions.
| Age | Phase | δ13C VPDB (‰) | δ18O VPDB (‰) | 87Sr/86Sr |
|---|---|---|---|---|
| Cambrian | D1 | |||
| n. | 8 | 8 | 5 | |
| Avg. | −4.27 | −9.91 | 0.71128 | |
| Stdev. | 2.03 | 3.93 | 0.00298 | |
| Max. | −0.30 | −2.92 | 0.71716 | |
| Min. | −7.67 | −16.91 | 0.70928 | |
| Cambrian | D2 | |||
| n. | 7 | 7 | 4 | |
| Avg. | −1.98 | −7.42 | 0.70998 | |
| Stdev. | 0.45 | 0.46 | 0.00068 | |
| Max. | −1.56 | −6.95 | 0.71100 | |
| Min. | −2.96 | −8.20 | 0.70927 | |
| Cambrian | SD | |||
| n. | 3 | 3 | 0 | |
| Avg. | −3.02 | −9.98 | ||
| Stdev. | 1.72 | 0.89 | ||
| Max. | −0.59 | −8.72 | ||
| Min. | −4.26 | −10.71 | ||
| Cambrian | BKC | |||
| n. | 4 | 4 | 3 | |
| Avg. | −4.47 | −12.27 | 0.71011 | |
| Stdev. | 0.63 | 2.85 | 0.00014 | |
| Max. | −3.55 | −7.93 | 0.71031 | |
| Min. | −5.30 | −15.20 | 0.71000 | |
| Ordovician | D1 | |||
| n. | 15 | 15 | 7 | |
| Avg. | 0.11 | −8.87 | 0.71189 | |
| Stdev. | 0.70 | 1.77 | 0.00517 | |
| Max. | 1.16 | −5.30 | 0.72346 | |
| Min. | −1.25 | −12.48 | 0.70808 | |
| Ordovician | D2 | |||
| n. | 19 | 19 | 7 | |
| Avg. | 0.70 | −7.71 | 0.70896 | |
| Stdev. | 0.71 | 1.26 | 0.00148 | |
| Max. | 2.24 | −4.15 | 0.71255 | |
| Min. | −0.46 | −9.62 | 0.70814 | |
| Ordovician | SD | |||
| n. | 6 | 6 | 2 | |
| Avg. | −0.04 | −9.44 | 0.70955 | |
| Stdev. | 1.75 | 0.91 | 0.00111 | |
| Max. | 2.24 | −8.33 | 0.71066 | |
| Min. | −2.56 | −10.86 | 0.70844 | |
| Ordovician | Early Calcite | |||
| n. | 41 | 41 | 1 | |
| Avg. | 0.30 | −5.67 | ||
| Stdev. | 0.85 | 1.24 | ||
| Max. | 2.16 | −3.89 | 0.70809 | |
| Min. | −3.19 | −9.21 | 0.70809 | |
| Ordovician | BKC | |||
| n. | 30 | 30 | 4 | |
| Avg. | −0.15 | −6.78 | 0.70801 | |
| Stdev. | 0.70 | 1.20 | 0.00005 | |
| Max. | 1.46 | −3.94 | 0.70809 | |
| Min. | −1.84 | −9.88 | 0.70797 | |
| Silurian | D1 | |||
| n. | 21 | 21 | 8 | |
| Avg. | 0.21 | −6.83 | 0.70935 | |
| Stdev. | 1.99 | 1.03 | 0.00103 | |
| Max. | 3.99 | −4.46 | 0.71201 | |
| Min. | −2.80 | −8.03 | 0.70871 | |
| Silurian | D2 | |||
| n. | 14 | 14 | 7 | |
| Avg. | 2.23 | −7.06 | 0.70867 | |
| Stdev. | 1.51 | 1.18 | 0.00013 | |
| Max. | 4.02 | −3.85 | 0.70891 | |
| Min. | −0.32 | −8.31 | 0.70847 | |
| Silurian | SD | |||
| n. | 6 | 6 | 3 | |
| Avg. | 2.00 | −8.08 | 0.70863 | |
| Stdev. | 1.44 | 1.08 | 0.00008 | |
| Max. | 3.69 | −6.13 | 0.70872 | |
| Min. | 0.10 | −9.65 | 0.70852 | |
| Silurian | Early Calcite | |||
| n. | 12 | 12 | 1 | |
| Avg. | 0.96 | −6.65 | ||
| Stdev. | 1.21 | 1.38 | ||
| Max. | 3.53 | −4.73 | 0.70815 | |
| Min. | −0.88 | −8.85 | 0.70815 | |
| Silurian | BKC | |||
| n. | 10 | 10 | 3 | |
| Avg. | −0.26 | −7.92 | 0.70820 | |
| Stdev. | 1.98 | 1.66 | 0.00014 | |
| Max. | 3.17 | −4.54 | 0.70838 | |
| Min. | −3.75 | −10.19 | 0.70805 | |
| Devonian | D1 | |||
| n. | 16 | 16 | 8 | |
| Avg. | 2.65 | −6.16 | 0.70832 | |
| Stdev. | 0.90 | 0.66 | 0.00059 | |
| Max. | 4.28 | −4.46 | 0.70937 | |
| Min. | 0.55 | −7.04 | 0.70788 | |
| Devonian | D2 | |||
| n. | 22 | 22 | 8 | |
| Avg. | 2.50 | −6.22 | 0.70873 | |
| Stdev. | 1.11 | 1.35 | 0.00053 | |
| Max. | 4.63 | −3.91 | 0.70937 | |
| Min. | 0.64 | −10.39 | 0.70809 | |
| Devonian | Early Calcite | |||
| n. | 19 | 19 | 1 | |
| Avg. | 1.45 | −6.33 | ||
| Stdev. | 1.48 | 1.21 | ||
| Max. | 4.12 | −4.42 | 0.70805 | |
| Min. | −2.42 | −9.69 | 0.70805 | |
| Devonian | BKC | |||
| n. | 5 | 5 | 4 | |
| Avg. | −1.58 | −9.12 | 0.70803 | |
| Stdev. | 0.43 | 0.85 | 0.00003 | |
| Max. | −1.22 | −8.01 | 0.70806 | |
| Min. | −2.40 | −10.54 | 0.70798 |
Table 3.
Summary of the major and trace element composition of the studied successions.
| Age-Phase | Statistics | CaCO3 | Mn | Fe | Sr |
|---|---|---|---|---|---|
| Cambrian-D1 (n = 4) | Avg. | 59.3 | 1558.3 | 8912.8 | 83.6 |
| Stdev. | 4.2 | 400.4 | 2013.8 | 56.2 | |
| Max. | 66.5 | 1945 | 11,672.6 | 180.4 | |
| Min. | 56 | 926.9 | 6773.7 | 44.8 | |
| Cambrian-D2 (n = 6) | Avg. | 55.3 | 907.2 | 3883.6 | 97.8 |
| Stdev. | 0.3 | 163.7 | 767.4 | 6.3 | |
| Max. | 55.7 | 1227.7 | 5364.1 | 107.7 | |
| Min. | 734.3 | 2942.3 | 90.6 | 0 | |
| Cambrian-SD (n = 1) | Avg. | ||||
| Stdev. | |||||
| Max. | 57.7 | 1026.4 | 12,579.1 | 89.5 | |
| Min. | 57.7 | 1026.4 | 12,579.1 | 89.5 | |
| Ordovician-D1 (n = 5) | Avg. | 58.4 | 1097.9 | 8115.6 | 90.9 |
| Stdev. | 1.2 | 430.4 | 1787.9 | 43.2 | |
| Max. | 60.2 | 1537.4 | 10,521.4 | 172 | |
| Min. | 56.7 | 341.8 | 5462.3 | 55.5 | |
| Ordovician-D2 (n = 13) | Avg. | 61.8 | 793.3 | 10,128.9 | 120.9 |
| Stdev. | 5.7 | 347 | 8459 | 59.2 | |
| Max. | 75 | 1305.5 | 29,800 | 236.4 | |
| Min. | 56.5 | 409.5 | 2942.8 | 41.5 | |
| Ordovician-SD (n = 3) | Avg. | 63.3 | 1157.6 | 15,055.2 | 108.6 |
| Stdev. | 7.2 | 227.7 | 6420.9 | 38.1 | |
| Max. | 73.5 | 1459.1 | 23,597.3 | 154.9 | |
| Min. | 57.1 | 909 | 8116.3 | 61.4 | |
| Silurian-D1 (n = 16) | Avg. | 54.3 | 223.8 | 2428 | 94.6 |
| Stdev. | 3.4 | 217.9 | 1729.4 | 18.7 | |
| Max. | 59.4 | 857.8 | 7017.6 | 125.7 | |
| Min. | 48.3 | 34.2 | 339.3 | 70.2 | |
| Silurian-D2 (n = 7) | Avg. | 55.9 | 433.3 | 4621.3 | 253.7 |
| Stdev. | 3.1 | 313.2 | 2423.3 | 396.5 | |
| Max. | 62.1 | 860.9 | 8249.6 | 1222.1 | |
| Min. | 52.6 | 66.3 | 809.7 | 70.7 | |
| Silurian-SD (n = 3) | Avg. | 62.3 | 1098.9 | 19,606.4 | 105.9 |
| Stdev. | 4.4 | 631.1 | 1132.4 | 18 | |
| Max. | 67 | 1645.5 | 20,439.8 | 124.8 | |
| Min. | 56.3 | 214.6 | 18,005.3 | 81.8 | |
| Devonian-D1 (n = 13) | Avg. | 55.6 | 33.2 | 219.8 | 71.8 |
| Stdev. | 4.4 | 11.2 | 239.8 | 17.4 | |
| Max. | 62.2 | 54.2 | 690.5 | 123.5 | |
| Min. | 50 | 14.3 | 33.9 | 46.8 | |
| Devonian-D2 (n = 9) | Avg. | 56.8 | 48 | 419.9 | 78.2 |
| Stdev. | 4.1 | 10.7 | 296.6 | 12.2 | |
| Max. | 61.6 | 60.8 | 791.4 | 97.1 | |
| Min. | 47.9 | 32.9 | 83 | 60.3 |
Table 4.
Summary of the REE (ppm) composition of dolomite and calcite components in the studied successions.
Table 4.
Summary of the REE (ppm) composition of dolomite and calcite components in the studied successions.
| Age-Phase | Stats. | La | Ce | Pr | Nd | Sm | Eu | Gd | Tb | Dy | Ho | Er | Tm | Yb | Lu | ΣREE |
|---|---|---|---|---|---|---|---|---|---|---|---|---|---|---|---|---|
| Cambrian-D1 (n = 5) | Avg. | 10.96 | 27.92 | 3.04 | 11.58 | 3.01 | 0.67 | 3.62 | 0.65 | 4.11 | 0.90 | 2.45 | 0.35 | 2.77 | 0.40 | 72.43 |
| Stdev. | 11.60 | 27.91 | 2.69 | 9.58 | 2.13 | 0.48 | 2.60 | 0.53 | 3.68 | 0.82 | 2.26 | 0.34 | 2.80 | 0.40 | 59.82 | |
| Max. | 33.20 | 80.29 | 7.84 | 27.95 | 5.25 | 1.26 | 6.71 | 1.48 | 10.10 | 2.26 | 6.16 | 0.91 | 7.51 | 1.08 | 170.43 | |
| Min. | 0.72 | 1.86 | 0.27 | 1.08 | 0.24 | 0.05 | 0.24 | 0.03 | 0.15 | 0.03 | 0.07 | 0.01 | 0.07 | 0.01 | 4.83 | |
| Cambrian-D2 (n = 7) | Avg. | 14.68 | 38.36 | 3.95 | 14.53 | 3.16 | 0.68 | 3.67 | 0.54 | 3.19 | 0.66 | 1.73 | 0.24 | 1.74 | 0.24 | 87.38 |
| Stdev. | 15.90 | 41.71 | 4.24 | 15.06 | 2.79 | 0.52 | 2.91 | 0.43 | 2.56 | 0.53 | 1.37 | 0.18 | 1.33 | 0.19 | 84.89 | |
| Max. | 52.30 | 138.00 | 13.90 | 49.38 | 8.87 | 1.53 | 8.42 | 1.45 | 8.95 | 1.88 | 4.81 | 0.64 | 4.66 | 0.66 | 282.20 | |
| Min. | 3.48 | 8.93 | 0.90 | 3.18 | 0.76 | 0.22 | 1.11 | 0.16 | 1.01 | 0.20 | 0.54 | 0.07 | 0.44 | 0.06 | 21.20 | |
| Cambrian-SD (n = 1) | Avg. | |||||||||||||||
| Stdev. | ||||||||||||||||
| Max. | 0.932 | 2.428 | 0.306 | 1.103 | 0.180 | 0.038 | 0.235 | 0.027 | 0.127 | 0.029 | 0.058 | 0.009 | 0.056 | 0.007 | 5.533 | |
| Min. | 0.932 | 2.428 | 0.306 | 1.103 | 0.180 | 0.038 | 0.235 | 0.027 | 0.127 | 0.029 | 0.058 | 0.009 | 0.056 | 0.007 | 5.533 | |
| Ordovician-D1 (n = 13) | Avg. | 2.01 | 4.88 | 0.57 | 2.13 | 0.44 | 0.11 | 0.49 | 0.07 | 0.38 | 0.08 | 0.22 | 0.03 | 0.19 | 0.03 | 11.63 |
| Stdev. | 3.04 | 8.62 | 1.06 | 4.15 | 0.96 | 0.23 | 1.05 | 0.16 | 0.93 | 0.20 | 0.54 | 0.08 | 0.48 | 0.08 | 21.56 | |
| Max. | 12.41 | 34.49 | 4.24 | 16.42 | 3.74 | 0.89 | 4.12 | 0.64 | 3.60 | 0.78 | 2.07 | 0.28 | 1.85 | 0.28 | 85.79 | |
| Min. | 0.20 | 0.45 | 0.06 | 0.21 | 0.03 | 0.01 | 0.05 | 0.01 | 0.03 | 0.01 | 0.01 | 0.00 | 0.01 | 0.00 | 1.07 | |
| Ordovician D2 (n = 16) | Avg. | 1.68 | 3.85 | 0.43 | 1.52 | 0.27 | 0.06 | 0.30 | 0.04 | 0.18 | 0.04 | 0.09 | 0.01 | 0.07 | 0.01 | 8.54 |
| Stdev. | 1.31 | 3.37 | 0.39 | 1.36 | 0.25 | 0.05 | 0.28 | 0.03 | 0.16 | 0.03 | 0.08 | 0.01 | 0.06 | 0.01 | 7.36 | |
| Max. | 5.62 | 14.02 | 1.60 | 5.65 | 1.05 | 0.23 | 1.17 | 0.15 | 0.70 | 0.14 | 0.34 | 0.05 | 0.24 | 0.04 | 30.99 | |
| Min. | 0.44 | 0.83 | 0.09 | 0.36 | 0.06 | 0.02 | 0.08 | 0.01 | 0.03 | 0.01 | 0.02 | 0.00 | 0.02 | 0.00 | 1.98 | |
| Ordovician SD (n = 6) | Avg. | 1.97 | 4.26 | 0.49 | 1.69 | 0.29 | 0.06 | 0.32 | 0.04 | 0.19 | 0.04 | 0.10 | 0.02 | 0.09 | 0.01 | 9.55 |
| Stdev. | 0.57 | 2.05 | 0.28 | 0.97 | 0.18 | 0.02 | 0.16 | 0.02 | 0.11 | 0.02 | 0.05 | 0.01 | 0.04 | 0.01 | 4.36 | |
| Max. | 3.08 | 7.75 | 0.98 | 3.28 | 0.61 | 0.10 | 0.61 | 0.09 | 0.40 | 0.08 | 0.21 | 0.03 | 0.15 | 0.03 | 17.41 | |
| Min. | 1.17 | 2.24 | 0.19 | 0.59 | 0.08 | 0.03 | 0.15 | 0.02 | 0.09 | 0.02 | 0.06 | 0.01 | 0.05 | 0.01 | 5.43 | |
| Silurian D1 (n = 16) | Avg. | 2.30 | 5.32 | 0.64 | 2.49 | 0.52 | 0.12 | 0.53 | 0.07 | 0.40 | 0.08 | 0.21 | 0.03 | 0.16 | 0.02 | 12.89 |
| Stdev. | 1.07 | 2.84 | 0.35 | 1.38 | 0.31 | 0.07 | 0.30 | 0.04 | 0.24 | 0.04 | 0.12 | 0.01 | 0.09 | 0.01 | 6.84 | |
| Max. | 4.47 | 11.58 | 1.35 | 5.49 | 1.19 | 0.26 | 1.15 | 0.17 | 0.89 | 0.17 | 0.43 | 0.05 | 0.34 | 0.05 | 27.60 | |
| Min. | 0.78 | 1.42 | 0.15 | 0.52 | 0.10 | 0.02 | 0.10 | 0.01 | 0.06 | 0.01 | 0.04 | 0.00 | 0.03 | 0.00 | 3.25 | |
| Silurian D2 (n = 9) | Avg. | 1.89 | 4.43 | 0.55 | 2.15 | 0.41 | 0.08 | 0.41 | 0.06 | 0.30 | 0.06 | 0.16 | 0.02 | 0.12 | 0.02 | 10.65 |
| Stdev. | 1.32 | 3.34 | 0.43 | 1.67 | 0.31 | 0.06 | 0.31 | 0.04 | 0.23 | 0.04 | 0.12 | 0.02 | 0.08 | 0.01 | 7.95 | |
| Max. | 3.64 | 9.45 | 1.23 | 4.86 | 0.88 | 0.18 | 0.87 | 0.12 | 0.65 | 0.12 | 0.36 | 0.05 | 0.23 | 0.03 | 22.67 | |
| Min. | 0.28 | 0.50 | 0.05 | 0.23 | 0.05 | 0.01 | 0.05 | 0.01 | 0.04 | 0.01 | 0.02 | 0.00 | 0.02 | 0.00 | 1.30 | |
| Silurian SD (n = 4) | Avg. | 8.84 | 23.37 | 2.95 | 10.78 | 1.87 | 0.27 | 1.36 | 0.16 | 0.83 | 0.14 | 0.41 | 0.05 | 0.30 | 0.04 | 51.37 |
| Stdev. | 6.96 | 17.27 | 2.13 | 7.40 | 1.26 | 0.17 | 0.89 | 0.10 | 0.52 | 0.09 | 0.26 | 0.03 | 0.20 | 0.03 | 37.09 | |
| Max. | 19.39 | 47.98 | 5.92 | 20.35 | 3.42 | 0.44 | 2.30 | 0.27 | 1.34 | 0.23 | 0.69 | 0.08 | 0.52 | 0.06 | 102.93 | |
| Min. | 0.36 | 0.77 | 0.09 | 0.39 | 0.07 | 0.02 | 0.04 | 0.01 | 0.05 | 0.01 | 0.02 | 0.00 | 0.02 | 0.00 | 1.85 | |
| Devonian D1 (n = 13) | Avg. | 0.91 | 1.34 | 0.23 | 0.95 | 0.18 | 0.03 | 0.24 | 0.03 | 0.14 | 0.03 | 0.08 | 0.01 | 0.06 | 0.01 | 4.17 |
| Stdev. | 1.42 | 2.06 | 0.39 | 1.67 | 0.29 | 0.06 | 0.33 | 0.04 | 0.20 | 0.04 | 0.10 | 0.01 | 0.06 | 0.01 | 6.60 | |
| Max. | 4.80 | 7.60 | 1.35 | 5.77 | 0.98 | 0.18 | 0.97 | 0.11 | 0.64 | 0.12 | 0.33 | 0.04 | 0.23 | 0.03 | 22.88 | |
| Min. | 0.11 | 0.17 | 0.02 | 0.07 | 0.01 | 0.00 | 0.03 | 0.00 | 0.02 | 0.00 | 0.01 | 0.00 | 0.01 | 0.00 | 0.44 | |
| Devonian D2 (n = 14) | Avg. | 2.01 | 2.23 | 0.40 | 1.65 | 0.32 | 0.07 | 0.43 | 0.05 | 0.30 | 0.06 | 0.18 | 0.02 | 0.13 | 0.02 | 7.80 |
| Stdev. | 2.37 | 2.46 | 0.49 | 2.07 | 0.40 | 0.09 | 0.47 | 0.06 | 0.35 | 0.07 | 0.20 | 0.02 | 0.14 | 0.02 | 9.16 | |
| Max. | 7.20 | 7.62 | 1.48 | 6.15 | 1.18 | 0.25 | 1.32 | 0.18 | 1.03 | 0.20 | 0.57 | 0.06 | 0.42 | 0.05 | 27.72 | |
| Min. | 0.14 | 0.20 | 0.03 | 0.10 | 0.03 | 0.00 | 0.03 | 0.00 | 0.02 | 0.00 | 0.01 | 0.00 | 0.01 | 0.00 | 0.56 |
Table 5.
Summary of the fluid inclusion data of the studied successions.
| Age | Host Mineral | Size (µm) | Th (°C) | Salinity |
|---|---|---|---|---|
| Cambrian | D2 | |||
| n. | 19 | 19 | 10 | |
| Avg. | 7.26 | 102.89 | 25.42 | |
| Stdev. | 2.88 | 17.05 | 1.32 | |
| Max. | 17.00 | 132.00 | 27.20 | |
| Min. | 4.00 | 75.00 | 23.20 | |
| Cambrian | SD | |||
| n. | 5 | 5 | 0 | |
| Avg. | 8.40 | 131.60 | ||
| Stdev. | 1.96 | 20.05 | ||
| Max. | 10.00 | 156.00 | ||
| Min. | 6.00 | 111.00 | ||
| Cambrian | BKC | |||
| n. | 11 | 11 | 2 | |
| Avg. | 11.00 | 108.00 | 22.85 | |
| Stdev. | 4.24 | 22.24 | 0.75 | |
| Max. | 20.00 | 141.00 | 23.60 | |
| Min. | 6.00 | 85.00 | 22.10 | |
| Ordovician | D2 | |||
| n. | 41 | 41 | 12 | |
| Avg. | 8.20 | 96.34 | 26.46 | |
| Stdev. | 2.37 | 17.08 | 3.39 | |
| Max. | 13.00 | 132.00 | 30.50 | |
| Min. | 4.00 | 66.00 | 21.60 | |
| Ordovician | SD | |||
| n. | 10 | 10 | 8 | |
| Avg. | 9.00 | 115.20 | 23.34 | |
| Stdev. | 2.05 | 16.28 | 2.32 | |
| Max. | 12.00 | 152.00 | 25.90 | |
| Min. | 6.00 | 89.00 | 20.80 | |
| Ordovician | BKC | |||
| n. | 27 | 27 | 7 | |
| Avg. | 11.77 | 109.67 | 27.19 | |
| Stdev. | 6.27 | 16.75 | 1.87 | |
| Max. | 22.00 | 153.00 | 30.30 | |
| Min. | 5.00 | 68.00 | 24.80 | |
| Silurian | D2 | |||
| n. | 42 | 42 | 15 | |
| Avg. | 3.52 | 93.45 | 23.10 | |
| Stdev. | 2.05 | 16.20 | 0.87 | |
| Max. | 10.00 | 134.10 | 25.21 | |
| Min. | 1.00 | 49.70 | 15.17 | |
| Silurian | SD | |||
| n. | 53 | 53 | 29 | |
| Avg. | 6.02 | 123.51 | 28.54 | |
| Stdev. | 2.83 | 16.44 | 1.74 | |
| Max. | 15.00 | 193.40 | 32.63 | |
| Min. | 2.00 | 101.20 | 25.21 | |
| Silurian | BKC | |||
| n. | 53 | 53 | 25 | |
| Avg. | 5.70 | 129.18 | 27.68 | |
| Stdev. | 3.31 | 31.92 | 2.55 | |
| Max. | 18.00 | 194.30 | 32.33 | |
| Min. | 2.00 | 70.20 | 21.40 | |
| Devonian | D2 | |||
| n. | 29 | 29 | 12 | |
| Avg. | 3.34 | 83.79 | 20.74 | |
| Stdev. | 1.67 | 8.26 | 0.90 | |
| Max. | 6.00 | 102.30 | 21.82 | |
| Min. | 1.00 | 69.90 | 18.96 | |
| Devonian | BKC | |||
| n. | 48 | 48 | 25 | |
| Avg. | 5.73 | 202.04 | 20.75 | |
| Stdev. | 2.33 | 27.83 | 2.17 | |
| Max. | 12.00 | 255.10 | 23.95 | |
| Min. | 2.00 | 146.20 | 15.17 |
Publisher’s Note: MDPI stays neutral with regard to jurisdictional claims in published maps and institutional affiliations. |
© 2021 by the authors. Licensee MDPI, Basel, Switzerland. This article is an open access article distributed under the terms and conditions of the Creative Commons Attribution (CC BY) license (https://creativecommons.org/licenses/by/4.0/).
Share and Cite
MDPI and ACS Style
Al-Aasm, I.S.; Crowe, R.; Tortola, M. Dolomitization of Paleozoic Successions, Huron Domain of Southern Ontario, Canada: Fluid Flow and Dolomite Evolution. Water 2021, 13, 2449. https://doi.org/10.3390/w13172449
AMA Style
Al-Aasm IS, Crowe R, Tortola M. Dolomitization of Paleozoic Successions, Huron Domain of Southern Ontario, Canada: Fluid Flow and Dolomite Evolution. Water. 2021; 13(17):2449. https://doi.org/10.3390/w13172449
Chicago/Turabian StyleAl-Aasm, Ihsan S., Richard Crowe, and Marco Tortola. 2021. "Dolomitization of Paleozoic Successions, Huron Domain of Southern Ontario, Canada: Fluid Flow and Dolomite Evolution" Water 13, no. 17: 2449. https://doi.org/10.3390/w13172449
Note that from the first issue of 2016, this journal uses article numbers instead of page numbers. See further details here.