
Investigation of Biofilm Growth within a Monodisperse Porous Medium under Fluctuating Water Level Assessed by Means of MRI


1
Engler-Bunte-Institut, Water Chemistry and Water Technology, Karlsruhe Institute of Technology, Engler-Bunte-Ring 9, 76131 Karlsruhe, Germany
2
Empa, Swiss Federal Laboratories for Material Science and Technology, Überlandstrasse 129, 8600 Dübendorf, Switzerland
3
DVGW Research Laboratories, Water Chemistry and Water Technology, Engler-Bunte-Ring 9, 76131 Karlsruhe, Germany
4
Karlsruhe Institute of Technology, Institute of Biological Interfaces (IBG-1), Hermann-von-Helmholtz-Platz 1, 76344 Eggenstein-Leopoldshafen, Germany
*
Author to whom correspondence should be addressed.
Water 2021, 13(18), 2456; https://doi.org/10.3390/w13182456
Submission received: 1 July 2021
/
Revised: 1 September 2021
/
Accepted: 2 September 2021
/
Published: 7 September 2021
(This article belongs to the Section Soil and Water)
Abstract
:Microorganisms settle in diverse partially saturated porous media in the form of biofilms. The alteration of hydraulic properties and diffusive transport processes occurs simultaneously with biofilm growth in porous media. Imaging methods offer the ability to directly visualize and quantify alterations on the pore scale. However, imaging methods have mainly observed biofilm growth in completely saturated porous media. The current study used magnetic resonance imaging (MRI) to dynamically visualize biofilm growth within a porous medium under alternating drainage and flushing events. Prior to the MRI experiments, the sample was cultivated for 6 days within a porous medium consisting of 2 mm glass spheres. Starting from day 6, growth was monitored using MRI over a period of 7 days. The approach allowed for a visualization of all fractions (biofilm, water, air, and porous material) after drainage as well as flushing events. Biofilm was found to preferentially grow within permanently wetted areas situated next to pore throats. Furthermore, an increase in the water retention and connectivity of the liquid phase was found. The largest liquid cluster covered 11% (day 6) and 91% (day 12) of the total retained water, suggesting that biofilm growth might improve diffusive transport processes within partially saturated porous media.
1. Introduction
Microorganisms can be found in natural, as well as engineered, partially saturated systems. Examples include the vadose zone, irrigated agriculture, and aerated biofilters. As a crucial part of the ecosystem, microorganisms are involved in the utilization of carbon sources, guaranteeing water quality, the removal of pollutants, the promotion of plant growth, and the regulation of greenhouse gas emissions within natural soils [1,2]. Their abundance and activity vary depending on the physical environment. Fluctuations in temperature, water, and nutrient availability, combined with geometrical restrictions, require microorganisms to be highly adaptable [1,3]. A common response of microorganisms to stressful conditions, such as fluctuating water levels, is the production of extracellular polymeric substances (EPSs) and surface attachments, which lead to the formation of biofilms [4].
Due to the often non-negligible amount of biofilm that covers the void space, alterations in the hydraulic properties of the porous medium occur. Possible reasons for this include: (I) structural changes via pore size accumulation, (II) the high water-holding capacity of EPS matrices, (III) changes in soil wettability due to surface coverage, and (IV) alterations in the water–air–surface tension [3,5].
It has been commonly reported that the EPS matrices of biofilms increase water retention and reduce evaporation, as well as saturated and unsaturated hydraulic conductivity [5,6,7,8]. Despite these observations, the role of the fragmentation of residual water is relevant for diffusive transport processes on many scales. At low water contents, EPS are associated with the dispersion of nutrients by bridging between isolated water clusters, leading to an enhanced liquid phase connectivity [1,9,10]. However, experimental studies on the impact of EPS accumulation on transport processes within partially saturated porous media are rare. One such study was conducted by Chenu and Roberson [1,9,10], who addressed this field by conducting diffusion experiments. An alternative approach is the direct visualization via suitable imaging methods.
The interplay of biofilms, porous media, and hydraulic properties has mainly been assessed in completely saturated conditions. The imaging methods of choice include X-ray microtomography [11,12,13], neutron-radiography [5], magnetic resonance imaging (MRI) [14,15,16,17], and optical methods on porous microfluidic channels [7,18,19,20]. The field of biofilm growth within partially saturated porous media is almost unexplored.
The more stringent requirements associated with imaging partially saturated porous media might be the cause of this. We propose that an ideal method requires: (I) a sufficient resolution to accurately resolve the pore spaces, (II) no depth limitation to the three-dimensional visualization of the entire porous medium, (III) adequate contrast to differentiate the phases (e.g., water, biofilm, air, and solid material), and (IV) noninvasiveness of the method in order to avoid the impairment of the porous material or microorganisms. As none of the aforementioned imaging methods fulfill all requirements, compromises have to be made.
The current study aimed at highlighting MRI as a suitable tool to visualize biofilm accumulation within unsaturated porous media. MRI has the benefits of being an in-situ, noninvasive method that is not limited in penetration depth. A bed of randomly packed glass spheres with sizes of 2 ± 0.1 mm were chosen as a porous medium to allow for pore-scale visualization. In a previous study, the initial water retention of a packed bed of 2 mm glass spheres showed the most homogeneous dispersion of free water, mostly between pore throats [21]. The hypothesis of this study was that a homogeneous distribution of free water would deliver rather equal starting points for biofilm growth.
The focus of this study was to: (I) visualize all fractions within the porous medium (water, air, particles, and biofilm) in a time-resolved manner, (II) identify preferential spots of biofilm development and accumulation within the porous medium, and (III) characterize ongoing changes within the liquid phase in the form of quantity and connectivity.
2. Materials and Methods
2.1. Experimental Setup and Procedure
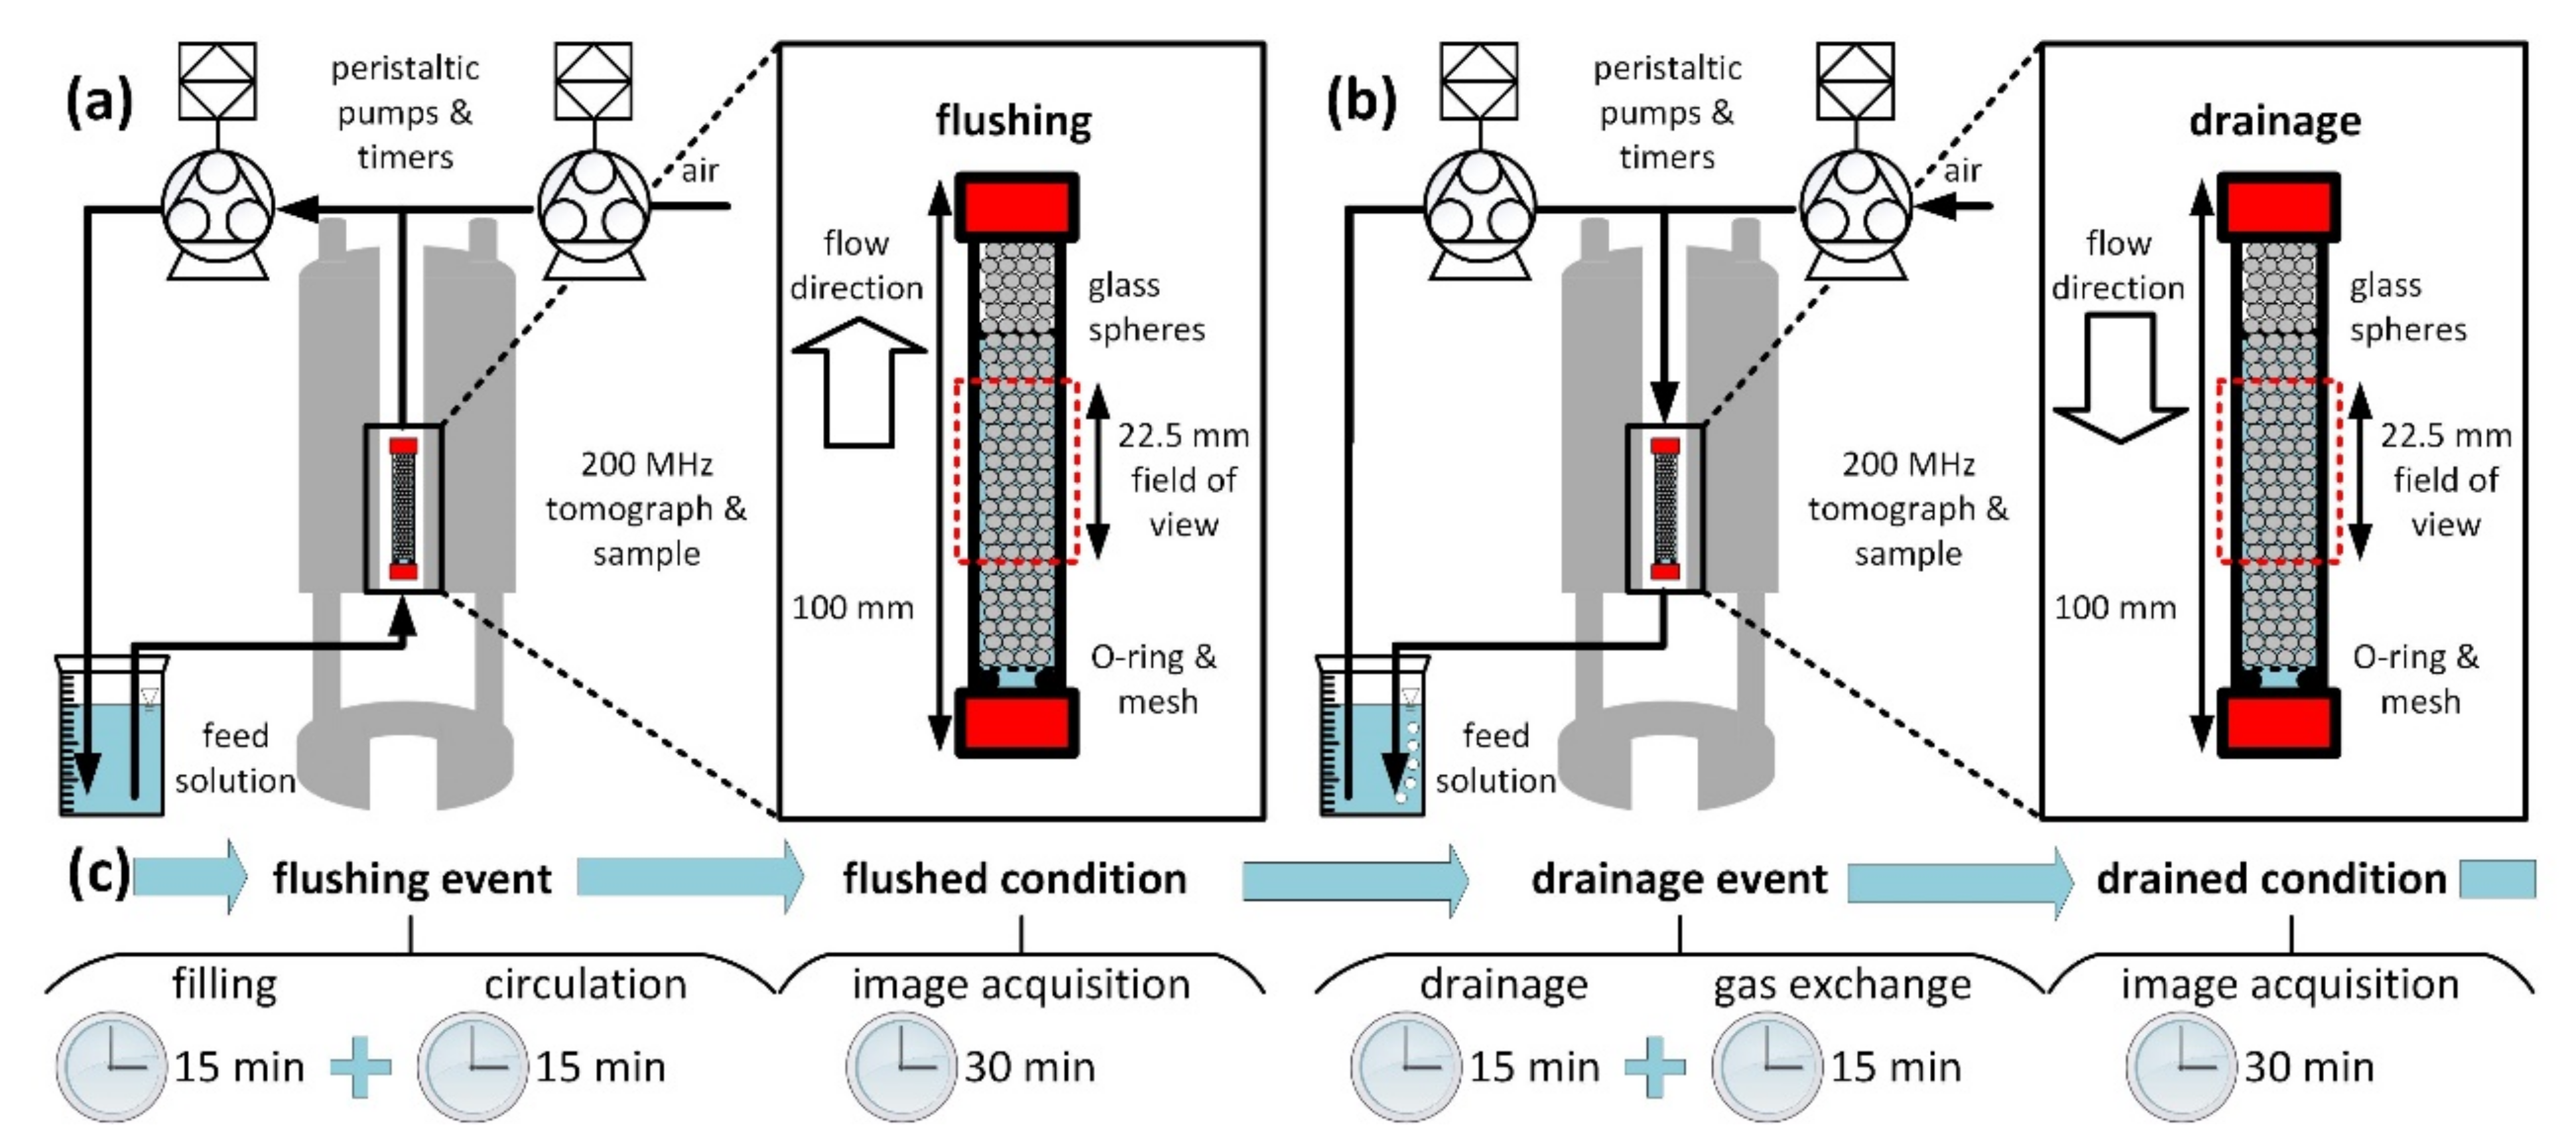
A schematic of the experimental setup is depicted in Figure 1. The 2 mm glass spheres were placed inside a glass column with an inner diameter of 14 mm and a length of 100 mm. An O-ring and a piece of mesh (size 0.7 mm fabric) were positioned at the lower part to avoid the blockage of the inlet. The height of the packed bed of glass spheres was approximately 90 mm. The field of view was positioned at the middle of the glass column and covered 22.5 mm along the height of the glass column. The glass column was installed inside a 200 MHz magnetic resonance tomograph (Bruker BioSpin GmbH, Rheinstetten). The cultivation setup was an open system that was connected using the tube lines. Drainage/flushing events were conducted in alternating order by temporarily switching the peristaltic pumps on and off. Furthermore, turning off the peristaltic pumps sealed the corresponding tube line. Thus, the integration of valves was avoided. Flushing is depicted in Figure 1a. Here, a peristaltic pump sucked water from the feed solution. Once the sample was filled with water, the pump circulated water until the end of the flushing sequence. The drainage of the sample (Figure 1b) was conducted by one peristaltic pump pushing air through the sample. Gas breakthrough was recognizable at the outlet once the sample was drained. The drainage/flushing sequence lasted 30 min in total. Approximately 15 min was needed to fill/drain the sample entirely, followed by 15 min of mixing to ensure a homogenous nutrient distribution within the porous medium (Figure 1c). In between the drainage/flushing sequence, a break of 30 min was applied. Breaks were used for image acquisition. For 3D images, the time for image acquisition was elongated to 1 h once per day.
2.2. Cultivation
The sample was inoculated with Bacillus subtilis precultures grown at 37 °C overnight in Luria broth (LB) medium. Twenty milliliters of preculture was added to the feed solution at the beginning of the experiment. Bacillus subtilis was chosen as it is abundant in natural soils and able to incorporate iron within the EPS matrix. The feed solution consisted of 1 L of tap water enriched with 1 g/L of acetate (originating from sodium acetate) and 2 mg/L of Fe3+ (originating from iron(III)chloride) as a contrast agent for the growing biofilm. The tap water of Karlsruhe contained the following concentrations of ions (mg/L): Ca (112), Na (11), Mg (9.7), Si (5.4), K (1.7), P (<0.01), Fe (<0.01), and Mn (<0.005). More information on constituents is accessible from the homepage of the Stadtwerke Karlsruhe website (https://www.stadtwerke-karlsruhe.de) (accessed on 9 November 2020). At day 6, the sample was positioned within the MRI and further monitored over a period of 7 days, resulting in an experiment period of 12 days. The timing of the drainage and flushing events was kept constant over the whole experiment, as described in the previous section.
The relevant cultivation period for the MRI measurements was based on a preliminary experiment. Here, samples were cultivated under permanently saturated conditions to additionally assess the growth by means of optical coherence tomography (OCT). A detailed description of the cultivation is provided in Appendix A. Only the OCT data of the preliminary experiment are shown in the present study.
2.3. Optical Coherence Tomography (OCT)
A spectral domain tomograph (GANYMEDE I, Thorlabs GmbH Dachau, Germany) was applied to monitor the biofilm growth on the glass spheres. B-scans were obtained with a resolution of 2.1 µm × 8 µm (x- by -z) in water (n = 133) and an A-scan average of 4. Detailed information on the working principle and applications in biofilm research are provided in Wagner and Horn [22].
In the current study, the acquisition of C-Scans was limited because of the curvature of the glass columns. Furthermore, optical refractions interfered when measuring the biofilm in partially saturated conditions. Therefore, the measurements were feasible only with constantly saturated probes. The conditions and setup for the cultivation under permanently saturated conditions are described in Appendix A.
2.4. Magnetic Resonance Imaging (MRI)
MRI experiments were conducted within a 200 MHz super-wide bore magnet equipped with an Avance HDIII console (Bruker BioSpin GmbH, Rheinstetten, Germany). The probe was an MICWB 40 with a 20 mm birdcage. For imaging, gradients of up to 1.5 T/m were available. The multi-slice–multi-echo (MSME) pulse sequence was chosen. The parameters of the MRI experiments are listed in Table 1. Different parameters were chosen for 2D and 3D measurements. The parameters were kept constant over the whole experimental period and no changes in acquisition parameters were conducted between drained and flushed conditions.
2.5. Image Analysis
The image analysis was performed by using Avizo 2021.1 (Thermo Fisher Scientific, Waltham, MA, USA) and self-written scripts in Matlab R2018b (Math-Works, Natick, MA, USA). For the 3D image analysis, the exterior material was used for noise adjustment and removed from the dataset. The binary images were obtained by setting a threshold at 3000 out of 215 intensity values. The first image, taken on day 6 in flushed condition, served as a reference. Here, the threshold separated the water-filled void space from glass spheres (solid material). For visualization purposes, the glass spheres were superpositioned onto the other images.
For each measurement, the water content was quantified by keeping the threshold value constant at 3000. After that, clusters of the liquid phase, as well as enclosed cavities smaller than 10 voxels, were removed.
Furthermore, the connectivity function defined liquid clusters by using a neighborhood connectivity of 26 in a 3D matrix. For the connectivity analysis, the specific Euler number χV, as suggested by Vogel and Roth [23], was calculated according to:
where the number of isolated objects is N, the number of redundant connections is C, the number of completely enclosed cavities is H, and the volume of the sample is V.
3. Results
3.1. Dynamics of Water Content
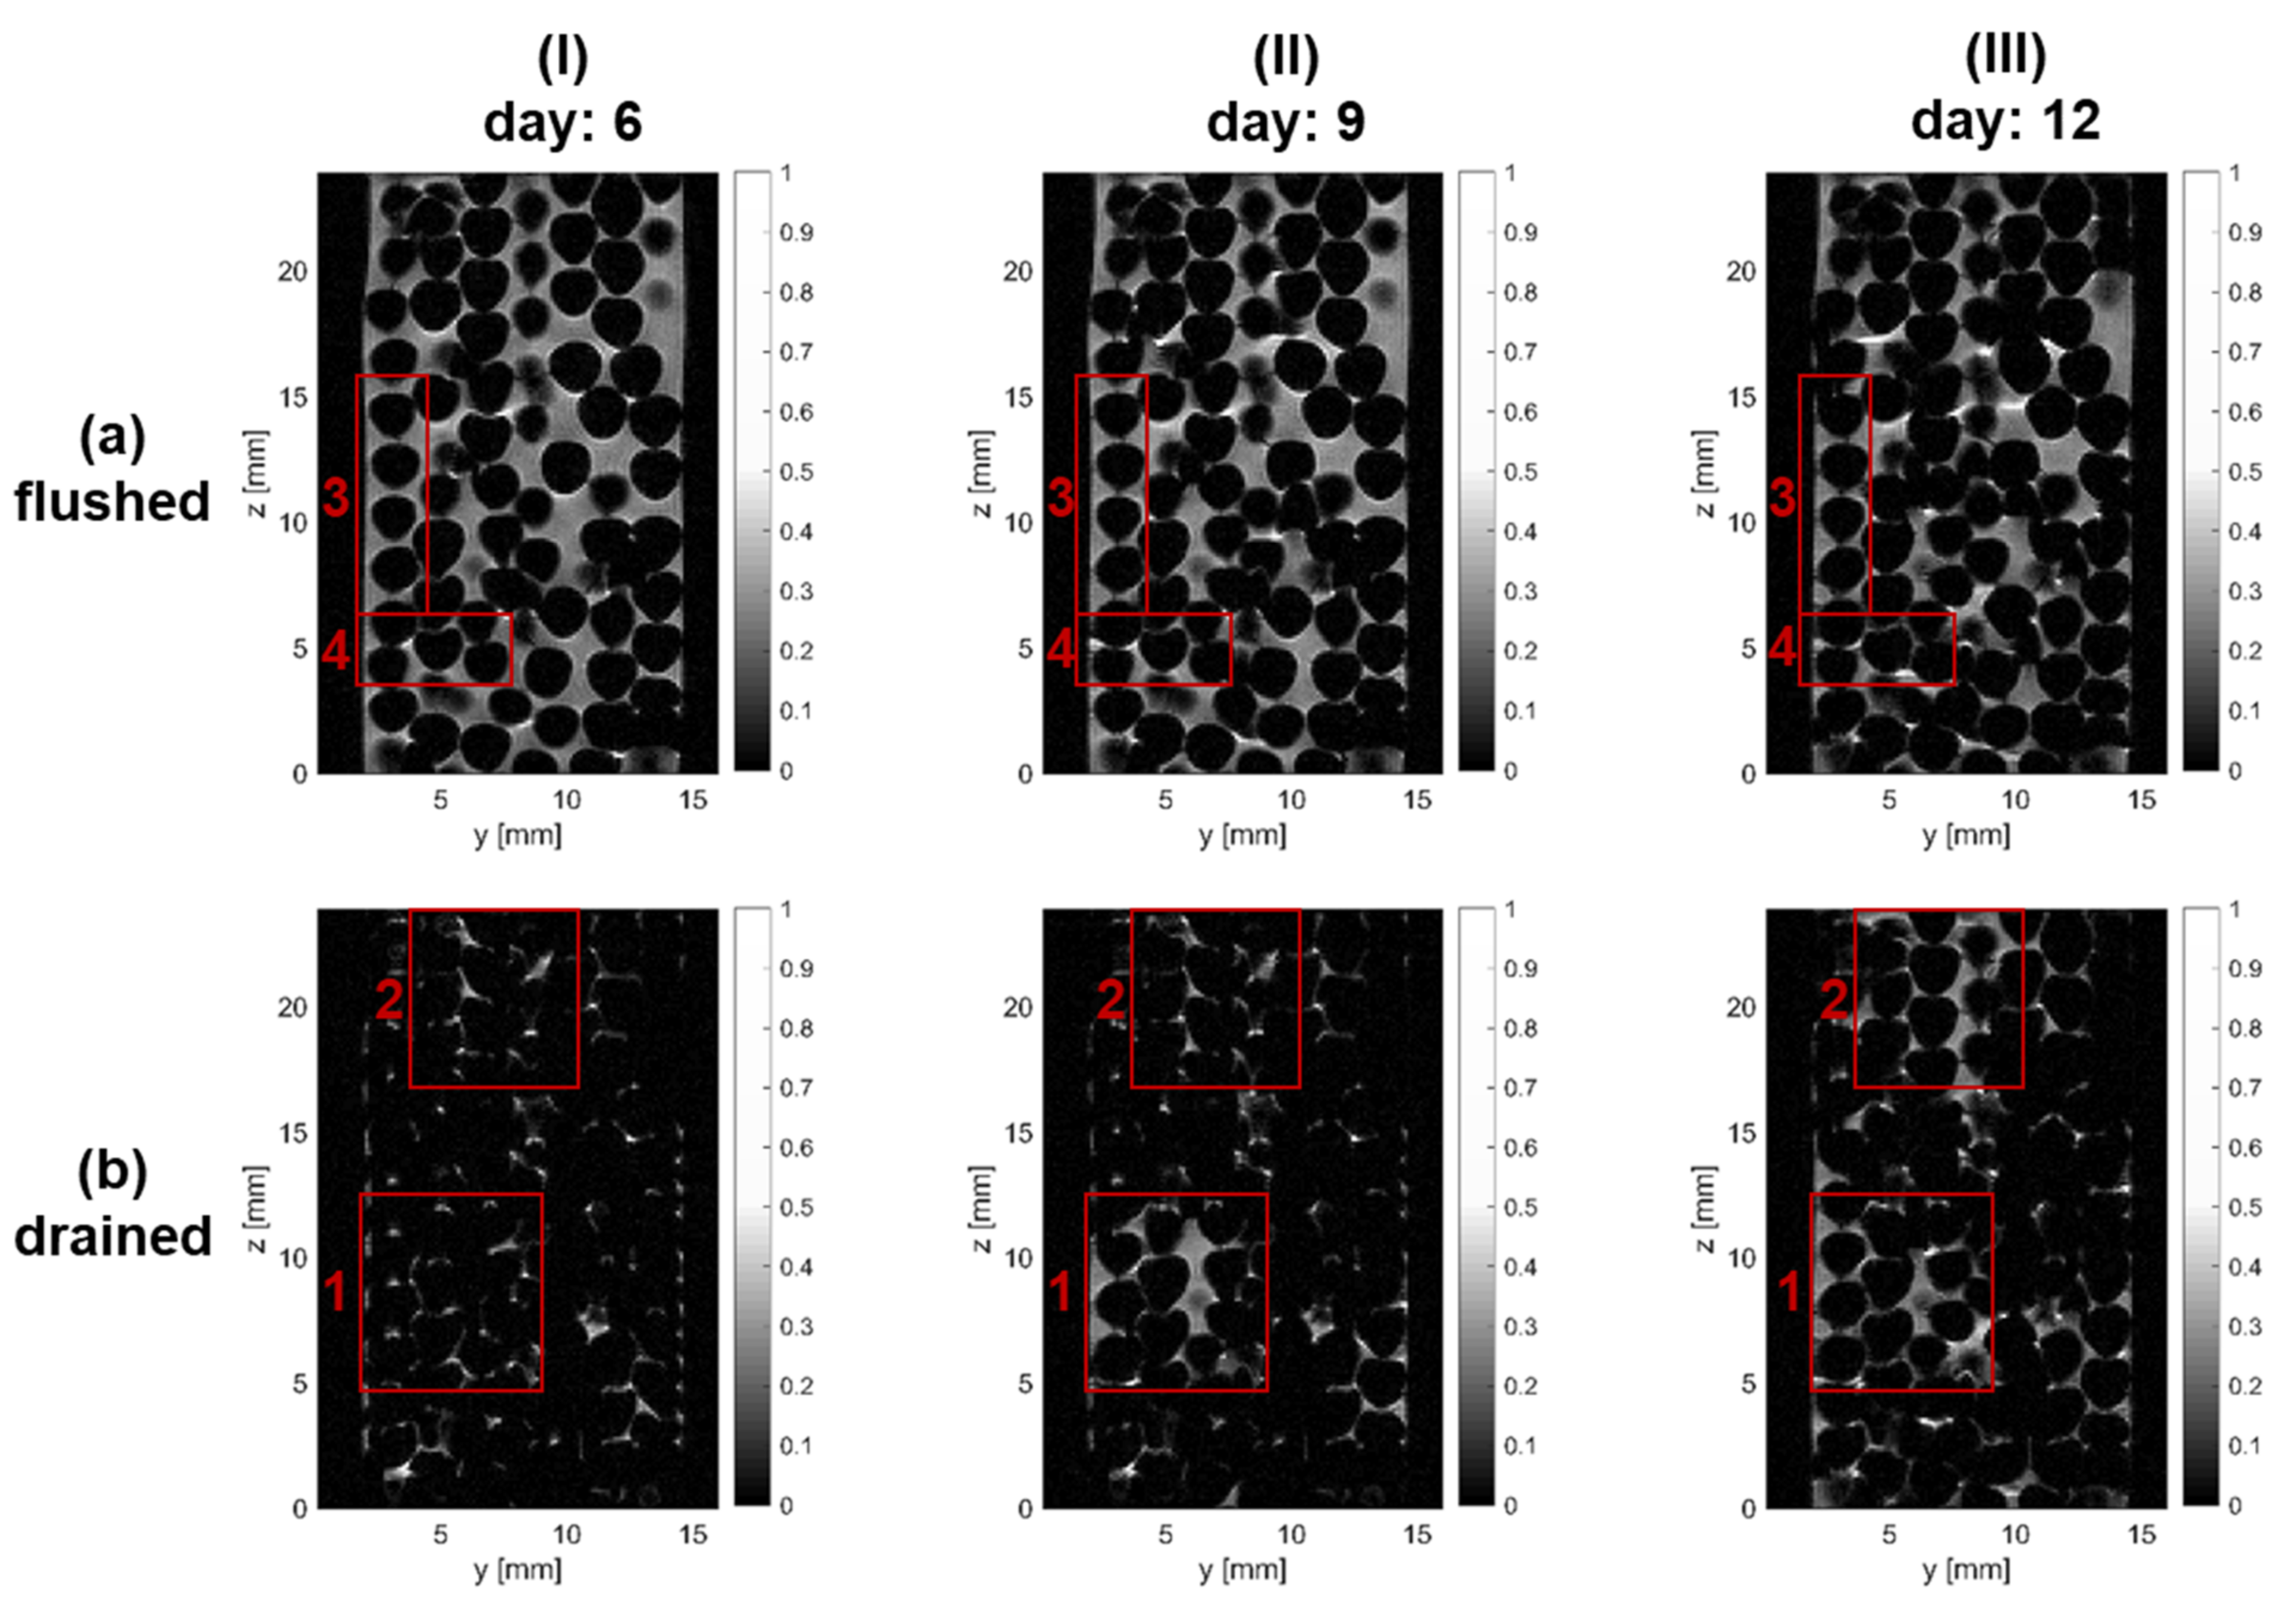
Figure 2 shows 2D images taken on days 6, 9, and 12. Figure 2a shows the sample in the flushed condition, while Figure 2b displays the sample in the drained condition. To enhance readability, the following statements refer to four regions of interest (ROI) that are highlighted in Figure 2.
MRI obtains a signal from water molecules. Therefore, water-containing voids deliver a signal that is typically indicated in grey (Figure 2a(I)). Regions indicated in white are the result of susceptibility artifacts, which appear close to the interface between different fractions. These are observed at the interface between the glass spheres and water or between entrapped air and water. However, the local entrapment of air may vary with the time and cycle. In addition, the occurrence of susceptibility artifacts can be aligned with the entrapment of small air bubbles. The glass spheres, the entrapped air, and the exterior components do not contribute to the signal and appear black. In Figure 2a(I), the void space is almost completely filled with water.
After the drainage of the sample, most of the void space was filled with air and delivered no signal (Figure 2b(I)). Water could still be found in pore throats between particles or between particles and the column wall (Figure 2b(I); ROI 1). Only a few pores retained larger amounts of water. A relatively high amount of water retained in pores can be seen in Figure 2b(I); ROI 2.
At day 9, more water was retained within the porous medium (Figure 2b(II)). The area of ROI 1 retained water almost completely on day 9, whereas changes in ROI 2 were not significant. At day 12, ROI 2 also retained relatively high amounts of water. Both ROIs 1 and 2 retained larger amounts of water than the rest of the porous medium, indicating a heterogeneity in the water retention.
Overall, the water content in the flushed condition did not significantly alter (Figure 2a(II,III)). However, the entrapment of air was locally recognized and is further indicated in the animated version (see Supplementary Materials).
3.2. Biofilm Growth
The growth of biofilm appeared as dark regions between glass spheres or between glass spheres and the column wall (Figure 2). For example, a cross-comparison of ROI 1 over days 6, 9, and 12 highlights the developing pore throat coverage of the biofilm along z (compare Figure 2a, ROI 3). For clarification, the authors encourage viewing the animation provided in the Supplementary Materials (see Supplementary Materials). Two locations of biofilm growth were identified in the sample: biofilm accumulated in pore throats, either between two particles or between a particle and a column wall (compare Figure 2a, ROI 3); additionally, a biofilm coverage of pores was punctually observed (compare Figure 2a, ROI 4). The biofilm can also be recognized in the drained condition on days 9 and 12 (see Figure 2b, ROI 1).
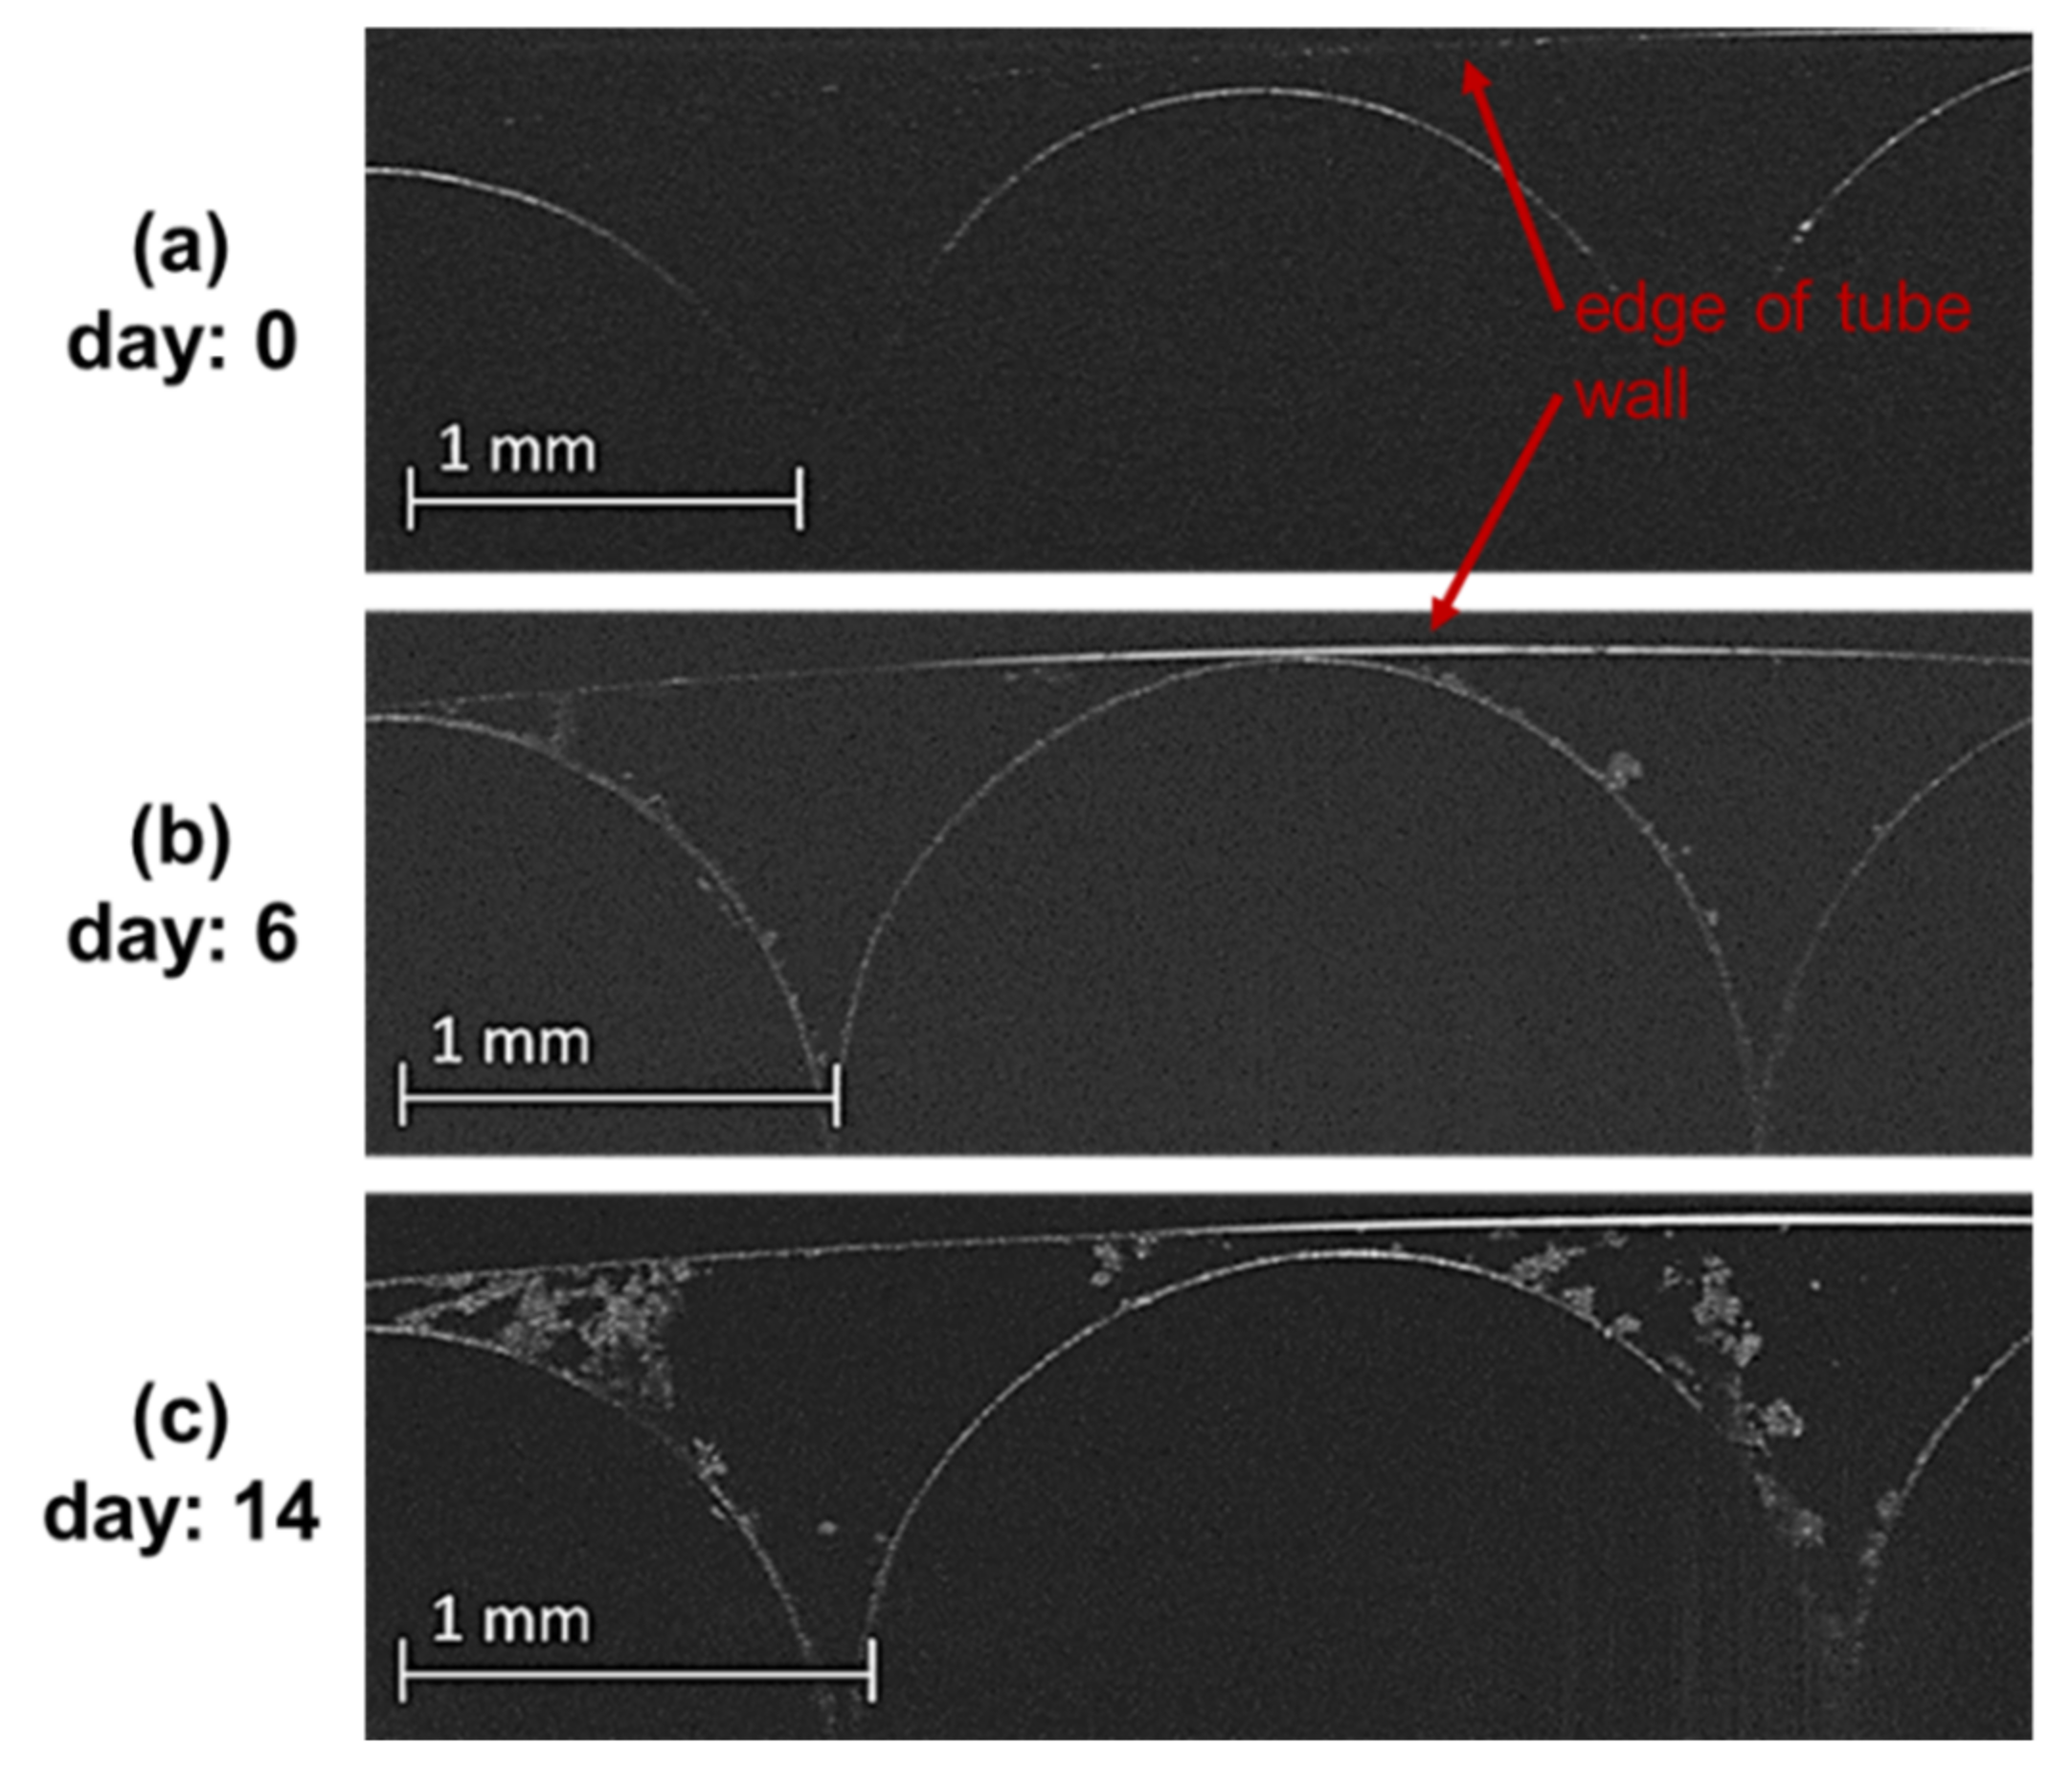
Optical coherence tomography (OCT) images (B-scan; xz-plane) provide a closer look at the biofilm situated on the glass spheres next to the column wall (Figure 3). Furthermore, they highlight which stages of biofilm growth were accessible by means of MRI. Data were provided from a separate experiment conducted under entirely saturated conditions. On day 0 (before inoculation), the smooth surfaces of three glass spheres were visible (Figure 3a). On day 6, small biofilm colonies situated on the surface of the glass spheres were recognized (Figure 3b); in addition, the inner edge of the glass wall, recognizable as a curvilinear line, became visible. After 14 days, the biofilm had grown between the glass wall and the particle surface (Figure 3c). The biofilm structure was fluffy. Additionally, cavities were found within the mesoscopic biofilm matrix. Overall, more biofilm was recognized between the glass column and the spheres than at the contact points between the glass spheres (Figure 3c). However, from the MRI perspective, only the former case, where a distinct biofilm covered the voids between particles and the column wall, was accessible due to the resolution.
3.3. Analysis of Liquid Phase
Figure 4 shows processed 3D MRI datasets. For the sake of clarification, the glass spheres and column wall have been superpositioned in the 3D rendering. The distinction between the void space and glass spheres was performed based on Figure 4a(I). The air is visualized as transparent regions.
An increase in the air entrapment was found at days 9 and 12 (compare Figure 4a). The increase in water retention after drainage is shown in Figure 4b. On day 6, most of the water was found close to contact points, while only a few pores were completely filled with water (Figure 4b(I)). The cluster visualization of the liquid phase (Figure 4c(I)) shows many isolated clusters (i.e., many clusters with different colors). On day 9, the enhanced water retention led to the formation of a dominant cluster (red) (Figure 4c(II)). The cluster partly covered the width and reached from the top to the bottom of the dataset (Figure 4c(II)). On day 12, almost the complete liquid phase was covered by one cluster (dark blue) (Figure 4c(III)).
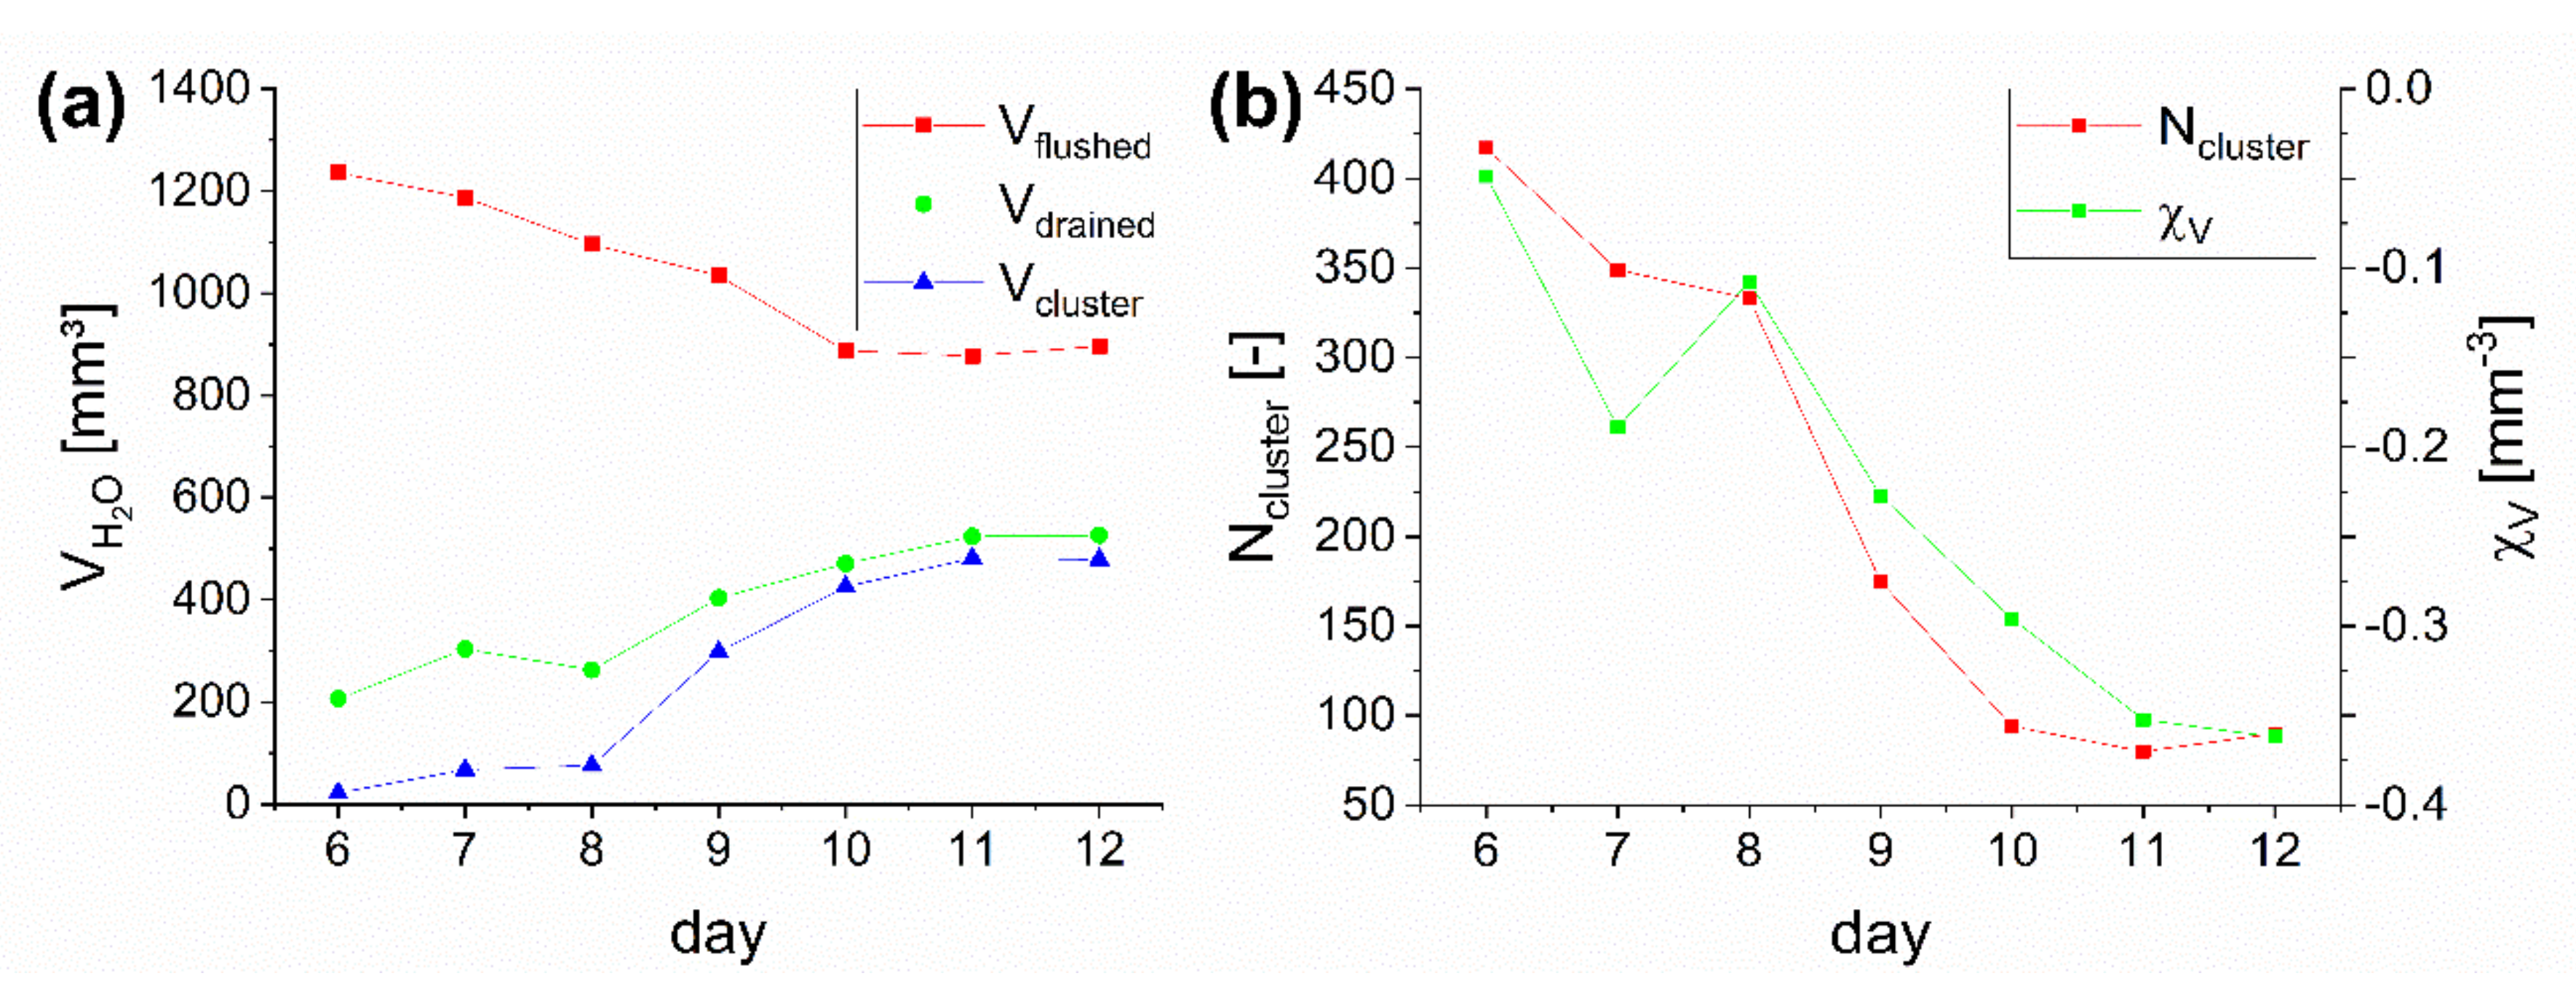
Figure 5a displays the total water volume over time in the drained and flushed conditions. In addition, the largest cluster in the flushed condition is shown. The percentages below are in relation to the water content on day 6 after flushing.
The water content in the flushed condition successively decreased from 100% to 72.6% (1236 to 897 mm³) (Figure 5a). The water retention in the drained condition increased from 16.7% to 42.6% (206 to 526 mm³) over the duration of the experiment. At the same time, the volume of the largest cluster increased from 1.8% to 38.8% (22 to 479 mm³). Furthermore, the largest cluster covered 11% of the total retained water at day 6, but 91% on day 12. In addition, the volumetric Euler number confirms that the connectivity increased (Figure 5b). The volumetric Euler number was below 0 at the beginning of the experiment. This can be explained by the often ring-like shape of the retained water along the pore throats between two particles or between a particle and the column wall (see Figure A1 in Appendix B), which contributes a value of 0 to the volumetric Euler number (see Equation (1)). Furthermore, the presence of a few larger clusters with more redundant connectivity led to an overall slightly negative Euler number. Over the experimental period, the volumetric Euler number further dropped, indicating a higher connectivity. The drop in the Euler number can be explained by the creation of more redundant connections due to an increase in the water content and the aggregation of liquid clusters (evidenced by the decrease in the total number of clusters) (Figure 5b). The measurement in the drained condition on day 8 conspicuously does not fit the trends observed.
4. Discussion
4.1. Applicability of the MRI Approach
The current study showed the applicability of MRI as a noninvasive and non-depth-limited method for visualizing the four fractions of a porous medium (water, air, particle, and biofilm). A compromise has to be made regarding the resolution, as the resolution hampers the quantification of the biofilm. An increase in resolution is possible when considering a smaller sample diameter, higher magnetic field strength, and a higher number of replications for averaging. For example, Caizán-Juanarena, Krug [24] achieved a resolution of 30 µm × 30 µm × 30 µm on granular bioanodes when using MRI.
An advantage of the method is that only small amounts of contrast agents are necessary. As reported in previous MRI studies, paramagnetic ions can enhance the contrast between the biofilm and liquid phase [14,15,25,26]. Furthermore, the addition of low iron dosages has been reported to promote biofilm formation [27,28,29].
4.2. Biofilm Growth under Fluctuating Water Level
In the literature, complex biofilm morphologies have been reported in saturated porous media. In general, these can be described as the surface coverage of particles, cluster-like biofilm structures filling complete voids [12], and biofilm colonies growing as streamers between pore throats [18], as well as intermediate structures [11]. In saturated porous media, restrictive nutrient and oxygen supply, as well as local shear rates, must be considered [11,30,31]. The availability of water becomes an additional restriction in partially saturated porous media [1,3]. In the present study, preferential spots for biofilm growth were found mainly between the pore throats of two particles or between a glass sphere and the column wall. Biofilm clusters filling voids were observed to a lesser extent. No distinct biofilm was recognizable at the glass sphere surface. However, this outcome does not mean that no biofilm grew on the glass sphere surface. As the pore throats retained water in the form of pendular rings, these regions were identified as preferential spots for biofilm growth. Similar web-like structures of EPS that connect single particles were identified in real soil samples [1,32].
Compared to most studies, the size of the glass spheres and the resulting void space in our study were larger. This may have influenced the extent of biofilm growth. The biofilm in our study had to grow larger to achieve bridging between particles or to cover whole voids, which also affected its resistance to hydrodynamic conditions (i.e., shear) or other physical constraints. Within randomly packed beds of a smaller particle size, the coverage of whole voids might become more pronounced.
4.3. Impact of Biofilm on the Liquid Phase
In accordance with the literature, it was shown that biofilm enhances water retention [5,6,7]. Potential ways biofilm may affect water-holding properties include: (1) structural changes via pore size accumulation, (2) the high water-holding capacity of the EPS matrix, (3) changes in soil wettability due to surface coverage, and (4) the alteration of water–air–surface tension [3,5]. With the present imaging approach, phenomena could be directly assessed and visualized. The usage of a randomly packed bed consisting of monodisperse 2 mm glass spheres revealed structural changes due to the blockage of pore throats. Thus, the entrapment of water above the pore throats played the most dominant role. In addition, the entrapment of air also increased when flushing the sample. Certainly, the usage of smaller particles and the application of lower matrix potentials would drastically reduce the amount of water entrapped above bioclogged throats.
However, Tecon and Or [1] pointed out that the connectivity of the liquid phase is relevant for transport processes on all scales. As a result of the increased connectivity due to the aggregation within one continuous top-to-bottom liquid cluster, the transport processes may have been enhanced in partially saturated conditions. Nevertheless, in completely saturated conditions, the biofilm at the pore throats would hamper transport processes. Overall, this is in agreement with the findings of Chenu and Roberson [10], who achieved a faster diffusion of glucose through artificial EPS-amended clay compared to pure clay for various matrix potentials.
5. Conclusions
MRI was a suitable analytical tool for visualizing the growth of biofilm within a partially saturated porous medium. This approach allowed us to differentiate and quantify the liquid, gaseous, and solid phases after flushing and drainage events. In addition, the biofilm fraction could be visualized but not quantified in the current state.
The biofilm grew preferentially in pore throats that remained permanently wetted in the flushed and drained conditions. Biofilm also filled voids to a lesser extent. The biofilm did not grow distinctly enough to be recognized on the free surface of glass spheres by means of MRI.
As a result of the usage of coarse monodisperse 2 mm glass spheres, the blocking of pore throats by biofilm was determined as the dominant water retention mechanism. With the ongoing biofilm accumulation, most of the water was entrapped above the bioclogged throats. In addition, a higher entrapment of air was found when flushing the sample.
Ongoing biofilm accumulation led to an increase in the connectivity of the liquid phase. Therefore, the transport of nutrients may potentially be enhanced in partially saturated systems. However, in completely saturated conditions the blocking of throats by biofilms would hamper transport processes.
Supplementary Materials
The following are available online at https://www.mdpi.com/article/10.3390/w13182456/s1. Video S1: Biofilm growth in a monodisperse porous medium.
Author Contributions
Conceptualization, all authors; validation, all authors; investigation, F.R. and K.S.; writing—original draft preparation, F.R.; writing—review and editing, all authors; visualization, F.R. and K.S.; supervision, H.H. and M.W. All authors have read and agreed to the published version of the manuscript.
Funding
DFG is acknowledged for financial support with regard to the 200 MHz spectrometer (INST 121384/137-1 FUGG).
Institutional Review Board Statement
Not applicable.
Informed Consent Statement
Not applicable.
Data Availability Statement
The data presented in this study are available on request from the corresponding author.
Acknowledgments
Bruker Biospin µ-Imaging, G. Guthausen, N. Schork, and S. Schuhmann are thanked for providing the Matlab scripts used for image processing and keeping the instrumental facility Pro2NMR running.
Conflicts of Interest
The authors declare no conflict of interest.
Appendix A
Cultivation under Saturated Conditions for OCT Measurements
The sample was inoculated with Bacillus subtilis precultures grown at 30 °C overnight in Luria broth (LB) medium. For the cultivation, a feed solution with the concentrations shown in Table A1 was prepared and autoclaved. The feed solution was constantly fed into a beaker through a peristaltic pump. This beaker was connected to the probes and served as a reservoir for mixing, recirculation, and oxygen input through continuous stirring. An overflow drain allowed the discharge of excess solution.
To start the cultivation, the beaker was inoculated with 5 mL of preculture. Then, the mixture was pumped through the probes for 15 min to ensure a good distribution of bacteria, followed by a one-hour waiting period to allow for surface attachment. This procedure was repeated a second time. During the following cultivation, the probes were constantly fed from the beaker with an average filter velocity of 5.4 m/h, resembling 0.6 mL/min. The probes were used as an indication of biofilm growth over time and could be examined with OCT because of the complete saturation.

Table A1.
Substances added to one liter of demineralized water for preparing the feed solution.
| Substance | Concentration [mg/L] |
|---|---|
| Tryptophan | 5 |
| Phenylalanine | 5 |
| Thiamine hydrochloride | 0.67 |
| ZnCl2 | 0.136 |
| MnCl2 | 9.9 |
| FeCl2 | 0.5 |
| CaCl2 | 110 |
| MgCl2 | 410 |
| Glycerol | 500 |
Appendix B
Figure A1.
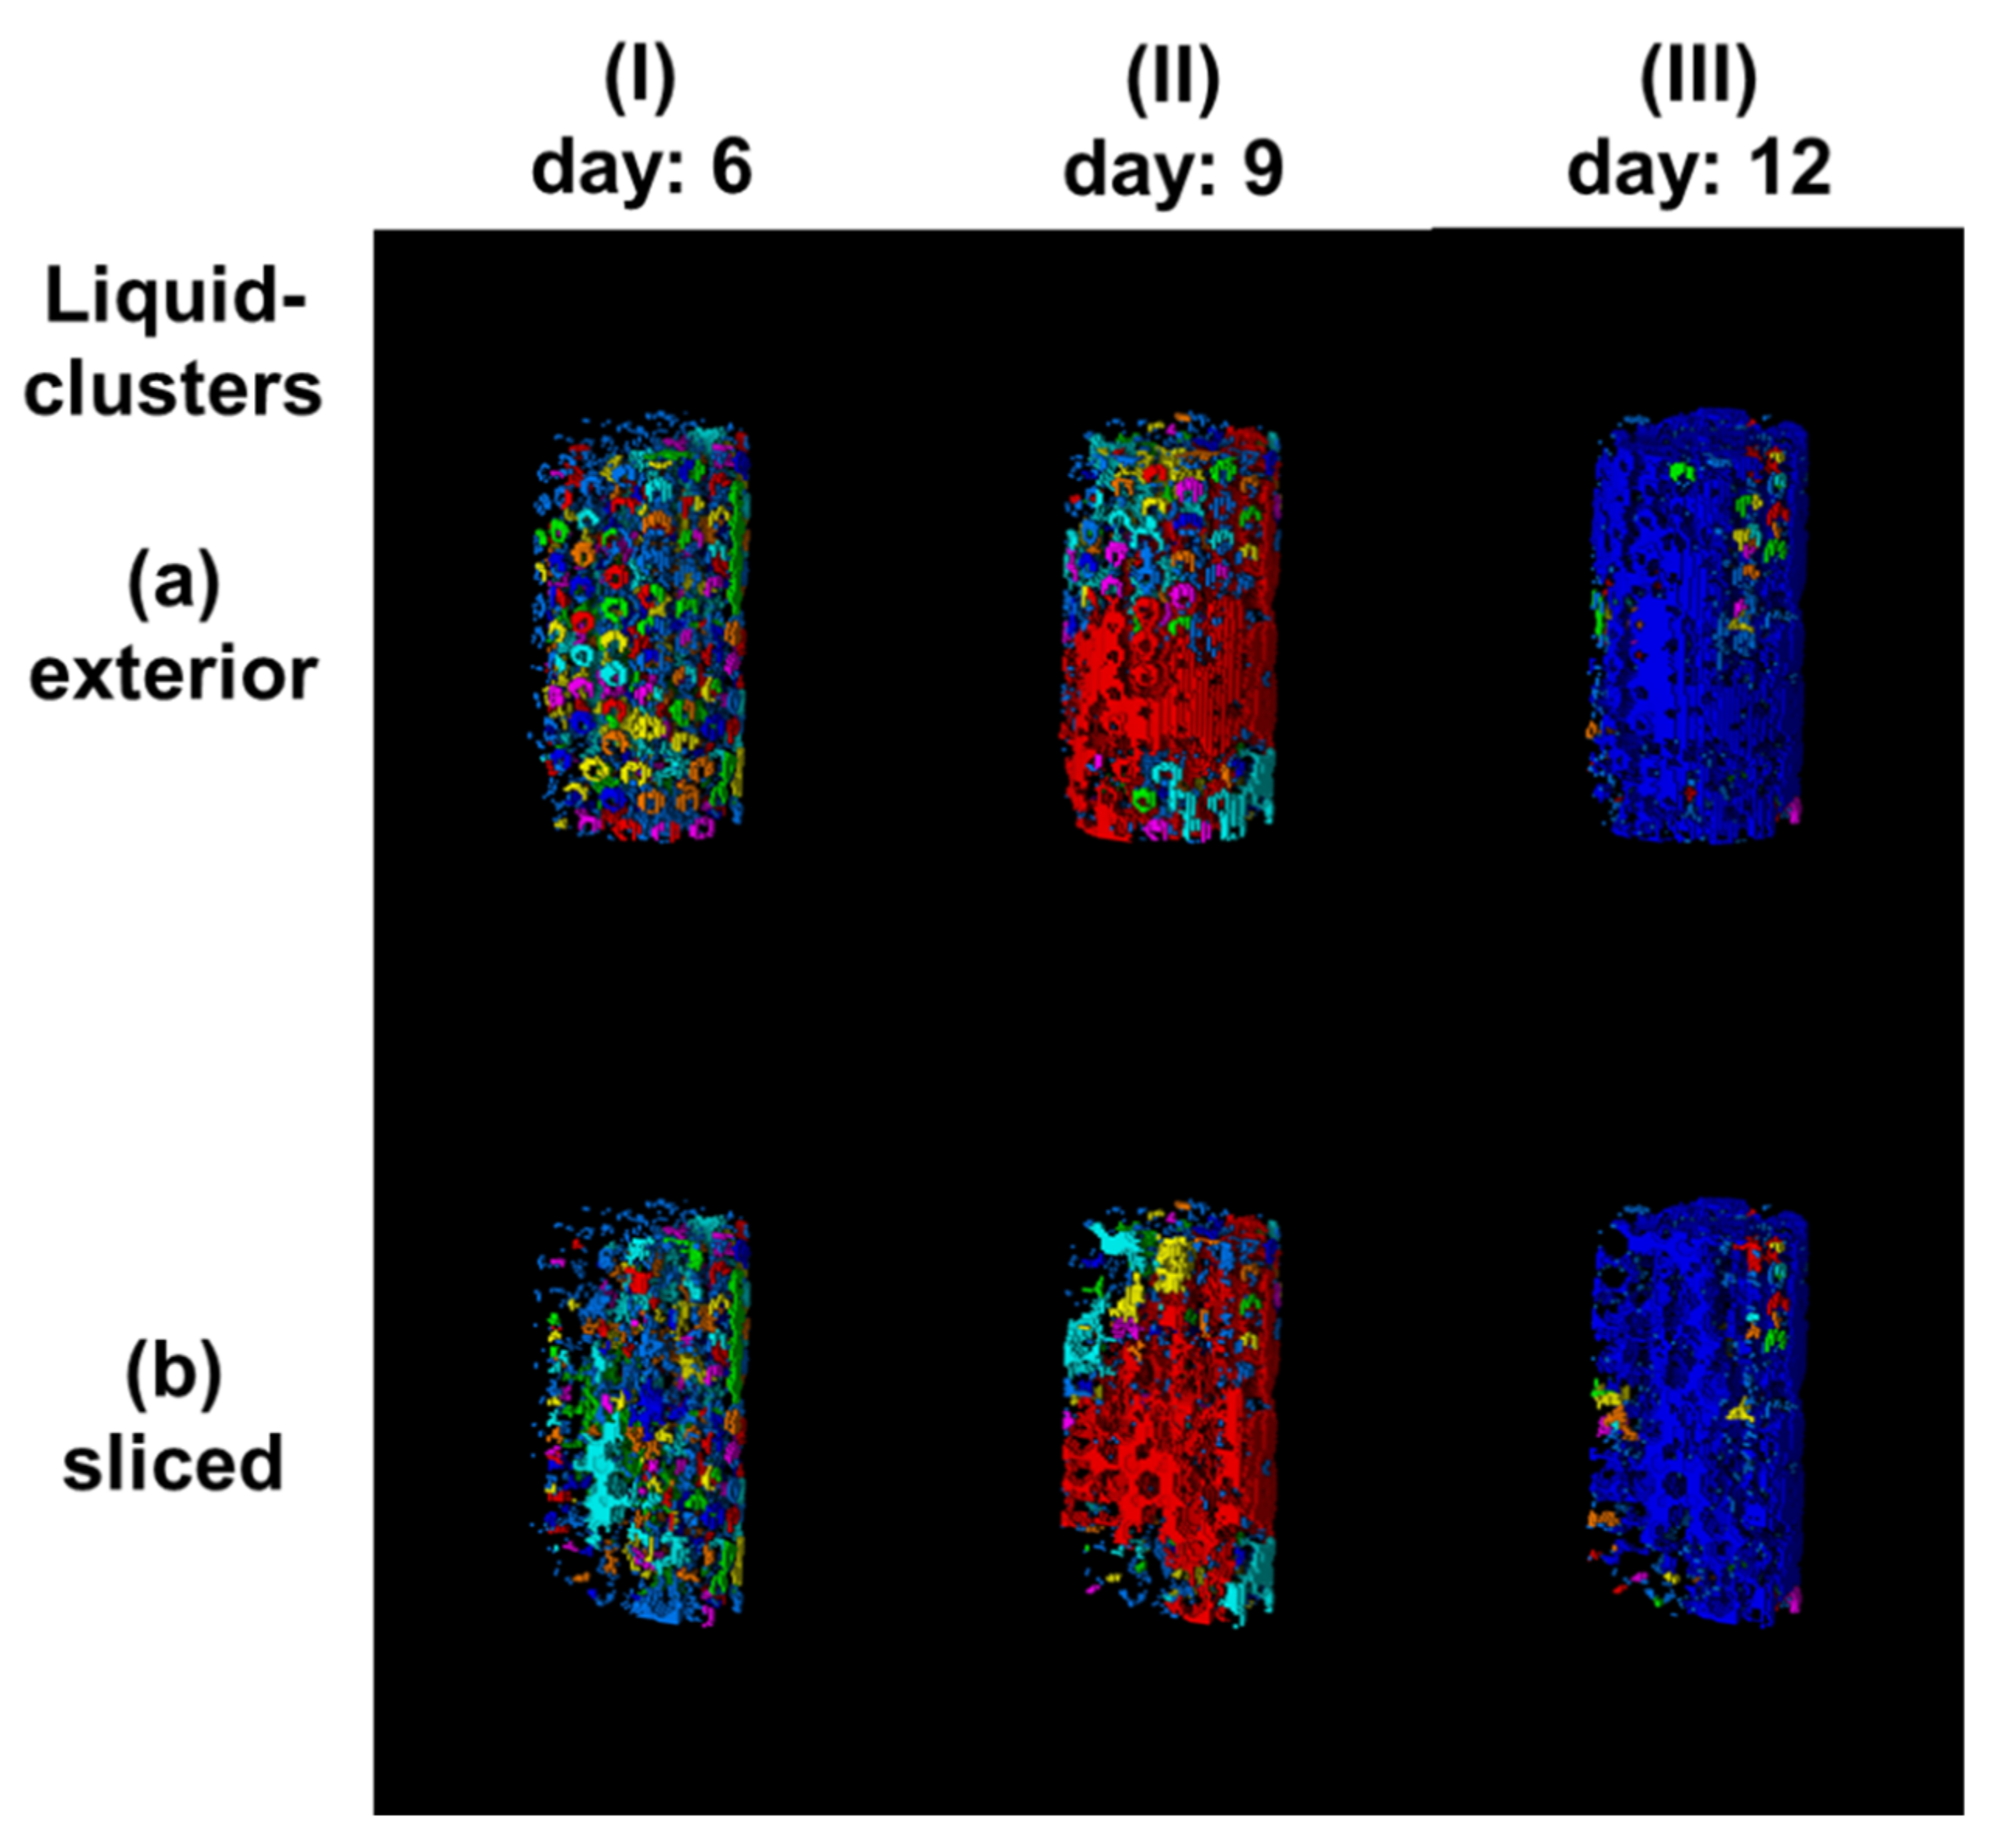
Visualization of liquid clusters. The same dataset is shown from an exterior perspective (a) and sliced through the center (b). On day 6, ring-like structures of retained water can be recognized. At day 9, a dominant cluster can be recognized; this cluster almost covers the complete liquid phase at day 12.
Figure A1.
Visualization of liquid clusters. The same dataset is shown from an exterior perspective (a) and sliced through the center (b). On day 6, ring-like structures of retained water can be recognized. At day 9, a dominant cluster can be recognized; this cluster almost covers the complete liquid phase at day 12.

References
- Tecon, R.; Or, D. Biophysical processes supporting the diversity of microbial life in soil. FEMS Microbiol. Rev. 2017, 41, 599–623. [Google Scholar] [CrossRef] [PubMed]
- Brussaard, L. Ecosystem services provided by the soil biota. In Soil Ecology and Ecosystem Services; Oxford University Press: Oxford, UK, 2012; pp. 45–58. [Google Scholar]
- Or, D.; Smets, B.F.; Wraith, J.M.; Dechesne, A.; Friedman, S.P. Physical constraints affecting bacterial habitats and activity in unsaturated porous media—A review. Adv. Water Resour. 2007, 30, 1505–1527. [Google Scholar] [CrossRef]
- Flemming, H.-C.; Wingender, J. The biofilm matrix. Nat. Rev. Microbiol. 2010, 8, 623. [Google Scholar] [CrossRef] [PubMed]
- Zheng, W.; Zeng, S.; Bais, H.; LaManna, J.M.; Hussey, D.S.; Jacobson, D.L.; Jin, Y. Plant Growth-Promoting Rhizobacteria (PGPR) Reduce Evaporation and Increase Soil Water Retention. Water Resour. Res. 2018, 54, 3673–3687. [Google Scholar] [CrossRef]
- Volk, E.; Iden, S.C.; Furman, A.; Durner, W.; Rosenzweig, R. Biofilm effect on soil hydraulic properties: Experimental investigation using soil-grown real biofilm. Water Resour. Res. 2016, 52, 5813–5828. [Google Scholar] [CrossRef] [Green Version]
- Bozorg, A.; Gates, I.D.; Sen, A. Using bacterial bioluminescence to evaluate the impact of biofilm on porous media hydraulic properties. J. Microbiol. Methods 2015, 109, 84–92. [Google Scholar] [CrossRef] [PubMed]
- Roberson, E.B.; Firestone, M.K. Relationship between desiccation and exopolysaccharide production in a soil Pseudomonas sp. Appl. Environ. Microbiol. 1992, 58, 1284–1291. [Google Scholar] [CrossRef] [Green Version]
- Or, D.; Phutane, S.; Dechesne, A. Extracellular polymeric substances affecting pore-scale hydrologic conditions for bacterial activity in unsaturated soils. Vadose Zone J. 2007, 6, 298–305. [Google Scholar] [CrossRef]
- Chenu, C.; Roberson, E. Diffusion of glucose in microbial extracellular polysaccharide as affected by water potential. Soil Biol. Biochem. 1996, 28, 877–884. [Google Scholar] [CrossRef]
- Carrel, M.; Morales, V.L.; Beltran, M.A.; Derlon, N.; Kaufmann, R.; Morgenroth, E.; Holzner, M. Biofilms in 3D porous media: Delineating the influence of the pore network geometry, flow and mass transfer on biofilm development. Water Res. 2018, 134, 280–291. [Google Scholar] [CrossRef] [Green Version]
- Peszynska, M.; Trykozko, A.; Iltis, G.; Schlueter, S.; Wildenschild, D. Biofilm growth in porous media: Experiments, computational modeling at the porescale, and upscaling. Adv. Water Resour. 2016, 95, 288–301. [Google Scholar] [CrossRef] [Green Version]
- Iltis, G.C.; Armstrong, R.T.; Jansik, D.P.; Wood, B.D.; Wildenschild, D. Imaging biofilm architecture within porous media using synchrotron-based X-ray computed microtomography. Water Resour. Res. 2011, 47. [Google Scholar] [CrossRef]
- Seymour, J.D.; Gage, J.P.; Codd, S.L.; Gerlach, R. Anomalous fluid transport in porous media induced by biofilm growth. Phys. Rev. Lett. 2004, 93, 198103. [Google Scholar] [CrossRef] [PubMed]
- Graf von der Schulenburg, D.A.; Akpa, B.S.; Gladden, L.F.; Johns, M.L. Non-invasive mass transfer measurements in complex biofilm-coated structures. Biotechnol. Bioeng. 2008, 101, 602–608. [Google Scholar] [CrossRef] [PubMed]
- Metzger, U.; Lankes, U.; Hardy, E.H.; Gordalla, B.C.; Frimmel, F.H. Monitoring the formation of an Aureobasidium pullulans biofilm in a bead-packed reactor via flow-weighted magnetic resonance imaging. Biotechnol. Lett. 2006, 28, 1305–1311. [Google Scholar] [CrossRef] [PubMed]
- Vogt, S.J.; Sanderlin, A.B.; Seymour, J.D.; Codd, S.L. Permeability of a growing biofilm in a porous media fluid flow analyzed by magnetic resonance displacement-relaxation correlations. Biotechnol. Bioeng. 2013, 110, 1366–1375. [Google Scholar] [CrossRef] [Green Version]
- Valiei, A.; Kumar, A.; Mukherjee, P.P.; Liu, Y.; Thundat, T. A web of streamers: Biofilm formation in a porous microfluidic device. Lab Chip 2012, 12, 5133–5137. [Google Scholar] [CrossRef]
- Sharp, R.R.; Stoodley, P.; Adgie, M.; Gerlach, R.; Cunningham, A. Visualization and characterization of dynamic patterns of flow, growth and activity of biofilms growing in porous media. Water Sci. Technol. 2005, 52, 85–90. [Google Scholar] [CrossRef]
- Karimifard, S.; Li, X.; Elowsky, C.; Li, Y. Modeling the impact of evolving biofilms on flow in porous media inside a microfluidic channel. Water Res. 2021, 188, 116536. [Google Scholar] [CrossRef]
- Ranzinger, F.; Hille-Reichel, A.; Zehe, E.; Guthausen, G.; Horn, H. Quantification of evaporation and drainage processes in unsaturated porous media using Magnetic Resonance Imaging (MRI). Water Resour. Res. 2020. [Google Scholar] [CrossRef] [Green Version]
- Wagner, M.; Horn, H. Optical coherence tomography in biofilm research: A comprehensive review. Biotechnol. Bioeng. 2017, 114, 1386–1402. [Google Scholar] [CrossRef] [PubMed]
- Vogel, H.-J.; Roth, K. Quantitative morphology and network representation of soil pore structure. Adv. Water Resour. 2001, 24, 233–242. [Google Scholar] [CrossRef]
- Caizán-Juanarena, L.; Krug, J.R.; Vergeldt, F.J.; Kleijn, J.M.; Velders, A.H.; Van As, H.; Ter Heijne, A. 3D biofilm visualization and quantification on granular bioanodes with magnetic resonance imaging. Water Res. 2019, 167, 115059. [Google Scholar] [CrossRef] [PubMed]
- Ranzinger, F.; Herrling, M.P.; Lackner, S.; Grande, V.W.; Baniodeh, A.; Powell, A.K.; Horn, H.; Guthausen, G. Direct surface visualization of biofilms with high spin coordination clusters using magnetic resonance imaging. Acta Biomater. 2016, 31, 167–177. [Google Scholar] [CrossRef] [PubMed]
- Nott, K.P.; Paterson-Beedle, M.; Macaskie, L.E.; Hall, L.D. Visualisation of metal deposition in biofilm reactors by three-dimensional magnetic resonance imaging (MRI). Biotechnol. Lett. 2001, 23, 1749–1757. [Google Scholar] [CrossRef]
- Peulen, T.-O.; Wilkinson, K.J. Diffusion of nanoparticles in a biofilm. Environ. Sci. Technol. 2011, 45, 3367–3373. [Google Scholar] [CrossRef]
- O’Toole, G.A.; Kolter, R. Initiation of biofilm formation in Pseudomonas fluorescens WCS365 proceeds via multiple, convergent signalling pathways: A genetic analysis. Mol. Microbiol. 1998, 28, 449–461. [Google Scholar] [CrossRef]
- Hu, X.; Chen, K.; Lai, X.; Ji, S.; Kaiser, K. Effects of Fe (III) on biofilm and its extracellular polymeric substances (EPS) in fixed bed biofilm reactors. Water Sci. Technol. 2016, 73, 2060–2066. [Google Scholar] [CrossRef] [PubMed] [Green Version]
- Rittmann, B.E. The significance of biofilms in porous media. Water Resour. Res. 1993, 29, 2195–2202. [Google Scholar] [CrossRef]
- Rockhold, M.L.; Yarwood, R.R.; Niemet, M.R.; Bottomley, P.J.; Selker, J.S. Considerations for modeling bacterial-induced changes in hydraulic properties of variably saturated porous media. Adv. Water Resour. 2002, 25, 477–495. [Google Scholar] [CrossRef]
- Chenu, C. Clay—or sand—polysaccharide associations as models for the interface between micro-organisms and soil: Water related properties and microstructure. In Soil Structure/Soil Biota Interrelationships; Elsevier: Amsterdam, The Netherlands, 1993; pp. 143–156. [Google Scholar]
Figure 1.
Experimental setup of the MRI experiments. Flushing (a) and drainage (b) events were conducted in alternating order. The timing of work flows is highlighted in (c). In the flushed and drained conditions, both pumps were turned off to acquire images in a static state.
Figure 1.
Experimental setup of the MRI experiments. Flushing (a) and drainage (b) events were conducted in alternating order. The timing of work flows is highlighted in (c). In the flushed and drained conditions, both pumps were turned off to acquire images in a static state.

Figure 2.
Two-dimensional MRI images displaying the normalized signal intensity in the flushed (a) and drained (b) conditions on days 6, 9, and 12. (a) Biofilm growth can be recognized in the form of dark regions appearing next to contact points of glass spheres. For further clarification, view the highlighted animation (see Supplementary Materials). (b) Water retention increases within the porous medium due to the growth of biofilm. Regions of interest (ROIs) that reveal occurring changes are highlighted in red.

Figure 3.
OCT B-Scans acquired from a previous experiment under permanently saturated conditions. (a) Three glass spheres before inoculation. (b) After 6 days, biofilm could be found on the particle surface in the form of small colonies. (c) Biofilm covered the voids between the particles and the column wall after 14 days. A biofilm as distinct as in (c) was accessible by means of MRI.

Figure 4.
Processed 3D images on days 6, 9, and 12 (a) in the flushed condition, (b) in the drained condition, and (c) analyzed for liquid clusters. Solid material (glass column; porous medium) is superpositioned and displayed in grey. The liquid phase is presented in blue. Air is removed from the visualization (transparent areas). Based on row (b), the liquid phase was analyzed for connectivity and divided into isolated liquid clusters. Each color represents a separate liquid cluster. Please note that more liquid clusters than colors are shown in (c); therefore, one color might also represent multiple isolated liquid clusters.

Figure 5.
Quantification of water content (a) and the total amount of liquid clusters Ncluster, as well as the volumetric Euler number χV (b) over time. Water content decreased in the flushed condition, while water retention in the drained condition increased. Furthermore, the connectivity of the liquid phase in the flushed condition increased, as indicated by the volume of the largest cluster (a) and the volumetric Euler number (b).

Table 1.
Acquisition parameters of MRI experiments.
| MSME 2D | MSME 3D | |
|---|---|---|
| repetition time [sec] | 1.5 | 0.5 |
| echo time [sec] | 0.01 | 0.01 |
| field of view (x, y, z) [mm × mm × mm] | 16 × 24 (6 slices in y-direction) | 15 × 15 × 24 |
| matrix size (x, y, z) | 128 × 6 × 192 | 64 × 64 × 128 |
| voxel size (x, y, z) [µm × µm × µm] | 125 × 125 (200 µm slice thickness in y-direction) | 234 × 234 × 188 |
| number of averages [-] | 4 | 1 |
| measurement time [min:sec] | 12:48 | 34:08 |
Publisher’s Note: MDPI stays neutral with regard to jurisdictional claims in published maps and institutional affiliations. |
© 2021 by the authors. Licensee MDPI, Basel, Switzerland. This article is an open access article distributed under the terms and conditions of the Creative Commons Attribution (CC BY) license (https://creativecommons.org/licenses/by/4.0/).
Share and Cite
MDPI and ACS Style
Ranzinger, F.; Schröter, K.; Horn, H.; Wagner, M. Investigation of Biofilm Growth within a Monodisperse Porous Medium under Fluctuating Water Level Assessed by Means of MRI. Water 2021, 13, 2456. https://doi.org/10.3390/w13182456
AMA Style
Ranzinger F, Schröter K, Horn H, Wagner M. Investigation of Biofilm Growth within a Monodisperse Porous Medium under Fluctuating Water Level Assessed by Means of MRI. Water. 2021; 13(18):2456. https://doi.org/10.3390/w13182456
Chicago/Turabian StyleRanzinger, Florian, Karin Schröter, Harald Horn, and Michael Wagner. 2021. "Investigation of Biofilm Growth within a Monodisperse Porous Medium under Fluctuating Water Level Assessed by Means of MRI" Water 13, no. 18: 2456. https://doi.org/10.3390/w13182456
Note that from the first issue of 2016, this journal uses article numbers instead of page numbers. See further details here.