
Removal of Hydrogen Peroxide Residuals and By-Product Bromate from Advanced Oxidation Processes by Granular Activated Carbon


1
Department of Environmental Science and Engineering, School of Environmental and Chemical Engineering, Shanghai University, Shanghai 200444, China
2
Department of Water Management, Faculty of Civil Engineering and Geosciences, Delft University of Technology, P.O. Box 5048, 2600 GA Delft, The Netherlands
3
Research & Innovation Program, Waternet, Korte Ouderkerkerdijk 7, 1096 AC Amsterdam, The Netherlands
*
Authors to whom correspondence should be addressed.
Water 2021, 13(18), 2460; https://doi.org/10.3390/w13182460
Submission received: 28 July 2021
/
Revised: 31 August 2021
/
Accepted: 2 September 2021
/
Published: 7 September 2021
(This article belongs to the Topic Emerging Solutions for Water, Sanitation and Hygiene)
Abstract
:During drinking water treatment, advanced oxidation process (AOP) with O3 and H2O2 may result in by-products, residual H2O2 and BrO3−. The water containing H2O2 and BrO3− often flows into subsequent granular activated carbon (GAC) filters. A concentrated H2O2 solution can be used as GAC modification reagent at 60 °C to improve its adsorption ability. However, whether low concentrations of H2O2 residuals from AOP can modify GAC, and the impact of H2O2 residuals on BrO3− removal by the subsequent GAC filter at ambient temperature, is unknown. This study evaluated the modification of GAC surface functional groups by residual H2O2 and its effect on BrO3− removal by GAC. Results showed that both H2O2 and BrO3− were effectively removed by virgin GAC, while pre-loaded and regenerated GACs removed H2O2 but not BrO3− anymore. At the ambient temperature 150 µmol/L H2O2 residuals consumed large amounts of functional groups, which resulted in the decrease of BrO3− removal by virgin GAC in the presence of H2O2 residuals. Redox reactions between BrO3− and surface functional groups played a dominant role in BrO3− removal by GAC, and only a small amount of BrO3− was removed by GAC adsorption. The higher the pH, the less BrO3− removal and the more H2O2 removal was observed.
1. Introduction
The combination of an advanced oxidation process (AOP) as a pre-treatment with subsequent managed aquifer recharge (MAR) has been suggested as a comprehensive treatment system to effectively remove various organic micro-pollutants (OMPs) during drinking water production [1,2]. However, a disadvantage of applying ozone-based AOP is the formation of bromate (BrO3−) [3,4,5], a genotoxic carcinogen [6], when bromide (Br−) is contained in the water. WHO, USEPA, and the European Union have set drinking water regulations for the maximum allowable concentration of BrO3− at 0.078 µmol/L (10 µg/L) [7,8,9]. In order to reduce the formation of BrO3−, hydrogen peroxide (H2O2) may be dosed excessively during AOP [10,11]. Since H2O2 contained in the effluent of ozone-based AOP may cause undesired effects to the ecosystem of subsequent MAR systems [12], it needs to be quenched to a low concentration before flowing into the MAR systems. Therefore, a subsequent removal process may be required for both of BrO3− and H2O2 control [13].
A recent study reported that the adsorption-based physical method has been proven to be more effective for BrO3− removal than chemical methods in potable water treatment [14]. Granular activated carbon (GAC) has been used as a powerful adsorbent in water treatment and some drinking water companies use GAC filters to quench the excessive H2O2 from AOP [15]. GAC and modified GAC also have been shown to decrease BrO3− formation [16] or remove BrO3− in a number of studies [17,18,19]. The previous studies focused on the effects of carbon type, pH, temperature, empty bed contact time, source water, natural organic matter (NOM) and other anions on BrO3− removal through kinetic and isotherm tests [17,20]. Previous studies found that BrO3− could be effectively removed by virgin GAC, while some studies revealed that after a certain running time, the loaded and/or regenerated GAC was no longer effective for BrO3− removal [17,20]. For example, 100% BrO3− removal was achieved in the first month and declined to around 5% removal after 11 months in a pilot with an empty bed contact time of 15 min [21]. The performance of GAC in most applications is influenced by its surface chemistry [22,23,24], so the modification of this GAC property, especially surface oxygen functional groups, has been frequently the target of a variety of GAC beneficiation treatments [25]. Oxidation as one of the most conventional modifications is mainly used to introduce carbon–oxygen surface groups in GAC [26]. Some oxidants, such as HNO3, O3 and H2O2, have been tested for GAC modification to increase the oxygen surface groups, and results indicated that the oxidation of GAC increased the content of acidic oxygen surface groups and the adsorption capacity of Hg, Cd, Cr(III), Cr(VI) and Cu(II) [26,27,28]. The oxidation treatment of GAC as a rule was performed mostly using O2 and acid, and rarely with H2O2. The real situation in practice is the co-presence of BrO3− and H2O2, while as far as to the authors’ knowledge, it has not been known whether the presence of H2O2 as a modification reagent of GAC can play a positive role in BrO3− adsorption by GAC during drinking water treatment. However, another possibility could be that the co-presence of BrO3− and H2O2 may compete the active sites or oxygen-containing functional groups of GAC so that they may negatively impact each other’s removal. What is more, the H2O2 decomposition product oxygen was speculated to cover the active sites on the surface of GAC or block the micropores [29], so that the presence of H2O2 may decrease BrO3− removal efficiency. Oppositely, the presence of H2O2 as a strong oxidant to modify GAC may increase the BrO3− removal, as stated earlier. However, till now it has not yet been investigated whether the co-presence of H2O2 and BrO3− can improve BrO3− removal by GAC.
The objectives of this study were to assess whether the presence of residual H2O2 from AOP in the water could improve the removal of BrO3− by GAC and to investigate the mechanism behind it.
2. Materials and Methods
2.1. GAC
Virgin, pre-loaded and regenerated GAC (Norit ROW 0.8 CAT) was used in this study. The virgin GAC was purchased from Sigma-Aldrich (St. Louis, MO, USA). The pre-loaded and regenerated GAC were collected from Dunea drinking water plant (Bergambacht, The Netherlands). The GAC pre-loaded with natural organic matter was already used for two and half years at the Dunea plant. The particle size of all GACs was 0.8–1.0 mm.
The GAC for the batch experiments was prepared by the following procedures. The GAC was ground and sieved to obtain a particle size ranging from 0.25 mm to 0.8 mm. After sieving, the GAC was washed with ultra-pure water until the water remained colorless, and finally the GAC was dried at 175 °C for 72 h to remove volatile impurities.
2.2. Water and Chemical Reagents
The water used in batch experiments was prepared using chemical reagents and deionized water from a Millipore Milli-Q system. Chemicals including sodium bromate (NaBrO3), sodium hydroxide (NaOH), concentrated acid (HCl), sodium carbonate (Na2CO3), sodium bicarbonate (NaHCO3) and hydrogen peroxide (H2O2) were purchased from Sigma-Aldrich. The H2O2 solutions were prepared from a 30% standard solution (Merck, Germany). All chemicals were of analytical grade. All solutions used in this study were prepared using water from a Millipore Milli-Q system.
2.3. Batch Experiments
In a survey of 100 drinking water utilities, BrO3− concentrations were in the range of <0.016–0.5 µmol/L following ozonation of water containing 0.025–5.36 µmol/L Br− [30,31]. It was decided to investigate the upper value of this range in this study, so 0.5 µmol/L BrO3− was achieved in the batch experiments. Batch experiments were conducted using glass bottles with a volume of 1 L. During all the experiments, the batch reactors were wrapped in thin foil. A 0.052 µmol/L NaBrO3 solution was prepared and 3 mL was dosed into the batch reactors to obtain a concentration of 0.5 µmol/L BrO3−. The research of Lekkerkerker and Knol [32] showed that 180 µmol/L H2O2 dosage was enough to form sufficient hydroxyl radicals in the AOP, so the residual H2O2 concentration in effluent water of AOP will not exceed 180 µmol/L. Hence, 150 µmol/L H2O2 was dosed into the batch reactors in this study.
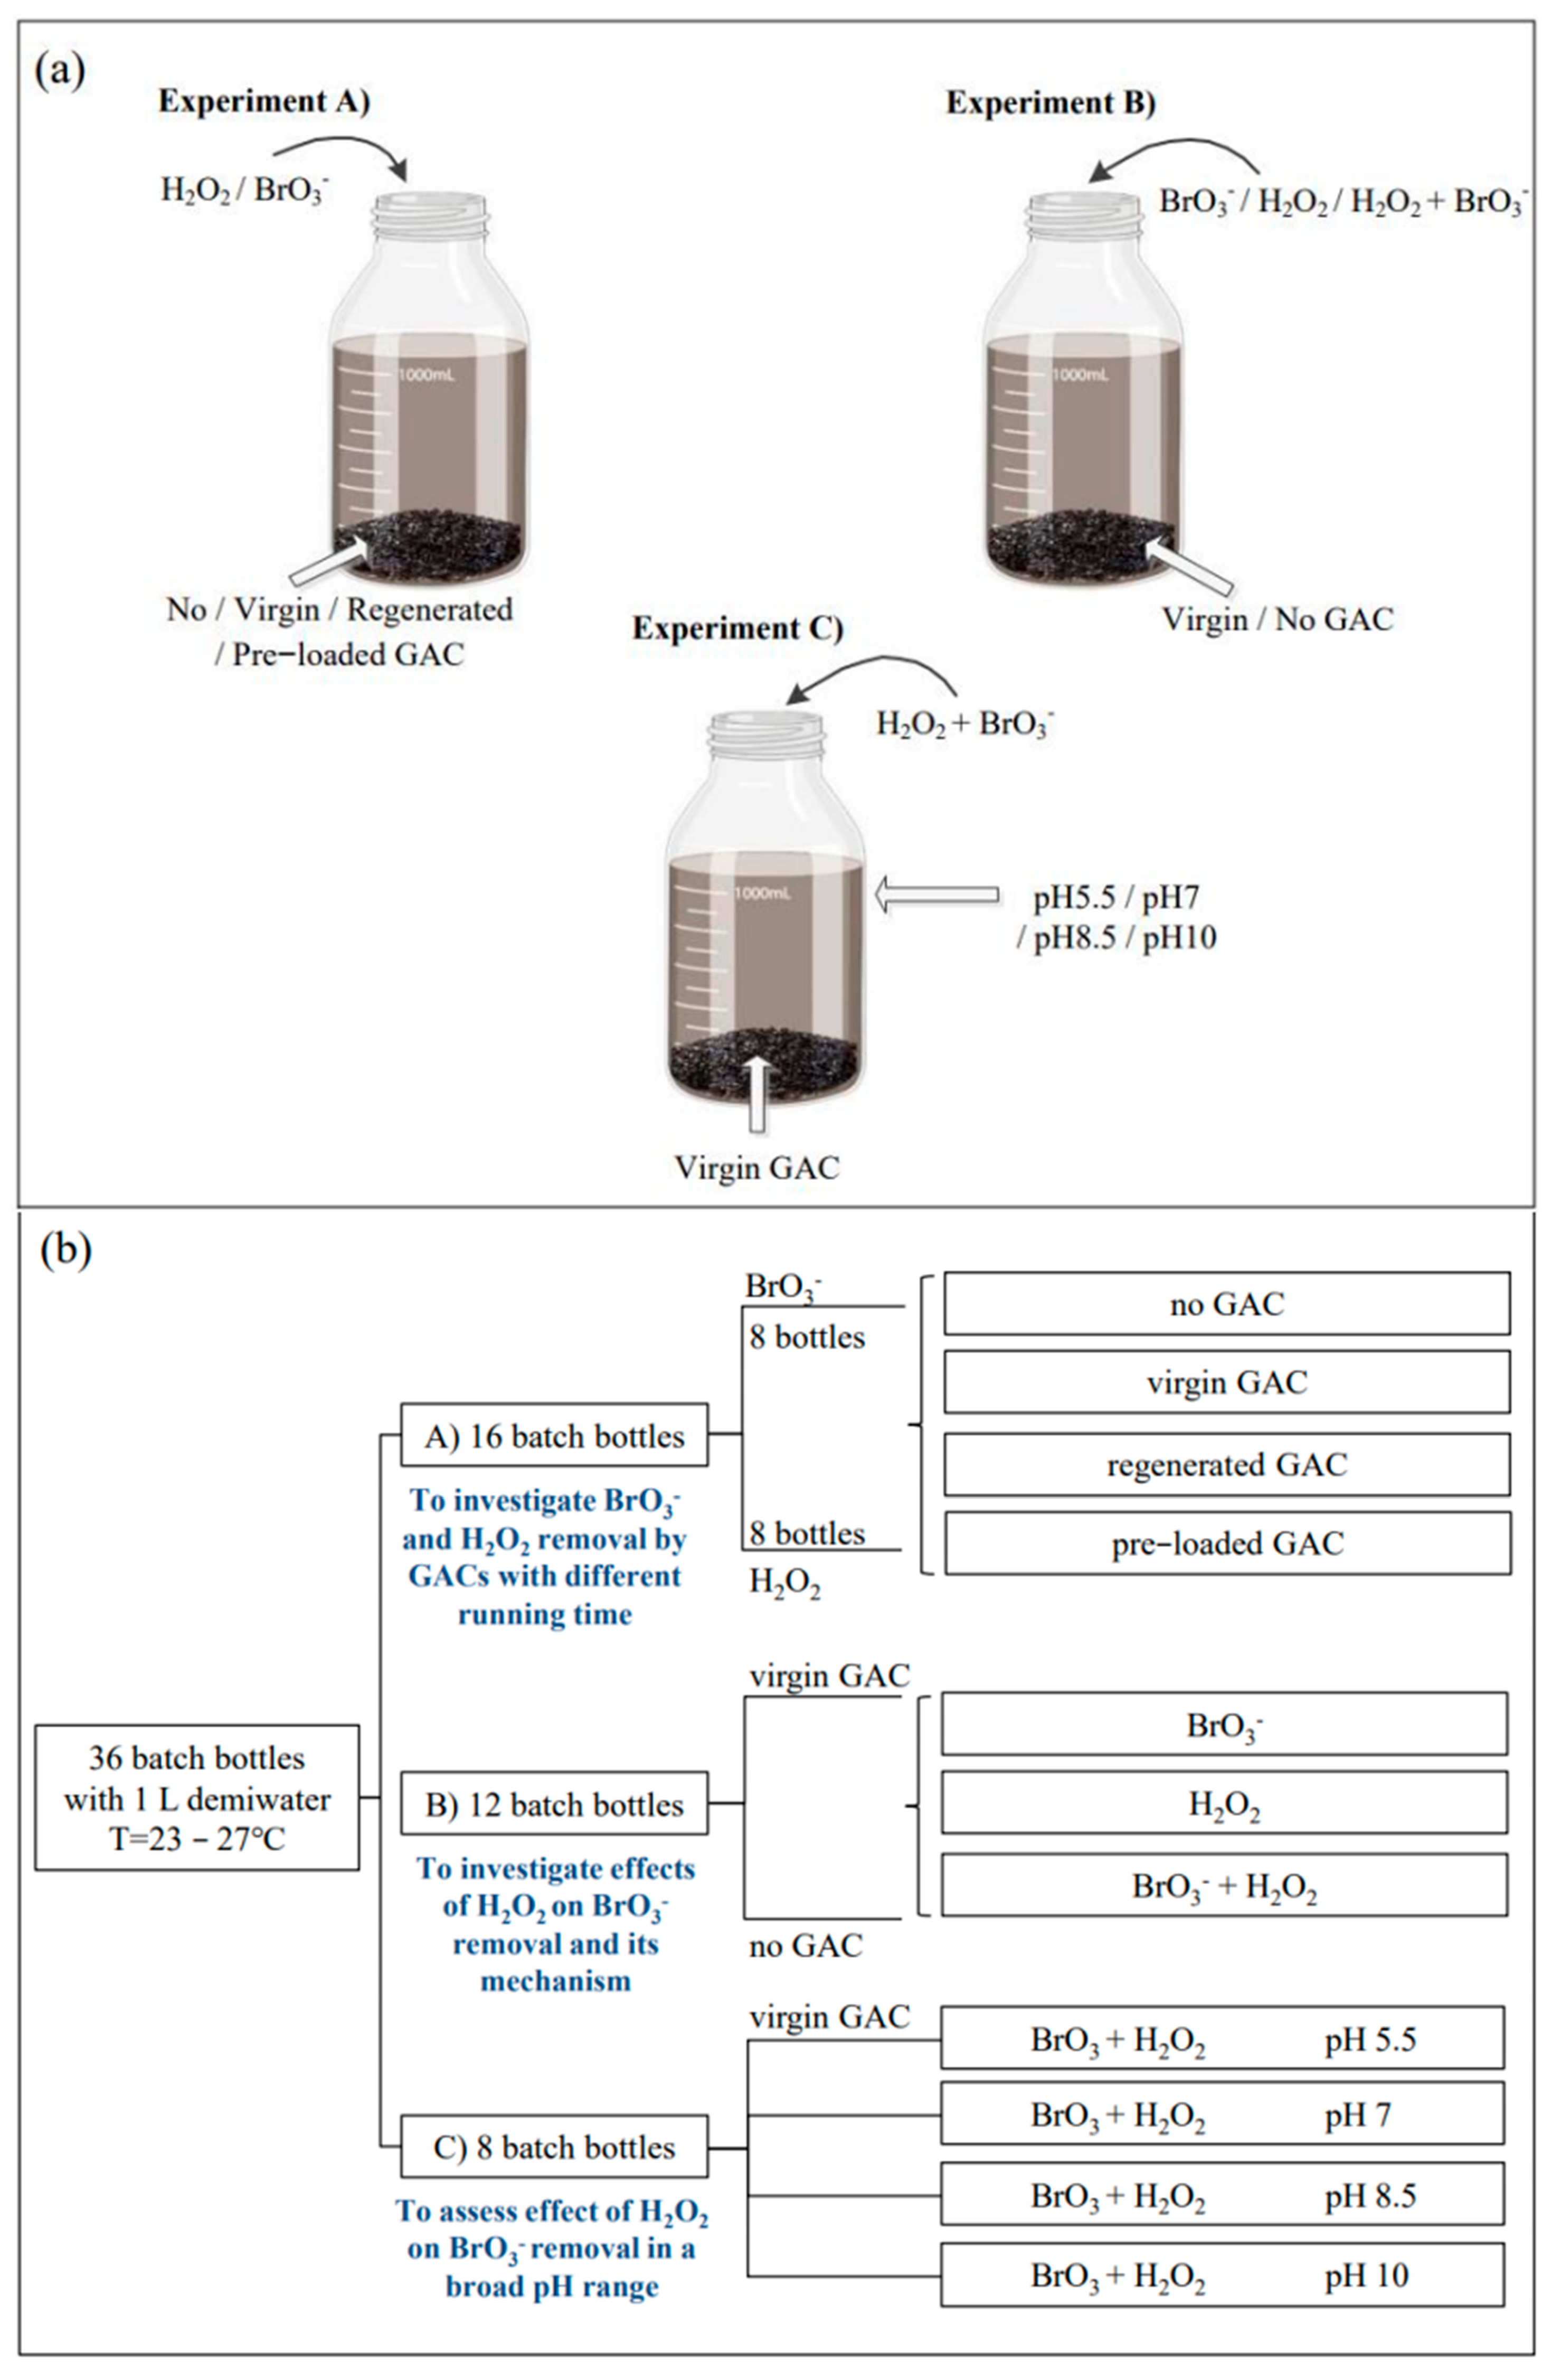
As is shown in Figure 1, a series of experiments were performed using 36 batch glass bottles at ambient temperature of 23–27 °C. The GAC dosage was always 5 g/L, and the H2O2 and BrO3− concentrations were always 150 µmol/L and 0.5 µmol/L, respectively. All the batch reactors with H2O2 were covered by aluminium foils to prevent potential degradation of H2O2 by the light.
In experiment A as shown in Figure 1, 16 batch reactors and three different GACs (virgin GAC, regenerated GAC and pre-loaded GAC) were used to investigate the removal of bromate and H2O2 by GAC with different running time. This experiment involved eight treatment groups (only H2O2, virgin GAC + H2O2, regenerated GAC + H2O2, pre-loaded GAC + H2O2, only BrO3−, virgin GAC + BrO3−, regenerated GAC + BrO3−, and pre-loaded GAC + H2O2). The groups without GAC were references. Before the experiment started, the three GACs were collected to characterize their surface functional groups. Water samples were collected at 0, 10, 20, 60, 120 and 180 min for BrO3− and H2O2 analysis.
In experiment B as shown in Figure 1, 0.5 µmol/L BrO3− and/or 150 µmol/L H2O2 was dosed into batch reactors with virgin GAC to investigate whether the presence of residual H2O2 from AOP improved the removal of BrO3− by GAC. This experiment involved 6 treatment groups (BrO3−, H2O2, BrO3− + H2O2, BrO3− + GAC, H2O2 + GAC, and BrO3− + H2O2 + GAC). The groups without GAC were references. Water samples were collected from the reactors for the analysis of BrO3− and H2O2. To identify the consumed/modified oxygen containing surface functional groups during the contact time, GAC samples were collected for the analysis of surface oxygen functional groups at the beginning and the end of the experiment.
To further assess the effect of H2O2 presence on BrO3− removal in a broad pH range, batch experiment C was performed using eight batch reactors with virgin GAC, H2O2 and BrO3−, in different pH levels ranging from 5.5 to 10. During the whole experiment, the solutions in batch reactors were not buffered. Every 5 min, solution pH was measured, and HCl or NaOH solution was dropped into batch reactors manually to reach a stable pH level. Water samples were collected at 0, 10, 20, 60, 120, 180, 240 and 300 min for BrO3− and H2O2 analysis. Additionally, GAC samples were collected to measure the initial and ending surface functional groups.
2.4. Analytical Methods
2.4.1. Functional Groups Measurement
The amount of surface acidic and basic functional groups was measured by the Boehm method [33]. Four series of GAC samples (0.5 g) were added to four flasks (100 mL). Then, 50 mL of 0.05 mol/L sodium hydrogen carbonate (NaHCO3), sodium carbonate (Na2CO3) and sodium hydroxide (NaOH) were added to the flasks, respectively. The flasks were then sealed and stirred at room temperature for 24 h. The GAC samples were then filtrated and carefully washed. All filtrates were collected and subsequently diluted to 100 mL. Then, the diluent was titrated with 0.05 mol/L HCl and the surface oxygenated groups were determined according to the following assumptions: NaOH neutralizes carboxyl, phenolic and lactonic groups. Na2CO3 neutralizes carboxyl and lactonic groups. NaHCO3 neutralizes carboxyl groups only. The amount of basic surface groups was determined with 0.05 mol/L HCl solution. The filtrate was collected as above, and then titrated with 0.05 mol/L NaOH solution.
2.4.2. Other Analysis and Measurements
Hydrogen peroxide test kits (1.18789.0001, VWR Company, Radnor, PA, USA) with a detection range of 0.44–180 µmol/L were used for water-phase H2O2 measurements because of ease of operation, the rapid decomposition of H2O2 and accuracy of results. After being filtered through 0.45 µm filters, the samples were transferred to a 10/20 mm rectangular cell and measured in a photometer (Spectroquant NOVA 60).
BrO3− was analysed using a Metrohm Schiedam ion chromatograph (SenTix® 940 IDS probe, Multi 340i, WTW, Germany) equipped with a suppressed conductivity detector, using an A Supp 16 150/4.0 column, a guard column, and a 100 µL sample loop. A 3.75 mM Na2CO3 and 0.375 mM NaOH solution was used as the eluent. The eluent flow rate was set at 0.7 mL/min. pH was measured with a SenTix® 940 (WTW) electrode (Xylem Inc., Weiheim, Germany), both using the WTW Multi 3420 m (Xylem Inc., Weiheim, Germany).
3. Results and Discussion
3.1. BrO3− and H2O2 Removal by Three GACs with Different Usage Times
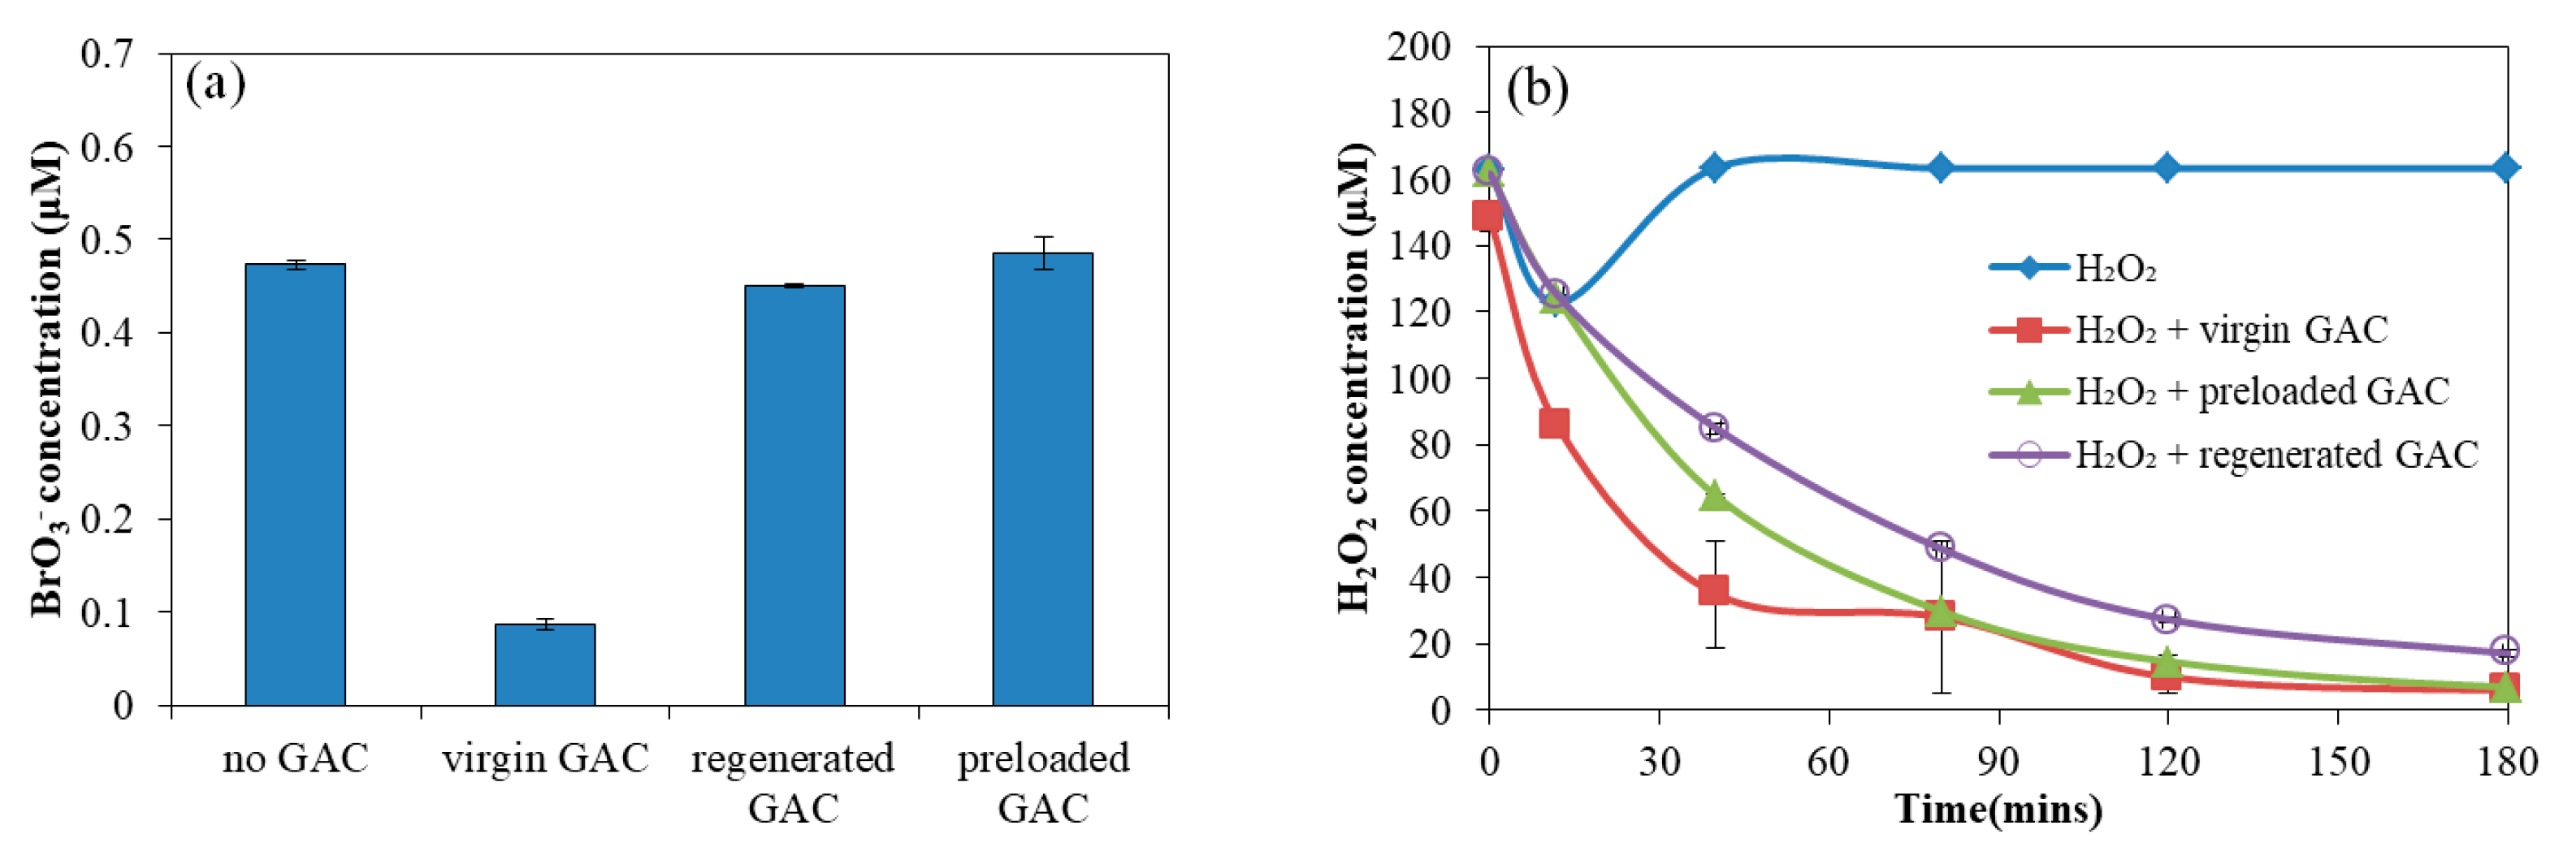
Figure 2 presents H2O2 and BrO3− removal efficiencies within 180 min by virgin GAC, pre-loaded GAC and regenerated GAC, respectively. As is shown in Figure 2a, among the three kinds of GAC, virgin GAC had the best BrO3− removal capacity (81%). No BrO3− removal was observed in the batch reactor without GAC, indicating BrO3− was not self-decomposed or decomposed by microbes in a short experiment period of 180 min. The pre-loaded GAC did not remove BrO3− at all, which is in line with a previous study reporting that BrO3− removal rate by GAC apparently decreased with increasing operation time [34], probably because the active sites or valid functional groups on the surface of GAC were exhausted due to preloading in the preceding two years with natural organic matter present in the drinking water treatment plant [35]. It seems that 3.8% BrO3− was removed by regenerated GAC, which is in line with a previous study reporting that, compared with regenerated GAC, virgin GAC had a better removal effect on BrO3− [36]. This result indicates that the thermal regeneration restored active sites or functional groups on the surface of GAC to some degree. In conclusion, these results indicate that GAC may become invalid for BrO3− removal after a period of running, even after regeneration, in practice. As is shown in Figure 2b, H2O2 was not decomposed in the absence of GAC within 180 min, indicating that the decrease of H2O2 in other groups was caused by GAC instead of other factors. No obvious difference was observed between preloaded GAC and virgin GAC groups. H2O2 removal rate in regenerated GAC group was slightly lower than that in preloaded GAC group. GAC regeneration and recycle slighly decreased H2O2 removal capacity, but regenerated GAC is still able to effectively quench residual H2O2. Previous studies showed that GAC can be used to quench the residual H2O2 after drinking water treatment AOPs, and the catalytic activity of GAC has nothing to do with continuous exposure to hydrogen peroxide, but is related to the physical and chemical properties of the GAC surface [37,38].
3.2. Surface Functional Groups of Three GACs with Different Usage Times
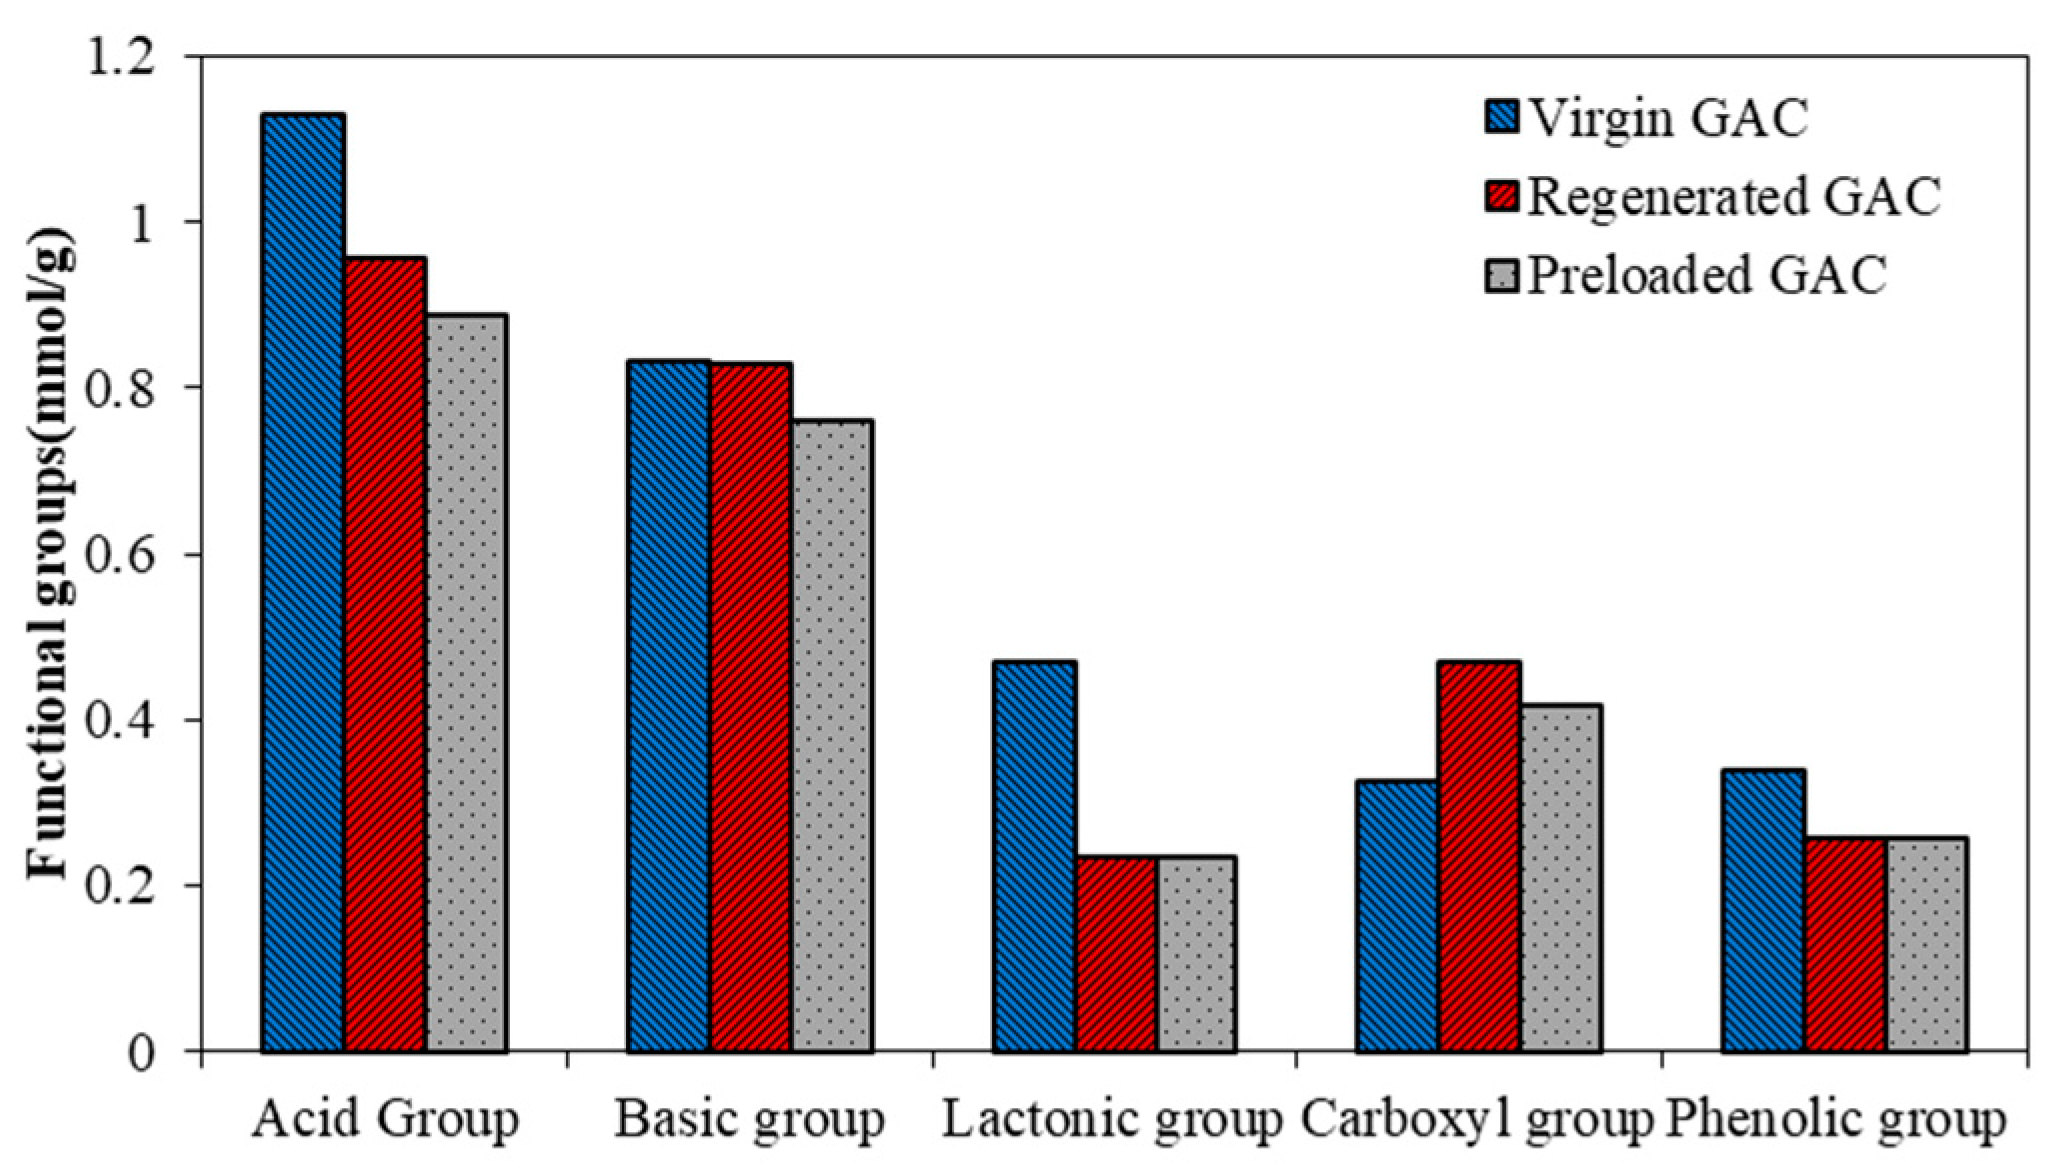
Figure 3 presents the acidic and basic functional groups on the surface of three kinds of GAC with different usage times before the BrO3− and H2O2 removal experiment. Generally, the overall concentrations of acidic and basic functional groups are observed to be in the following order: virgin GAC > regenerated GAC > pre-loaded GAC, although the concentration of basic functional groups on the surface of virgin GAC is the same as that of regenerated GAC, indicating that the virgin GAC contained rich functional groups and the regeneration can recover a portion of functional groups. Usually, regardless of the regeneration method used, the porosity, specific surface area and surface oxygen functional groups on the surface of the regenerated GAC are less than that of the virgin GAC. Mesopores formed during the regeneration are considered to promote the carbon adsorption capacity [39]. Correspondingly, BrO3− removal ability was also recovered after GAC regeneration, but not much (Figure 2). Acid groups are classified to lactonic groups, carboxyl groups and phenolic groups. Among the three acidic functional groups, lactonic groups and phenolic groups on virgin GAC are greater than that on regenerated and pre-loaded GAC. This might also be one of the reasons why virgin GAC reached the highest removal efficiencies of BrO3− and H2O2 (Figure 2).
3.3. Effect of H2O2 on BrO3− Removal by Virgin GAC
To assess the interaction of BrO3− and H2O2 removal by virgin GAC, Figure 4 presents the removal of BrO3− and H2O2 by 5 g/L virgin GAC in the presence and the absence of the other. Figure 4a shows that the initial 0.5 µmol/L BrO3− was removed 60–80% by GAC under the presence and absence of H2O2 in 180 min, respectively. It can be observed that the BrO3− concentration decreased faster in the absence than in the presence of 150 µmol/L H2O2, that is the presence of 150 µmol/L H2O2 negatively impacted BrO3− removal by GAC, indicating 150 µmol/L H2O2 may not successfully modify the surface functional groups of GAC at the ambient temperature. A previous study found that the activated carbon modified with 0.04 mol/L hydrogen peroxide at 75 °C removed 85.6% cobalt from aqueous solution after 1h, while the activated carbon modified at a lower temperature of 25 °C removed only 74% cobalt after 1 h [40]. It further proves that the modification temperature has a great influence on the physical and chemical properties of the activated carbon surface, and the low temperature environment cannot modify GAC well. Figure 4b shows that 150 µmol/L H2O2 was decomposed fully by GAC and its decomposition in the presence and the absence of 0.5 µM BrO3− had no considerable difference during the 180 min contact time (p > 0.05), indicating an ignorable influence of 0.5 µmol/L BrO3− on H2O2 decomposition. In the reference without GAC, both BrO3− and H2O2 showed steady concentrations, indicating that no self-decomposition took place and the removal of BrO3− and H2O2 can be contributed to GAC.
3.4. The Mechanism of H2O2 Impact on BrO3− Removal by Virgin GAC
3.4.1. BrO3− Removal by Adsorption or Reduction?
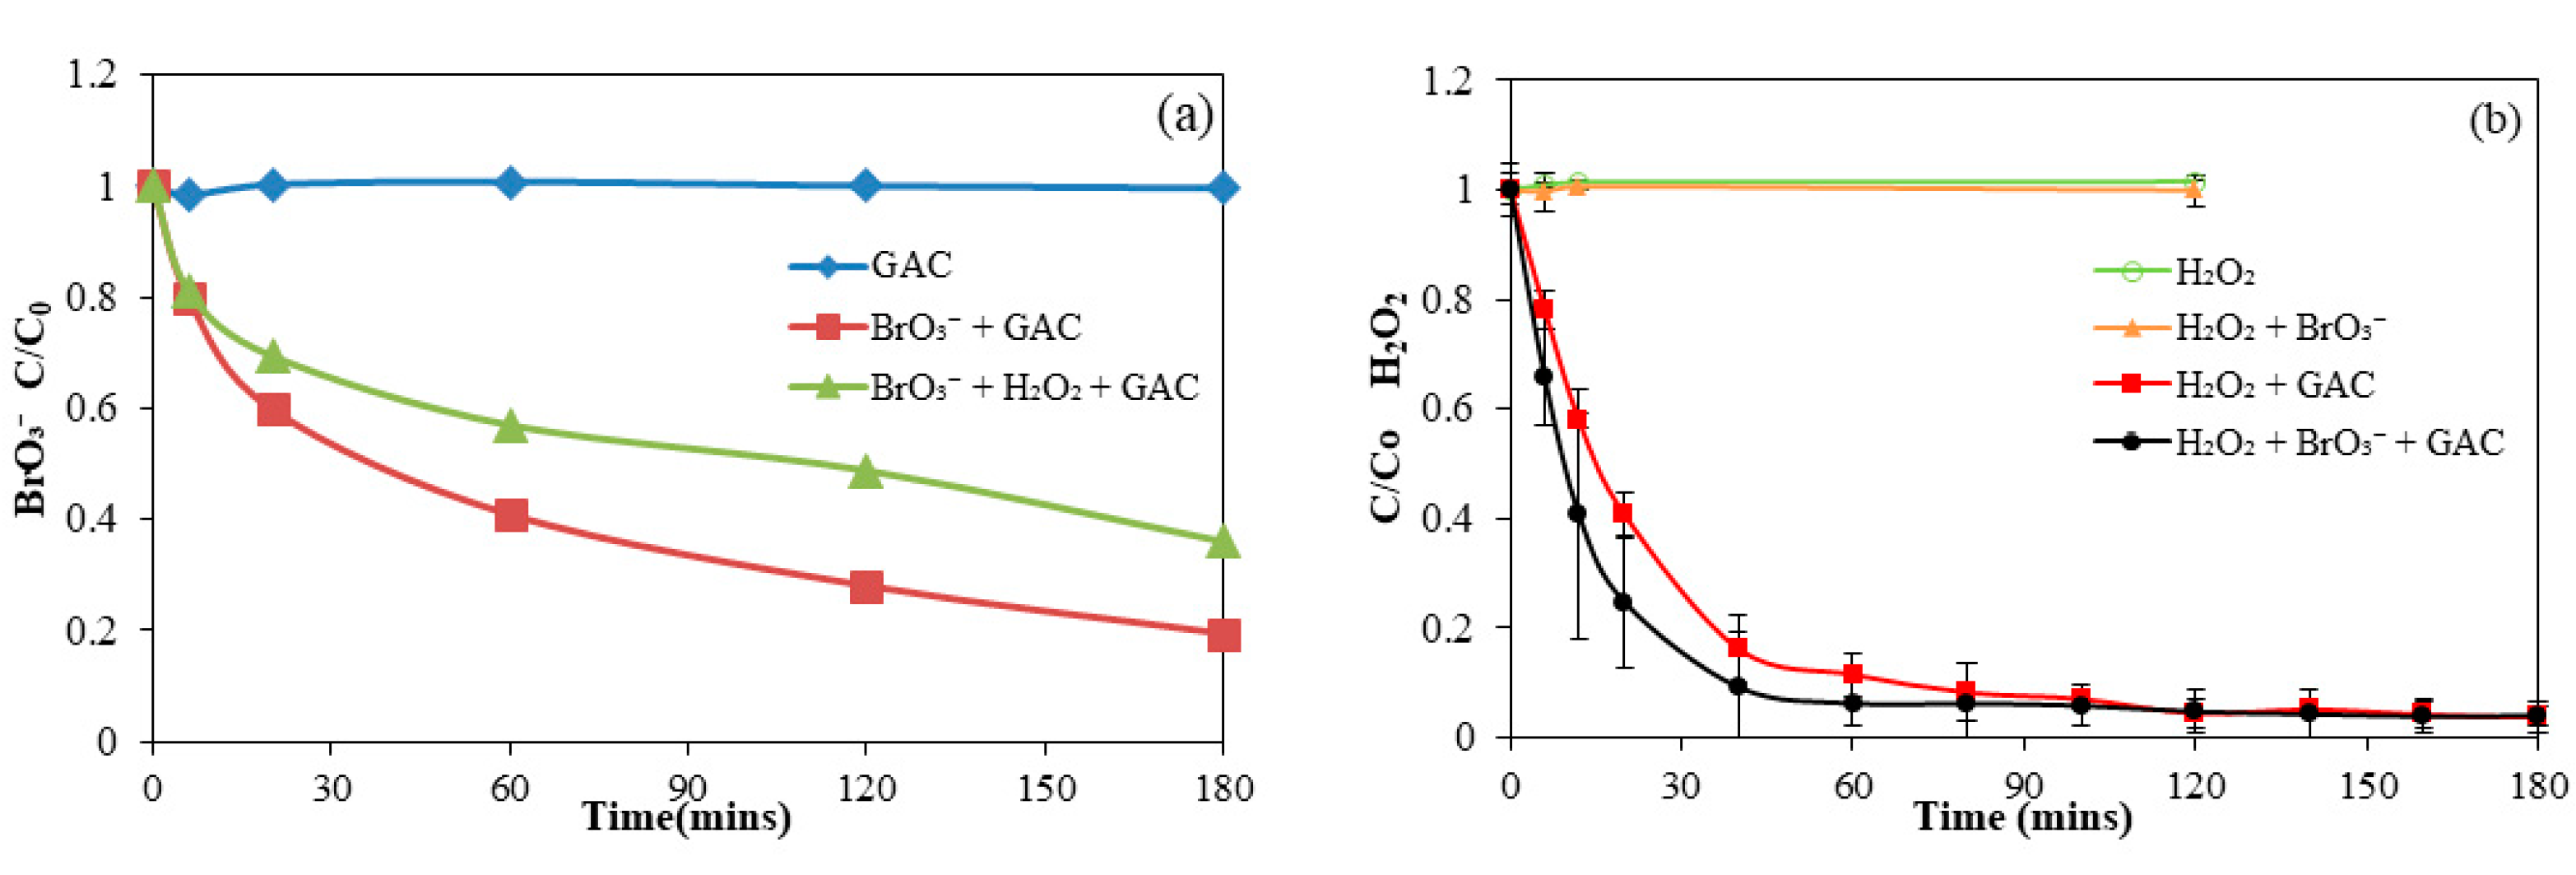
Figure 5 presents the removal of BrO3− by virgin GAC and correspondingly the increase of reaction product Br−, in the presence and absence of H2O2. Under both situations, the BrO3− concentration gradually decreased, and correspondingly the Br− concentration gradually increased with time. The molar mass of BrO3− and Br− in the reactor tends to stabilize after a slight decrease in the first 6 min. This slight decrease could be caused by GAC adsorption. The gradual increase of Br− with the decrease of BrO3− indicates that the removal of BrO3− by virgin GAC is mainly a reduction process, which might involve redox reactions between surface functional groups and BrO3−. Obviously, the presence of 150 µmol/L H2O2 significantly inhibited the removal of BrO3− by virgin GAC. Figure 5 showed that the addition of H2O2 changed the physical and chemical properties of the GAC surface, resulting in a significant decrease in the acidic and basic oxygen-containing functional groups on the GAC surface, thereby reducing the reaction efficiency of the functional groups with BrO3−. When H2O2 and BrO3− coexist, there may be competition for GAC oxygen-containing functional groups and adsorption active sites, which is one of the reasons why BrO3− removal was inhibited by H2O2. In addition, bromine mass loss in BrO3− and Br− is observed due to the presence of H2O2, by comparing Figure 5a,b. During H2O2 decomposition, a small amount of OH· can be generated [41]. The OH· can further oxidize Br− into intermediate products, such as HOBr and BrO− [42], which could explain the bromine mass loss under the situation of H2O2 addition.
3.4.2. Modification of GAC Surface Functional Groups by H2O2
The surface oxygen-containing functional groups of initial GAC and the modified GAC after contacting with BrO3− and H2O2 are presented in Figure 6. It is observed that both H2O2 alone and BrO3− alone consumed acid groups and basic groups, indicating the presence of H2O2 consumed oxygen-containing surface functional groups with BrO3− instead of provided more functional groups. Therefore, the H2O2 concentration of 150 µmol/L could be too low to effectively modify GAC oxygen-containing surface functional groups. Among the three acid groups, both the amount of carboxyl groups and phenolic groups did not change significantly after different reactions and the main change lay in lactonic groups, indicating that H2O2 mainly reacted with lactonic groups. The functional group modification by H2O2 can be explained as follows.
H2O2 has a property of electrophilic attacking, so H2O2 attacks the unsaturated bonds of C=C by electrophilic addition and introduces the phenolic groups [43], as shown in Equation (1). In a previous study [43], around 1.47 mol/L H2O2 was used to modify activated carbon at 60 °C for 2 h and the modification treatment increased the formation of carboxyl groups and carbonyl groups but decreased the formation of phenolic groups, which was explained by the fact that phenolic groups formed in Equation (1) could be further oxidized to carboxyl groups by esterification and dehydration as shown in Equations (2) and (3). A previous study [44] showed that different from the steady rise of carboxyl groups and lactonic groups, the concentration of phenolic groups first increased and then decreased with the increase of H2O2 concentration, which could be caused by the fact that the dehydration of phenolic groups became faster than the formation of phenolic groups with the increase of oxidation ability. Therefore, the low H2O2 concentration, an environmentally relevant concentration, in this study might be not enough to further conduct the following two steps reactions, dehydration and esterification, as shown in Equations (2) and (3), which might explain the increase of phenolic groups instead of carboxyl group. In conclusion, an environmentally relevant concentration of H2O2 from AOP cannot significantly increase the concentrations of carboxyl and lactonic groups due to the limited oxidation ability.
![Water 13 02460 i001]()
![Water 13 02460 i002]()
![Water 13 02460 i003]()


3.5. Effect of pH on BrO3− and H2O2 Removal
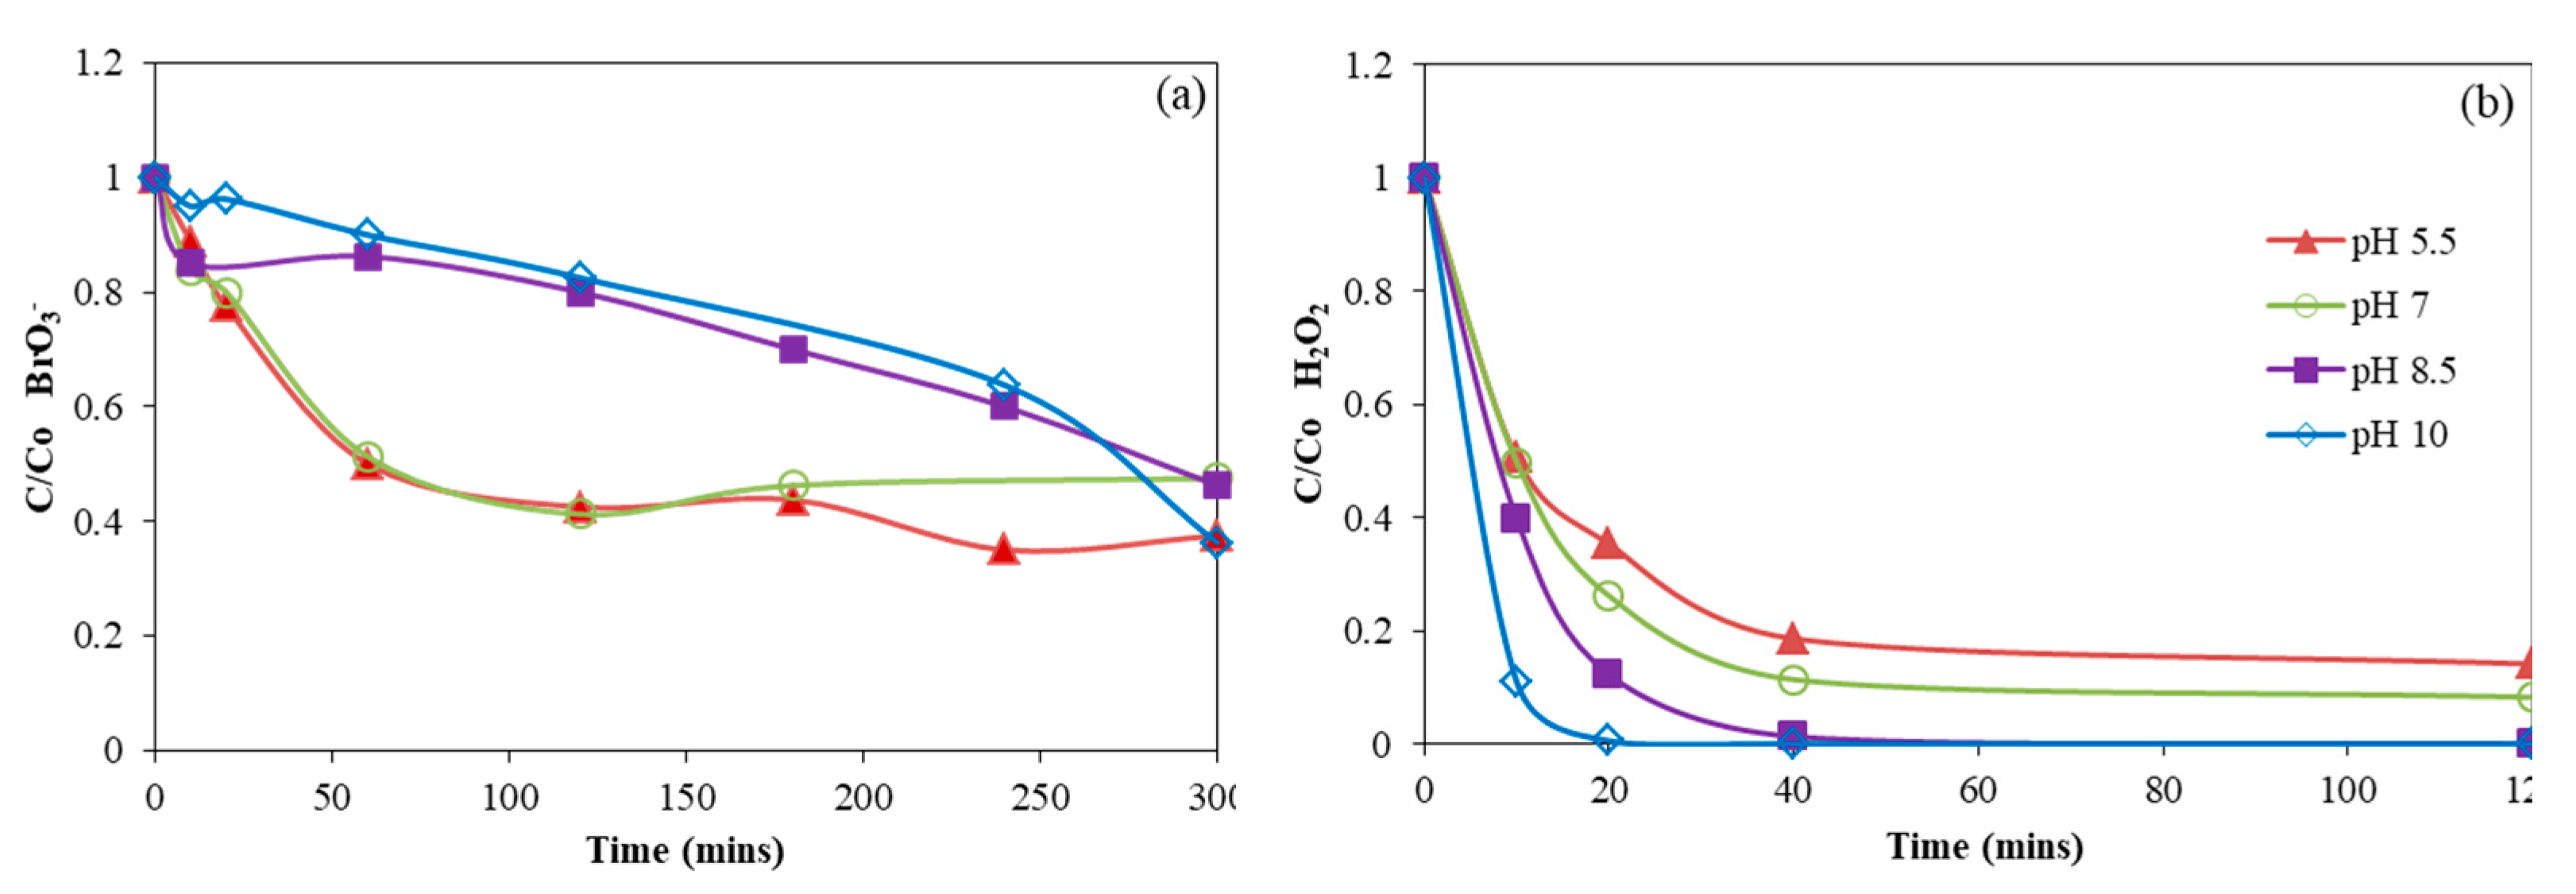
The removal of BrO3− and H2O2 by virgin GAC under different pH conditions is shown in Figure 7. At pH 5.5 and 7, BrO3− concentration decreased sharply within the first 50 min, and then remained constant. In contrast, BrO3− concentrations slowly decreased within the whole 300 min and did not arrive at an equilibrium status at pH 8.5 and 10. Therefore, BrO3− removal efficiency was higher at the acidic and neutral conditions than at the basic condition, which seems in conflict with a previous study [45]. This is probably because (1) BrO3− is a strong oxidizer under low pH conditions, and its reactivity is in direct proportion to the square of the proton concentration [46]; (2) as pH decreases, the protonation of surface functional groups of activated carbon or dissociation of OH− makes the material surface electropositive, resulting in electrostatic attraction of BrO3− [45]. As for H2O2, with the increase of pH, H2O2 decomposition was more efficient. At pH 10, almost all H2O2 was removed while only 64% H2O2 was removed at pH 5.5. The results indicate that a higher pH is favourable to H2O2 removal in GAC filters during drinking water treatment.
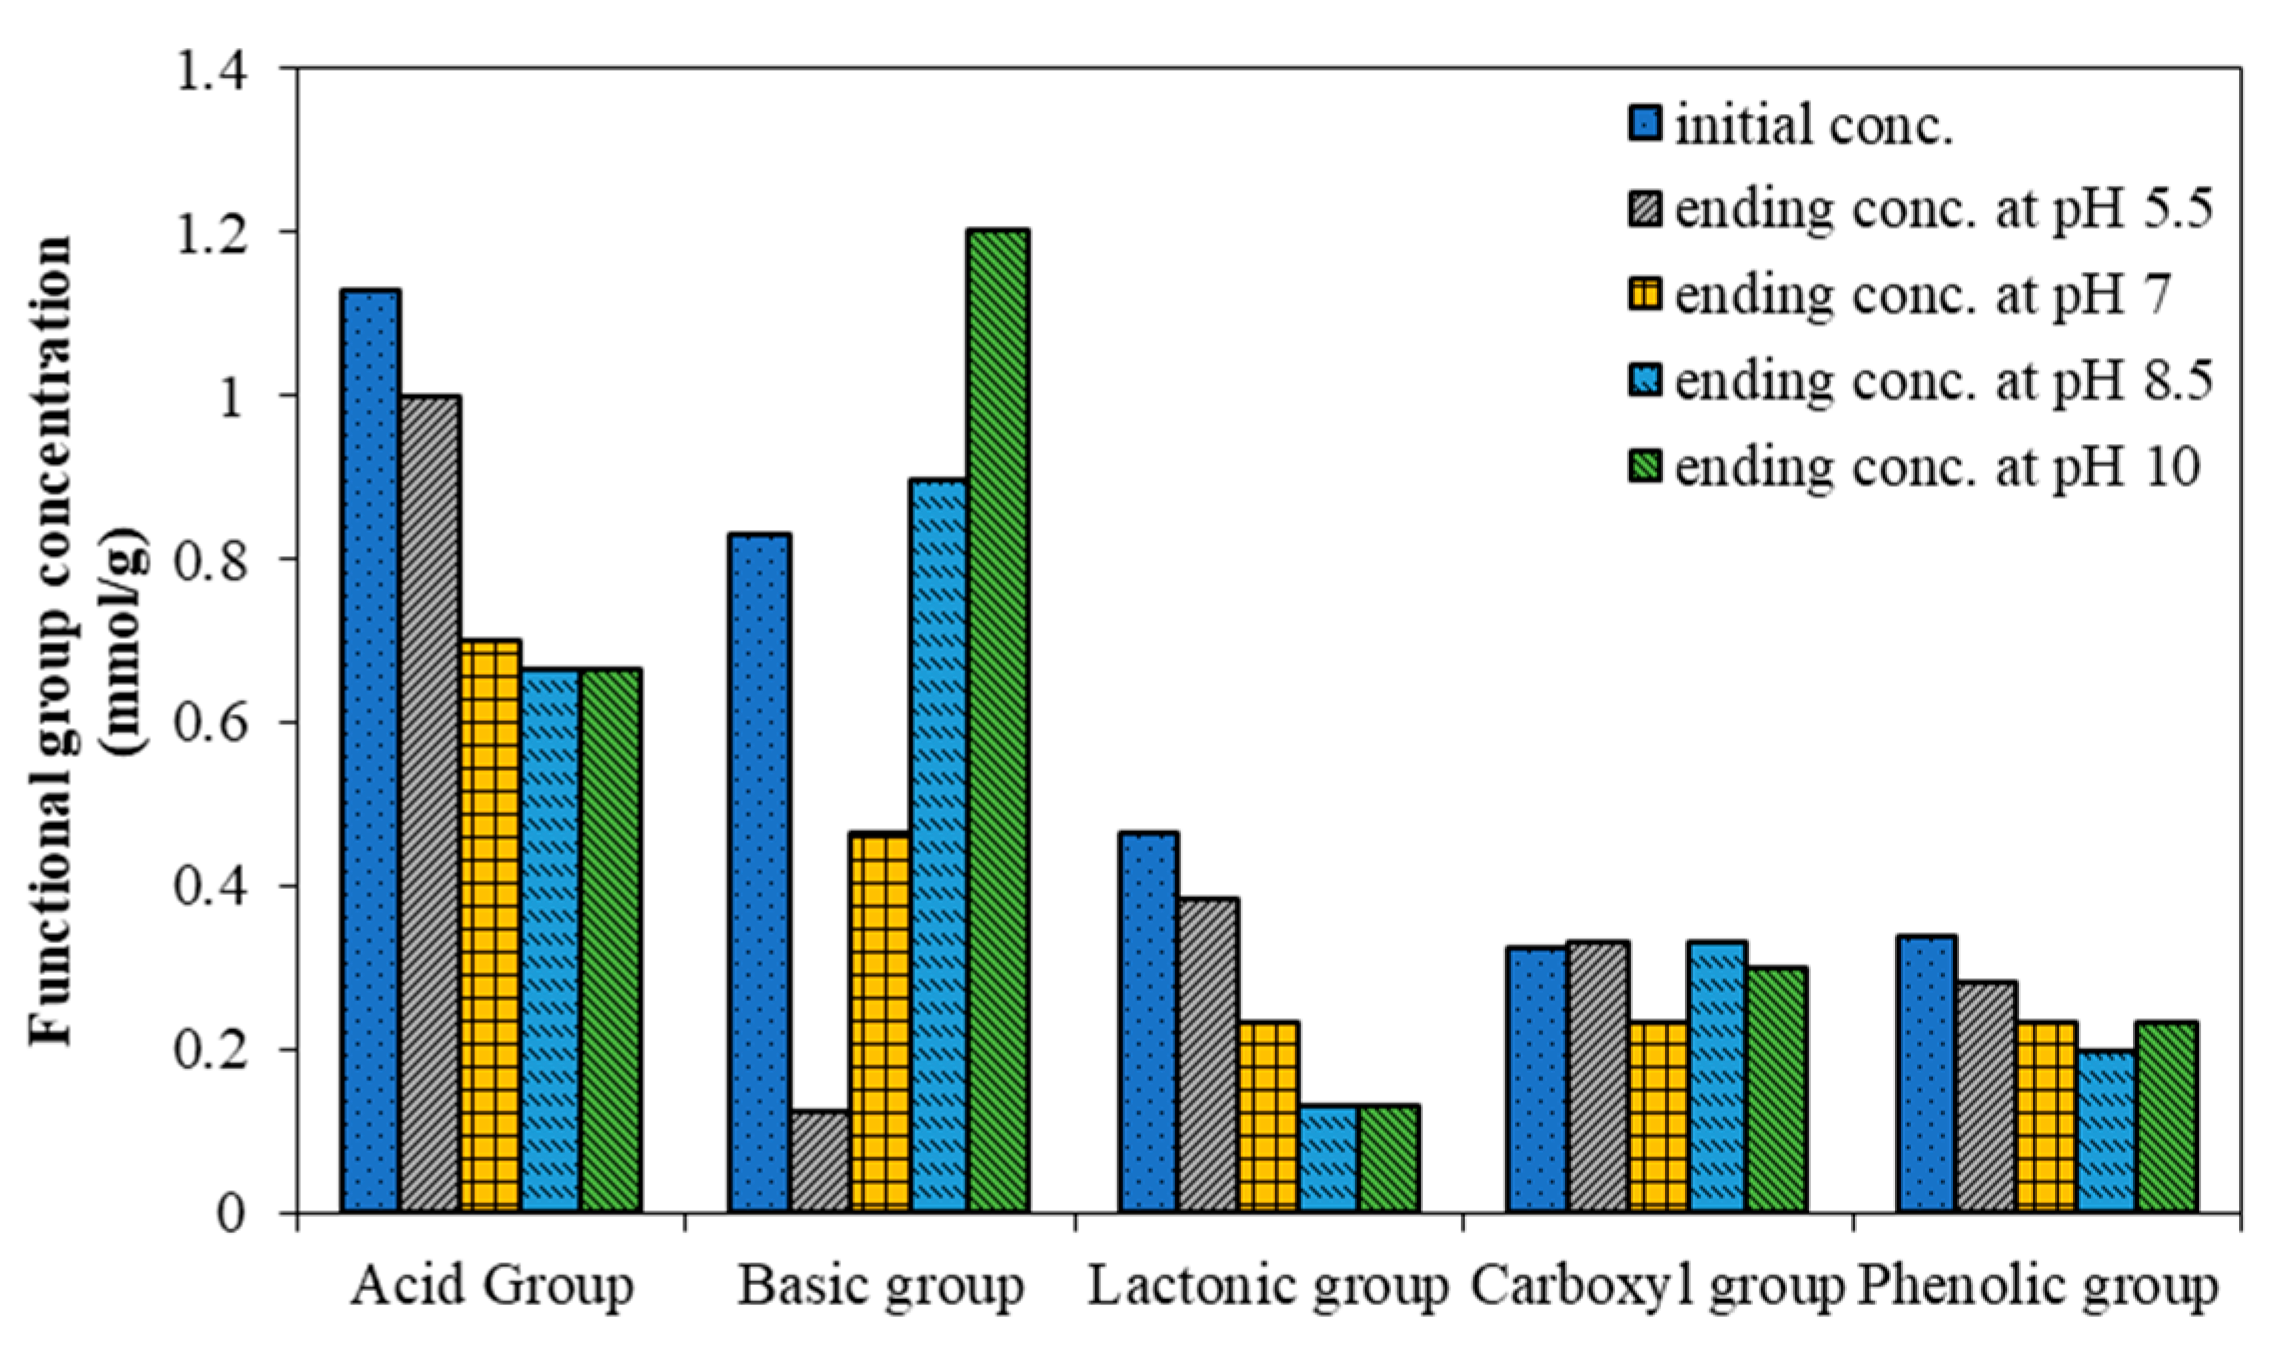
Figure 8 presents the effect of pH on surface functional groups’ modification by H2O2. With the increase of pH, the surface acid groups decreased from 1 mmol/g to 0.7 mmol/g in the pH range of 5.5–7 and then became stable in the pH range of 7–10. In contrast, the basic group greatly increased with the increase of pH from 5.5 to 10. At pH 10, even the basic groups reached 1.2 mmol/g, higher than the initial level of 0.8 mmol/g. With regard to the three acid groups, as the pH increased, the lactonic groups and phenolic groups presented a notable decrease and a slight decrease respectively, while the carboxyl groups did not show regular changes.
It is reasonable that the change trends of the acid groups and the basic groups with pH change were caused by acid-base neutralization. What is more, with the increase of pH, the basic groups were observed to increase (Figure 8), and simultaneously the H2O2 removal efficiency also increased (Figure 7), which is in line with previous studies reporting that the basic groups enhanced the H2O2 removal [35]. More specifically, the decrease of lactonic groups might be explained by the fact that the lactonic groups produced by the esterification reaction between carboxyl groups and phenolic groups decreased with the increase of pH.
4. Conclusions
Virgin GAC has the most acidic and basic surface functional groups, and correspondingly it presented the highest BrO3− removal. However, GAC hardly remove BrO3− anymore after two years running and thermal regeneration in this study. In our experiments, 5 g/L GAC decreased H2O2 from 150 μmol/L to <3 μmol/L within 80 min and the removal efficiency was not evidently impacted by GAC running time or regeneration.
The presence of 150 µmol/L H2O2 inhibited BrO3− removal by virgin GAC, which could be explained by the fact that H2O2 competed oxygen-containing functional groups with BrO3−. H2O2 removal efficiency was hardly impacted by the presence of 0.5 μmol/L BrO3−.
Redox reactions between BrO3− and surface functional groups played a dominant role in BrO3− removal by GAC, and a small amount of BrO3− was removed by GAC adsorption.
BrO3− removal efficiency was higher at acidic and neutral conditions than at basic conditions. In contrast, H2O2 removal efficiency was increased with pH increase, which could be explained by the increase of alkaline surface functional groups with the increase of pH.
Author Contributions
Conceptualization, F.W. and L.W.; methodology, F.W. and L.W.; Investigation, F.W. and L.Z.; writing—original draft preparation, F.W. and L.Z.; writing—review and editing, L.W. and J.P.v.d.H.; supervision, J.P.v.d.H.; project administration, F.W. and J.P.v.d.H.; funding acquisition, F.W. and J.P.v.d.H. All authors have read and agreed to the published version of the manuscript.
Funding
This research was funded by State Key Laboratory of Pollution Control and Resource Reuse Foundation, grant number PCRRF19003.
Institutional Review Board Statement
Not applicable.
Informed Consent Statement
Not applicable.
Acknowledgments
This study was financially supported by State Key Laboratory of Pollution Control and Resource Reuse Foundation (No. PCRRF19003).
Conflicts of Interest
The authors declare no conflict of interest.
References
- Lekkerkerker, K.; Scheideler, J.; Maeng, S.K.; Ried, A.; Verberk, J.Q.J.C.; Knol, A.H.; Amy, G.; Van Dijk, J.C. Advanced oxidation and artificial recharge: A synergistic hybrid system for removal of organic micropollutants. Water Sci. Technol. Water Supply 2009, 9, 643–651. [Google Scholar] [CrossRef]
- Oller, I.; Malato, S.; Sánchez-Pérez, J.A. Combination of Advanced Oxidation Processes and biological treatments for wastewater decontamination—A review. Sci. Total Environ. 2011, 409, 4141–4166. [Google Scholar] [CrossRef] [PubMed]
- Sgroi, M.; Snyder, S.A.; Roccaro, P. Comparison of AOPs at pilot scale: Energy costs for micro-pollutants oxidation, disinfection by-products formation and pathogens inactivation. Chemosphere 2021, 273, 128527. [Google Scholar] [CrossRef]
- Guan, C.; Jiang, J.; Pang, S.; Zhou, Y.; Gao, Y.; Li, J.; Wang, Z. Formation and control of bromate in sulfate radical-based oxidation processes for the treatment of waters containing bromide: A critical review. Water Res. 2020, 176, 115725. [Google Scholar] [CrossRef] [PubMed]
- Farzaneh, H.; Loganathan, K.; Saththasivam, J.; McKay, G. Ozone and ozone/hydrogen peroxide treatment to remove gemfibrozil and ibuprofen from treated sewage effluent: Factors influencing bromate formation. Emerg. Contam. 2020, 6, 225–234. [Google Scholar] [CrossRef]
- Ahmad, M.K.; Zubair, H.; Mahmood, R. DNA damage and DNA-protein cross-linking induced in rat intestine by the water disinfection by-product potassium bromate. Chemosphere 2013, 91, 1221–1224. [Google Scholar] [CrossRef]
- WHO. Guidelines for Drinking-Water Quality; World Health Organization: Geneva, Switzerland, 1993. [Google Scholar]
- US Environmental Protection Agency. Guidelines for Carcinogen Risk Assessment; US Environmental Protection Agency: Washington, DC, USA, 2005. [Google Scholar]
- EU. Councial Directive 98/83/EC of 3 November 1998 on the Quality of Water Intended for Human Consumption. Off. J. Eur. Communities 1998, 5, L330. Available online: https://eur-lex.europa.eu/legal-content/EN/ALL/?uri=CELEX:31998L0083 (accessed on 6 September 2021).
- Yu, J.; Wang, Y.; Wang, Q.; Wang, Z.; Zhang, D.; Yang, M. Implications of bromate depression from H2O2 addition during ozonation of different bromide-bearing source waters. Chemosphere 2020, 252, 126596. [Google Scholar] [CrossRef]
- Bourgin, M.; Borowska, E.; Helbing, J.; Hollender, J.; Kaiser, H.P.; Kienle, C.; McArdell, C.S.; Simon, E.; von Gunten, U. Effect of operational and water quality parameters on conventional ozonation and the advanced oxidation process O3/H2O2: Kinetics of micropollutant abatement, transformation product and bromate formation in a surface water. Water Res. 2017, 122, 234–245. [Google Scholar] [CrossRef] [PubMed] [Green Version]
- Wang, F.; van Halem, D.; Liu, G.; Lekkerkerker-Teunissen, K.; van der Hoek, J.P. Effect of residual H2O2 from advanced oxidation processes on subsequent biological water treatment: A laboratory batch study. Chemosphere 2017, 185, 637–646. [Google Scholar] [CrossRef]
- Wang, F.; van Halem, D.; Ding, L.; Bai, Y.; Lekkerkerker-Teunissen, K.; van der Hoek, J.P. Effective removal of bromate in nitrate-reducing anoxic zones during managed aquifer recharge for drinking water treatment. Water Res. 2018, 130, 88–97. [Google Scholar] [CrossRef]
- Jahan, B.N.; Li, L.; Pagilla, K.R. Fate and reduction of bromate formed in advanced water treatment ozonation systems: A critical review. Chemosphere 2021, 266, 128964. [Google Scholar] [CrossRef] [PubMed]
- Kruithof, J.C.; Kamp, P.C.; Martijn, B.J. UV/H2O2 treatment: A practical solution for organic contaminant control and primary disinfection. Ozone Sci. Eng. 2007, 29, 273–280. [Google Scholar] [CrossRef]
- Wen, G.; Wang, S.; Wang, T.; Feng, Y.; Chen, Z.; Lin, W.; Huang, T.; Ma, J. Inhibition of bromate formation in the O3/PMS process by adding low dosage of carbon materials: Efficiency and mechanism. Chem. Eng. J. 2020, 402, 126207. [Google Scholar] [CrossRef]
- Zhang, Y.Q.; Wu, Q.P.; Zhang, J.M.; Yang, X.H. Removal of bromide and bromate from drinking water using granular activated carbon. J. Water Health 2015, 13, 73–78. [Google Scholar] [CrossRef]
- Xu, J.; Gao, N.; Zhao, D.; An, N.; Li, L.; Xiao, J. Bromate reduction and reaction-enhanced perchlorate adsorption by FeCl3-impregnated granular activated carbon. Water Res. 2019, 149, 149–158. [Google Scholar] [CrossRef]
- Cai, J.; Zhang, Y.P. Enhanced Reduction of Bromate from Water by AC/S-nZVI: Performance and Mechanism. J. Environ. Eng. 2020, 146, 04020107. [Google Scholar] [CrossRef]
- Kirisits, M.J.; Snoeyink, V.L.; Kruithof, J.C. The reduction of bromate by granular activated carbon. Water Res. 2000, 34, 4250–4260. [Google Scholar] [CrossRef]
- Huang, W.J.; Chen, L.Y. Assessing the effectiveness of ozonation followed by GAC filtration in removing bromate and assimilable organic carbon. Environ. Technol. 2004, 25, 403–412. [Google Scholar] [CrossRef]
- Bury, N.A.; Mumford, K.A.; Stevens, G.W. The electro-Fenton regeneration of Granular Activated Carbons: Degradation of organic contaminants and the relationship to the carbon surface. J. Hazard. Mater. 2021, 416, 125792. [Google Scholar] [CrossRef] [PubMed]
- Palliyarayil, A.; Saini, H.; Vinayakumar, K.; Selvarajan, P.; Vinu, A.; Kumar, N.S.; Sil, S. Advances in porous material research towards the management of air pollution. Emerg. Mater. 2021, 4, 607–643. [Google Scholar] [CrossRef]
- Tang, L.; Ma, X.Y.; Wang, Y.; Zhang, S.; Zheng, K.; Wang, X.C.; Lin, Y. Removal of trace organic pollutants (pharmaceuticals and pesticides) and reduction of biological effects from secondary effluent by typical granular activated carbon. Sci. Total Environ. 2020, 749, 141611. [Google Scholar] [CrossRef]
- Mariana, M.; Abdul Khalil, H.P.S.; Mistar, E.M.; Yahya, E.B.; Alfatah, T.; Danish, M.; Amayreh, M. Recent advances in activated carbon modification techniques for enhanced heavy metal adsorption. J. Water Process Eng. 2021, 43, 102221. [Google Scholar] [CrossRef]
- Jaramillo, J.; Álvarez, P.M.; Gómez-Serrano, V. Oxidation of activated carbon by dry and wet methods surface chemistry and textural modifications. Fuel Process. Technol. 2010, 91, 1768–1775. [Google Scholar] [CrossRef]
- Park, S.-J.; Kim, B.-J. Influence of oxygen plasma treatment on hydrogen chloride removal of activated carbon fibers. J. Colloid Interface Sci. 2004, 275, 590–595. [Google Scholar] [CrossRef]
- Kim, D.W.; Wee, J.H.; Yang, C.M.; Yang, K.S. Efficient removals of Hg and Cd in aqueous solution through NaOH-modified activated carbon fiber. Chem. Eng. J. 2020, 392, 123768. [Google Scholar] [CrossRef]
- Bohli, T.; Ouederni, A. Improvement of oxygen-containing functional groups on olive stones activated carbon by ozone and nitric acid for heavy metals removal from aqueous phase. Environ. Sci. Pollut. Res. 2016, 23, 15852–15861. [Google Scholar] [CrossRef] [PubMed]
- Butler, R.; Godley, A.; Lytton, L.; Cartmell, E. Bromate environmental contamination: Review of impact and possible treatment. Crit. Rev. Environ. Sci. Technol. 2005, 35, 193–217. [Google Scholar] [CrossRef]
- Kirisits, M.J.; Snoeyink, V.L. Reduction of bromate in a BAC filter. J. Am. Water Work. Assoc. 1999, 91, 74–84. [Google Scholar] [CrossRef]
- Lekkerkerker-Teunissen, K.; Chekol, E.T.; Maeng, S.K.; Ghebremichael, K.; Houtman, C.J.; Verliefde, A.R.D.; Verberk, J.Q.J.C.; Amy, G.L.; van Dijk, J.C. Pharmaceutical removal during managed aquifer recharge with pretreatment by advanced oxidation. Water Sci. Technol. Water Supply 2012, 12, 755–767. [Google Scholar] [CrossRef]
- Yang, S.; Li, L.; Xiao, T.; Zheng, D.; Zhang, Y. Role of surface chemistry in modified ACF (activated carbon fiber)-catalyzed peroxymonosulfate oxidation. Appl. Surf. Sci. 2016, 383, 142–150. [Google Scholar] [CrossRef]
- Huang, W.J.; Peng, H.S.; Peng, M.Y.; Chen, L.Y. Removal of bromate and assimilable organic carbon from drinking water using granular activated carbon. Water Sci. Technol. 2004, 50, 73–80. [Google Scholar] [CrossRef]
- Huang, W.J.; Chen, C.Y.; Peng, M.Y. Adsorption/reduction of bromate from drinking water using GAC: Effects on carbon characteristics and long-term pilot study. Water SA 2004, 30, 369–375. [Google Scholar] [CrossRef] [Green Version]
- Siddiqui, M.; Zhai, W.Y.; Amy, G.; Mysore, C. Bromate ion removal by activated carbon. Water Res. 1996, 30, 1651–1660. [Google Scholar] [CrossRef]
- Li, J.; Zamyadi, A.; Hofmann, R. Effect of granular activated carbon type and age on quenching H2O2 residuals after UV/H2O2 drinking water treatment. J. Water Supply Res. Technol. AQUA 2016, 65, 28–36. [Google Scholar] [CrossRef]
- Kurniawan, T.A.; Lo, W.-h. Removal of refractory compounds from stabilized landfill leachate using an integrated H2O2 oxidation and granular activated carbon (GAC) adsorption treatment. Water Res. 2009, 43, 4079–4091. [Google Scholar] [CrossRef]
- Han, X.; Wishart, E.; Zheng, Y. A comparison of three methods to regenerate activated carbon saturated by diesel fuels. Can. J. Chem. Eng. 2014, 92, 884–891. [Google Scholar] [CrossRef]
- Liu, Z.; Zhang, Y.G.; Han, B.; Tan, Z.C.; Li, Q.H. Adsorption of cobalt (III) by HCl and H2O2 modified activated carbon. Int. J. Environ. Pollut. 2018, 63, 192–205. [Google Scholar] [CrossRef]
- Rey, A.; Zazo, J.A.; Casas, J.A.; Bahamonde, A.; Rodriguez, J.J. Influence of the structural and surface characteristics of activated carbon on the catalytic decomposition of hydrogen peroxide. Appl. Catal. A Gen. 2011, 402, 146–155. [Google Scholar] [CrossRef]
- von Gunten, U. Ozonation of drinking water: Part II. Disinfection and by-product formation in presence of bromide, iodide or chlorine. Water Res. 2003, 37, 1469–1487. [Google Scholar] [CrossRef]
- Gu, L.; Wang, D.; Deng, R.; Liu, H.; Ai, H. Effect of surface modification of activated carbon on its adsorption capacity for bromate. Desalin. Water Treat. 2013, 51, 2592–2601. [Google Scholar] [CrossRef]
- Zhang, D.F.; Lu, W.; Wang, P.P.; Yang, L.L.; Li, C.X.; Zeng, X.D. Effect of wet oxidized modification on oxygen-containing functional groups of activated carbon fibers. Meitan Xuebao 2008, 33, 439–443. [Google Scholar]
- Yan, H.; Du, X.; Li, P.; Yu, S.; Tang, Y. Adsorption of bromate from aqueous solutions by modified granular activated carbon: Batch and column tests. Ozone Sci. Eng. 2015, 37, 357–370. [Google Scholar] [CrossRef]
- Huang, W.J.; Cheng, Y.L. Effect of characteristics of activated carbon on removal of bromate. Sep. Purif. Technol. 2008, 59, 101–107. [Google Scholar] [CrossRef]
Figure 1.
The schematic diagram of the reactor (a) and the flowchart of the experimental plan (b).

Figure 2.
(a) BrO3− and (b) H2O2 removal by different types of GAC. GAC dosage was 5 g/L. Initial BrO3 concentration was 0.5 µM.
Figure 2.
(a) BrO3− and (b) H2O2 removal by different types of GAC. GAC dosage was 5 g/L. Initial BrO3 concentration was 0.5 µM.

Figure 3.
Surface functional groups of three different types of GAC.

Figure 4.
(a) BrO3− and (b) H2O2 removal by GAC under the co-present condition.

Figure 5.
BrO3−, Br−, and BrO3− + Br− concentration in the absence and presence of H2O2. (a) with H2O2, (b) without H2O2.
Figure 5.
BrO3−, Br−, and BrO3− + Br− concentration in the absence and presence of H2O2. (a) with H2O2, (b) without H2O2.

Figure 6.
Surface functional groups on the initial and modified GAC.

Figure 7.
The removal of (a) BrO3− and (b) H2O2 at different pH by virgin GAC.

Figure 8.
Surface functional groups of the modified oxidized GAC under different pH levels.

Publisher’s Note: MDPI stays neutral with regard to jurisdictional claims in published maps and institutional affiliations. |
© 2021 by the authors. Licensee MDPI, Basel, Switzerland. This article is an open access article distributed under the terms and conditions of the Creative Commons Attribution (CC BY) license (https://creativecommons.org/licenses/by/4.0/).
Share and Cite
MDPI and ACS Style
Wang, F.; Zhang, L.; Wei, L.; van der Hoek, J.P. Removal of Hydrogen Peroxide Residuals and By-Product Bromate from Advanced Oxidation Processes by Granular Activated Carbon. Water 2021, 13, 2460. https://doi.org/10.3390/w13182460
AMA Style
Wang F, Zhang L, Wei L, van der Hoek JP. Removal of Hydrogen Peroxide Residuals and By-Product Bromate from Advanced Oxidation Processes by Granular Activated Carbon. Water. 2021; 13(18):2460. https://doi.org/10.3390/w13182460
Chicago/Turabian StyleWang, Feifei, Lu Zhang, Liangfu Wei, and Jan Peter van der Hoek. 2021. "Removal of Hydrogen Peroxide Residuals and By-Product Bromate from Advanced Oxidation Processes by Granular Activated Carbon" Water 13, no. 18: 2460. https://doi.org/10.3390/w13182460
Note that from the first issue of 2016, this journal uses article numbers instead of page numbers. See further details here.