
Investigation of Groundwater Depletion in the State of Qatar and Its Implication to Energy Water and Food Nexus


College of Science and Engineering, Hamad Bin Khalifa University, Qatar Foundation, Doha P.O. Box 34110, Qatar
*
Author to whom correspondence should be addressed.
Water 2021, 13(18), 2464; https://doi.org/10.3390/w13182464
Submission received: 9 June 2021
/
Revised: 24 August 2021
/
Accepted: 25 August 2021
/
Published: 8 September 2021
(This article belongs to the Section Hydrology)
Abstract
:Groundwater is a precious freshwater resource heavily relied upon by agricultural activities in many parts of the world, and especially by countries with limited water resources located in arid regions. Groundwater resources are under severe pressures due to population increase, urbanisation and socio-economic development, with potential for causing long-term threats to human life and natural ecosystems. This study attempts to investigate the impacts of local and regional climatic trends, and establish key forcing functions that have changed local groundwater resources. The main questions answered through this study include: Are these changes beneficial or detrimental? If they are detrimental, what is the future outlook for impacts on the ecosystem? What are the corrective actions needed to avert the long-term risks in arid environments? In view of this, the methodology developed in this study focuses on a joint time-series statistical analysis using ground data as well as Gravity Recovery and Climate Experiment (GRACE) satellite data. Results show a substantial depletion in the groundwater thickness (0.24 ± 0.20 cm/year) during the period of observation (2002–2020). Long-term temperature data indicates that the annual mean temperature increased significantly by 1.02 °C between 1987 and 2016, while total rainfall exhibited a slight decreasing trend. In addition to groundwater extraction, fluctuations in monthly rainfall, soil moisture, evapotranspiration and relative humidity support the groundwater thickness reduction of GRACE datasets. The use of desalinated water and wastewater reuse in the agriculture sector may reduce the pressure on groundwater resources. Optimization, adaptation and mitigation in the EWF nexus will further improve the sustainability of the EWF resources.
1. Introduction
Groundwater is the second most abundant freshwater supply after the cryosphere, and it is a critical resource for human existence and ecological function. Over a third of the world’s freshwater comes from groundwater sources [1]. Demands for freshwater are increasing due to population expansion, socio-economic development, and land-use changes in dry and semiarid regions with insufficient surface water availability [2]. In the last decades, groundwater has been depleted significantly in dry and semiarid regions raising concerns for groundwater sustainability [3]. In addition to extraction, climate change is inflicting further pressure on groundwater resources [4]. Climate change may affect the natural balance of recharge/discharge, alter demand and supply in water-dependent sectors and may put further pressure on groundwater systems through land use management practices [5].
In addition, climate change can also reduce the infiltration capacity of soil and enhance the rate of evapotranspiration, causing a decline in groundwater recharge over time [3]. An increase in mean temperature also increases evaporation, which affects the quantity of water available to recharge groundwater [6]. Furthermore, groundwater is also affected by a decrease in total rainfall. Rainfall and temperature are the main parameters of the climate system and play a vital role in the regulation of groundwater resources. Recent research indicated that the land surface temperature is rising in the Middle East and Africa, for instance, in Iraq [7], Saudi Arabia [8], Kuwait [9] and the Arabian peninsula [10]. While several studies have reported droughts caused by dry episodes of weather, for example, the droughts of 1980–1994 in Morocco [11], the damaging Syrian droughts in 1998–2000 [12], persistent drought in Africa [13], and the more recent drought of 2014 in Lebanon and Jordan [14].
These changes in the mean temperature and total rainfall raise serious concerns about the availability of energy, water and food resources, which are important for the sustenance of life on earth. These three resources are interconnected and interdependent in a complex ‘nexus’ often known as the energy water food nexus EWF [15,16,17]. Water is required in fossil fuel processing, electricity generation and cooling, while energy is needed for water pumping, distribution, filtration, desalination, and water treatment. Similarly, agriculture consumes a substantial amount of water and energy, accounting for more than 70% of freshwater and 30% of the worldwide energy use [18]. Interdependencies and interconnectedness of the EWF nexus vary spatially depending on the availability of these resources. Due to the strong interlinkages and interdependencies between energy, water and food sectors, there is a need to study groundwater resources in association with climatic parameters like temperature, soil moisture, evapotranspiration, relative humidity and rainfall. The EWF nexus is especially important for countries situated in arid climates such as the State of Qatar. The State of Qatar is a hot dry peninsula with no surface water resources. The main freshwater source is groundwater which is recharged primarily by winter rainfall. Annual groundwater recharge from rainfall is 71.6 million cubic meters while about 2.2 million cubic meters is added by inflow from Saudi Arabia [19]. In addition to erratic rainfall, availability of limited renewable freshwater resources and extreme weather, most of the land is not suitable for conventional agriculture, and the state of Qatar imports about 90% of its food, which has effects on its long-term food security [20]. As a result, a considerable increase in the agricultural yield from the local farms has been observed in recent years. This could lead to the improvement of food security resilience; however, this will also alter the demand and supply of fresh water and energy in the food sector.
Historical data from ground stations are available for Qatar, which have not been sufficiently analysed to understand long-term variation in climatic parameters. For instance, temperature and rainfall data of only one weather station was previously analysed [21] though long term climatic data from six weather stations are available, and more representative of the State of Qatar. In addition, groundwater depletion in the UAE [22], Saudi Arabia [23] and Iran [24] has been studied using GRACE data. However, groundwater depletion has not yet been explored in the water scarce State of Qatar. Thus, it is important to investigate whether the State of Qatar is following regional groundwater depletion trends or not. Furthermore, no previous research exists to explain groundwater depletion in connection with climatic parameters under the holistic approach of the EWF nexus. This study aims to increase the overall resilience of the EWF nexus by evidence-based measures for energy water and food security.
2. Methods and Data
2.1. Study Area
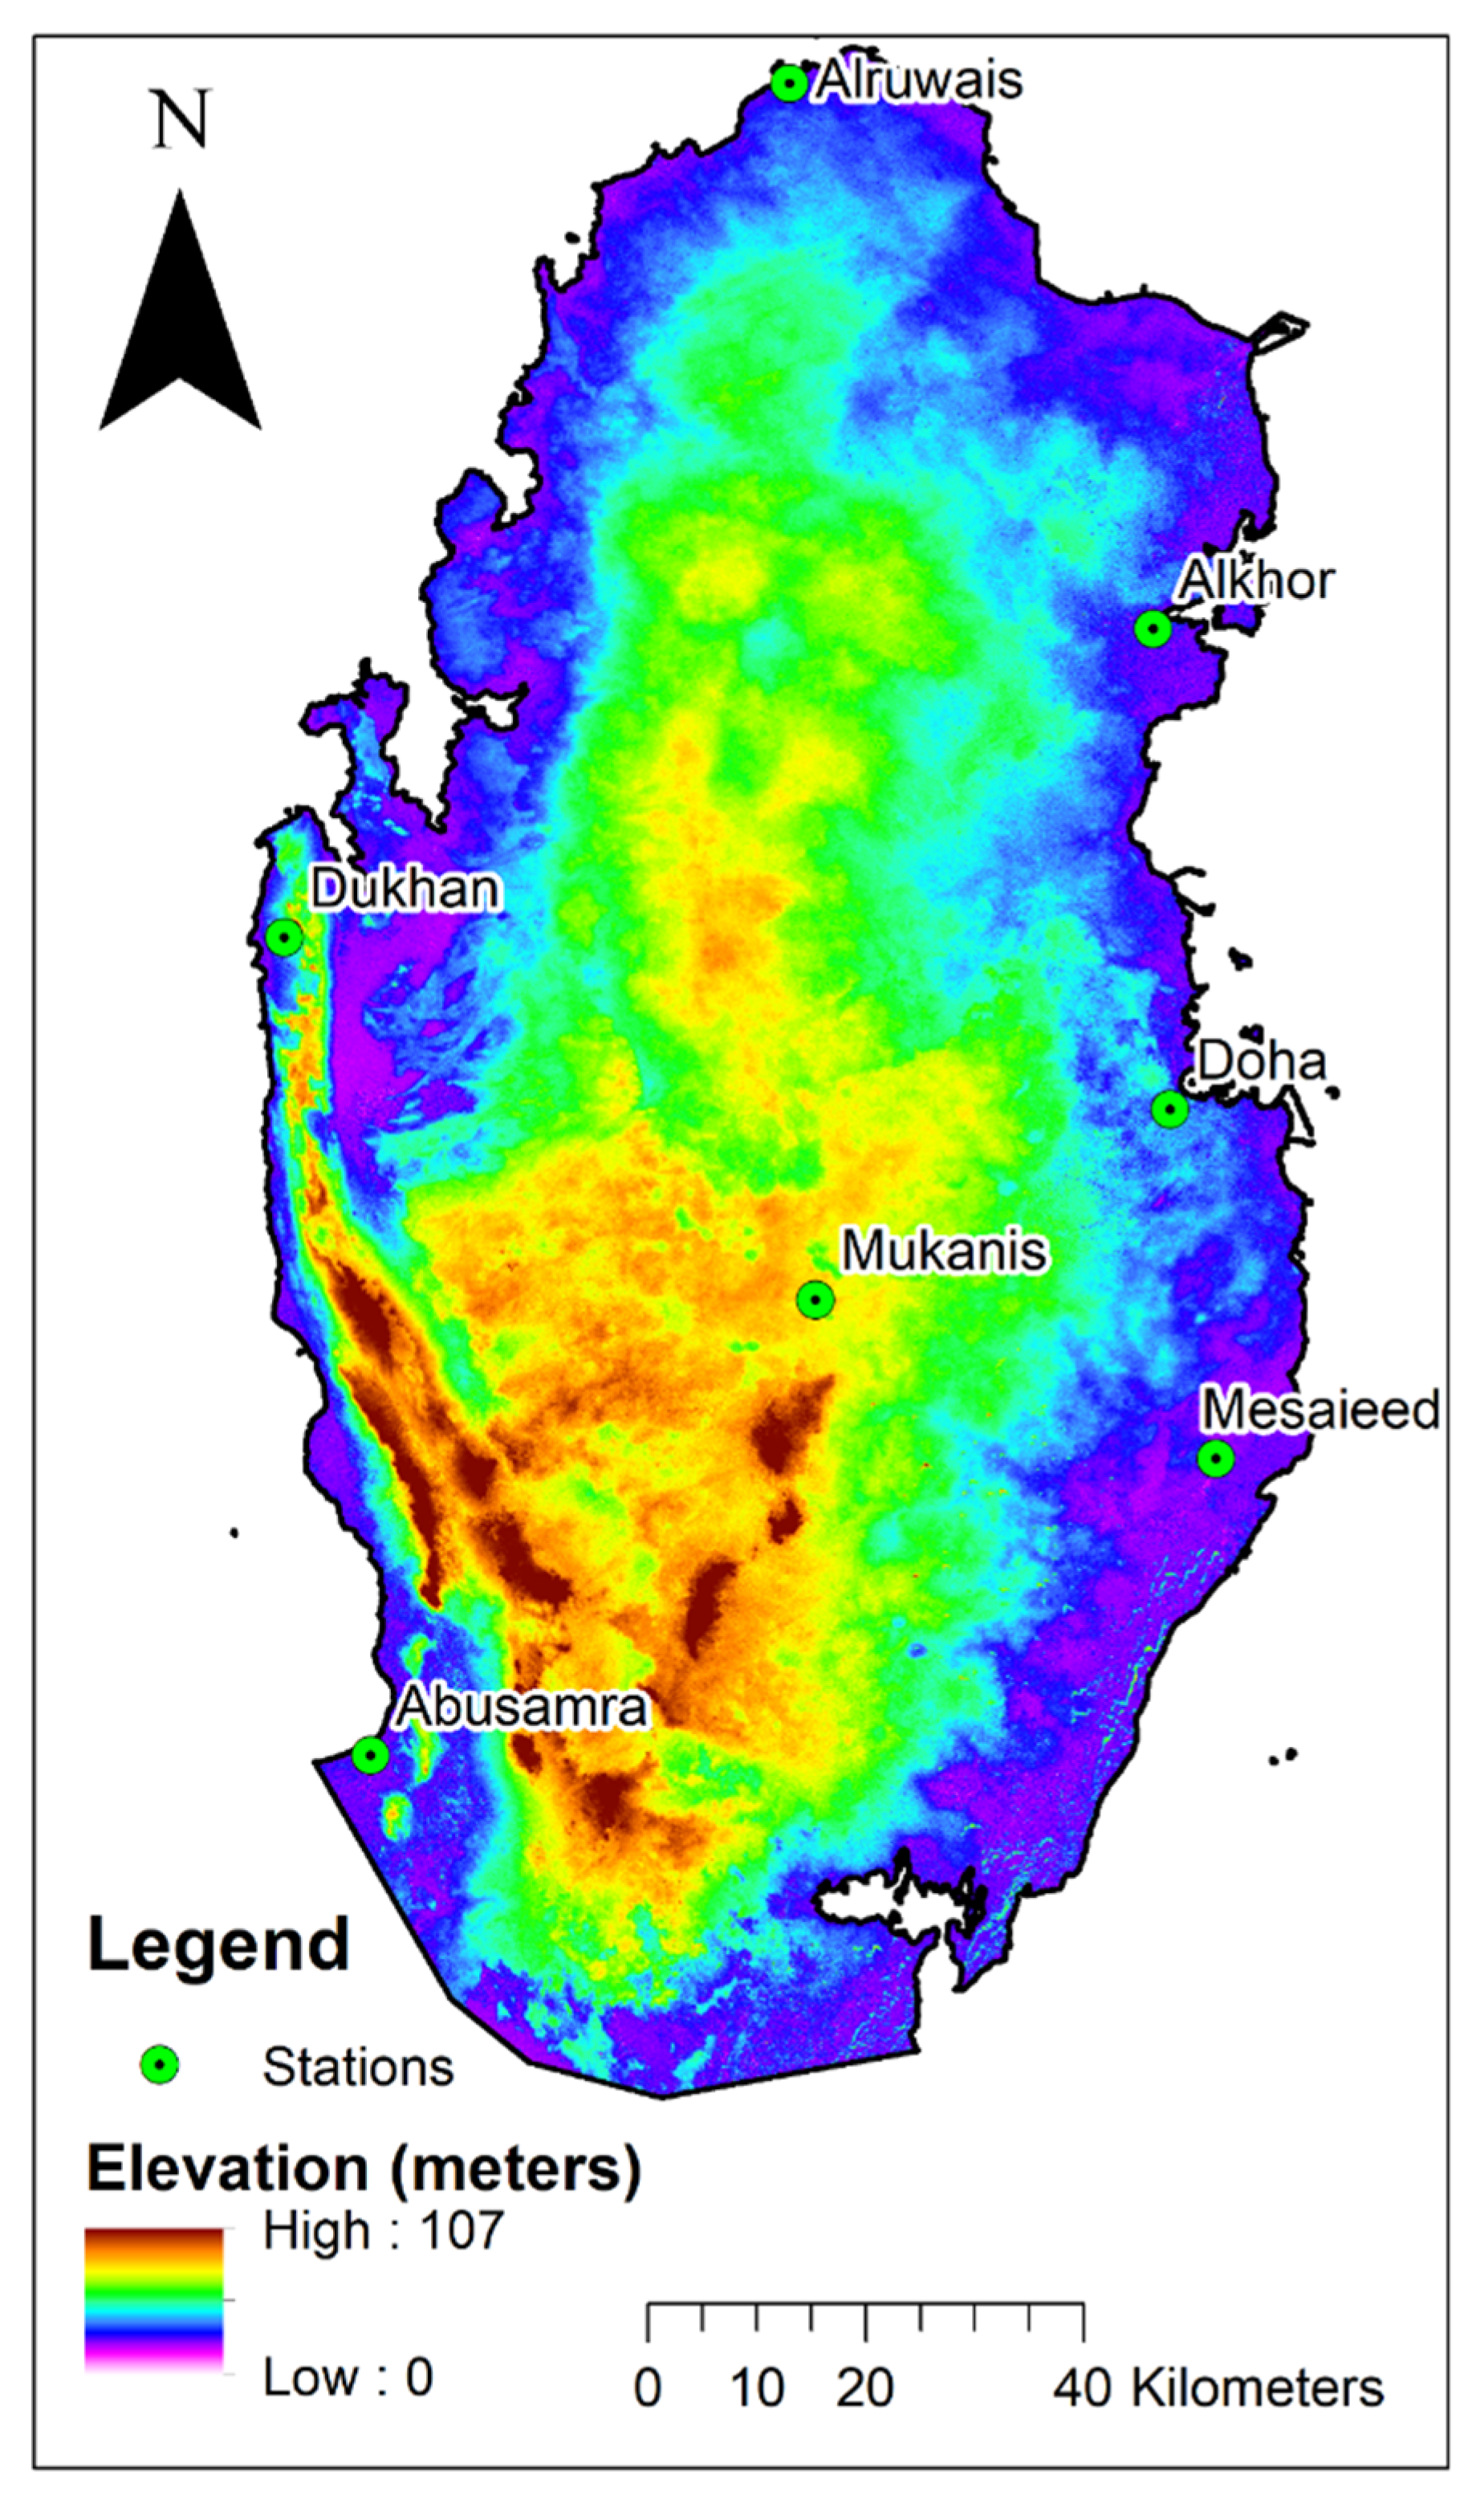
The State of Qatar is a peninsula located on the eastern coast of the Arabian Peninsula and is bordered by the Kingdom of Saudi Arabia to the south and surrounded by the Arabian Gulf in all other directions. The peninsula has an area of 11,571 km2, and it protrudes approximately 160 km into the Persian Gulf. Qatar is a relatively flat peninsula with natural topography that varies from 5 to 107 m above sea level (Figure 1). It has a hot desert environment and erratic annual rainfall. Qatar is often hit by Shamals, which are predominantly north-westerly dust storms that occur during the summer.
2.2. Datasets
According to the Qatar meteorological department, seven weather stations provide daily data on different climatic parameters such as temperature, rainfall, relative humidity, wind and solar radiation. However, due to less availability of long-term data, only six weather station data were used for long-term analysis (Table 1). Daily mean temperature and daily total rainfall data were acquired from 1987 to 2016. Although many of the weather stations have been installed recently, those weather stations were selected with data collected for over 30 years. ArcMap software version 10.4 was used to plot weather stations on a map using the respective longitude and latitude of each station. Raw data were analysed in Excel for outliers and missing data. In addition, annual groundwater extraction data from 1990–2019 was acquired from the Planning and Statistical Authority. Table 1 below provides a detailed summary of the weather stations.
2.3. GRACE and GRACE-FO
The Gravity Recovery and Climate Experiment (GRACE) satellite mission was cooperatively established and operated by the National Aeronautics and Space Administration (NASA) and the German Aerospace Centre (DLR). Gravity Recovery and Climate Experiment (GRACE) satellites operated from 2002–2017, and their replacement pair, the GRACE Follow-On, were started in 2018. The operation comprises two twin satellites in identical circular polar orbits at 500 km of altitude with a distance of 220 km between the two satellites. They measure differences in the earth’s gravitational field, which cause small fluctuation in the distance between both satellites as a result of different masses distributed on earth. These fluctuations are calculated by employing a GPS and a microwave sensing system giving spatiotemporal gravitational maps. Changes in the planet’s mass, shown as alterations in the gravitational field, are primarily triggered by fluctuations in surface and groundwater [25]. GRACE-based monthly gravity product produced by Jet Propulsion Laboratory (JPL) Monthly Mass Grids-Global mascons (JPL RL06_v02) were used in the present study. This monthly global mascon dataset contains gridded monthly global water storage information developed from GRACE and GRACE-FO. This dataset is available at https://podaac.jpl.nasa.gov/dataset/TELLUS_GRAC-GRFO_MASCON_CRI_GRID_RL06_V2 (accessed 27 March 2021) [26] in a single data file in netCDF format. This dataset has a spatial resolution of 0.5-degrees and a temporal resolution of one month. The current version of the data uses a Coastal Resolution Improvement (CRI) filter that decreases signal leakage errors across coastlines [27]. The water storage/height anomalies are given in equivalent water thickness units (cm) (NASA-JPL). Further details on the Mascon solution, involving the mathematical derivation, validation and realization of geophysical constraints can be found in [28].
2.4. GLDAS
The Global Land Data Assimilation System (GLDAS) is a program to utilise satellite- and ground-based observational data using sophisticated land surface modelling and data integration methods to produce the best possible land surface states and fluxes. GLDAS has been established by NASA and the National Oceanic and Atmospheric Administration (NOAA) and utilizes in situ and ex situ observations of the land surface interactions by the use of various models. The model used in this study was the monthly GLDAS NOAH Land Surface Model L4 monthly 0.25 × 0.25 degree V2.1, 2000–2020 [29]. Monthly soil moisture and evapotranspiration data were acquired from the GLDAS model using the Bash command line. GLDAS data have been validated against the observation data. A significant positive correlation exists between the observed total monthly precipitation data (r = 0.79) and GLDAS total monthly precipitation dataset. Similarly, a strong positive relationship with monthly mean temperature (r = 0.95) occurs in comparison to the GLDAS dataset.
2.5. Digital Elevation Model
A Shuttle Radar Topography Mission SRTM 30m digital elevation model was used for the delineation of the watershed. Thirty-meter (1 arc-second) resolution SRTM DEM data were downloaded from https://earthexplorer.usgs.gov/ (accessed on 21 September 2020) [30]. Downloaded tiles of the SRTM DEM were mosaicked and the study area was extracted using ArcMap 10.4.
3. Statistical Analysis
3.1. Mann-Kendall Trend Analysis
The Mann-Kendall (MK) test [31,32] was used to identify trends in the time series of climatic and hydrological data. The MK statistic indicated whether a trend was present in the time series data and whether the trend was positive or negative. The MK test was also used to identify stations where variations were significant or of large magnitude [33]. The MK test is a nonparametric test, which means that it does not depend on the knowledge of the distribution of the sampled population. The null hypothesis (H0) was that the data had no trend. The alternative hypothesis (Ha) was that the data follow a monotonic trend. A monotonic trend means that the trend is consistently decreasing or increasing over time. Kendall’s tau (t) is a measure of the strength of a trend. A trend is reported as statistically significant if the p-value is smaller than the significance level alpha (=0.05). Similarly, a null hypothesis is rejected or accepted if the p-value greater or smaller than the significance level alpha = 0.05.
The S statistic used for the Mann Kendall test is:
where Xj and Xk are the adjacent data values, S is the sum of positive or negative signs, n is the number of observations and variance can be calculated as in [31]:
Moreover, the extent of a time series trend was assessed by a nonparametric test know as Sen’s slope [34]. The slope of the trend is calculated by
where β is the Sen’s slope estimate. A β value greater than zero means an upward trend and β < zero indicates a downward trend.
3.2. Mann-Whitney-Pettitt Change Point Analysis
Pettitt’s test is a nonparametric test proposed by Pettitt in 1979 [35]. Pettitt’s test is used to identify the time at which a shift occurs. It is commonly applied to detect a single change-point in hydrological and climatic data series [36]. This test not only detects occurrence time but also the significance of the change point. The null hypothesis (H0) is that the T variables follow one or more distributions that have the same location parameter (no change). The alternative hypothesis (Ha) is that a change point exists in the data. The nonparametric statistic is defined as:
Xi and Xj are the adjacent data values and n is the number of observations. The change-point of the series is situated at KT, if that the statistic is significant.
The significance probability of KT is approximated for p ≤ 0.05 as:
4. Results and Discussion
4.1. State-Wide Annual and Seasonal Climatic Trends
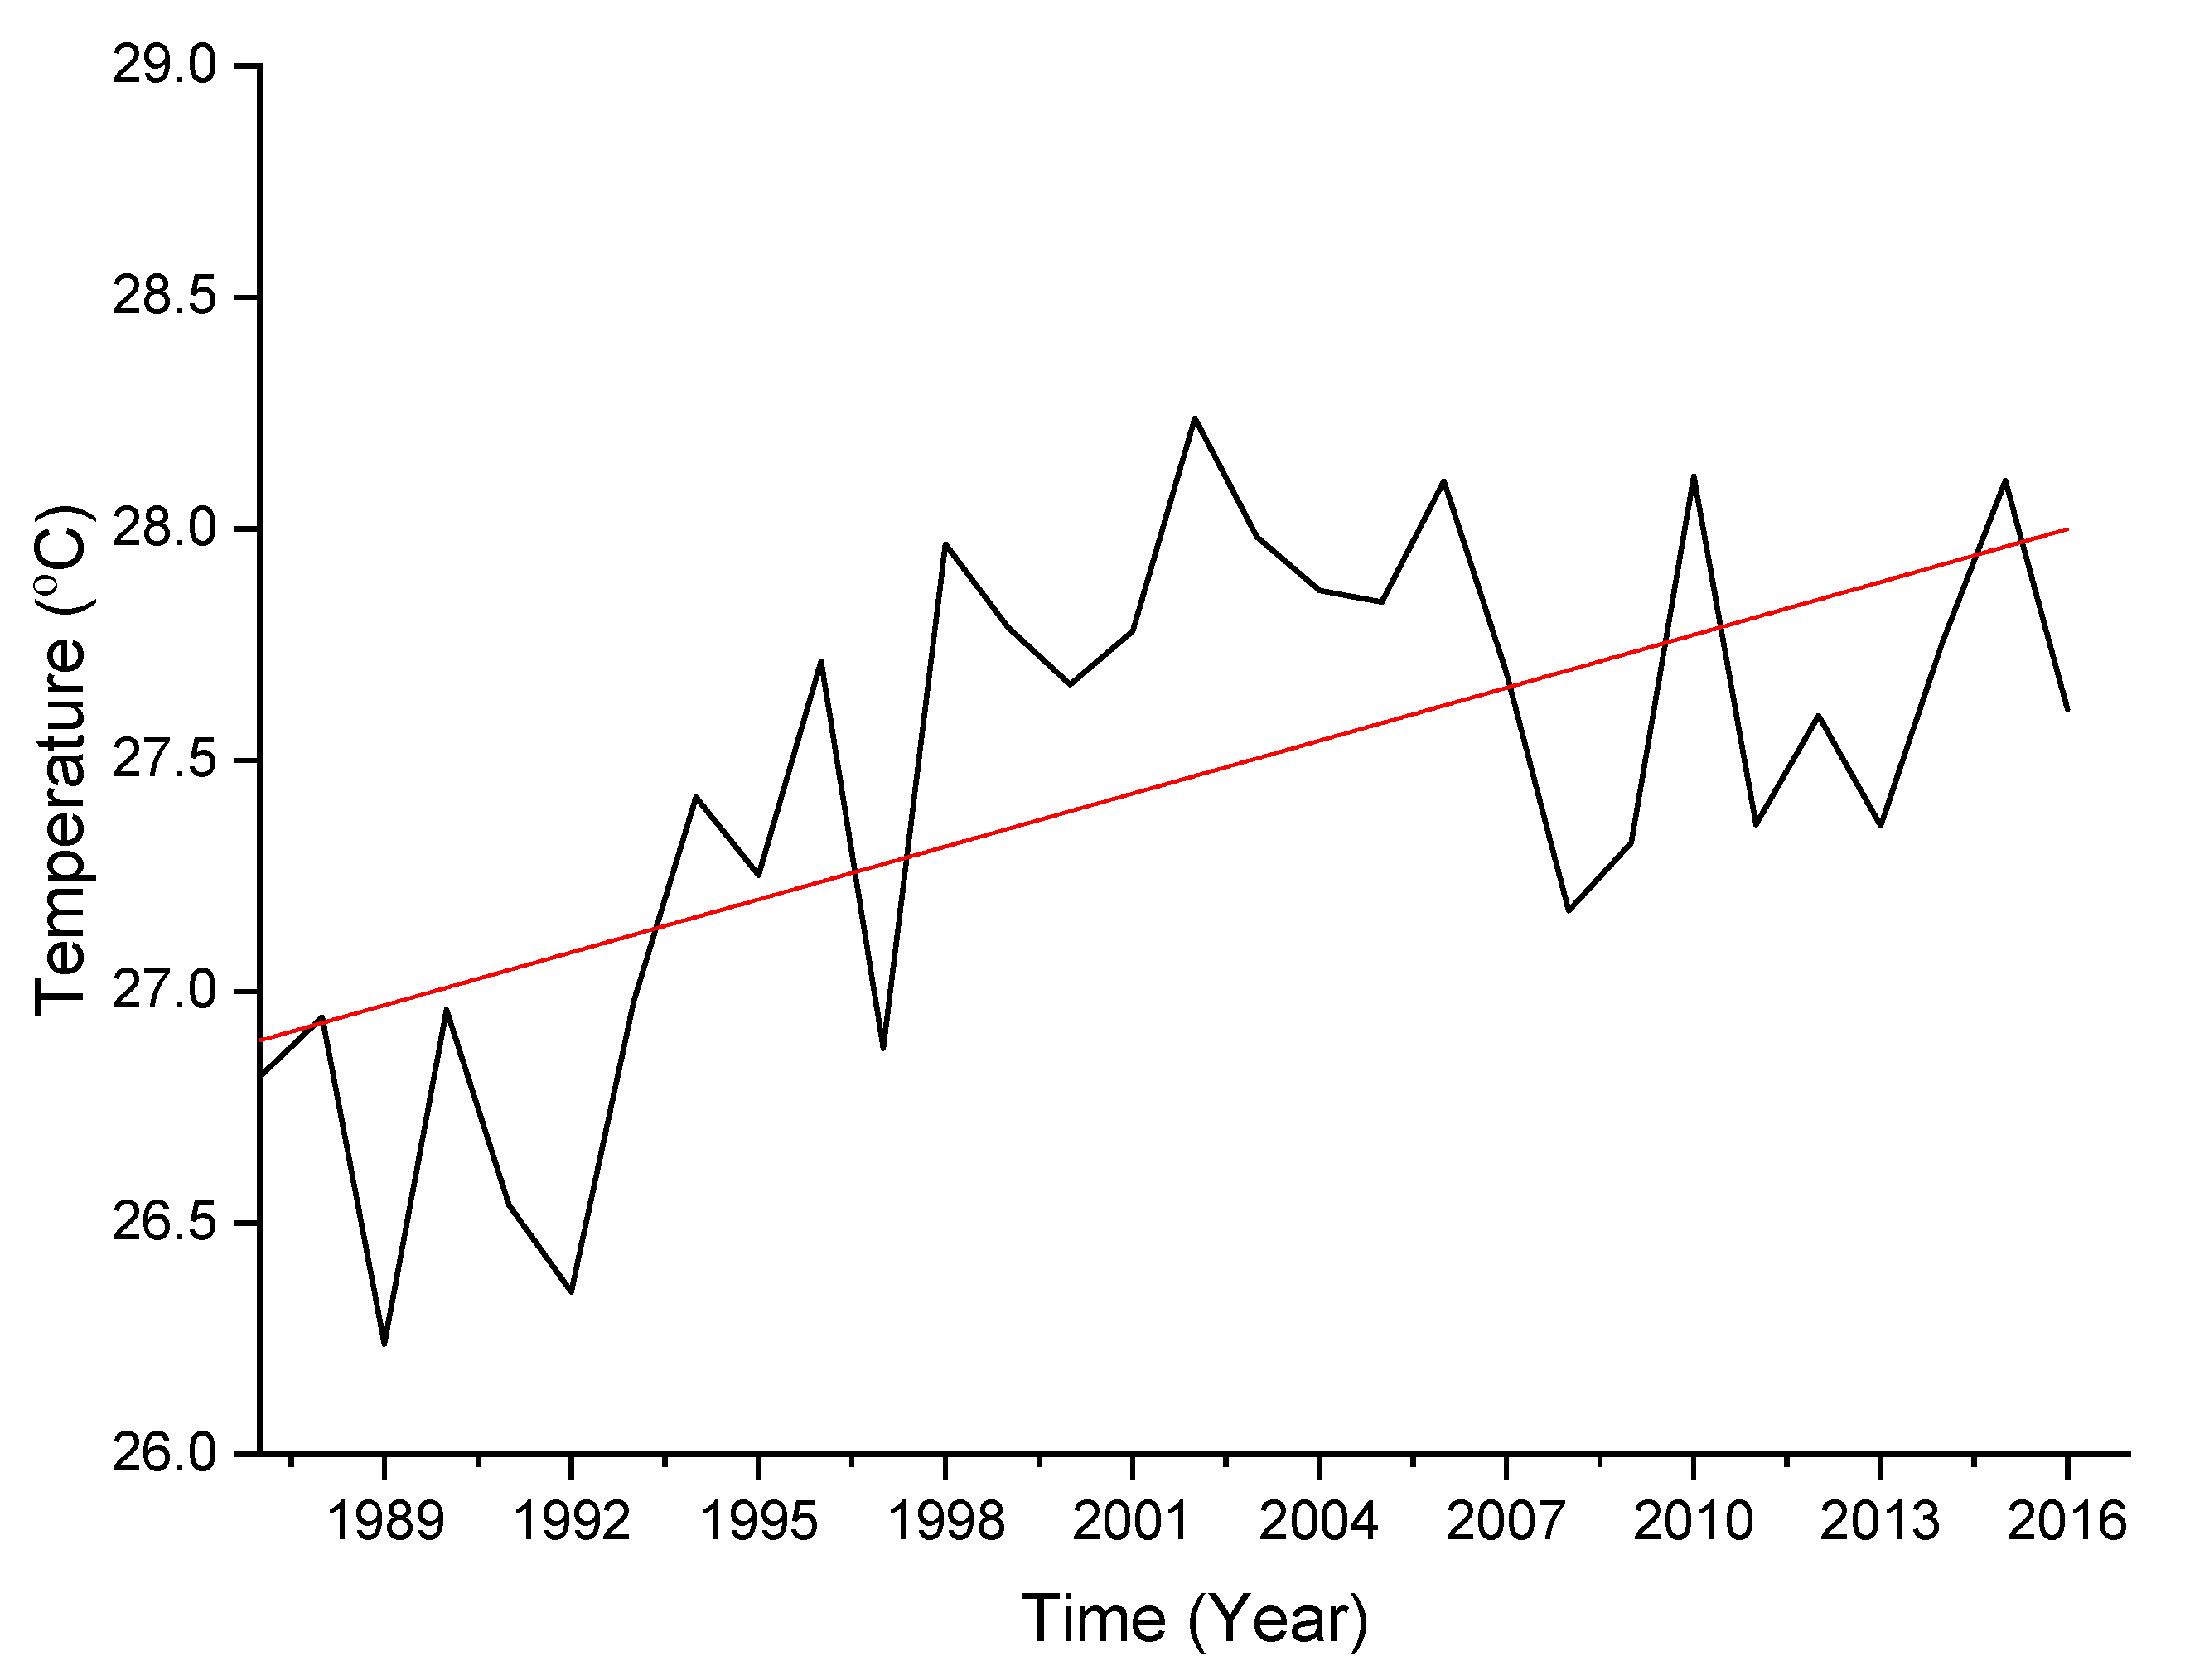
Mean temperature data from six weather stations from 1987–2016 were averaged to establish a state-wide representative mean annual temperature. Long-term temperature data indicated that the mean annual temperature in Qatar is 27.42 °C with significant variation between diurnal and seasonal temperature. Mean annual data were analysed using the Mann Kendall trend test with a confidence level of 95%. Mann Kendal trend test analysis indicated a significant (p < 0.005) increase in the state-wide mean annual temperature over the period of observation (Figure 2). The Sen’s slope estimated that mean temperature had increased by 1.02 °C over the last 30 years with a 0.034 °C per year increment. These warming trends are in agreement with previous studies in Qatar [21], Saudi Arabia [8] Iran [37], and Kuwait [9]. The Mann Pettit test indicated a significant change in the annual temperature data in 1997. According to The Oceanic Niño Index (ONI) by the National Oceanic and Atmospheric Administration, 1997 and 1998 were very strong El Nino years. Similarly, ENSO induced temperature intensities could be found in 2008–2009 and 2006–2007. La Nina signals were also obvious; for example, 2007–2008 and 2010–2011 were strong La Nina years (Figure 2).
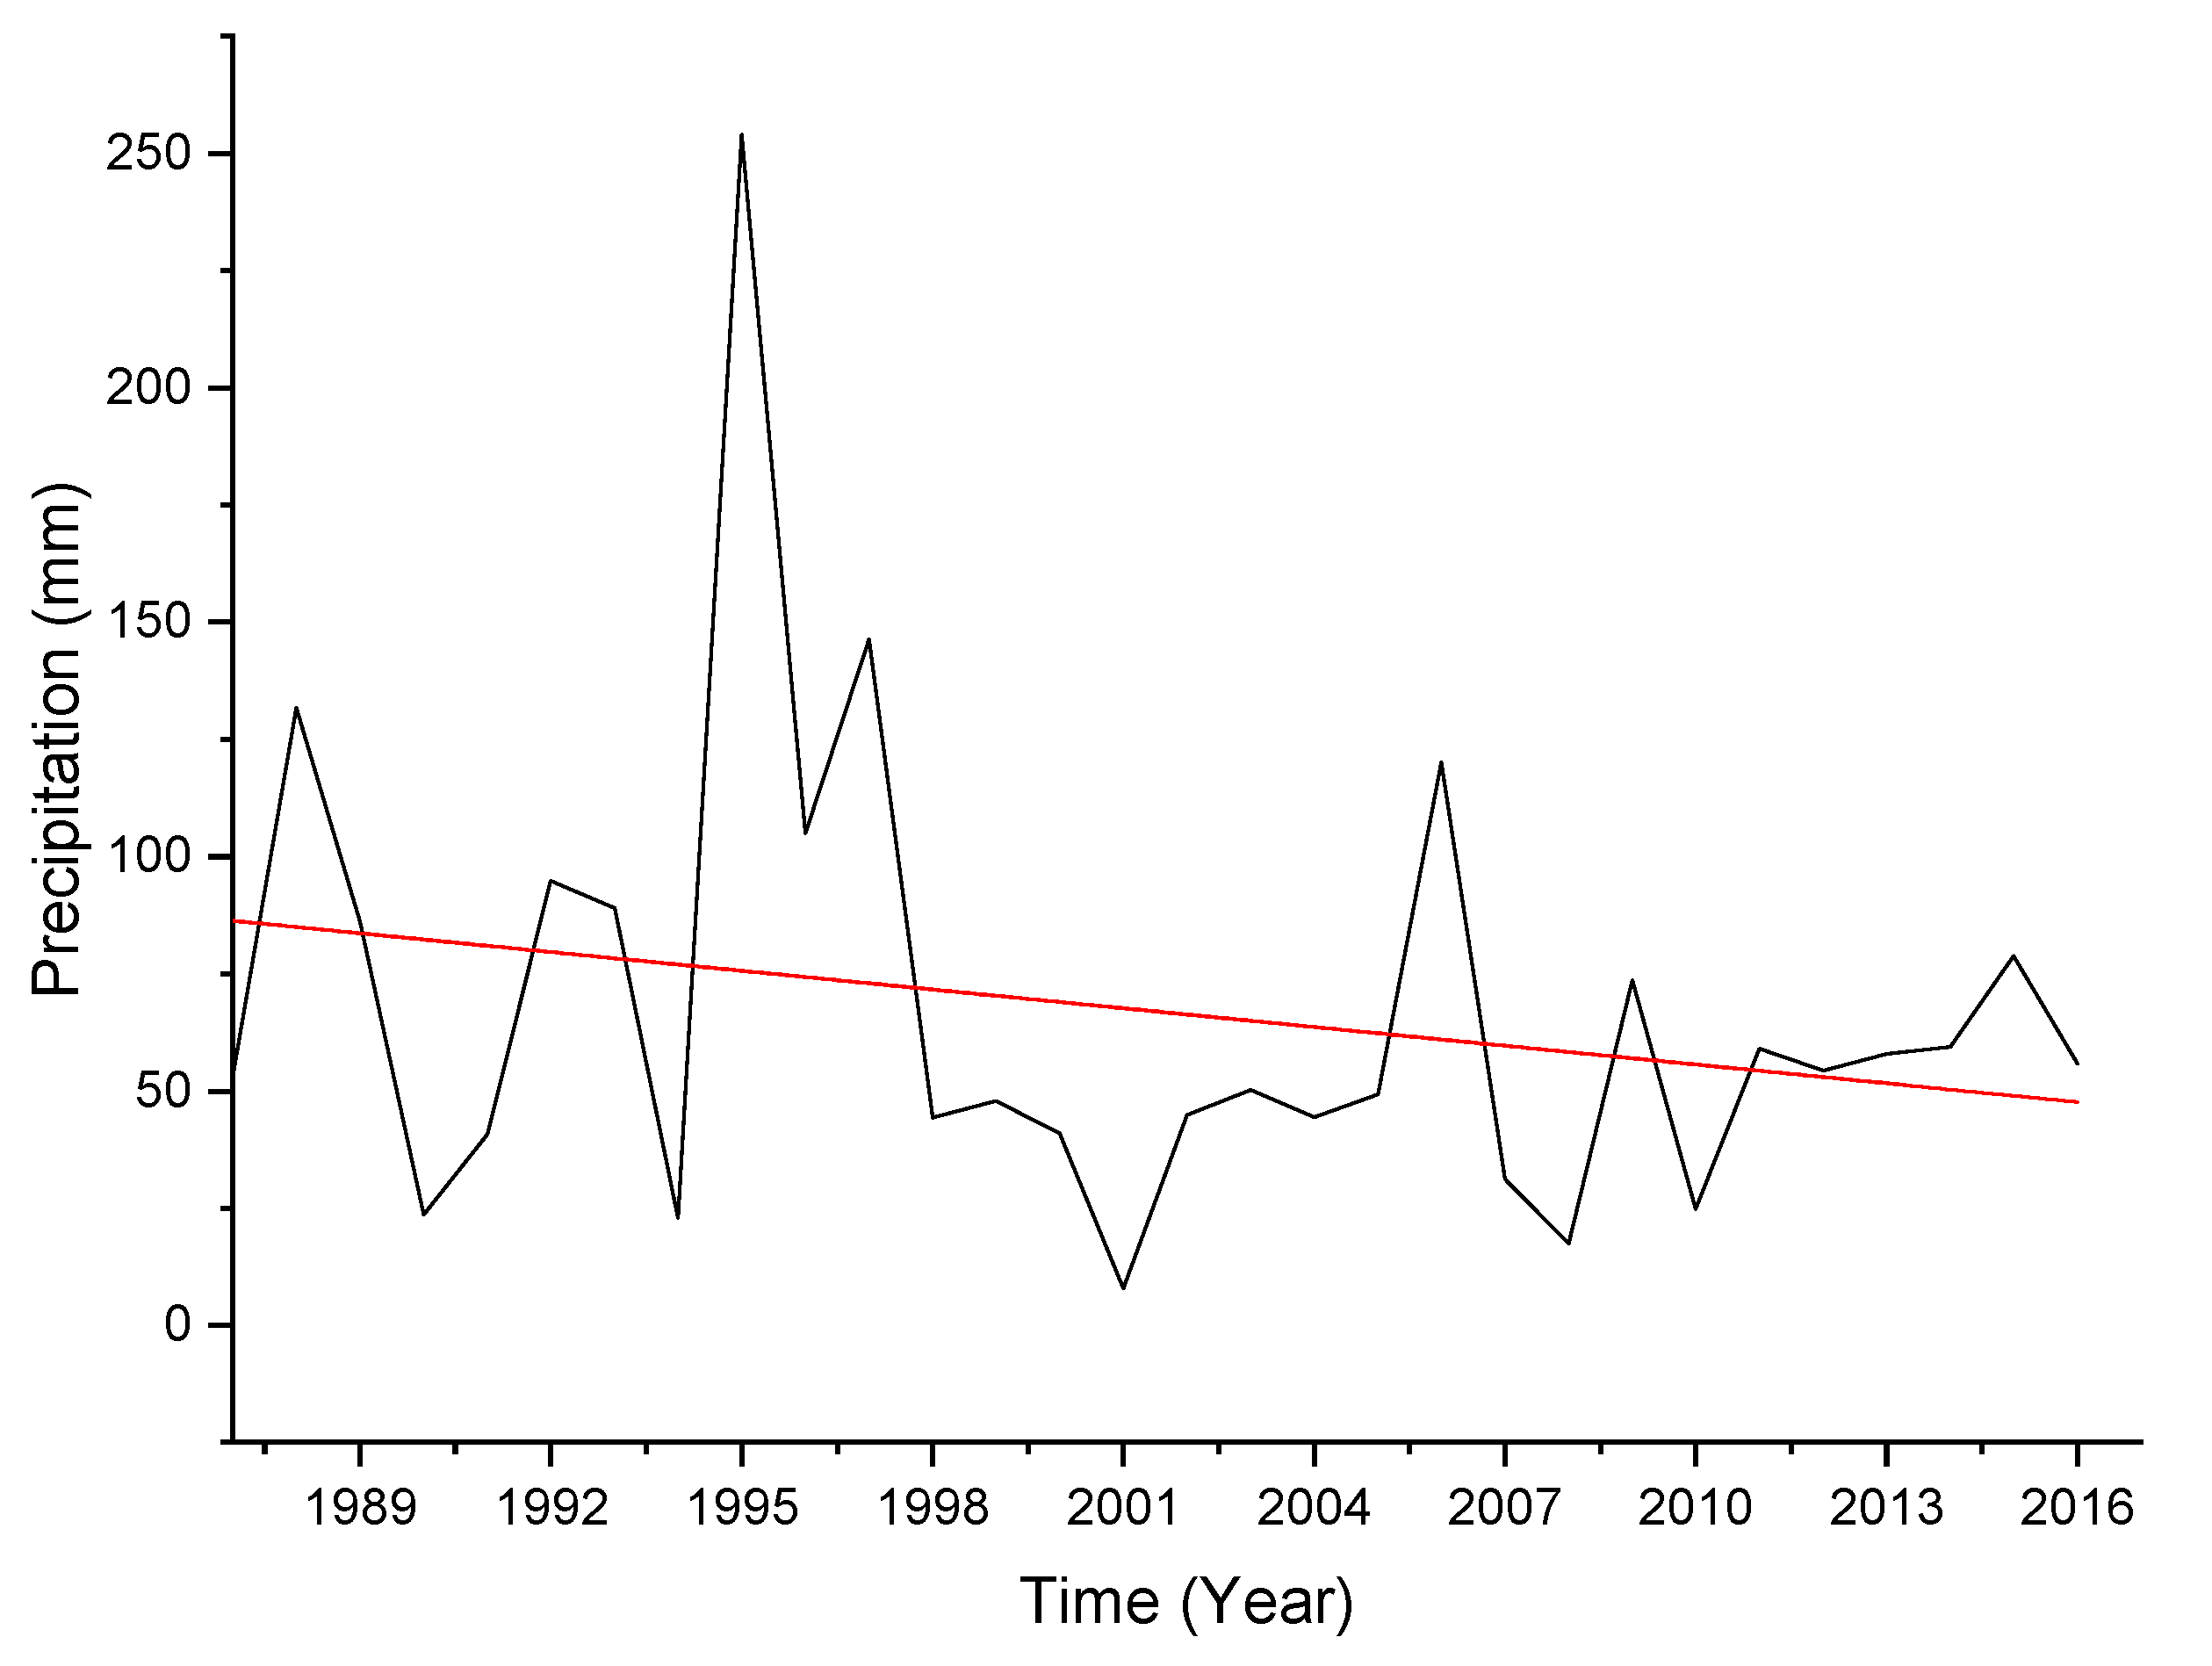
Rainfall data from six weather stations were also analysed for long-term trends using the Mann Kendall trend test with 95% confidence. State-wide long-term total annual rainfall data indicated rainfall is decreasing over the state of Qatar (Figure 3). It was determined that rainfall during the period of observation decreased by −0.42 mm per year. However, this decreasing trend was not statistically significant (p < 0.05). These drying trends are consistent with the subtropical drier projection [38]. More recently, similar dry episodes were observed in the MENA region [39,40] and particularly in Saudi Arabia [41].
4.2. State-Wide Seasonal Climatic Trends
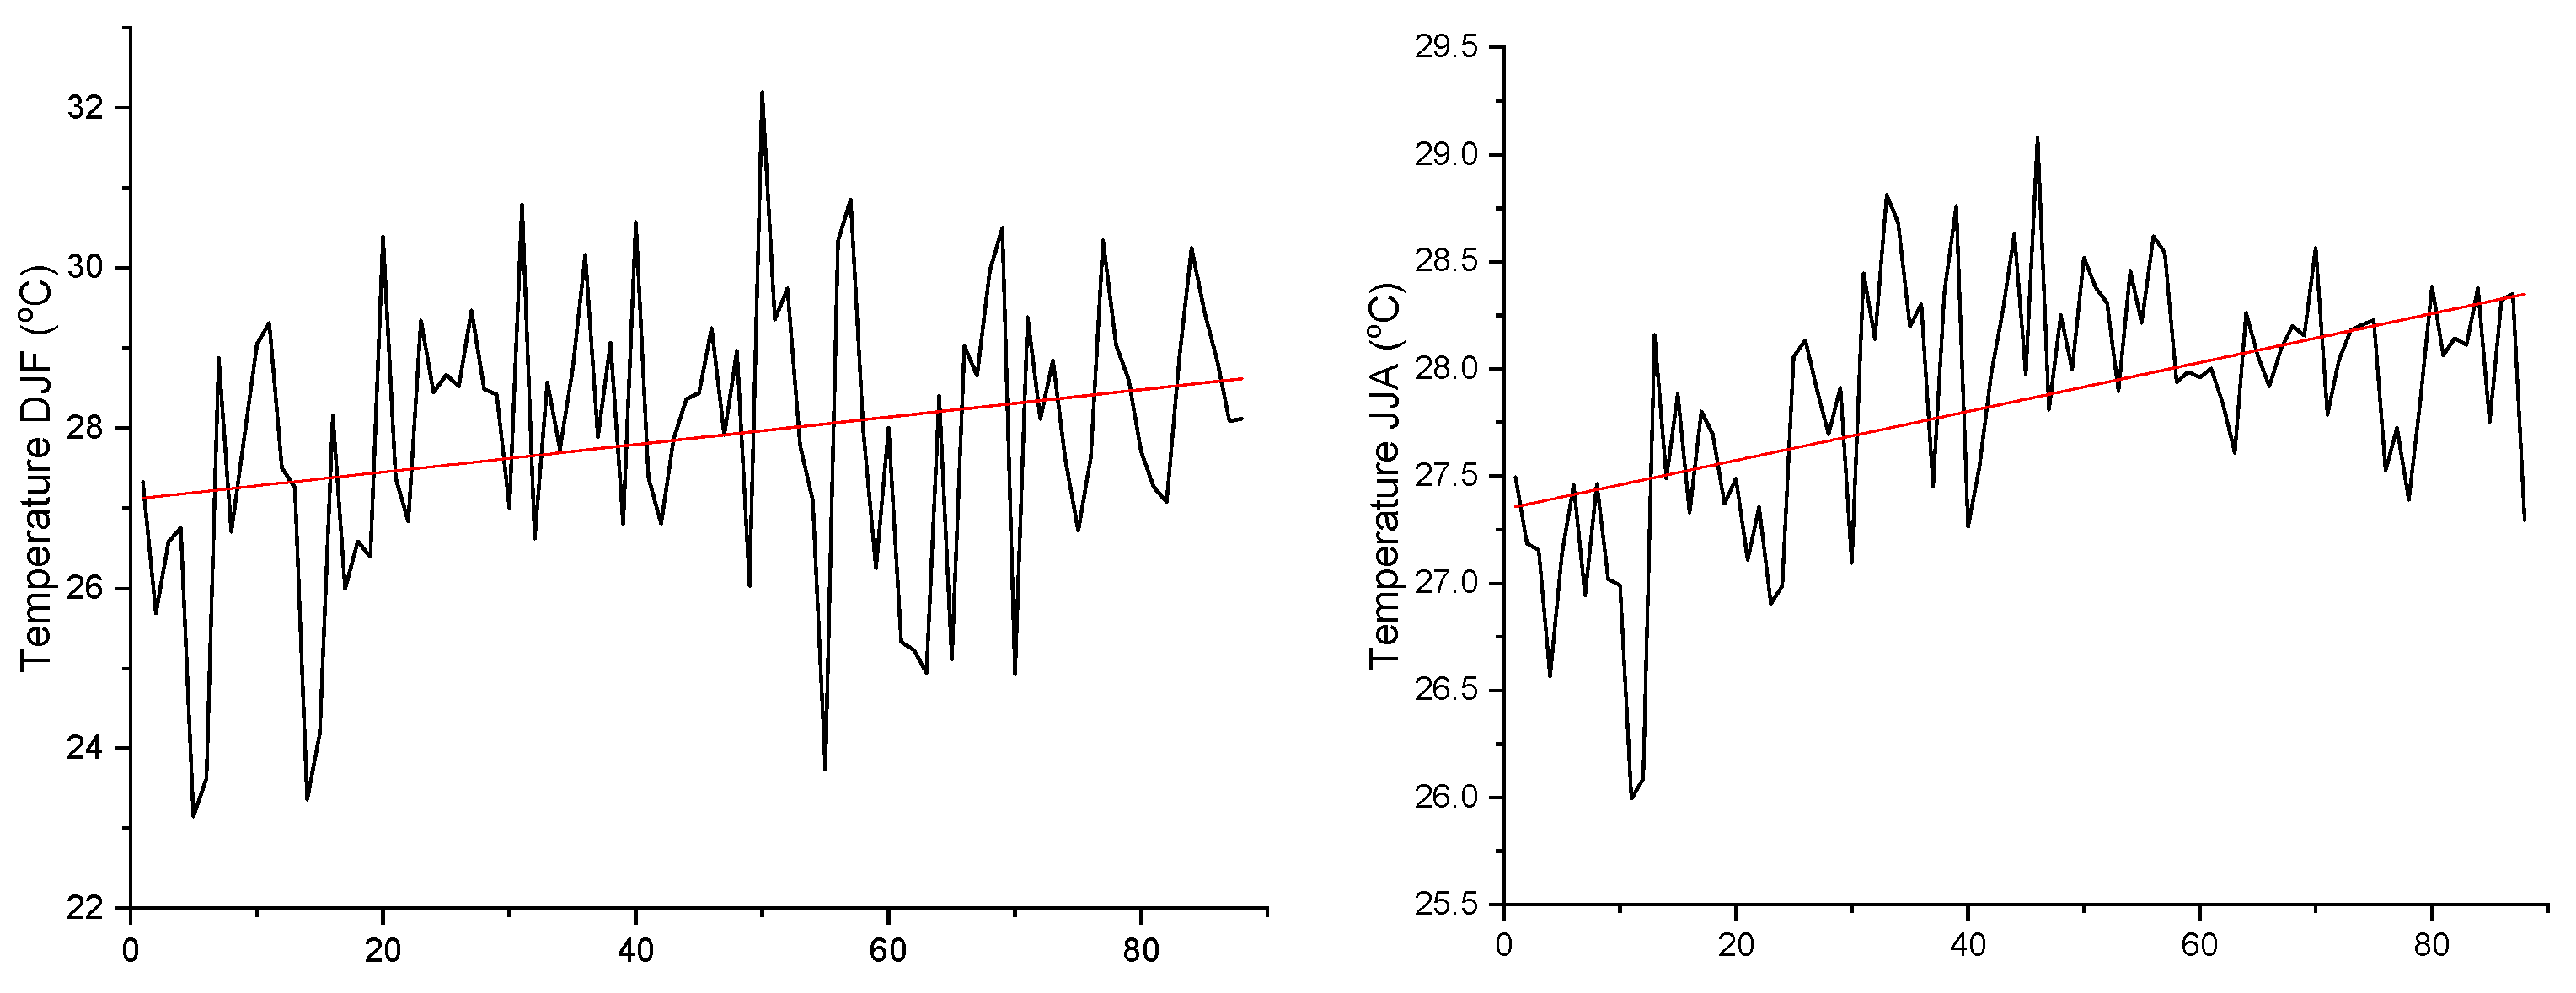
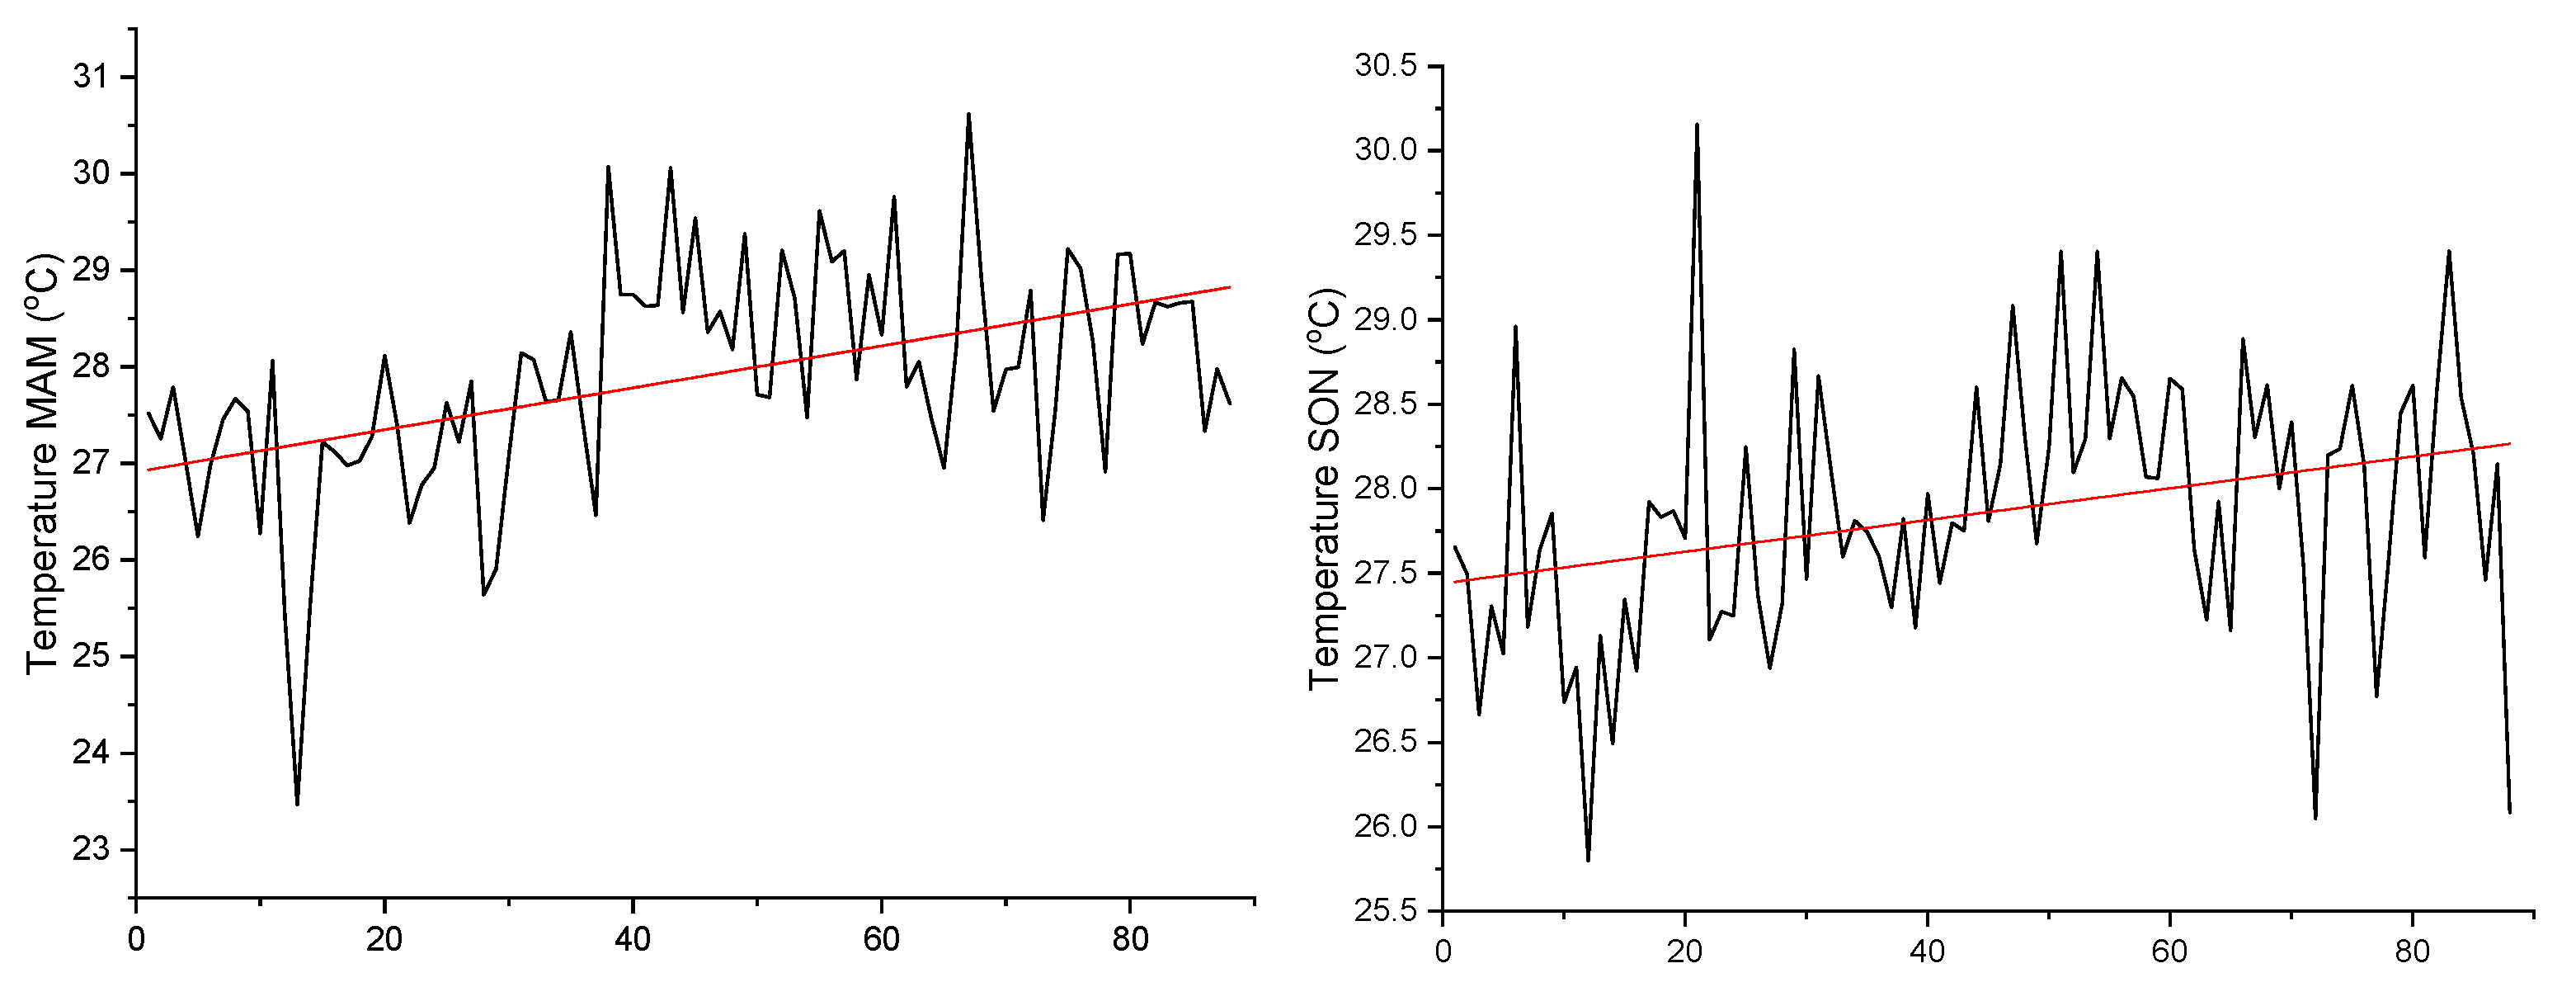
Mean temperature and total monthly rainfall data from six weather stations were divided into seasonal subsets; for example, winter (December, January, February = DJF), summer (June, July, August = JJA), spring (March, April, May = MAM) and autumn (September, October, November = SON) seasons. Seasonal data analysis demonstrated that mean monthly temperature during DJF (τ = 0.173, S = 0.016, p < 0.01), MAM (τ = 0.358, S = 0.02 (Sen’s slope), p < 0.0001), JJA (τ = 0.362, S = 0.011, p < 0.0001), and SON (τ = 0.335, S = 0.014, p < 0.0001), has increased significantly (p < 0.05) over the 30 year period of observation. As indicated by the Mann Kendall tau value, increasing trends are comparatively prominent during summer, spring and autumn (Figure 4).
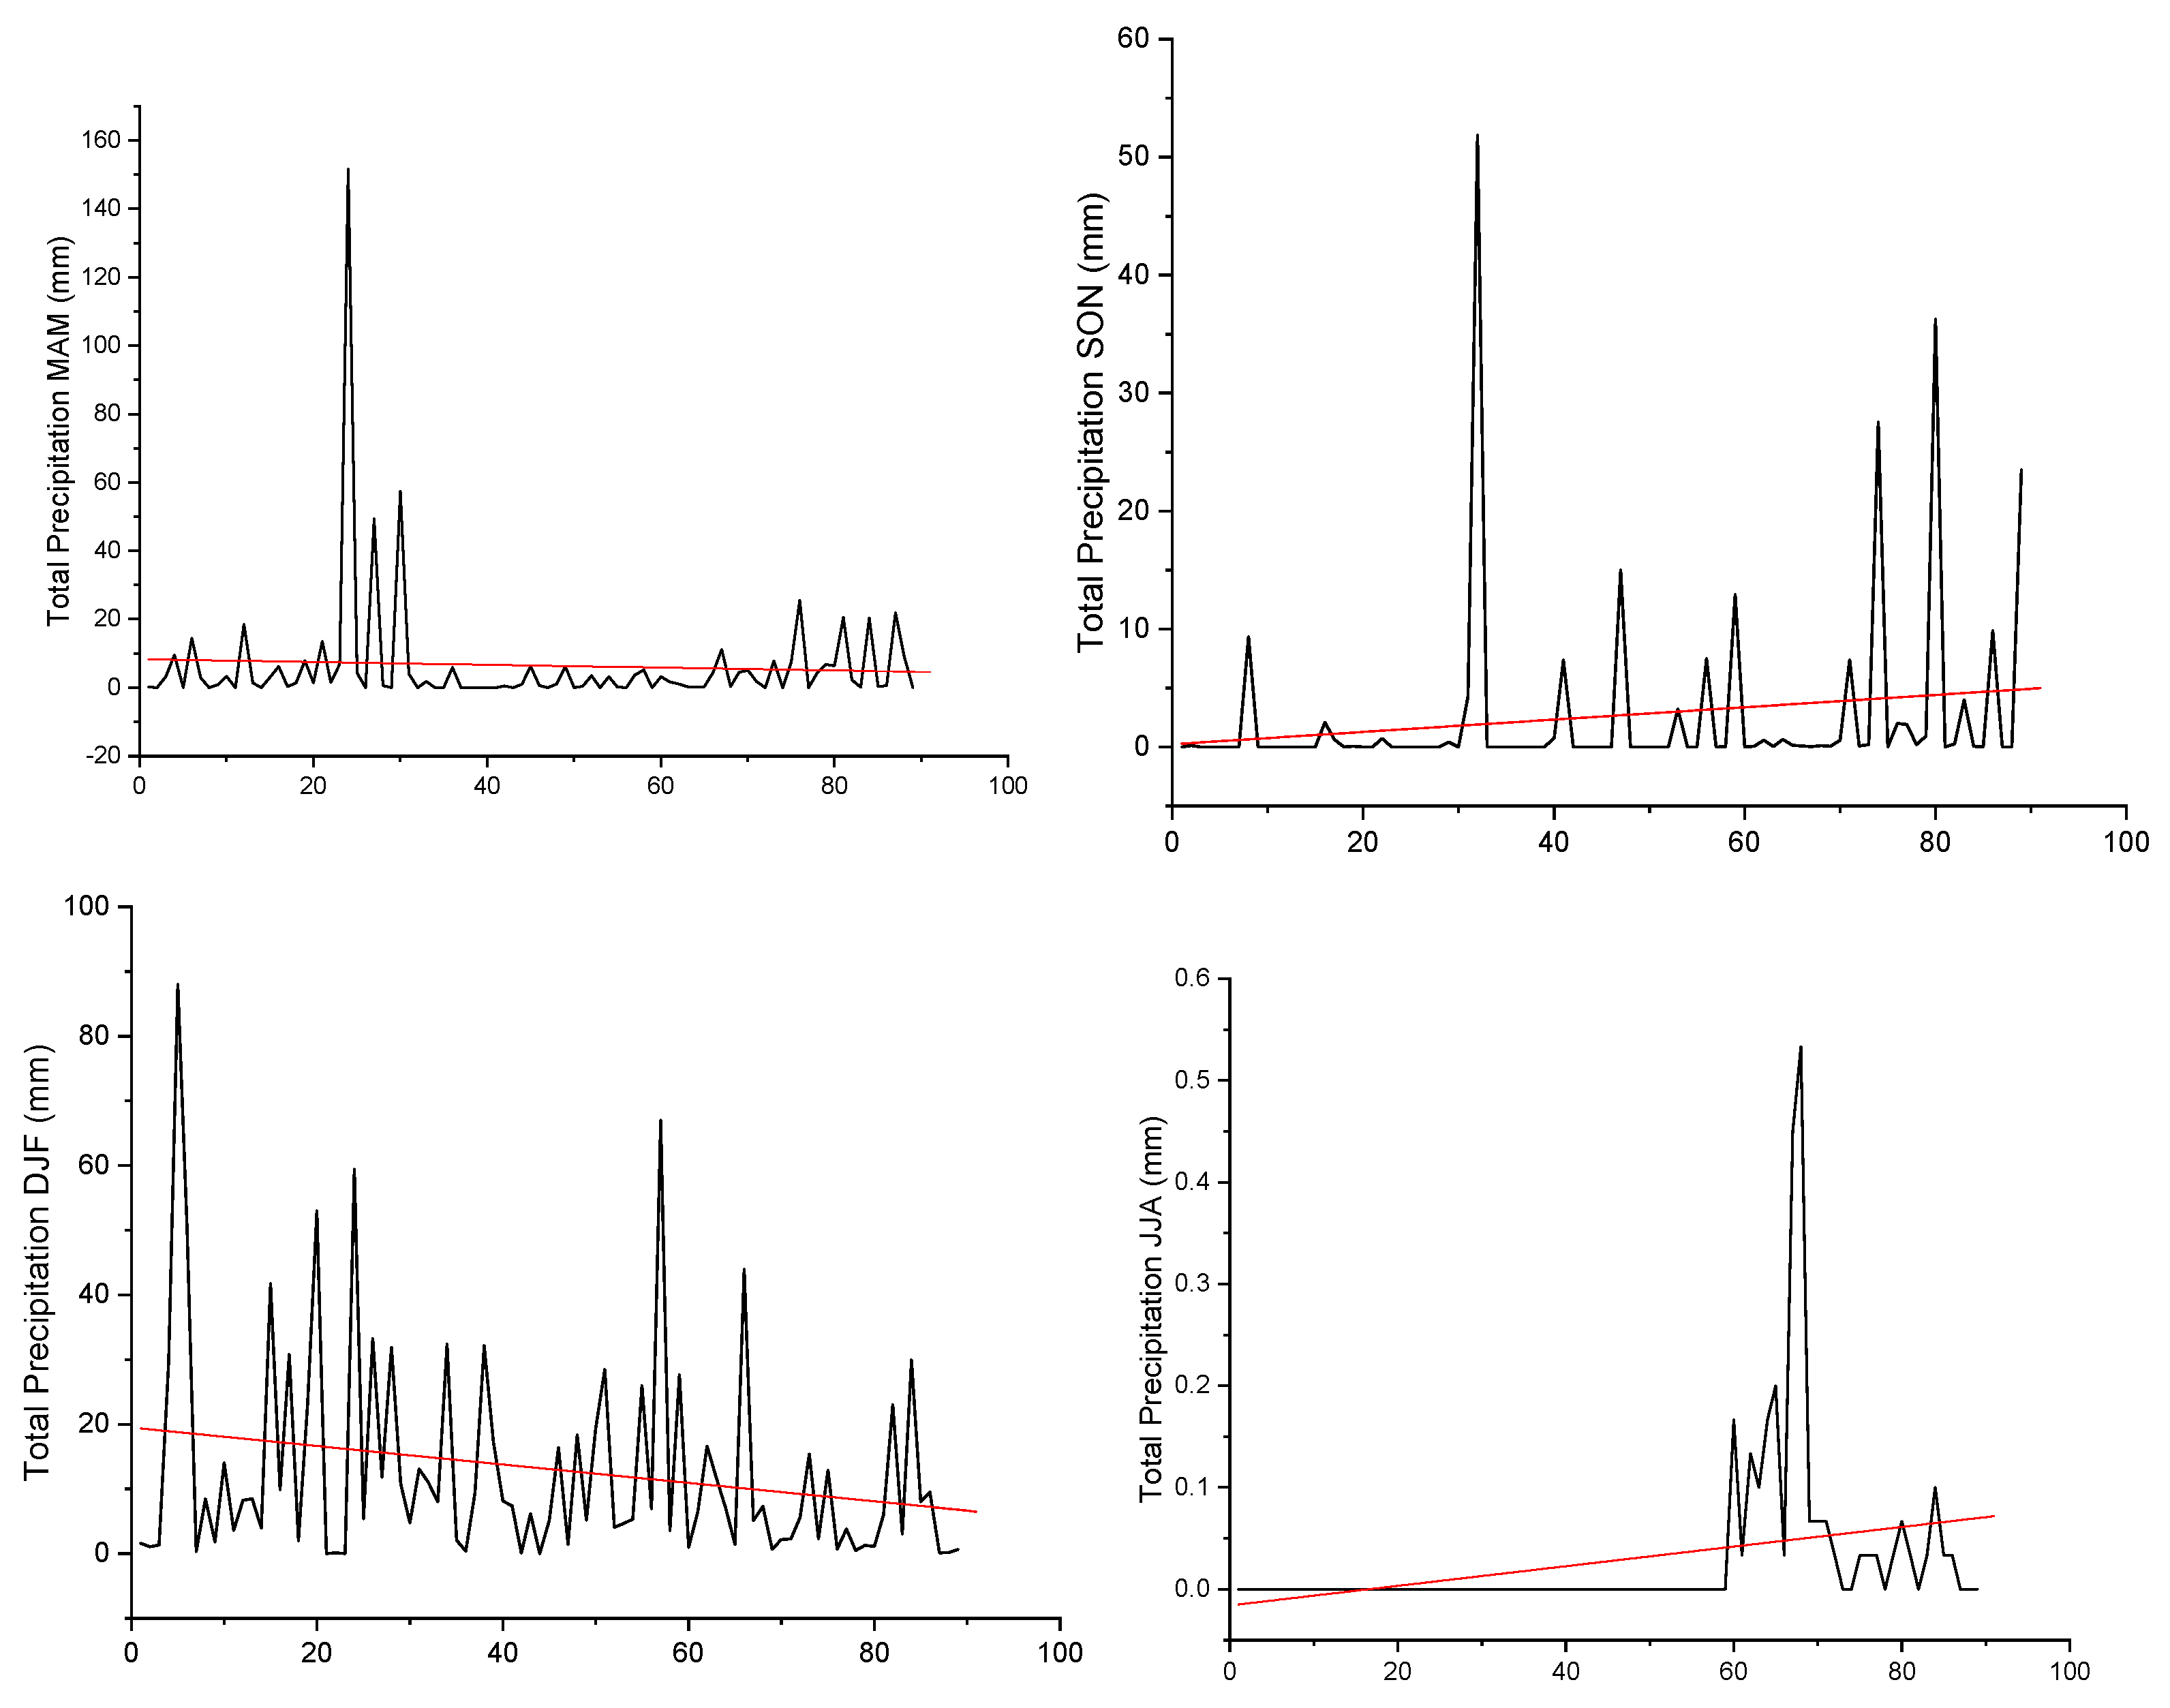
Similarly, total monthly rainfall was analysed for seasonal trends using the Mann Kendall trend test with 95% confidence. Annual rainfall in the State of Qatar is 70 mm based on the average data from 1987–2016. Most of the rainfall occurs during DJF and MAM followed by SON and JJA. JJA is usually dry with zero rainfall; however, in the recent decade, rainfall during JJA was increasing. Based on the Mann Kendall trend test, a statistically significant increment in the total monthly rainfall data was observed during JJA (τ = 0.453, S = 0, p < 0.0001) and SON (τ = 0.314, S = 0, p < 0.0001) (Figure 5). In contrast a nonsignificant downward trend in the total monthly rainfall was found during DJF (τ = −0.109, S = −0.045, p > 0.05), while a nonsignificant increasing trend was observed for MAM (τ = 0.047, S = 0, p > 0.05).
4.3. Station-Wise Annual Trends
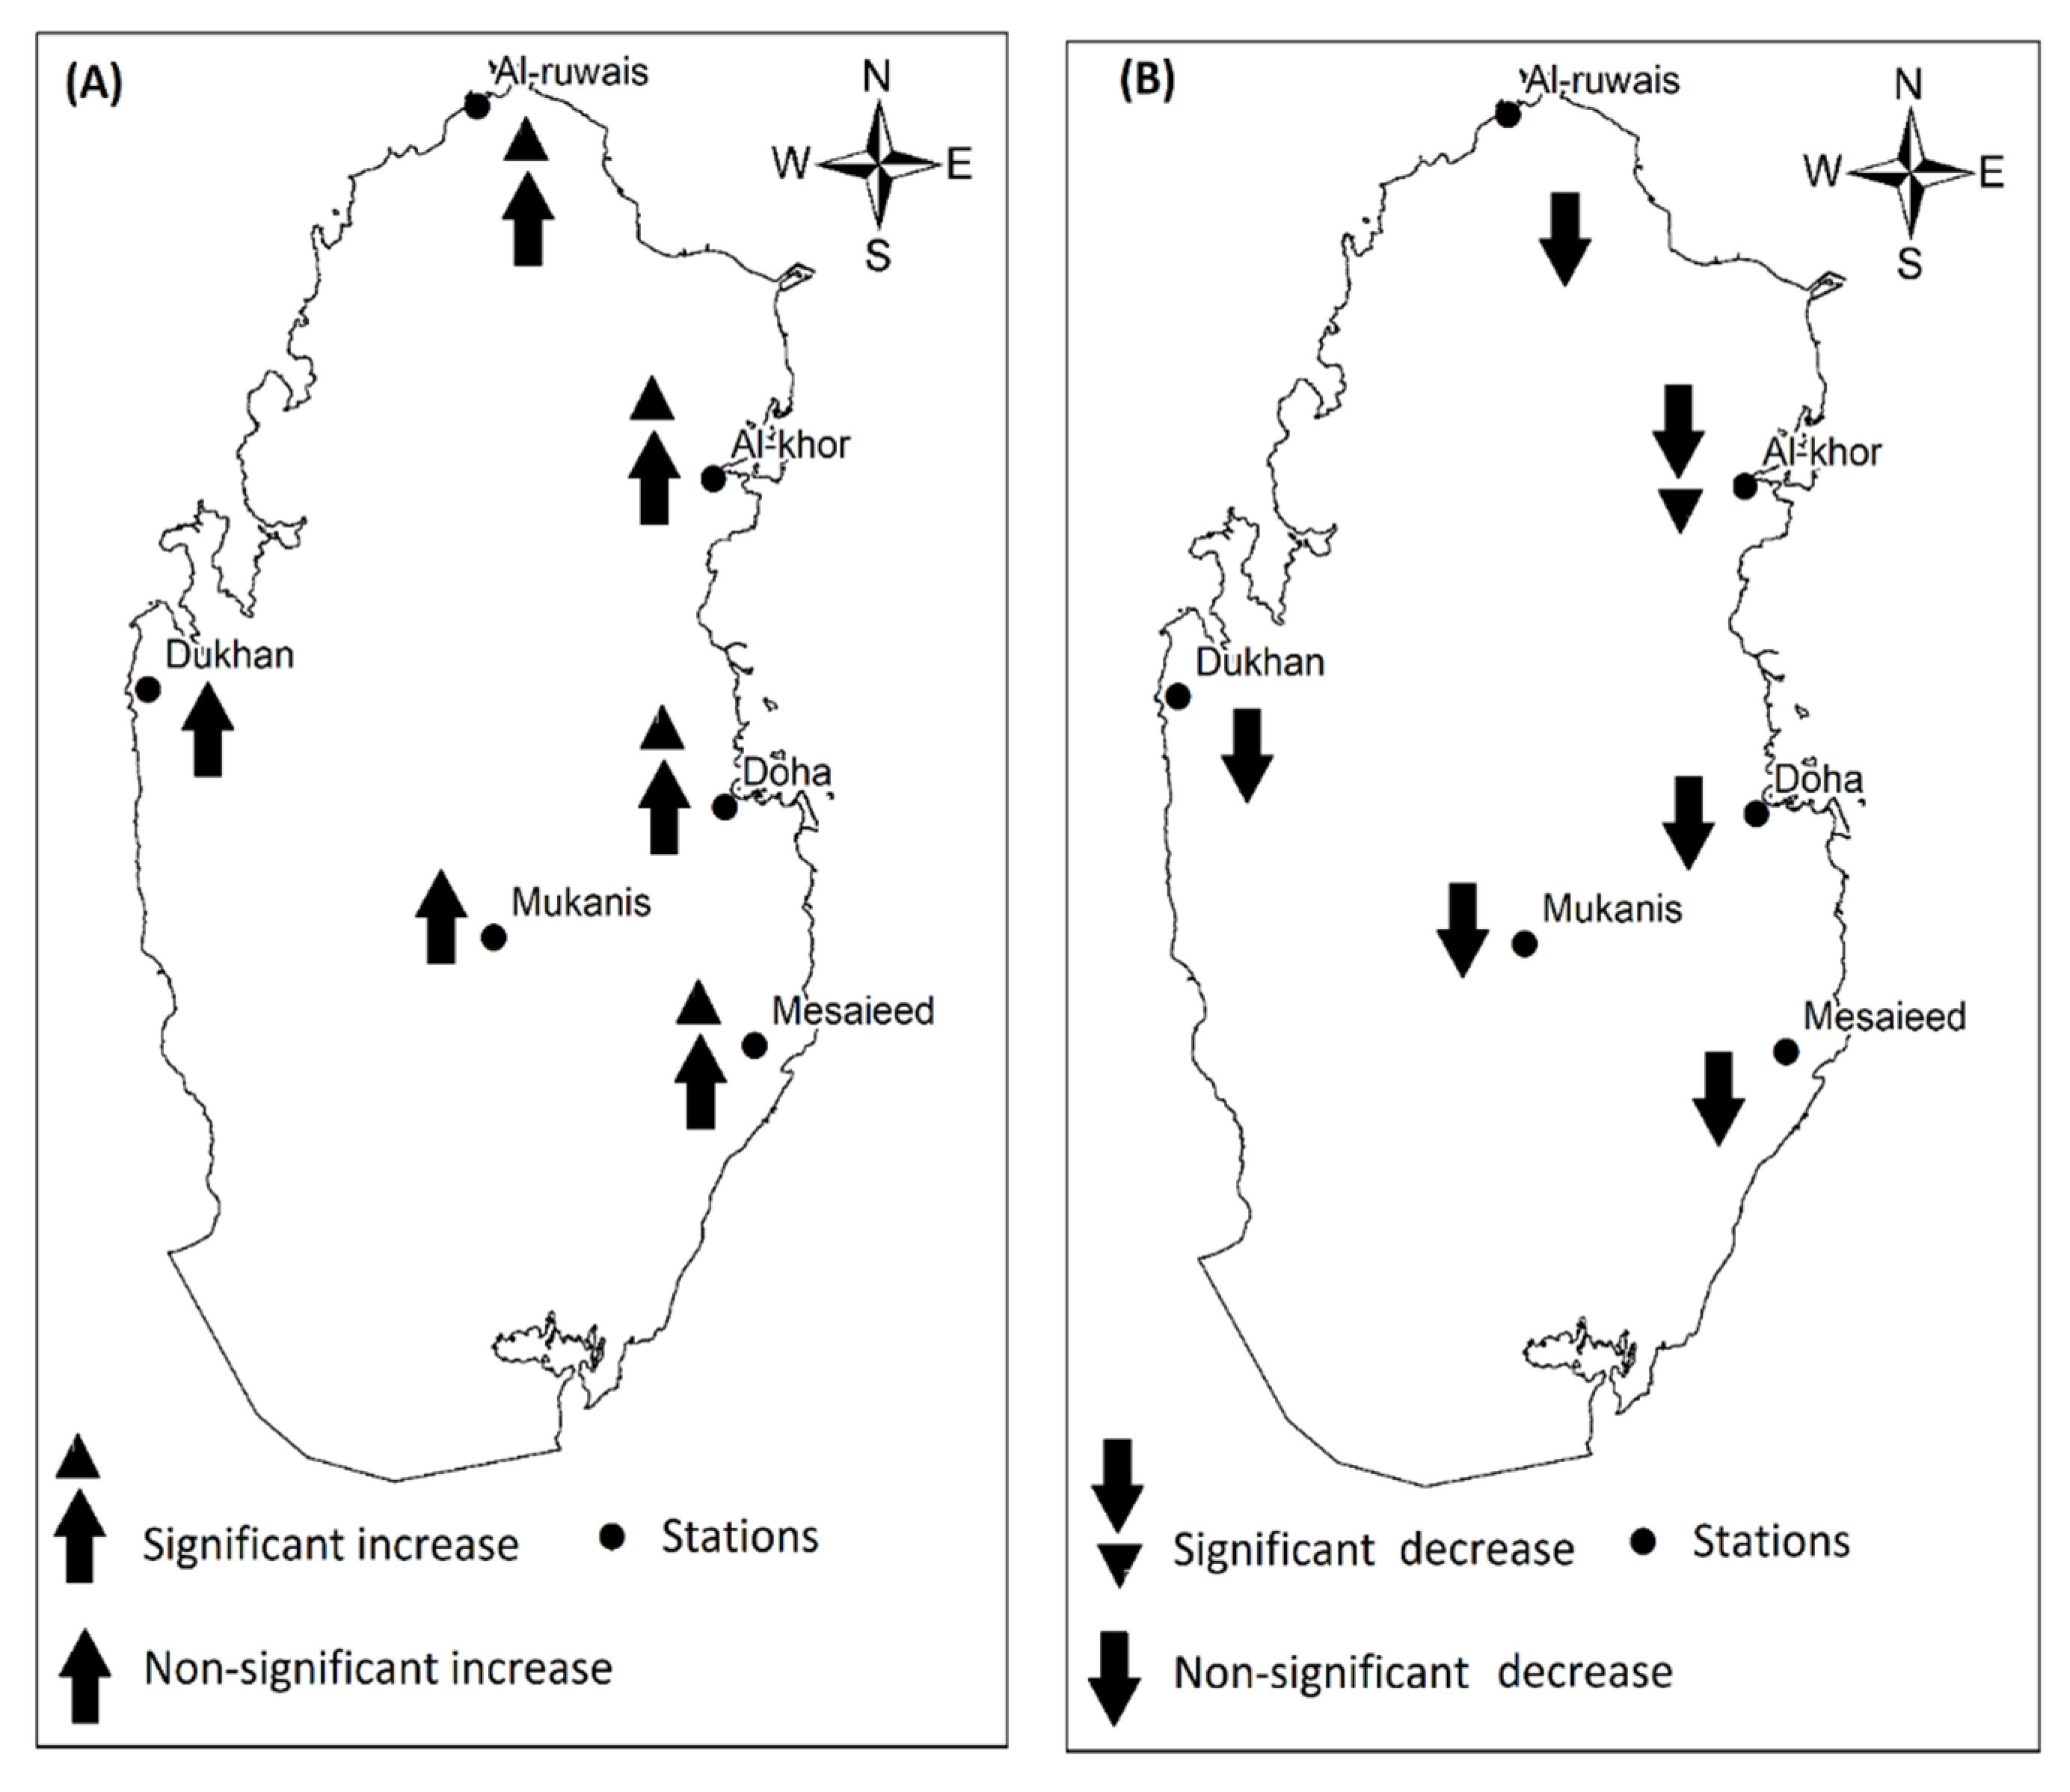
Rainfall and temperature data of six weather stations were analysed for long-term trends and spatial variability. Long-term data analysis indicated that four (66%) weather stations exhibited statistically significant increasing trends, while two weather stations namely, Dukhan and Mukanis, demonstrated increasing but nonsignificant upward trends in mean annual temperature (Figure 6). It was determined that weather stations situated at the eastern southern coastal areas experienced significant increment in mean annual temperature, while the temperature at the western coastal areas such as Dukhan is increasing; however, the trend is not statistically significant.
In contrast to the increasing mean annual temperature, the annual total rainfall is decreasing at all weather stations, though the only significant decrease in the total annual rainfall was found at Al-khor weather station (Figure 6).
4.4. Seasonal Station Wise Spatial Variability
Data from six weather stations were analysed for seasonal trends in winter = DJF, spring = MAM, summer = JJA and autumn = SON. All weather stations indicated an increased temperature in the seasonal mean monthly temperature. However, 50% of the weather stations, namely Doha, Al-ruwais and Mukanis, indicated a significant increase during DJF. The number of weather stations with a significant increase in the monthly temperature further increased to 66.67% during MAM, JJA and SON (Figure 7). Most of these weather stations are installed in the eastern and southern coastal areas. In contrast, both the Al- Khor station installed at the eastern coastal line, and the Dukhan weather station situated at the western coastal line, exhibited nonsignificant increasing trends. This could be attributed to the geographic, climatic and anthropogenic changes in those areas.
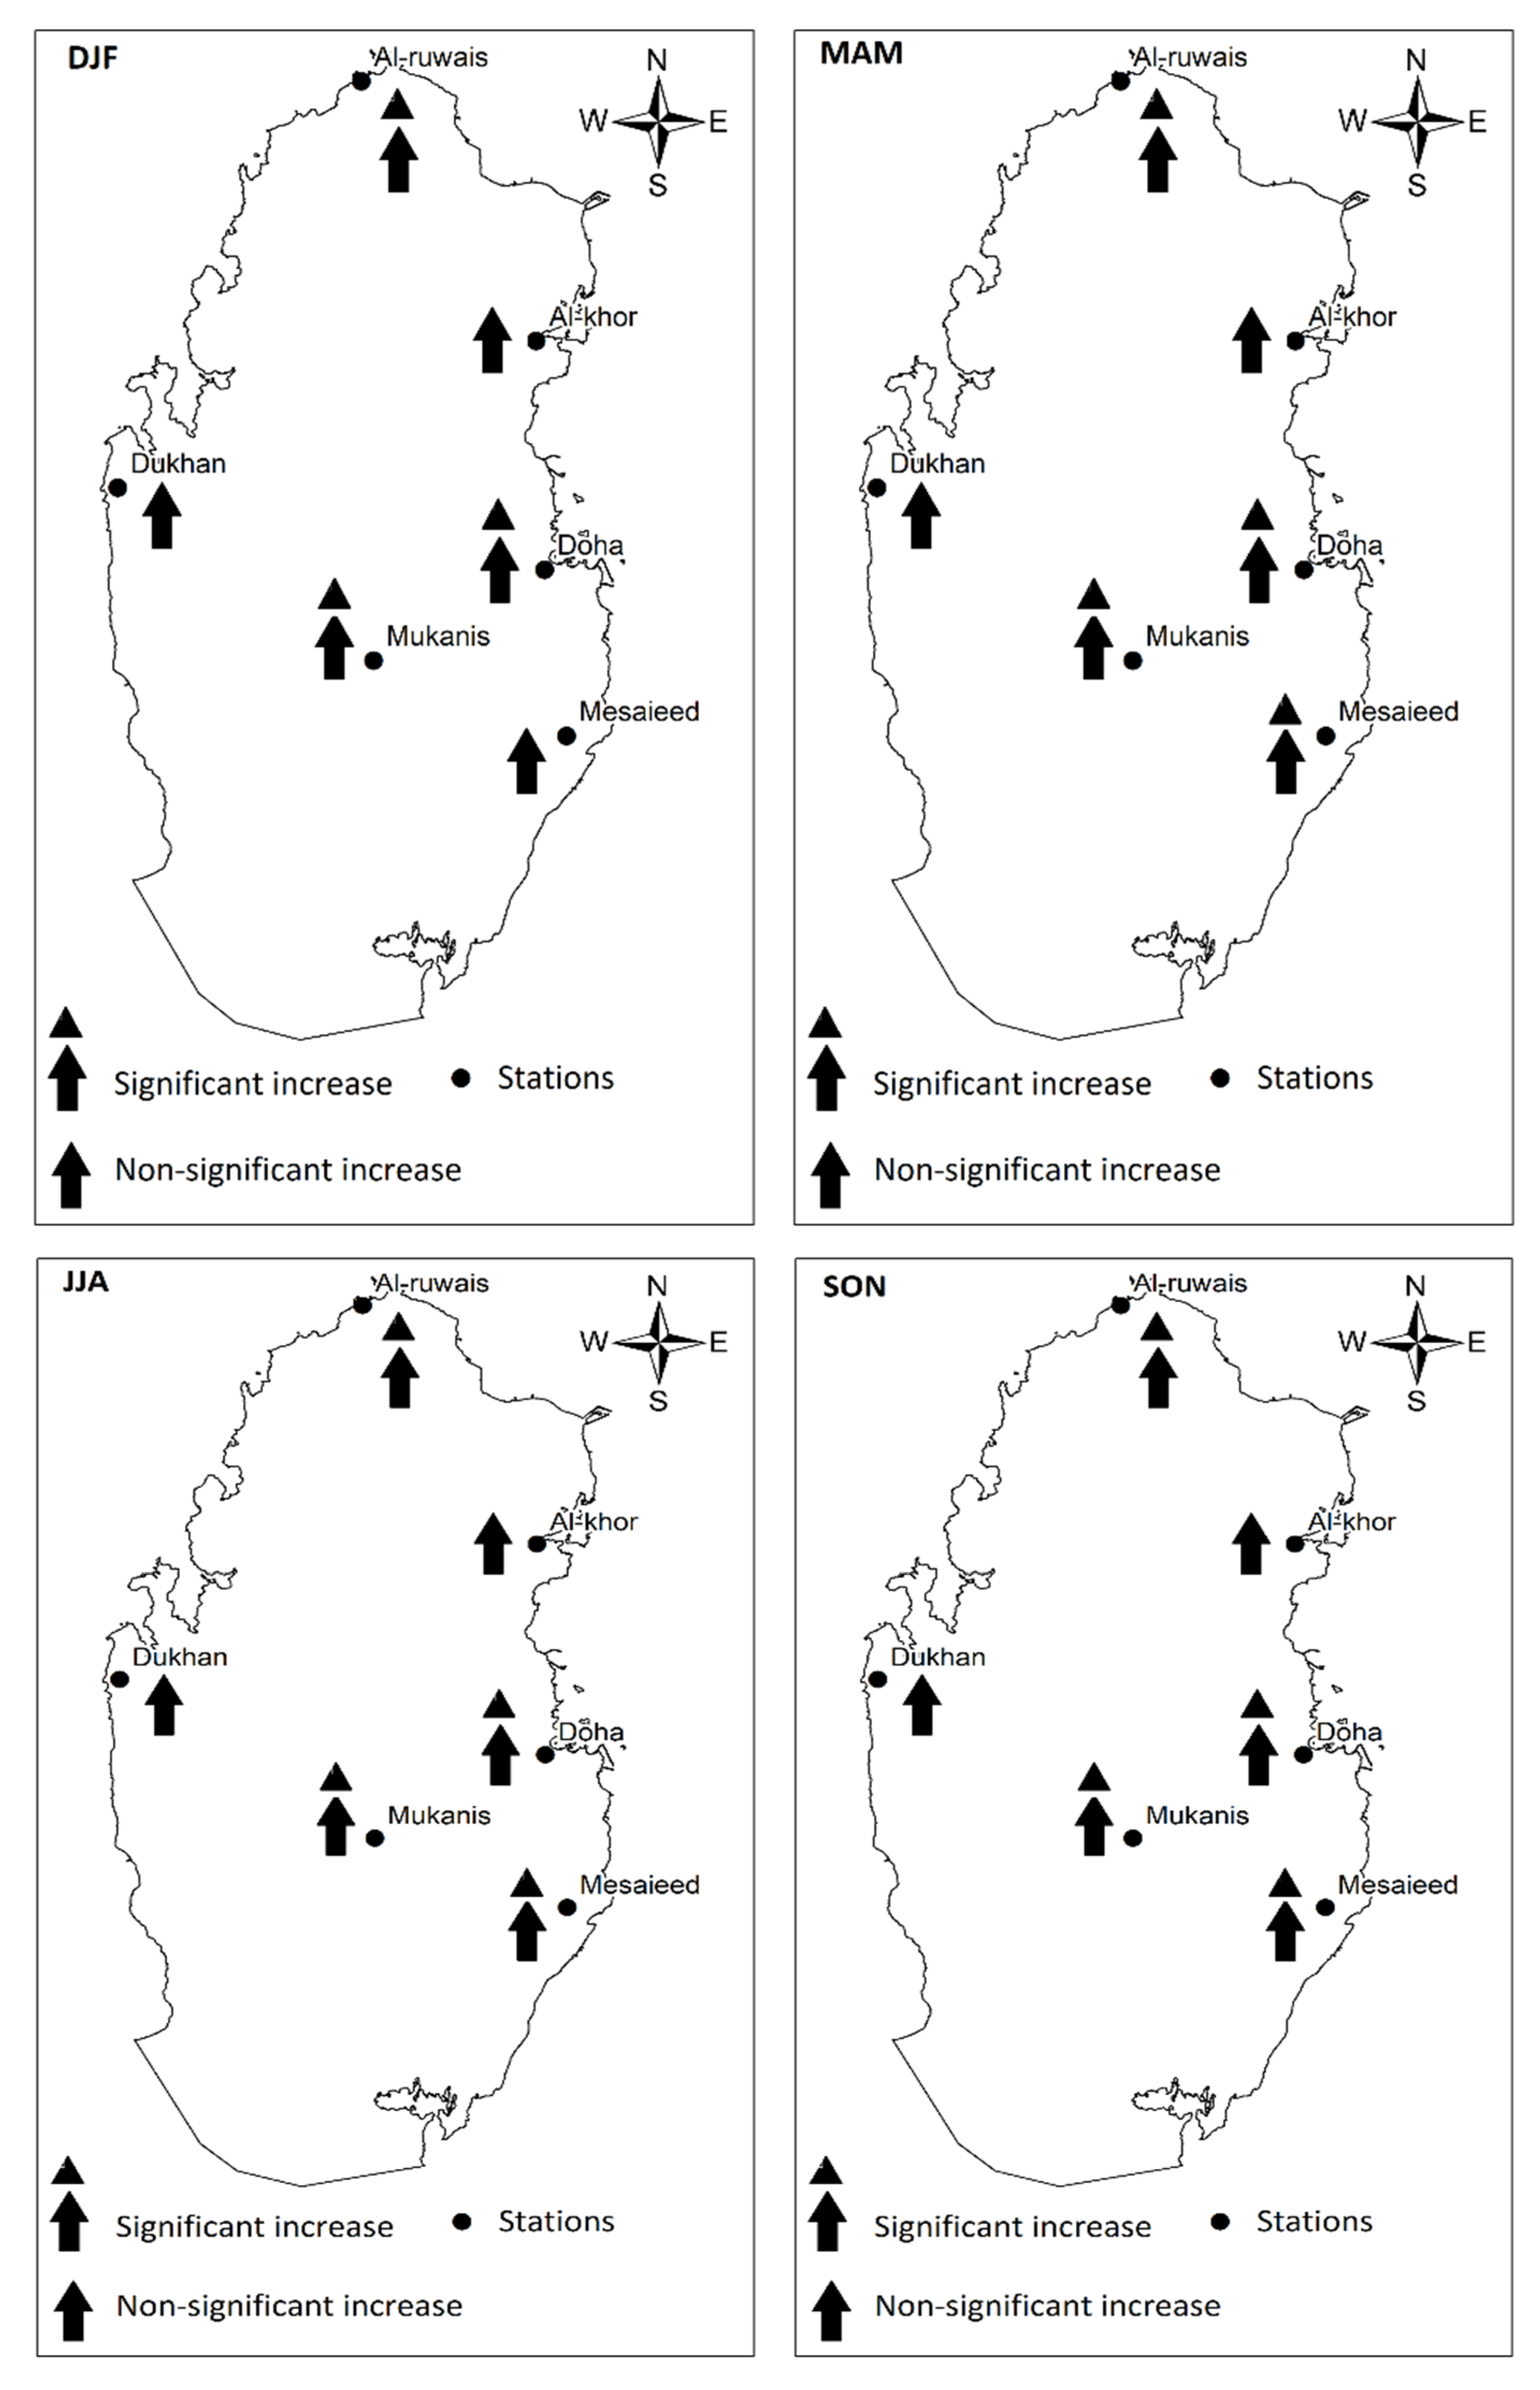
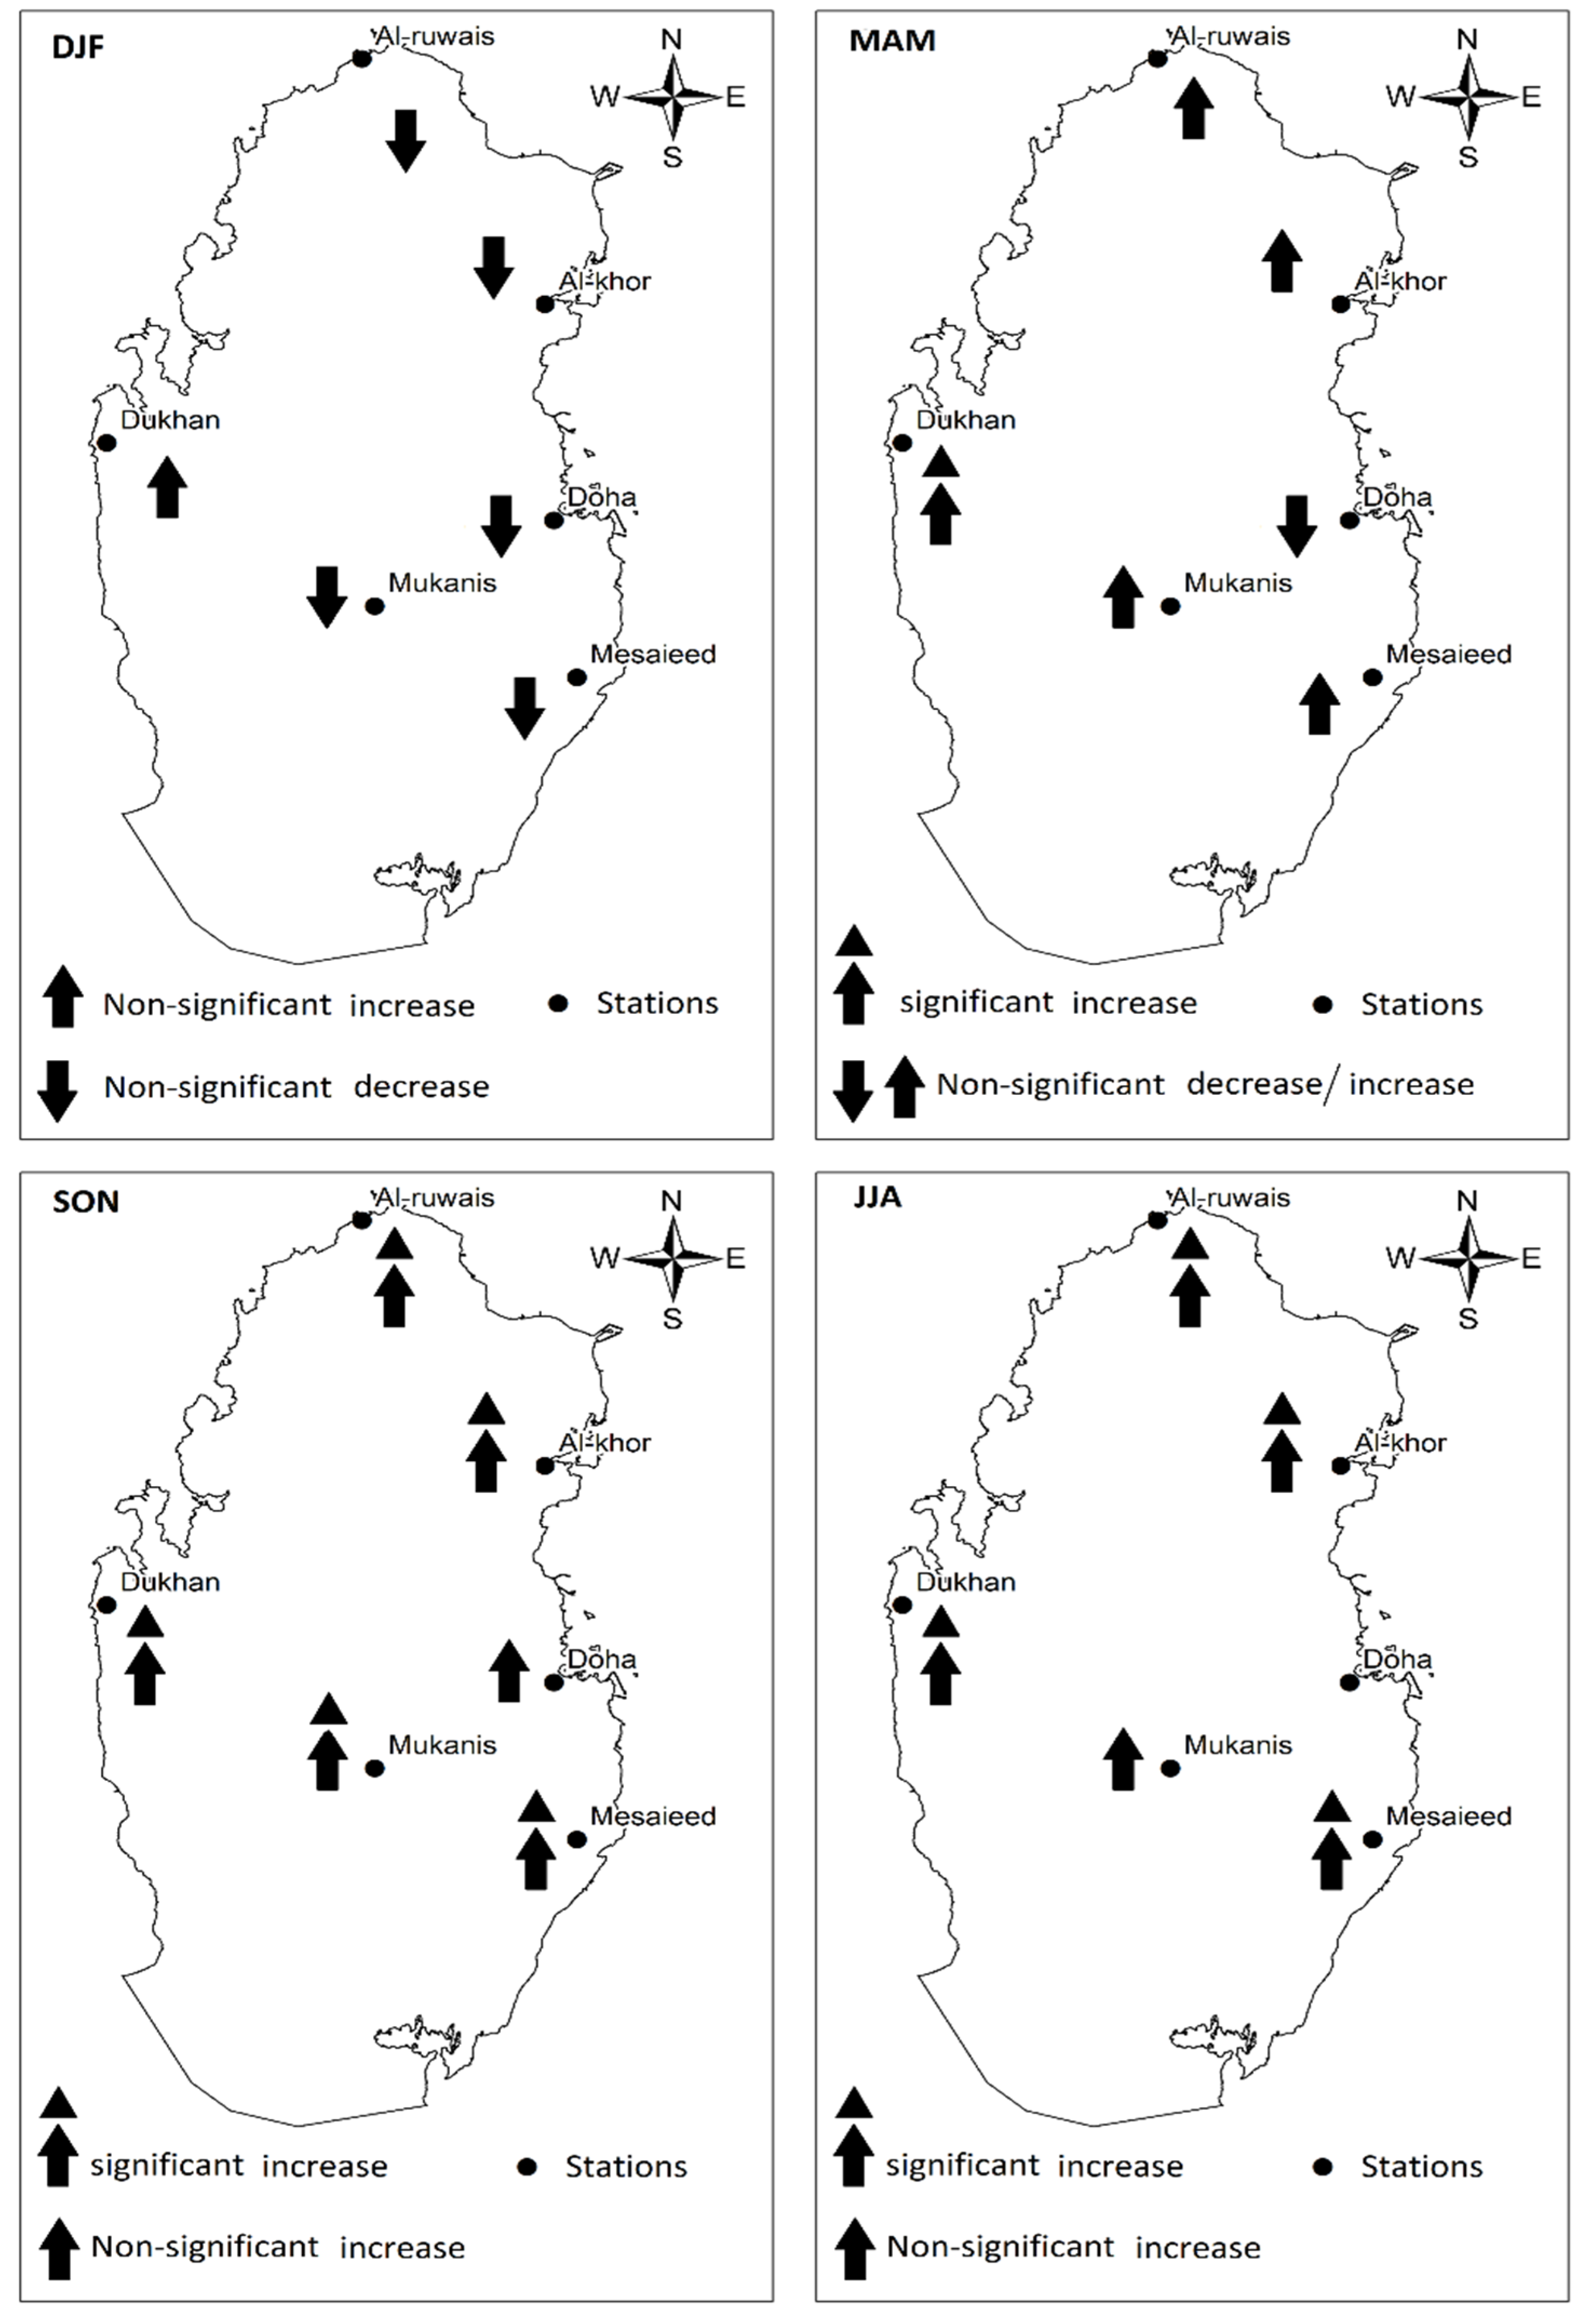
All six weather stations were also investigated for seasonal rainfall variation. The Mann Kendall trend test indicated great variability in seasonal temperature in DJF and MAM compared to JJA and SON. In DJF, none of the weather stations indicated a statistically significant increase in the monthly rainfall; however, a general nonsignificant decreasing trend was observed at five stations. As the temperature increases with the early warming in later February, monthly rainfall tends to increase with a significant increase at Dukhan weather station. In JJA, 80% of stations demonstrated a statistically significant increase in the total monthly rainfall. Similarly, 83% of stations indicated a significant upward tendency in the total monthly rainfall during SON. Though monthly rainfall increased significantly in JJA and SON, a significant amount of rainfall was received in DJF. Thus, decreasing trends in DJF is of importance compared to the observed significant increases in MAM, JJA and SON (Figure 8).
5. Groundwater Assessment
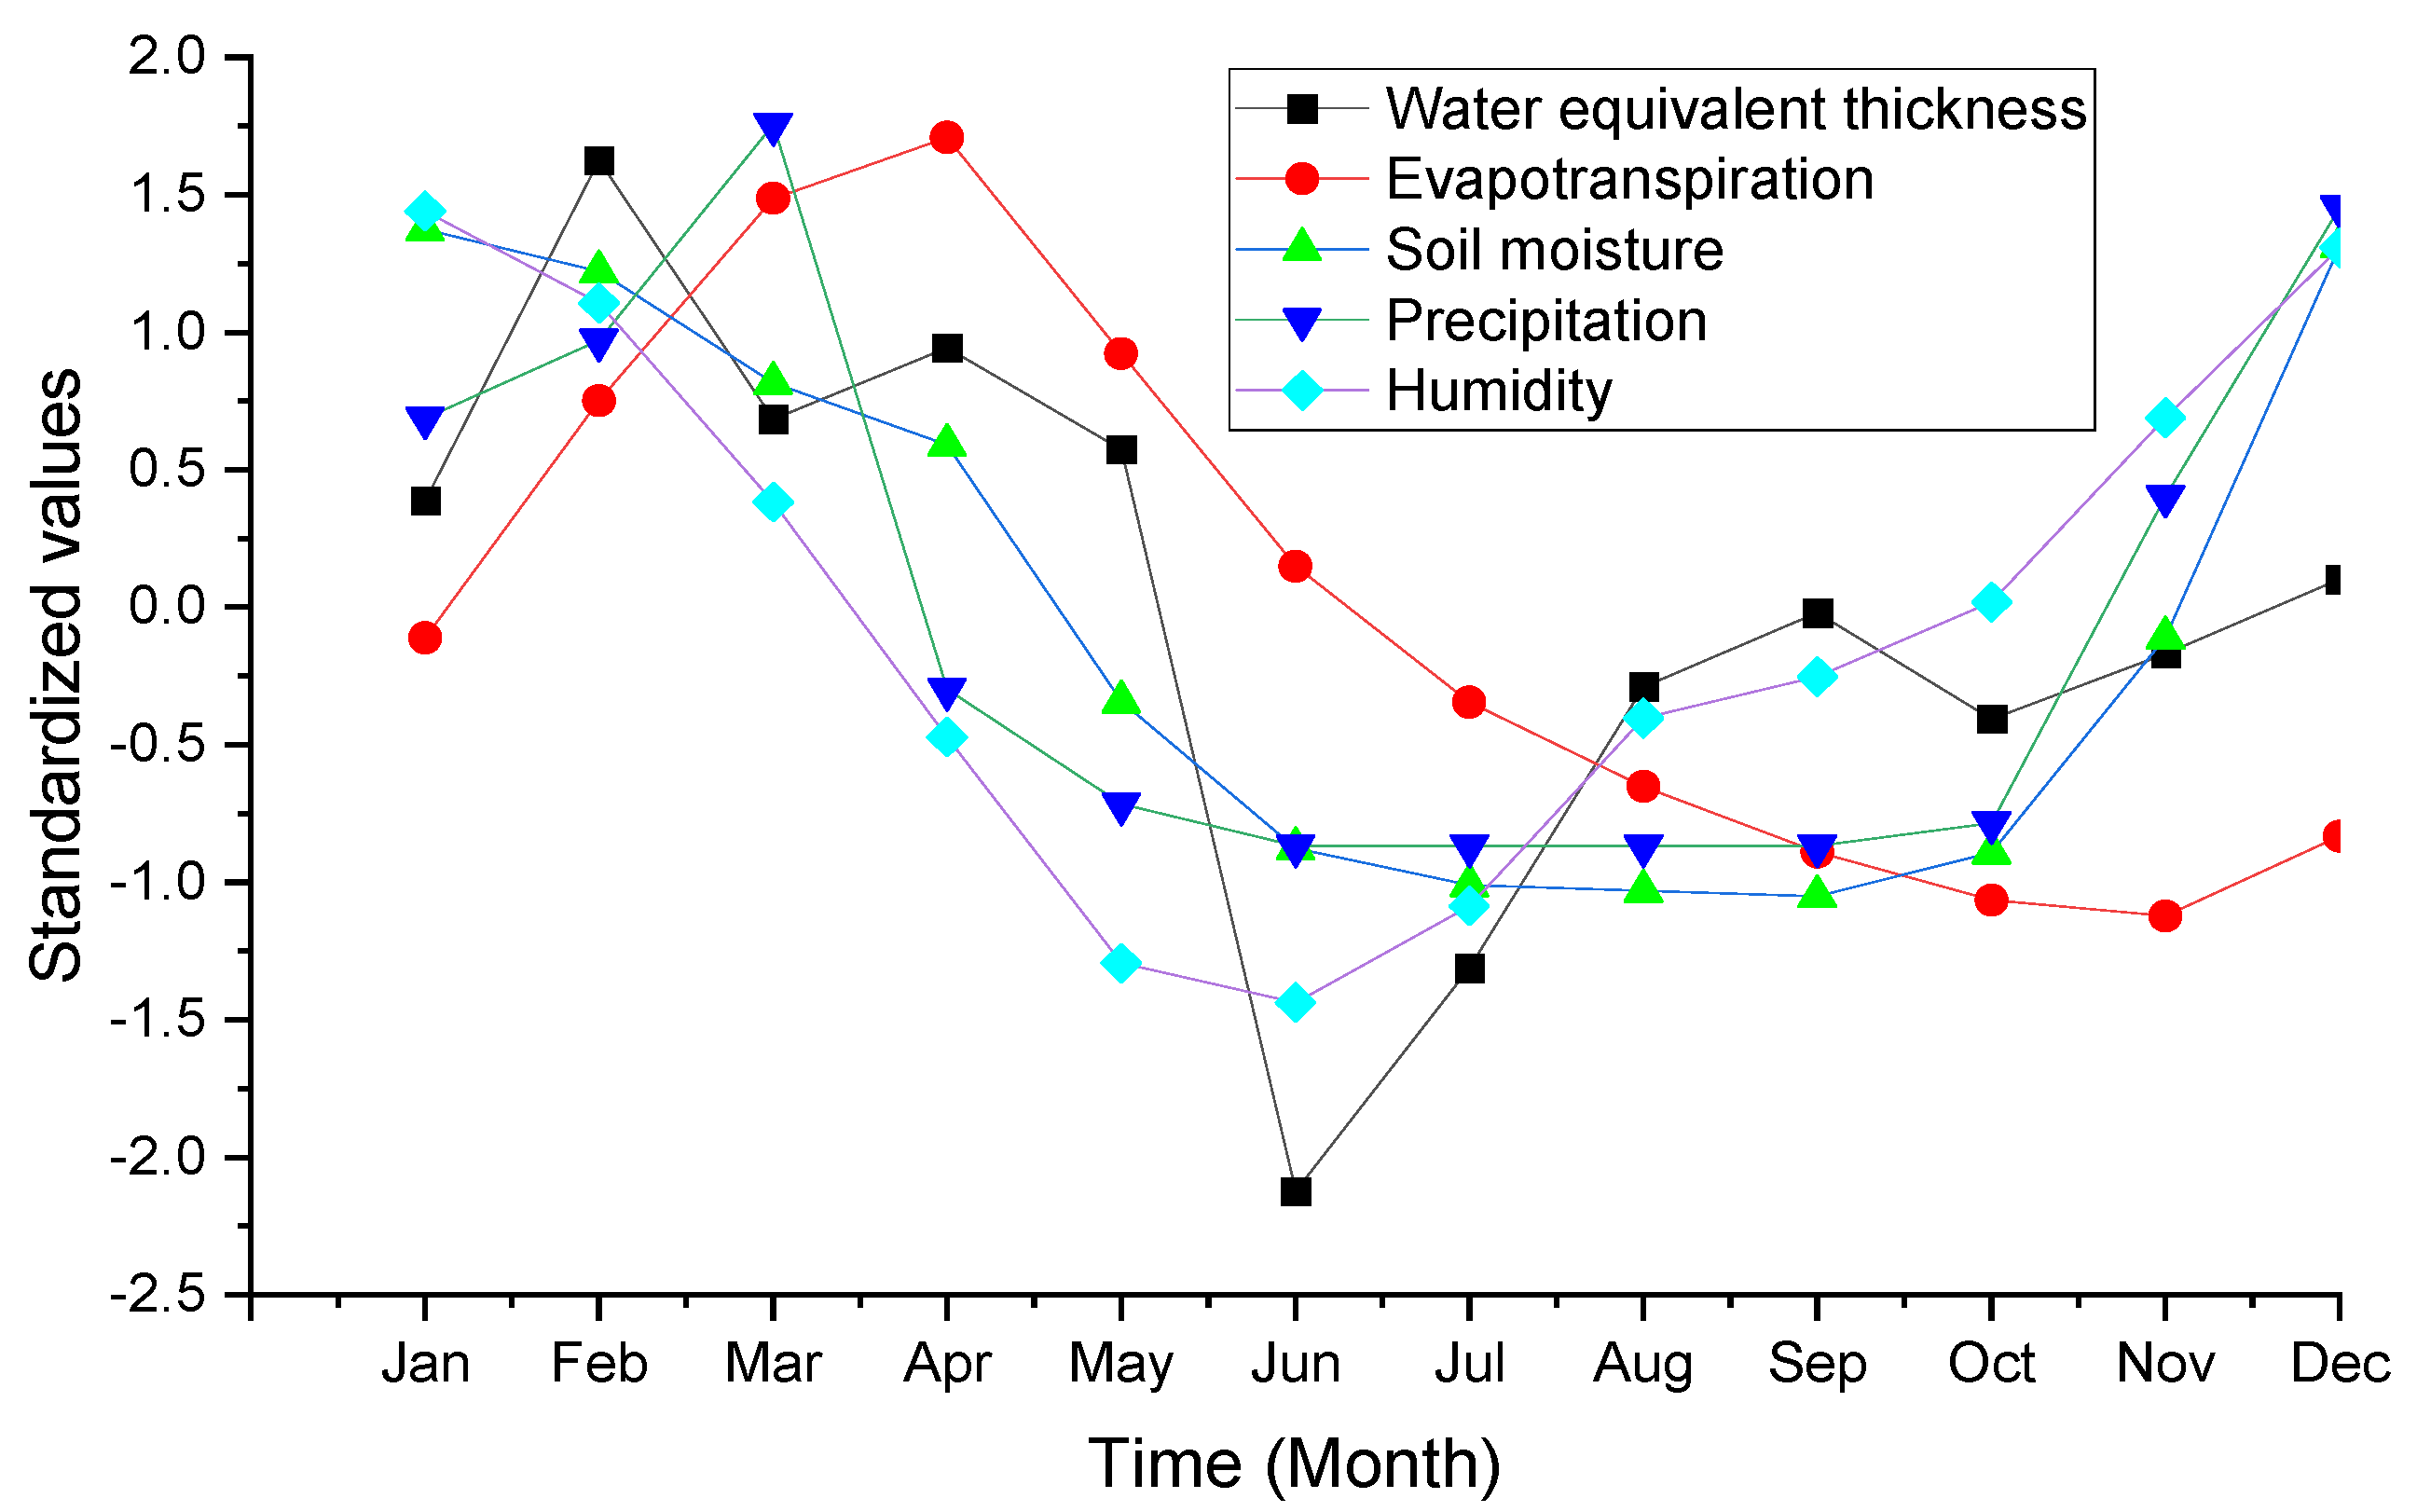
Groundwater is one of the most important water resources of Qatar. Groundwater extraction and desalination of seawater fulfil national water needs. Based on the long-term average of GRACE-FO data analysis there is a considerable interannual variation (±2 cm) in the groundwater depletion (Figure 9). Groundwater depletion reaches the highest in June as increased temperature increases the rate of evapotranspiration and the overall water requirements for agriculture, horticulture and other recreational activities increases. Rainfall during winter is one of the major sources of the aquifer. Around 71.6 million cubic meters are contributed by annual rainfall to the groundwater recharge while about 2.2 million cubic meters are added by inflow from Saudi Arabia [19]. Temperature and rainfall play an important role in the variation of soil moisture, evapotranspiration, relative humidity, and groundwater recharge. Most of the rainfall occurs during DJF and that is why the rate of groundwater depletion is lower during these months. In contrast, groundwater depletion is highest in June due to zero rainfall.
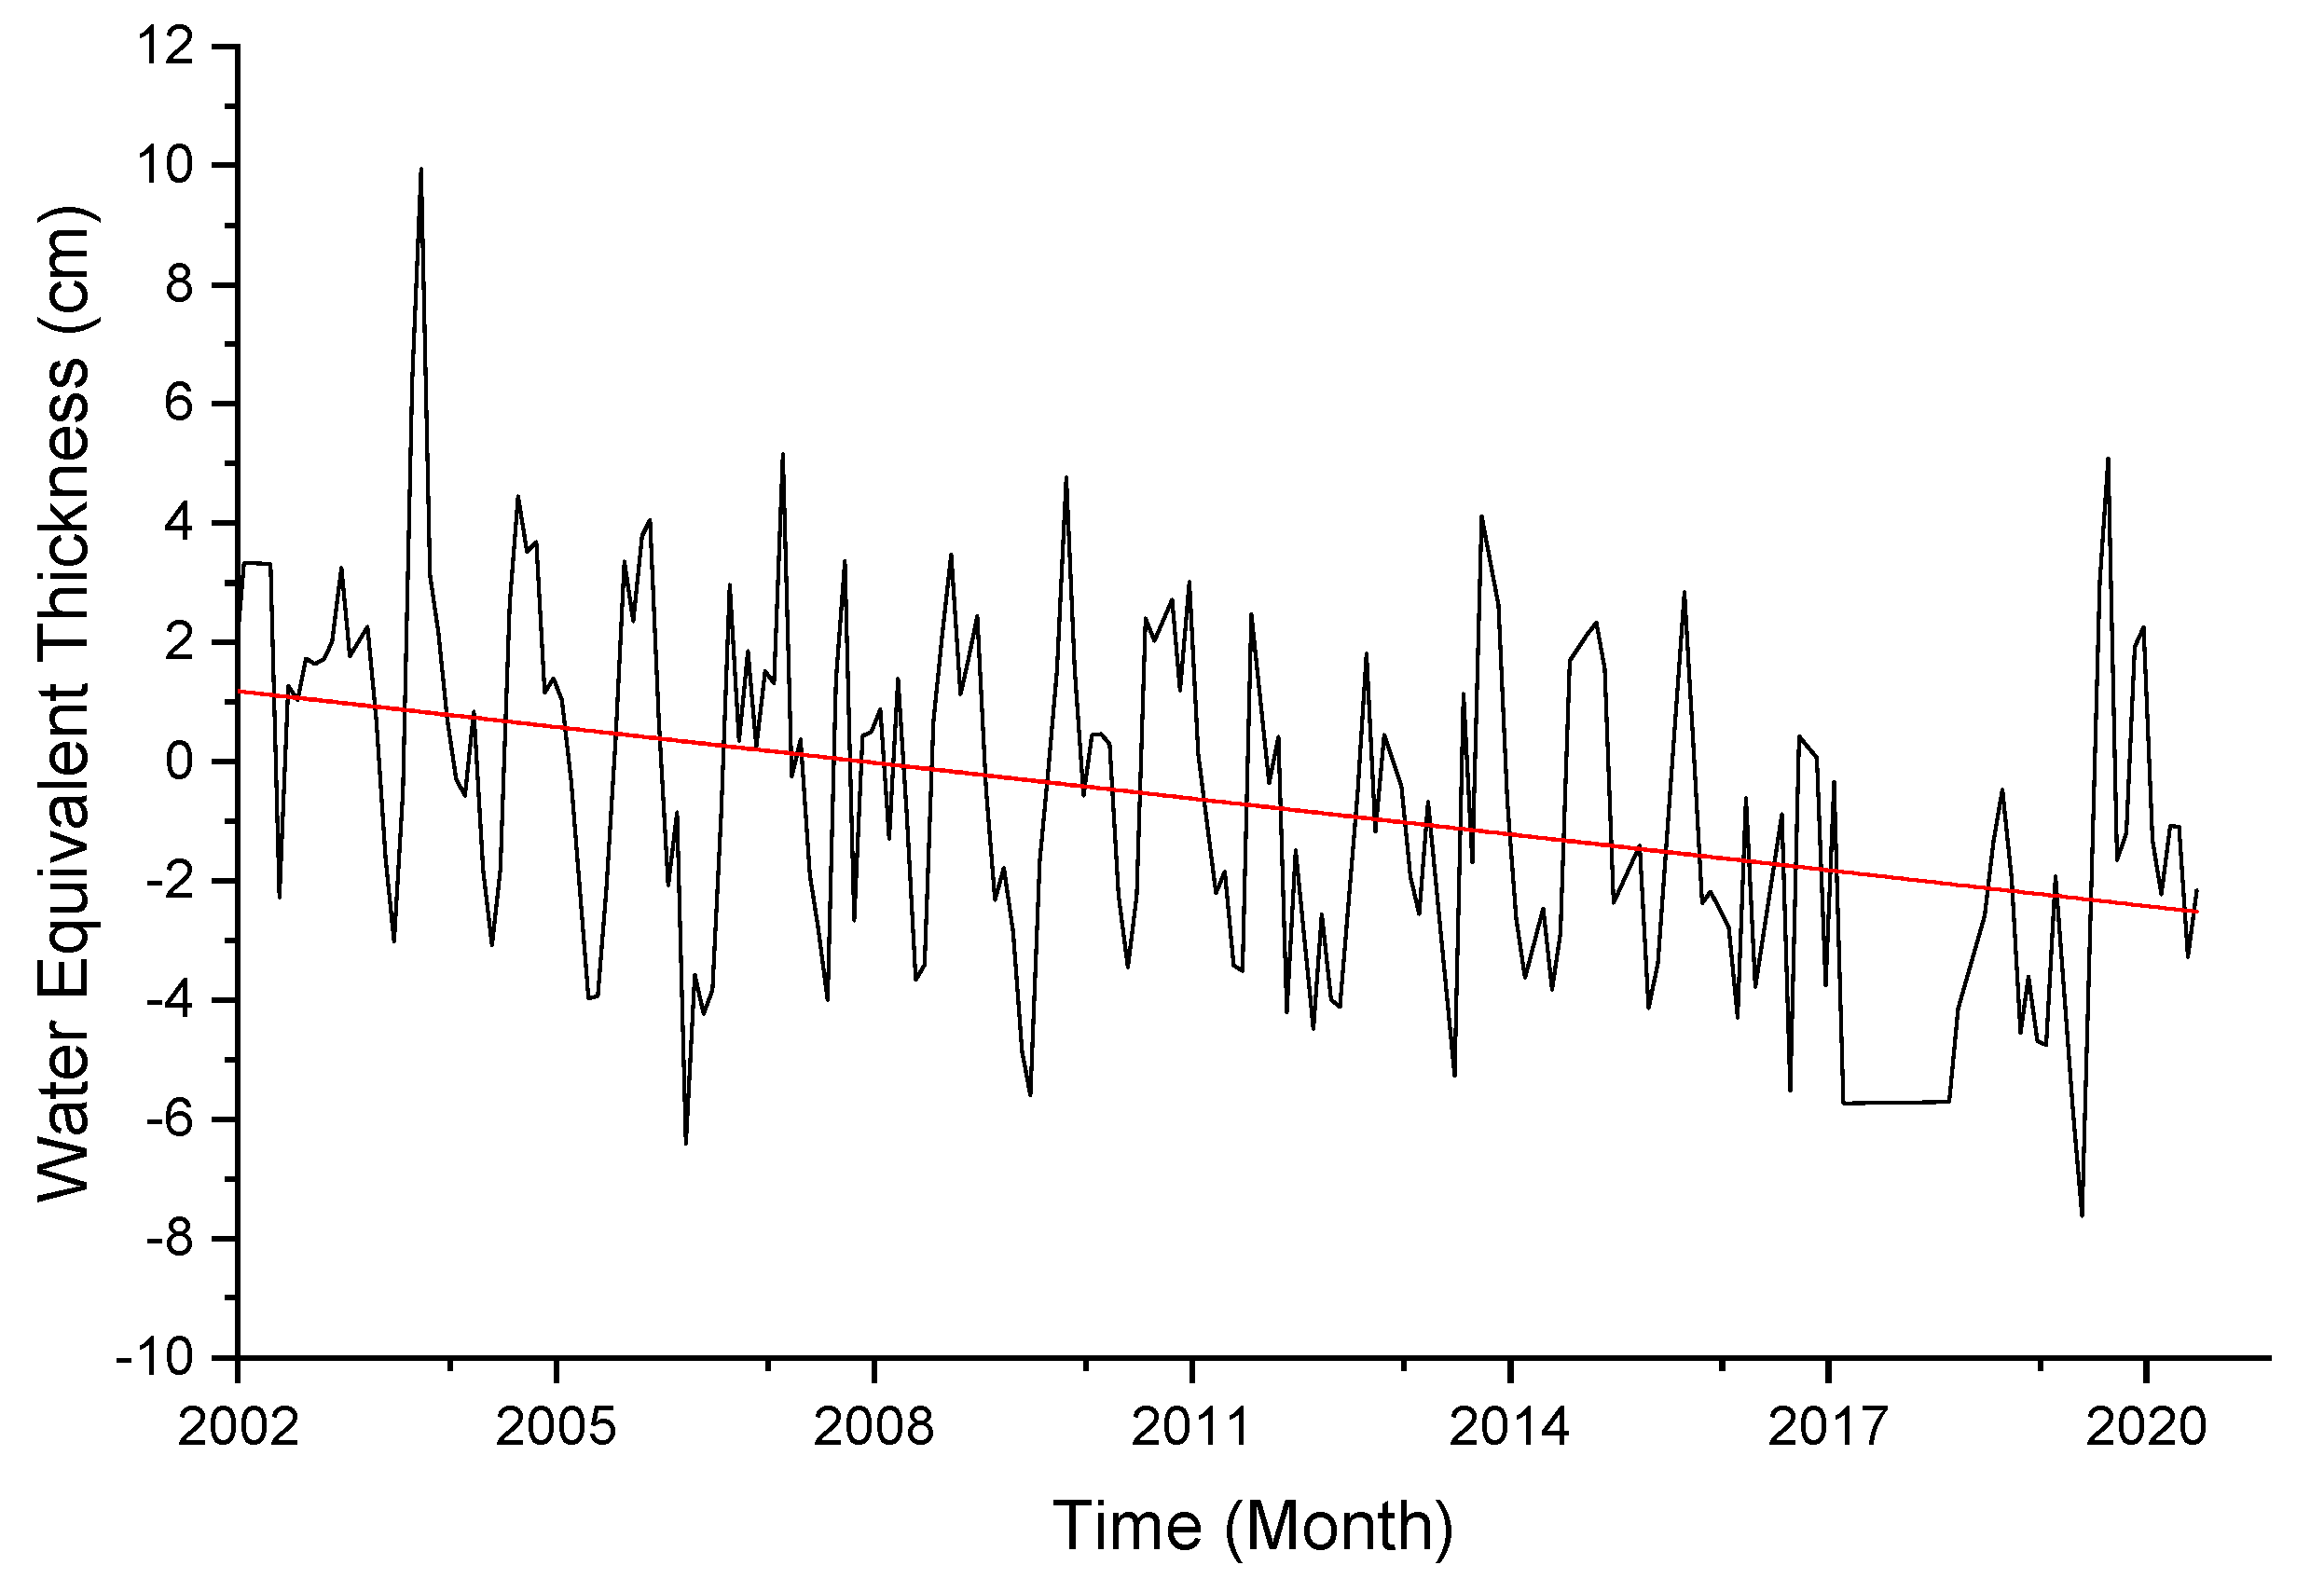
GRACE-FO monthly water equivalent thickness data analysis indicated a significant depletion in the groundwater from 2002–2020. The GRACE-FO JPL data showed a statistically significant (t = −0.260, p < 0.05) decrease in the groundwater thickness. Sen’s slope estimated a depletion trend of 0.24 ± 0.20 cm per year (Figure 10). This reduction in the groundwater thickness is in agreement with the previous study conducted in the UAE where an annual decline of 0.5 cm per year was reported [22]. A recent study in Saudi Arabia found an annual decreasing trend of 1 cm per year in the groundwater thickness using GRACE data [42]. Similarly, a groundwater thickness reduction of 0.76 cm per year was found in Bakhtegan catchment of Iran [24]. Groundwater is mainly used for agriculture purposes, as the majority of the domestic and industrial water demand is fulfilled by desalination. According to the Planning and Statistical Authority, agriculture is the biggest consumer of freshwater resources, with an annual use of 309.97 million cubic meters in 2019 [43]. About 250 million cubic meters of groundwater were extracted by the agriculture sector in 2019. Long-term groundwater extraction data indicated a gradual increase in the water consumption pattern by the agriculture sector (Figure 10). Groundwater extraction by the agriculture sector could be one of the reasons for the observed significant groundwater thickness loss observed by GRACE-FO. Moreover, correlation analysis indicated a significant direct correlation only between groundwater and evapotranspiration (r = 0.196) and groundwater and relative humidity (r = 0.287). This indicates that rainfall plays a significant role in groundwater recharge. Relative humidity increases with an increase in rainfall as rainwater is evaporated from the soil into the atmosphere.
Rainfall is one of the main sources of groundwater recharge in the State of Qatar. As mentioned earlier (Figure 3) the long-term rainfall trend exhibited a slight negative trend from 1987–2016. However, state-wide total monthly rainfall data exhibited a significant positive trend from 2000 onwards, which was primarily due to anomalous extreme rainfall, especially in 201,8 which resulted in flash floods. Average total monthly rainfall data from the six weather stations indicated a positive trend and with an increase of 0.072 mm per year. Rainfall and temperature play a great role in the hydrological cycle. Rainfall in the State of Qatar is erratic and falls mostly during the winter months. Correlation analysis indicates that a significant negative correlation (r = −0.421) exists between rainfall and temperature. As the rain falls it causes a cooling effect and thus a reduction in the mean temperature. This cooling effect is a result of soil moisture being evaporated from the land into the atmosphere. A significant inverse correlation of mean temperature with soil moisture and relative humidity further explains the phenomenon that as the temperature increases it reduces soil moisture and relative humidity.
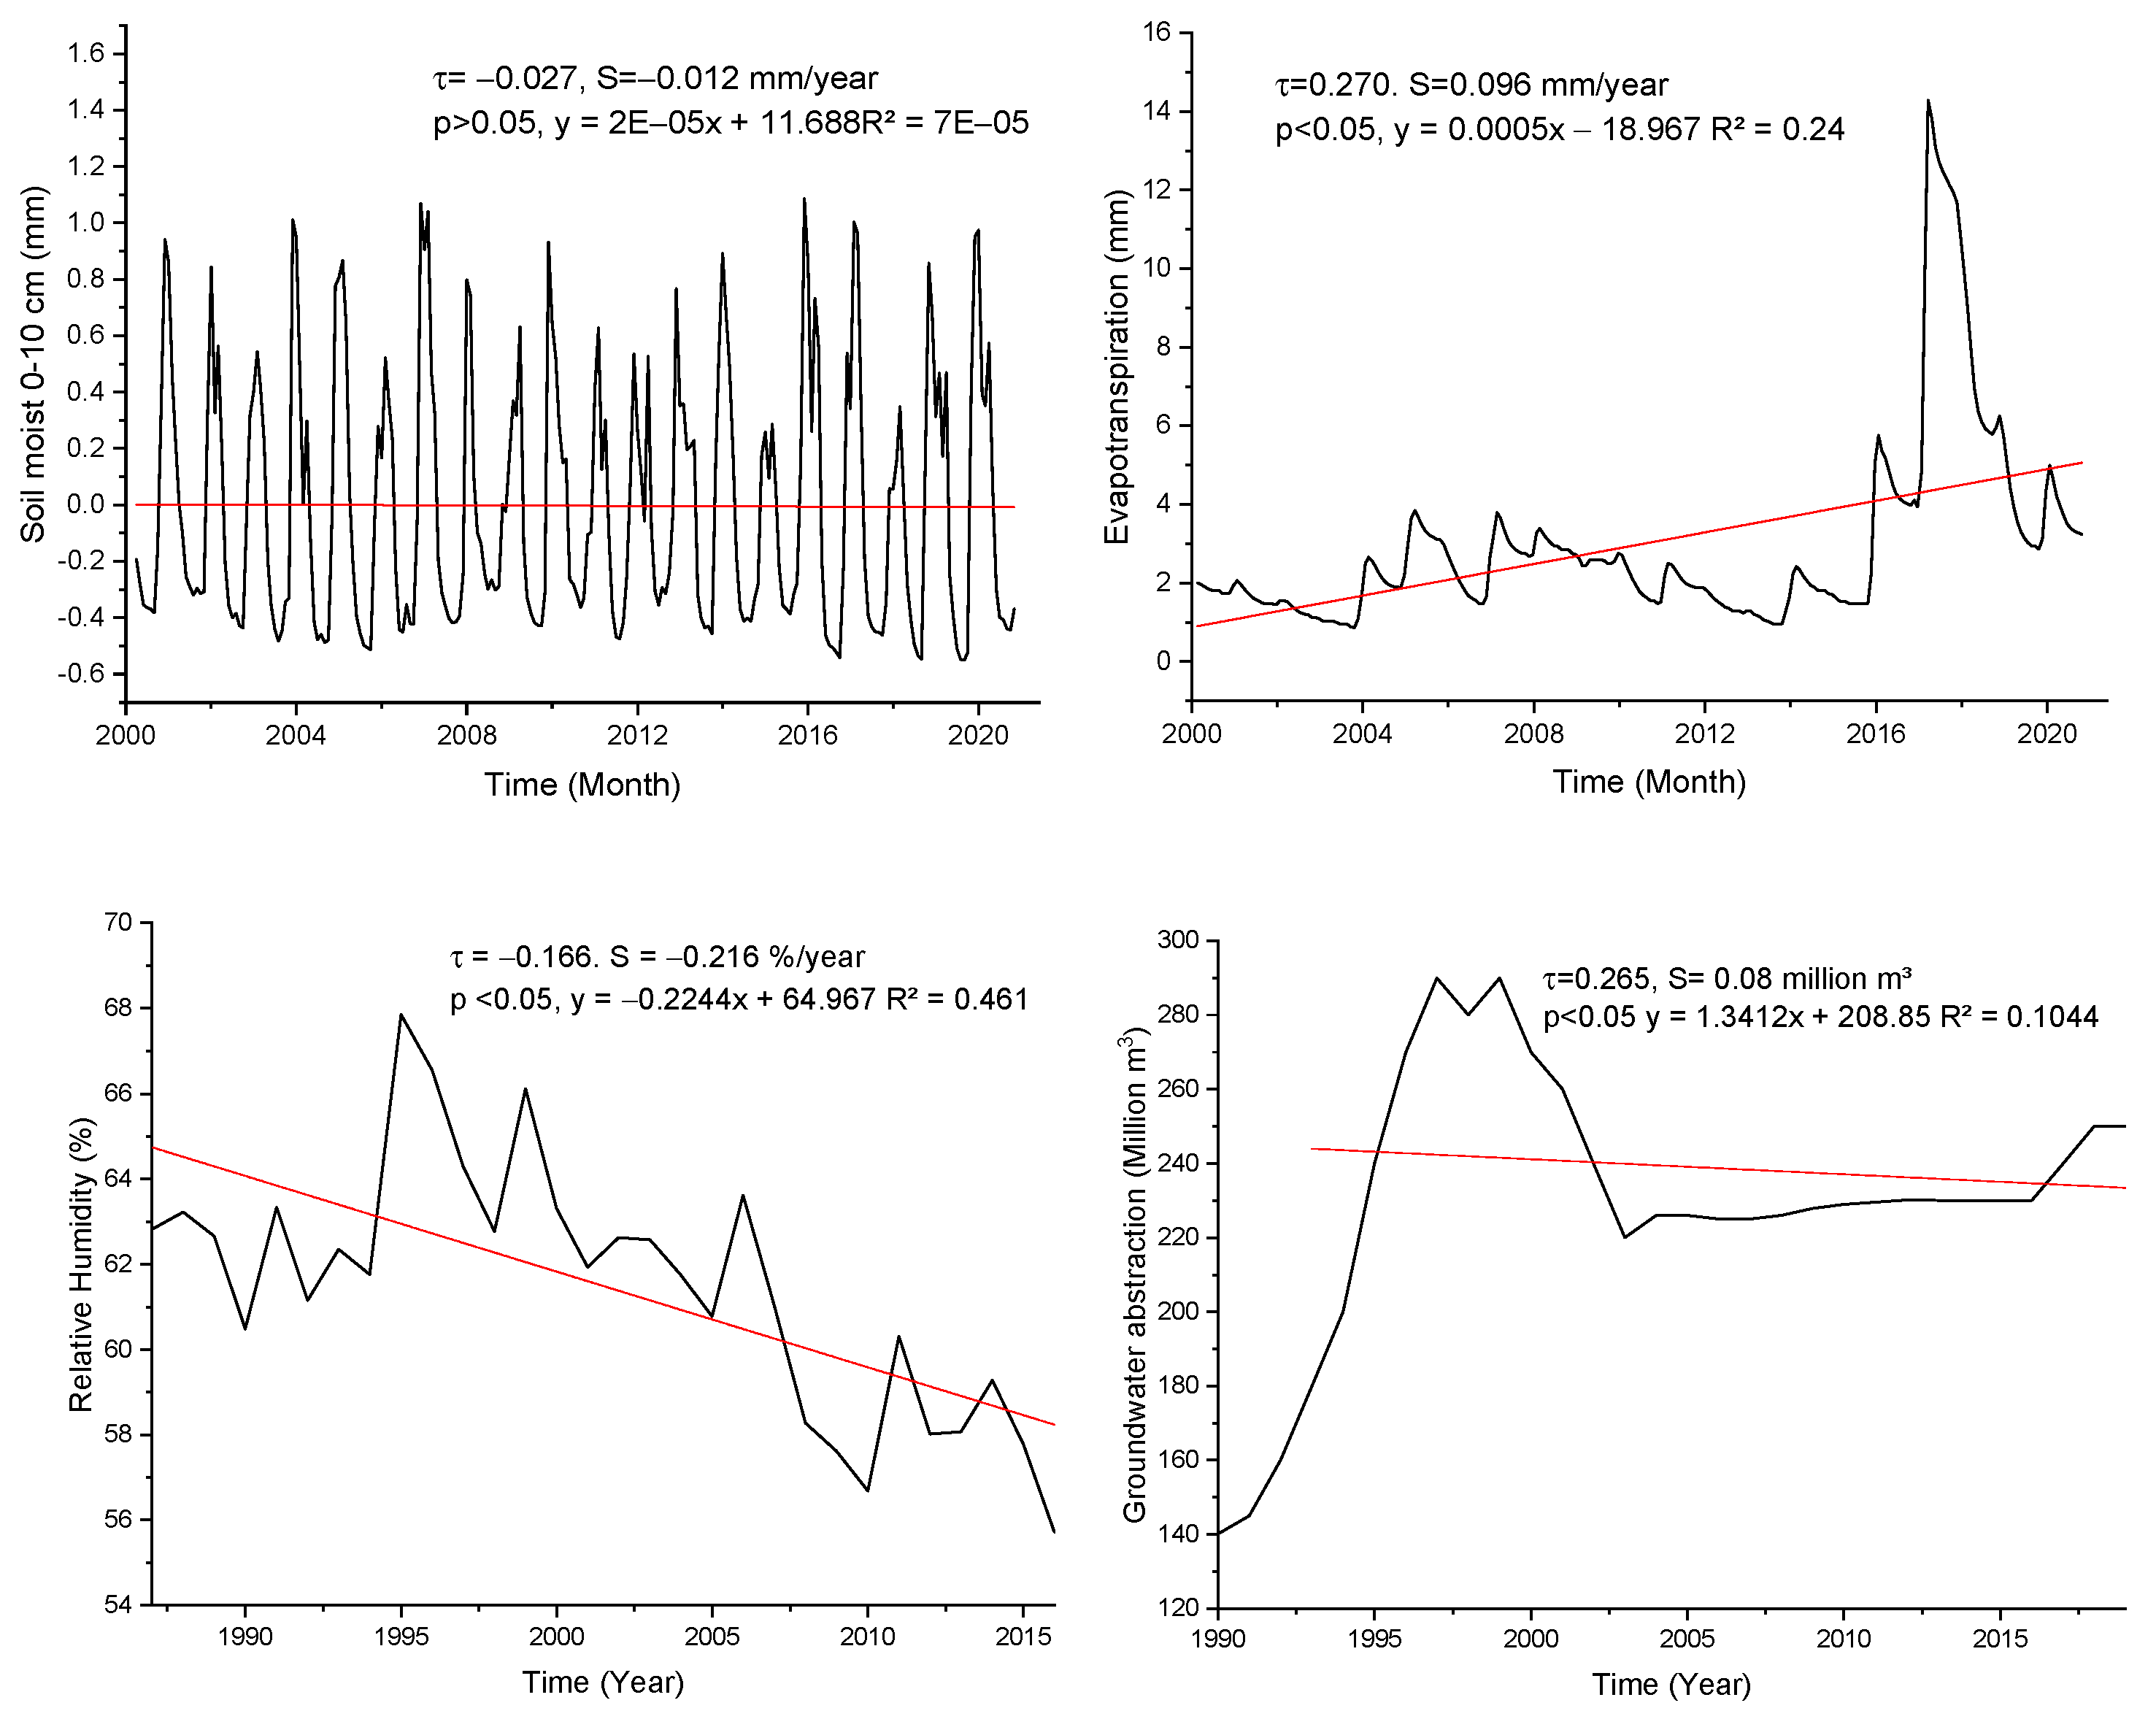
Data analysis indicated a slight loss in soil moisture with an annual decrease of −0.012 mm per year (Figure 11). The soil moisture-holding capacity depends on the type of soil in addition to other environmental parameters. The major soil type of the state of Qatar is sandy loam with a high salt content. Sandy soil tends to store a greater proportion of water at depth (>~50 cm) than finer textured soils [44]. This variation in the soil moisture along with the soil depth shows that most of the precipitated water is stored in the lower layers of the soil. A strong negative correlation (r = −851) exists between temperature and soil moisture. As the temperature increases more amount of soil moisture evaporates into the atmosphere causing a reduction in the soil moisture.
Evapotranspiration is the combined water loss by evaporation from the soil and the transpiration of vegetation. A shift in climate and weather parameters causes a significant change in evapotranspiration [45]. Changes in evaporation affect the soil moisture content and groundwater recharge. In addition, rising temperature increases evaporative demand over land, which limits the amount of water available to replenish groundwater [6]. Evapotranspiration data analysis indicated a significant increment (t = 0.272, p < 0.05) in evapotranspiration with an increase of 0.096 mm per year. The state of Qatar has sandy soil characterised by lower water-holding capacity. In addition, the significant increasing trend in mean temperature could be one of the main reasons for the observed decreasing trend in topsoil (0–10 cm) moisture. Furthermore, data analysis of relative humidity indicated a significant (p < 0.05) reduction over the last three decades with an annual decrease rate of −0.216 % (Figure 11). A significant inverse correlation (r = −763) was found between relative humidity and temperature. Relative humidity has an inverse relationship with air temperature as the temperature increases the water holding capacity of the air increases and the relative humidity decreases. This significant decrease in the relative humidity could be one of the reasons for the observed significant increment in mean temperature. Similar decreasing trends in relative humidity with an increase in the mean temperature were reported in Iran [46].
6. Implications for the Energy Water Food Nexus in Qatar
The interdependent and interlinked nature of the EWF nexus is strong in the State of Qatar due to limited renewable freshwater options, erratic annual rainfall, and lack of arable land due to harsh weather conditions. The current freshwater production system is heavily dependent on the continuous supply of energy for desalination, pumping of groundwater, transportation, storage and wastewater treatment. While a considerable amount of water is used for cooling purposes during energy production, desalination and food processing. Agricultural practices consume 33.8% of the total water produced, which is mainly extracted from groundwater [44]. The energy sector plays a bonding and compensatory role in the EWF nexus. For instance, Qatar fossil-based energy-intensive desalination technologies compensate for the nonavailability of surface water and brackish groundwater through desalination to fulfil domestic, industrial, and agricultural water consumption needs.
Groundwater depletion as a consequence of direct anthropogenic actions such as over-extraction of groundwater, and indirect depletion by climate change, will enhance intersectoral competition in the EWF nexus. Groundwater depletion affects water supply to the food sector in two ways. First, it reduces the amount of water to be extracted, and second it reduces groundwater quality through saltwater intrusion of coastal shallow aquifers. Groundwater uptake, especially in the dry seasons, encourages saltwater intrusion to fill the gap created by the over-extraction of the groundwater. Annual groundwater extraction is currently more than 250 million cubic meters per year, with a deficit of 98 million cubic meters. If the present groundwater depletion trends persist, along with the reduction in annual total rainfall, the groundwater deficit is expected to increase in the coming years. This reduction will increase the amount of energy consumed to reach deeper aquifers and to use more energy on groundwater desalination as the water quality deteriorates due to saltwater intrusion.
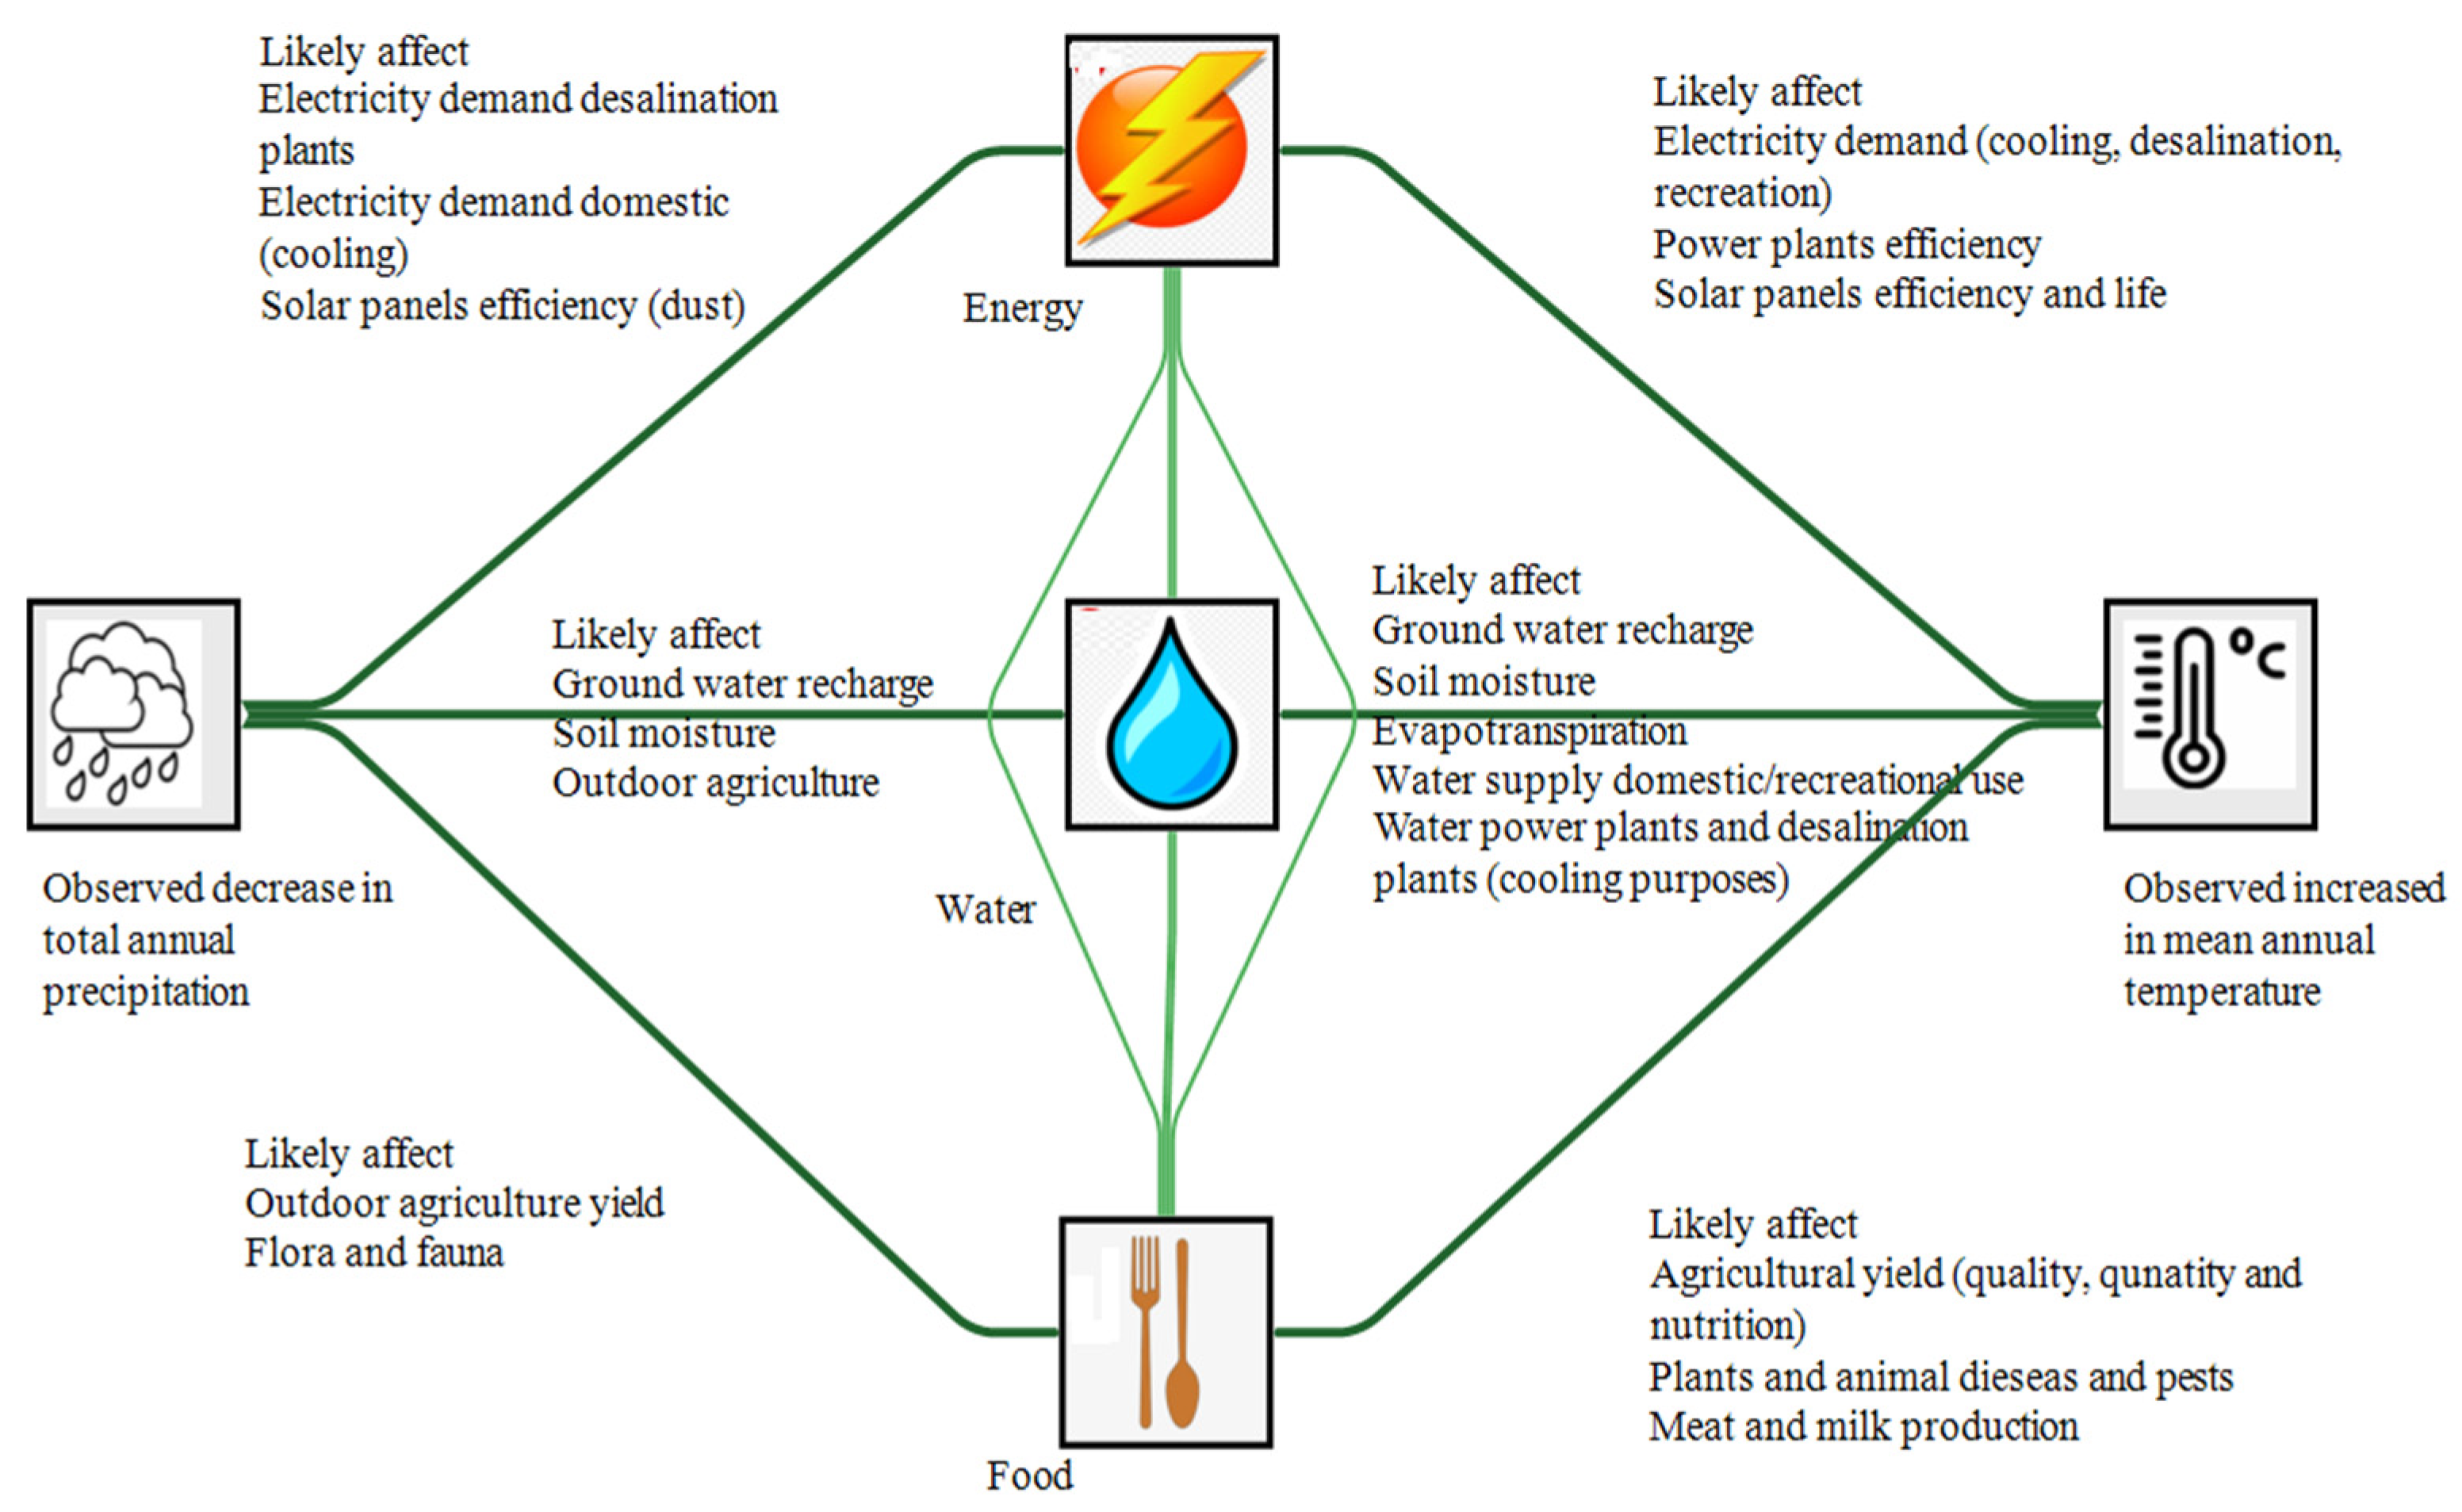
Rainfall is the prime source of groundwater recharge which is responsible for adding 71.6 million cubic meters of water per year to the groundwater. The observed long-term declining trends are significant for the sustainability of groundwater resources. Reduction in the total annual rainfall is likely to affect groundwater recharge, affecting demand and supply of water and energy in the food sector. Dry weather conditions in the future will put further pressure on groundwater to produce more water for outdoor and indoor irrigation, either through extraction or seawater desalination. Excessive groundwater extraction and high saline water is often associated with increased energy consumption for pumping and saltwater treatment costs. Thus, reduction in rainfall not only affects the groundwater resources but also affects food production and energy generation systems. In addition, less frequent rainfall will affect the efficiency of solar power, as rainfall washes off dust from solar panels. Dust is considered one of the main limitations of renewable solar energy in dry and dusty regions like the Middle East and Africa.
The observed significant increase in the mean temperature will affect the rate of evapotranspiration and soil moisture, which are vital parameters for crop growth. Variation in the mean temperature affects plants water requirements, as the temperature is directly related to evaporation and soil moisture loss. In dry conditions, plants require more water as soil moisture is evaporated into the atmosphere. This not only affects the soil moisture, which is vital for plant growth, but also groundwater recharge by reducing soil infiltration. In addition, a considerable amount of water is used for cooling during energy production. According to International Energy Agency, about 10% of the global freshwater withdrawals are for power generation [47]. Therefore, water demand for cooling purposes will increase in power plants and desalination plants if the increasing trends in mean temperature prevail in the future. Furthermore, power plants, solar cells and desalination power plant efficiency are likely to be affected by changes in mean temperature (Figure 12). Though the state of Qatar imports the majority of its food, fluctuations in the mean temperature is expected to affect local crop rotation, agricultural yield, and local meat and fish farming.
7. Conclusions
In this study, groundwater variation based on ground data and satellite (GRACE) data was measured and compared to climatic parameters from weather stations and model data. The results showed good agreement between satellite-based groundwater levels and climatic parameters such as rainfall, temperature, soil moisture loss, evapotranspiration, and relative humidity. During the period of study, the groundwater level dropped by an average of 0.24 ± 0.20 cm per year. This was mainly the result of an increase in groundwater exploitation, particularly for irrigation as groundwater is mainly used by agricultural activities. The imbalance between aquifer recharge and groundwater extraction is expected to increase in the future as water demand will increase with the increases in population, economic growth and agricultural development. Desalination powered by renewable energy such as wind and solar can play a great role in compensating for the imbalance caused by groundwater extraction for agricultural practices. In addition, the use of wastewater for irrigation and industrial use will further reduce pressure on the groundwater resources of the State of Qatar.
With increasing population, urbanisation and economic and technological development, there is continuous pressure on energy, water and food resources. In addition, climate change, which can cause variations in temperature and total annual rainfall, is one of the greatest risks to energy, water and food security. A decline in the groundwater is of great concern for the sustainability of water-dependent sectors such as agriculture and aquaculture. If groundwater depletion persists it will cause saltwater intrusion and land subsidence. In addition, an observed increase in the mean temperature will further affect the evapotranspiration rate and soil moisture loss in outdoor farming, which will likely increase water supply-demand for irrigation. Moreover, as water demand in agriculture and recreational activities increases due to increased evapotranspiration, energy demand will also increase to extract more groundwater and to treat wastewater. Similarly, water demand will increase in power plants and desalination plants for cooling if the increasing trend in mean temperature prevails in the future. Furthermore, power plants, solar cells and desalination power plant efficiency are likely to be affected by changes in temperature and rainfall. Changes in the mean temperature and total rainfall will likely affect local crop rotation and agricultural yield. On the other hand, a reduction in the annual rainfall will affect natural groundwater recharge making groundwater more saline. As a result, energy will be needed to treat groundwater before making it available for irrigation and recreational purposes Thus, informed smart decision-making needs to be introduced in the planning, policy and implementation stages of future projects dealing with the EWF nexus. Though the present study was conducted using long-term 30 year ground-based data and GRACE data from 18 years, this can be further improved by increasing the temporal resolution of the data as more data is made available. There is also a need to investigate and project variations in climatic parameters such as rainfall and temperature under different scenarios, and the possible impacts on groundwater resources using high-resolution regional climate models.
Author Contributions
H.B.: data download, data evaluation, data analysis, paper writing; R.G.: data evaluation, data analysis, review; T.A.-A.: data provision, supervision, review, editing. All authors have read and agreed to the published version of the manuscript.
Funding
This research was funded by the Qatar National Research Fund (QNRF) under the National Priorities Research Program (NPRP) (grant number NPRP11S-0107-180216).
Institutional Review Board Statement
Not applicable.
Informed Consent Statement
Not applicable.
Data Availability Statement
Not applicable.
Acknowledgments
The authors thank the Qatar Meteorological Department QMD for providing weather station data and NASA Jet Propulsion Laboratory for making the GRACE dataset freely available.
Conflicts of Interest
The authors declare no conflict of interest.
References
- Famiglietti, J.S. The global groundwater crisis. Nat. Clim. Chang. 2014, 4, 945–948. [Google Scholar] [CrossRef]
- Wu, W.Y.; Lo, M.H.; Wada, Y.; Famiglietti, J.S.; Reager, J.T.; Yeh, P.J.F.; Ducharne, A.; Yang, Z.L. Divergent effects of climate change on future groundwater availability in key mid-latitude aquifers. Nat. Commun. 2020, 11, 3710. [Google Scholar] [CrossRef] [PubMed]
- Cuthbert, M.O.; Taylor, R.G.; Favreau, G.; Todd, M.C.; Shamsudduha, M.; Villholth, K.G.; MacDonald, A.M.; Scanlon, B.R.; Kotchoni, D.V.; Vouillamoz, J.M.; et al. Observed controls on resilience of groundwater to climate variability in sub-Saharan Africa. Nature 2019, 572, 230–234. [Google Scholar] [CrossRef]
- Wu, W.Y.; Lan, C.W.; Lo, M.H.; Reager, J.T.; Famiglietti, J.S. Increases in the annual range of soil water storage at northern middle and high latitudes under global warming. Geophys. Res. Lett. 2015, 42, 3903–3910. [Google Scholar] [CrossRef]
- Taylor, R.G.; Scanlon, B.; Döll, P.; Rodell, M.; Van Beek, R.; Wada, Y.; Longuevergne, L.; Leblanc, M.; Famiglietti, J.S.; Edmunds, M.; et al. Ground water and climate change. Nat. Clim. Chang. 2013, 3, 322–329. [Google Scholar] [CrossRef] [Green Version]
- Berg, A.; Findell, K.; Lintner, B.; Giannini, A.; Seneviratne, S.I.; Van Den Hurk, B.; Lorenz, R.; Pitman, A.; Hagemann, S.; Meier, A.; et al. Land–atmosphere feedbacks amplify aridity increase over land under global warming. Nat. Clim. Chang. 2016, 6, 869–874. [Google Scholar] [CrossRef]
- Muslih, K.D.; Błażejczyk, K. The inter-annual variations and the long-term trends of monthly air temperatures in Iraq over the period 1941–201. Theor. Appl. Climatol. 2017, 130, 583–596. [Google Scholar] [CrossRef]
- Nazrul Islam, M.; Almazroui, M.; Dambul, R.; Jones, P.D.; Alamoudi, A.O. Long-term changes in seasonal temperature extremes over Saudi Arabia during 1981–2010. Int. J. Climatol. 2015, 35, 1579–1592. [Google Scholar] [CrossRef]
- Nasrallah, H.A.; Nieplova, E.; Ramadan, E. Warm season extreme temperature events in Kuwait. J. Arid Environ. 2004, 56, 357–371. [Google Scholar] [CrossRef]
- Zhang, X.; Aguilar, E.; Sensoy, S.; Melkonyan, H.; Tagiyeva, U.; Ahmed, N.; Kutaladze, N.; Rahimzadeh, F.; Taghipour, A.; Hantosh, T.H.; et al. Trends in Middle East climate extreme indices from 1950 to 2003. J. Geophys. Res. Atmos. 2005, 110. [Google Scholar] [CrossRef]
- Driouech, F. Distribution of Winter Precipitation over Morocco in the Context of Climate Change: Downscaling and Uncertainties. Ph.D. Thesis, University of Toulouse, Toulouse, France, 2010. [Google Scholar]
- Flohr, P.; Fleitmann, D.; Zorita, E.; Sadekov, A.; Cheng, H.; Bosomworth, M.; Edwards, L.; Matthews, W.; Matthews, R. Late Holocene droughts in the Fertile Crescent recorded in a speleothem from northern Iraq. Geophys. Res. Lett. 2017, 44, 1528–1536. [Google Scholar] [CrossRef] [Green Version]
- Rowell, D.P.; Booth, B.B.B.; Nicholson, S.E.; Good, P. Reconciling past and future rainfall trends over East Africa. J. Clim. 2015, 28, 9768–9788. [Google Scholar]
- Barlow, M.; Zaitchik, B.; Paz, S.; Black, E.; Evans, J.; Hoell, A. A review of drought in the Middle East and southwest Asia. J. Clim. 2016, 29, 8547–8574. [Google Scholar] [CrossRef]
- Govindan, R.; Al-Ansari, T. Computational decision framework for enhancing resilience of the energy, water and food nexus in risky environments. Renew. Sustain. Energy Rev. 2019, 112, 653–668. [Google Scholar] [CrossRef]
- Al-Ansari, T.; Govindan, R.; Korre, A.; Nie, Z.; Shah, N. An Energy, Water and Food Nexus Approach Aiming to Enhance Food Production Systems Through CO2 Fertilization. Comput. Aided Chem. Eng. 2018, 43, 1487–1492. [Google Scholar] [CrossRef]
- Namany, S.; Al-Ansari, T.; Govindan, R. Sustainable energy, water and food nexus systems: A focused review of decision-making tools for efficient resource management and governance. J. Clean. Prod. 2019, 225, 610–626. [Google Scholar] [CrossRef]
- Food and Agriculture Organization of the United Nations. The Future of Food and Agriculture—Alternative Pathways to 2050; Food and Agriculture Organization of the United Nations: Rome, Italy, 2018. [Google Scholar]
- PSA. Planning and Statistical Authority: Doha, Qatar. Available online: https://www.psa.gov.qa/en/Pages/default.aspx (accessed on 20 January 2021).
- Mustafa, S.A.-A. Growing food pyramids in the sand: How sustainable are Qatar’s self-sufficiency and foreign agro-investment policies? J. Agri. Enviro. Int. Dev. 2017, 111, 409–424. [Google Scholar] [CrossRef]
- Cheng, W.L.; Saleem, A.; Sadr, R. Recent warming trend in the coastal region of Qatar. Theor. Appl. Climatol. 2017, 128, 193–205. [Google Scholar] [CrossRef] [Green Version]
- Gonzalez, R.; Ouarda, T.; Marpu, P.; Allam, M.; Eltahir, E.; Pearson, S. Water Budget Analysis in Arid Regions, Application to the United Arab Emirates. Water 2016, 8, 415. [Google Scholar] [CrossRef] [Green Version]
- Taha, A.I.; Al Deep, M. Investigation of groundwater occurrence using gravity and electrical resistivity methods: A case study from Wadi Sar, Hijaz Mountains, Saudi Arabia. Arab. J. Geosci. 2021, 14, 1–10. [Google Scholar] [CrossRef]
- Zaki, N.A.; Haghighi, A.T.; Rossi, P.; Tourian, M.; Klove, B. Monitoring Groundwater Storage Depletion Using Gravity Recovery and Climate Experiment (GRACE) Data in the Semi-Arid Catchments. Hydrol. Earth Syst. Sci. Discuss. 2018, 17, 1456. [Google Scholar] [CrossRef]
- Landerer, F.W.; Flechtner, F.M.; Save, H.; Webb, F.H.; Bandikova, T.; Bertiger, W.I.; Bettadpur, S.V.; Byun, S.H.; Dahle, C.; Dobslaw, H.; et al. Extending the global mass change data record: GRACE Follow-On instrument and science data performance. Geophys. Res. Lett. 2020, 47, e2020GL088306. [Google Scholar] [CrossRef]
- Wiese, M.M.W.D.N.; Yuan, D.-N.; Boening, C.; Landerer, F.W. “JPL GRACE Mascon Ocean, Ice, and Hydrology Equivalent Water Height RL06 CRI Filtered Version 02. Ver. 02.,” PO.DAAC, CA, USA. Available online: https://podaac.jpl.nasa.gov/dataset/TELLUS_GRAC-GRFO_MASCON_CRI_GRID_RL06_V2 (accessed on 27 March 2021).
- Wiese, D.N.; Landerer, F.W.; Watkins, M.M. Quantifying and reducing leakage errors in the JPL RL05M GRACE mascon solution. Water Resour. Res. 2016, 52, 7490–7502. [Google Scholar]
- Watkins, M.M.; Wiese, D.N.; Yuan, D.; Boening, C.; Landerer, F.W. Improved methods for observing Earth’s time variable mass distribution with GRACE using spherical cap mascons. J. Geophys. Res. Solid Earth 2015, 120, 2648–2671. [Google Scholar] [CrossRef]
- Rui, H.L.; Beaudoing, H. README Document for NASA GLDAS Version 2 Data Products; Goddart Earth Sciences Data and Information Services Center (GES DISC): Greenbelt, MD, USA, 2020; Volume 16, pp. 1–32. Available online: https://hydro1.gesdisc.eosdis.nasa.gov/data/GLDAS/README_GLDAS2.pdf (accessed on 9 March 2021).
- NASA. EarthExplorer. 2020. Available online: https://earthexplorer.usgs.gov/ (accessed on 21 September 2020).
- Mann, H.B. Nonparametric tests against trend. Econom. J. Econom. Soc. 1945, 13, 245–259. [Google Scholar] [CrossRef]
- Kendall, M. Multivariate Analysis; Charles Griffin b Co. LTD.: London, UK; p. 1975.
- Hirsch, R.M.; Slack, J.R. A nonparametric trend test for seasonal data with serial dependence. Water Resour. Res. 1984, 20, 727–732. [Google Scholar] [CrossRef] [Green Version]
- Sen, P.K. Estimates of the regression coefficient based on Kendall’s tau. J. Am. Stat. Assoc. 1968, 63, 1379–1389. [Google Scholar]
- Pettitt, A.N. A non-parametric approach to the change-point problem. J. R. Stat. Soc. Ser. C (Appl. Stat.) 1979, 28, 126–135. [Google Scholar] [CrossRef]
- Bilal, H.; Chamhuri, S.; Mokhtar, M.B.; Kanniah, K.D. Recent snow cover variation in the Upper Indus Basin of Gilgit Baltistan, Hindukush Karakoram Himalaya. J. Mt. Sci. 2019, 16, 296–308. [Google Scholar] [CrossRef]
- Marofi, S.; Sohrabi, M.M.; Mohammadi, K.; Sabziparvar, A.A.; Abyaneh, H.Z. Investigation of meteorological extreme events over coastal regions of Iran. Theor. Appl. Climatol. 2011, 103, 401–412. [Google Scholar]
- Held, I.M.; Soden, B.J. Robust responses of the hydrological cycle to global warming. J. Clim. 2006, 19, 5686–5699. [Google Scholar] [CrossRef]
- Wainwright, C.M.; Marsham, J.H.; Keane, R.J.; Rowell, D.P.; Finney, D.L.; Black, E.; Allan, R.P. Eastern African Paradox’ rainfall decline due to shorter not less intense Long Rains. NPJ Clim. Atmos. Sci. 2019, 2, 1–9. [Google Scholar] [CrossRef]
- Hoell, A.; Hoerling, M.; Eischeid, J.; Quan, X.-W.; Liebmann, B. Reconciling theories for human and natural attribution of recent East Africa drying. J. Clim. 2017, 30, 1939–1957. [Google Scholar] [CrossRef]
- Almazroui, M.; Islam, M.N.; Athar, H.; Jones, P.D.; Rahman, M.A. Recent climate change in the Arabian Peninsula: Annual rainfall and temperature analysis of Saudi Arabia for 1978–2009. Int. J. Climatol. 2012, 32, 953–966. [Google Scholar] [CrossRef]
- Othman, A.; Abotalib, A.Z. Land subsidence triggered by groundwater withdrawal under hyper-arid conditions: Case study from Central Saudi Arabia. Environ. Earth Sci. 2019, 78, 243. [Google Scholar] [CrossRef]
- Planning and Statistics Authority, National Statistics. Planning and Statistics Authority; 2019. Available online: https://www.psa.gov.qa/en/statistics1/Pages/default.aspx (accessed on 25 April 2020).
- Dodd, M.B.; Lauenroth, W.K. The influence of soil texture on the soil water dynamics and vegetation structure of a shortgrass steppe ecosystem. Plant Ecol. 1997, 133, 13–28. [Google Scholar] [CrossRef]
- Abtew, W.; Melesse, A. Evaporation and Evapotranspiration: Measurements and Estimations; Springer Science & Business Media: Berlin, Germany, 2012. [Google Scholar]
- Kousari, M.R.; Malekinezhad, H.; Ahani, H.; Zarch, M.A.A. Sensitivity analysis and impact quantification of the main factors affecting peak discharge in the SCS curve number method: An analysis of Iranian watersheds. Quat. Int. 2010, 226, 66–74. [Google Scholar] [CrossRef]
- IEA. Water Energy Nexus—Excerpt from the World Energy Outlook 2016; IEA: Paris, France, 2016. [Google Scholar]
Figure 1.
Digital Elevation Model (DEM) of the state of Qatar with weather station locations.

Figure 2.
State-wide mean annual temperature in the state of Qatar from 1987–2016. Data source QMD.

Figure 3.
State-wide total annual average rainfall in the state of Qatar from 1987–2016. Data source QMD.
Figure 3.
State-wide total annual average rainfall in the state of Qatar from 1987–2016. Data source QMD.

Figure 4.
Monthly average seasonal temperature trends from 1987–2016. DJF = December, January February; MAM = March, April, May; JJA = June July August; SON = September, October, November.
Figure 4.
Monthly average seasonal temperature trends from 1987–2016. DJF = December, January February; MAM = March, April, May; JJA = June July August; SON = September, October, November.


Figure 5.
Average seasonal rainfall trends from 1987–2016. DJF = December, January February; MAM = March, April, May; JJA = June July August; SON = September, October, November). Data source QMD.
Figure 5.
Average seasonal rainfall trends from 1987–2016. DJF = December, January February; MAM = March, April, May; JJA = June July August; SON = September, October, November). Data source QMD.

Figure 6.
Station wise spatial variability in mean annual temperature (A) and total annual rainfall (B). Data source QMD.
Figure 6.
Station wise spatial variability in mean annual temperature (A) and total annual rainfall (B). Data source QMD.

Figure 7.
Station wise seasonal monthly mean temperature trends. DJF = December, January February; MAM = March, April, May; JJA = June July August; SON = September, October, November). Data source QMD.
Figure 7.
Station wise seasonal monthly mean temperature trends. DJF = December, January February; MAM = March, April, May; JJA = June July August; SON = September, October, November). Data source QMD.

Figure 8.
Station wise seasonal monthly average rainfall trends. DJF = December, January February; MAM = March, April, May; JJA = June July August; SON = September, October, November). Data source QMD.
Figure 8.
Station wise seasonal monthly average rainfall trends. DJF = December, January February; MAM = March, April, May; JJA = June July August; SON = September, October, November). Data source QMD.

Figure 9.
Interannual variation in groundwater, evapotranspiration, soil moisture and rainfall (monthly average data). Sources: groundwater = GRACE-FO; evapotranspiration, and soil moisture = GLDAS; precipitation = QMD.
Figure 9.
Interannual variation in groundwater, evapotranspiration, soil moisture and rainfall (monthly average data). Sources: groundwater = GRACE-FO; evapotranspiration, and soil moisture = GLDAS; precipitation = QMD.

Figure 10.
Groundwater equivalent thickness variation based on GRACE-FO datasets (2002–2020) JPL.

Figure 11.
Long-term trends of soil moisture from GLDAS (A); relative humidity 1987–2016 and evapotranspiration from GLDAS (C); groundwater extraction (D) 1990–2019 (PSA, 2019).
Figure 11.
Long-term trends of soil moisture from GLDAS (A); relative humidity 1987–2016 and evapotranspiration from GLDAS (C); groundwater extraction (D) 1990–2019 (PSA, 2019).

Figure 12.
Possible impacts of observed climatic changes on the EWF nexus.


Table 1.
Location of the weather stations and dataset period.
| Weather Station | Longitude | Latitude | Elevation (m) | Data Period |
|---|---|---|---|---|
| Doha | 51.51051 | 25.28232 | 12 | 1987–2016 |
| Mesaieed | 51.54831 | 24.99424 | 06 | 1987–2016 |
| Mukanis | 51.21765 | 25.12483 | 35 | 1987–2016 |
| Dukhan | 50.77898 | 25.42424 | 31 | 1987–2016 |
| Alruwais | 51.19646 | 26.12855 | 09 | 1987–2016 |
| Alkhor | 51.49618 | 25.67839 | 14 | 1987–2016 |
Publisher’s Note: MDPI stays neutral with regard to jurisdictional claims in published maps and institutional affiliations. |
© 2021 by the authors. Licensee MDPI, Basel, Switzerland. This article is an open access article distributed under the terms and conditions of the Creative Commons Attribution (CC BY) license (https://creativecommons.org/licenses/by/4.0/).
Share and Cite
MDPI and ACS Style
Bilal, H.; Govindan, R.; Al-Ansari, T. Investigation of Groundwater Depletion in the State of Qatar and Its Implication to Energy Water and Food Nexus. Water 2021, 13, 2464. https://doi.org/10.3390/w13182464
AMA Style
Bilal H, Govindan R, Al-Ansari T. Investigation of Groundwater Depletion in the State of Qatar and Its Implication to Energy Water and Food Nexus. Water. 2021; 13(18):2464. https://doi.org/10.3390/w13182464
Chicago/Turabian StyleBilal, Hazrat, Rajesh Govindan, and Tareq Al-Ansari. 2021. "Investigation of Groundwater Depletion in the State of Qatar and Its Implication to Energy Water and Food Nexus" Water 13, no. 18: 2464. https://doi.org/10.3390/w13182464
Note that from the first issue of 2016, this journal uses article numbers instead of page numbers. See further details here.