
Micro-Clustering and Rank-Learning Profiling of a Small Water-Quality Multi-Index Dataset to Improve a Recycling Process

Department of Mechanical Engineering, The University of West Attica, Egaleo, 12241 Attica, Greece
Water 2021, 13(18), 2469; https://doi.org/10.3390/w13182469
Submission received: 25 July 2021
/
Revised: 3 September 2021
/
Accepted: 5 September 2021
/
Published: 8 September 2021
(This article belongs to the Special Issue Water Quality Optimization)
Abstract
:The efficiency improvement of wastewater recycling has been prioritized by ‘Goal 6’ of the United Nations Sustainable Development initiative. A methodology is developed to synchronously profile multiple water-quality indices of a wastewater electrodialysis (ED) process. The non-linear multifactorial screener is exclusively synthesized by assembling proper R-based statistical freeware routines. In sync with current trends, the new methodology promotes convenient, open and rapid implementation. The new proposal unites the ‘small-and-fast’ data-sampling features of the fractional multifactorial designs to the downsizing, by microclustering, of the multiple water quality indices—using optimized silhouette-based classification. The non-linear multifactorial profiling process is catalyzed by the ‘ordinalization’ of the regular nominal nature of the resulting optimum clusters. A bump chart screening virtually eliminates weak performances. A follow-up application of the ordinal regression succeeds in assigning statistical significance to the resultant factorial potency. The rank-learning aptitude of the new profiler is tested and confirmed on recently published wastewater ED-datasets. The small ED-datasets attest to the usefulness to convert limited data in real world applications, wherever there is a necessity to improve the quality status of water for agricultural irrigation in arid areas. The predictions have been compared with other techniques and found to be agreeable.
1. Introduction
Water is indispensable to life, but its chemical behavior perpetually remains a great enigma [1,2]. This is because the mysterious inner workings of water have not been adequately deciphered yet—in its basic role to mediate nature’s processes [3]. Water is a universal solvent that covers two-thirds of the earth’s surface [4]. What makes water such an astonishing component is that it coordinates nature’s phenomena at all scales—from the molecular level to the global ‘mega’ atmospheric events. Amazingly, the water concentration in the human body is about 70%—the main constituent. Replenishing this amount requires a daily intake of a few liters of clean water. Moreover, 70% of blue water is channeled into irrigating crops. Alas, there is a global water crisis that forges ahead and, it adversely affects the global food production, too [5,6,7]. According to the United Nations World Water Development Report [8], “the population growth, the economic development and the changing consumption patterns” are among the main contributors that propel the annually increasing rate of 1% in global water demand. In an effort to monitor the status of the evolving water crisis on the planet, the application of a water balance accounting has been advocated in domestic, agricultural and industrial use. Therefore, the water footprint indicator was conceived to assist in identifying improvement areas and, hence, in recommending integrated policy options [9]. Impactful projects are endorsed through the ‘Goal 6’ of the United Nations Sustainable Development [10] to boost the water availability worldwide. Humans are very thirsty, inasmuch as one in three people do not currently have access to safe drinking water [11]. Among the primary business themes to engage on are: (1) the “improved water quality through effluent treatment”, and (2) the “improved water efficiency through application of 5R principles: reduce, reuse, recover, recycle, replenish” [12]. Consequently, to converge on targets 6.3 and 6.A—by 2030—there is a clear direction with great emphasis on “water efficiency, wastewater treatment, recycling and reuse technologies” [13].
Improving water quality via enhancing the efficiency of a water recycling process is critical to sustainably uphold extensive crops. Large-scale wastewater treatment units may be benefited from data-driven screening/optimization studies that seek to quantify and control system uncertainty [14,15]. Considering also the various origins of the wastewater feeds (polluted, brackish and saline sources), it becomes a complex process to manage to match replenishing volumes to agricultural demands [16]. This is because a successful water recycling enterprise relies on the technicalities and the economics at the point of use, besides the quality status of the influx (or drainage) water. Interestingly, electrodialysis (ED) has been envisaged to be a future workhorse alternative to water treatment [17,18]. Additionally, water quality screening studies, which could be favorable in improving the water availability for crop growth, require familiarization and experimentation with various principal quality indices [19,20,21]. Published wastewater ED-screening/optimization investigations have been limited, but they are promising to future advancement [22]. Some barriers to more extensive experimentation might be the great amount of knowledge that is needed to organize ‘economical-and-practical’ recycling performance trials, but most importantly in offering a statistical engineering perspective.
Design of Experiments (DOE) are known to economically regulate trial planning and execution by concocting preset, yet minimal, factorial recipes; DOE facilitates the acceleration of innovation and discovery projects [23]. It has been well documented in past detailed expositions [24,25,26] that the adoption of DOE—as an efficient and effective methodology—is substantial in industrial product/process improvement and development assignments. A great deal of applied industrial research has implemented Taguchi’s DOE principles that provide strong economic motivation for improved costs, which are derived from the improved quality performance of products and processes [27,28]. In a nutshell, Taguchi’s DOE approach attempts to screen and optimize products/processes in a single phase, which speeds up the discovery effort. The greatest contribution in advancing and economizing the research procedure is the consistent use of fractional factorial designs (FFDs) in rigidly structuring the multiparameter sampling plans. FFDs assist in accomplishing the reduction of the research work to a fraction by compressing the required volume of trials [23]. Although FFDs minimize the search effort by minimizing the examination of the number of the actual predictor settings, they ensure balance in the ensuing experimental recipe representation. A particular family of FFDs are the orthogonal arrays (OAs) that are favored for linear, non-linear and interaction-spotting studies [24]. The Taguchi-DOE robustification aspect involves the tuning of the product/process performance in terms of: (1) central tendency (mean response) and (2) variability (signal-to-noise ratio [SNR] response). There are several successful applications of the classical Taguchi methods to organize improvement experiments in wastewater treatment [29,30,31,32,33].
Even though the statistical estimators which are utilized in Taguchi methods may not be universally resilient to exhaustively portray all real phenomena [34,35,36], their usefulness in chemometrics in general [37], but also specifically to wastewater recycling aquametrics have been appreciated [22]. According to Taguchi’s robust design framework, in screening/optimization studies, the replicated datasets ought to be reduced to the two mentioned performance measures, thus always rendering their arrangement to comply to the so-called “unreplicated” state; this state automatically includes the special case where, for practical/economic reasons, the trial recipe runs have to be executed only once. Consequently, the DOE analysis is carried out on “unreplicated-like” vectors, casting the dichotomized dataset in terms of its mean and SNR estimations. Moreover, in industrial applications, the OA-sampling pattern is best exploited when the trial plan is saturated to the maximum contributions that is permitted to handle. However, saturated and unreplicated dataset configurations are not well-suited to be treated with the ordinary analysis of variance (ANOVA) or even with the ‘all-purpose’ generalized linear modelling (GLM) techniques. Both approaches restrictively deliver rated predictions as long as the unexplained error has been quantified. Datasets in saturated-unreplicated OA form, return no uncertainty to the ANOVA or GLM treatments, because all degrees of freedom are absorbed by the predictor estimation. Recognizing the importance of screening studies in expediting innovation projects, several specialized alternatives have been developed to overcome such hindrances and to allow the statistical manipulation of the saturated-unreplicated FFD datasets [38]. Most commercial statistical software packages opt to implement a combination of popular techniques by mainly placing emphasis on the classic half-normal test [39], the Lenth test [40] and the Box-Meyer test [41]; all three tests have been intended to screen a single characteristic and it is not quite clear yet how they would simultaneously cope with gauging effect non-linearity. In chemometrics, FFD-collected multiresponse dataset may undergo orthogonal factorial screening using principal components (PC) decomposition of the response matrix and then treating the resulting PC scores with cumulative normal probability plots to filter out noise variation [42]. If there is a persistent need to also screen for non-linearity in a multi-variable arrangement, a convenient option is to resort to desirability analysis [43,44]. Nevertheless, profiling of water quality indices involves comparison of ionic content measurements in multifarious species combinations. Water quality indices are primarily expressed in ratio or percentage-based scales. They are more complex data types and, hence, they may require more specialized multiparametric treatments [45].
Returning to the subject of the much simpler screening of the unreplicated FFD/OA-datasets, it is usually deemed worthwhile to merely assess predictions from different methods, utilizing a statistical software package, and then find a compromised solution that logically accommodates the individual outcomes. Matters here become more complex though, because it was shown that different screening DOE solvers, across different statistical software brands, provide different results because each product selects different methods and different criteria to perform comparisons [46]. On the other hand, it may not be practical, economical or even reasonable for a researcher/engineer/practitioner to pursue acquiring a great variety of available commercial solvers in order to ensure the viability of the resulting data analysis. One way to circumvent this problem is to use simple well-tested workhorse routines from freeware platforms that have also been bestowed upon sufficient scientific credibility. For example, the R statistical computing platform [47] appears to have accumulated a great wealth of routines that facilitate DOE planning and analysis [48]; R-packages are often granted from academic experts and professional researchers. R-packages may be the fulfillment of a published scholarly/technical work and, they are always accessible to benchmarking with other available statistical software. The purpose of this work is to offer a new methodology that assembles and seamlessly synthesizes a few R-packaged graphical/computational routines in order to accomplish the multifactorial multiresponse non-linear screening/optimization of key water quality indices. Water quality indices complement the quantification of the efficiency improvement of a wastewater ED-recycling process that supplies water, which is intended for irrigation of crops. It will be shown how to reduce the imposing multi-index dataset to a single clustered nominal response. This is a new concept and it furnishes an alternative to extracting water quality classification information from small data [49,50,51,52,53,54,55,56]. This would quickly refashion the problem to the naiver non-linear saturated but ‘unreplicated’ form. Next, the nominal cluster tags are transformed to ordinal OA-entries by tracking the direction of improvement in each cluster. The resulting non-linear multifactorial structure of the dataset is rapidly suppressed by exploiting the transparent depiction of the bump chart. A final ordinal regression (‘naïve’ ranking learning) on the remaining predictors allows the estimation of a statistical significance value. The composition sequence of the mentioned data-conversion steps is unique to this work. The advantage of this presentation is that it applies the proposed methodology in two novel datasets from a published wastewater ED-recycling project [19]. The initial ED-dataset demonstrates the converting capability of the proposed procedure and the second dataset reaffirms the prediction. The second dataset is embellished by an ancillary type of uncertainty because the empirically gained feedback information from the initial dataset has been incorporated in the generation of the second dataset.
2. Materials and Methods
2.1. Main Features
Water quality screening/optimization experiments are carried out using fractional factorial designs to contain substantially more voluminous sampling efforts. The proposed approach considers: (a) multiple water quality characteristics, (b) multiple water quality controllers, (c) potential non-linearity, (d) full-utilization (saturation) of the trial planner and (e) lone measurements per trial recipe (unreplication). The approach uniquely combines: (1) the structured data collection advantages of the FFD samplers [23], (2) the multiresponse mini-data reduction—by clustering and (3) the non-linear non-parametric effect sizing. For demonstrational purposes, a typical case that examines the influence of four controlling factors on three characteristic responses is undertaken. The Taguchi-type L9(34) OA [24] will be examined because it meets the described requirements. Moreover, it has been previously implemented and investigated in a wastewater electrodialysis study [22,45]. The filtrated drainage wastewater was mainly intended for irrigation purposes in farming. On the contrary, the logistical costs and project duration for a full factorial endeavor would be nine times higher than the pre-defined requirements which are established by the L9(34) OA recipes; it is the FFD tactic that permits such impressive reduction in the data collection effort. Moreover, by resorting to unreplication the experimental endeavor is reduced by a factor of 9x times, where x equals the number of additional replication rounds, beyond the original execution of a single series of the planned OA runs.
2.2. Case Study Summary
The four controlling factors were (coded here for convenience): (1) A: DF—the dilute flow (L/h), (2) B: CF—the cathode flow (L/h), (3) C: AF—the anode flow (L/h), and (4) D: V—the voltage rate (V) [22]. The selected water quality characteristics were: (1) RS: the removed sodium content (%), (2) SAR: the sodium adsorption ratio and (3) SSP: the soluble sodium percentage (%) [22]. The removed sodium percentage is critical because low values might signify high osmotic pressure in the soil. In turn, the elevated osmotic pressure interferes against the favorable aeration and permeability conditions for optimal plant growth [19,20,21]. Thus, the characteristic RS response should be maximized.
SAR is a water quality index for assessing the capability potential of an agricultural irrigation process [19]. SAR is defined as: SAR = Na+/(Ca2+ + Mg2+)1/2, with Na+, Ca2+ and Mg2+ to denote the ionic concentrations (in meq/L) for sodium, calcium and magnesium, respectively. Higher SAR values indicate heightened sodium levels; they are construed as an advancing deleterious risk to plant growth. This is because the soil structure is progressively damaged by the adsorption of higher sodium concentrations; sodium restricts soil permeability and infiltration rate and hence induces crust formation and water-logging. SAR allows the direct categorization of the agricultural soil suitability by monitoring the sodium content balance [20,21]. Meanwhile, the bivalent cations Ca2+ and Mg2+ are essential plant nutrients. Increasing concentrations of Ca2+ and Mg2+ promote water hardness which is beneficial for irrigation purposes. While Na+ is the worst soil dispersant cation, Ca2+ is the best soil flocculant and hence it favorably influences soil permeability and easy tilling. The Mg2+ content has a milder effect on the (saturated) soil hydraulic conductivity, clay-particle dispersion and aeration, in contrast to the respective potency of Ca2+.
Inasmuch as SAR is the standard diagnostic parameter for sodicity hazard, there are guidelines that distinctly classify SAR with respect to nominal interval values. The sodium hazard classes according to SAR evaluation are: S1-Excellent (0 ≤ SAR ≤ 10), S2-Good (10 ≤ SAR ≤ 18), S3-Doubtful (18 ≤ SAR ≤ 26), S4-Unsuitable (SAR > 26) [19,20,21]. Class S1 is obviously the desirable condition to most crops, class S2 may indicate appreciable hazard but it may be managed, while class S3 may be suitable only to a few specific crops.
Finally, the soluble sodium percentage (SSP) is defined as: SSP (Na+%) = Na+/(Na+ + K+ + Ca2+ + Mg2+), with the soluble potassium (K+ in meq/L) to explicitly enter this water quality parameter [19,20,21]. Potassium is also an essential nutrient for plants. However, elevated soluble potassium concentration may have a negative impact on the saturated soil hydraulic conductivity, but to a lesser degree than that of sodium. Using the SSP water quality index, the irrigation viability is assessed by employing the Wilcox (Agriculture) diagram classification [20]; analogous suitability partitions are formed, as mentioned in the case of the SAR index.
The ED is a semi-permeable membrane-based separation technique that conducts the deionization process of aqueous solutions [17,18]. The ion migration process is directed by applying an electric field—through two electrodes—across the feed compartment of an ED cell. The feed compartment is situated between the cation and anion exchange membranes, and in the adjacent cation/anion compartment, the brine is collected. ED may be favored over reverse osmosis with respect to achieving higher recovery rates because: (1) only ED removes directly solutes from the feed, and, (2) ED works more efficient at ionic concentrations, which are typically encountered in drainage systems. Furthermore, the ED as a water separation method for irrigation may be economically preferable when: (1) there is a need to cater broader categories of cultivations—not only to those that have been deemed highly profitable, and (2) the ionic molecular weights in the feed are low [22]. The ED process remains simple in its conception and this aids in experimentally controlling and improve water quality by perhaps adjusting as few as four parameters: the feed flow, the anode/cathode flow and the electrical potential difference between electrodes. The delicate relationships among the various water quality index levels have shown to be experimentally determined for different feed sources [22].
To recapitulate, the raw dataset that will be used in this work to demonstrate the proposed methodology are comprised of the Abu-Shady’s ED double datasets [22]—in combination form of the published information in Tables 3 and 4. To complete the confirmation process of the new approach, the final Abu-Shady ED observations will be tested—in combination form of the published information in Tables 9 and 10.
2.3. Data Manipulation Issues and New Approach Benefits
The synchronous screening of the three water-quality indices against the four controlling ED-factors may need to be transformed to an expression meaningful according to the regular Taguchi modelling [24,45]. The first comment is that the examined (original) dataset [22] is in an unreplicated form in both available datasets. Therefore, the customary SNR concept [24] may not be relevant here in the absence of multiple replicates. Even so, in the original study [22] the classical SNR formula for a numerical ‘larger-the-better’ characteristic was used. According to the nature of the three indices, their direction should be minimized for SAR and SSP. However, as it was stated earlier both of those two indices may relay meaningful information by simply allocating any estimations to their appropriate category rating instead. For example, it is practically immaterial if SAR has a value of 2 or 6 because both of these are less than 10 and hence, they are identified to category S1 (Excellent). On the other hand, the removed sodium content should be maximized. Since all three water quality characteristics are either percentages or ratios, SNR expressions are not relevant anyway, but the omega transformation might be considered instead [45]. The omega transformation becomes meaningful even for a lone observation per recipe run. The omega transformation is defined as: Ω(db) = 10 log(R) given the odds, R = p/(1 − p), with p (0 < p < 1): the data expressed in ratio form, or equivalently in percentage. It should be remarked that such transformation is indispensable in percentage-based datasets, because percentage values complicate the additivity of individual values; the percentage scale is only relevant in the defined range 0–100%. The omega transformation is usually recommended for datasets that include small or large percentage entries (<20% or >80%).
The proposed approach renders unnecessary: (1) the explicit effect screening for each water-quality characteristic separately and, (2) the parallel tracking of the individual trends for each water-quality characteristic separately. Therefore, it is proposed to cluster the multiresponse dataset into a new single vector column such that to docket a cluster identification label to each specific run. This idea aims to accomplish four innovative objectives: (1) it collapses the multiple independent water quality response vectors to a single one, (2) it creates a single uniform ‘characteristic’ that contains relative information from all physical characteristics at the same time, (3) it feeds pre-labeled information to a statistical profiler that enables the assignment of significance to the examined effects, and (4) it concocts a new method from only proven and easily-accessible techniques.
2.4. Methodological Design and Analysis Stages
The new methodology is outlined as follows:
- (1)
- Select a number of suitable characteristics that could provide a multi-lateral view of the water quality status of the tested samples.
- (2)
- Select a number of controlling factors that are relevant to screening the respective water quality properties.
- (3)
- Outline an adequately broad factorial landscape by pinpointing its operational end points.
- (4)
- Select an appropriate FFD/OA design that accommodates the group of the selected controlling factors from step 2 and decide on possible investigating factor non-linearity.
- (5)
- Execute the trial recipes according to the FFD/OA plan of step 4 and collect the data.
- (6)
- Apply cluster analysis to the multiresponse dataset.
- (7)
- Use the Silhouette method [57] to optimize the number of clusters by estimating the average silhouette width (ASW).
- (8)
- “De-nominalize” the cluster membership identification by “ordinalizing” the cluster label groups according to the direction of the desirable behavior of the examined physical characteristics.
- (9)
- Identify the strong effects
- (10)
- Confirm the results with additional data.
2.5. The Computational Aids
The functions ‘kmeans()’ and ‘silhouette()’ from the (free software) R-package (v.R 4.1.0) [47] ‘stats’ and ‘cluster’ (v.2.1.2) were utilized to retrieve information in order to determine the optimal cluster membership of the examined multiple characteristics. The module ‘param.design()’ from the R-package ‘DoE.base’ (v. 1.1-6) was used to prepare the non-linear Taguchi OA designs. The bump chart analysis of the ordinalized response was facilitated by implementing the R-packages ‘ggplot2()’ (v.3.3.4) and ‘ggbump()’ (v.0.1.0).
3. Results
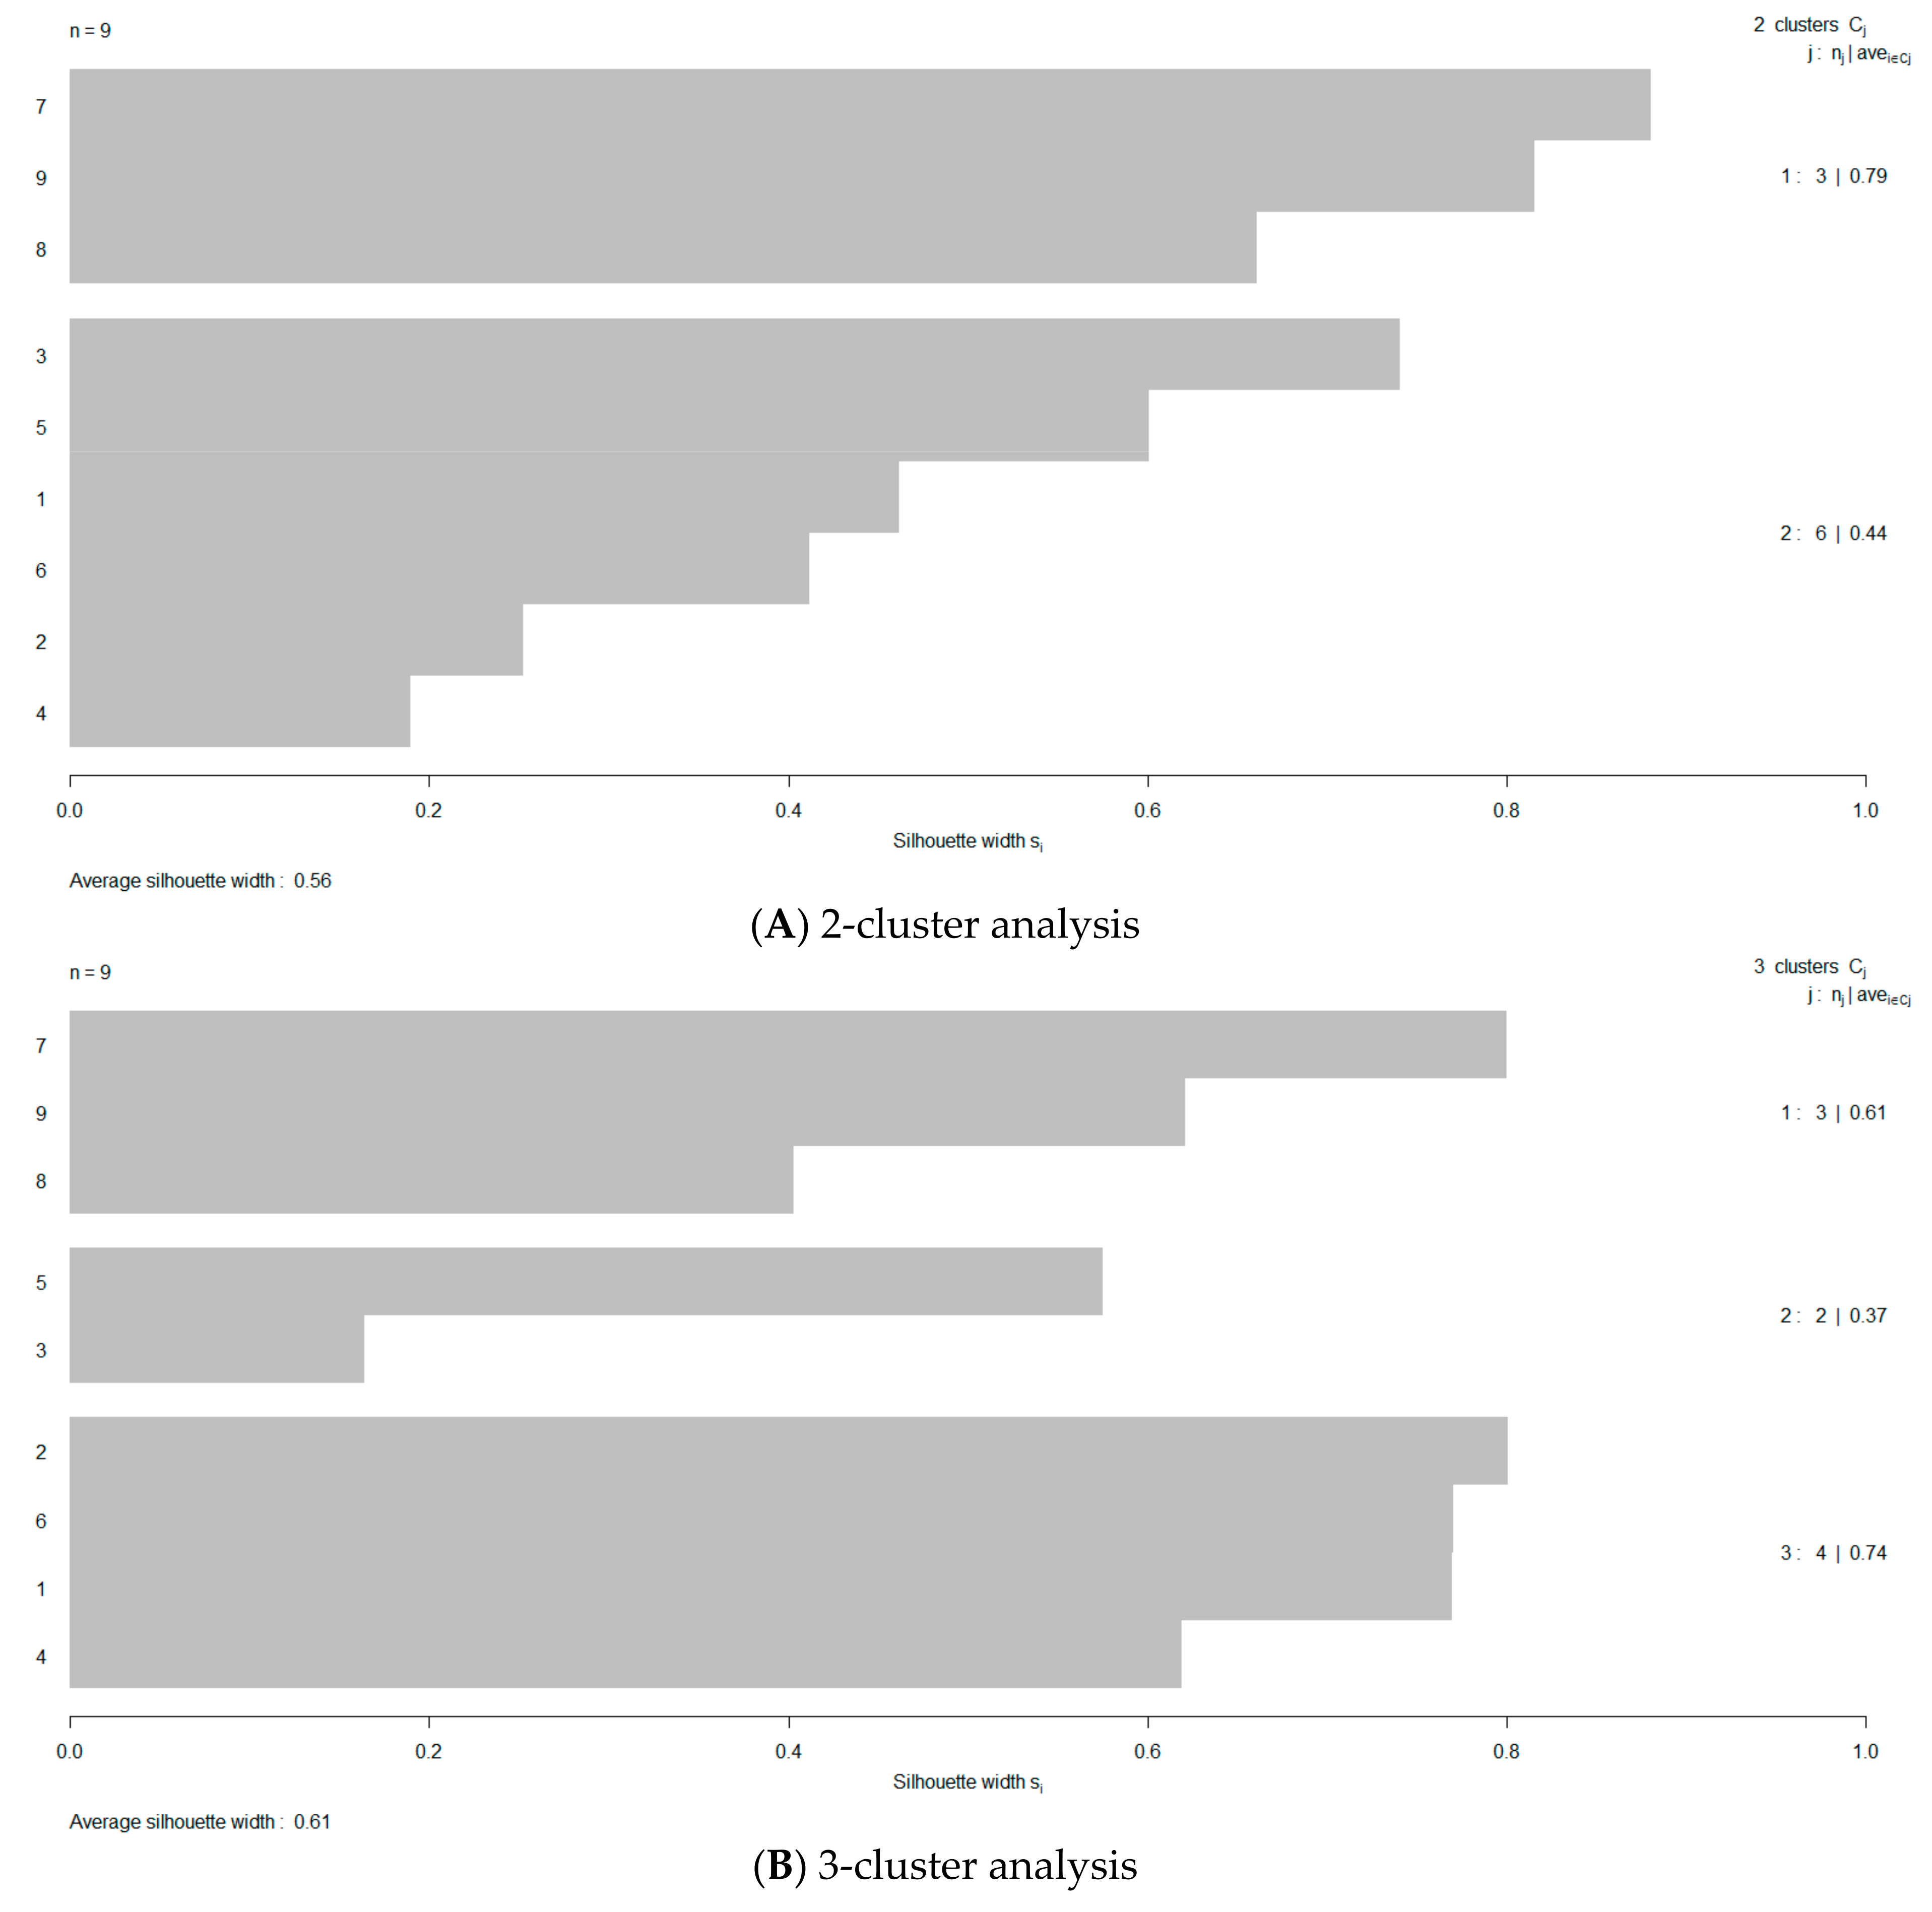
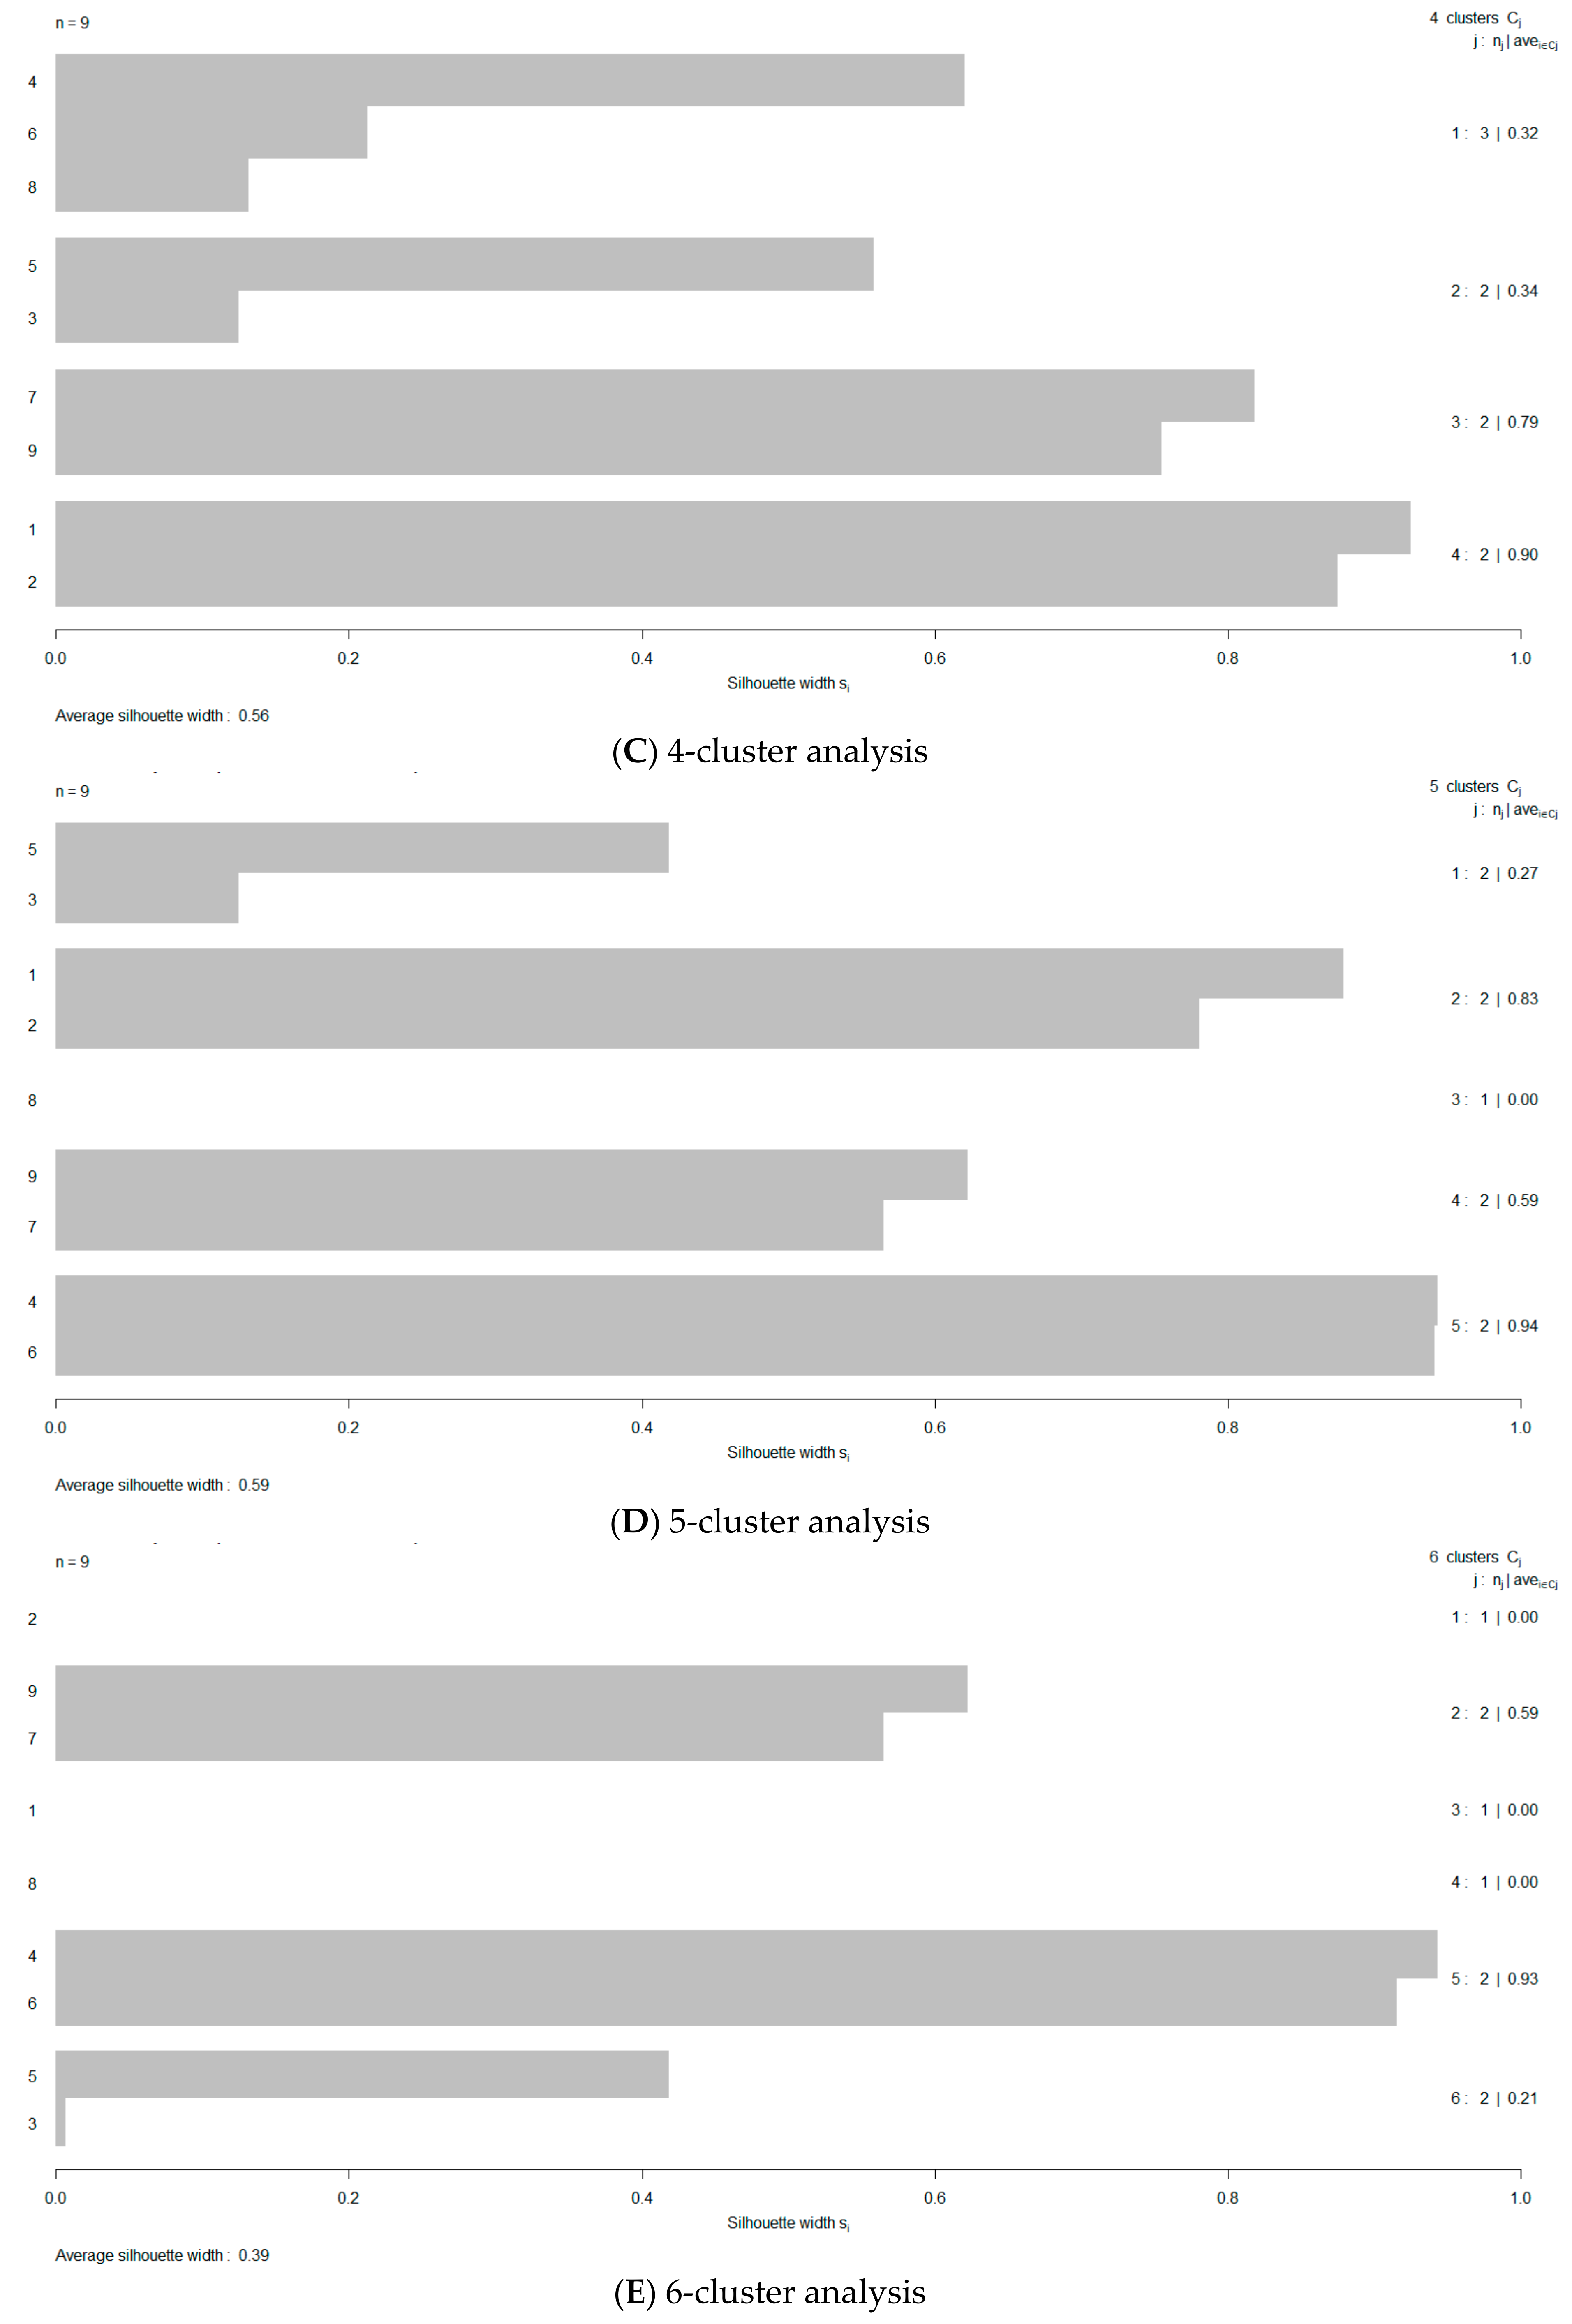
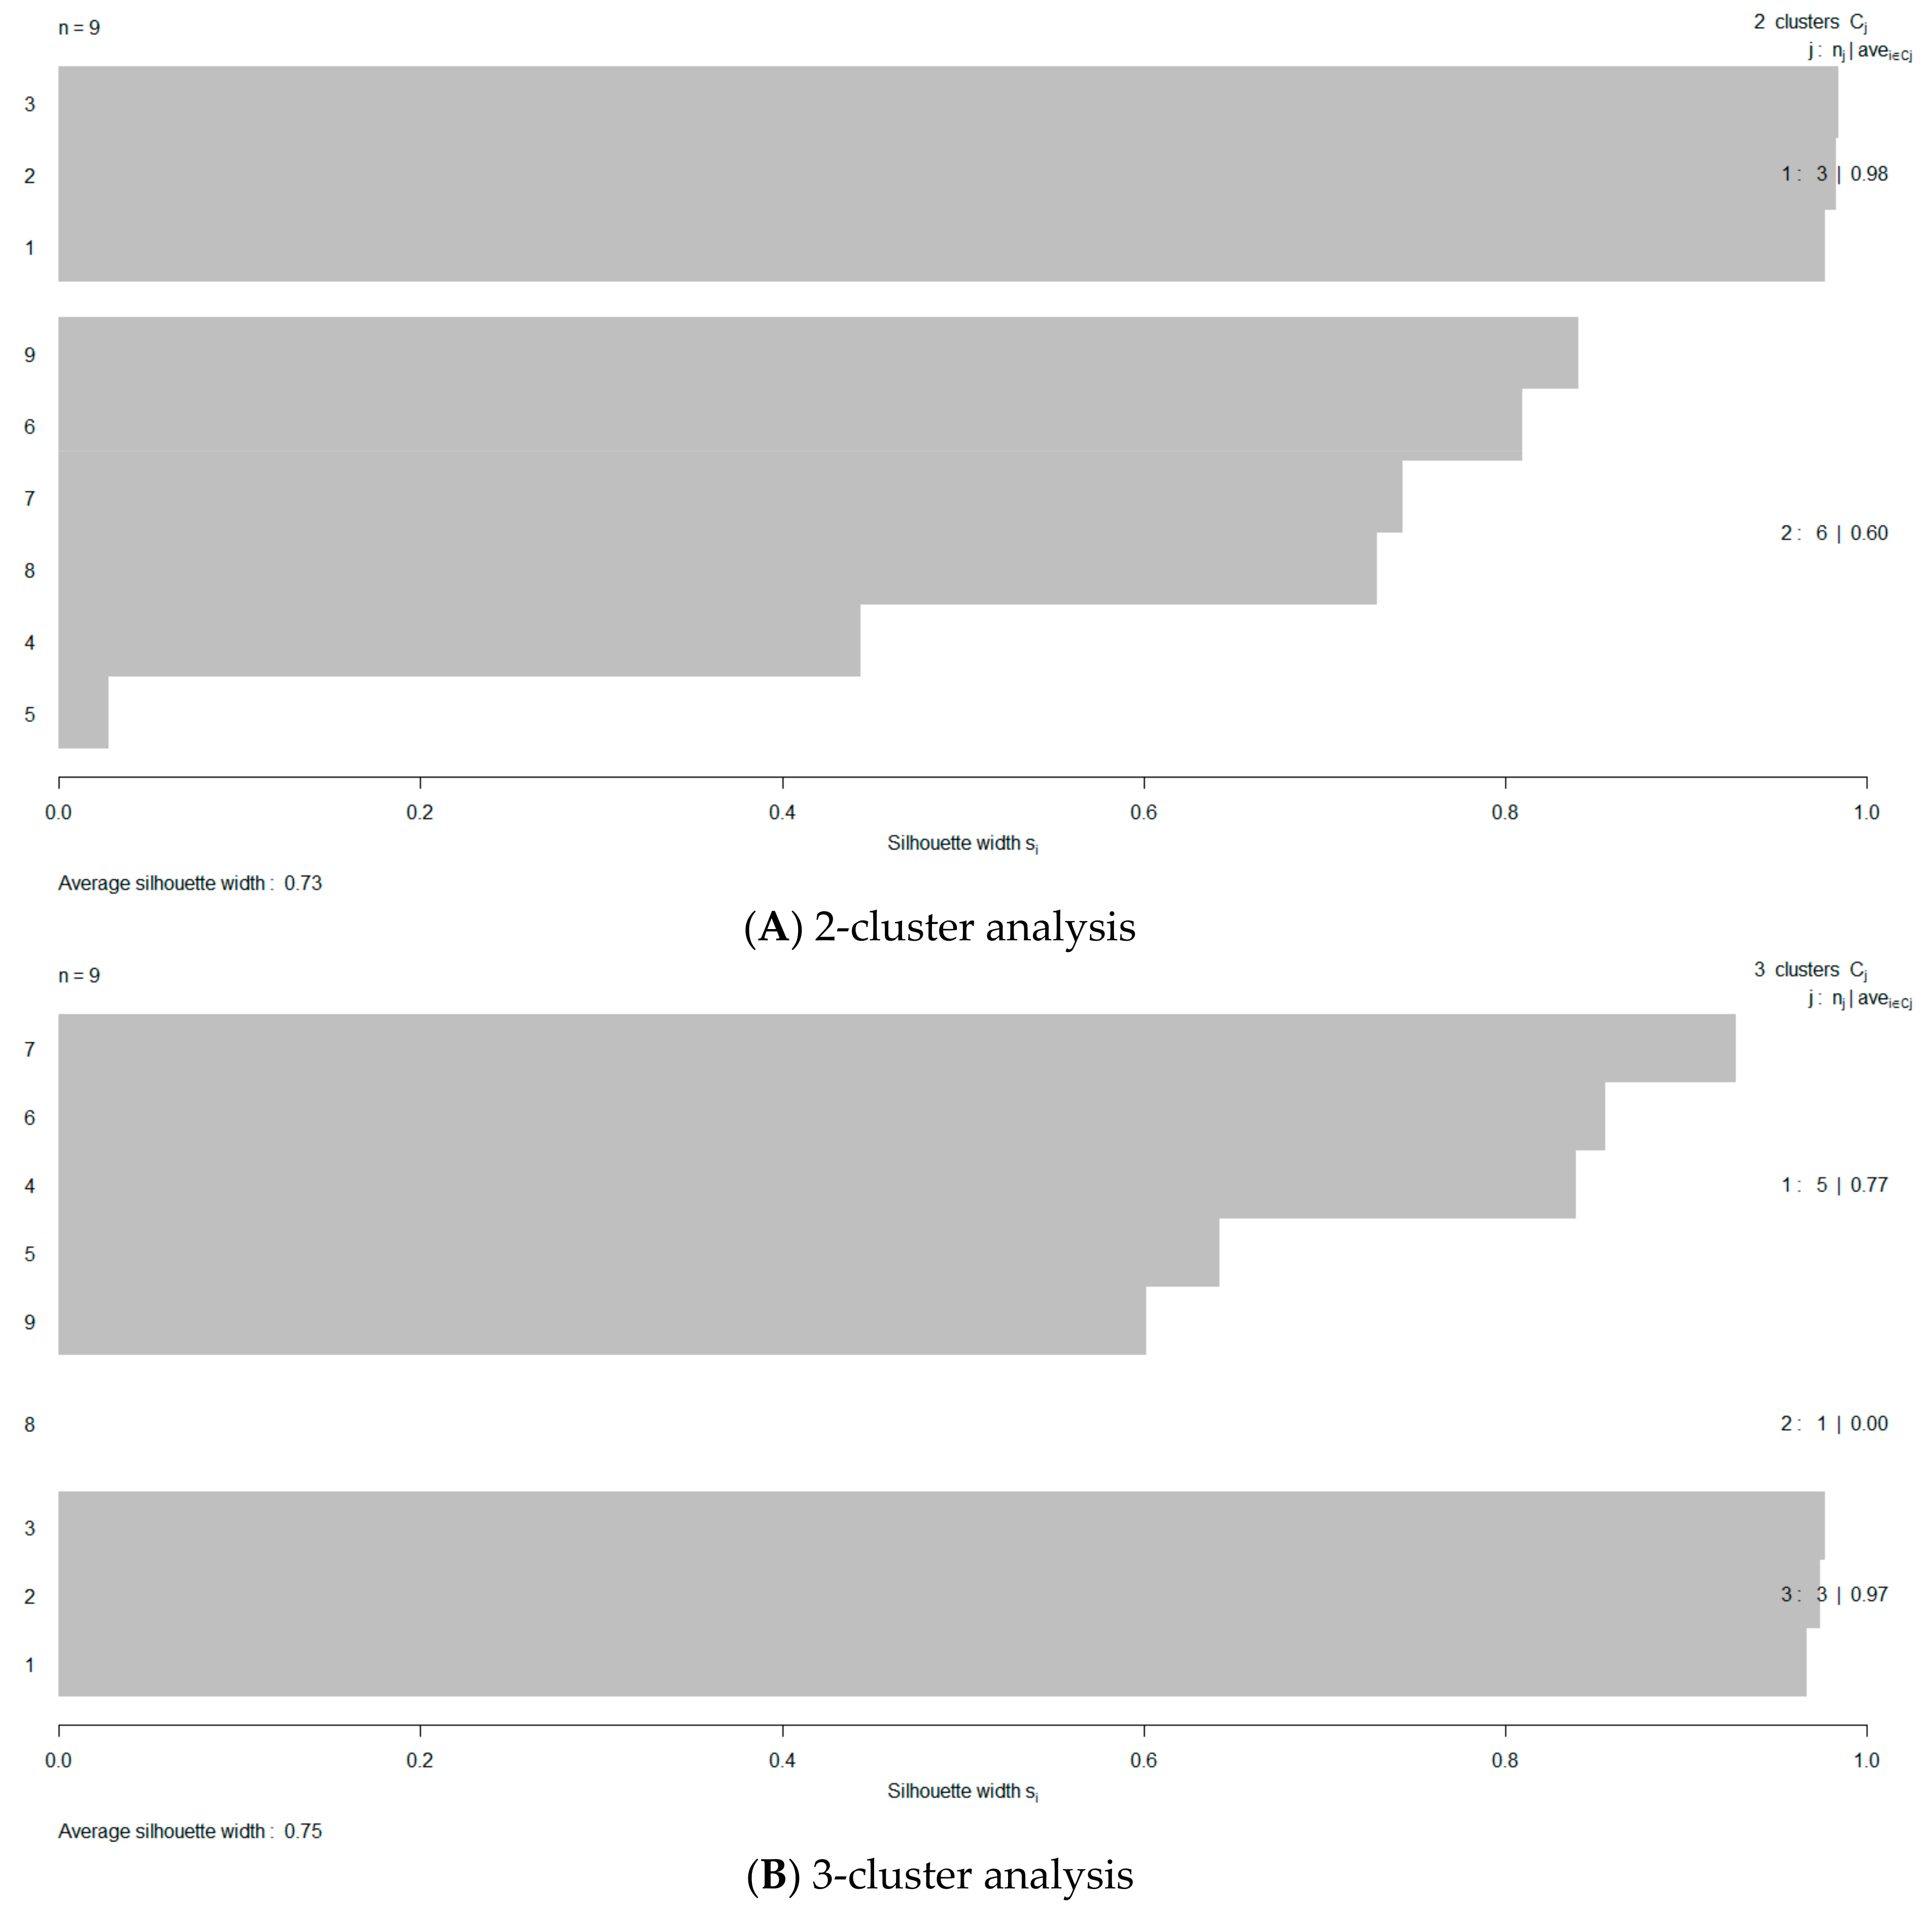
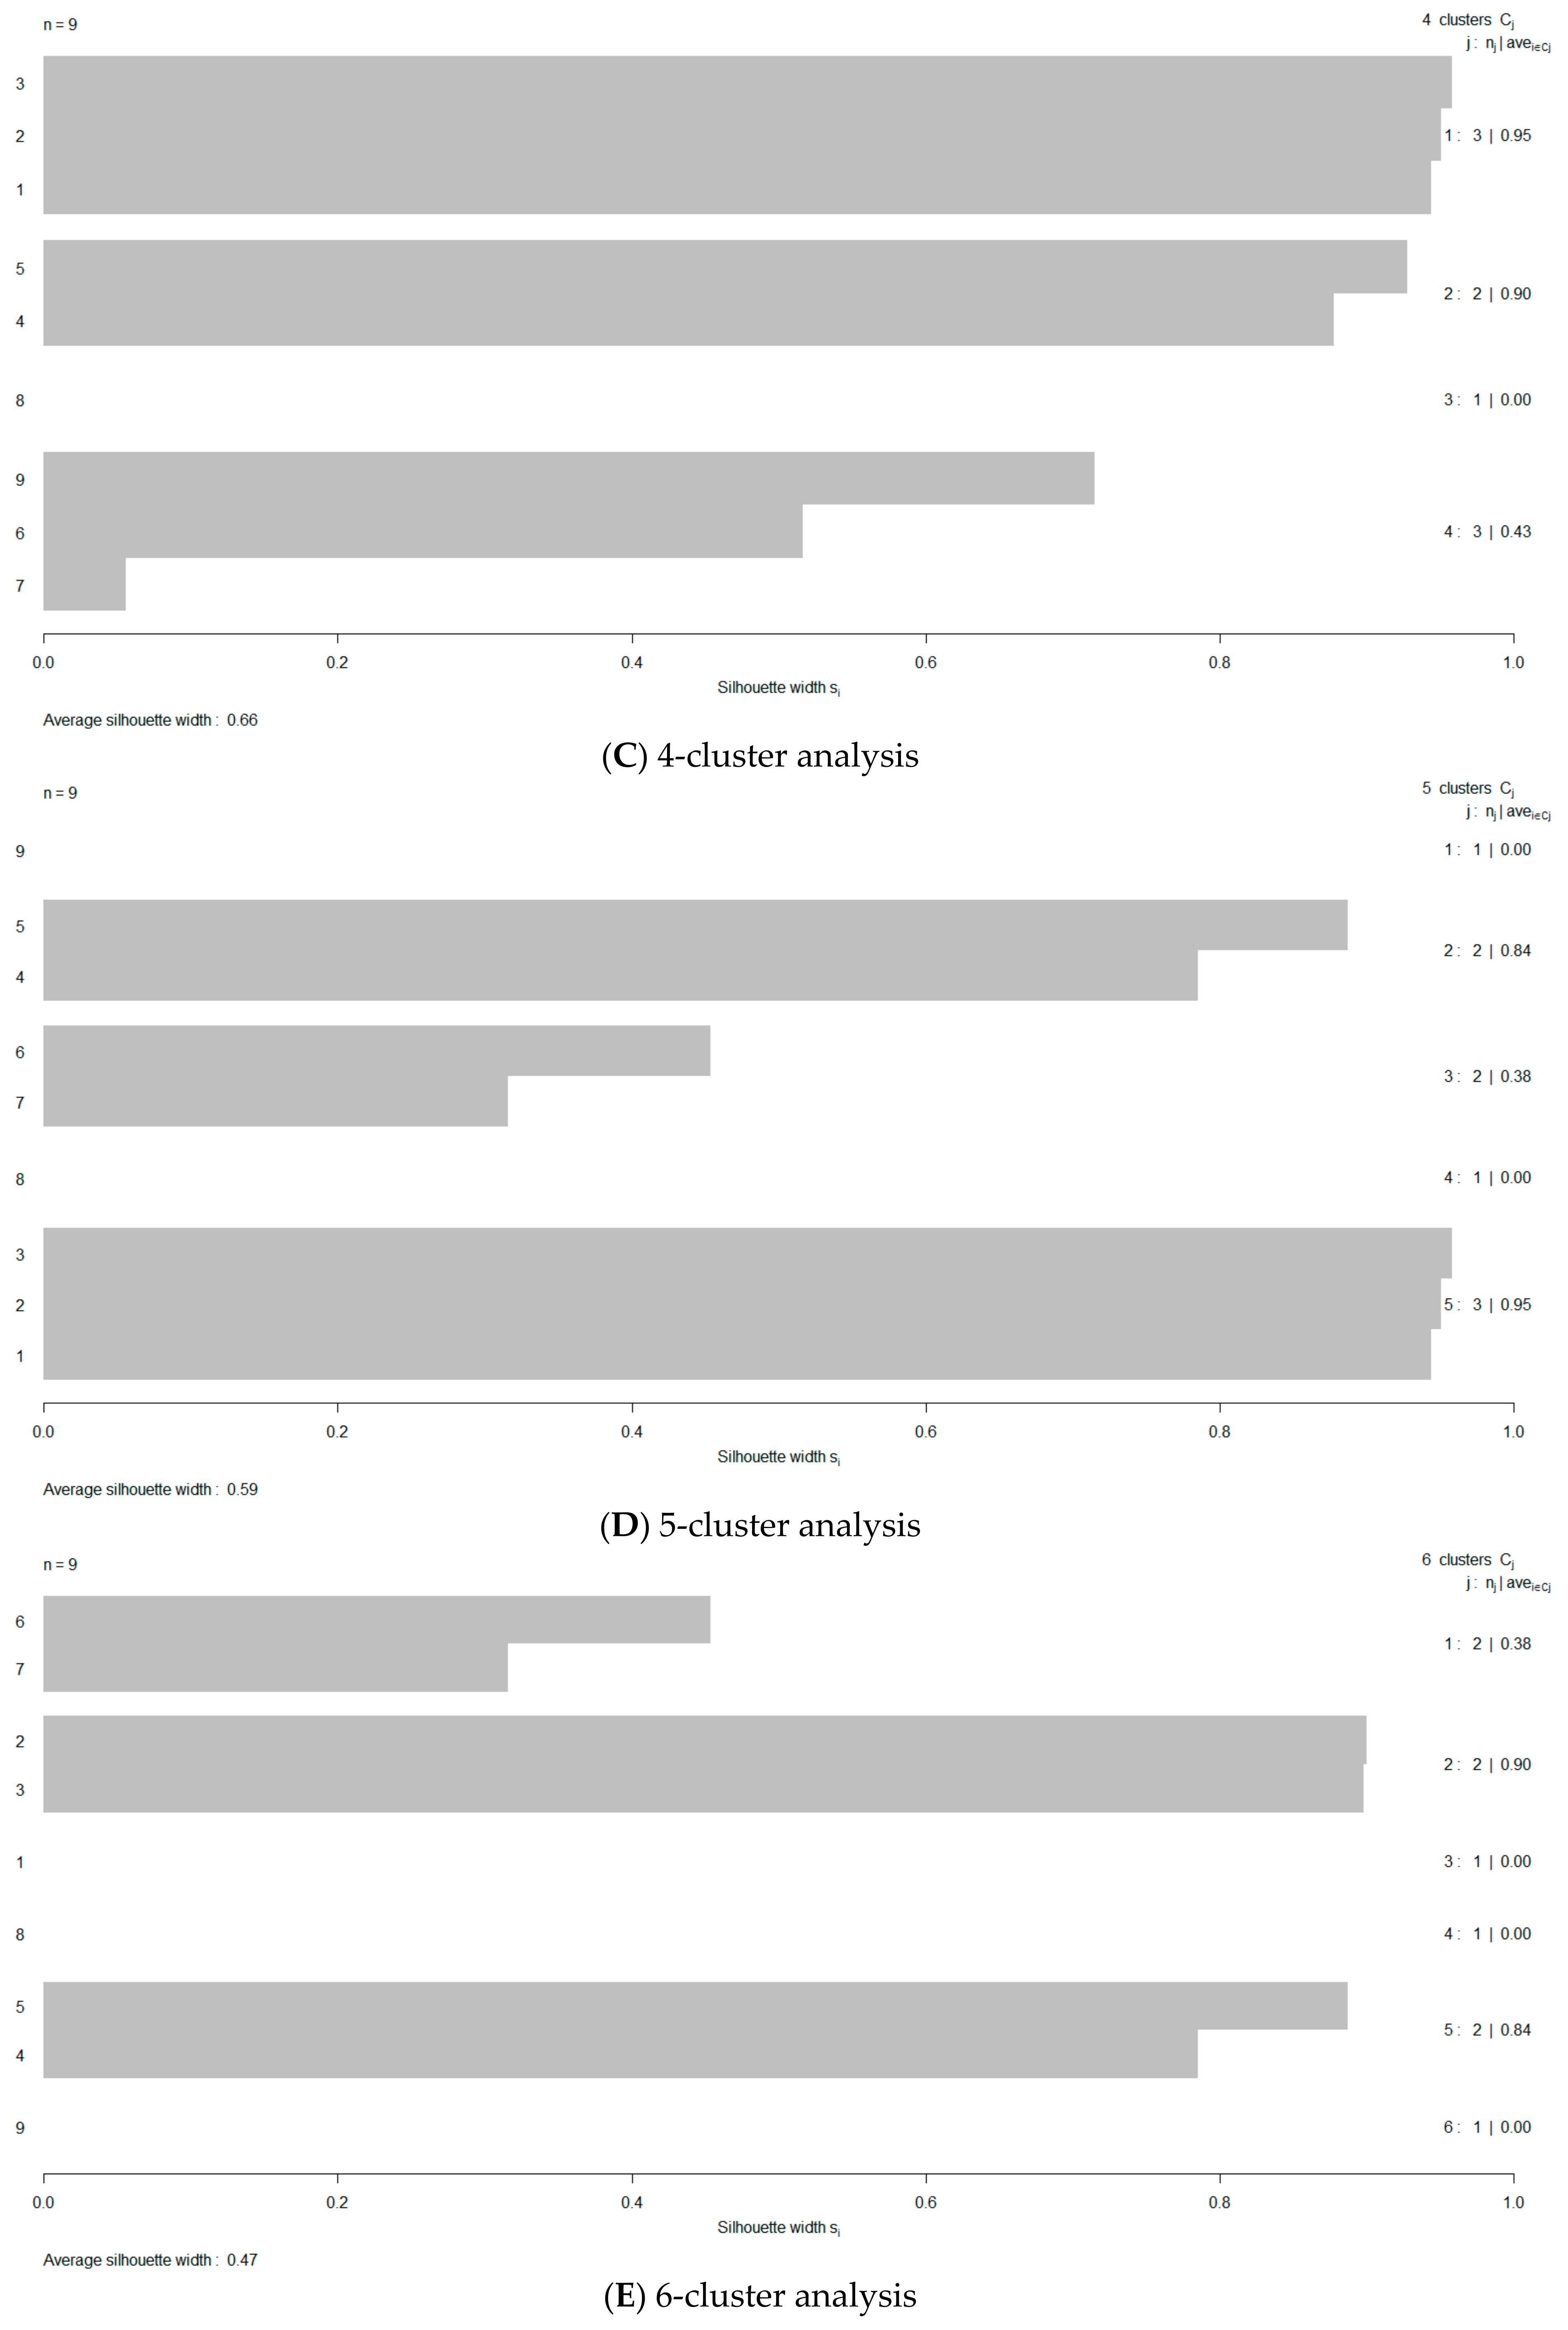
In Figure 1, the variability among the silhouette maps is portrayed in order to facilitate the visual evaluation of favorable cluster groupings; they range from 2–6 memberships. Dataset silhouetting provides an easy cluster cohesion evaluation, since larger score values are indicating better matching with their own cluster and better separation from their neighboring clusters. To quickly screen for an optimal membership number, the volatility of the silhouette bands is depicted in terms of the proper performance measure—the ASW—against the predefined number of tested clusters, n (Figure 2). Clearly, it may be inferred that working with a three-clustered dataset will be advisable, since the ASW value is maximized at a value of 0.61. At this point, it is needed to “de-nominalize” the membership identification of the Abu-Shady ED dataset (Tables 3 and 4 in reference [22]). The nominal representation of the dataset according to the silhouette method results, for n = 3, is listed in Table 1. The de-nominalization/ordinalization path is recoded as: 2′→3, 3′→2, and 1′→1, where the primed cluster identification represents the nominal status (initial cluster assignment).
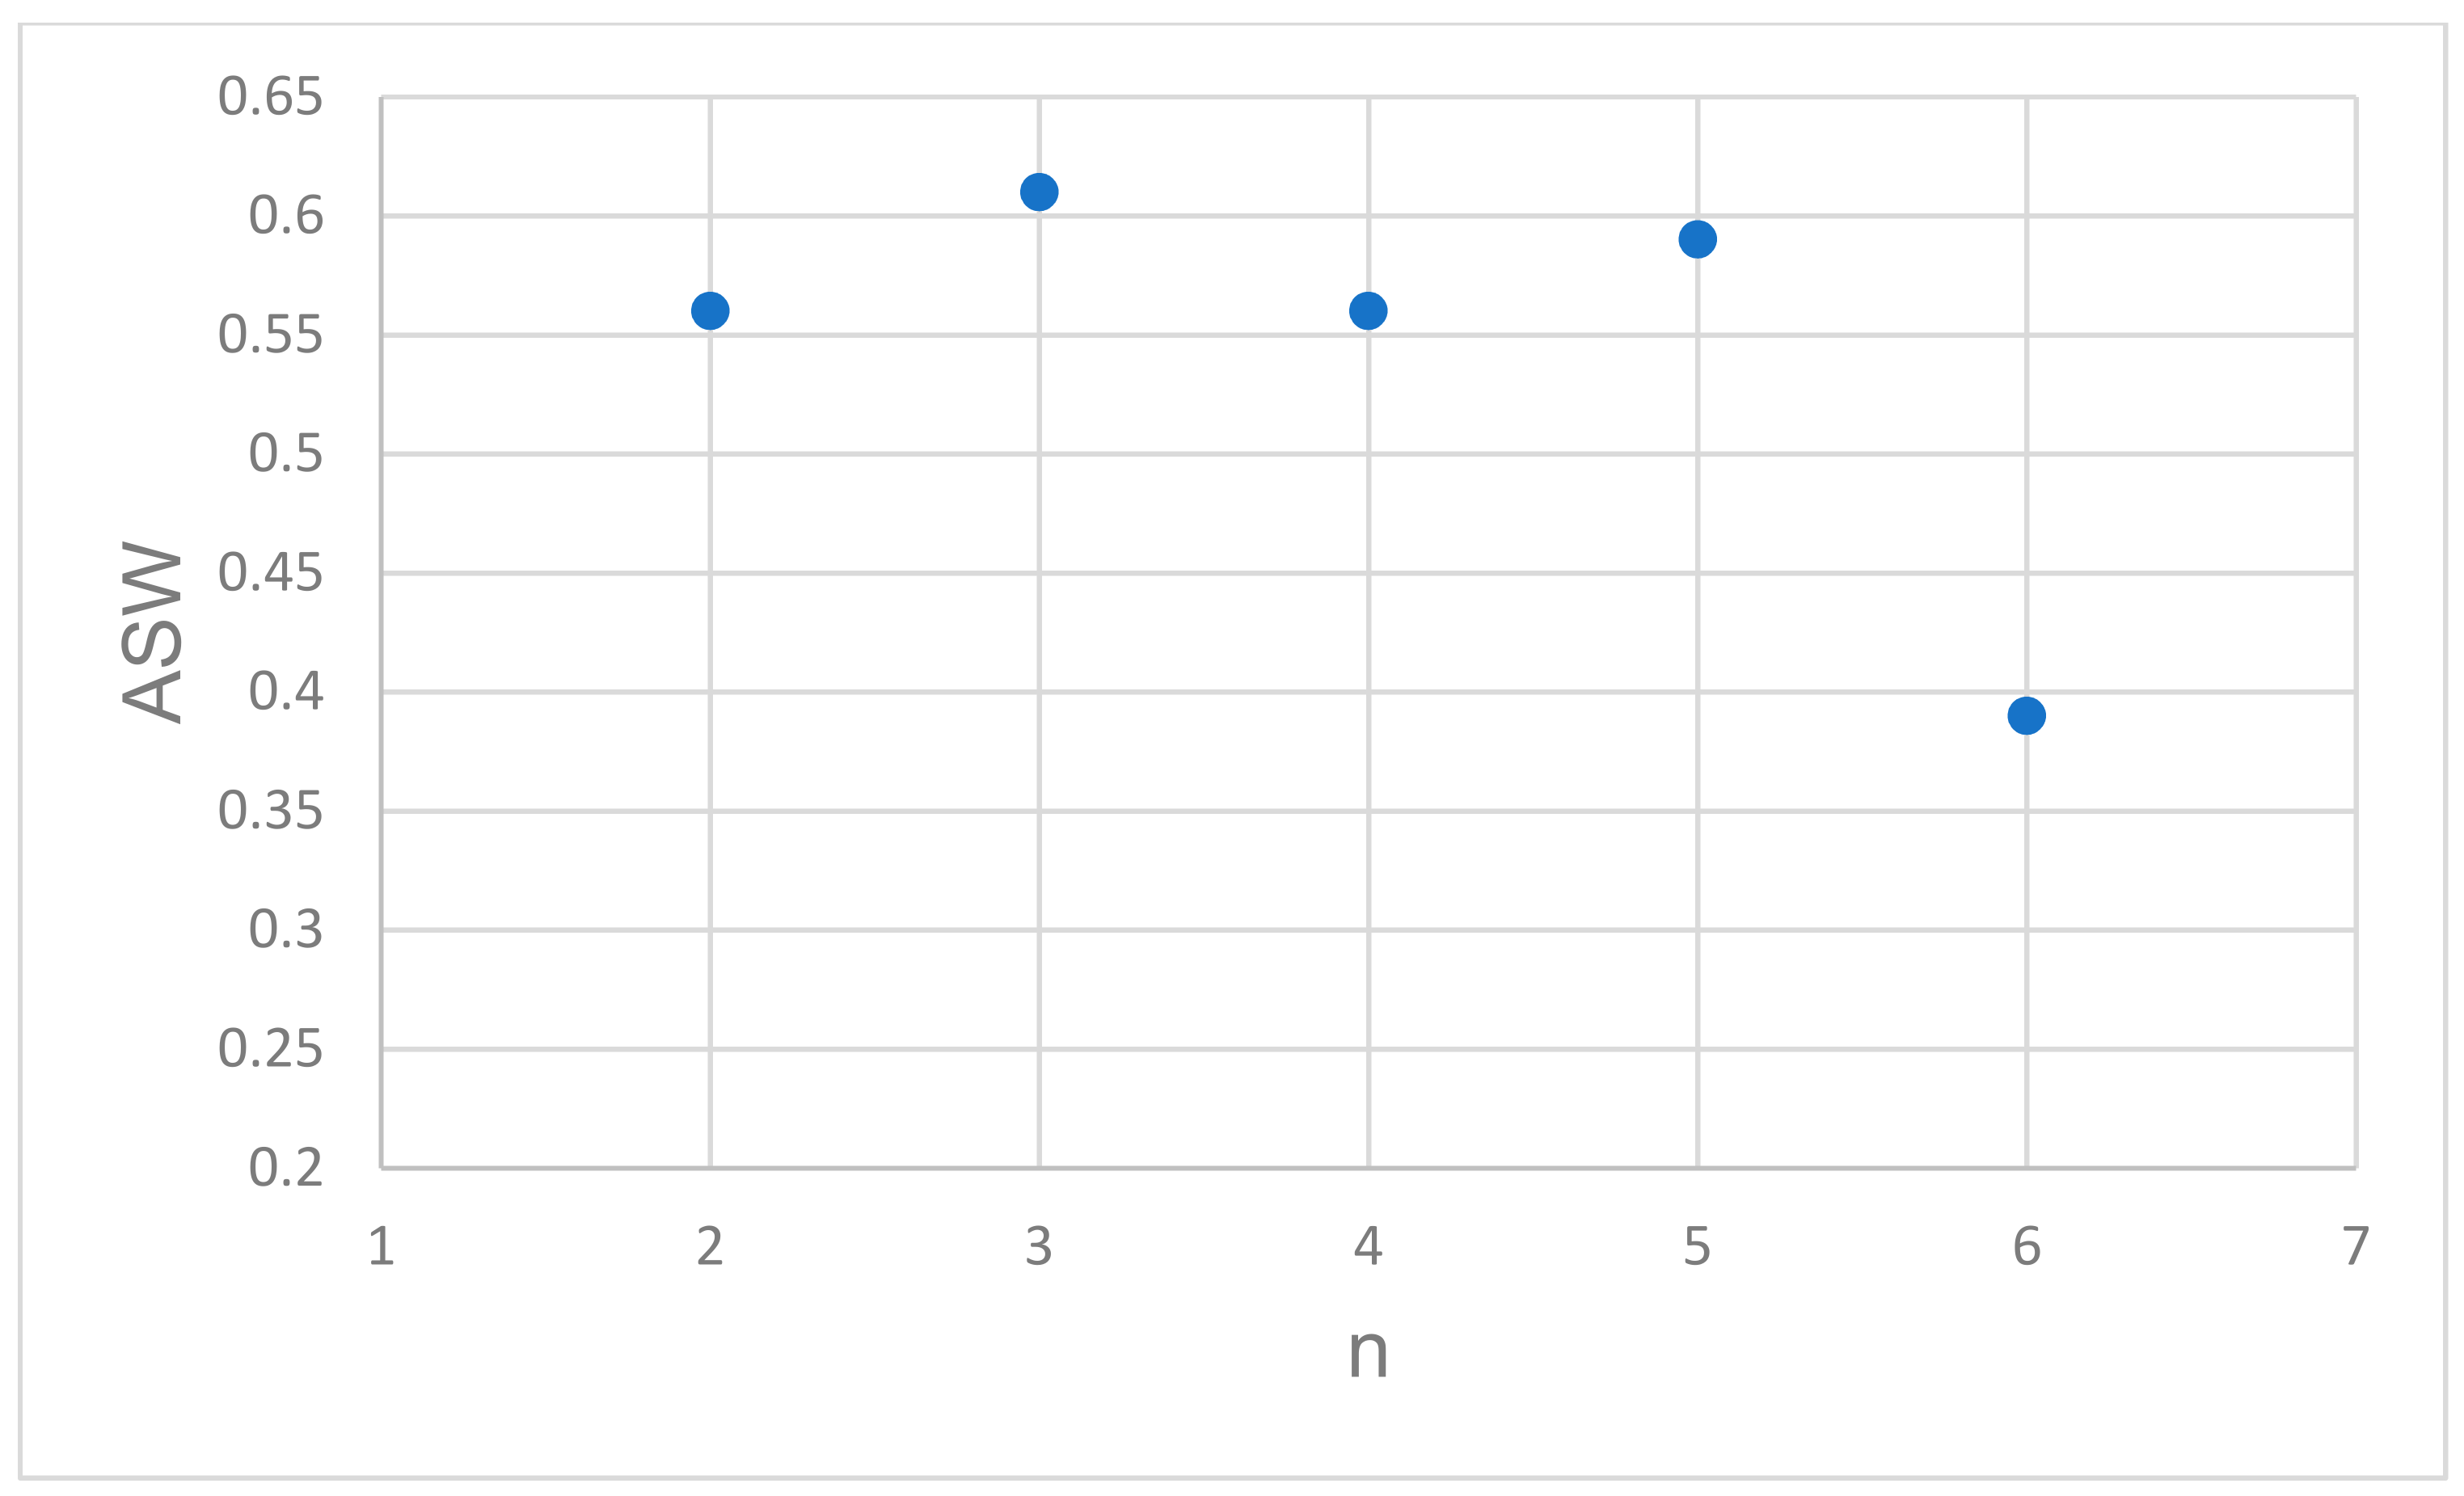
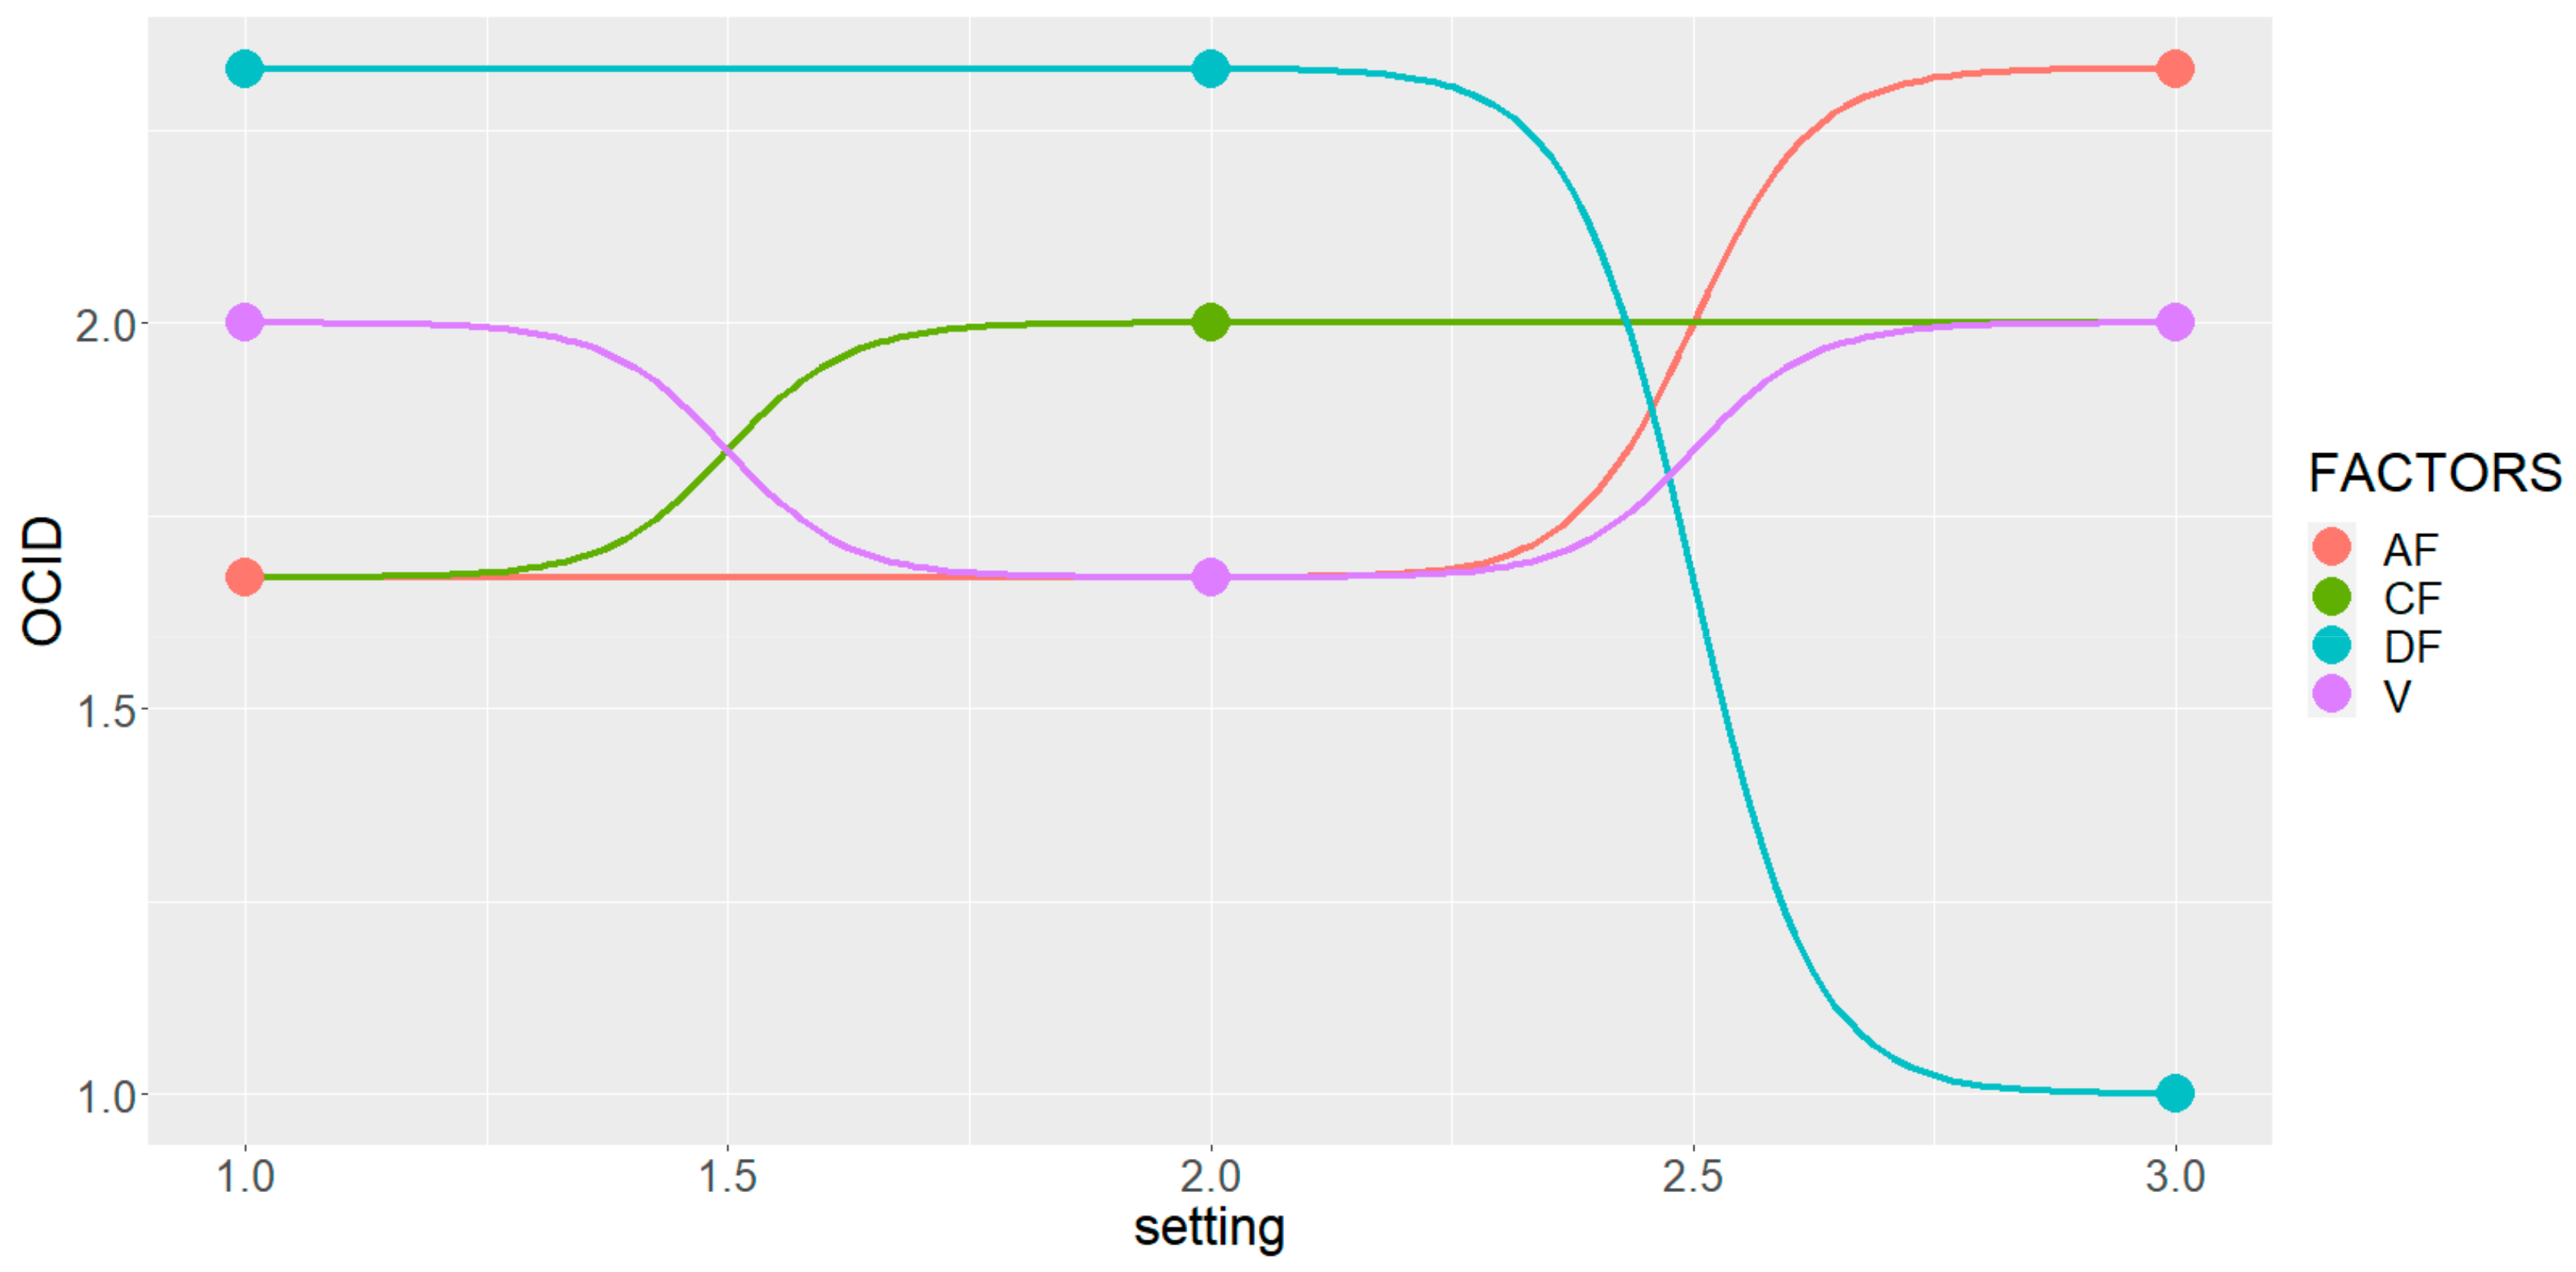
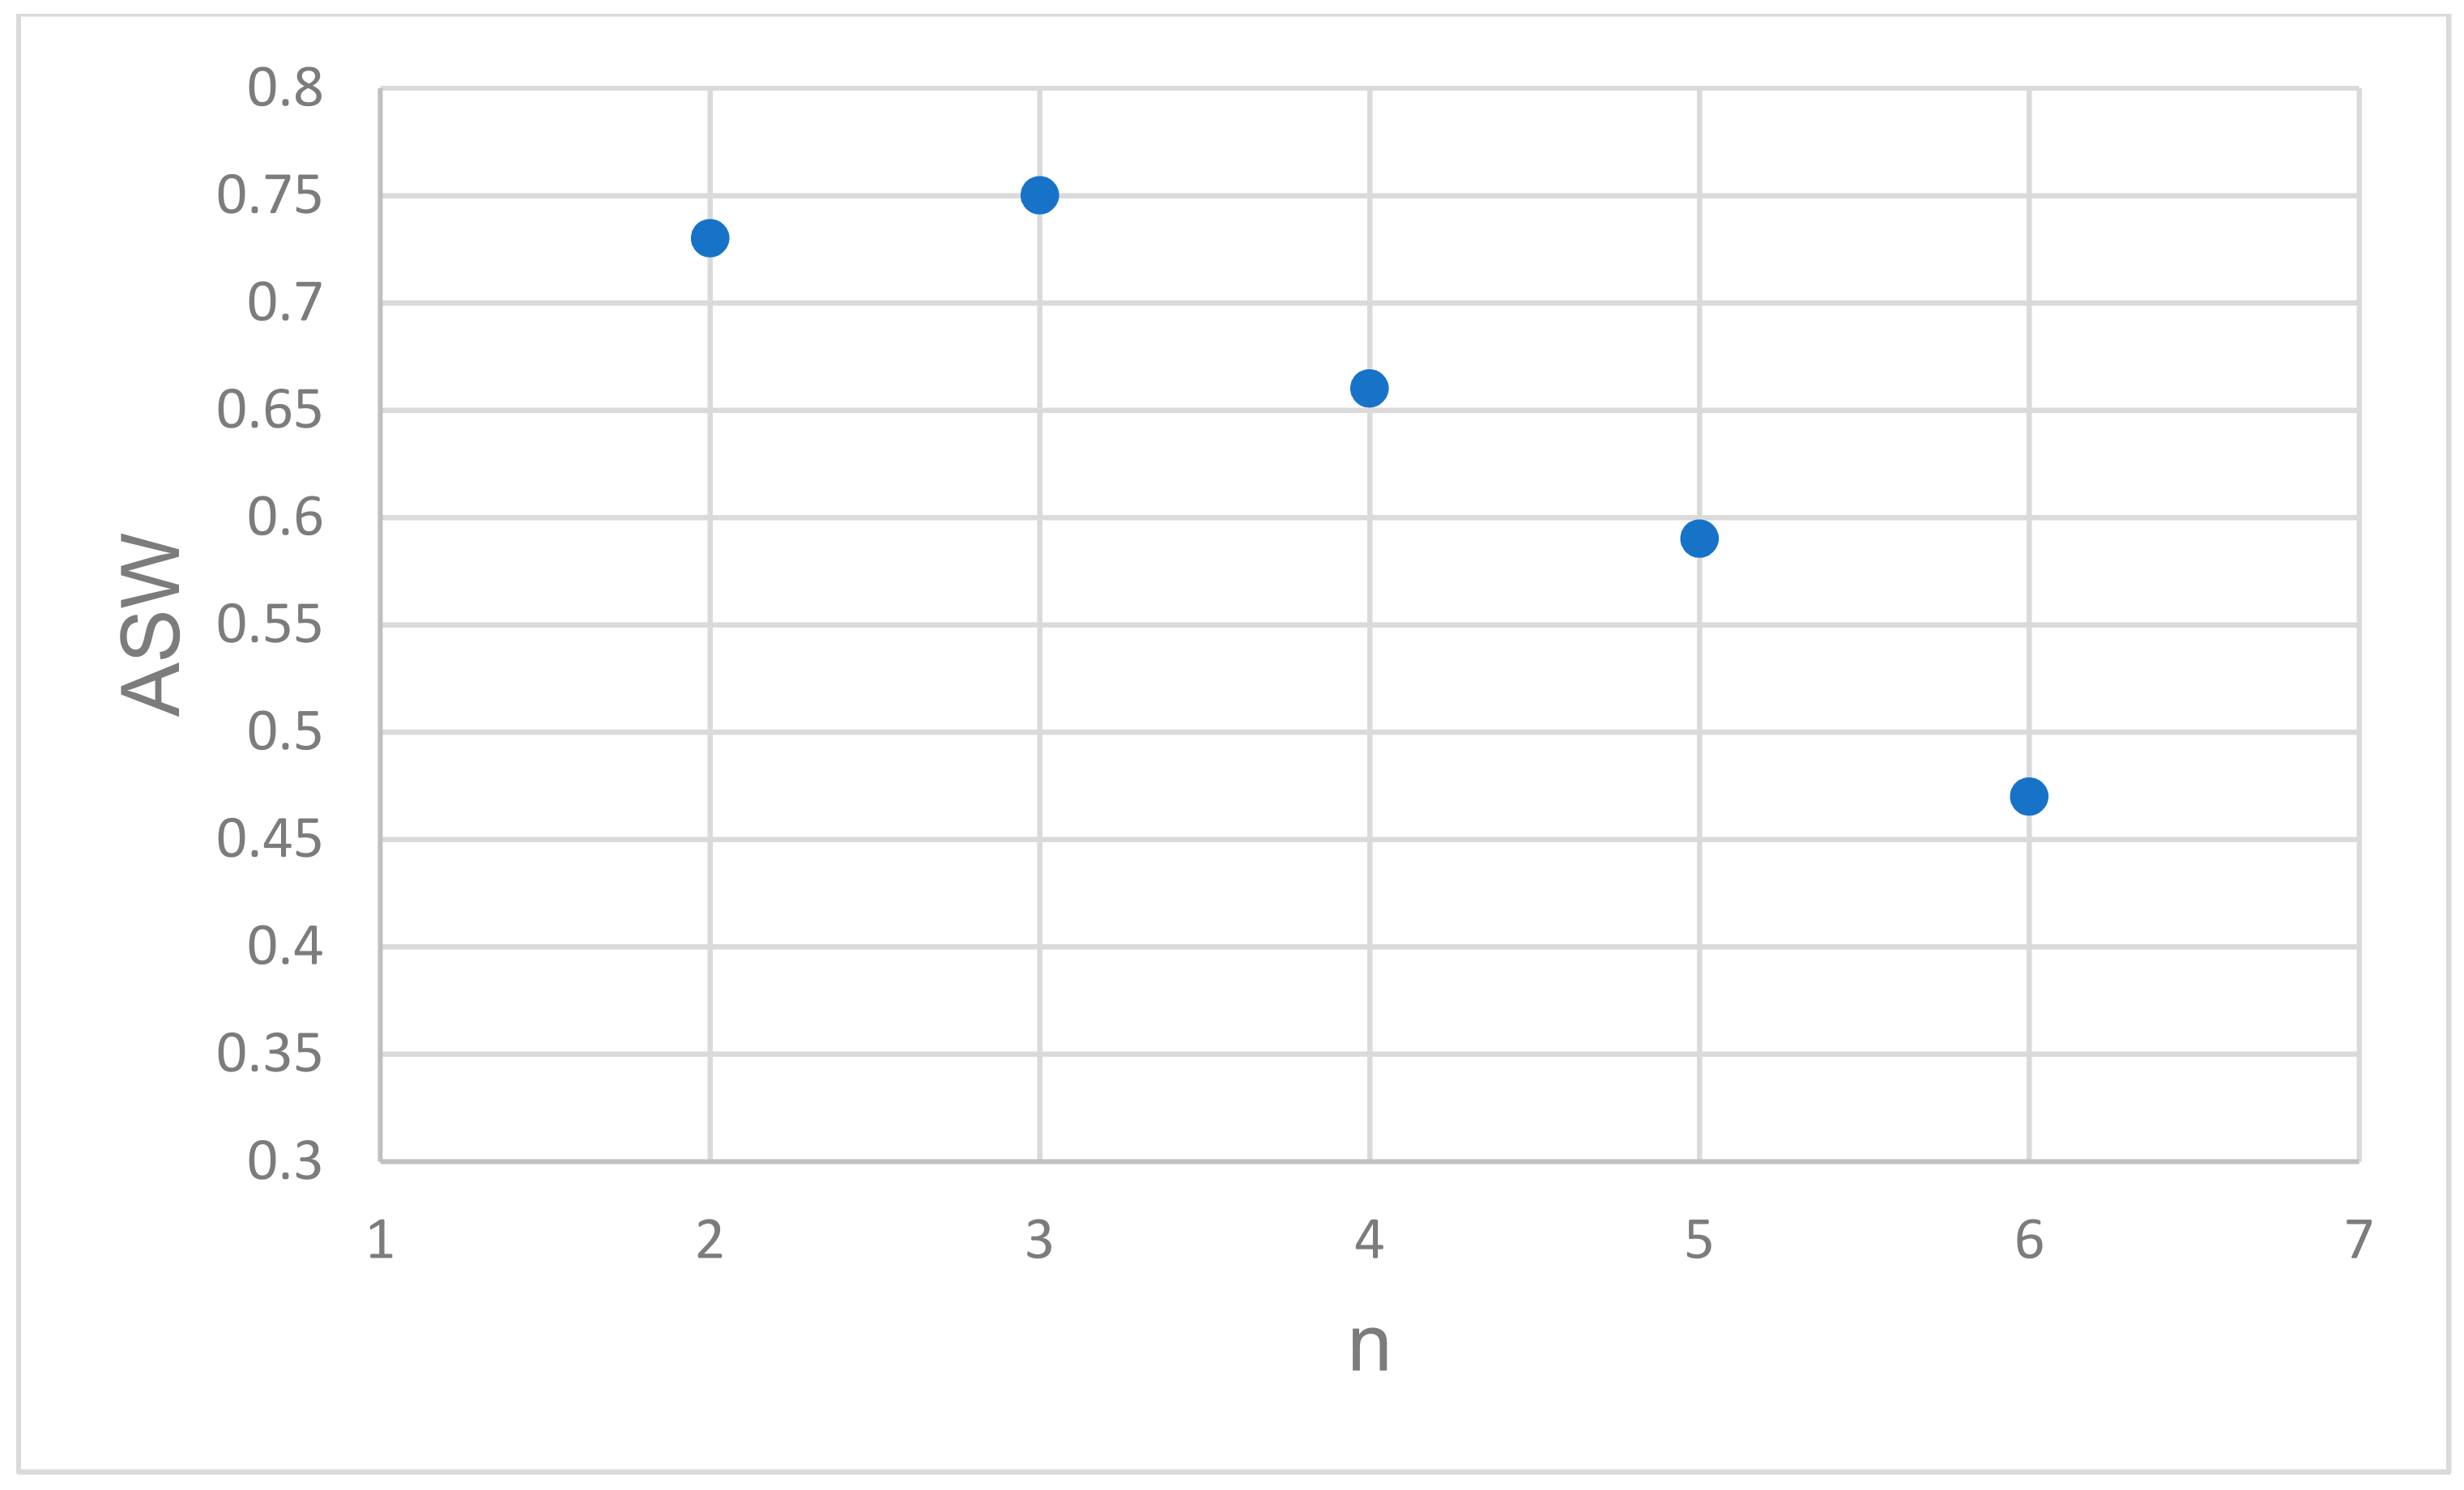
To justify the reason for a “re-engineered” designation (from cluster nominal labeling to ordinal ranking), the notion is illustrated by providing (Table 2) useful descriptive statistics that estimate the initial central tendencies of the nominally labeled datasets. It becomes clear that if it is to maximize RS (mean = 13.41%), and minimize SAR (mean = 5.33) and SSP (mean = 62.29%), their performance is maximized at a ranking of value ‘3’ (the highest achievable). Hence, the nominal labeling of ‘2’ becomes the ordinal ranking of ‘3’, i.e., the maximum desirable behavior for all three water quality indices. It becomes apparent now why the nominal rating of ‘1’ should remain unaltered to the original designation. Hence, it simply remains to become the ordinal ranking of value ‘1’—least desirable behavior by all three characteristics. From Table 2, it is observed that the evaluated measures of the central tendencies are fairly stable; mean and median estimations are similar in consideration of this small sample. The next step is to use as a guide the L9(34) OA setup of the Abu-Shady ED dataset (Table 3 in ref. [22]) along with the OCID dataset from Table 1 so that to prepare a bump chart (Figure 3). The versatility of the bump chart is conveniently demonstrated in the depiction of the uniformed multiple-ranking performances of the factors and their quick tracing of changes across settings. It immediately becomes evident that the variable factors should be treated with a linear model. The fitted model will be further simplified if factors CF, AF and V are outrightly eliminated, since no significant disturbance is detected—fluctuations around any ordinal level are less than half-step. On the contrary, factor DF seems to cause enough attenuation to span across two adjacent ordinal levels. It is construed that the DF variable should be treated with a simple linear model, as observed by the fact that between levels ‘1’ and ‘2’ there is no fluctuation at all. Finally, using ordinal regression with DF to play the role of the single predictor, it is discovered that DF is statistically significant at a level 0.5 upon while meeting absolute and relative convergence criteria.
4. Discussion
The best way to reaffirm the outcomes of the previous section is to repeat the study with another independent ED dataset. Fortunately, Abu-Shady in Table 9 [22] provided a second round of trial OA-recipes where the factor AF had been eliminated from further consideration. Moreover, factor setting values of V had been altered and the testing dataset was tabulated in Table 10 [22]. The same procedure is repeated on this second dataset as in the previous section and the new silhouette plots are arranged in Figure 4. From Figure 5, it is observed that again the 3-cluster case seems to outpace the other four clustering options in terms of their ASW performance. The nominal clustering of the runs is tabulated in Table 3. Based on the nominal clustering of the new OA runs, the descriptive statistics for the three characteristics have been listed in Table 4. The ordinalized clustering, then, is tabulated in Table 3. The new bump chart (Figure 6) demonstrates again that the factor DF causes substantial disturbance since it clearly transverses at least two “ordinalized” clusters. Following up, by treating the factor DF with ordinal regression, the coefficient of DF is even larger in magnitude—using the confirming dataset (−41.89 from −2.61). The log-likelihood value at the estimated optimum was also improved from −6.20 to −1.91. Since the absolute, but not the relative, convergence criterion was met, an application of the Kruskal-Wallis test [58] of DF on the OCID information, in both screening and testing datasets, confirmed that the differentiation of the ordinalized clusters in both situations is statistically significant at a level of 0.05. The R-function “kruskal.test” from the R-package “STATS” was used for the required computations. The overall prediction agrees with a recently published multiresponse nonparametric method which was developed to handle the limitations of the alternative regular treatments of ANOVA/MANOVA/GLM on overcoming the dual conditions of ‘unreplication/saturation’ in FFDs/OAs [45].
5. Conclusions
Improving wastewater recycling efficiency is necessary for sustainable agricultural irrigation. Resilient solutions require adaptable data-conversion tools to perform the complicated screening/optimization studies. This is because a wastewater stock may be marred by many sources of uncertainty; they have to be detected, quantified and isolated through the implementation of meaningful and relevant water quality indices. Screening/optimization studies have shown that DOE planning methods, such as the FFDs and the Taguchi-type OAs, may speed up the organizing effort and the execution of the required experimentation with noticeably less budgeted costs and time. Subsequently, the specialized analysis of the generated small, but also structured and balanced, datasets are usually carried out by employing several—all of them well-thought—methods, which are easily accessible through the use of one or more statistical software packages. The democratization of the resulting multifarious solutions may then be pursued and a ‘common-ground’ solution is hopefully to be reached. Since the statistical screening/optimization outcomes might be contested because of the polyphony of the offered solver gamut, new methodologies might come to aid if they could offer a description of the active predictor landscape from yet a different viewpoint. There are situations where a small research unit might find itself in lack of one or more of those commercially available computing resources. Other times, there are such computing facilities at hand, but it is requisite to supplement the overall prediction horizon from still another perspective, perhaps, because there is no alignment of the solution outcomes among the employed techniques. It has been shown how plurality of outcomes may be reinforced by introducing new open approaches, which are assembled from several well-accepted techniques. It is proposed that there be still the possibility of formulating new methodologies by considering the openness and effectiveness of statistical freeware routines that, in combination, could provide new insights to solving a difficult multiresponse multiparameter non-linear screening problem. In enhancing the performance of a wastewater ED-recycling process, it is demonstrated that ordinary classification, with optimally silhouette-selected clusters, may fuse the multiresponse dependencies to a produce a much simpler single nominal characteristic. The subsequent “ordinalization” of the nominal clusters allowed the quick graphical profiling of the potentially influential non-linear factors using solely a bump chart. A final check using ordinal regression assigned a significance value to the effect. All graphical and computational work was conducted on freeware routines from the statistical platform R. The tested dataset was a two-part published experimental output for a rare wastewater ED-recycling problem in congruence with crop growth planning in arid areas to serving expanding population needs. The new screening/optimization predictions agreed with other recently published work. A combination of the aspects of classification and rank learning may be viewed as alternative ways to treat complicated small data problems by aspiring to infer their multiresponse multiparameter non-linear core properties.
Funding
This research received no external funding.
Conflicts of Interest
The author declares no conflict of interest.
References
- Finney, J. Water: A Very Short Introduction; Oxford University Press: Oxford, UK, 2015. [Google Scholar]
- Ball, P. H2O: The Biography of Water; Orion Publishing Co.: London, UK, 2000. [Google Scholar]
- Ball, P. Water—An enduring mystery. Nature 2008, 452, 291–292. [Google Scholar] [CrossRef] [PubMed]
- Herring, J.G. Water: The Environmental, Technological, and Societal Complexity of a Simple Substance. In Encyclopedia of Water: Science, Technology, and Society; Patricia, A.M., Ed.; John Wiley & Sons, Inc.: Hoboken, NJ, USA, 2019. [Google Scholar]
- Pearce, F. When the Rivers Run Dry—Water: The Defining Crisis of the Twenty-First Century; Beacon Press: Boston, MA, USA, 2018. [Google Scholar]
- Newton, D.E. The Global Water Crisis: A Reference Handbook; ABC-CLIO: Santa Barbara, CA, USA, 2016. [Google Scholar]
- Dinar, A.; Tien, A.; Huynh, H. Water scarcity impacts on global food production. Glob. Food Secur. 2019, 23, 212–226. [Google Scholar] [CrossRef] [Green Version]
- WWAP (United Nations World Water Assessment Programme)/UN-Water. The United Nations World Water Development Report 2018: Nature-Based Solutions for Water; UNESCO: Paris, France, 2018. [Google Scholar]
- Vanham, D.; Bidoglio, G. A review on the indicator water footprint for the EU28. Ecol. Indic. 2013, 26, 61–75. [Google Scholar] [CrossRef]
- Goal 6: Ensure Access to Water and Sanitation for All, United Nations Sustainable Development. Available online: https://www.un.org/sustainabledevelopment/water-and-sanitation/ (accessed on 28 May 2019).
- Regional Information Center for Western Europe. Goal 6: Ensure Access to Water and Sanitation for All; United Nations: Bruxelles, Belgium; Available online: https://unric.org/en/sdg-6/ (accessed on 8 July 2021).
- SDG Compass. Ensure Availability and Sustainable Management of Water and Sanitation for All; United Nations: New York, NY, USA, 2015; Available online: https://sdgcompass.org/sdgs/sdg-6/ (accessed on 8 July 2021).
- WWAP (United Nations World Water Assessment Programme). The United Nations World Water Development Report 2017. Wastewater: The Untapped Resource; UNESCO: Paris, France, 2017. [Google Scholar]
- Burn, D.H.; McBean, E.A. Optimization modelling of water quality in an uncertain environment. Water Resour. Res. 1985, 21, 934–940. [Google Scholar] [CrossRef]
- Rehana, S.; Rajulapati, C.R.; Ghosh, S.; Karmakar, S.; Mujumdar, P. Uncertainty Quantification in Water Resource Systems Modeling: Case Studies from India. Water 2020, 12, 1793. [Google Scholar] [CrossRef]
- Hsien, C.; Low, J.S.C.; Chung, S.Y.; Tan, D.Z.L. Quality-based water and wastewater classification for waste-to-resource matching. Resour. Conserv. Recycl. 2019, 151, 104477. [Google Scholar] [CrossRef]
- Zito, R. Electrochemical Water Processing; Wiley-Scrivener: Hoboken, NJ, USA, 2011. [Google Scholar]
- Tanaka, Y. Ion Exchange Membrane Electrodialysis: Fundamentals, Desalination, Separation; Nova Science: New York, NY, USA, 2013. [Google Scholar]
- U.S. Salinity Laboratory Staff. Diagnosis and Improvement of Saline and Alkali Soils. Handbook No. 60; USDA: Washington, DC, USA, 1954.
- Wilcox, L.V. Classification and Use of Irrigation Water; US Department of Agriculture: Washington, DC, USA, 1955.
- Ayer, R.S.; Westcot, D.W. Water Quality for Agriculture, FAO Irrigation and Drainage Paper No. 29; Food and Agriculture Organization of the United Nations: Rome, Italy, 1985; pp. 1–117. [Google Scholar]
- Abou-Shady, A. Recycling of polluted wastewater for agriculture purpose using electrodialysis: Perspective for large scale application. Chem. Eng. J. 2017, 323, 1–18. [Google Scholar] [CrossRef]
- Box, G.E.P.; Hunter, W.G.; Hunter, J.S. Statistics for Experimenters—Design, Innovation, and Discovery; Wiley: New York, NY, USA, 2005. [Google Scholar]
- Taguchi, G.; Chowdhury, S.; Wu, Y. Quality Engineering Handbook; Wiley-Interscience: Hoboken, NJ, USA, 2004. [Google Scholar]
- Ilzarbe, L.; Alvarez, M.J.; Viles, E.; Tanco, M. Practical applications of design of experiments in the field of engineering: A bibliographical review. Qual. Reliab. Eng. Int. 2008, 24, 417–428. [Google Scholar] [CrossRef]
- Tanco, M.; Viles, E.; Ilzarbe, L.; Alvarez, M.J. Implementation of Design of Experiments projects in industry. Qual. Reliab. Eng. Int. 2009, 25, 478–505. [Google Scholar] [CrossRef]
- Taguchi, G.; Chowdhury, S.; Taguchi, S. Robust Engineering: Learn. How to Boost Quality While Reducing Costs and Time to Market; McGraw-Hill: New York, NY, USA, 2000. [Google Scholar]
- Lepeniotis, S.S.; Vigezzi, M.J. Lowering manufacturing cost of material by formulating it through statistical modeling and design. Chemom. Intell. Lab. Syst. 1995, 29, 133–139. [Google Scholar] [CrossRef]
- Madeni, S.; Koocheki, S. Application of Taguchi method in the optimization of wastewater treatment using spiral-wound reverse osmosis element. Chem. Eng. J. 2009, 119, 37–44. [Google Scholar] [CrossRef]
- Kaminari, N.M.S.; Schultz, D.R.; Ponte, M.J.J.S.; Ponte, H.A.; Marino, C.E.B.; Neto, A.C. Heavy metals recovery from industrial wastewater using Taguchi method. Chem. Eng. J. 2007, 126, 139–146. [Google Scholar] [CrossRef]
- Pardeshi, P.M.; Mungray, A.A.; Mungray, A.K. Mungray, Determination of optimum condition in forward osmosis using a combined Taguchi-neural approach. Chem. Eng. Res. Des. 2016, 109, 215–225. [Google Scholar] [CrossRef]
- Khan, R.; Inam, M.A.; Zam, S.Z.; Park, D.R.; Yeom, I.T. Assessment of Key Environmental Factors Influencing the Sedimentation and Aggregation Behavior of Zinc Oxide Nanoparticles in Aquatic Environment. Water 2018, 10, 660. [Google Scholar] [CrossRef] [Green Version]
- Ji, C.; Liang, X.; Peng, Y.; Zhang, Y.; Yan, X.; Wu, J. Multi-Dimensional Interval Number Decision Model Based on Mahalanobis-Taguchi System with Grey Entropy Method and Its Application in Reservoir Operation Scheme Selection. Water 2020, 12, 685. [Google Scholar] [CrossRef] [Green Version]
- Box, G.E.P. Signal-to-noise ratios, performance criteria and transformation. Technometrics 1998, 30, 1–17. [Google Scholar] [CrossRef]
- Maghsoodloo, S.; Ozdemir, G.; Jordan, V.; Huang, C.-H. Strengths and limitations of Taguchi’s contributions to quality, manufacturing, and process engineering. J. Manuf. Syst. 2004, 23, 73–126. [Google Scholar] [CrossRef]
- Pignatiello, J.J.; Ramberg, J.S. Top ten triumphs and tragedies of Genichi Taguchi. Qual. Eng. 1992, 4, 211–225. [Google Scholar] [CrossRef]
- Stone, R.A.; Veevers, A. The Taguchi influence on designed experiments. J. Chemometr. 1994, 8, 103–110. [Google Scholar] [CrossRef]
- Hamada, M.; Balakrishnan, N. Analyzing unreplicated factorial experiments: A review with some new proposals. Stat. Sin. 1998, 8, 1–41. [Google Scholar]
- Daniel, C. Use of the half-normal plots in interpreting factorial two-level experiments. Technometrics 1959, 1, 311–341. [Google Scholar] [CrossRef]
- Lenth, R.V. Quick and easy analysis of unreplicated factorials. Technometrics 1989, 31, 469–473. [Google Scholar] [CrossRef]
- Box, G.E.P.; Meyer, R.D. An analysis for unreplicated fractional factorials. Technometrics 1986, 28, 11–18. [Google Scholar] [CrossRef]
- Carlson, R.; Nordahl, A.; Barth, T.; Myklebust, R. An approach to evaluating screening experiments when several responses are measured. Chemom. Intell. Lab. Syst. 1991, 12, 237–255. [Google Scholar] [CrossRef]
- Derringer, G.; Suich, R. Simultaneous optimization of several response variables. J. Qual. Technol. 1980, 12, 214–219. [Google Scholar] [CrossRef]
- Saeed, A.A.H.; Harun, N.Y.; Sufian, S.; Bilad, M.R.; Nufida, B.A.; Ismail, N.M.; Zakaria, Z.Y.; Jagaba, A.H.; Ghaleb, A.A.S.; Al-Dhawi, B.N.S. Modeling and Optimization of Biochar Based Adsorbent Derived from Kenaf Using Response Surface Methodology on Adsorption of Cd2+. Water 2021, 13, 999. [Google Scholar] [CrossRef]
- Besseris, G.J. Concurrent multiresponse multifactorial screening of an electrodialysis process of polluted wastewater using robust non-linear Taguchi profiling. Chemom. Intell. Lab. Syst. 2020, 200, 103997. [Google Scholar] [CrossRef]
- Fontdecaba, S.; Grima, P.; Tort-Martorell, X. Analyzing DOE with Statistical Software Packages: Controversies and proposals. Am. Stat. 2014, 68, 205–211. [Google Scholar] [CrossRef]
- R Core Team. R (Version 4.0.5): A Language and Environment for Statistical Computing; R Foundation for Statistical Computing: Vienna, Austria, 2021; Available online: https://www.R-project.org/ (accessed on 25 July 2021).
- Lawson, J. Design and Analysis of Experiments with R; CRC Press: Boca Raton, FL, USA, 2014. [Google Scholar]
- Dilmi, S.; Ladjal, M. A novel approach for water quality classification based on the integration of deep learning and feature extraction techniques. Chemom. Intell. Lab. Syst. 2021, 214, 104329. [Google Scholar] [CrossRef]
- Yu, Y.; Song, X.; Zhang, Y.; Zheng, F. Assessment of Water Quality Using Chemometrics and Multivariate Statistics: A Case Study in Chaobai River Replenished by Reclaimed Water, North China. Water 2020, 12, 2551. [Google Scholar] [CrossRef]
- Díaz-Gonzalez, L.; Uscanga-Junco, O.A.; Rosales-Rivera, M. Development and comparison of machine learning models for water multidimensional classification. J. Hydrol. 2021, 598, 126234. [Google Scholar] [CrossRef]
- Banda, T.D.; Kumarasamy, M. Application of Multivariate Statistical Analysis in the Development of a Surrogate Water Quality Index (WQI) for South African Watersheds. Water 2020, 12, 1584. [Google Scholar] [CrossRef]
- Mamun, M.; Kim, J.Y.; An, K.-G. Multivariate Statistical Analysis of Water Quality and Trophic State in an Artificial Dam Reservoir. Water 2021, 13, 186. [Google Scholar] [CrossRef]
- Abdel-Fattah, M.K.; Abd-Elmabod, S.K.; Aldosari, A.A.; Elrys, A.S.; Mohamed, E.S. Multivariate Analysis for Assessing Irrigation Water Quality: A Case Study of the Bahr Mouise Canal, Eastern Nile Delta. Water 2020, 12, 2537. [Google Scholar] [CrossRef]
- Barclay, J.R.; Tripp, H.; Bellucci, C.J.; Warner, G.; Helton, A.M. Do waterbody classifications predict water quality? J. Environ. Manag. 2016, 183, 1–12. [Google Scholar] [CrossRef] [PubMed] [Green Version]
- Verma, S.P.; Uscanga-Junco, O.A.; Díaz-González, L. A statistically coherent robust multidimensional classification scheme for water. Sci. Total Environ. 2021, 750, 141704. [Google Scholar] [CrossRef] [PubMed]
- Rousseeuw, P.J. Silhouettes: A Graphical Aid to the Interpretation and Validation of Cluster Analysis. Comput. Appl. Math. 1987, 20, 53–65. [Google Scholar] [CrossRef] [Green Version]
- Kruskal, W.H.; Wallis, W.A. Use of ranks in one-criterion variance analysis. J. Am. Stat. Assoc. 1952, 47, 583–621. [Google Scholar] [CrossRef]
Figure 1.
Cluster screening by the silhouette method using group memberships of 2–6 (band maps (A–E)).
Figure 1.
Cluster screening by the silhouette method using group memberships of 2–6 (band maps (A–E)).


Figure 2.
Screening for optimal cluster memberships, n, using estimations of their average silhouette widths (ASW).
Figure 2.
Screening for optimal cluster memberships, n, using estimations of their average silhouette widths (ASW).

Figure 3.
Bump chart of the L9(34) OA with the OCID dataset.

Figure 4.
Cluster screening by the silhouette method using group memberships of 2–6 (A–E) for the testing ED dataset.
Figure 4.
Cluster screening by the silhouette method using group memberships of 2–6 (A–E) for the testing ED dataset.


Figure 5.
Screening for optimal cluster memberships, n, using estimations of their average silhouette widths (ASW) on the testing ED dataset.
Figure 5.
Screening for optimal cluster memberships, n, using estimations of their average silhouette widths (ASW) on the testing ED dataset.

Figure 6.
Bump chart of the L9(34) OA with the OCID dataset for the confirming trials.


Table 1.
Initial cluster assignment and ordinalized re-assignment of the three-characteristic Abu-Shady ED OA-dataset.
Table 1.
Initial cluster assignment and ordinalized re-assignment of the three-characteristic Abu-Shady ED OA-dataset.
| Run # | Cluster ID | Ordinalized Cluster ID (OCID) |
|---|---|---|
| 1 | 3 | 2 |
| 2 | 3 | 2 |
| 3 | 2 | 3 |
| 4 | 3 | 2 |
| 5 | 2 | 3 |
| 6 | 3 | 2 |
| 7 | 1 | 1 |
| 8 | 1 | 1 |
| 9 | 1 | 1 |
Table 2.
Clustered descriptive statistics for the individual characteristics according to the three-member Silhouette method.
Table 2.
Clustered descriptive statistics for the individual characteristics according to the three-member Silhouette method.
| Variable | Cluster ID | Mean | SE Mean | Median |
|---|---|---|---|---|
| RS | 1 | 1.75 | 1.67 | 0.08 |
| 2 | 13.41 | 2.42 | 13.41 | |
| 3 | 5.73 | 0.81 | 5.75 | |
| SAR | 1 | 6.91 | 0.18 | 6.87 |
| 2 | 5.33 | 0.23 | 5.33 | |
| 3 | 5.83 | 0.15 | 5.86 | |
| SSP | 1 | 70.34 | 0.98 | 70.75 |
| 2 | 62.29 | 2.37 | 62.29 | |
| 3 | 64.45 | 1.18 | 64.66 |
Table 3.
Initial cluster assignment and ordinalized re-assignment of the three-characteristic Abu-Shady electrodialysis (ED) testing OA-dataset.
Table 3.
Initial cluster assignment and ordinalized re-assignment of the three-characteristic Abu-Shady electrodialysis (ED) testing OA-dataset.
| Run # | Cluster ID | Ordinalized Cluster ID (OCID) |
|---|---|---|
| 1 | 3 | 3 |
| 2 | 3 | 3 |
| 3 | 3 | 3 |
| 4 | 1 | 2 |
| 5 | 1 | 2 |
| 6 | 1 | 2 |
| 7 | 1 | 2 |
| 8 | 2 | 1 |
| 9 | 1 | 2 |
Table 4.
Clustered descriptive statistics for the individual characteristics according to the three-member Silhouette method.
Table 4.
Clustered descriptive statistics for the individual characteristics according to the three-member Silhouette method.
| Variable | Cluster ID | Mean | SE Mean | Median |
|---|---|---|---|---|
| RS | 1 | 54.20 | 2.61 | 54.70 |
| 2 | 26.92 | - | 26.92 | |
| 3 | 80.04 | 0.88 | 80.26 | |
| SAR | 1 | 2.83 | 0.21 | 2.89 |
| 2 | 4.70 | - | 4.70 | |
| 3 | 1.36 | 0.084 | 1.42 | |
| SSP | 1 | 45.26 | 2.31 | 43.91 |
| 2 | 58.76 | - | 58.76 | |
| 3 | 31.01 | 1.89 | 32.58 |
Publisher’s Note: MDPI stays neutral with regard to jurisdictional claims in published maps and institutional affiliations. |
© 2021 by the author. Licensee MDPI, Basel, Switzerland. This article is an open access article distributed under the terms and conditions of the Creative Commons Attribution (CC BY) license (https://creativecommons.org/licenses/by/4.0/).
Share and Cite
MDPI and ACS Style
Besseris, G. Micro-Clustering and Rank-Learning Profiling of a Small Water-Quality Multi-Index Dataset to Improve a Recycling Process. Water 2021, 13, 2469. https://doi.org/10.3390/w13182469
AMA Style
Besseris G. Micro-Clustering and Rank-Learning Profiling of a Small Water-Quality Multi-Index Dataset to Improve a Recycling Process. Water. 2021; 13(18):2469. https://doi.org/10.3390/w13182469
Chicago/Turabian StyleBesseris, George. 2021. "Micro-Clustering and Rank-Learning Profiling of a Small Water-Quality Multi-Index Dataset to Improve a Recycling Process" Water 13, no. 18: 2469. https://doi.org/10.3390/w13182469
Note that from the first issue of 2016, this journal uses article numbers instead of page numbers. See further details here.