
Different Mercury Species Partitioning and Distribution in the Water and Sediment of a Eutrophic Estuary in Northern Taiwan

Department of Marine Environmental Informatics, College of Marine Science and Resource, National Taiwan Ocean University, Keelung 202, Taiwan
*
Author to whom correspondence should be addressed.
Water 2021, 13(18), 2471; https://doi.org/10.3390/w13182471
Submission received: 29 July 2021
/
Revised: 27 August 2021
/
Accepted: 31 August 2021
/
Published: 8 September 2021
(This article belongs to the Special Issue The Geochemical Behavior of Trace Elements in Inshore Environments)
Abstract
:The total Hg and methyl Hg in waters and sediments, as well as particulate total Hg (PTHg), were analyzed to study their distribution and partitioning in the Danshuei River Estuary (DRE), northern Taiwan. TOC and grain size were also determined in the sediment samples. The dissolved total Hg (DTHg) in waters ranged from 24.0 to 45.8 ng/L. The dissolved methyl Hg (DMeHg) concentrations contributed 0.6–30.4% of the DTHg pool, with the higher percentage appearing in the upper estuary. The DMeHg concentration positively correlated with the Chl.a within the estuary, suggesting that phytoplankton plays an important role in influencing the DMeHg concentration. The partitioning results indicated that DTHg chiefly dominates the THg (DTH + PTHg) pool, especially at a salinity of >15 psu region. The value of partition coefficient, log(KD), was within a range of 3.54 to 4.68, and the value linearly decreased with increasing salinity. The sediment total Hg (STHg) concentrations ranged from 80 to 379 ng/g, and most data exceeded the NOAA guidelines value (ERL < 150 ng/g), indicating that the DRE is contaminated with Hg. The STHg concentrations inversely and positively correlated with the grain size and TOC content, respectively, suggesting that sediment Hg distributions are strongly influenced by the both parameters.
1. Introduction
Mercury ranks as one of the most toxic among the trace metals present in the aquatic environment [1]. Mercury is released and mobilized through natural processes, mainly from mineral weathering, forest fires and degassing of the earth’s crust. Anthropogenic mercury sources include artisanal gold mining, Hg mines, coal combustion and Hg-contaminated effluent discharged from specific chemical industries which is ultimately transported into the marine environment [2,3]. Inshore mercury pollution caused a huge disaster throughout the food chain in Minamata Bay, Japan, during the 1950–1970 period [4]. This resulted in mercury becoming one of the most critical trace metals examined in environmental studies [1,5]. The geochemistry of Hg in the marine environment, especially in estuary and inshore areas, is complicated because of the characteristics of the element [6,7,8,9,10,11]. Mercury occurs in three valency states (0, +1 and +2); divalent Hg is commonly present in oxidized water and sediment in the marine environment [12]. The most striking phenomenon of Hg among the metal elements is that Hg (0) in the water column can exist in the gas phase and escape into the atmosphere, allowing it to be transported far from the source [13,14]. Mercury ions have high affinity with particles and can be adsorbed into the water column [10,15,16]. Mercury ions easily form stable complexes with Cl−, such as HgCl2−, HgCl3−, HgCl4−2, under Cl− enriched solution, which generally leads to increased Hg solid phase dissolution [2,17,18]. In addition, mercury easily forms organic-Hg complexes with dissolved organic matter due to its very high stability constants with organic ligands [19,20]. Methylated Hg is of particular concern because methylmercury (MeHg) (which caused the Minamata Bay tragedy) is a neurotoxin that can bio-accumulate and bio-magnify in the food web [4,5]. MeHg is commonly detected in the water column and sediment, especially in anoxic sediment [8,9,10,11,16], because anoxic bacteria, such as iron/sulfate reducing bacteria, are responsible for converting inorganic Hg+2 into MeHg [21,22]. Methylmercury formation in the aquatic environment is rather complicated, and is influenced by many environmental factors, such as temperature, pH, redox potential, the structure of the bacterial community and the presence of inorganic and organic complexing agents [2,12,21,23]. Phytoplankton seem to play an important role in regulating the MeHg content in seawater because MeHg concentrations in phytoplankton can be 100,000 times higher than that in seawater [24,25]. The biological effect further complicates Hg geochemistry in the estuarine environment [26,27,28,29].
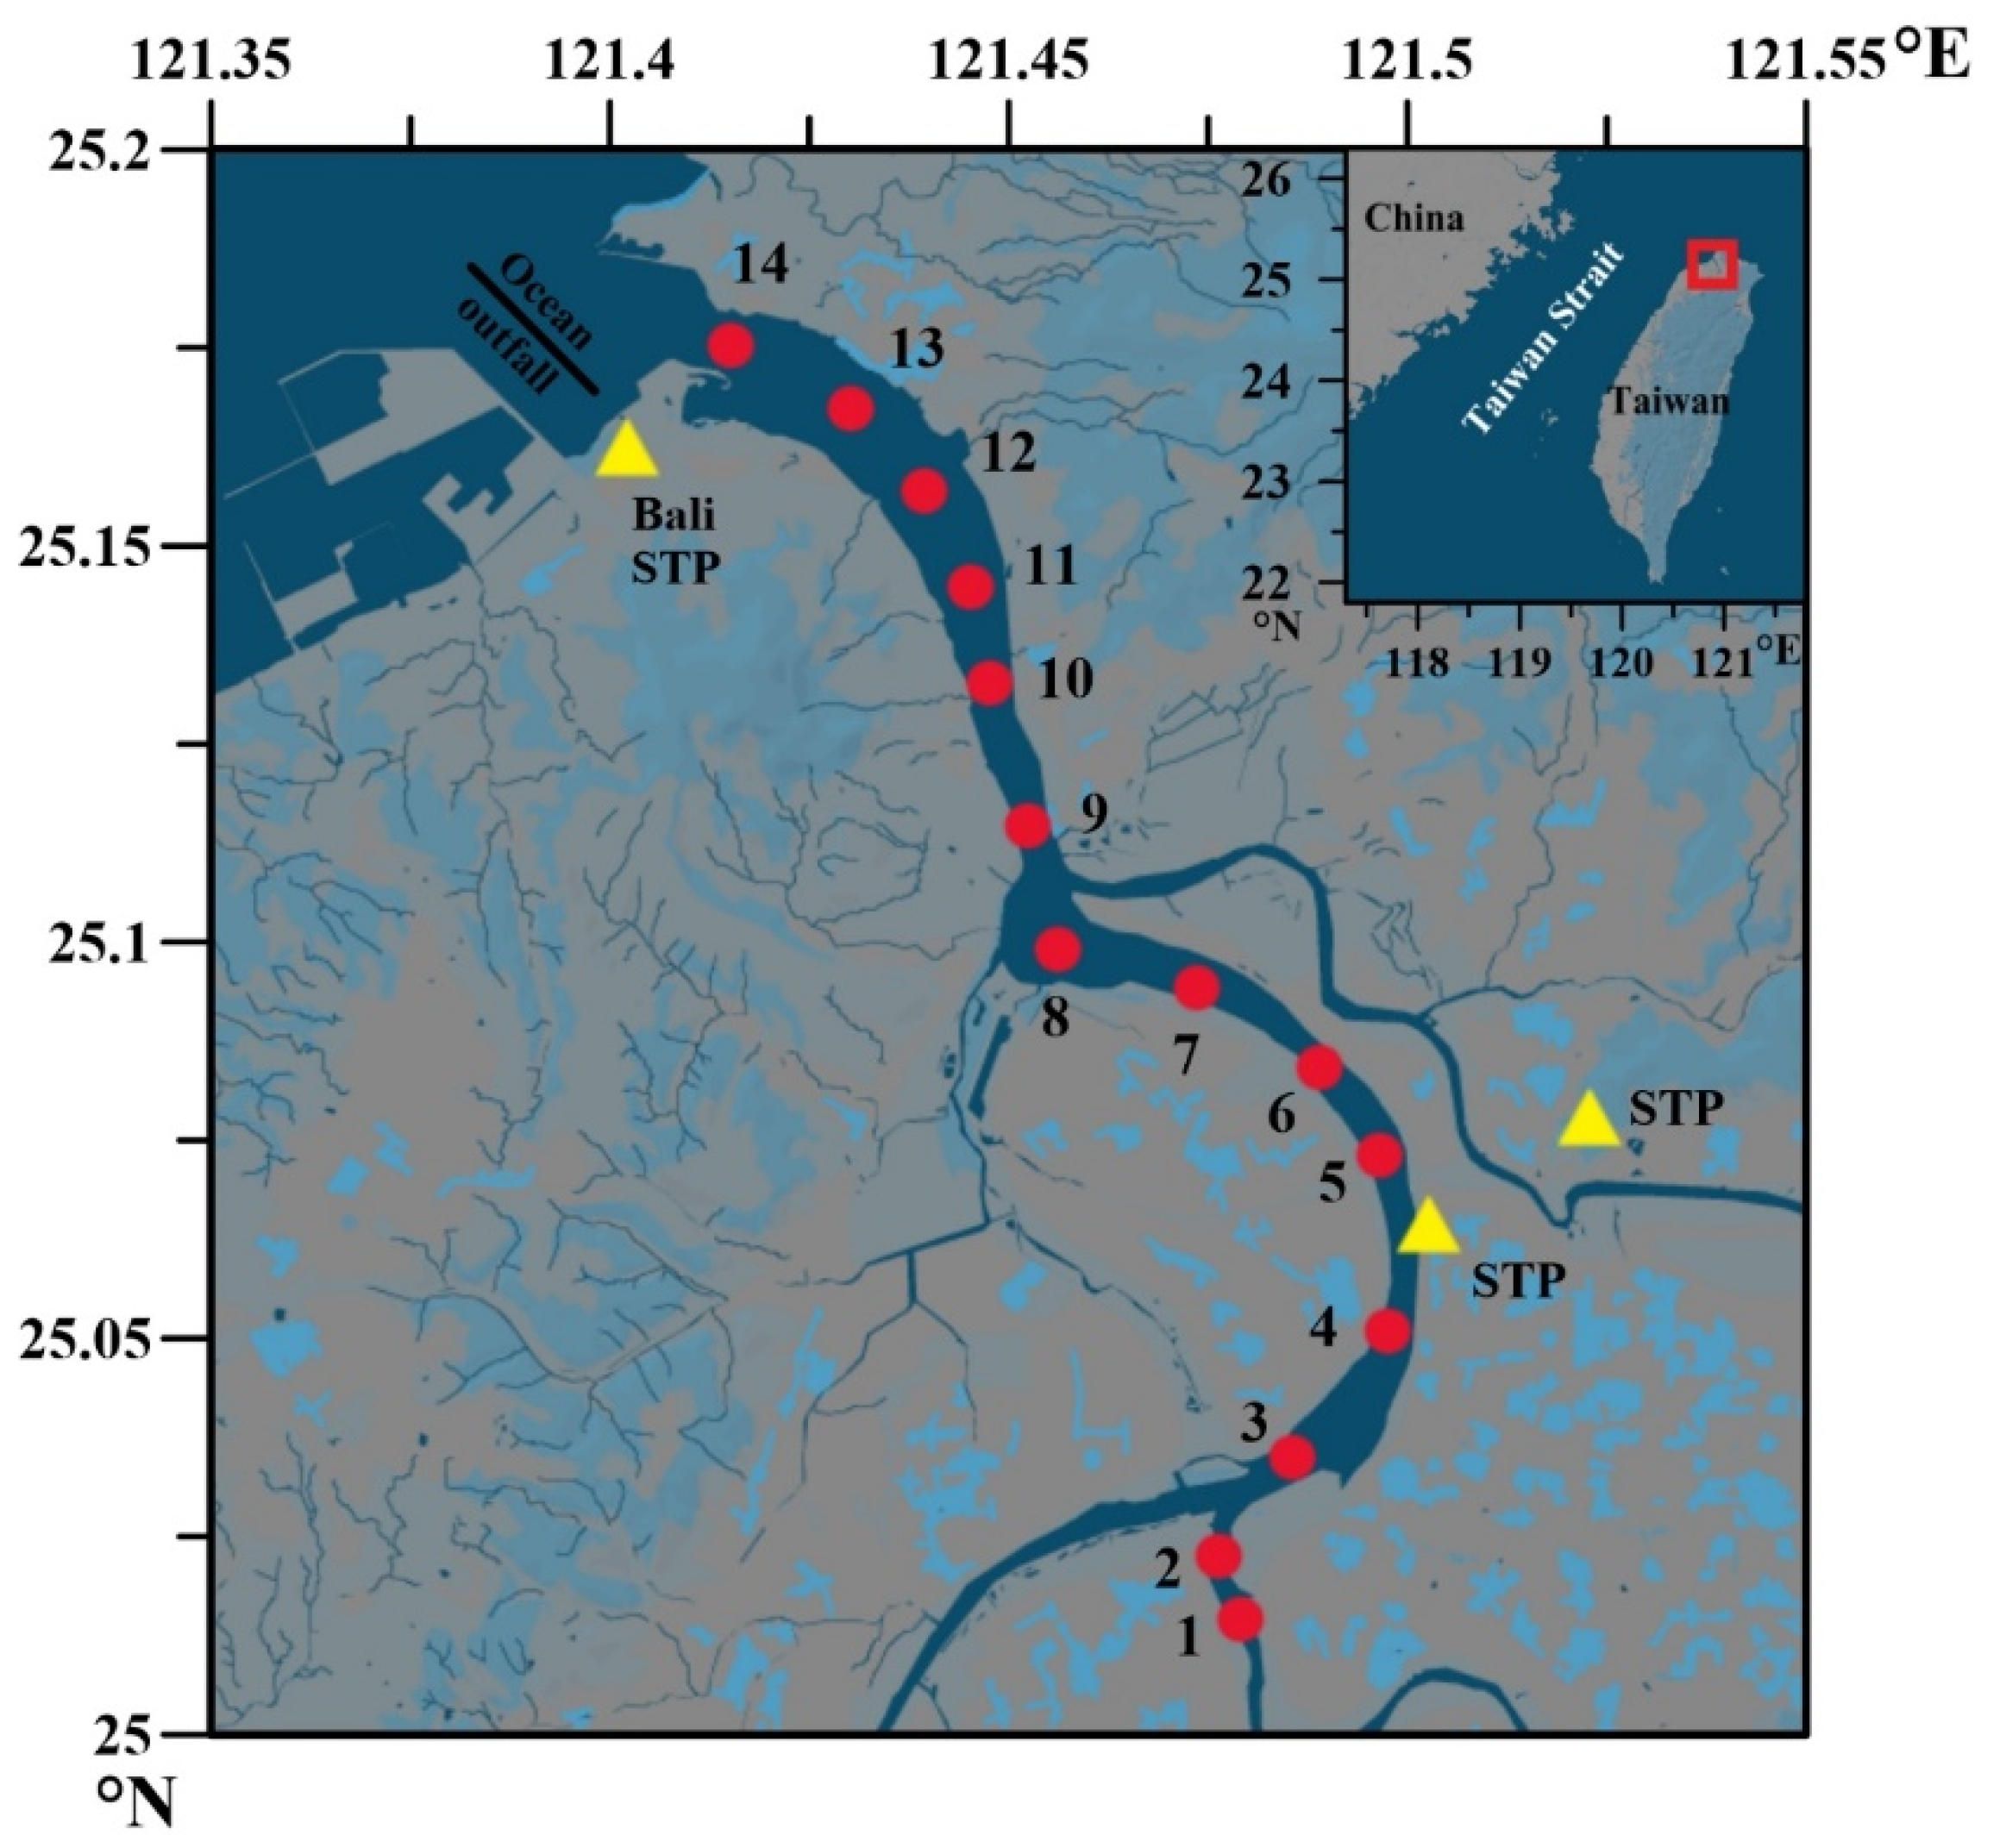
The Danshuei River Estuary (DRE), the largest in northern Taiwan, located on the outskirts of Taipei, is impacted by treated and untreated domestic sewage effluent discharge and is the subject area of this study. The DRE is seriously polluted by nutrients and trace metals [30,31]. As a result, the upper DRE estuary contains relatively higher total dissolved nitrogen (>500 μm), mainly in the form of ammonium, and phosphorus (>10 μm) concentrations. Nutrient pollution causes phytoplankton blooms and relatively higher chl.a concentrations (>40 μg/L) that are commonly detected in the hypoxic upper estuary [32,33]. Historically, domestic sewage is a significant source of Hg in the aquatic environment. The element enters domestic sewage from a variety of sources, such as effluents from chlor-alkali synthesis, the wood pulping industry, electrical equipment (thermometers, barometers, batteries, switch gears, fluorescent lamps), hospital and dental waste, paints, fertilizers, pharmaceuticals and agricultural chemicals [34]. Recent studies have indicated that municipal raw sewage contains dissolved total Hg (DTHg) at an average concentration of approximately 310 ± 239 ng/L [34]. The corresponding value is as high as 3400 ± 2600 ng/L in developing countries such as China, with approximately 95% of the total Hg in the influent sewage efficiently converted into sewage sludge. The DTHg concentration therefore reduces to 160 ± 130 ng/L in effluent sewage [35]. However, the DTHg concentration in effluent sewage is still one to two orders of magnitude higher than that in the marine environment [2,3]. Thus, municipal sewage is a major source of the anthropogenic Hg which reaches the marine environment [35,36]. This phenomenon has also been observed in the inshore off the DRE, because Taipei’s largest sewage treatment plant (STP), i.e., the Bali STP, is located on the west bank of the Danshuei estuary mouth. The primarily treated effluent is discharged into the coastal seawater off the DRE mouth through an ocean outfall pipe. The dissolved total Hg concentration detected in seawater around the ocean outfall pipe area ranged from 21 to 177 ng/L, while the values reduced to 6–80 ng/L in seawater outside the DRE mouth. It is also estimated that the annual discharge of total Hg (dissolved plus particulate Hg) from effluent is approximately 428 ± 200 kg/year [37]. However, study of the geochemical behavior of Hg within the DRE is very limited, with most studies focusing on nutrients and trace metals [31,32,33,34]. In order to better understand the impact of the effluents of the STPs located in the upper estuary of DRE and the Bali STP, as well as of the geochemical behavior of Hg within the DRE, this work presents a study of the distribution, speciation transformation and partition of Hg within the DRE by analyzing different Hg species, including the total Hg and methyl Hg in water and sediment samples. Particulate total Hg (PTHg) in water samples was also analyzed. The Fe and Mn in particles and sediments, as well as grain size and TOC content in sediment, were analyzed in order to understand the interactions between Hg, Fe, Mn and C. It is well documented that the geochemical behavior of Hg in the estuary is influenced by many factors, such as ionic strength, adsorption/desorption from particles, interaction with DOC, redox potential and phytoplankton, as mentioned above.
2. Sampling and Methods
2.1. Study Area
A detailed description of the morphology, the catchment area, the hydrodynamics and the various qualities of the water in the DRE can be found elsewhere [31,32,38]. A brief description of the study area is given below. The drainage area of the DRE is 2726 km2 and six million people, i.e., over a quarter of Taiwan’s entire population, reside around the Danshuei River system. Three sewage treatment plants (STP) are located in the river estuary system (Figure 1). The largest, i.e., the Bali STP, with daily sewage treatment of approximately 1.05 × 10⁶ m3/day, is located outside the west bank of the Danshuei estuary mouth. The treated effluent is discharged into the seawater through an ocean outfall pipe. Two other STPs are located on the upper estuary, and treated effluent is discharged into the river. These two STPs have daily sewage treatment of approximately 5.8 × 10⁵ m3/day. The average concentrations of dissolved oxygen, SPM and ammonium in the discharge effluent are 1.8 mg/L, 11.7 mg/L and 5.0 mg/L, respectively [39]. Due to the discharge of municipal waste water over a long period of time, there is a long record of nutrient pollution in the DRE [31]. According to a survey of water quality data in the catchment area of the Danshuei River carried out by the EPA, Taiwan (https://wq.epa.gov.tw/EWQP/zh/ConService/DownLoad/HistoryData.aspx, accessed on 27 August 2021) the total dissolved inorganic nitrogen (TDIN) and total dissolved phosphorus (TDP) concentrations observed at the three stations located in the main tributaries of the DRE ranged from 49 to 774 μm (average 240 μm) and 0.65 to 222 μm (average 15 μM) during the period of 2002–2016 [33]. Relatively higher ammonium (>500 μM) and dissolved phosphate (>10 μm) concentrations can now be commonly detected in the upper estuary, where hypoxia and dissolved oxygen increases in correlation with increasing salinity due to the mixing of the outflow with intruding seawater [32,33]. Water quality data regarding Hg in the catchment area of the Danshuei River are not available as all values are typically lower than the detection limit, i.e., <150 ng/L (https://wq.epa.gov.tw/EWQP/zh/ConService/DownLoad/HistoryData.aspx, accessed on 27 August 2021). In addition, the DRE has also been mildly polluted with trace metals since 1980, when the economy began to undergo a period of intense development [40]. However, trace metal contamination gradually decreased, mostly due to the introduction of regulations in the Taipei metropolitan area [30].
2.2. Sampling
The DRE estuarine surface waters were collected on 3 January, 25 March and 16 July, 2020 by employing a small fishing boat. The sampling stations are located in the tidal area of the estuarine system (Figure 1). The estuarine water samples were collected by hand using a 2.5-L Go-Flo bottle at a depth of about 1 m. One portion of the collected water was placed in a dissolved oxygen (DO) bottle and the mixture reagent (MnCl2/NaOH/NaI) was added immediately to pickle the DO sample [41]. Afterwards, the collected water was split into three other clean bottles. One was for the measurements of pH, salinity, dissolved silicate and Chl.a concentration. The remaining two samples were stored in acid cleaned 1-L Nalgene polyethylene terephthalate bottles (PET). The PET bottles were rigorously cleaned prior to use by soaking in a detergent solution followed by a mixture consisting of 50% (v/v) hydrochloric acid and 50% (v/v) nitric acid. The surficial sediment samples were also collected using a grabber and placed in clean plastic bags after finishing water collection. In order to minimize changes in Hg species in the samples over time, the collected samples were immediately stored in an icebox on the boat. All sampling operations were completed within 4 h in each survey. The samples were returned to the laboratory as soon as possible.
The Chl.a samples were filtered using a Whatman GF/F filter (25 mm). The filtrates were analyzed for pH, salinity and dissolved silicate, and the filters were examined for Chl.a concentration. Analyses of these parameters were completed within 48 h after returning to the laboratory. The water samples for Hg measurement were filtered using an acid-cleaned Nuclepore membrane (0.45 μm) under a laminar flow hood prior to analysis. The filtered samples were analyzed for the dissolved total Hg (DTHg) and MeHg (DMeHg). The filtered samples for the measurement of DTHg were stored in Teflon bottles into which a BrCl solution was immediately added to oxidize the organic Hg into inorganic Hg for 24 h at room temperature. The DMeHg samples were stored in PET bottles in a refrigerator. Analyses of DTHg and DMeHg were completed within 72 h after returning to the laboratory. The suspended particulate matter (SPM) loaded filters were dried to constant weight in a flow hood at room temperature. The SPM was obtained from the difference in filter weight before and after filtration. The SPM loaded filters were analyzed for the particulate Hg concentration.
The sediment sample in each station was divided into three portions in the laboratory. One of the untreated samples was directly analyzed for grain size. Another was freeze-dried for 5 days using a freeze drier instrument. Afterwards, the dried sediment samples were ground with a mortar and pestle and stored in clean sealed PVC bags in a freezer until analysis.
2.3. Analysis
Dissolved oxygen was determined using a colorimetric method [41]. Salinity and pH were determined using a salinity meter (Suntex SC-110) and pH meter (Sartorius PB-10). The filters for chlorophyll-a measurements were extracted in 10 mL 90% HPLC-grade acetone, following a method described by Strickland and Parsons [42]. Dissolved silicate was analyzed using a method described in [43]. DTHg and DMeHg concentrations in the estuarine waters were analyzed using USA EPA Methods 1631 [44] and 1630 [45], respectively, as well as the cold vapor atomic fluorescence spectroscopy (CVAFS) method, which employed an atomic fluorescence spectrophotometer (Brooks Rand Model III, Brooks Rand Instruments, Seattle, WA, USA) to determine the Hg concentration. The MeHg distillation system (Brooks Rand Model III, Brooks Rand Instruments, USA) was used to distill the MeHg in the samples prior to determining the Hg concentration. In order to understand the DTHg and DMeHg analytical quality in the water sample, simultaneous DTHg and DMeHg evaluations in seawater were performed using the spiked method. The DTHg and DMeHg spiked concentrations were 50 ng/L and 2 ng/L, respectively. The DTHg and DMeHg analytical recoveries in the spiked seawater were 89.95 ± 3.86% and 96.50 ± 9.33% (n = 6), respectively, suggesting that the analytical quality was reliable.
The total Hg concentrations in the particulate and sediment samples were determined using the USA EPA Method 7474 [46]. The analytical procedure was slightly modified but similar to the method described in [47]. The Fe and Mn concentrations were also determined for both extracted solutions using flame or furnace atomic absorption spectrophotometry employing the Perkin Elmer Analyst 900. A detailed description of the total Hg analytical procedure can be found in [48]. The MeHg concentration in the sediment sample was determined using the NIEA Method S341.60B (Taiwan, EPA), which refers to the method published by Hintelmann [49], who used the H2SO4/KBr/CuSO4 mixture as the attacking reagent to chemically extract MeHg from a sediment sample. The analytical procedure is briefly described below. Approximately 0.5 g of the dried sample was placed in a 50 mL PP centrifuge tube and a 5ml mixture reagent (H2SO4 and KBr) and 1 mL CuSO4 reagent were added to extract the MeHg at room temperature for 1 h. Afterward, 10 mL CH2Cl2 was added to the PP centrifuge tube and awaited for 1 h. The samples were then shaken vigorously in a shaker for 1 h. Afterwards, the sample was centrifuged at 3000 rpm for 10 min, and 2 mL of the CH2Cl2 chemical in the bottom layer of the tube was extracted using an autopipette and placed into a clean PP tube. Then, 40 mL Milli-Q water was added to the MeHg extraction PP tube and the tube was heated in a water bath at 50 °C for 4 h to remove the CH2Cl2. After cooling, the extracted solution was diluted to 40 mL with Milli-Q water and the MeHg concentration was determined in the solution using the same analytical procedure as that for the water sample without the distillation procedure.
The dried sediments were also analyzed for total organic carbon (TOC) using a Horbia carbon analyzer 8210 after smoking with concentrated HCl acid in a closed container for 48 h to remove inorganic C. The detailed TOC analytical procedure can be found in Fang and Hong [50]. The sediment grain size measurement was based on the analytical method published by Folk [51]. The grain size in each sample was divided into four fractions: medium sand (MS > 177 μm); fine sand (FS, 125–177 μm); very fine sand (VFS, 63–125 μm) and mud (<63 μm). In order to evaluate the analytical accuracy of the total Hg concentration in the sediment sample, simultaneous total Hg determination in the MESS-3 reference material (from the National Research Council, Ottawa, ON, Canada) was performed using the same analytical procedure. The analytical concentration was 0.092 ± 0.0033 mg/kg (n = 6), and the analytical accuracy was 101.16 ± 3.62%, suggesting that the analytical quality was reliable.
3. Results
3.1. pH, DO, SPM, Chl.a, Silicate
The values obtained in the three surveys are plotted in Figure 2, which shows that the pH (7.38–8.21) and DO (1.61–7.72 mg/L) values gradually increased with increasing salinity due to the river water mixing with seawater. The DO values at the upper estuary, salinity < 5 psu region, during the 25 March survey revealed a hypoxic condition, agreeing with previous studies which indicated that the upper DRE estuary always exhibits hypoxic conditions because of pollution with the treated/untreated domestic wastewater discharge. The DO values gradually increased with increasing salinity due to the intrusion of oxic seawater [31,32]. The SPM concentrations (6.70–56.8 mg/L) within the DRE were not significant and varied to minor degrees in the different surveys. The Chl.a concentrations (0.70–55.1 μg/L) within the DRE generally exhibited a decrease with increasing salinity and showed minor variations across the three surveys. The Chl.a concentration in the upper DRE estuary generally remained at a relatively higher concentration, i.e., >30 μg/L, probably due to enrichment with nutrients [31,32,33]. The silicate concentration in the DRE ranged from 10.6 to 187.9 μm across the three surveys, and exhibited fairly conservative behavior, suggesting there was no major removal or introduction of silicate during river water and seawater mixing within the estuarine system.
3.2. Dissolved Hg and Particulate Hg, Fe and Mn
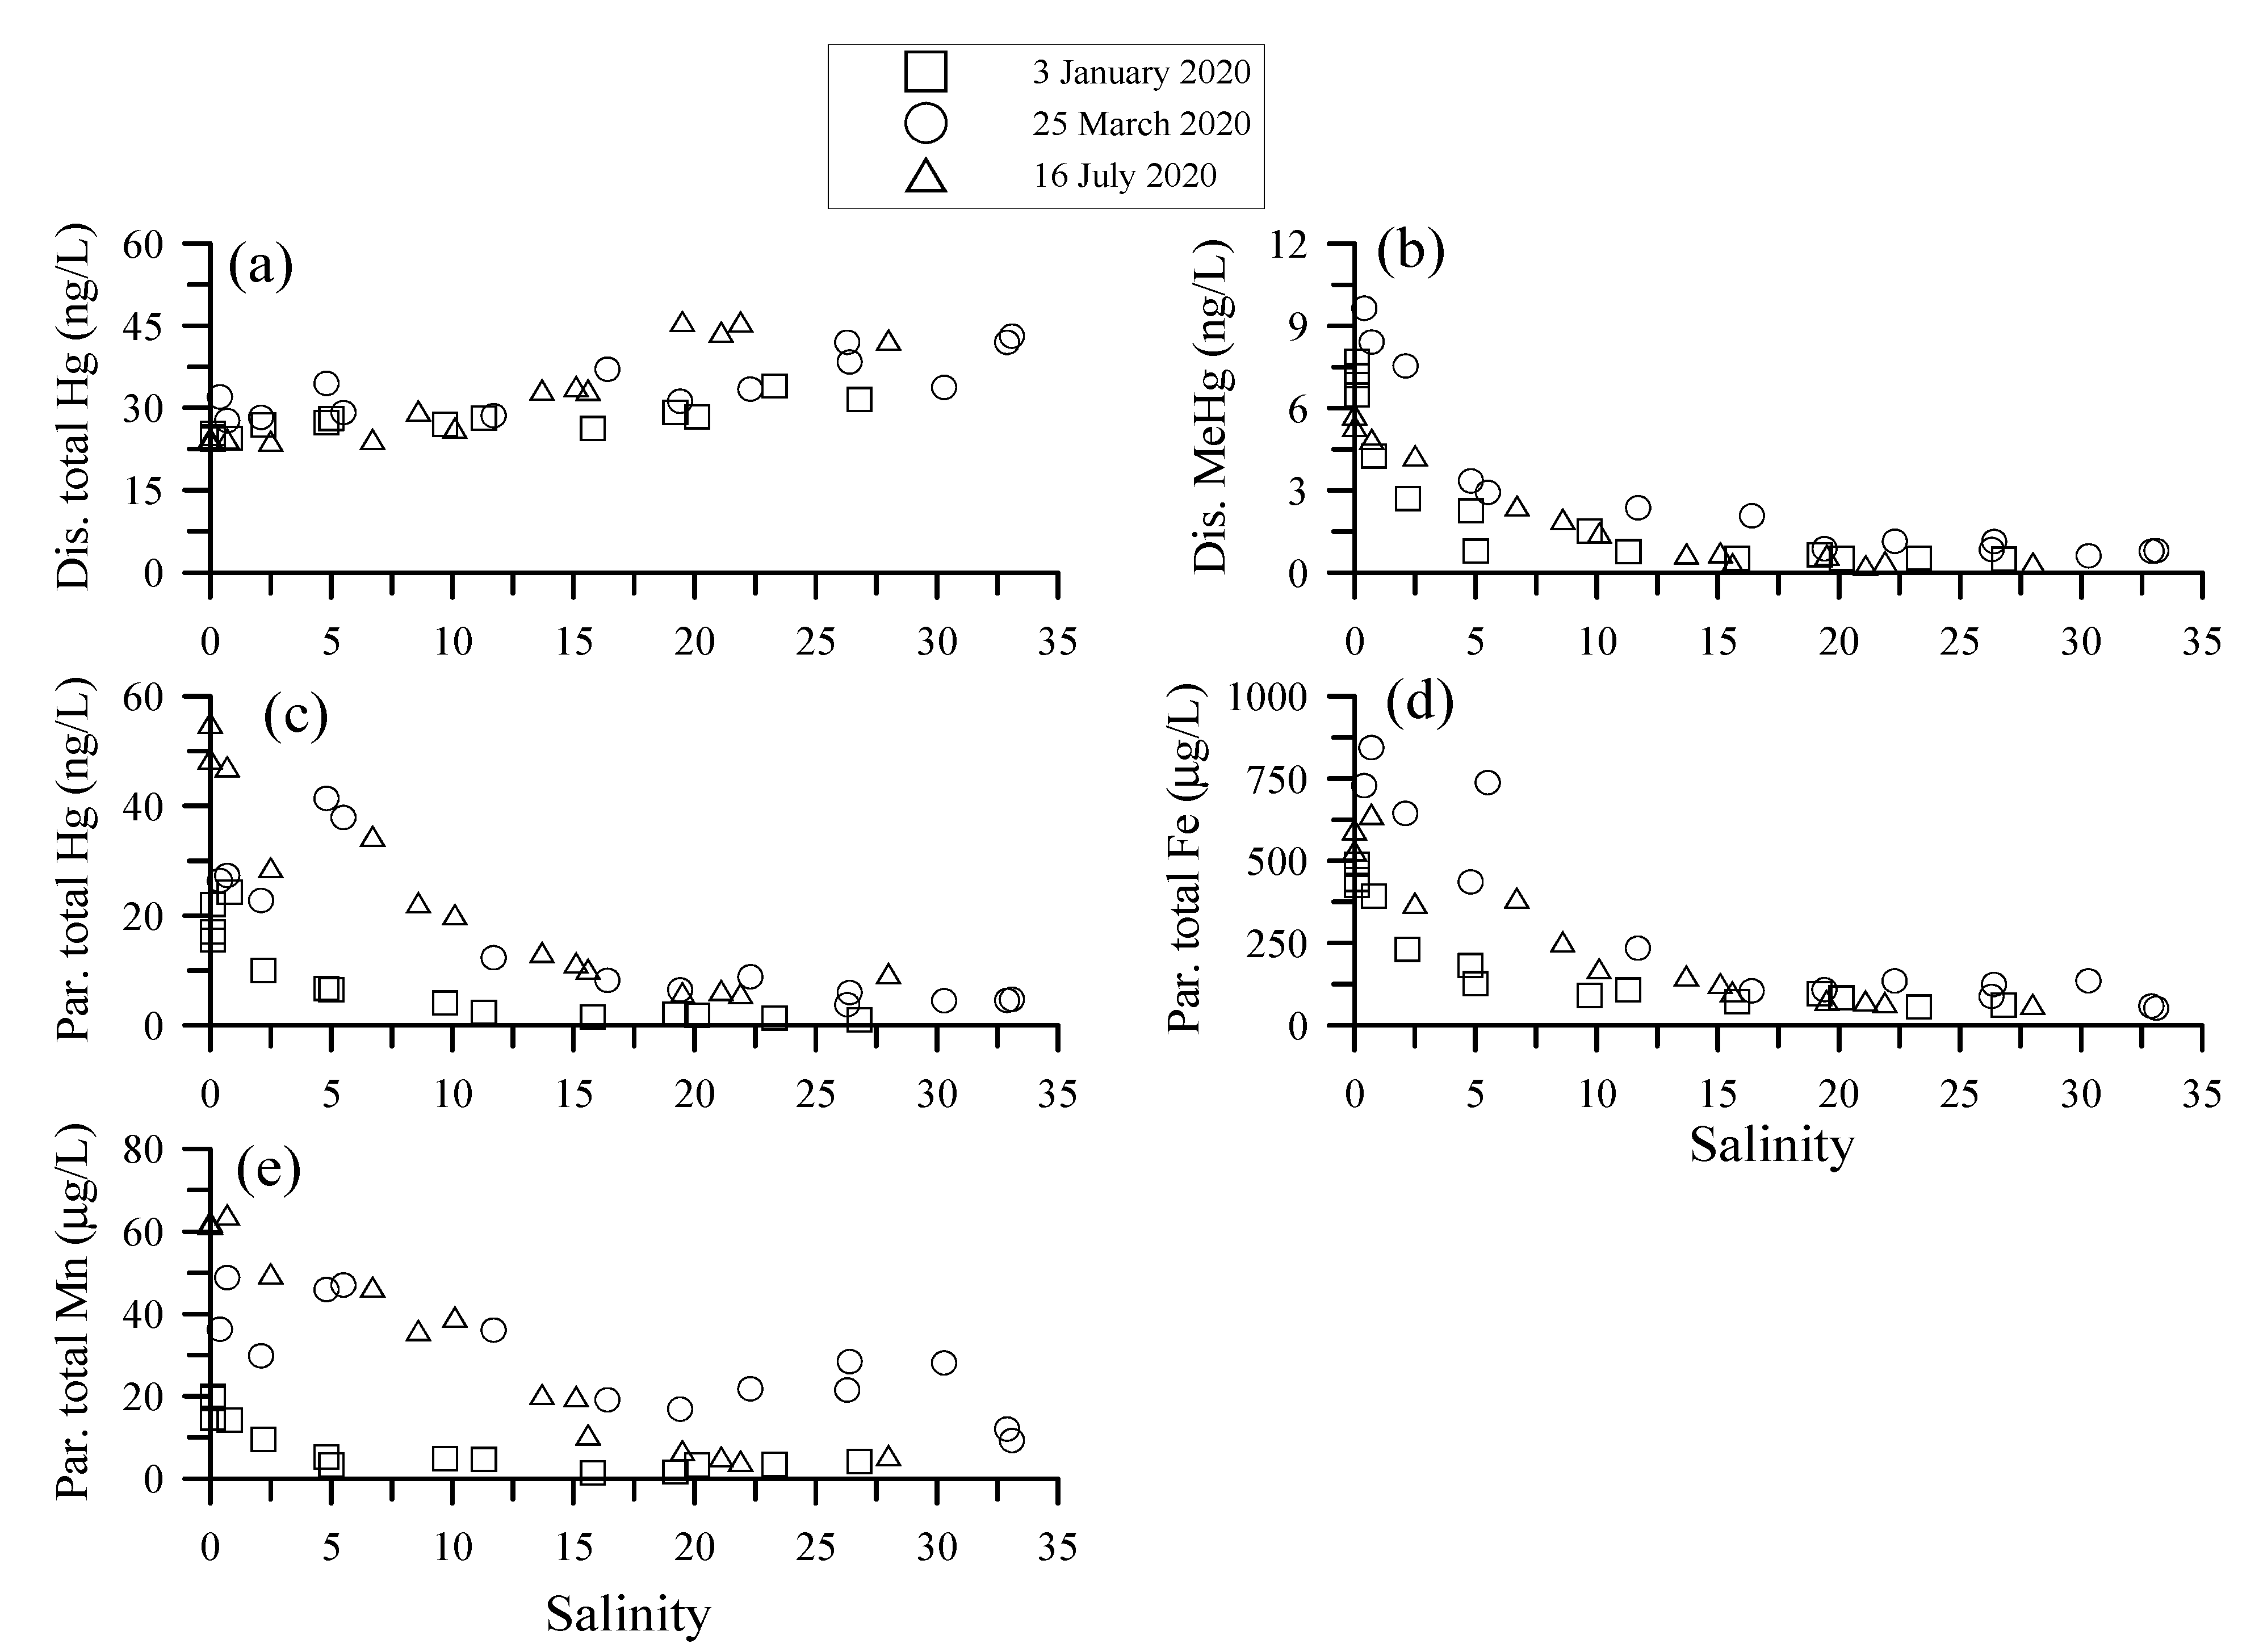
The DTHg, DMeHg and particulate total HG (PTHg) concentration ranges within the DRE obtained in the three surveys are listed in Table 1. Their concentrations against salinity are plotted in Figure 3. The DTHg and DMeHg concentrations within the DRE ranged from 24.0 to 45.8 ng/L and 0.27 to 9.64 ng/L, respectively, and both concentrations obtained in the different surveys varied only a little. The DTHg distributions exhibited a slight increase with increasing salinity. A higher DMeHg concentration (3.0–9.6 ng/L) appeared in the salinity < 1 psu region, while the concentration dropped significantly in the salinity 1–5 psu region. Afterwards, the DMeHg concentration remained slightly lower with increasing salinity.
The particulate total Hg (PTHg), Fe (PTFe) and Mn (PTMn) concentrations within the DRE ranged from 1.02 to 55.13 ng/L, 52.5 to 843.7 μg/L and 1.43 to 64.4 μg/L, respectively. Their estuarine distributions are plotted in Figure 3. The PTHg concentration generally decreased with increasing salinity but exhibited a little scattering. The PTFe concentration showed a significant decrease within salinity < 10 psu; afterwards, the concentration gradually decreased with increasing salinity. In contrast, the PTMn distribution exhibited a little scattering and varied among the different surveys. Overall, the PTMn estuarine distribution also showed that the concentration decreased moving seaward.
3.3. Sediment Grain Sizes and TOC
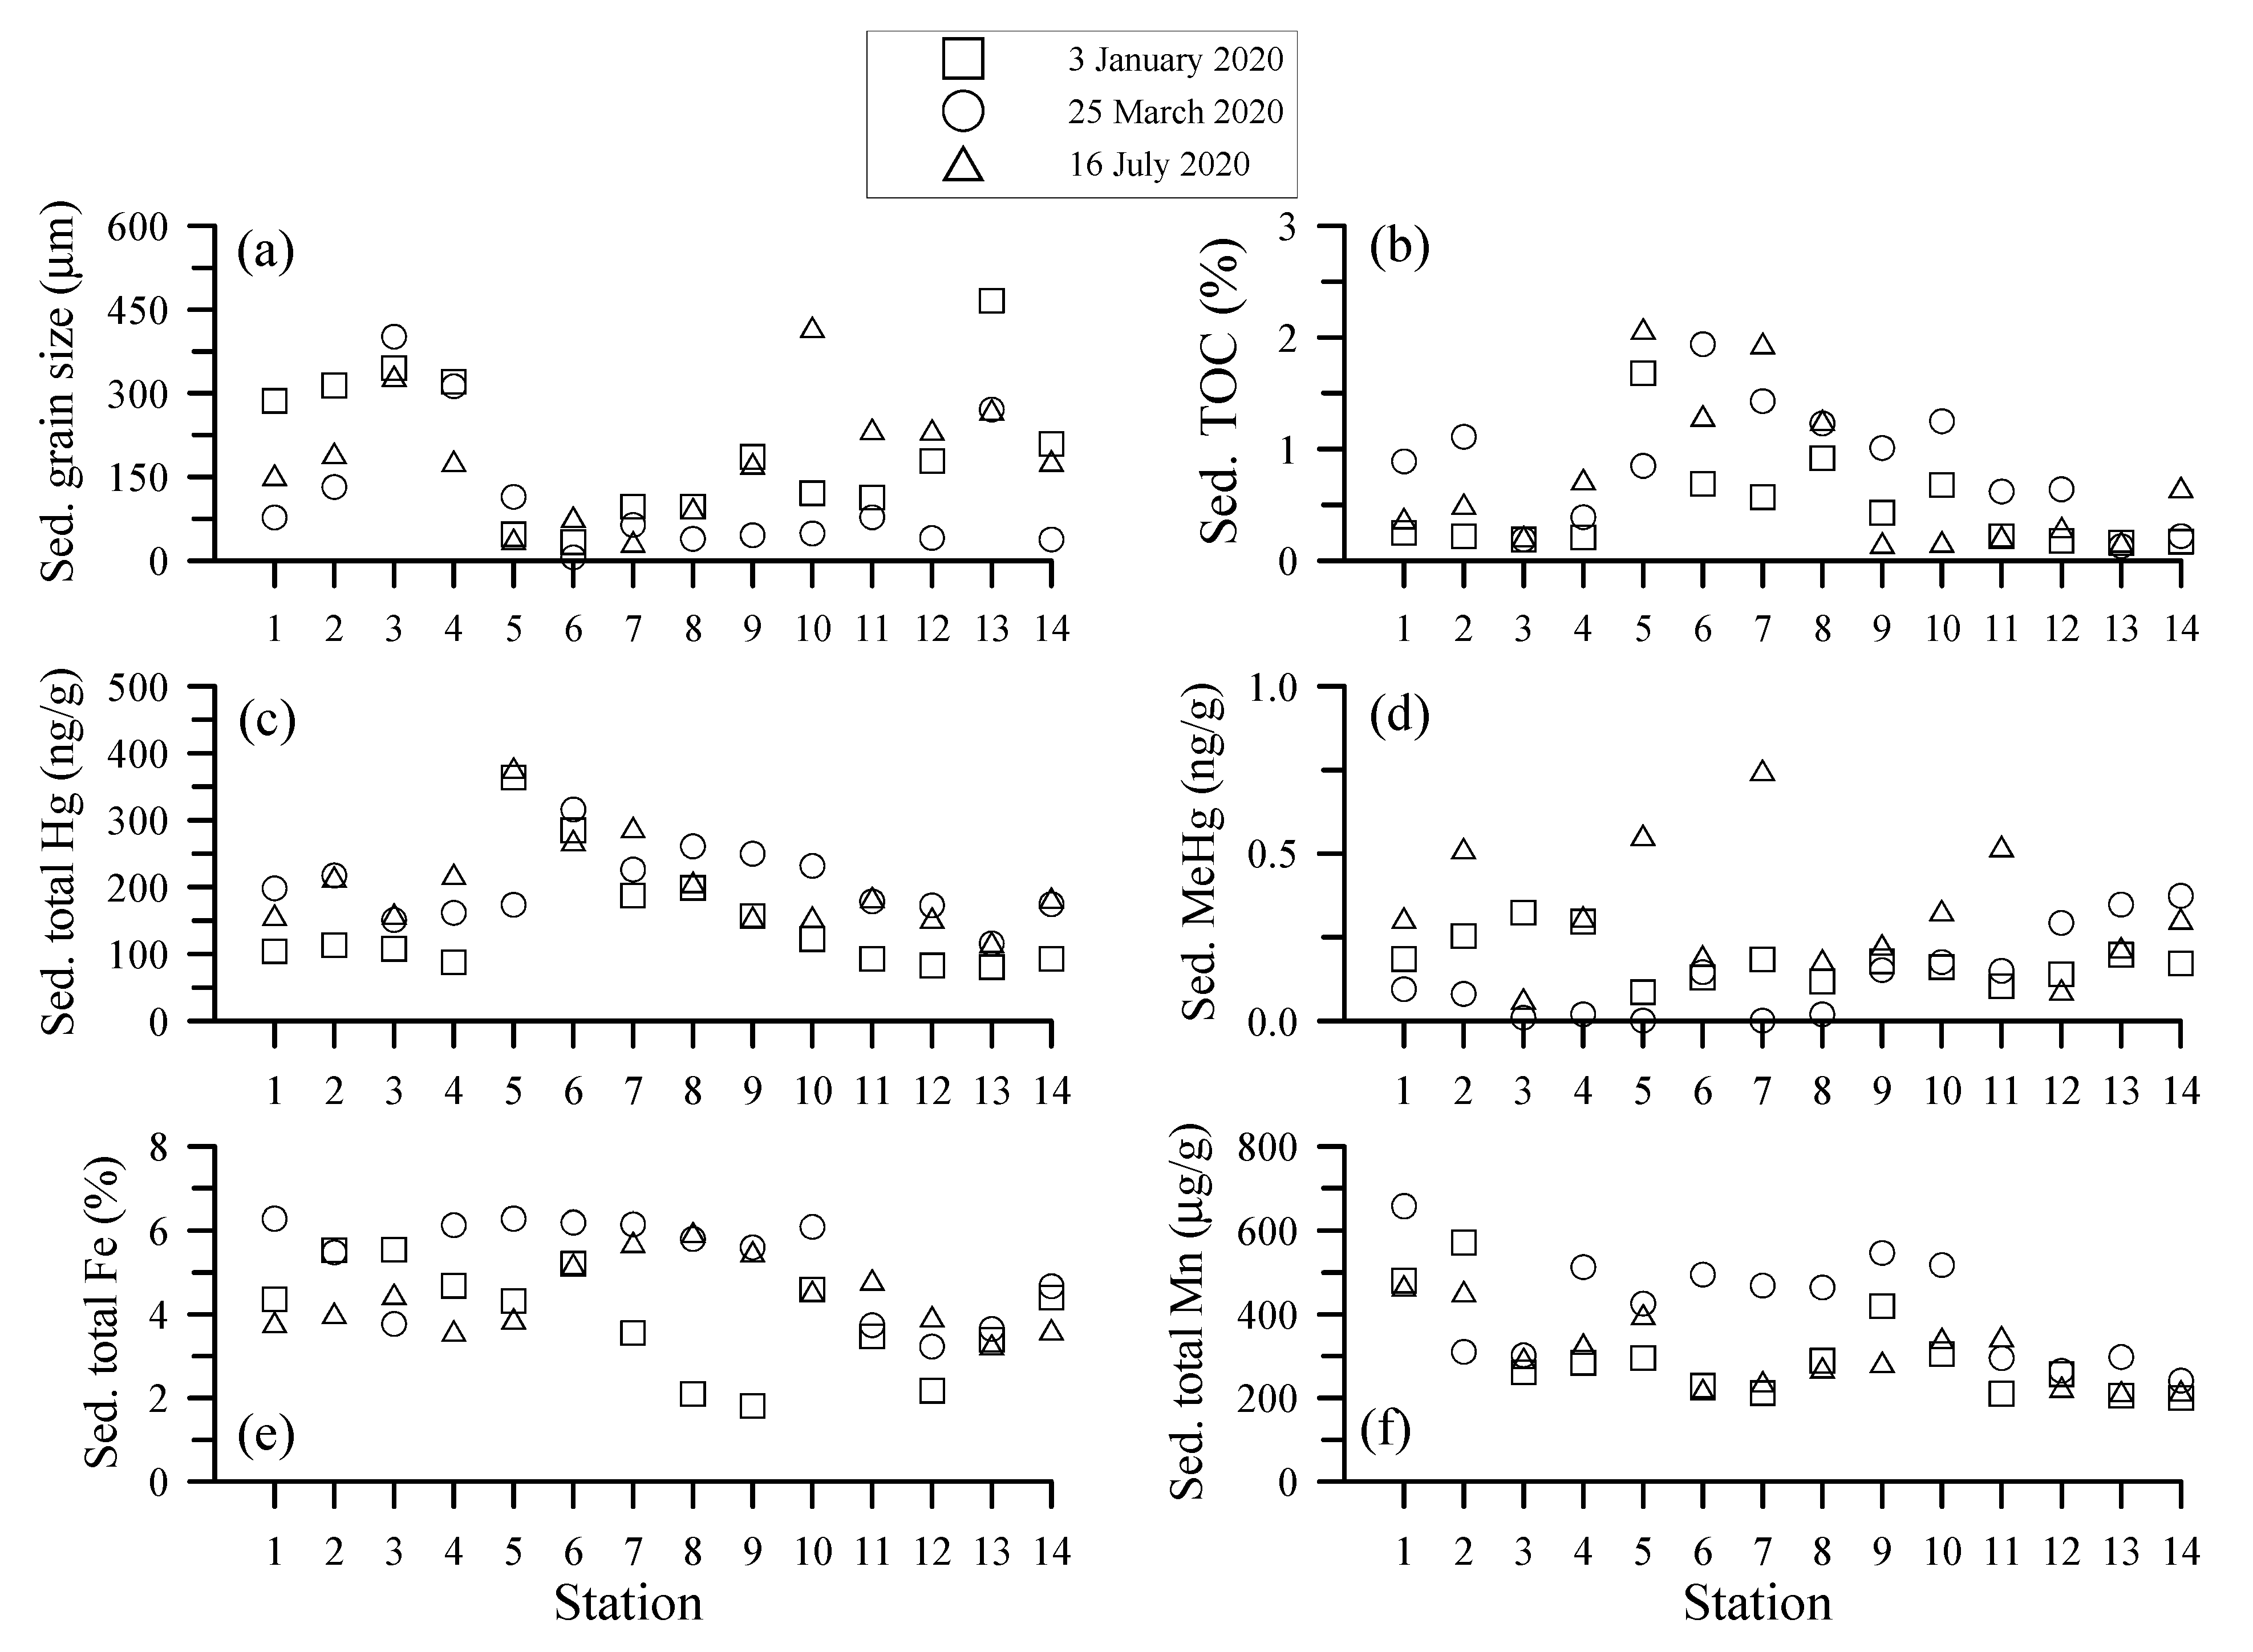
The sediment grain sizes and TOC concentrations in the DRE sediments ranged from 6 to 466 μm and 0.13 to 2.08% in the three surveys; their values, plotted in Figure 4, indicate that both showed a little scattering across the different surveys, but consistently displayed finer grain size with higher TOC concentration. The sediment grain sizes at the middle estuary stations (station 5–9) were mostly dominated by very fine sand (63–125 μm) and mud (<63 μm), which were relatively smaller than those found at the upper (1–4) and the lower estuary (11–14) stations. The sediment grain sizes in the upper and lower estuary stations were mainly dominated by medium (>177 μm) and fine sand (125–177 μm). In contrast, the TOC concentrations from the middle estuary stations were relatively higher than those at the upper and the lower stations.
3.4. Hg, Fe and Mn in Surface Sediment
The sediment total Hg (STHg), Fe (STFe) and Mn (STMn) concentrations within the DRE ranged from 80 to 379 ng/g, 1.81 to 6.28% and 200 to 658 μg/g, respectively. Their concentrations at the studied stations are also plotted in Figure 4. The sediment methyl Hg concentrations, ranging from <0.01 to 0.75 ng/g, were relatively minor and generally <0.5% of the STHg pool within the DRE. The STHg distribution corresponded quite well with the TOC distribution, also indicating that the concentrations at the middle estuary stations were relatively higher than those at the upper and the lower stations. In contrast, the STFe and STMn distributions exhibited a little scattering, and no specific trend could be described.
4. Discussion
4.1. Hg, Fe and Mn in Water
The DTHg concentrations found within the DRE ranged from 24 to 46 ng/L; these values were relatively higher than those reported in developed countries such as the USA and France. Table 2 compares the DTHg, DMeHg and PTHg concentrations reported in the recent literature for other estuaries around the world with those from DRE. It seems that the DTHg concentration range in the estuarine environment can be generally divided into three groups based on the Hg contamination status: <10 ng/L, less Hg-contaminated environment; 11–100 ng/L, mildly Hg-contaminated environment; and >100 ng/L, seriously Hg-contaminated environment. The DTHg concentrations in seawater reported in the literature rarely exceed the EPA USA (940 ng/L) or the EAP Taiwan (1000 ng/L) standards. However, a relatively high DTHg concentration, i.e., 2700 ng/L, was observed in Wuli RE, China; this was attributed to discharge from the Chlor-alkali plant [52]. Moreover, extremely high DTHg concentrations were observed in small streams in Wanshan (880 μg/L, [53]) and Tongguan, China (10.6 μg/L, [54]), respectively, which were attributed to Hg and Au mining activity.
Table 2 shows that the DMeHg concentrations reported for other estuarine environments around the world were generally relatively low, i.e., <1 ng/L, with some exceptions, such as the Tagus RE, Portugal [11] and Danshuei RE. By comparison, the DMeHg concentration found in the upper DRE estuary was relatively high, approaching to 10 ng/L, representing about 30% of the total DTHg. The DMeHg to DTHg percentage (DMeHg/DTHg) in the estuarine environment varied widely, but was generally <30% with one exception (42%) observed in the Hudson RE, USA [6]. Figure 5 shows the percentage variations of different Hg species in the dissolved and particulate phases in the DRE. Figure 5 clearly indicates that the DMeHg percentage ranged from 20 to 30% DTHg in the upper estuary (salinity < 3 psu), but the percentage sharply decreased to <10% of DTHg (salinity > 5 psu). Afterwards, the percentage decreased with increasing salinity and remained fairly constant in the lower estuary. The mechanisms which caused the DMeHg concentrations to behave in this manner within the DRE are not quite clear. Figure 6 shows that the DMeHg concentration correlates well with the Chl.a concentration, i.e., the higher the Chl.a concentration, the higher the DMeHg concentration. However, such a correlation between the DTHg and chl.a concentrations was not seen in the DRE. The DMeHg concentration, but not DTHg, correlating well with the Chl.a concentration is generally reported in the literature for estuarine and marine environments [26,27,28,58]. It has been shown that phytoplankton have a great ability to accumulate MeHg in seawater, with volume concentration factors (VCFs) ranging from 0.2 to 640 × 105 [24]. Thus, DMeHg uptake by phytoplankton can decrease the DMeHg concentration in the water column and elevate it in biota. However, phytoplankton blooms can decrease the amount of methyl Hg in phytoplankton cells, known as growth biodilution [58,59,60,61]. Remineralization from decaying phytoplankton could provide a source and elevate the DMeHg concentrations in estuarine [10,27,62], coastal [61,63] and oceanic waters [64,65]. Thus, the relatively higher DMeHg concentration found in the upper DRE estuary could be attributed to eutrophication, which increases the phytoplankton biomass and elevates the DMeHg concentration through the remineralization of organic matter in the water column, as observed in many marine environments.
Estuarine and marine sediments have been recognized as a methylmercury source to the water column, because microbial Hg methylation production is optimal near the oxic–anoxic transition zones (redox transition zone) that are commonly found close to sediment–water interfaces in marine environments [2]. Thus, MeHg in sediment can be released into the water column through the diffusion, bioturbation, tidal mixing and desorption from the resuspension process, thereby enhancing DMeHg concentrations [9,10,11,55]. A source from the sediment in the DRE cannot be ruled out, because the upper DRE estuary water column is always hypoxic due to the discharge of domestic waste water. Thus, the sediment may potentially exist in an anoxic conditions [31,32]. DMeHg estuarine distribution within the DRE exhibited removal behavior, sharply decreasing at salinity < 5 psu and remaining fairly constant below salinity > 5 psu (see Figure 3). Thus, it is unlikely that there were additional DMeHg sources, i.e., from the sediment into the water column, during this investigation.
In contrast to DMeHg, the DTHg distribution within the DRE showed a slight increase with increasing salinity, suggesting an additional DTHg source. Figure 5 shows the partition between DTHg and PTHg with the total Hg (THg = DTHg + PTHg) in the DRE, and indicates that the PTHg contribution nearly equalized that of DTHg in the upper estuary (salinity < 5 psu) region. However, the contribution of PTHg decreased to <25% of THg pool in the salinity < 15 psu region, and DTHg chiefly dominated the THg pool. The solid-solution partitioning of a constituent can be quantified using the conditional distribution coefficient, KD, given as KD = P/C, where P (ng/g) and C (ng/L) are the particulate and dissolved total concentrations, respectively. The distribution coefficient can provide a quantitative concentration partition value between the solution and particles [66]. Figure 7a shows the Hg log(KD) value plots against salinity and SPM concentrations observed in the DRE in this study. The Hg log(KD) values ranged from 3.54 to 4.68, and the value linearly decreased with increasing salinity, suggesting that the log(KD) values are dependent on the salinity. The KD values obtained in the DRE were consistent with the experimental results (3.8–4.8, Li et al. [67]), but were obviously lower than those found in the Delaware Estuary (5.02–6.01, Gosnell et al. [10]), the six tributaries to the Chesapeake Bay (5.06–5.52, Lawson et al. [68]), the New Jersey Harbor Estuary (5.3–6.5, Balcom et al. [16]), the Galveston Bay (4.6–5.2, Stordal et al. [69]), the Douro Estuary, Portugal (3.72–6.52, Ramalhosa et al. [15]) and some other European estuaries (5.08–5.9, Turner et al. [18]). In spite of this, relatively lower KD values, i.e., 1.9–2.7, have been reported for the Deule and Lys Rivers in Northern France [70]. It is worth noting that the KD values observed along the Douro Estuary varied by three orders of magnitude, suggesting that the partitioning between dissolved Hg and particulate Hg in the estuarine water was fully hydrodynamic and strongly influenced by the salinity and DOC effects [15,18]. The influence of the salinity effect on the partition coefficient (KD) is generally observed for trace metals, especially Cd and Hg, during estuarine mixing due to metal desorption from particles because of competition from increasing numbers of major cations (Na+ and Mg2+) and major anions (Cl− and SO42−) that form soluble chloro- and sulfato-complexes with metals in solution [2,17,19,71]. The DOC effect is that the stability constants for Hg–DOC complexes reported in the literature are about 1020–1028 in aquatic environments [72,73]. Thus the strong formation of Hg–DOC complexes in the water column also induces decreasing Hg adsorption on aqueous particulates [20]. In addition, other factors, such as the species of metals, the texture of particles, the resuspension of particles and residence time etc., can also interfere with particle interactions with trace metals in the water column [67,74,75]. Thus, KD values for trace metals, including Hg, may differ among different estuaries around the world [76].
As shown in in Figure 7b, the Hg log(KD) values correlated well with the log(SPM) concentrations in the DRE in the present study. This finding is in contrast to results from experimental and estuarine studies, indicating that the distribution coefficient of many trace elements, especially trace metals, generally negatively correlates well with particle concentrations. This is attributed to the particle concentration effect and the associated colloidal effect [66,74,77]. The reason for the present result is probably that the higher particle and PTHg concentrations generally occurred in the upper estuary, and both concentrations significantly decreased at salinity < 10 psu. Afterwards, the particle concentrations remained fairly constant and the PTHg concentrations slightly decreased with increasing salinity. In spite of this, Fe and Mn oxyhydroxides represent important particulate Hg carrier phases in estuarine environments [7,78,79]. Figure 6c,d show that PTHg concentrations positively correlated well with the PTFe (r = 0.82, p < 0.05) and PTMn (r = 0.89, p < 0.05) concentrations, suggesting that particulate Fe and Mn serve as important carriers for PTHg in the DRE. Figure 3d shows that the estuarine PTFe distribution was similar to that of SPM (Figure 2c). Both concentrations significantly decreased within the salinity < 10 psu. These results may explain why the Hg log(KD) values correlated well with the log(SPM) concentration in the DRE.
4.2. Hg, Fe and Mn in Surface Sediment
The sediment total Hg concentrations found within the DRE ranged from 80.4 to 378.5 ng/g, and most of the data exceeded the biological effects range-low value (ERL, Hg 150 ng/g) but did not surpass the effects range-median value (ERM, Hg 710 ng/g) of the sediment quality guidelines (SQGs) of the USA EPA [80], suggesting that the DRE is contaminated with Hg. Fortunately, the sediment MeHg (a more toxic Hg species) concentrations were almost <0.5 ng/g within the DRE, and were generally <0.5% of the STHg pool. This result agrees with literature reports showing that the MeHg contribution to STHg is generally <1% in the estuarine environment, as shown in Table 3. Literature reports have indicated that total Hg concentrations in estuarine and coastal sediments could vary by one to four orders of magnitude, depending upon the Hg contamination and pollution status. For example, it is commonly found total Hg concentrations in urban estuarine sediment range from 50 to 500 ng/g (e.g., [2,81,82]), as observed in the present study. However, the total Hg concentrations in seriously polluted inshore sediment, such as those in Kastela Bay (Croatia), the Gulf of Trieste (Italy) and the Minamata Bay (Japan) can be greater than 10,000 ng/g [4,83,84].
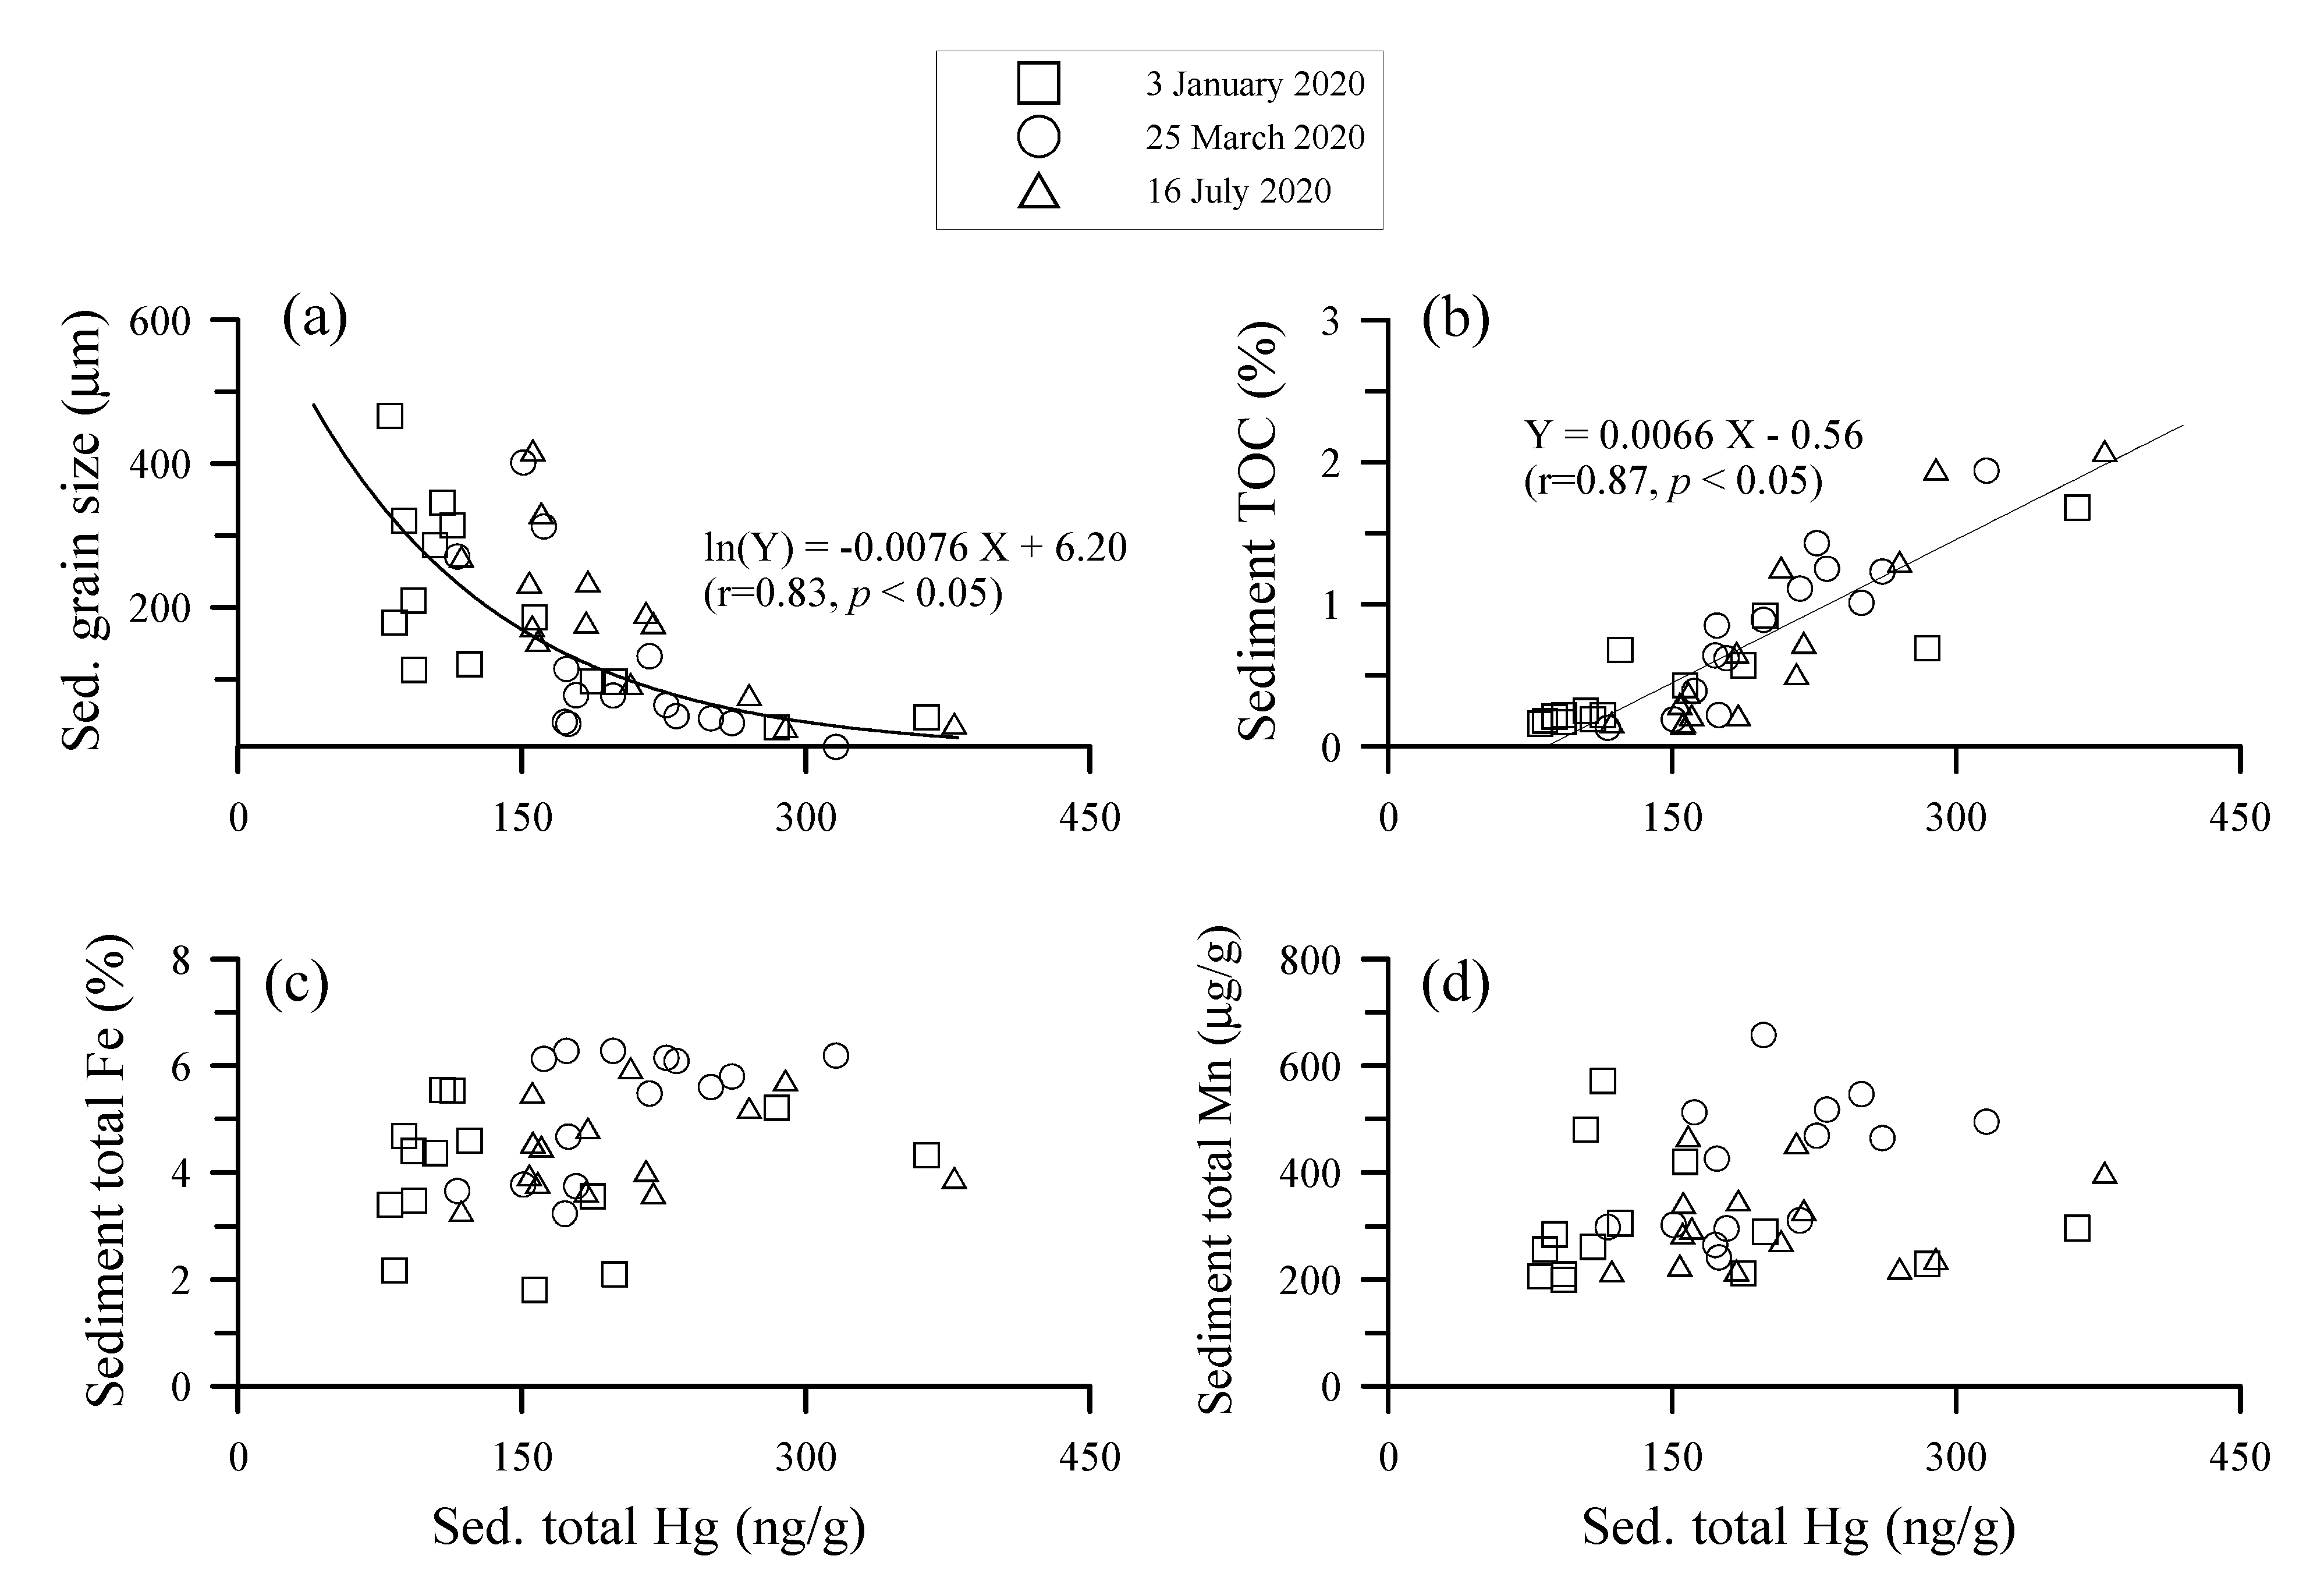
The estuarine sediment total Hg, Fe and Mn concentration distributions within the DRE were scattered, and no specific trend could be described (Figure 4). However, plotting these concentrations with the grain size and TOC content, Figure 8 shows that the STHg concentration inversely exponentially correlated with the grain size (r = −0.83; p < 0.05) and positively correlated with TOC content (r = 0.87; p < 0.05). These results indicate that the STHg within the DRE is fundamentally influenced by grain size and TOC content. The fact that TOC content and grain size play crucial roles in controlling the STHg concentration in marine sediment is commonly seen in marine environments, because Hg has a higher affinity for organic matter, and therefore, the finer the sediment, the larger the surface area [2,48,89]. However, it was surprising to see that the Hg concentrations did not correlate well with the Fe concentrations in the sediment samples, as good correlation was observed in the particulate samples (Figure 6). No clear correlations were found between sediment grain size and TOC with Fe and Mn concentrations, suggesting that Fe and Mn concentrations in sediments within the DRE are independent of these parameters (see Figure 8). However, as observed in the present study, Fe and Mn oxides serve as important carriers in adsorbing the dissolved Hg in the water column. In spite of this, the sediment texture, i.e., quartz and calcium carbonate, which generally contain less Hg, may influence the Hg concentration in sediments and interfere with the relationships between these elements [90]. Further examination of the minerology of DRE sediment is necessary to fully identify the mechanisms which influence the geochemical behavior of Hg within DRE sediment.
5. Conclusions
This study pioneered an investigation into Hg species in a seriously eutrophic estuary, i.e., the DRE water column and its sediments. The analyzed results indicated that the DRE is contaminated by Hg, and that evidence of Hg sediment is more significant than that of the dissolved Hg. Most of the sedimentary total Hg concentrations exceeded the biological effects range low value (ERL, Hg 150 ng/g). However, the sediment MeHg concentrations were generally relatively low, i.e., <0.5 ng/g, and <0.5% of the sediment total Hg pool. In contrast, DMeHg seemed to be an important fraction of DTHg in the upper estuary, as DMeHg may contribute to 30% of DTHg pool. The importance of DMeHg was found to significantly decrease at salinity < 10 psu. Higher DMeHg concentrations were generally found to be relevant to chl.a concentrations, suggesting that phytoplankton may play a crucial role in influencing the DMeHg concentrations within the estuary.
The partitioning result indicates that the DTHg contribution nearly equalized PTHg in the upper estuary (salinity < 5 psu) region, and became the dominate species after the middle estuary (salinity < 15 psu) region. The Hg partitioning coefficient (KD) value linearly decreases with the increasing salinity, indicating Hg desorption from particles caused by the salinity effect. The KD value also showed a linear increase with log(SPM) concentration, a distinctive phenomenon rarely occurring in estuarine studies. The sediment total Hg contents within the DRE were found to be primarily governed by TOC content and grain size. Finally, it is necessary to further examine why the particulate Hg correlated with particulate Fe despite the fact that such a correlation was not seen in the sediment samples.
Supplementary Materials
The following are available online at https://www.mdpi.com/article/10.3390/w13182471/s1, Excel file: 2021 DRE Hgdata.
Author Contributions
The analytical works of the present study were completed by C.-Y.L. during she studied her master degree with his supervisor, T.-H.F. at the Department of Marine Environmental Informatics, National Taiwan Ocean University, Taiwan. T.-H.F. arranged this research study and wrote the manuscript. All authors have read and agreed to the published version of the manuscript.
Funding
This research was financially supported by the Ministry of Science and Technology, Taiwan under grants MOST 108-2611-M-019-011 and 109-2611-M-019-008.
Institutional Review Board Statement
Not applicable.
Informed Consent Statement
Informed consent was obtained from all subjects involved in the study.
Data Availability Statement
Data reported in this article can be found at the supplementary data.
Acknowledgments
This research was financially supported by the Ministry of Science and Technology, Taiwan under grants MOST 108-2611-M-019-011 and 109-2611-M-019-008. The authors are grateful to two anonymous referees for their constructive comments and suggestions which led to significant improvements to the manuscript.
Conflicts of Interest
The authors declare no conflict of interest.
References
- Kennish, M. Practical Handbook of Estuarine and Marine Pollution; CRC Press: Boca Raton, FL, USA, 1999. [Google Scholar]
- Fitzgerald, W.F.; Lamborg, C.H.; Hammerschmidt, C.R. Marine Biogeochemical Cycling of Mercury. Chem. Rev. 2007, 107, 641–662. [Google Scholar] [CrossRef]
- Gworek, B.; Bemowska-Kalabun, O.; Kijenska, M.; Wrzosek-Jakubowska, J. Mercury in marine and oceanic waters—A review. Water Air Soil Pollut. 2016, 227, 371. [Google Scholar] [CrossRef] [Green Version]
- Tomiyasu, T.; Matsuyama, A.; Eguchi, T.; Fuchigami, Y.; Oki, K.; Horvat, M.; Rajar, R.; Akagi, H. Spatial variations of mercury in sediment of Minamata Bay, Japan. Sci. Total Environ. 2006, 368, 283–290. [Google Scholar] [CrossRef]
- Neff, J.M. Bioaccumulation in Marine Organisms: Effect of Contaminants from Oil Well Produced Water; Elsevier: Amsterdam, The Netherlands, 2002. [Google Scholar]
- Heyes, A.; Miller, C.; Mason, R. Mercury and methylmercury in Hudson River sediment: Impact of tidal resuspension on partitioning and methylation. Mar. Chem. 2004, 90, 75–89. [Google Scholar] [CrossRef]
- Muresan, B.; Cossa, D.; Jezequel, D.; Prevot, F.; Kerbellec, S. The biogeochemistry of mercury at the sediment-water interface in the Thau lagoon. 1. Partition and speciation. Estuar. Coast. Shelf Sci. 2007, 72, 472–484. [Google Scholar] [CrossRef] [Green Version]
- Sharif, A.; Monperrus, M.; Tessier, E.; Bouchet, S.; Pinaly, H.; Rodriguez-Gonzalez, P.; Maron, P.; Amouroux, D. Fate of mercury species in the coastal plume of the Adour River estuary (Bay of Biscay, SW France). Sci. Total Environ. 2014, 496, 701–713. [Google Scholar] [CrossRef] [PubMed]
- Balcom, P.H.; Schartup, A.T.; Mason, R.P.; Chen, C.Y. Sources of water column methylmercury across multiple estuaries in the Northeast U.S. Mar. Chem. 2015, 177, 721–730. [Google Scholar] [CrossRef] [PubMed] [Green Version]
- Gosnell, K.; Balcom, P.; Ortiz, V.; DiMento, B.; Schartup, A.; Greene, R.; Mason, R. Seasonal Cycling and Transport of Mercury and Methylmercury in the Turbidity Maximum of the Delaware Estuary. Aquat. Geochem. 2016, 22, 313–336. [Google Scholar] [CrossRef]
- Cesario, R.; Mota, A.M.; Caetano, M.; Nogueira, M.; Canario, J. Mercury and methylmercury transport and fate in the water column of Tagus estuary (Portugal). Mar. Pollut. Bull. 2018, 127, 235–250. [Google Scholar] [CrossRef] [PubMed]
- Ullrich, S.M.; Tanton, T.W.; Abdrashitova, S.A. Mercury in the aquatic environment: A review of factors affecting methylation. Crit. Rev. Environ. Sci. Technol. 2001, 31, 241–293. [Google Scholar] [CrossRef]
- Amyot, M.; Gill, G.A.; Morel, F.M.M. Production and loss of dissolved gaseous mercury in coastal seawater. Environ. Sci. Technol. 1997, 31, 3606–3611. [Google Scholar] [CrossRef]
- Conaway, C.H.; Squire, S.; Mason, R.P.; Flegal, A.R. Mercury speciation in the San Francisco Bay estuary. Mar. Chem. 2003, 80, 199–225. [Google Scholar] [CrossRef]
- Ramalhosa, E.; Pereira, E.; Vale, C.; Valega, M.; Monterroso, P.; Duarte, A.C. Mercury distribution in Douro estuary (Portugal). Mar. Pollut. Bull. 2005, 50, 1218–1222. [Google Scholar] [CrossRef] [PubMed] [Green Version]
- Balcom, P.H.; Hammerschmidt, C.R.; Fitzgerald, W.F.; Lamborg, C.H.; O’Connor, J.S. Seasonal distributions and cycling of mercury and methylmercury in the waters of New York/New Jersey Harbor Estuary. Mar. Chem. 2008, 109, 1–17. [Google Scholar] [CrossRef]
- Grassi, S.; Netti, R. Sea water intrusion and mercury pollution of some coastal aquifers in the province of Grosseto (Southern Tuscany, Italy). J. Hydrol. 2000, 237, 198–211. [Google Scholar] [CrossRef]
- Turner, A.; Millward, G.E.; Le Roux, S.M. Sediment-water partitioning of inorganic mercury in estuaries. Environ. Sci. Technol. 2001, 35, 4648–4654. [Google Scholar] [CrossRef]
- Stumm, W.; Morgan, J.J. Aquatic Chemistry, 3rd ed.; A Wiley-Interscience Publication: Hoboken, NJ, USA, 1996. [Google Scholar]
- Ravichandran, M. Interactions between mercury and dissolved organic matter- a review. Chemosphere 2004, 55, 319–331. [Google Scholar] [CrossRef] [PubMed]
- Merrit, K.A.; Amirbahman, A. Mercury methylation dynamics in estuarine and coastal marine environment–A critical review. Earth-Sci. Rev. 2009, 96, 54–66. [Google Scholar] [CrossRef]
- Jonsson, S.; Skyllberg, U.; Nilsson, M.B.; Lundberg, E.; Andersson, A.; Bjorn, E. Differentiated availability of geochemical mercury pools controls methylmercury levels in estuarine sediment and biota. Nat. Commun. 2014, 5, 4624–4633. [Google Scholar] [CrossRef] [PubMed]
- Hsu-Kim, H.; Kucharzyk, K.H.; Zhang, T.; Deshusses, M.A. Mechanisms Regulating Mercury Bioavailability for Methylating Microorganisms in the Aquatic Environment: A Critical Review. Environ. Sci. Technol. 2013, 47, 2441–2456. [Google Scholar] [CrossRef]
- Lee, C.S.; Fisher, N.S. Methylmercury uptake by diverse marine phytoplankton. Limnol. Oceanogr. 2016, 61, 1626–1639. [Google Scholar] [CrossRef]
- Schartup, A.; Qureshi, A.; Dassuncao, C.; Thackray, C.P.; Harding, G.; Sunderland, E.M. A model for methylmercury uptake and trophic transfer by marine plankton. Environ. Sci. Technol. 2018, 52, 654–662. [Google Scholar] [CrossRef] [PubMed]
- Stoichev, T.; Amouroux, D.; Monperrus, M.; Point, D.; Tessier, E.; Bareille, G.; Donard, O.F.X. Merecury in surface waters of a macrotidal urban estuary (River Adour, south-west France). Chem. Ecol. 2006, 22, 137–148. [Google Scholar] [CrossRef]
- Luengen1, A.C.; Flegal, A.R. Role of phytoplankton in mercury cycling in the San Francisco Bay estuary. Limnol. Oceanogr. 2009, 54, 23–40. [Google Scholar] [CrossRef] [Green Version]
- Heimburger, L.E.; Cossa, D.; Marty, J.C.; Migon, C.; Averty, B.; Dufour, A.; Ras, J. Methyl mercury distributions in relation to the presence of nano- and picophytoplankton in an oceanic water column (Ligurian Sea, North-western Mediterranean). Geochim. Cosmochim. Acta 2010, 74, 5549–5559. [Google Scholar] [CrossRef] [Green Version]
- Faucheur, S.L.; Campbell, P.G.C.; Fortin, C.; Slaveykova, V.I. Interactions between mercury and phytoplankton: Speciation, bioavailability, and internal handling. Environ. Toxicol. Chem. 2014, 33, 1211–1224. [Google Scholar] [CrossRef]
- Jiann, K.T.; Wen, L.S.; Santschi, P.H. Trace metal (Cd, Cu, Ni and Pb) partitioning, affinities and removal in the Danshuei River estuary, a macro-tidal, temporally anoxic estuary in Taiwan. Mar. Chem. 2005, 96, 293–313. [Google Scholar] [CrossRef]
- Wen, L.S.; Jiann, K.T.; Liu, K.K. Seasonal variation and flux of dissolved nutrients in the Danshuei Estuary, Taiwan: A hypoxic subtropical mountain river. Estuar. Coast. Shelf Sci. 2008, 78, 694–704. [Google Scholar] [CrossRef]
- Fang, T.H.; Wang, C.W. Dissolved and particulate phosphorus species partitioning and distribution in the Danshuei River Estuary, Northern Taiwan. Mar. Pollut. Bull. 2020, 151, 110839. [Google Scholar] [CrossRef] [PubMed]
- Fang, T.H.; Chen, W.H. Dissolved and particulate nitrogen species partitioning and distribution in the Danshuei River Estuary, Northern Taiwan. Mar. Pollut. Bull. 2021, 164, 111981. [Google Scholar] [CrossRef]
- Gbondo-Tugbawa, S.S.; McAlear, J.A.; Driscoll, C.T.; Sharpe, C.W. Total and methyl mercury transformations and mass loadings within a wastewater treatment plant and the impact of the effluent discharge to an alkaline hypereutrophic lake. Water Res. 2010, 44, 2863–2875. [Google Scholar] [CrossRef] [PubMed]
- Liu, M.; Du, P.; Yu, C.; He, Y.; Zhang, H.; Sun, X.; Lin, H.; Luo, Y.; Xie, H.; Guo, J.; et al. Increases of total mercury and methylmercury releases from municipal sewage into environment in China and implications. Environ. Sci. Technol. 2018, 52, 124–134. [Google Scholar] [CrossRef] [PubMed]
- Ramond, J.; Petit, F.; Quilet, L.; Quddane, B.; Berthe, T. Evidence of methylmercury production and modification of the microbial community structure in estuary sediments contaminated with wastewater treatment plant effluents. Mar. Pollut. Bull. 2011, 62, 1073–1080. [Google Scholar] [CrossRef]
- Lu, T.H. Temporal and Spatial Variations of Hg in Sediments of the Danshuei Watershed and Adjacent Coastal Area, Taiwan. Master’s Thesis, National Taiwan Normal University, Taiwan, 2013. [Google Scholar]
- Liu, W.C.; Chen, W.B.; Kuo, J.T.; Wu, C. Numerical determination of residence time and age in a partially mixed estuary using three-dimensional hydrodynamic model. Cont. Shelf Res. 2008, 28, 1068–1088. [Google Scholar] [CrossRef]
- PWD, Public Works Department, Taipei City Government. Available online: https://www.sso.gov.taipei/News.aspx?n=AACA1DD3515C73D7&sms=C4B1D81C0A0892E0 (accessed on 27 August 2021).
- Fang, T.H.; Lin, C.L. Dissolved and particulate trace metals and their partitioning in a hypoxic estuary: The Tanshui Estuary in northern Taiwan. Estuaries 2002, 25, 598–607. [Google Scholar] [CrossRef]
- Pai, S.C.; Gong, G.C.; Liu, K.K. Determination of dissolved oxygen in seawater by direct spectrophotometry of total iodine. Mar. Chem. 1993, 41, 343–351. [Google Scholar] [CrossRef]
- Strickland, J.D.; Parsons, T.R. A Practical Handbook of Seawater Analysis; Fisheries Research Board of Canada: Ottawa, ON, Canada, 1972. [Google Scholar]
- Grasshoff, K.; Kremling, K.; Ehrhardt, M. Methods of Seawater Analysis, 2nd ed.; John Wiley & Sons: Hoboken, NJ, USA, 2009. [Google Scholar]
- Environmental Protection Agency. Method 1631, Revision E: Mercury in Water by Oxidation, Purge and Trap, and Cold Vapor Atomic Fluorescence Spectrometry. 2002. Available online: https://www.epa.gov/cwa-methods/approved-cwa-test-methods-metals (accessed on 27 August 2021).
- Environmental Protection Agency. Method 1630. Methyl Mercury in Water by Distillation, Aqueous Ethylation, Purge and Trap, and Cold Vapor Atomic Fluorescence Spectrometry. Available online: https://www.epa.gov/cwa-methods/other-clean-water-act-test-methods-chemical (accessed on 27 August 2021).
- Environmental Protection Agency. Method 7474. Mercury in Sediment and Tissue Samples by Atomic Fluorescence Spectrometry. 2007. Available online: https://www.epa.gov/hw-sw846/sw-846-test-method-7474-mercury-sediment-tissue-samples-atomic-fluorescene (accessed on 27 August 2021).
- Shi, J.; Liang, L.; Jiang, G.; Jin, X. The speciation and bioavailability of mercury in sediments of Haihe River, China. Environ. Int. 2005, 31, 357–365. [Google Scholar] [CrossRef] [PubMed]
- Fang, T.H.; Chen, R.Y. Mercury contamination and accumulation in sediments of the East China Sea. J. Environ. Sci. 2010, 22, 1–7. [Google Scholar] [CrossRef]
- Hintelmann, H. Comprison of different extraction techniques used for methylmercury analysis with respect to accidental formation of methylmercury during sample preparation. Chemosphere 1999, 39, 1093–1105. [Google Scholar] [CrossRef]
- Fang, T.H.; Hong, E. Mechanisms influencing the spatial distribution of trace metals in surficial sediments off the south-western Taiwan. Mar. Pollut. Bull. 1999, 38, 1026–1037. [Google Scholar] [CrossRef]
- Folk, R. Petrology of Sedimentary Rocks; Hamphill’s: Austin, TX, USA, 1974. [Google Scholar]
- Wang, S.; Jia, Y.; Wang, S.; Wang, X.; Wang, H.; Zhao, Z.; Liu, B. Total mercury and monomethylmercury in water, sediments, and hydrophytes from the rivers, estuary, and bay along the Bohai Sea coast, northeastern China. Appl. Geochem. 2009, 24, 1702–1711. [Google Scholar] [CrossRef]
- Liu, J.; Feng, X.; Zhang, X.; Yin, R. Spatial distribution and speciation of mercury and methyl mercury in the surface waters of East River (Dongjiang) tributry of Pearl River Delta, South China. Environ. Sci. Pollut. Res. 2012, 19, 105–112. [Google Scholar] [CrossRef]
- Leermakers, M.; Galletti, S.; De Galan, N.; Brion, W.; Baeyens, W. Mercury in the Southern North Sea and Scheldt estuary. Mar. Chem. 2001, 75, 229–248. [Google Scholar] [CrossRef]
- Bartkic, A.; Ogrinc, N.; Kotnik, J.; Faganeli, J.; Zagar, D.; Yano, S.; Tada, A.; Horvat, M. Mercury speciation driven by seasonal changes in a contaminated estuarine environment. Environ. Res. 2013, 125, 171–178. [Google Scholar] [CrossRef] [PubMed]
- Covelli, S.; Acquavita, A.; Piani, R.; Predonzani, S.; De Vittor, C. Recent contamination of mercury in an estuarine environment (Marano lagoon, Northern Adriatic, Italy). Estuar. Coast. Shelf Sci. 2009, 82, 273–284. [Google Scholar] [CrossRef]
- Cardoso, P.G.; D’Ambrosio, M.; Marques, S.C.; Azeiteiro, U.M.; Coelho, J.P.; Pereira, E. The effects of mercury on the dynamics of the peracarida community in a temperate coastal lagoon (Ria de Aveiro, Portugal). Mar. Pollut. Bull. 2013, 72, 188–196. [Google Scholar] [CrossRef]
- Chen, C.Y.; Folt, C.L. High plankton densities reduce mercury biomagnification. Environ. Sci. Technol. 2005, 39, 115–121. [Google Scholar] [CrossRef]
- Hammerschmidt, C.R.; Finiguerra, M.B.; Weller, R.L.; Fitzgerald, W.F. Methylmercury accumulation in plankton on the continental margin of the Northwest Atlantic Ocean. Environ. Sci. Technol. 2013, 47, 3671–3677. [Google Scholar] [CrossRef]
- Soerensen, A.L.; Schartup, A.T.; Gustafsson, E.; Gustafsson, B.G.; Undeman, E.; Bjorn, E. Eutrophication increase phytoplankton methylmercury concentrations in a coastal sea–A Baltic Sea case study. Environ. Sci. Technol. 2016, 50, 11787–11796. [Google Scholar] [CrossRef]
- Gosnell, K.; Balcom, P.H.; Tobias, C.R.; Gilhooly, W.P., III; Mason, R.P. Spatial and temporal trophic transfer dynamics of mercury and methylmercury into zooplankton and phytoplankton of Long Island Sound. Limnol. Oceanogr. 2017, 62, 1122–1138. [Google Scholar] [CrossRef]
- Chen, C.Y.; Buckman, K.L.; Shaw, A.; Curtis, A.; Taylor, M.; Montesdeoca, M.; Driscoll, C. The influence of nutrient loading on methylmercury availability in Long Island estuaries. Environ. Pollut. 2021, 268, 115510. [Google Scholar] [CrossRef]
- Monperrus, M.; Tessier, E.; Amouroux, D.; Leynaert, A.; Huonnic, P.; Donard, O.F.X. Mercury methylation, demethylation and reduction rates in coastal and marine surface waters of the Mediterranean Sea. Mar. Chem. 2007, 107, 49–63. [Google Scholar] [CrossRef]
- Cossa, D.; Averty, B.; Pirronec, N. The origin of methylmercury in open Mediterranean waters. Limnol. Oceanogr. 2009, 54, 837–844. [Google Scholar] [CrossRef]
- Hammerschmidt, C.R.; Bowman, K. Vertical methylmercury distribution in the subtropical North Pacific Ocean. Mar. Chem. 2012, 132–133, 77–82. [Google Scholar] [CrossRef]
- Benoit, G.; Rozan, T.F. The influence of size distribution on the particle concentration effect and trace metal partitioning in rivers. Geochim.Cosmochim. Acta 1999, 63, 113–127. [Google Scholar] [CrossRef]
- Li, Y.H.; Burkhardt, L.; Buchholtz, M.; O’Hara, P.; Santschi, P.H. Partition of radiotracers between suspended particles and seawater. Geochim.Cosmochim. Acta 1984, 48, 2011–2019. [Google Scholar] [CrossRef]
- Lawson, N.; Mason, R.P.; Laporte, J.M. The fate and transport of mercury, methylmercury, and other trace metals in Chesapeake tributaries. Water Res. 2001, 35, 501–515. [Google Scholar] [CrossRef]
- Stordal, M.C.; Gill, G.A.; Wen, L.S.; Santschi, P.H. Mercury phase speciation in the surface waters of three Texas estuaries: Importance of colloidal forms. Limnol. Oceanogr. 1996, 41, 52–61. [Google Scholar] [CrossRef]
- Daye, M.; Kadlecova, M.; Wuddane, B. Biogeochemical factors affecting the distribution, speciation, and transport of Hg species in the Deule and Lys Rivers (Northern France). Environ. Sci. Pollut. Res. 2015, 22, 2708–2720. [Google Scholar] [CrossRef] [PubMed]
- Comans, R.N.J.; van Dijk, C.P.J. Role of complexation processes in cadmium mobilization during estuarine mixing. Nature 1988, 336, 151–154. [Google Scholar] [CrossRef]
- Benoit, J.M.; Mason, R.P.; Gilmour, C.C.; Aiken, G.R. Constants for mercury binding by dissolved organic matter isolated from the Florida Everglades. Geochim. Cosmochim. Acta 2001, 65, 4445–4451. [Google Scholar] [CrossRef]
- Haitzer, M.; Aiken, G.R.; Ryan, J.N. Binding of mercury (II) to dissolved organic matter: The role of the mercury-to-DOM concentration ratio. Environ. Sci. Technol. 2002, 36, 3564–3570. [Google Scholar] [CrossRef] [PubMed]
- Middelburg, J.J.; Herman, P.M.J. Organic matter processing in tidal estuaries. Mar. Chem. 2007, 106, 127–147. [Google Scholar] [CrossRef]
- Turner, A.; Martino, M.; Le Roux, S.M. Trace metal distribution coefficients in the Mersey Estuary, UK: Evidence for salting out of metal complexes. Environ. Sci. Technol. 2002, 36, 4578–4584. [Google Scholar] [CrossRef] [PubMed]
- Turner, A. Trace metal partitioning in estuaries: Importance of salinity and particle concentration. Mar. Chem. 1996, 54, 27–39. [Google Scholar] [CrossRef]
- Choe, K.Y.; Gill, G.A.; Lehman, R. Distribution of particulate, colloidal, and dissolved mercury in San Francisco Bay estuary. 1. Total mercury. Limnol. Oceanogr. 2003, 48, 1535–1546. [Google Scholar] [CrossRef] [Green Version]
- Laurier, F.J.G.; Cossa, D.; Gonzalez, J.L.; Sarazin, G. Mercury transformations and exchanges in a high turbidity estuary: The role of organic matter and amorphous oxyhydroxides. Geochim.Cosmochim. Acta 2003, 67, 3329–3345. [Google Scholar] [CrossRef]
- Turner, A.; Millward, G.E.; Le Roux, S.M. Significance of oxides and particulate organic matter in controlling trace metal partitioning in a contaminated estuary. Mar. Chem. 2004, 88, 179–192. [Google Scholar] [CrossRef]
- Long, E.R.; Macdonald, D.D.; Smith, S.; Calder, F.D. Incidence of adverse biological effects within ranges of chemical concentrations in marine and estuarine sediments. Environ. Manag. 1995, 19, 81–97. [Google Scholar] [CrossRef]
- Birch, G.F. Determination of sediment metal background concentrations and enrichment in marine environment—A critical review. Sci. Total Environ. 2017, 580, 813–831. [Google Scholar] [CrossRef]
- Ng, K.; Szabo, Z.; Reilly, P.A.; Barringer, J.L.; Smalling, K.L. An assessment of mercury in estuarine sediment and tissue in Southern New Jersey using public domain data. Mar. Pollut. Bull. 2016, 107, 22–35. [Google Scholar] [CrossRef] [PubMed]
- Kwokal, Z.; Franciskovic-Bilinski, S.; Bilinski, H.; Branica, M. A comparison of anthropogenic mercury pollution in Kastela Bay (Croatia) with pristine estuaries in Ore (Sweden) and Krka (Croatia). Mar. Pollut. Bull. 2002, 44, 1152–1169. [Google Scholar] [CrossRef]
- Covelli, S.; Faganeli, J.; Horvat, M.; Brambati, A. Mercury contamination of coastal sediments as the result of long-term cinnabar mining activity (Gulf of Trieste, northern Adriatic sea). Appl. Geochem. 2001, 16, 541–558. [Google Scholar] [CrossRef]
- Taylor, D.L.; Linehan, J.C.; Murray, D.W.; Prell, W.L. Indicators of sediment and biotic mercury contamination in a southern New England estuary. Mar. Pollut. Bull. 2012, 64, 807–819. [Google Scholar] [CrossRef] [Green Version]
- Stoichev, T.; Amouroux, D.; Wasserman, J.; Point, A.; De Diego, A.; Bareille, G.; Donard, O.F.X. Mercury speciation in surface sediments from of the Adour estuary and other bays of the Basque coast (Gulf of Biscay). Estuar. Coast. Shelf Sci. 2004, 59, 511–521. [Google Scholar] [CrossRef]
- Canario, J.; Caetano, M. Distribution of monomethylmercury and mercury in surface sediments of the Tagus Estuary (Portugal). Mar. Pollut. Bull. 2005, 50, 1142–1145. [Google Scholar] [CrossRef]
- Yanez, J.; Guajardo, M.; Miranda, C.; Soto, C.; Mansilla, H.D.; Flegal, A.R. New assessment of organic mercury formation in highly polluted sediments in the Lenga estuary, Chile. Mar. Pollut. Bull. 2013, 73, 16–23. [Google Scholar] [CrossRef]
- Hammershchmidt, C.R.; Fitzgerald, W.F.; Lamborg, C.H.; Balcom, P.H.; Visscher, P.T. Biogeochemistry of methylmercury in sediments of Long Island Sound. Mar. Chem. 2004, 90, 31–52. [Google Scholar] [CrossRef]
- Ram, A.M.A.; Zingde, M.D. Mercury enrichment in sediments of Amba estuary. Indian J. Mar. Sci. 2009, 38, 89–96. [Google Scholar]
Figure 1.
Sampling stations (1–14) along the Danshuei River Estuary in northern Taiwan. (STP: sewage treatment plant).
Figure 1.
Sampling stations (1–14) along the Danshuei River Estuary in northern Taiwan. (STP: sewage treatment plant).

Figure 2.
Scatter plots of (a) pH, (b) dissolved oxygen (DO), (c) suspended particulate matter (SPM), (d) Chl.a, and (e) dissolved silicate against salinity in the Danshuei River Estuary, northern Taiwan.
Figure 2.
Scatter plots of (a) pH, (b) dissolved oxygen (DO), (c) suspended particulate matter (SPM), (d) Chl.a, and (e) dissolved silicate against salinity in the Danshuei River Estuary, northern Taiwan.

Figure 3.
Scatter plots of (a) dissolved total Hg, (b) dissolved MeHg, (c) particulate total Hg, (d) particulate total Fe and (e) particulate total Mn concentrations against salinity in the Danshuei River Estuary, northern Taiwan.
Figure 3.
Scatter plots of (a) dissolved total Hg, (b) dissolved MeHg, (c) particulate total Hg, (d) particulate total Fe and (e) particulate total Mn concentrations against salinity in the Danshuei River Estuary, northern Taiwan.

Figure 4.
Scatter plots of (a) grain size, (b) TOC, (c) total Hg, (d) MeHg, (e) total Fe and (f) total Mn concentrations in sediment samples at the studied stations in the Danshuei River Estuary, northern Taiwan.
Figure 4.
Scatter plots of (a) grain size, (b) TOC, (c) total Hg, (d) MeHg, (e) total Fe and (f) total Mn concentrations in sediment samples at the studied stations in the Danshuei River Estuary, northern Taiwan.

Figure 5.
Percentage of (a) DMeHg/DTHg, (b) DTHg/THg, and (c) PTHg/THg against salinity in the Danshuei River Estuary, northern Taiwan.
Figure 5.
Percentage of (a) DMeHg/DTHg, (b) DTHg/THg, and (c) PTHg/THg against salinity in the Danshuei River Estuary, northern Taiwan.

Figure 6.
Scatter plots of (a) chl.a against dissolved MeHg, (b) Chl.a against dissolved total Hg, (c) particulate total Fe against particulate total Hg, (d) particulate total Mn against particulate total Hg concentration in the Danshuei River Estuary, northern Taiwan.
Figure 6.
Scatter plots of (a) chl.a against dissolved MeHg, (b) Chl.a against dissolved total Hg, (c) particulate total Fe against particulate total Hg, (d) particulate total Mn against particulate total Hg concentration in the Danshuei River Estuary, northern Taiwan.

Figure 7.
Scatter plots of log(KD) value for Hg (a) against salinity (b) against log(SPM) concentration in the Danshuei River Estuary, northern Taiwan.
Figure 7.
Scatter plots of log(KD) value for Hg (a) against salinity (b) against log(SPM) concentration in the Danshuei River Estuary, northern Taiwan.

Figure 8.
Scatter plots of (a) sediment grain size, (b) sediment TOC, (c) sediment Fe, and (d) sediment Mn against sediment total Hg concentrations in the Danshuei River Estuary, northern Taiwan.
Figure 8.
Scatter plots of (a) sediment grain size, (b) sediment TOC, (c) sediment Fe, and (d) sediment Mn against sediment total Hg concentrations in the Danshuei River Estuary, northern Taiwan.


Table 1.
Concentration ranges for different species of the analyzed Hg, the percentage of methyl Hg to total Hg in water and sediment samples, and the percentages of dissolved total Hg and particulate total Hg to total Hg in waters in the Danshuei River Estuary, northern Taiwan.
Table 1.
Concentration ranges for different species of the analyzed Hg, the percentage of methyl Hg to total Hg in water and sediment samples, and the percentages of dissolved total Hg and particulate total Hg to total Hg in waters in the Danshuei River Estuary, northern Taiwan.
| Dissolved Hg Conc. (ng/L) | Particulate Hg Conc. (ng/L) | Sediment Hg Conc. (ng/g) | Dissolved Methyl Hg (%) (DMeHg/DTHg) | Total Hg | ||||
|---|---|---|---|---|---|---|---|---|
| Total Hg | Methyl Hg | Par. Total Hg | Total Hg | Methyl Hg | DTHg (%) | PTHg (%) | ||
| Sampled time 3 January 2020 | ||||||||
| Min | 24.3 | 0.50 | 1.02 | 80.4 | 0.09 | 1.6 | 50.2 | 3.1 |
| Max | 34.0 | 7.71 | 24.3 | 363.8 | 0.32 | 30.4 | 96.9 | 49.8 |
| Sampled time 25 March 2020 | ||||||||
| Min | 27.7 | 0.62 | 3.78 | 115.9 | <0.01 | 1.9 | 43.5 | 8.3 |
| Max | 43.1 | 9.64 | 41.4 | 315.9 | 0.37 | 30.4 | 91.7 | 56.5 |
| Sampled time 16 July 2020 | ||||||||
| Min | 24.0 | 0.27 | 5.85 | 118.1 | 0.07 | 0.6 | 30.8 | 11.3 |
| Max | 45.8 | 5.77 | 55.13 | 378.5 | 0.75 | 23.9 | 88.7 | 69.2 |
Table 2.
Comparison the concentration ranges of dissolved total Hg (DTHg), dissolved methyl Hg (DMeHg), and particulate total Hg (PTHg) obtained in the Danshuei River Estuary with values reported for other eutrophic estuaries around the world.
Table 2.
Comparison the concentration ranges of dissolved total Hg (DTHg), dissolved methyl Hg (DMeHg), and particulate total Hg (PTHg) obtained in the Danshuei River Estuary with values reported for other eutrophic estuaries around the world.
| Studied Area | DTHg (ng/L) | DMeHg (ng/L) | DMeHg/DTHg (%) | PTHg (ng/g) | Reference |
|---|---|---|---|---|---|
| Danshuei RE, Taiwan | 24.0−45.8 | 0.27−9.64 | 0.6−30.4 | 108.7−1429 | This study |
| Wuli RE, China | 210−2700 | 0.048−3.0 | 0.03−0.39 | ND | [52] |
| East R/Pear R. delta, China | 11−49 | 0.08−0.21 | 0.2−3 | ND | [53] |
| Delaware RE, USA | 0.24−0.80 | 0.01−0.16 | <2−28 | ND | [10] |
| New Jersey Harbor RE, USA | 0.18−3.29 | 0.002−0.05 | 0.06−18.2 | 84.2−2427 | [16] |
| Hudson RE, USA | 0.22−11.7 | 0.01−0.16 | 0.4−42.2 | ND | [6] |
| Adour RE, France | 0.1−1.16 | 0.008−0.054 | 2.2−10.2 | 14−2314 | [8] |
| Scheldt RE, Belgium | 0.44−3.0 | 0.01−0.4 | ND | 40−1946 | [54] |
| Soca/Isonzo RE, Italy | 2.1−31.4 | 0.04−0.9 | 0.2−11.6 | ND | [55] |
| Aussa-River Marano lagoon, Italy | 20−283 | ND | ND | 1100−20.300 | [56] |
| Ria de Aveiro lagoon, Portugal | 8.5−95 | ND | ND | 100−3400 | [57] |
| Tagus RE, Portugal | 3.6−65.4 | 0.06−6.42 | 0.5−30 | 361−8625 | [11] |
ND: no data.
Table 3.
Comparison of concentration ranges for total Hg (THg) and methyl Hg (MeHg), and the percentage of methyl Hg to total Hg in sediment obtained from the Danshuei River Estuary with other eutrophic estuaries elsewhere in the world.
Table 3.
Comparison of concentration ranges for total Hg (THg) and methyl Hg (MeHg), and the percentage of methyl Hg to total Hg in sediment obtained from the Danshuei River Estuary with other eutrophic estuaries elsewhere in the world.
| Studied Area | THg (ng/g) | MeHg (ng/g) | MeHg/THg (%) | Reference |
|---|---|---|---|---|
| Danshuei RE, Taiwan | 80.4−78.5 | 0.001−0.75 | <0.01−0.34 | This study |
| Haihe R, China | 60−8779 | 0.8−21.7 | 0.1−2.2 | [47] |
| Wuli RE, China ** | 800−64000 | 180−35000 | 0.017−0.49 | [52] |
| Minamata Bay, Japan ** | 340−4470 | 3.5−5.06 | 0.08−0.17 | [4] |
| Delaware RE, USA | 100.3−862.5 | 0.06−1.44 | 0.1−0.45 | [10] |
| Narragansett Bay, USA | 35−2629 | 0.14−8.59 | 0.03−1.32 | [85] |
| San Francisco Bay, USA | 20−702 | 0.02−3.41 | <0.2 | [14] |
| Adour RE, France | 0.4−1464 | 0.1−1.6 | 0.01−1.8 | [86] |
| Soca/Isonzo RE, Italy | 1650−17200 | 0.21−6.28 | <0.12 | [55] |
| Scheldt RE, Belgium | 4.0−736 | 7.0−471 | ND | [54] |
| Tagus RE, Portugal | 8−49345 | 0.3−32 | 0.02−0.4 | [87] |
| Krka RE, Croatia | 101−1418 | 0.4−2.96 | <0.01−2.7 | [83] |
| Kastela Bay, Croatia ** | 14280−74000 | 6.05−36.7 | 0.04−0.18 | [83] |
| Lenga RE, Chile** | 500−129000 | 11−53 | 0.02−5.7 | [88] |
ND: No data, ** The environment was polluted by discharge from the Chlo-alkali plant.
Publisher’s Note: MDPI stays neutral with regard to jurisdictional claims in published maps and institutional affiliations. |
© 2021 by the authors. Licensee MDPI, Basel, Switzerland. This article is an open access article distributed under the terms and conditions of the Creative Commons Attribution (CC BY) license (https://creativecommons.org/licenses/by/4.0/).
Share and Cite
MDPI and ACS Style
Fang, T.-H.; Lien, C.-Y. Different Mercury Species Partitioning and Distribution in the Water and Sediment of a Eutrophic Estuary in Northern Taiwan. Water 2021, 13, 2471. https://doi.org/10.3390/w13182471
AMA Style
Fang T-H, Lien C-Y. Different Mercury Species Partitioning and Distribution in the Water and Sediment of a Eutrophic Estuary in Northern Taiwan. Water. 2021; 13(18):2471. https://doi.org/10.3390/w13182471
Chicago/Turabian StyleFang, Tien-Hsi, and Chia-Yu Lien. 2021. "Different Mercury Species Partitioning and Distribution in the Water and Sediment of a Eutrophic Estuary in Northern Taiwan" Water 13, no. 18: 2471. https://doi.org/10.3390/w13182471
Note that from the first issue of 2016, this journal uses article numbers instead of page numbers. See further details here.