1. Introduction
The concept of cloud seeding was first put forward by Louis Gathmann in 1891, suggesting that shooting liquid carbon dioxide into rain clouds might accelerate the raining process [
1]. During the 1930s, the Bergeron–Findeisen process theorized that supercooled water droplets present while ice crystals released into clouds would cause precipitation [
2]. In the 1940s, multiple studies and experiments were performed with the discovery of artificial ice nucleation by both dry ice and silver iodide.
Traditional weather modification methods mostly rely on solid carbon dioxide or silver iodide and other hygroscopic salts. While positive results have been acquired over years of experiments and implementations [
3,
4,
5,
6,
7], there are still several issues to be mentioned. Whether cloud seeding is effective in producing a statistically significant increase in precipitation is still a matter of academic debate, with contrasting results depending on the study in question. In addition, traditional weather modification usually delivers catalyst via aircraft or rockets, which would be too costly and complex to perform. Negative impact on the environment and health is also a controversial issue [
8,
9,
10].
With all the concerns mentioned above, cloud seeding by charged particles seems to be a solution. The cloud chamber theory was first put forward by Wilson in 1895, that the ions produced by radioactive material are able to serve as condensation nuclei in super-saturated water vapor environment. The theory was at first used for visualizing the passage of ionizing radiation. It took a long time before its connection with weather modification was found. Nielsen conducted an electrodynamic balance experiment to test the effect of electric charge on atmospheric water particles [
11]. Hoenig demonstrated the possibility of extracting water vapor from the air by forming condensation on the needle [
12]. Uchiyama and Jyumonji developed an electrostatic fog liquefier, which charged fog particles and attracted them to the reverse polarization electrode [
13]. Harrison suggested that ions can affect the formation of clouds and raindrops at multiple stages throughout the precipitation process [
14]. Khain proposed a method of accelerating droplet collision with the help of charged droplets and proved its remarkable effect on enhancing precipitation and defogging under sowing and natural conditions [
15]. Hortal conducted further laboratory experiments and observed droplet growth in the chamber with electrical discharge [
16]. Chin proposed that, based on laboratory observations, the ionic wind generated by corona discharge will play an important role in the generation of precipitation [
17]. Tan also proved the growth of a single droplet would be enhanced with the help of charge on it and further investigated the formation of corona discharge-induced rain and snow in a 15,000 m
2 artificial climate room.
Ion-based precipitation enhancement trials have also been carried out by a few countries and organizations, and proved positive [
18,
19]. ELAT Corporation constructed 17 ground-based charged catalytic particle stations in Mexico and claimed to enhance local monthly precipitation by 50%. The Meteo Systems Corporation realized 52 precipitations on the edge of the Abu Dhabi desert applying the technique. The Australia Precipitation Technology has performed several trials in Oman since 2013 and enhanced local yearly precipitation by 18%. These field experiments suggest that ion-based cloud seeding has the potential to enhance precipitation under certain well-constrained conditions. In addition, most trials are located by the coast, offering abundant moist sea draft. Northwest China is one of the most water-stressed regions in the world, located inland [
20]. Various cloud seeding attempts have been carrying out to increase precipitation and mitigate the projected future reduction in China [
21]. New technique to cloud seeding in China, coupling research in ion-based cloud seeding performance inland, led to the first negative ion-based cloud seeding and rain enhancement in China [
22].
The paper is organized as follows.
Section 1 introduces the background and significance of the trial.
Section 2 gives a whole overview of the trial, including trial schedule and location, experiment design, as well as the seeding procedures and facilities.
Section 3 offers the analysis methodology.
Section 4 provides the results of the trial.
2. Trial Overview
The equipment used in this experiment is a ground-based negative ionization system, and the working principle is to enhance the microphysical process of precipitation formation in multiple stages, which ultimately leads to an increase in precipitation on the ground downwind of the emitter. There is one device in Wushaoling, and three other independent devices in Liupan Mountain. Meanwhile, dedicated integrated monitoring instrument networks are designed and constructed for the trial, surrounding the negative ionization system, mostly downwind.
2.1. Principle and Seeding Procedures of the Ion-Based Rain Enhancement
The principle of ion-based cloud seeding can be described as follows. Water vapor condenses into small droplets when encountering cold airflow at high altitude. With abundant vapor in the cloud, the condensation process will continue, and thus droplets accumulate until precipitation is formed. With the help of ice-forming nuclei (IFN) and cloud condensation nuclei (CCN), the condensation process will be accelerated and easier to reach the condition to form precipitation. The presence of space charge enhances both contact ice nucleation and population of particles effective as condensation nuclei. Both cases will play important roles in droplet condensation and thus eventually result in precipitation enhancement.
The seeding procedures can be conceptualized with the ground-based negative ionization system as follows. Aerosols with negative ions are created via applying high voltage DC to the device so that particles close to the electrode will be negatively charged. As the plume of charged particles drifts with the updraft to the cloud layer, which may form precipitation, it is lifted orographically and dispersed by mechanical mixing, atmospheric electric field and possibly other turbulent processes to fill a relatively large volume of cloudy air. The particles act as condensation nuclei as a result of electrostatic forces. The charged aerosols have a polarizing effect on other neutral water molecule clusters so that the nucleation of the cloud droplets and ice crystals will be accelerated over what would happen naturally. In a water-saturated condition, these cloud droplets and ice crystals will eventually grow until they are large enough to fall to the ground, leading to precipitation in the target area [
23,
24].
2.2. Trial Location
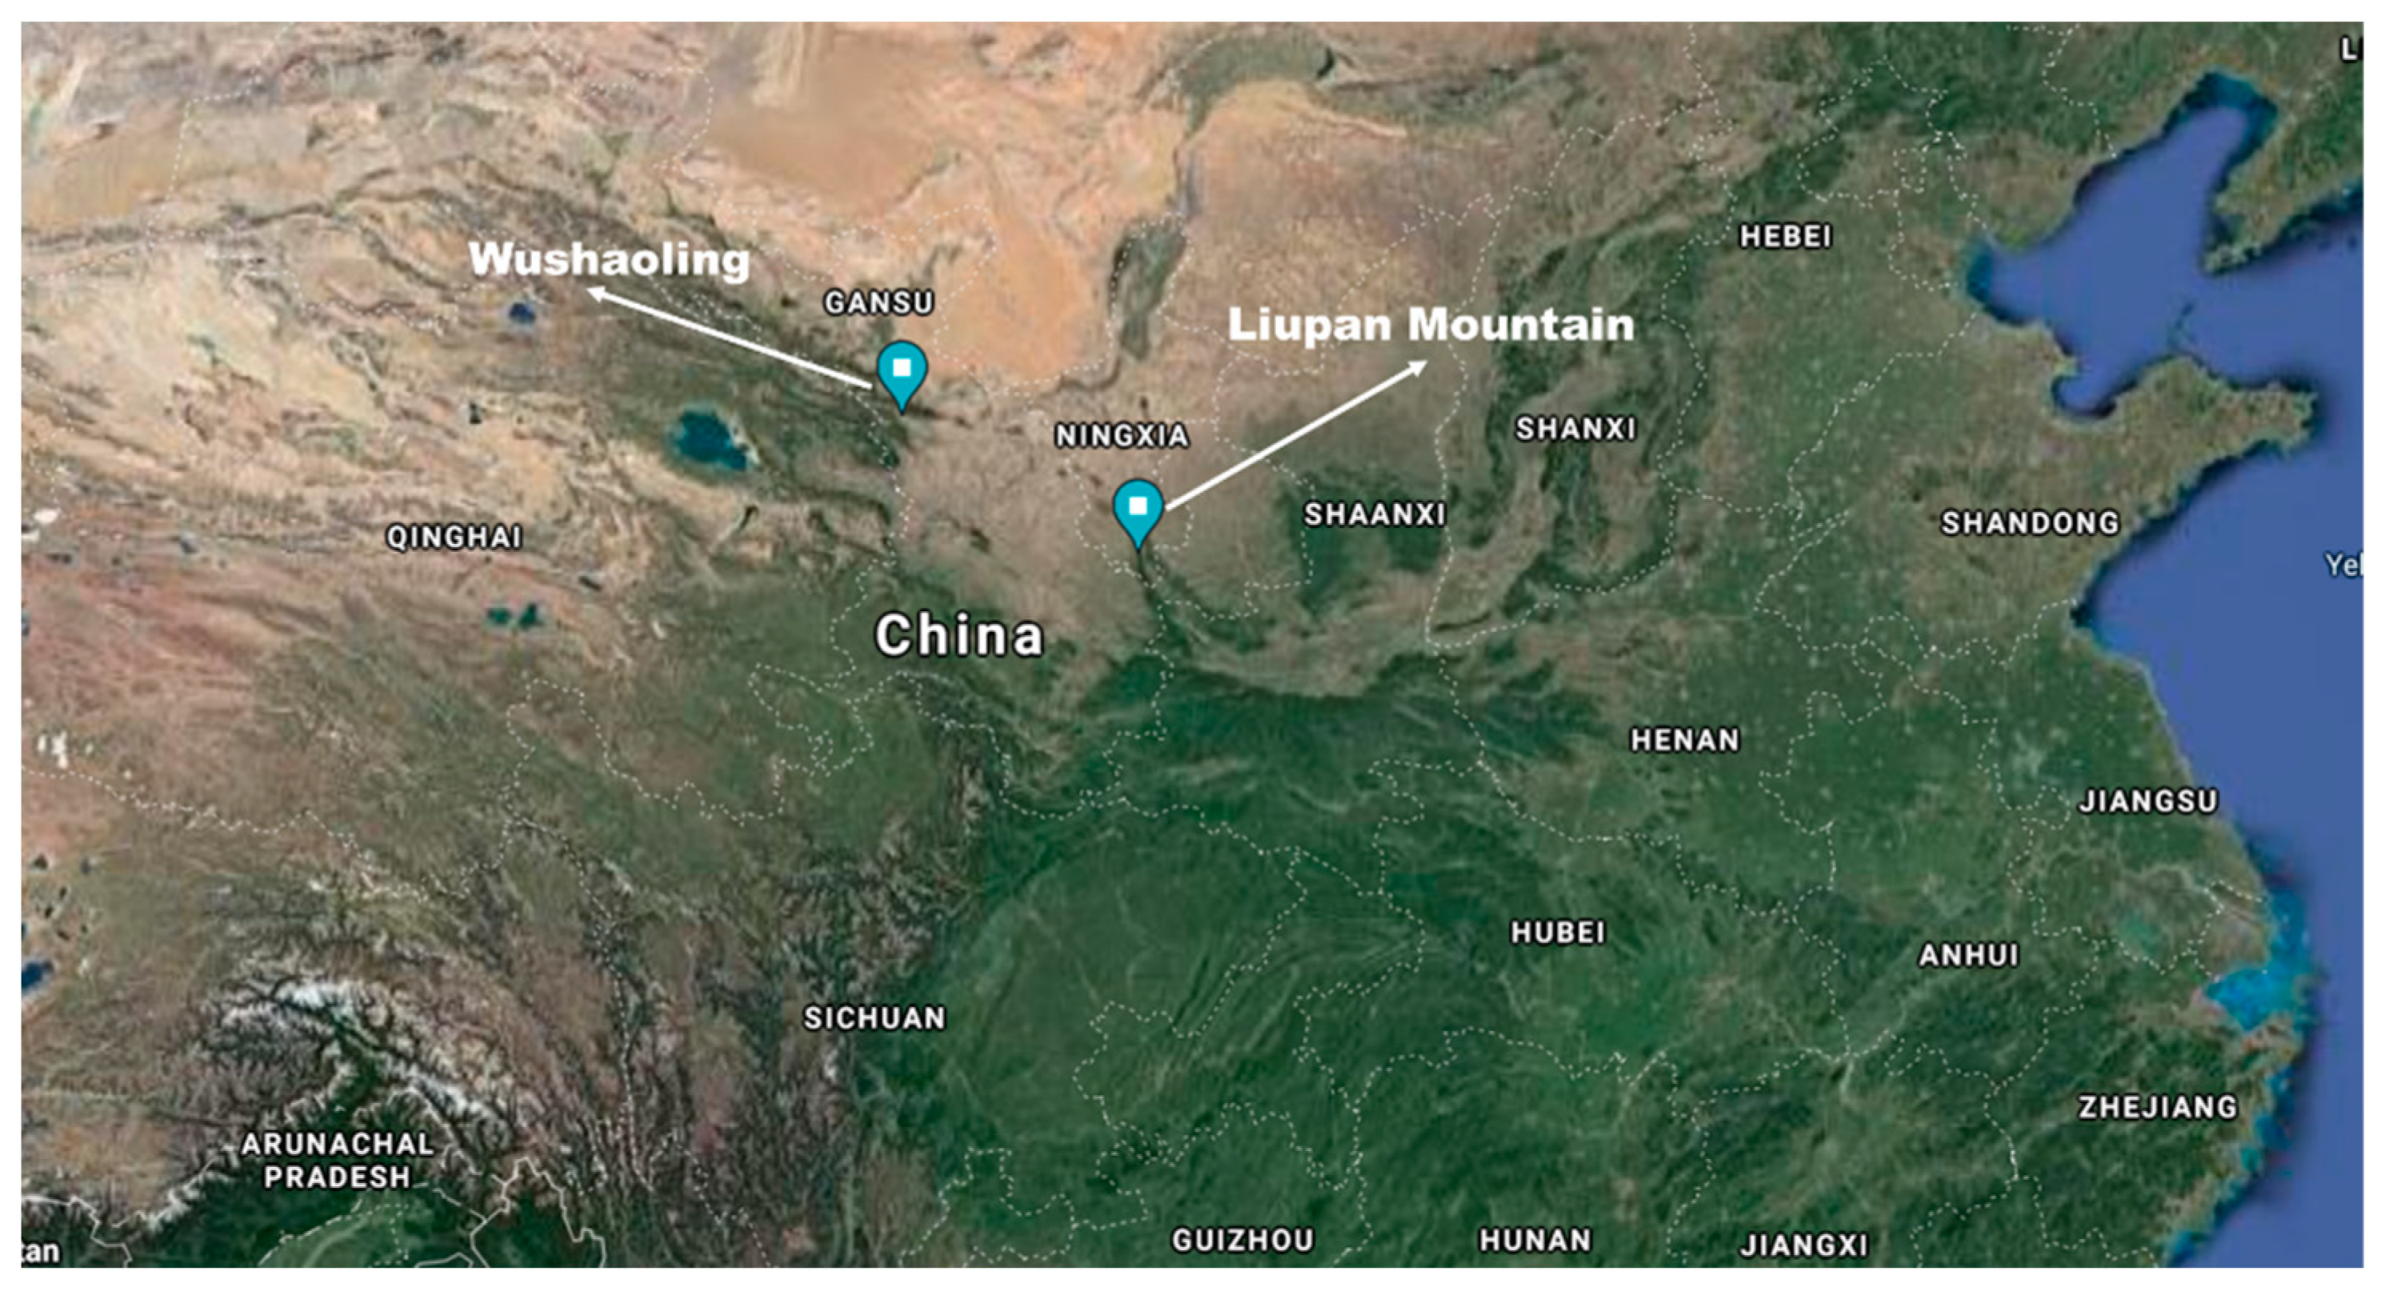
Two trial locations, Wushaoling and Liupan Mountain, were chosen, considering local synoptic and wind flows, cloud types, terrain, humidity and widespread uplift. Such features affect the delivery of charged particles or aerosols to the cloud layer and potential subsequent precipitation enhancement.
Figure 1 is an overview map of the general region.
Wushaoling is located in the middle of Tianzhu Tibetan Autonomous County, Wuwei City, Gansu Province, southeast end of the northern branch of Qilian Mountains. Topographically, Wushaoling is located at the intersection of the Loess Plateau, the Qinghai-Tibet Plateau, and the Inner Mongolia Plateau, with a length of 17 km and an average elevation of 3562 m. Climatically, sub-arid, mid-temperate sub-arid, and mid-temperate arid zone intersect in Wushaoling. The east of Wushaoling is the monsoon region with outflow, and the west is the non-monsoon region with inflow. The main source of surface runoff replenishment are precipitation and melting ice and snow, with a great interannual variation. There is an updraft at the site. Abundant moisture input is provided compared with the surrounding area. Taking power supplies, traffic, and other factors into account, the site in Wushaoling is located on the top of Maomao Mountain, relatively close to the local meteorological station. The site is installed on the windward slope of the airflow, indicating that the charged particles would be transported easier to the cloud layer. A satellite map of the Wushaoling area is shown in
Figure 2, with the experimental devices and precipitation gauges labeled.
Liupan Mountain ranges in northern China extending southward from Hui Autonomous Region of Ningxia across the eastern panhandle of Gansu province and into western Shanxi province, with a general elevation of 2000 m and individual peaks that reach 2995 m. The mountain is located on the northwestern edge of the southwest monsoon region, with southwest wind prevailing throughout the year. The area has an average of 133.7 days of precipitation and annual precipitation of 675.7 mm. The amount of cloud formation and water vapor is much higher than surrounding areas based on previous studies. The trend and extent of the convergence zone of the water vapor flux produced by the Liupan Mountain topography are consistent with that of the mountainous area. The dynamic effect of the low-level convergence and high-altitude divergence configuration in mountainous areas is conducive to the occurrence and development of precipitation. There is still considerable development space for precipitation enhancement. Three sites are located in Liupan Mountain, centered on a local meteorological station. The distances between the three sites are relatively close, while they are all constructed on different tuyeres, so that the catalytic effect of charged particles is expected to be more obvious. A satellite map of the Liupan Mountain area is shown in
Figure 3, with the experimental devices and precipitation gauges labeled.
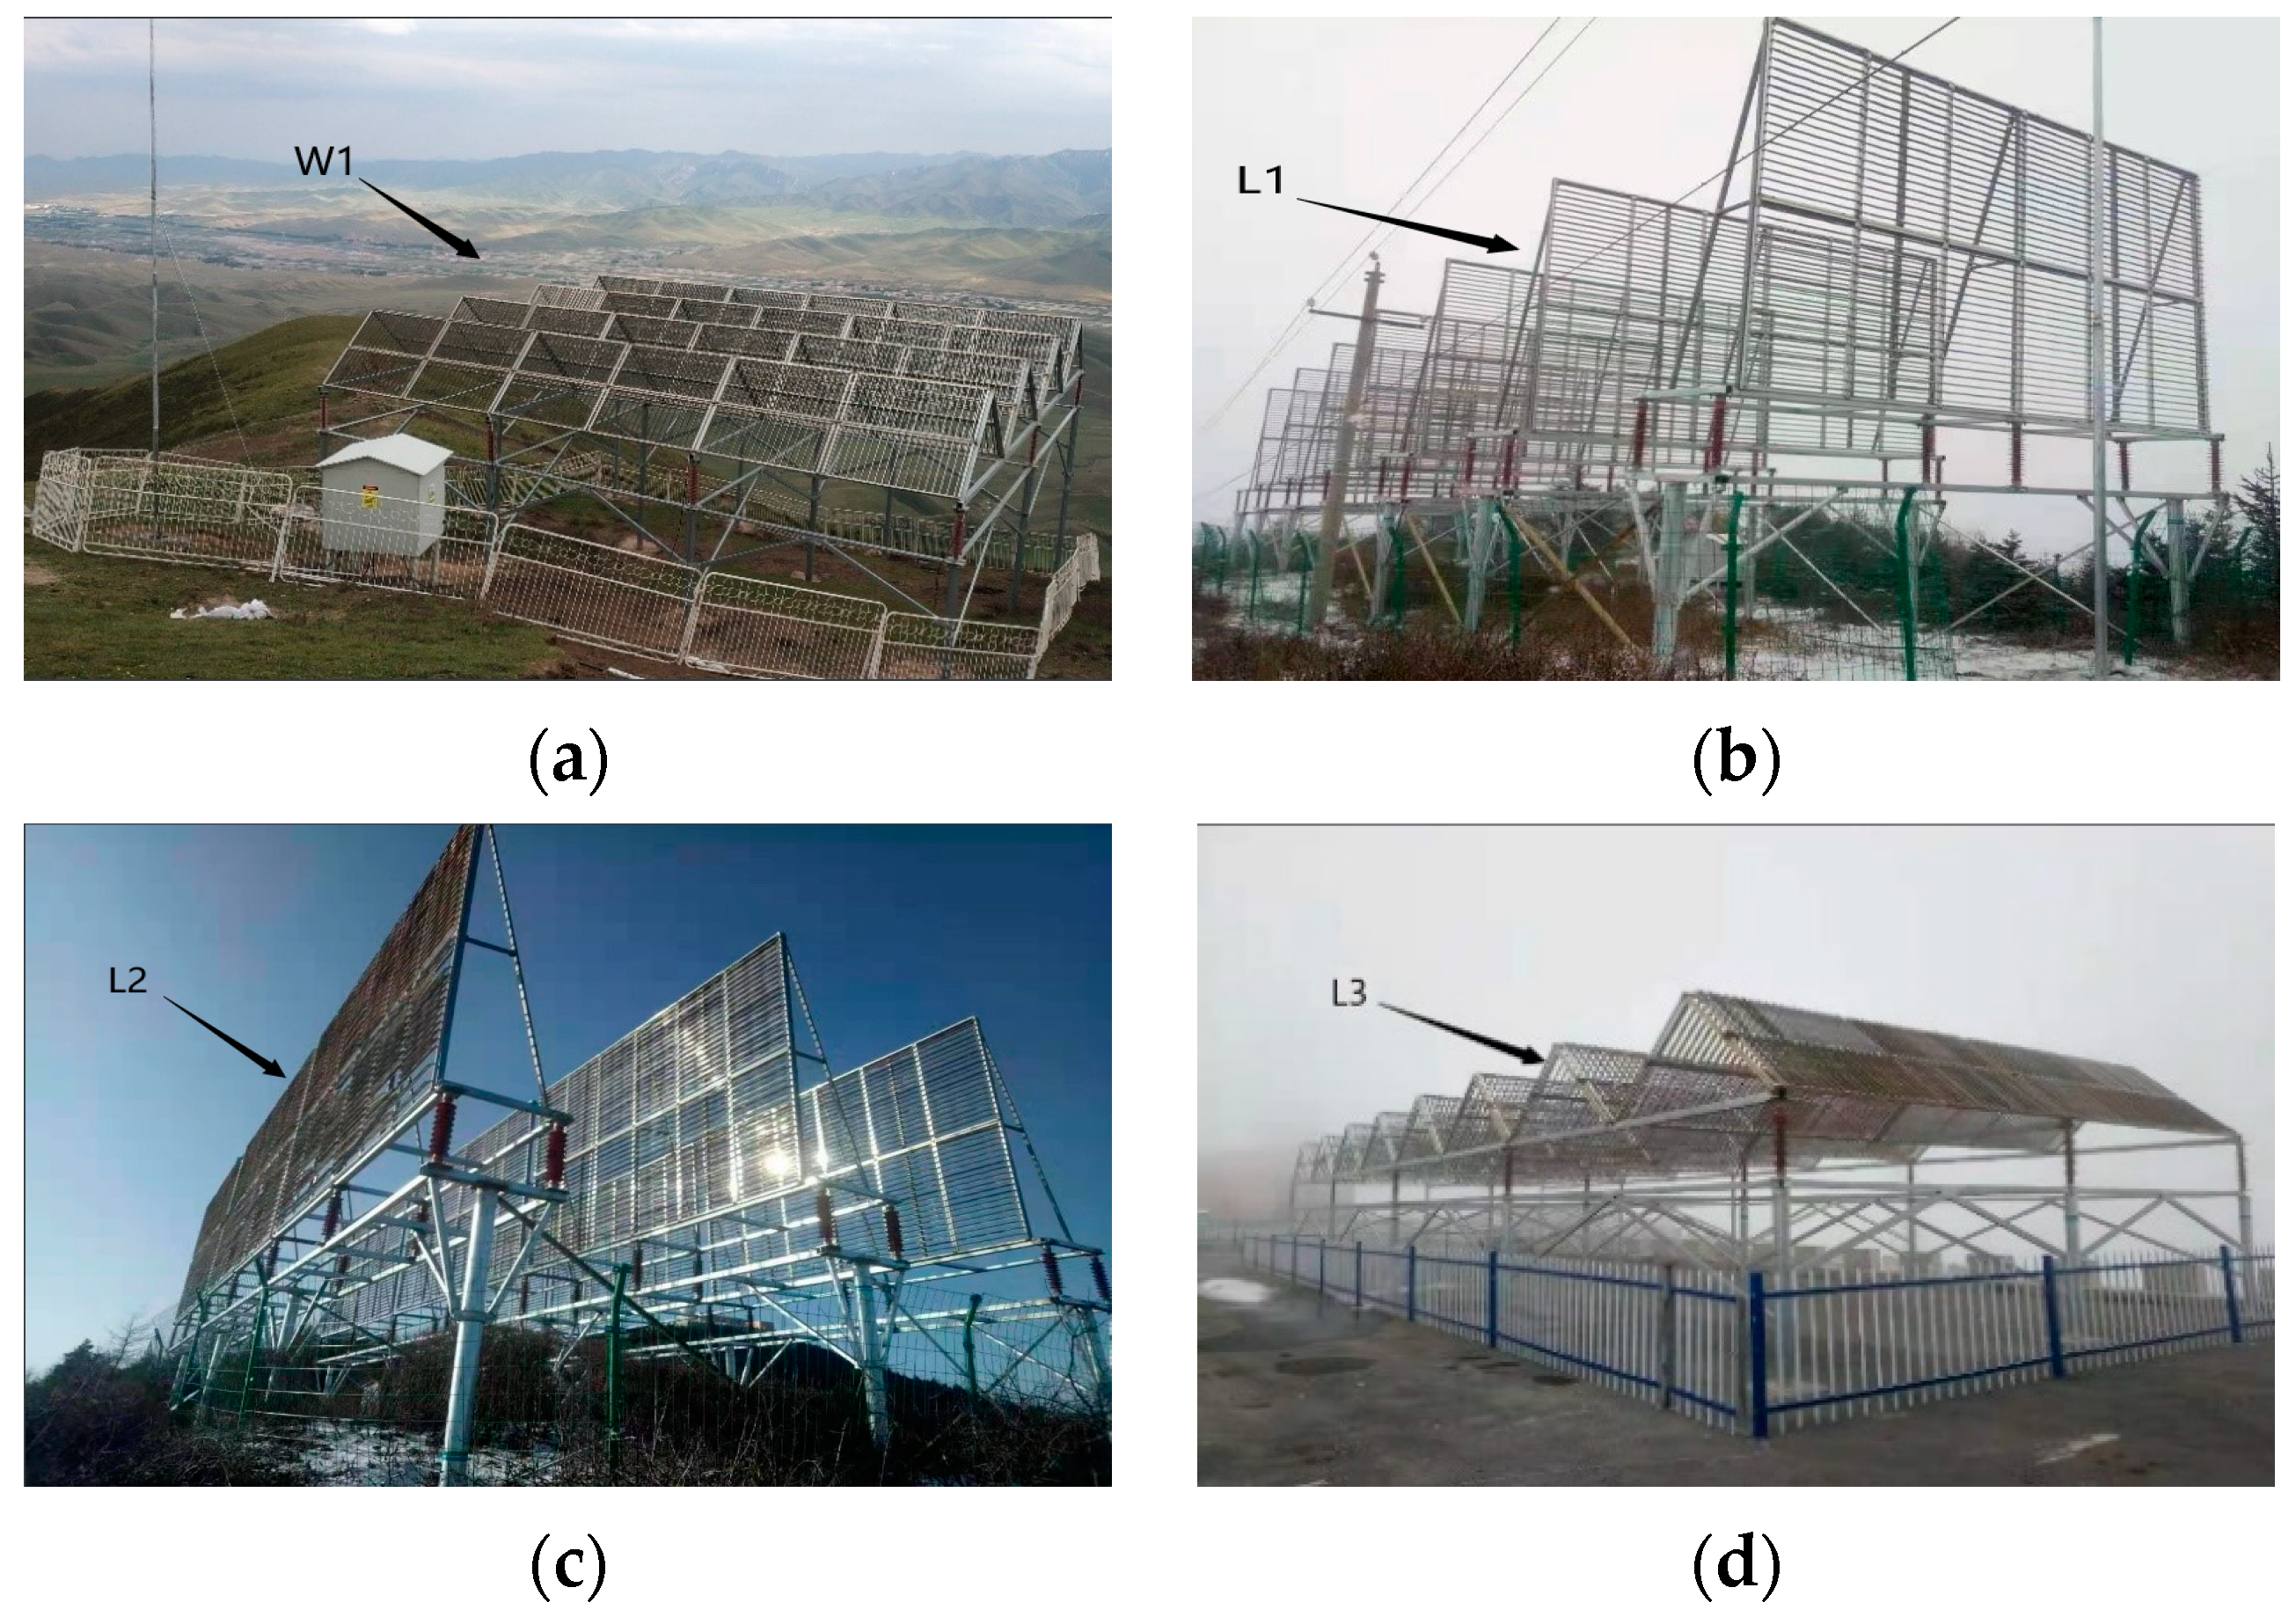
Locations and construction of the sites are shown in
Figure 4.
Figure 4.
(
a) The ground-based negative ionization system in Wushaoling (W1); (
b) The first ground-based negative ionization system in Liupan Mountain (L1); (
c) The second ground-based negative ionization system in Liupan Mountain (L2); (
d) The third ground-based negative ionization system in Liupan Mountain (L3).
Table 1 presents more detailed information on one ground-based negative ionization system at Wushaoling and three at Liupan Mountain.
Table 1.
Information about the ground-based negative ionization systems.
Table 1.
Information about the ground-based negative ionization systems.
| System Serial | Latitude (N) | Longitude (E) | Elevation (m) | Date of Installation | Time of Operation/In-Operation | Range of Precipitation Data |
|---|
| W1 | 37°12′03.40′′ | 102°53′29.40′′ | 3529 | 2019.11 | 2020.7–2020.11 | 2019.5–2020.11 |
| L1 | 35°39′42.17′′ | 106°11′41.82′′ | 2790 | 2020.4 | 2020.8–2020.11 | 2020.4–2020.11 |
| L2 | 35°39′41.73′′ | 106°12′17.03′′ | 2771 | 2020.4 | 2020.8–2020.11 | 2020.4–2020.11 |
| L3 | 35°39′47.51′′ | 106°12′06.06′′ | 2837 | 2020.4 | 2020.8–2020.11 | 2020.4–2020.11 |
2.3. Ionization System and Meteorological Monitoring Instrument Network Design
The smaller the radius of the electrode, the better effect of the corona discharge tends to be. According to the simulation and prototype experimental results, blade electrode was finally adopted as the discharge terminal. As all the sites are located on the windward slopes, the devices adopt a roof structure to make it easier for charged particles to spread with the wind. However, L1 and L2 are located in the nature reserve in Liupan Mountain. At the request of relevant department, a board structure is adopted to reduce the shadow area they take. The roof structure itself is strong enough to resist the strong wind on the top of the mountain. The board structure is reinforced for better stability [
22]. Our panels are windward to help with the diffusion of negative ions.
Each site is powered by three individual DC power supplies with a maximum voltage output of 100 kV. The power supplies can be remotely controlled by connecting the terminal host to the control system via the Ethernet. The time of operation, voltage, current and error logs are automatically recorded locally and backed up in a database.
To better evaluate the actual effect of cloud seeding, meteorological monitoring instrument networks were designed and constructed in both experimental areas to provide a higher temporal and spatial resolution of the precipitation and other meteorological characteristics. Previous studies based on historical meteorological data indicated the dominant wind direction of the experimental area [
22]. It is assumed that the charged particles spread with the airflow. Thus, the meteorological monitoring instrument network is mainly constructed downwind the ionization system. The meteorological monitoring instrument networks consist of rain gauges and multi-function stations. The specific locations of these multi-functional stations are shown in
Table 2. Since both trial areas are located on a high altitude, the temperature is often below 0 °C. Therefore, solid precipitation measurement gauges have also been installed with the multi-function stations. Data collected by the meteorological monitoring instrument networks can be obtained through web or directly from the database. Meteorological characteristics and their resolution are shown in
Table 3.
2.4. Supplementary Data
The meteorological monitoring instrument network was completely established in 2019 and therefore had not accumulated enough data to support historical contrast. Therefore, additional data has been obtained from local meteorological stations from Wushaoling and Liupan Mountain, supplying hourly data on temperature, humidity, air pressure, visibility, precipitation, wind direction, and other elements, from 2008 to present. In addition, we were supported by the national meteorological stations in Longde County and Guyuan City near Liupan Mountain, which are closer to Liupan Mountain and have stronger reference value for our experiments. We combined the data from these two stations to train a neural network to assist in predicting the rainfall in Liupan Mountain. The locations of these stations are shown in
Table 4.
In addition, to observe possible microphysical processes that take place in clouds during the cloud seeding, an all-sky imager has also been constructed next to the device in Wushaoling.
2.5. Experiment Design
The seeding procedures are relatively uncontrollable in both time and space scale with great uncertainty. The speed and directions of the diffusion of charged particles, as well as the response of different cloud layers are all greatly affected by natural conditions, and little research have been carried out so far. Thus it is necessary to design a variety of comparative experiment methods, using time, space, and natural conditions such as the wind direction and velocity to establish various experimental and control groups to perform the whole experiment.
The trial employs a regional regression design as the basic principle. Based on this principle, to minimize the effect caused by random and unknown temporal and spatial covariates that may influence the effect and result of the experiment, the randomized design is employed. In addition, regional regression experiments often take a fixed control and target area, and precipitation of both areas is summed up by all the rain gauges within a certain range. In this way, it is more convenient for statistics, but the spatial resolution is lost, therefore reducing the sensitivity of the statistical test greatly. Considering the effect area and the operation characteristics of the device are still unknown, dynamic control and target area based on wind direction are taken. Based on this, the spatial resolution can be improved and it is more likely to determine the scope of the influence. Meanwhile, with the help of a neural network for regression, integrated characteristics and precipitation data can be made full use of and forecast accuracy and temporal resolution will be improved.
Geographically, the scope of the influence of the charged particles is downwind of the device. Thus the trial area can be divided into control and target groups according to the terrain, wind speed and velocity. The spatial target group was defined as the area downwind according to the wind direction, and the rest of the experimental area was defined as the control group.
2.6. Trial Schedule
Due to COVID-19, experiments could not be carried out as planned and thus the devices were left unused for quite a long time. In addition, weather conditions on both trial locations were extreme and led to minor damage to the device. Both factors delayed the experiment and thus, the rain enhancement operation phase was postponed until midyear of 2020. The schedule of the two experimental areas is shown in
Table 5.
This period was chosen to capture the water vapor transported by the monsoon with consistently suitable conditions for cloud seeding operations, while the temperature was still warm enough so that the devices would not be frozen.
3. Analysis Methodology
The outfield trial was successfully conducted in 2020, and now it is necessary to analyze and evaluate the effect of the trial. Effectiveness assessment is an important part of the artificial precipitation test, and its basic requirements are scientific, objective and quantitative. Since the actual operating characteristics, the range of influence, and the action time of the negative ion generating device are unknown, a set of special analysis methods is designed to evaluate the effect of the experiment.
3.1. Machine Learning Anomaly Detection
For a scientifically valid assessment, an important task is to estimate the natural precipitation in the experimental area, assuming an unseeded scenario. This allows us to distinguish between the natural precipitation component and the catalytic increase component of the actual precipitation. In the traditional precipitation effectiveness assessment, a linear regression approach is often used to derive precipitation, which requires the establishment of historical regression equations for the target and comparison areas. However, this method tends to predict seasonal or annual precipitation and neither high is the prediction accuracy, nor can it analyze meteorological data collected from multiple stations. Thus, we tried to use machine learning to help us, using neural networks to predict precipitation in a hypothetical unseeded scenario in the trial area. The anomaly detection is a comparison of the model’s predictions with the actual precipitation. If they are very similar, there is no anomaly, indicating that the precipitation is not disturbed by anything other than natural precipitation. If the difference is large, it means that there is a disturbance.
The anomaly detection method is used to demonstrate that precipitation during the experiment was influenced by something other than natural conditions. A neural network model was established to predict precipitation. The prediction model was trained using data from 2008 to 2018. The accuracy of the model was tested by predicting the precipitation in 2019. The model is optimized and adjusted to meet our requirements before predicting the precipitation in 2020. We conducted the experiment from July to November, so the actual precipitation for this period includes both the natural precipitation component and the catalytic precipitation enhancement component. We train the neural network using historical data, and the result of the network prediction is the natural precipitation component.
Artificial precipitation augmentation can be considered as an anomalous disturbance to nature, and using the method of residual anomaly detection for rainfall augmentation effect assessment can minimize the influence of natural precipitation fluctuation on the assessment effect. By comparing the actual precipitation during the experiment with the predicted values from the model (i.e., natural precipitation), we can calculate how much the actual precipitation has increased compared to the natural precipitation. This increase is brought about by the experimental catalysis. The experimental increase in precipitation is calculated as follows.
3.2. Analysis of Historical Precipitation Data
Both the Liupan Mountain meteorological station and the Wushaoling meteorological station have extensive historical records. Since the field trial was conducted from July to November in 2020, we need to study the precipitation during this time of the year in order to find the evidence of increased precipitation in 2020. We studied and analyzed the precipitation data from July to November for each year from 2008 to 2020 to find the difference in 2020. We performed significance tests on the experimental data. A common test used in the evaluation of artificial precipitation effects is the t-test, also known as the Student’s t-test, which is applied to a normal distribution with a small sample and an unknown sample standard deviation. A t-test is a type of inferential statistic used to determine if there is a significant difference between the means of two groups. We ran a t-test on the data from the experimental and control groups to obtain a p-value, which indicates the statistical significance that the two groups have the same different value. We expect the low value of p-value to indicate that our experiment changed the mean value of factors such as precipitation.
3.3. Analysis of the Randomized Comparative Trial
According to the original experimental plan, we conducted a randomized comparative experiment in 2020. The trial was started in July in the Wushaoling experimental area. At the beginning of the trial, we turned on and off the negative ion generation device in the Wushaoling trial area according to a randomization rule. Define the duration of the operation as the experimental group while the rest as the control group. When the trial began in August in the Liupan Mountain experimental area, the experimental strategy was changed in view of the relatively short duration of the trial. We turned on the device for a long time in both experimental areas and only randomized short interruptions to provide data for the control group. Thus, the truly randomized comparison experiment was only conducted in the Wushaoling area for part of the trial period. We only analyze the Wushaoling in this section.
A number of precipitation gauges were installed in the experimental areas to record the precipitation during the experiment. We summed the data recorded to obtain the precipitation during the experiment at that site, which minimizes individual chance from each one.
We counted the precipitation in the experimental group and the control group separately to calculate the increase in the experimental group. Then we have to perform significance tests on the two sets of data to infer the probability of occurrence of the difference.
3.4. Analysis of the Effect of Geographical Location on the Precipitation Augmentation
There are several precipitation gauges in our experimental area, scattered and far apart. They collected different amounts of rain during the trial, reflecting that the distribution of the precipitation within the trial area is variable. We plot the precipitation of the experimental group in the randomized comparison experiment on a map to obtain a tensor to observe the precipitation distribution during the experiment. In addition, to eliminate the precipitation differences at the stations themselves, we also need to plot the precipitation of the control group in the randomized comparison experiment to obtain another tensor, from which the precipitation distribution in the case of natural precipitation can be observed. Then, these two tensors are subtracted to obtain the distribution of precipitation increments in geographic locations.
3.5. Analysis of the Effect of Wind Direction on the Precipitation Augmentation
The influence of wind is significant during the operation of the negative ion generation device. The negative ion generated by the device need to be spread out by the wind and then come to catalyze the precipitation. If there is no wind, the negative ion will spread very slowly. This will result in our device having a very small range of influence and only works very close to the area. If there is wind, theoretically, the catalytic effect at the downwind will be higher than that at the upwind because the downwind gets more negative ions [
22,
25].
In order to analyze the effect of wind on the distribution of precipitation augmentation effect in the experimental area during the trial, we analyzed the precipitation and wind data from the self-built rain gauges to investigate the relationship between wind direction and catalytic rainfall augmentation effect. This is done by dividing all the precipitation stations into upwind and downwind stations just according to the wind and the location of the device. In order to minimize the effect of precipitation differences between the precipitation stations themselves, the precipitation data for each station is subtracted from its own natural precipitation, which is calculated from the precipitation measured when the device is turned off. In this way, we get the precipitation’s augmentation. The average of the precipitation’s augmentation at the upwind and downwind stations is counted separately to find the increment at the downwind compared to the upwind. This makes it possible to calculate how much stronger the catalytic effect is at the downwind than at the upwind.
3.6. Analysis of the Concentration of Negative Ions
According to the principle of the experimental device, the device catalyzes precipitation by generating negative ions to act as a catalyst. Therefore, the concentration of the negative ions determines the effectiveness of the device. In order to verify the effect brought by the device, the concentration of negative ions was analyzed and compared to test the effectiveness of the device. Theoretically, an increase in the concentration of negative ions will catalyze the completion of more precipitation, so the concentration of negative ions is a direct reflection of the experiment. Since the negative ion is a new type of test, few meteorological stations measured this indicator before our project began. Only the integrated meteorological station designed and established by the project itself has it tested. We compared the concentration of negative ions when the device was on off to find the effect of the device on it.
3.7. Analysis of All-Sky Imager’s Data
There is an all-sky imager in Wushaoling that provides continuous automatic monitoring of cloudiness in the sky during the day. According to common sense, weather with a lot of clouds is more likely to produce precipitation. We could study the changes of cloudiness to evaluate the effectiveness of the device. By exploring whether the cloud volume increases significantly during the experiment, we can determine how effective the experimental device is.
4. Results
4.1. Analysis Results of Machine Learning Anomaly Detection
We built a neural network to predict the natural precipitation in 2020 for the Liupan Mountain area. We mainly used the historical data from the Liupan Mountain meteorological station to train the neural network. These data range from 2008 to 2018, and with temperature, humidity, air pressure, wind direction, wind speed, and month of Liupan Mountain as characteristics. We trained without using the precipitation of Liupan Mountain station because precipitation is the label of the data, which is to say, the model is trained to predict the precipitation of Liupan Mountain. The precipitation data from meteorological stations in Longde and Guyuan was also used as features. The meteorological data of Longde and Guyuan meteorological stations are relatively complete and close to the Liupan Mountain experimental area, with strong relevance in natural precipitation. One thing to note is that the precipitations in Longde and Guyuan are thought NOT to be affected by the trial, while the precipitations in Liupan Mountain are affected.
It should be emphasized that the precipitation data from these two stations were only used for training the model, and the model can only predict the precipitation in Liupan Mountain. This is because the model was trained using all the data from Liupan Mountain except for precipitation. For the meteorological stations in Longde and Guyuan, no data were used except for precipitation. The model needs inputs when it makes predictions of the precipitation of the Liupan Mountain. The input meteorological data are almost all from Liupan Mountain, while only precipitation data from Longde and Guyuan are used to assist in training the model. So the precipitation predicted by the model is for Liupan Mountain.
The model was trained with historical data from 2008 till a year before the trial stared. The model can predict the precipitation quite accurately when the trial is not conducted (this is the normal scenario). During the trial, precipitation in Liupan Mountain would be affected. The surface measurement excluding precipitation should not be affected by the trial, neither precipitation of the other two stations. So the model is predicting the precipitation of Liupan without the effect of the trial. However, the precipitation in Liupan is affected by the trial, so the model gives a large prediction error; the real precipitations are larger than the predicted values, which is an anomaly. This anomaly is caused by the trial.
Before predicting natural precipitation in 2020, precipitation in 2019 is predicted (no precipitation augmentation tests were conducted in 2019), which aims to optimize and test the performance of the neural network. The data from 2008 to 2016 were used as the training set, 2017 and 2018 as the validation set, and 2019 as the test set. The daily precipitation was predicted using neural networks. The specific results are shown in
Table 6.
As can be seen from
Table 6, the difference between the actual and predicted values of daily precipitation from January to November is only 1.42%, which is less than 2%. We calculated the coefficient of determination (R2) for the predicted and actual values, and the result was 0.91, which is closer to 1. This indicates that the model is relatively accurate in predicting daily precipitation. The actual value from January to July was 2.62% higher than the predicted value, indicating the accuracy of the prediction. The actual value from August to November was 5.67% lower than the predicted value, which was slightly larger. However, considering the high predicted precipitation, this suggests that the model will not output a lower predicted value to make the actual value look falsely high. Because no seeding trials were conducted in 2019, the model output was close to the actual precipitation and no anomalies were detected.
Using the neural network to predict precipitation in 2020, the results are shown in
Table 7.
It is clear that the model has anomalies in its predictions for August to November. As can be seen from the table, the actual value from August to November in 2020 is 14.25% higher than the predicted value. Also, it can be found that when predicting daily precipitation for 2019, the actual value from August to November is 5.67% lower than the actual value (Refer to
Table 6), indicating that the natural precipitation is 5.67% lower than the predicted value. We assume that the neural network also has that error in predicting precipitation for 2020. The predicted value during the test period in 2020 is now 3.51 mm. Then considering the model error of 5.67%, the natural precipitation can be calculated as 3.31 mm by solving the following equation.
From the table it can also be found that the actual precipitation for this period was 4.01 mm. Compared to the natural precipitation of 3.31 mm, the actual value is 21.15% higher. The reason why the actual value is larger than the predicted value is that the predicted value is natural precipitation. The actual precipitation includes natural precipitation and the catalytic precipitation enhancement of our experiment. Therefore, this result is seemingly positive and proves that our experiment worked to some extent.
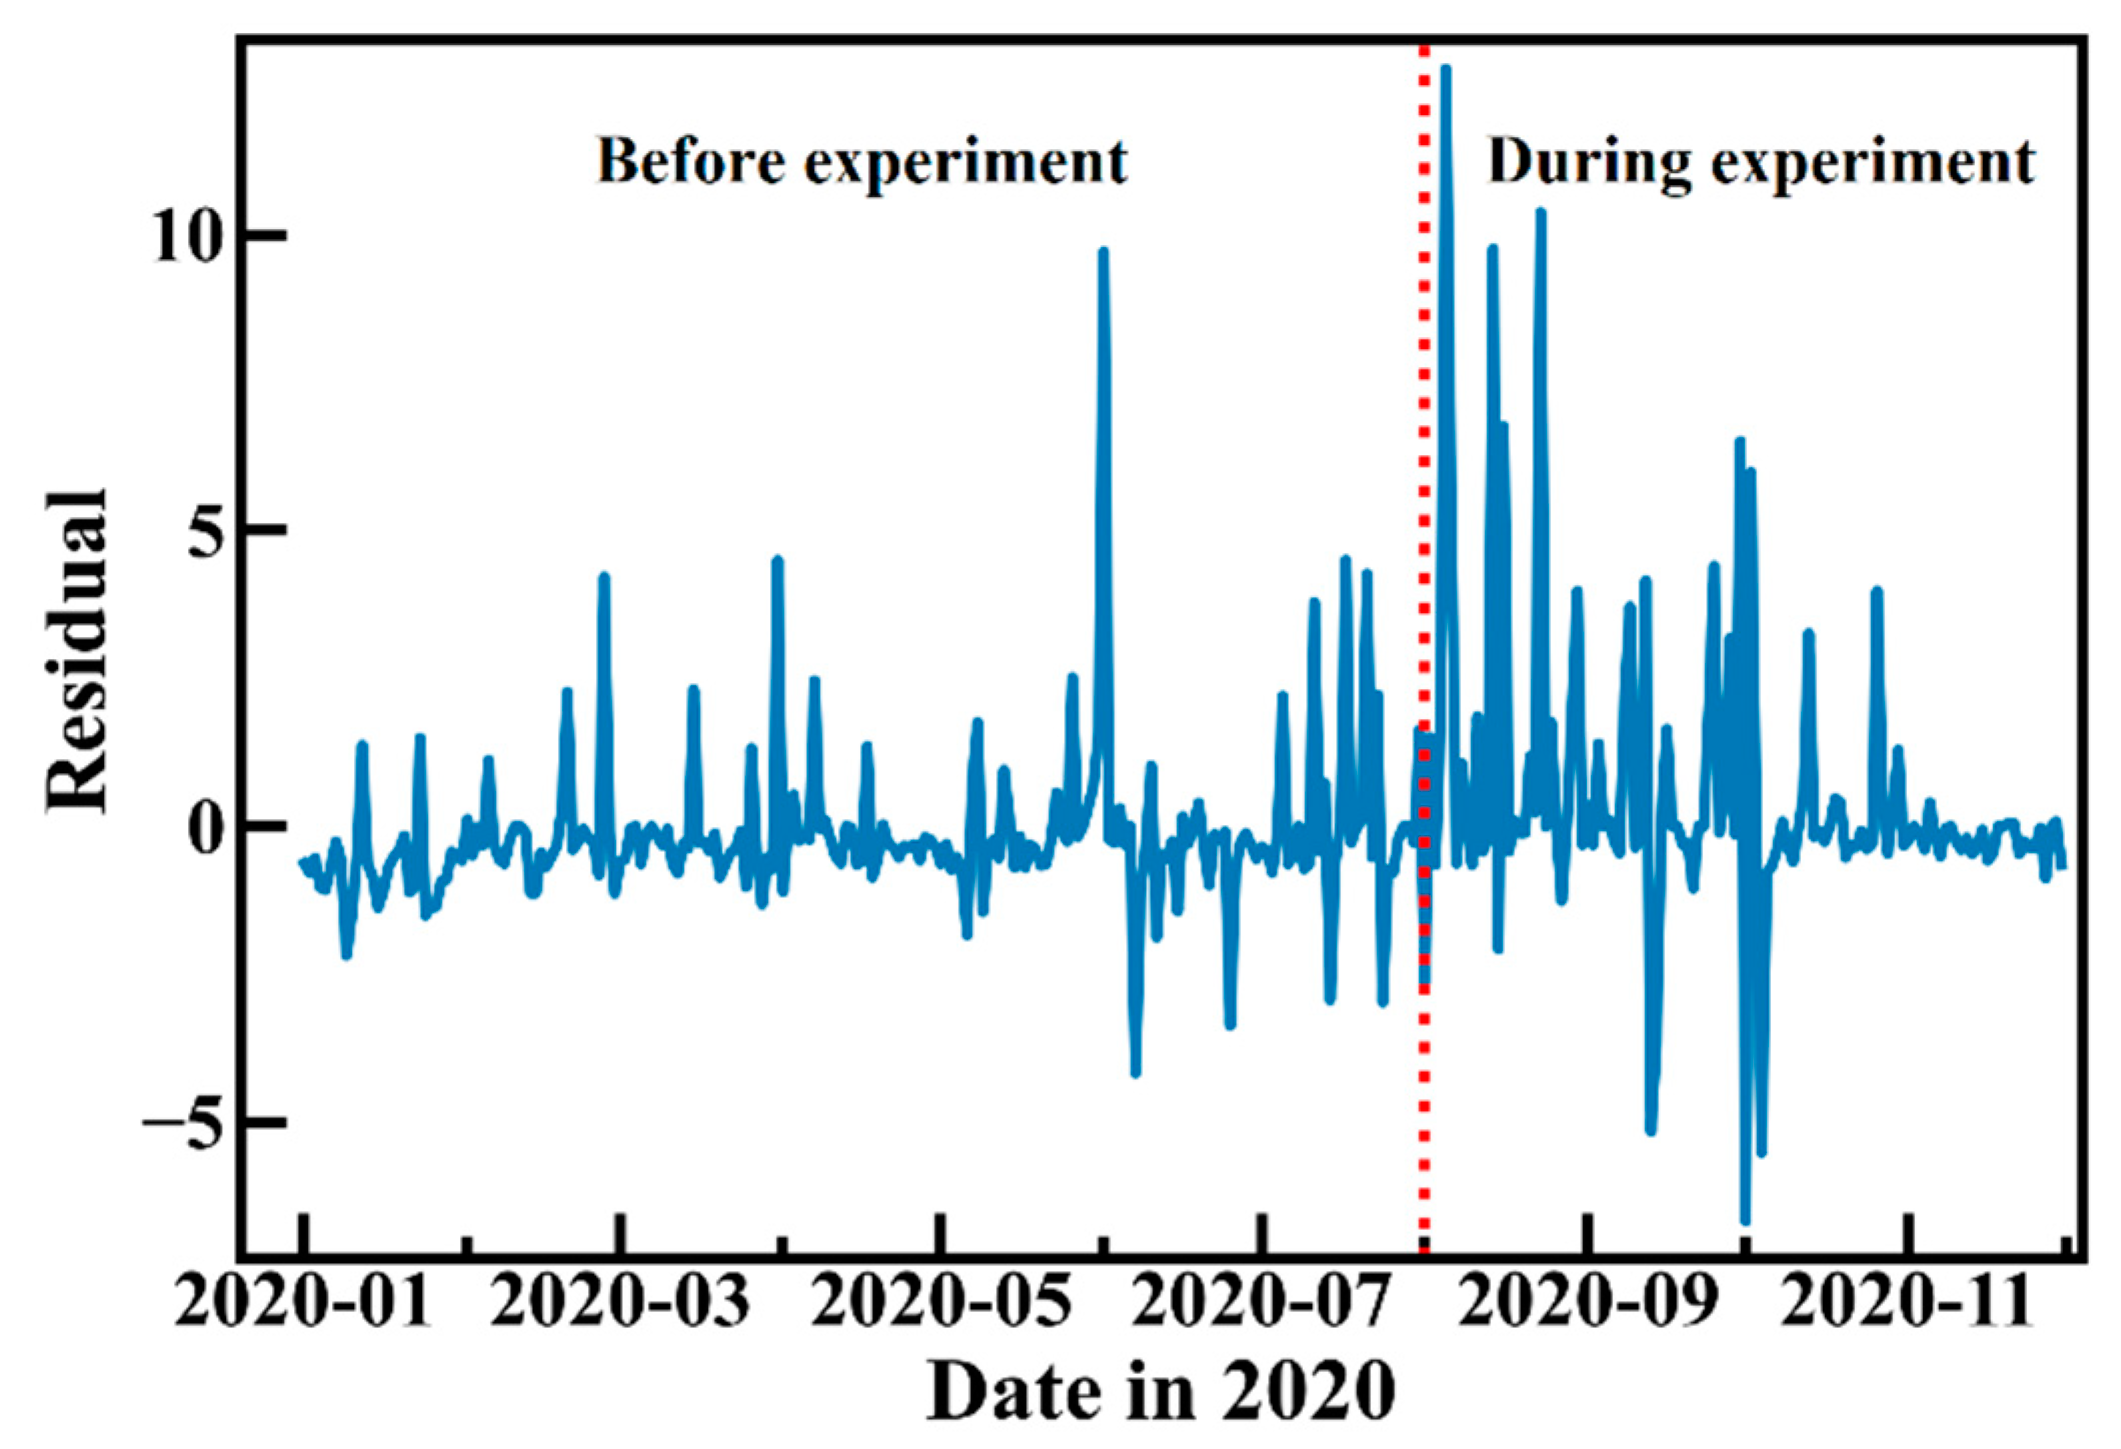
A residual plot is analyzed, which represents the difference between the actual and predicted values of the average daily precipitation in 2020, as shown in
Figure 5. As can be seen from the graph, the variation of the residuals in the first half of the year is relatively smaller and stays around the value of 0. The variation in the second half of the year is larger, while mostly positive, showing that the actual precipitation in the second half of the year is generally greater than the predicted value, which is likely brought by the trial.
4.2. Analysis of Historical Precipitation Data
This section is an analysis of historical precipitation data from the Liupan Mountain meteorological station and the Wushaoling meteorological station. Both stations have hourly precipitation data from 2008 to 2020, from which the daily and monthly precipitation amounts were calculated. The increase in 2020 was calculated by comparing the precipitation data for 2020 with the precipitation data from 2008 to 2019 and using a t-test to give the p-value as the confidence level.
4.2.1. Analysis of Historical Data from the Wushaoling Weather Station
The duration of the outfield experiment in Wushaoling is from July to November in 2020. We study the precipitation data for this period from 2008 to 2020 to find the increase in 2020. We used the precipitation data collected at the Wushaoling meteorological station as a representative of this experimental area, whose location is 37°11′51′′ N, 102°52′04′′ E. It was calculated that the average monthly precipitation from July to November from 2008 to 2019 was 57.5 mm, while the average monthly precipitation from July to November for 2020 was 64.5 mm, an increase of 12.2% compared to the former. A t-test was performed and the p-value was 0.42.
We then focused on the precipitation in 2020. The average monthly precipitation was 22.9 mm from January to June without the operation, while 64.5 mm from July to November during operation, an increase of 182% compared to the first half of the year. The increase is considerable, but with the concern that during a normal year the precipitation is concentrated in summer and autumn, the second half of the year will also have more precipitation than the first half. Precipitation for each month from 2008 to 2019 was counted, finding that the average monthly precipitation from January to June from 2008 to 2019 was 28.2 mm, while the precipitation from July to December 57.5 mm. Precipitation in the second half of the year increased by 104% compared to the first half, meaning that in a normal year, the precipitation in the second half of the year will increase by about 104% compared to the first half. However, in the second half of 2020 compared to the first half of the year, precipitation increased by 182%, almost twice the average increase. A comparison of the specific data is shown in
Table 8.
4.2.2. Analysis of Historical Data from the Liupan Mountain Weather Station
The same analysis was performed for the Liupan Mountain region. Since the experiment in Liupan Mountain started in August 2020, monthly precipitation data from August to November from 2008 to 2020 are studied. Precipitation data collected at the Liupan Mountain meteorological station was used as a representative of this experimental area, whose location is 35°39′47′′ N, 106°12′06′′ E. It was calculated that the average monthly precipitation from August to November from 2008 to 2019 was 79.3 mm, while the average monthly precipitation from August to November in 2020 was 122.3 mm, with an increase of 54% compared to the former. p-value of the t-test was 0.31.
Focusing on the data for the year 2020, the average monthly precipitation from January to July was 65.0 mm and from August to November 122.3 mm, an increase of 88% compared to the first half of the year. The average monthly precipitation from January to July from 2008 to 2019 was 59.1 mm and from August to November 79.3 mm, an increase of 35% compared to the former. It can be noticed that the growth in 2020 reaches more than twice the average. A comparison of the specific data is shown in
Table 9.
4.3. Analysis of the Randomized Comparison Experiment
When the outfield trial was conducted, an accompanying comparison experiment was carried out in the Wushaoling area, and this section is an analysis of the precipitation results from the comparison experiment. Precipitation data collected by gauges that spanned from July to November in 2020 was used. The increase in the experimental group compared to the control group was calculated and the confidence level was given using a t-test.
In full accordance with the principles of a randomized comparison experiment, the data for the experimental group in Wushaoling was 14 days and the data for the control group was 13 days.
The average daily precipitation of the experimental group was 12.6 mm, while the control group was 9.9 mm. Using Equation (4), it can be calculated that the efficiency of negative ion catalyzing precipitation during the experimental period is 27.3%, which achieves the project requirement of 20% precipitation enhancement efficiency.
In Equation (4), A is the precipitation enhancement efficiency, R0 is the natural precipitation (average precipitation of the control group), and R1 is the post-catalytic precipitation (average precipitation of the experimental group). p-value of the t-test was 0.37.
Further, since the experiment was conducted randomly with a period of days, despite a high confidence level, the experimental data was discontinuous and lack in amount. This is not able to reflect the effect of precipitation increase during a long period of operation, thus a study of long-term trials was conducted. The operation was suspended from 24 August to 30 August, and from 15 September to 22 September due to the network damage of the device, which was used as the control group. The time when the device was turned on was used as the experimental group.
The results showed that the average daily precipitation for the experimental group with the device on for a total of 30 days was 23.6 mm, while the average daily precipitation for the control period was 10.4 mm for a total of 8 days. The efficiency of negative ion in catalyzing precipitation was calculated to be 126.9%, which far exceeded the project requirement of 20%. A t-test was performed on these two sets of data and the p-value was 0.23.
The data from all the above comparison experiments were combined to obtain a total of 44 days for the experimental group and 21 days for the control group. The average daily precipitation was 20.1 mm for the experimental group and 10.1 mm for the control group. Relative to the control group, the average daily precipitation of the experimental group was 99% higher, much higher than the required 20%. A t-test was performed and the p-value was 0.15.
4.4. Analysis of the Effect of Geographical Location on the Precipitation Augmentation
This section discusses the effect of geographic location on the effectiveness of precipitation augmentation. We used a two-dimensional interpolation method to make a general analysis of the precipitation increase distribution in the whole experimental area. We refer to some good examples [
26,
27], but we are limited by the small amount of data we have, and the distribution obtained is still approximate. Precipitation data and location information from the precipitation stations were used. The comparison between the experimental and the control group shows the distribution of increased precipitation. The time span of the data used is from July to November of 2020. The specific date comes from the grouping of the randomized comparative experiment.
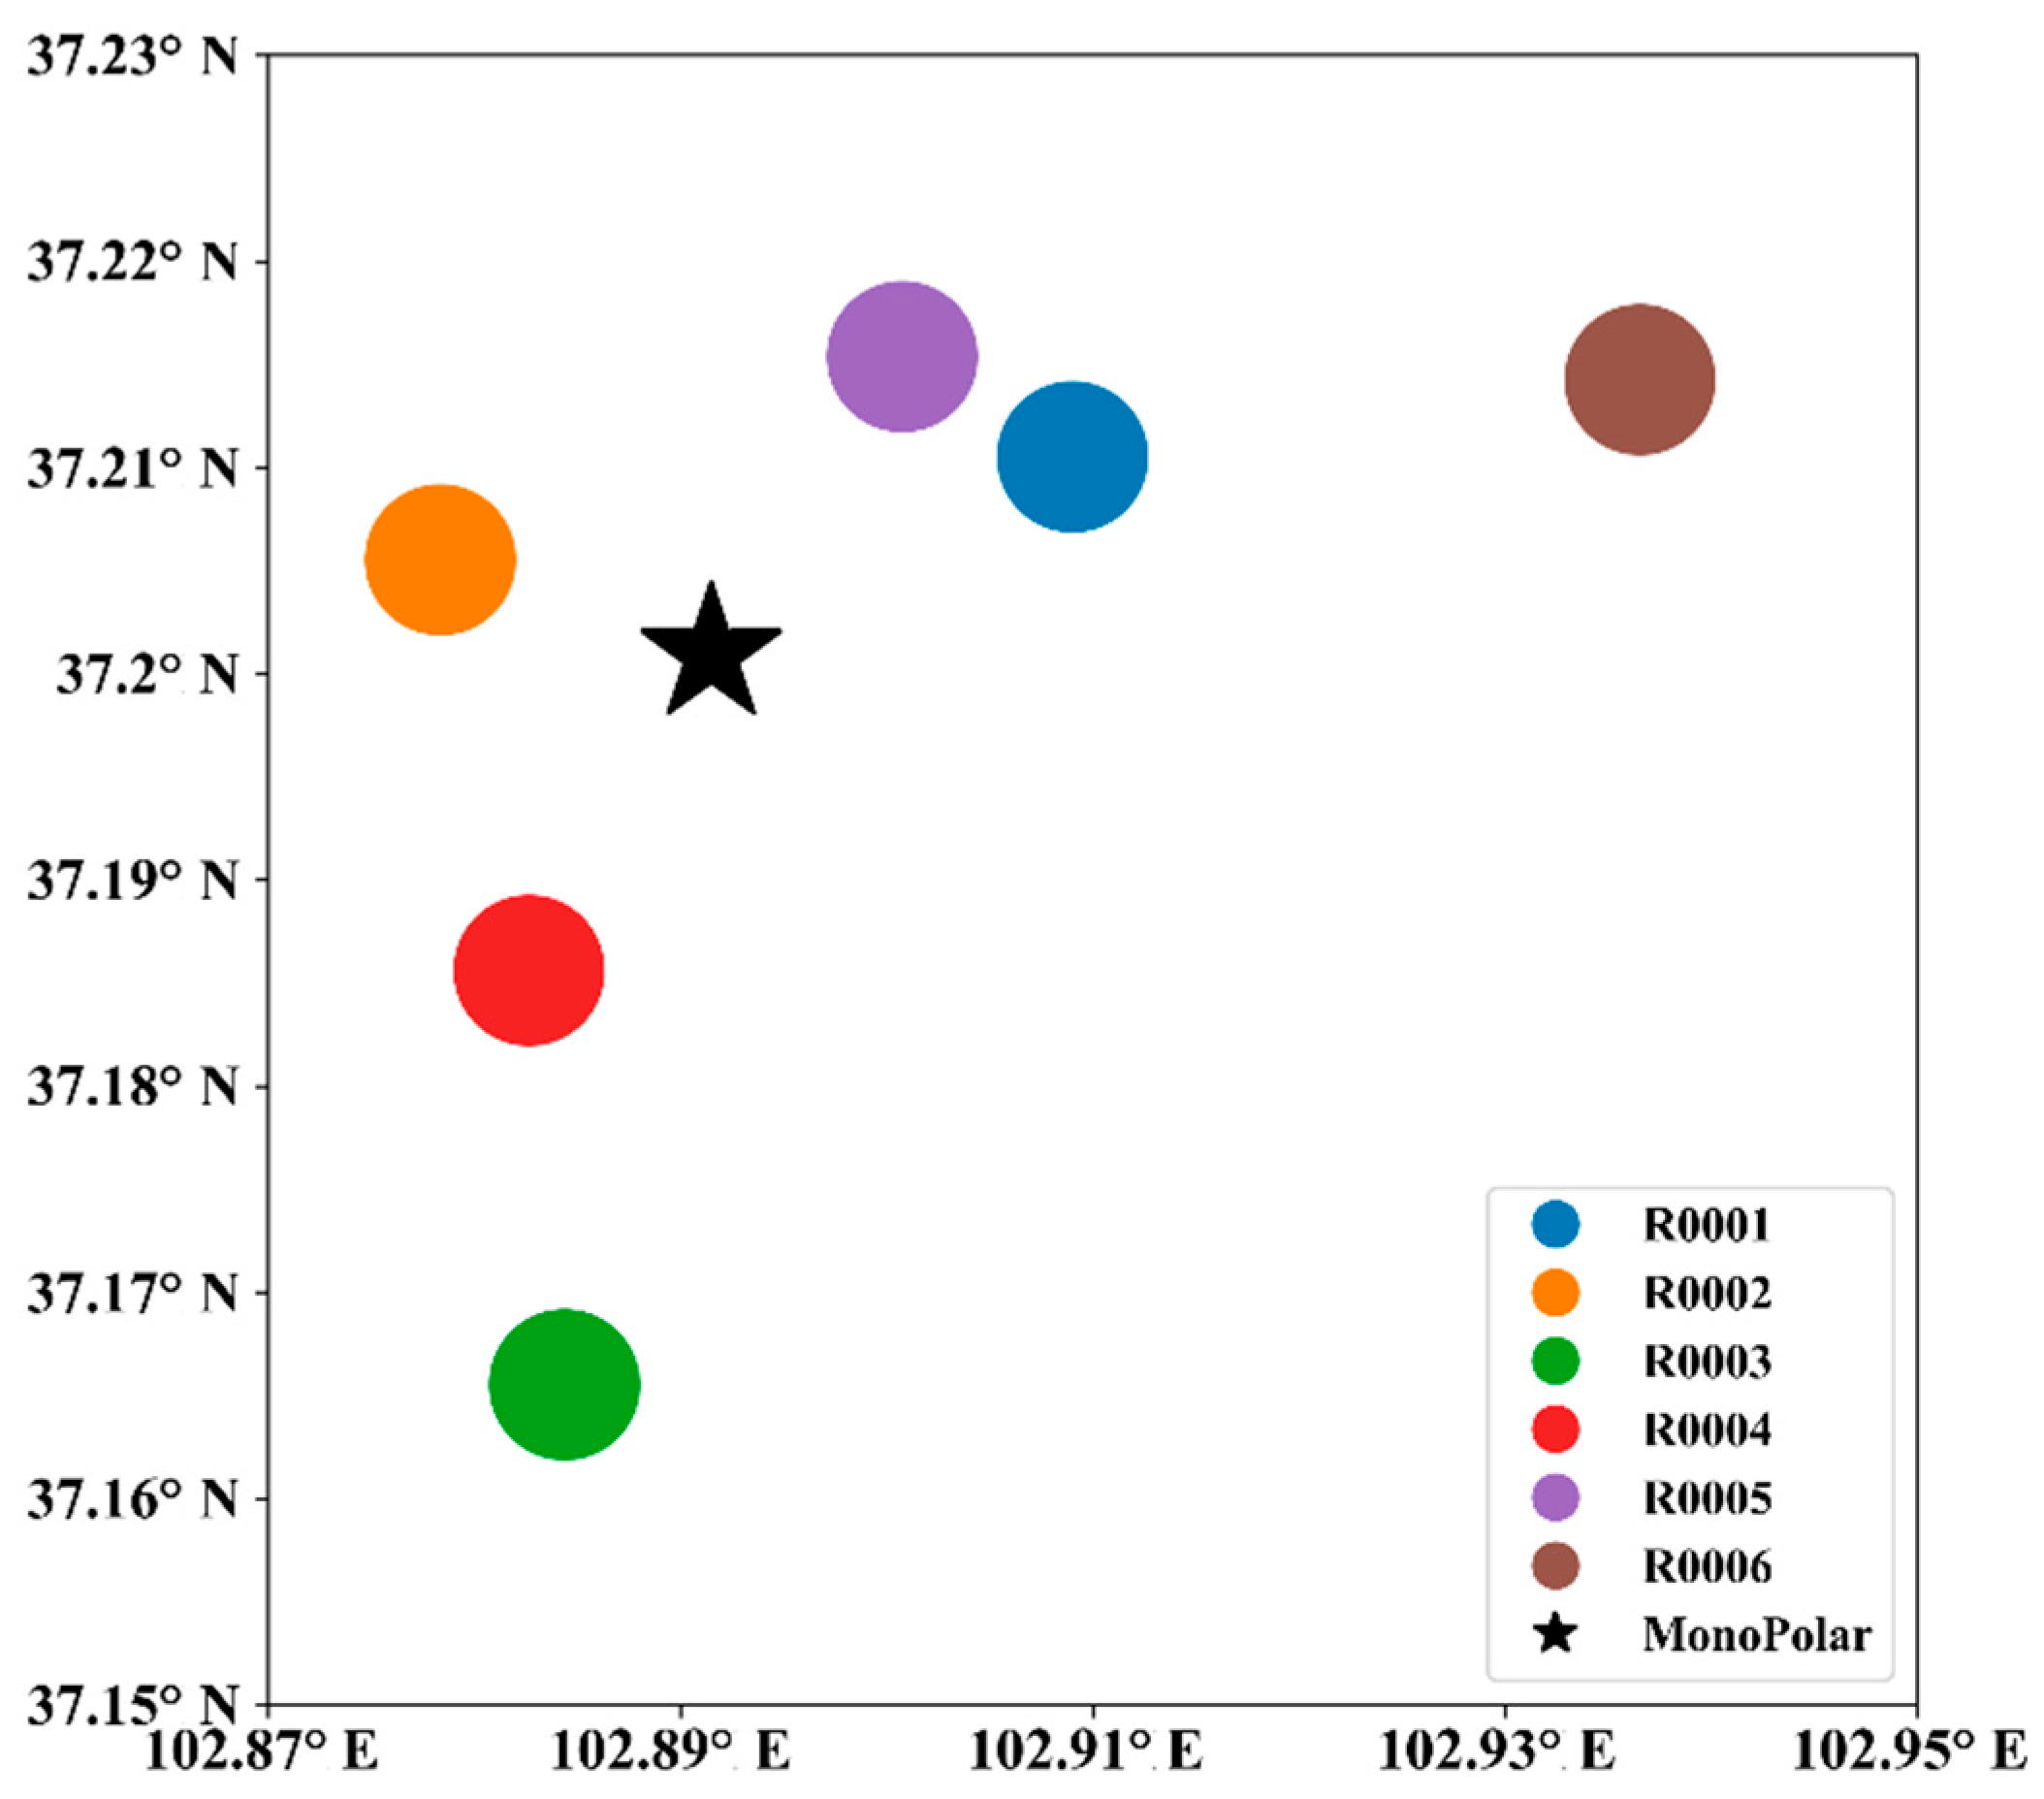
4.4.1. Location Distribution of the Precipitation Augmentation in Wushaoling
There is a single-electrode ion generator in the Wushaoling area, along with six precipitation stations, whose physical locations are shown in
Figure 6.
We took the range of 102.87° E~102.95° E and 37.15° N~37.23° N as the experimental area of the Wushaoling. The area was divided into grids according to latitude and longitude, and the precipitation data from each precipitation station were written into the corresponding grids. For grids without precipitation stations, interpolation was used to compute the data. To highlight the effects of the experiment, we treated the experimental and control groups separately according to the classification of the comparison experiment. After the interpolation was completed, the grid data were drawn in the form of a picture with different values corresponding to different colors, as shown in
Figure 7.
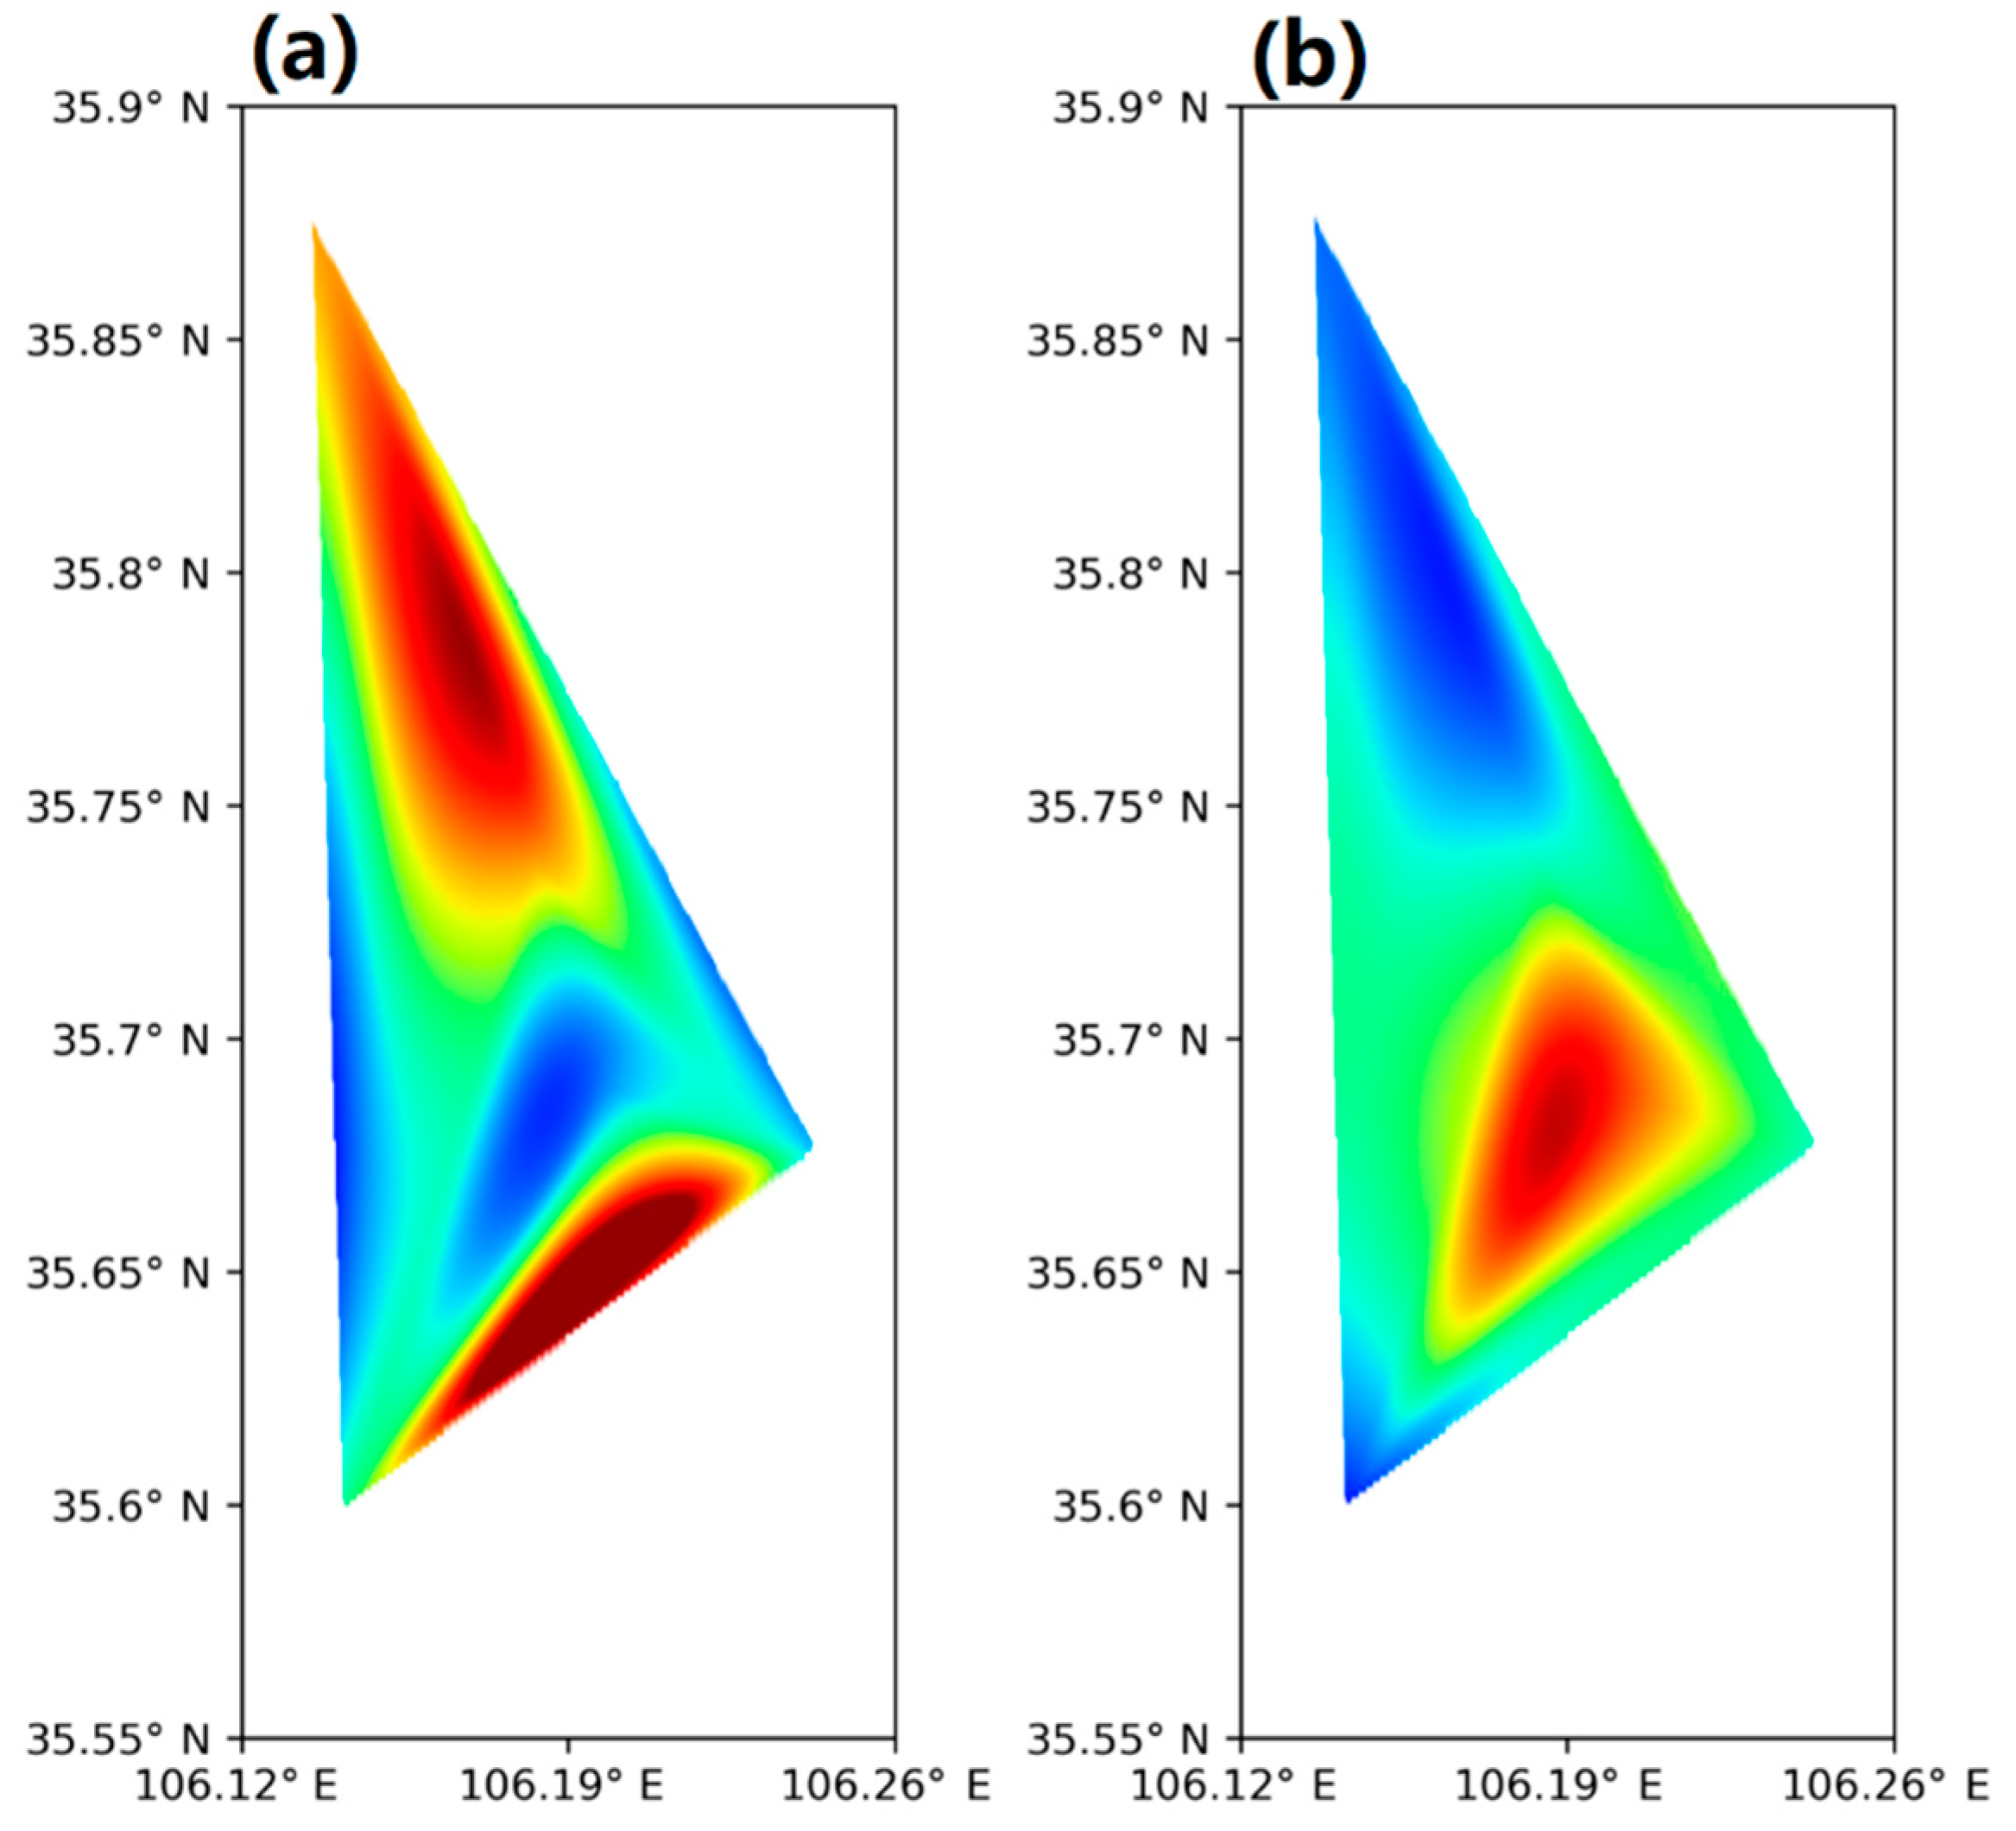
The interpolation results are approximated as the precipitation distribution of the area. As can be seen from the graph, the color of the experimental group is significantly warmer compared to the control group, indicating that the experimental group corresponds to a larger value overall. In order to clearly show the distribution of precipitation augmentation of the experimental group, we subtract the grid data of the control group from the experimental group, which is the left subplot minus the right subplot in the above figure. In this way, the grid data of the precipitation growth distribution is obtained, which is plotted as a heatmap image, as shown in
Figure 8.
Observing the color bar in this figure, we can see that the minimum value is about 0.8, which is a positive number. This indicates that during the experimental period, precipitation increased in different degrees in all parts of Wushaoling. In addition, the increase of precipitation in the northwest region is relatively large.
4.4.2. Location Distribution of the Precipitation Augmentation in Liupan Mountain
The same processing method is applied to the Liupan Moutain area. There are three single-electrode ion generators in Liupan Mountain, along with six precipitation stations, whose physical locations are shown in
Figure 9.
We took the range of 106.12° E~106.26° E and 35.55° N~35.90° N as the experimental area of the Liupan Mountain. The experimental area is divided first, then is filled with data from the precipitation stations, and finally interpolated. The results are shown in
Figure 10.
As can be seen from the figure, the image color of the experimental group in most of the areas is warmer compared to the control group at the same locations. However, there are regions excepted. To analyze the reason, we listed the average daily precipitation data of the experimental and control groups at six effective precipitation stations in Liupan Mountain, as shown in
Table 10.
As can be seen from the table, except for sites R0004 and R0007, the experimental group received more precipitation than the control group at all sites. Moreover, the position of these two stations in the experimental area is exactly in the upper right corner of the center. This is a phenomenon that actually existed in the outfield trial. Analyzing the reasons, we think that part of the reason may be that no systematic randomized controlled trial was conducted in the Liupan Mountain. The control group had too little data and chose a continuous period of data in July, during which it rained almost every day near the two rain gauges. We think it is also possible that the effect of the experimental setup was not significant at this location due to the topography. This needs to be verified with more experimental data. The heatmap is shown in
Figure 11.
From the figure, it can be visualized that the precipitation increases at all locations within the core area except for the upper right area off the center, and this result is consistent with the above analysis.
4.5. Differences in Precipitation Augmentation Influenced by Wind Direction
This section studies the effect of wind direction on the distribution of precipitation augmentation. By analyzing the wind data and the precipitation data when the device was turned on, we found the difference of precipitation augmentation at upwind and downwind. The experimental data span the period from July to November 2020. In addition, precipitation data from May 2019 to June 2020 were used to calculate the natural precipitation for each site.
4.5.1. Analysis of the Effect of Wind Direction on Precipitation Augmentation in Wushaoling
Hourly precipitation data and wind data were recorded at precipitation stations and integrated stations. In order to eliminate the differences in precipitation at each precipitation station itself, the natural precipitation at each precipitation station was first required to calculate. Rain gauges were deployed and start operation in May 2019, so we have data before the experiment started. Use these data to calculate the natural precipitation for each precipitation station.
The respective average daily natural precipitation was subtracted from the actual precipitation data of each station during operation to obtain the catalytic precipitation increment. When calculating the catalytic precipitation increment, dates without precipitation at each site were removed. This is because if the actual precipitation is zero, after subtracting the natural precipitation, the data at each station will be negative and not equal, and it will be easy to make an incorrect judgment.
We find the dominant wind direction in the experimental area for that day by using the daily wind rose diagram. Then, using the single electrode device as a divider, the stations were divided into upwind and downwind stations based solely on the wind direction of the day. The actual precipitation of each station upwind is subtracted from its own natural precipitation to obtain the catalytic precipitation increase of each station. The catalytic precipitation for all stations upwind is then averaged. The same operation was performed for the stations downwind, and the average catalytic precipitation increment for the stations downwind was obtained. We did this for each date of operation to calculate these two values. Averaging these data, we found that during operation, the average precipitation increase at the upwind precipitation stations was 4.0 mm, and it was 6.3 mm for the downwind precipitation stations. The catalytic effect at the downwind sites was 58% better than that at the upwind sites. A t-test was carried out, and the p-value was 0.29. It shows that the catalytic effect is highly dependent on the wind direction.
4.5.2. Analysis of the Effect of Wind Direction on Precipitation Augmentation in Liupan Mountain
Similarly, the natural precipitation at each precipitation station was first derived in order to eliminate the precipitation differences at the precipitation stations themselves. However, the precipitation stations in Liupan Mountain only had data from May to July 2020 before the experiment, which has a short time span. Furthermore, there was much precipitation during this period, which led to calculate the high natural precipitation.
The result found that during operation, the average increment of precipitation at the downwind sites was 0.89 mm, and it was 0.75 mm at the upwind sites. The catalytic effect at the downwind sites was 19% better than that at the upwind sites. A t-test was carried out, and the p-value was 0.46.
4.5.3. Examples of the Data Collected for a Few Events
In order to show more vividly that the catalytic effect is better downwind than upwind, we found some examples and drew maps of wind and rainfall. These examples appear in pairs, divided into the dates when the device was turned on and off. The wind direction is similar on both days, but the rainfall at the downwind side gets more significantly increased when the device is turned on.
The first is the Wushaoling area.
Figure 12 and
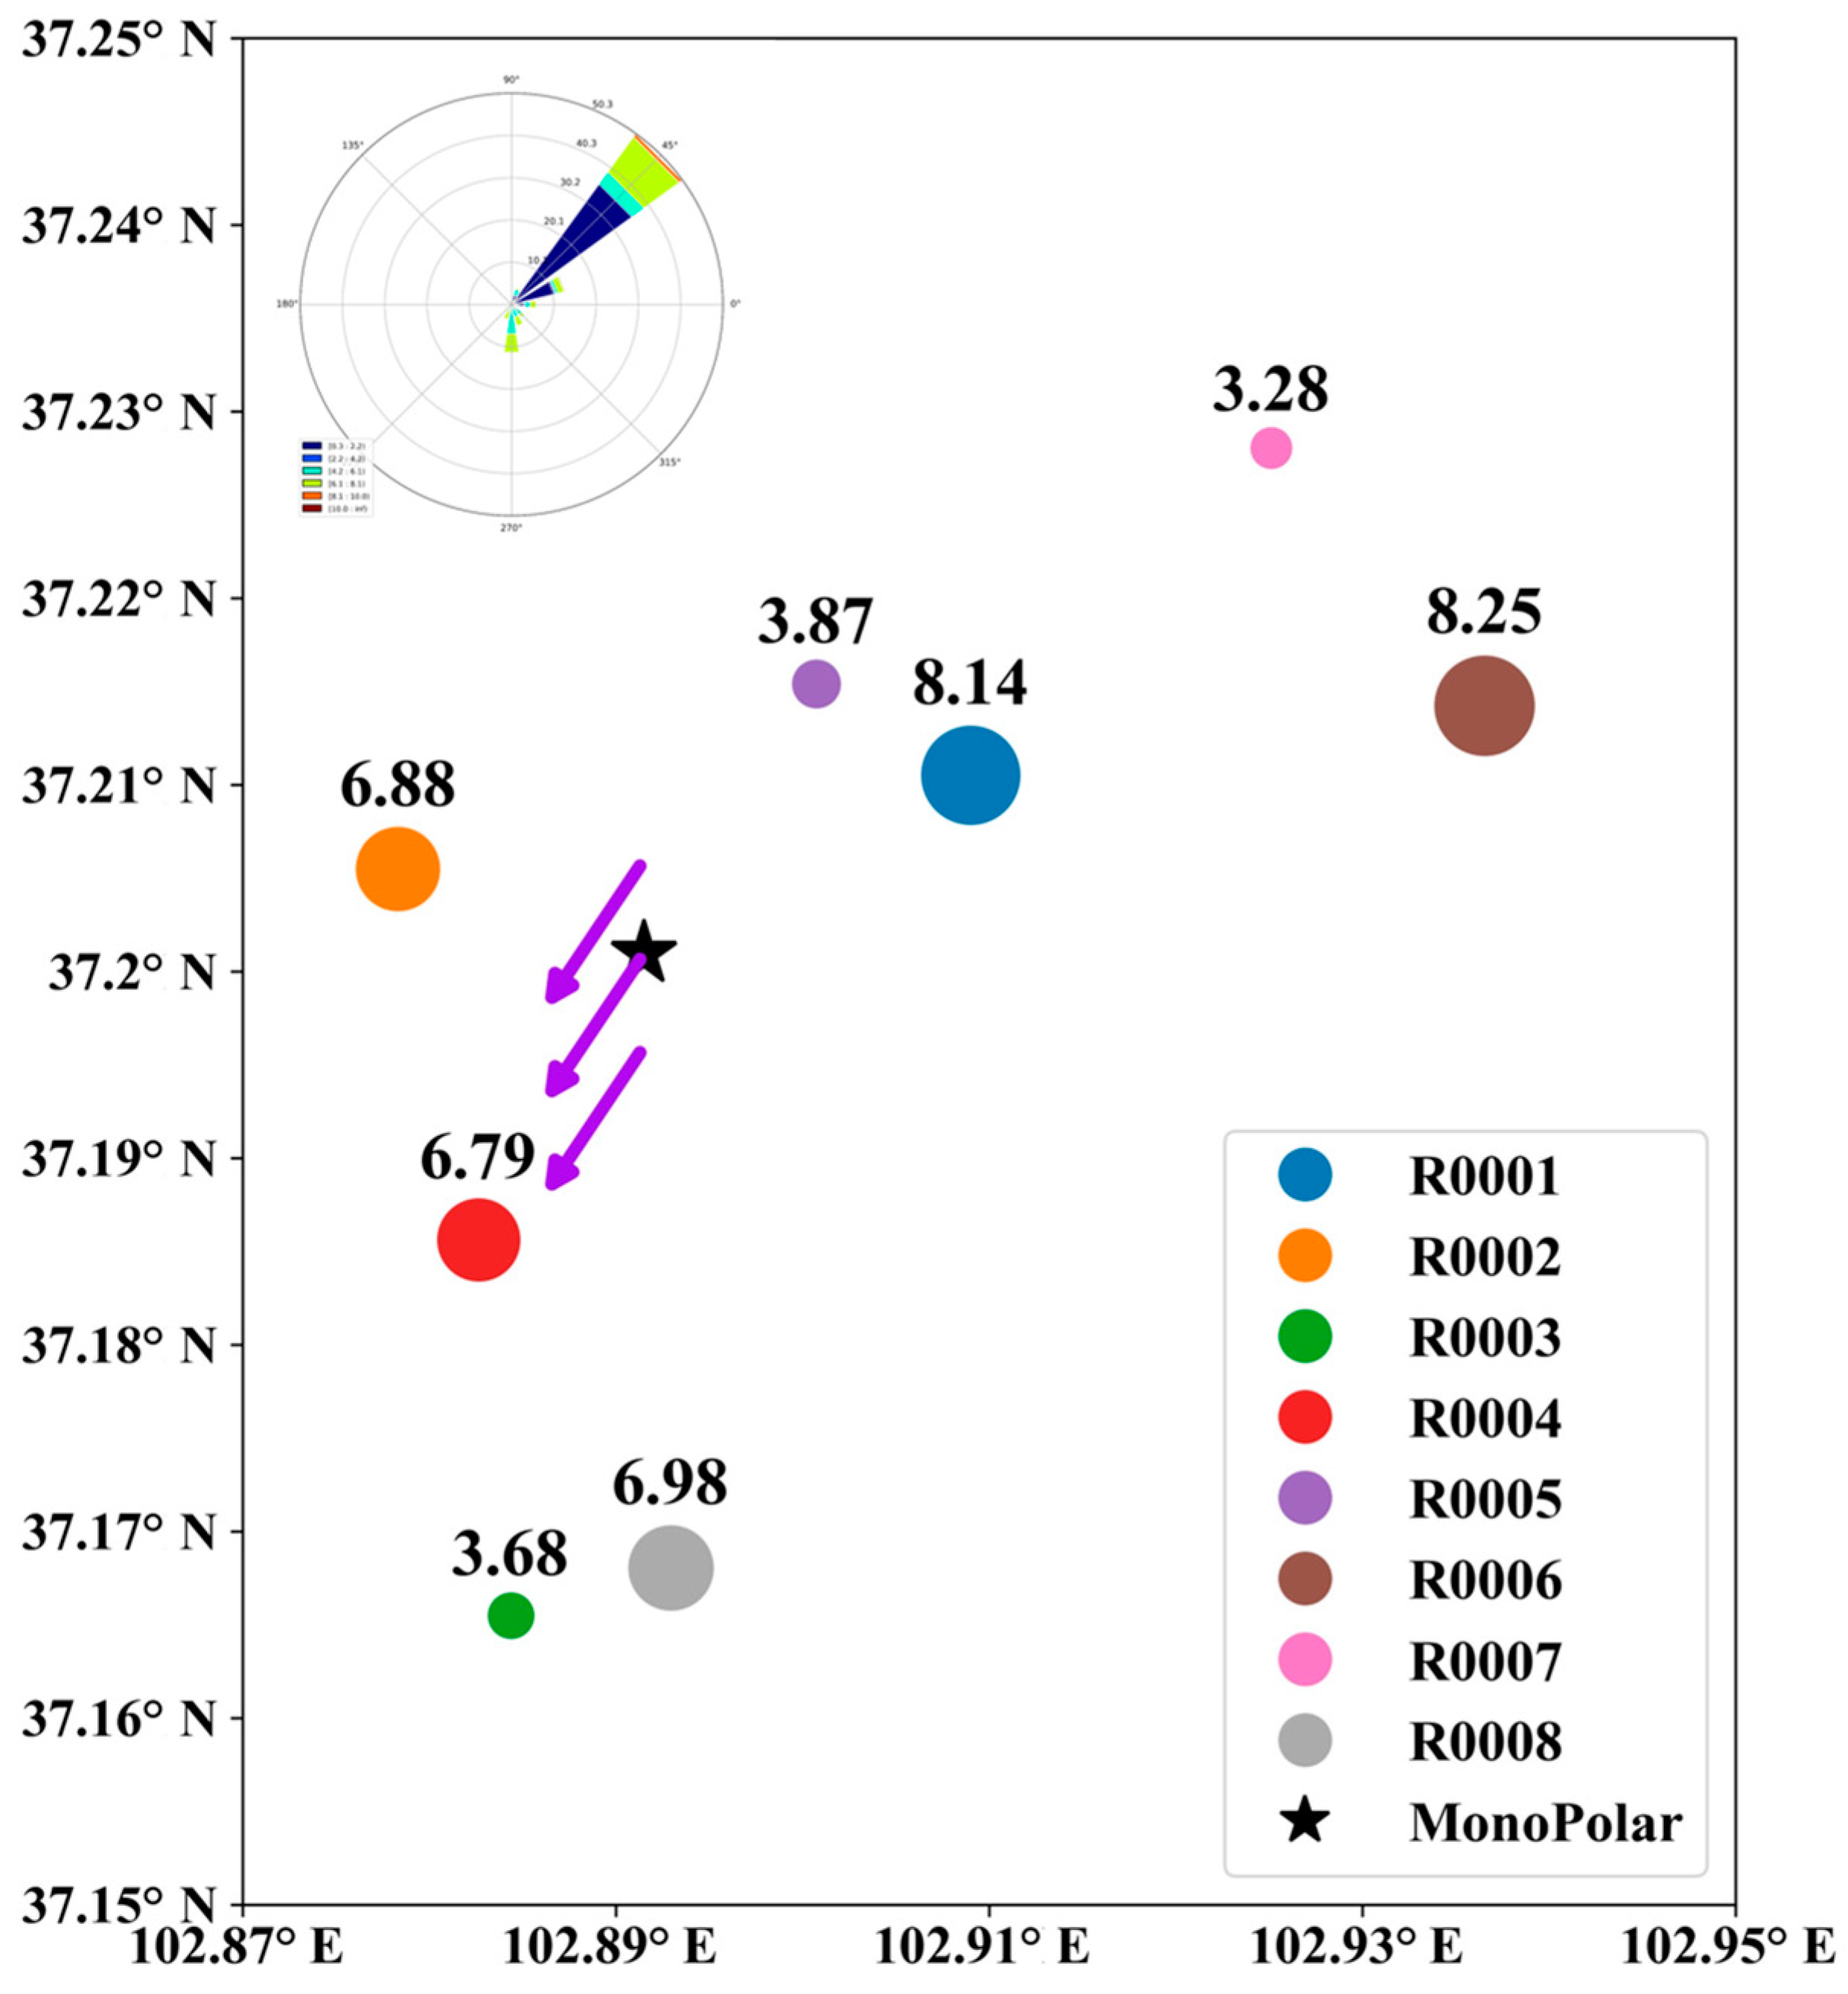
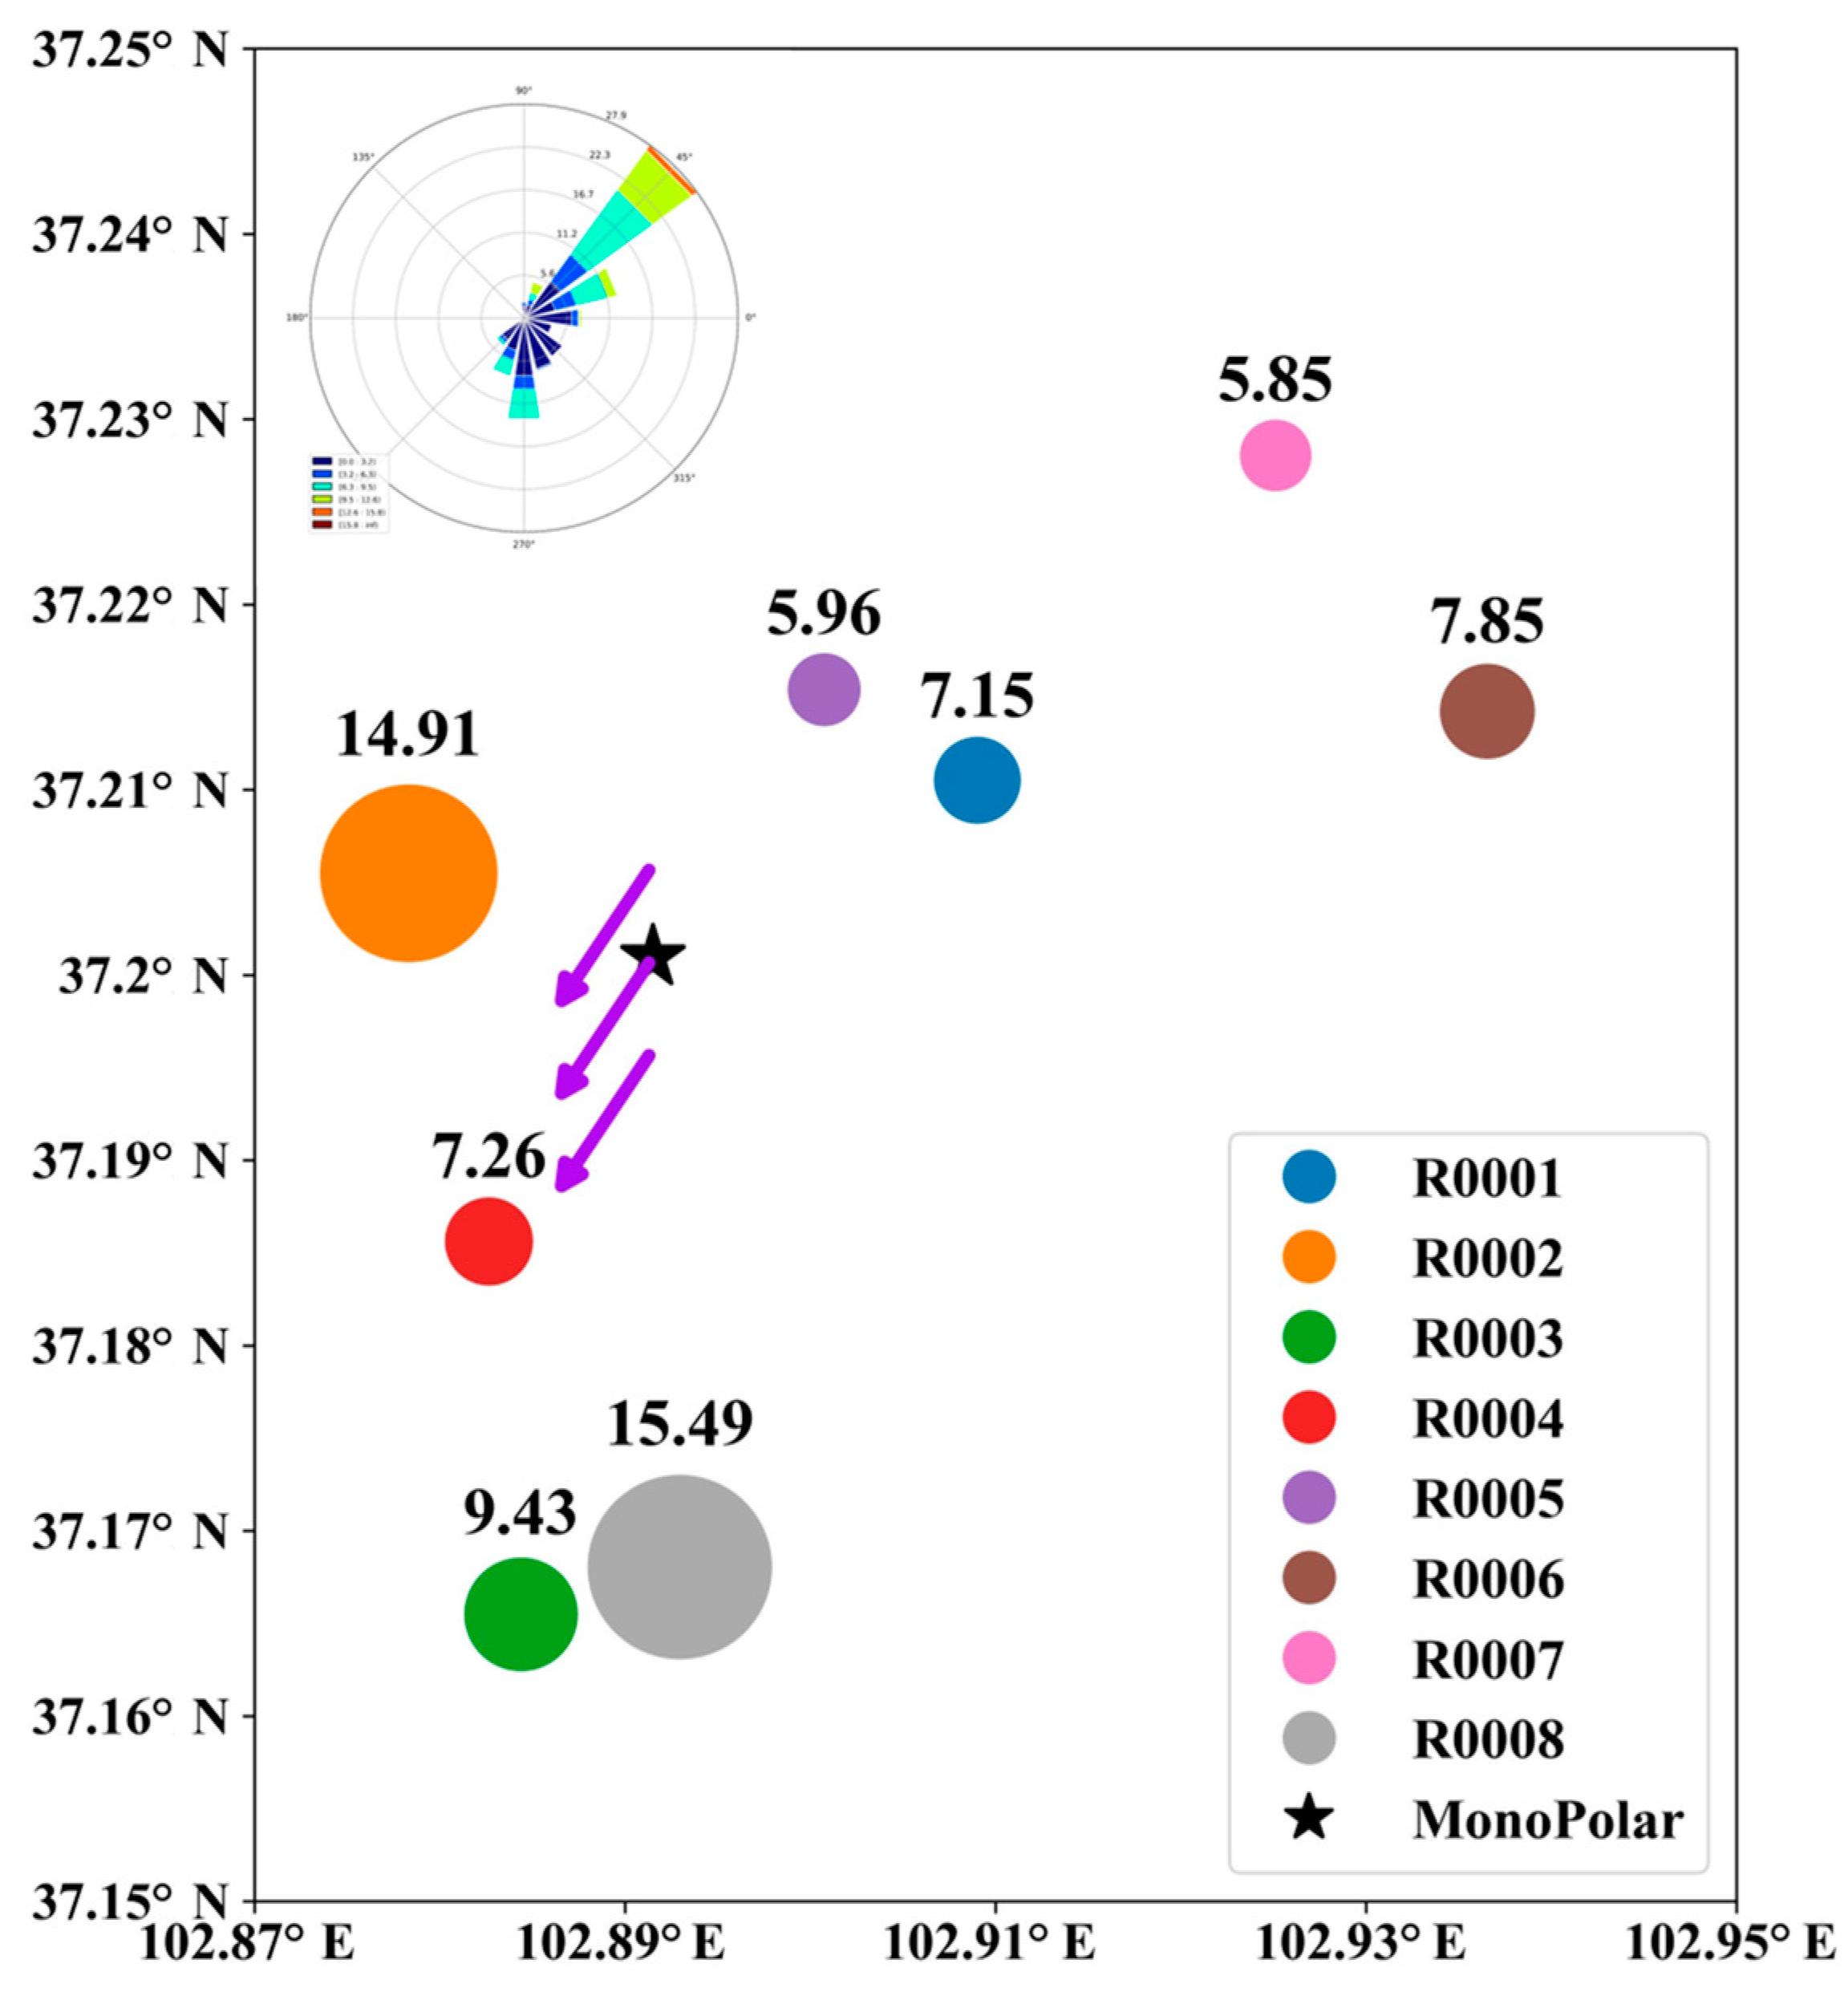
Figure 13 respectively show the rainfall and wind maps for the device off (August 4) and on (September 21) in Wushaoling. The circles in the graph represent the locations of the precipitation stations, the size of the circles represents the amount of precipitation, and the values indicate the specific values of precipitation. The wind direction is almost the same for both days shown in the graphs, which means that the division between upwind and downwind stations is the same for both days. This makes it possible to see the catalytic increase at a particular station by comparison. The analysis is then combined with whether the station is upwind or downwind to reveal the difference in the effectiveness of upwind and downwind catalytic precipitation augmentation.
As can be seen from the figures, the wind direction is almost the same on both days. When the device was turned off, the average daily rainfall at the precipitation stations downwind was 6.09 mm and it was 5.89 mm at upwind. The precipitation at downwind and upwind is basically the same. However, when the device was turned on, the average precipitation at downwind was 11.77 mm and at upwind was 6.70 mm. The rainfall at downwind is 76% more than it at upwind. The R0001 and R0006 precipitation stations, which are located upwind, have the most precipitation when the device was turned off. However, when the device was turned on, the stations with a lot of rain were downwind. This phenomenon highlights the effect of the experimental device.
Next is Liupan Mountain.
Figure 14 and
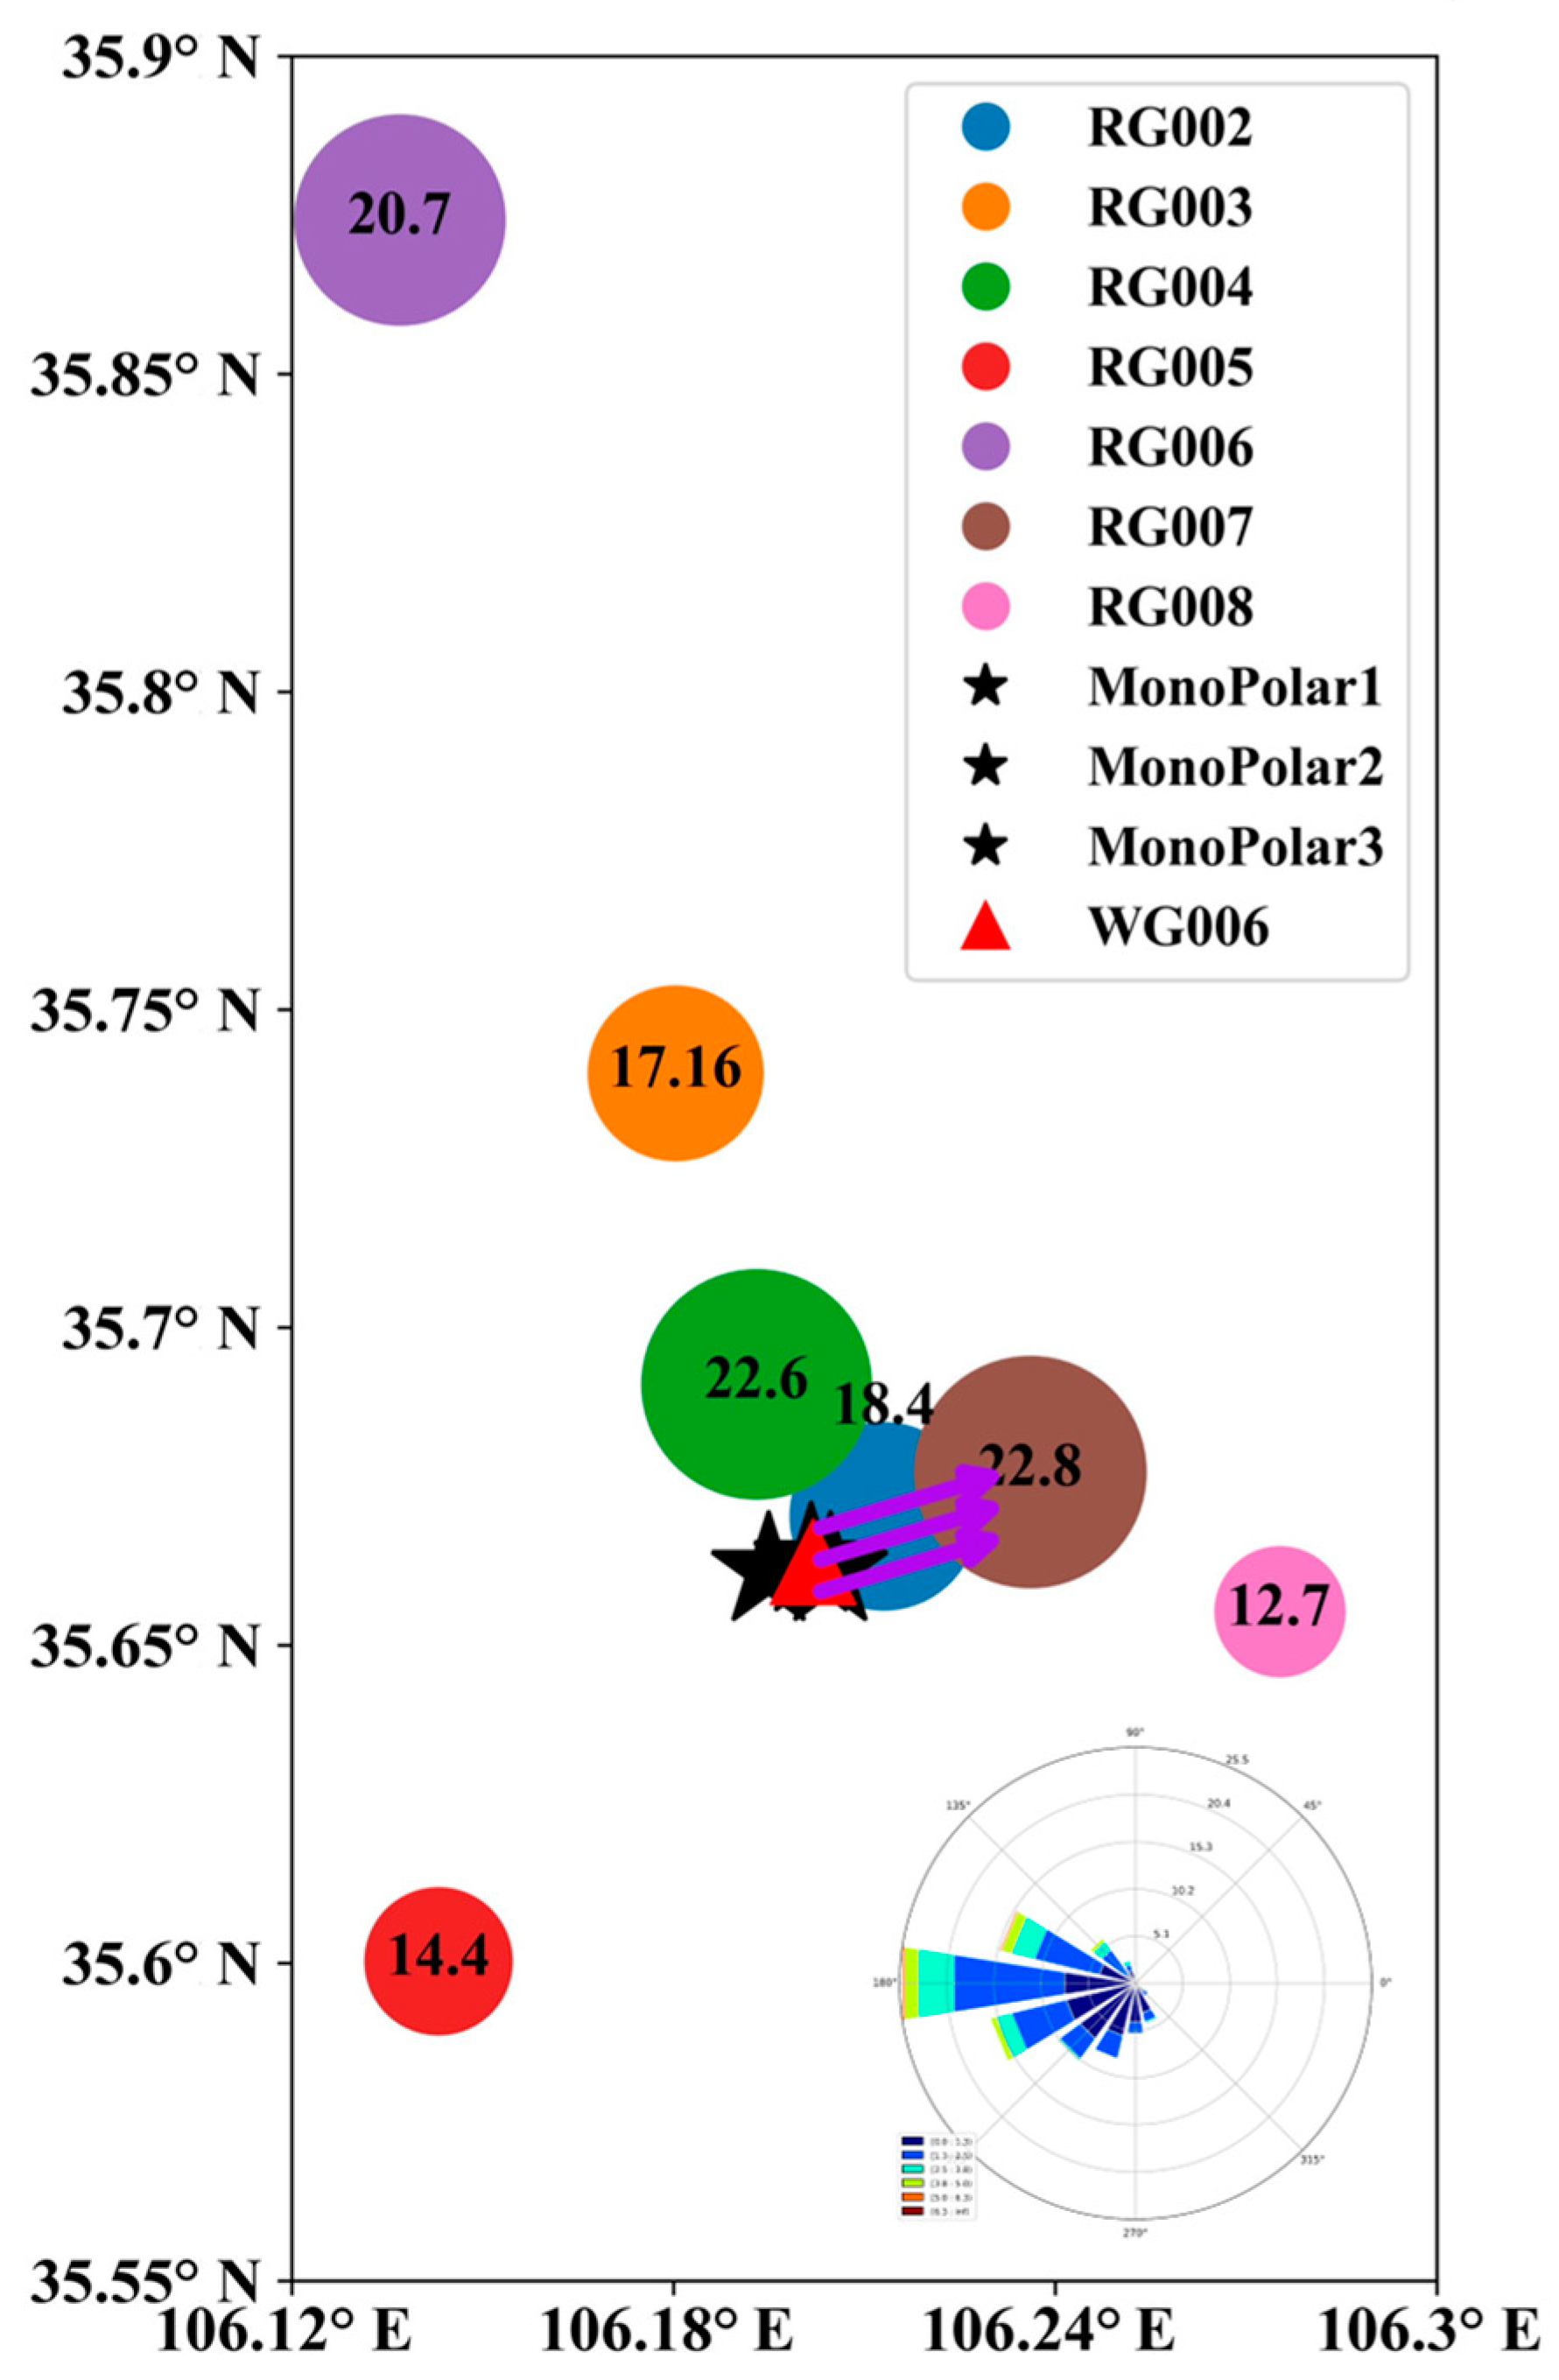
Figure 15 respectively show the precipitation and wind maps for the device off (July 10) and on (August 30).
As can be seen from the figure, the wind direction is almost the same on both days. RG005 and RG008, before and after the device opened, slightly differs in terms of precipitation. RG006 station is far from the device. Therefore, we focus on the four precipitation stations near the installation. It can be seen that there is no much difference among the precipitation of these four stations when the device is closed. However, after the device was turned on, the precipitation at stations RG002 and RG004 increased a lot because they are relatively close to the device. The precipitation at RG003 station located upwind increased by about 39%, while the precipitation at RG007 station downwind reached twice as much as when the device was turned off. These phenomena show that the effect of the device is relatively obvious.
4.6. Analysis of the Concentration of Negative Ions
This section analyzes the data of negative ions collected by the integrated monitoring stations in both trial areas. When analyzing, we first did similar on/off experiments and ion concentration control comparisons. But the result was statistically insignificant. We looked into the result and discovered that the ion measurement is set up on the ground level, which is not the target of the ion emitter. However, the target is up in the cloud. The ions are carried up to the clouds by the updraft as well as the atmospheric electric field which also pulls the negative ion upwards. So the ground level ion concentration measurement is the indirect effect of device. The device increased the ion on the ground level due to many unpredictable things, like turbulence, diffusion, and heavy-charged particle settlement. This is very slow and temporal un-deterministic process. The time constant of the above effect is predicted way larger than the on/off period of the device. So it is impossible to define a short enough and accurate enough experiment and control group within the trial. So for ion concentration much long experiment and control was chosen.
The effect of the experimental device on negative ions is illustrated by comparing the number of negative ions before and after the device. These data span from May 2019 to November 2020. The increase in negative ions is calculated, and a t-test is performed to obtain the confidence level of the increase.
4.6.1. Analysis of the Concentration of Negative Ions in Wushaoling
Negative ion data were recorded at four integrated monitoring stations in Wushaoling, with data spanning the period May 2019 to September 2020. Because the experiment was conducted from July to November 2020, this period was used as the experimental group and the time from May 2019 to July 2020 as the control group. The daily averages of negative ion counts were obtained for each station in the experimental and control groups, and
t-tests were performed. The results are shown in
Table 11.
It was found that the experimental group data increased at three integrated stations except for the station W0003 where the data of the experimental group were lower than the control group. Averaging the four stations, it was found that the experimental group had 18% more than the control group. Observing the p-values, it can be seen that the highest is only 0.07, indicating that the confidence level is at least 93%. The p-value for station W0001 with a 25% increase is only 6.7 × 10⁻⁷, indicating that this increase is very reliable.
4.6.2. Analysis of the Number of Negative Ions in Liupan Mountain
There are three integrated monitoring stations in Liupan Mountain with the valid data interval from May 2020 to November 2020. Because the experiment was started in August 2020 at that location, the negative ions data from May to July 2020 were used as the control group and from August to November 2020 as the experimental group. The daily averages of the negative ion counts were obtained separately and
t-tests were performed. The results are shown in
Table 12.
It was found that the experimental group data of the two integrated stations increased significantly, with an increment of more than six times, except for the WG006 station, where the experimental group data were lower than the control group. Averaging the three stations, an average increase of 208% in the number of negative ions was obtained for each station. By observing the p-values, it can be seen that the highest value among the increased sites is only 0.02, indicating that the confidence level is at least 98%. Moreover, the smallest of all results was only 1.16 × 10⁻⁶, indicating that the conclusion that the experimental group had a higher concentration of negative ions is reliable.
4.7. Data Analysis of All-Sky Imager
This part is an analysis of data from the all-sky imager, which records experimental data from September 2019 to November 2020. The effect brought by the device is illustrated by comparing the change in cloud volume before and after the trial, and the confidence level of cloud volume increase is given by t-test.
Since the data obtained from this instrument are pictures, we need to analyze the pictures. The all-sky imager comes with a picture analysis tool, and we mainly used the BRGB algorithm and CODC algorithm to analyze these pictures to get the cloud data. BRBG is an evaluation using the blue/red and blue/green ratio of the image. The total cloudiness was evaluated with BRBG algorithm. CDOC is an evaluation using the cloud detection and opacity classification algorithm. Thick clouds and thin clouds are evaluated with the CDOC algorithm.
Since the cloud amount varies greatly from one period to another in each year, we combine the data and compare the average daily cloud data for September to November in two years. This is shown in
Table 13.
As can be seen from the table, the cloud volumes in 2020 are more than those in 2019, except for September 2020, which has a lower volume of thick clouds calculated with the CDOC algorithm. The effect of cloud increase in September is not obvious; the highest increase in one indicator increased by 11% and its p-value is 0.28, which is the relative value. The three data points for October increased by 40, 15 and 21%, respectively.
In addition, the p-values are all below 0.07, which means there is at least 93% confidence that there are more clouds in October 2020 than in October 2019. For November, the total cloud volume calculated by the BRBG algorithm and the thin cloud volume calculated by the CDOC algorithm for 2020 both increased by more than 20% compared to 2019, with their p-values both below 0.02. It can be concluded with a high level of confidence that there are more clouds during the 2020 experiment than during the same period in 2019.
5. Discussion
This paper introduces the negative ion-based cloud seeding technology and provides a detailed description of the China’s first negative ion-based cloud seeding experiment. The principle of negative ion catalytic precipitation is briefly described. In addition, this paper presents information on the experimental sites. The design of ionization systems and meteorological monitoring networks are described. The design of the trial protocol for the field trial is described in detail. Various analysis and evaluation methods were designed for the experimental results. Detailed analyses of precipitation data, wind data, negative ion data, and cloud data were conducted to obtain quantitative results. The effect evaluation methods used and the results are as follows.
- (1)
The overall natural precipitation in Liupan Mountain was predicted using a neural network. The prediction result for 2020 was analyzed, and it was found that the precipitation increased by about 20% during the trial.
- (2)
The historical precipitation data were analyzed. It was found that compared with the historical average, precipitation increased by at least 12.2% in Wushaoling and 54% in Liupan Mountain during the experimental period. The p-value was 0.42 for Wushaoling and 0.31 for Liupan Mountain.
- (3)
The results of the randomized comparison experimental were analyzed. It was found the experimental group in Wushaoling had a 27.3% increase in precipitation. The p-value is 0.37.
- (4)
The effect of geographical location on precipitation differences was investigated within the trial area. Heatmaps were created for the two trial areas to demonstrate the location distribution of the increased precipitation.
- (5)
The precipitation differences at upwind and downwind were studied. The catalytic effect was 58% stronger upwind than downwind in the Wushaoling area, and the p-value is 0.29. The catalytic effect was 19% stronger upwind than downwind in the Liupan Mountain area, and the p-value is 0.46.
- (6)
A comparative analysis of the number of negative ions before and after the experiment was conducted, and it was found that the number of ions in the Wushaoling area increased by about 18% during the experiment, with the p-value of 1.5 × 10⁻⁴. The Liupan Mountain area increased by 208% and the p-value is 3.38 × 10⁻⁶.
- (7)
Data from the all-sky imager in Wushaoling was analyzed. It was found that the cloud volume basically increased from September to November in 2020 compared to the same period in 2019. The increase in cloud volume in October was relatively the largest, and the smallest increase in one indicator was also 15% more, and the total cloud volume even increased by 40%. The p-values for all three indicators are relatively small, with a maximum of only 0.07.
From the analysis of precipitation, it can be seen that the precipitation during the trial period basically achieved the expected effect, which is a 20% increase in precipitation. However, their p-values are relatively large. This is because our test period is relatively short; only about four months of testing has been conducted so far. At the same time, the duration of the artificial precipitation operation is usually longer. We believe this result will improve with a longer trial. For the analysis of the negative ion count and cloudiness, it was found that the increase in these two indicators was more significant during the trial period and the p-values were relatively small, showing that the devices have a significant and measurable impact on the environment and are positive for forming precipitation.


