
Erosion Resistance Performance of Surface-Reinforced Levees Using Novel Biopolymers Investigated via Real-Scale Overtopping Experiments


1
Department of Land, Water and Environment Research, Korea Institute of Civil Engineering and Building Technology, Goyang 10223, Korea
2
Department of Civil Engineering, Kyungsung University, Busan 48434, Korea
*
Author to whom correspondence should be addressed.
†
The authors contributed to this work equally.
Water 2021, 13(18), 2482; https://doi.org/10.3390/w13182482
Submission received: 19 August 2021
/
Revised: 6 September 2021
/
Accepted: 6 September 2021
/
Published: 10 September 2021
(This article belongs to the Section Hydraulics and Hydrodynamics)
Abstract
:This study evaluates a novel biopolymer-based material reinforcement method. A real-scale experiment minimizing flood disasters and economic losses incurred by the collapse of river levees due to overtopping was conducted. At the Andong River Experiment Center, lateral overflow was reproduced to induce levee collapse using sand, reinforced novel materials, and vegetation levees represented as cases 1, 2, and 3, respectively. The flow in the upstream and downstream areas was measured, and fluctuations in the lateral overflow discharge were calculated using an acoustic Doppler current profiler. To quantitatively verify the performance of this method, the collapse delay effect based on the surface loss rate of the levee slope was analyzed using image pixel analysis and three-dimensional point cloud modeling. Comparing the collapse delay effect of the new-material levee with that of the non-reinforced levees, we found a time delay of approximately 2.7–7 times from the occurrence of overtopping via the lateral flow to the end of the test. These results indicate that we can secure time for emergency repairs and operations by reinforcing the levee surface using the material proposed in this study. These research findings are expected to provide the basis for the proper design and construction of river levees.
1. Introduction
The continuous reinforcement of levees is required worldwide because most existing levee structures are old. Levees are essential structures that prevent the flooding of rivers and protect lowlands. The collapse of levees causes secondary damage, such as urban flooding, and has a complex impact on the changes in river environments and aquatic ecosystems [1,2,3]. Therefore, although the value of levees as structures is low, their potential value can be immeasurable considering the social and economic value of the protected lowland areas. More than 75% of levees in South Korea collapse due to overtopping and piping, and the major causes of levee collapse reported worldwide are: (1) overtopping (34%), (2) piping (28%), and (3) structural issues (30%) [4,5]. In particular, owing to changes in rainfall patterns caused by climate change, long rainy seasons, and heavy rainfall, preemptive measures to prevent the recurrence of overtopping are necessary to minimize the damage from levee collapse caused by overtopping.
Since the 1960s, more than 730 experiments on the collapse of dams and levees have been conducted to understand the collapse mechanisms of levees via overtopping and to verify the reinforcement methods [5]. Tinney and Hsu [6] performed a fuse plug dam breach experiment, while Fujita and Tamamura [7] conducted a three-dimensional (3D) analysis of the non-cohesive levee collapse process through a small-scale hydraulic experiment. In addition, many experiments have been performed considering the conditions of various levee bodies, such as their configuration and size. The levee collapse mechanism due to overtopping as determined by several previously conducted hydraulic experiments is as follows: first, as the strength of the soil particles constituting a levee is reduced by rainfall erosion, scour and erosion of the collapsed surface occur because of the local collapse of the embankment slope and the formed flow path. These scour and erosion regions gradually develop, collapsing the levee crown and expanding the collapse cross-section because of increased flow [8,9,10]. Because small-scale hydraulic experiments experience issues resulting from scaling effects and simplifications, real-scale field experiments are crucial for understanding the complex natural phenomenon of levee collapse and verifying the stability of levees. Liu and Wu [11] performed flood routing for actual levee collapse cases. In addition, Huang et al. [12] analyzed the levee collapse mechanism through actual levee collapse cases in Taiwan. Although many researchers have made considerable efforts to investigate and analyze actual levee collapse cases, data collection has been insufficient and limited because most field investigations have focused on recovery after collapse [13]. Considering real- or field-scale experiments, Zhang et al. [14] experimented on levee collapse by overtopping under four cases of varying cohesive strength conditions. Ko and Kang [15] quantitatively analyzed the collapse delay effect by experimenting on a novel material levee with overtopping. These real-scale experiments on levee collapse by overtopping, however, are limited as the lateral overflow that occurs in actual rivers cannot be reproduced to verify reinforcement methods because they are performed such that a flood wave similar to the dam collapse flow is reproduced and distributed into the lowlands. Kakinuma and Shimizu [16] suggested a levee collapse mechanism by lateral overflow using an experiment involving the collapse of an actual levee by lateral overflow.
While the complex levee collapse mechanism has been investigated, the existing analysis techniques are limited. Regarding experimental studies on analyzing levee collapse patterns, image analysis is usually conducted using an imaging device while recording the collapse process over time [14,17,18]. In particular, Kakinuma and Shimizu monitored the collapse process of a levee using acceleration sensors, but this method incurs considerable costs. In recent years, the structure from motion technique, which identifies the structure of a facility based on high-resolution data obtained through drones with excellent accessibility, has been used to analyze the characteristics of seabed habitats, measure the water depth, and explore the marine environment and topography [19,20]. This technique can achieve high accuracy based on high-resolution data and provide excellent accessibility and economic efficiency.
To understand the factors that affect levee collapse, the hydrodynamic forces and material and soil properties of the system must be investigated. Therefore, accurate information concerning the inflow hydrographs, breach outflow hydrographs, and breach geometry before and during the collapse, including the shape, side slope, and width, is required. Moreover, information concerning the collapse time and embankment, such as the particle size, clay content, and construction method, is required [5]. In this study, the collapse delay effect of a novel biopolymer-based levee is evaluated using a real-scale experiment, and reliable results are obtained under different levee conditions through image analysis. To achieve this, the following analysis methods are used: the existing surface loss rate analysis technique based on image digitizing and image pixels and the 3D point cloud modeling technique using drone images is used. The surface loss rate results of each technique are then compared. In addition, the erosion resistance effect over time is determined by measuring the real-time flow and by analyzing changes in the lateral overflow discharge using an Acoustic Doppler Current Profiler (ADCP).
2. Experimental Description
2.1. Levee Properties
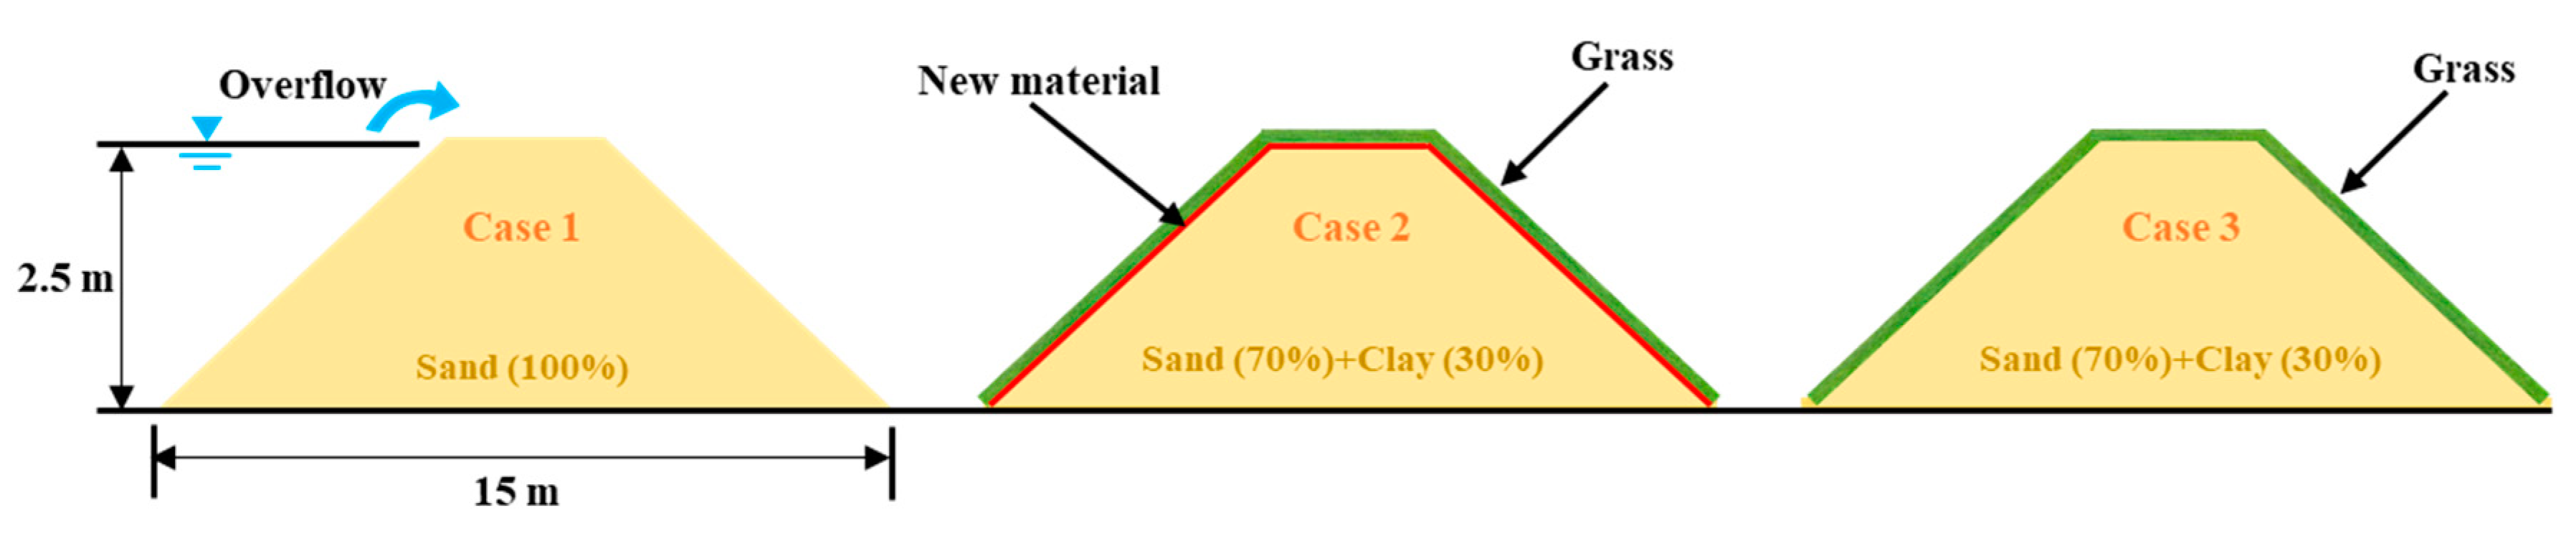
This study examines the collapse delay effect provided by a levee reinforcement using a novel material. A real-scale experiment of levee collapse by lateral overflow was conducted using sand, the novel material, and vegetation levees denoted as cases 1, 2, and 3, respectively. To stabilize the lateral overflow, a levee model was installed in the straight section of the downstream area of the A3 channel at the Andong River Experiment Center (REC). Figure 1 demonstrates the specifications of the levee, including its height (2.5 m), length (15 m), width (4 m), and slope (1:2).
After creating the basic levee by dropping sand from a height of approximately 3 m using heavy machinery, a solid levee was constructed through repeated compaction from the bottom of the model to its top at intervals of 0.5 m using a compaction roller of 1 t. For cases 2 and 3, the experiment was performed after securing a sufficient vegetation rootage time of approximately 2 to 3 months.
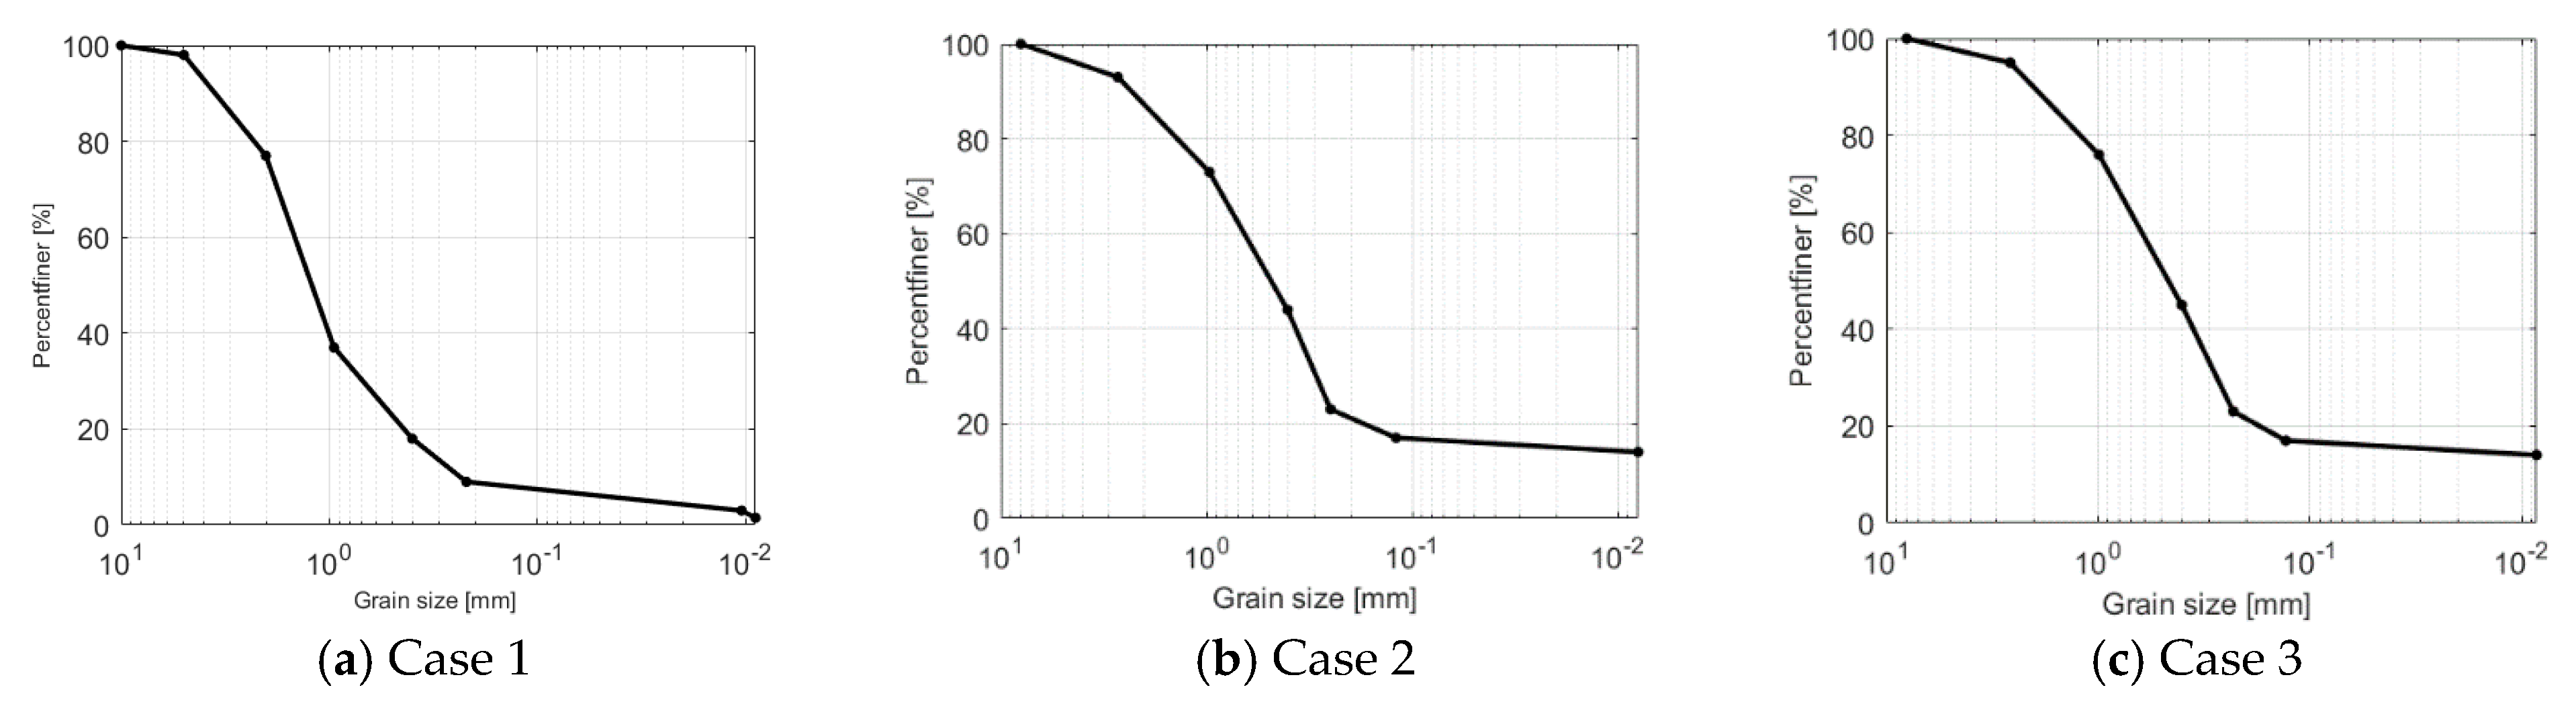
The soil around the REC was classified as sand with poor particle size distribution. Because the soil does not meet the domestic criteria for levee materials in terms of levee leakage resistance, a suitable particle size distribution must be obtained for the experiment by mixing the sand with red clay. Therefore, the Atterberg limit test was conducted according to the mixing ratio between the sand and red clay at the Korea Advanced Institute for Science and Technology (KAIST), a joint research institute for this study. The criteria for levee materials were met when the sand and red clay were mixed at a ratio of 7:3 (Table 1). Based on this mixing ratio, the clayey sand (referred to as SC), with a liquid limit of 21, the plastic limit of 13, and a plasticity index of 8, was used as the material for the levee. The median particle diameters (d50) of the levee material for each case were 1.25, 0.49, and 0.47 mm (Figure 2). In addition, the degree of compaction of the levee achieved through the field compaction test was approximately 92%.
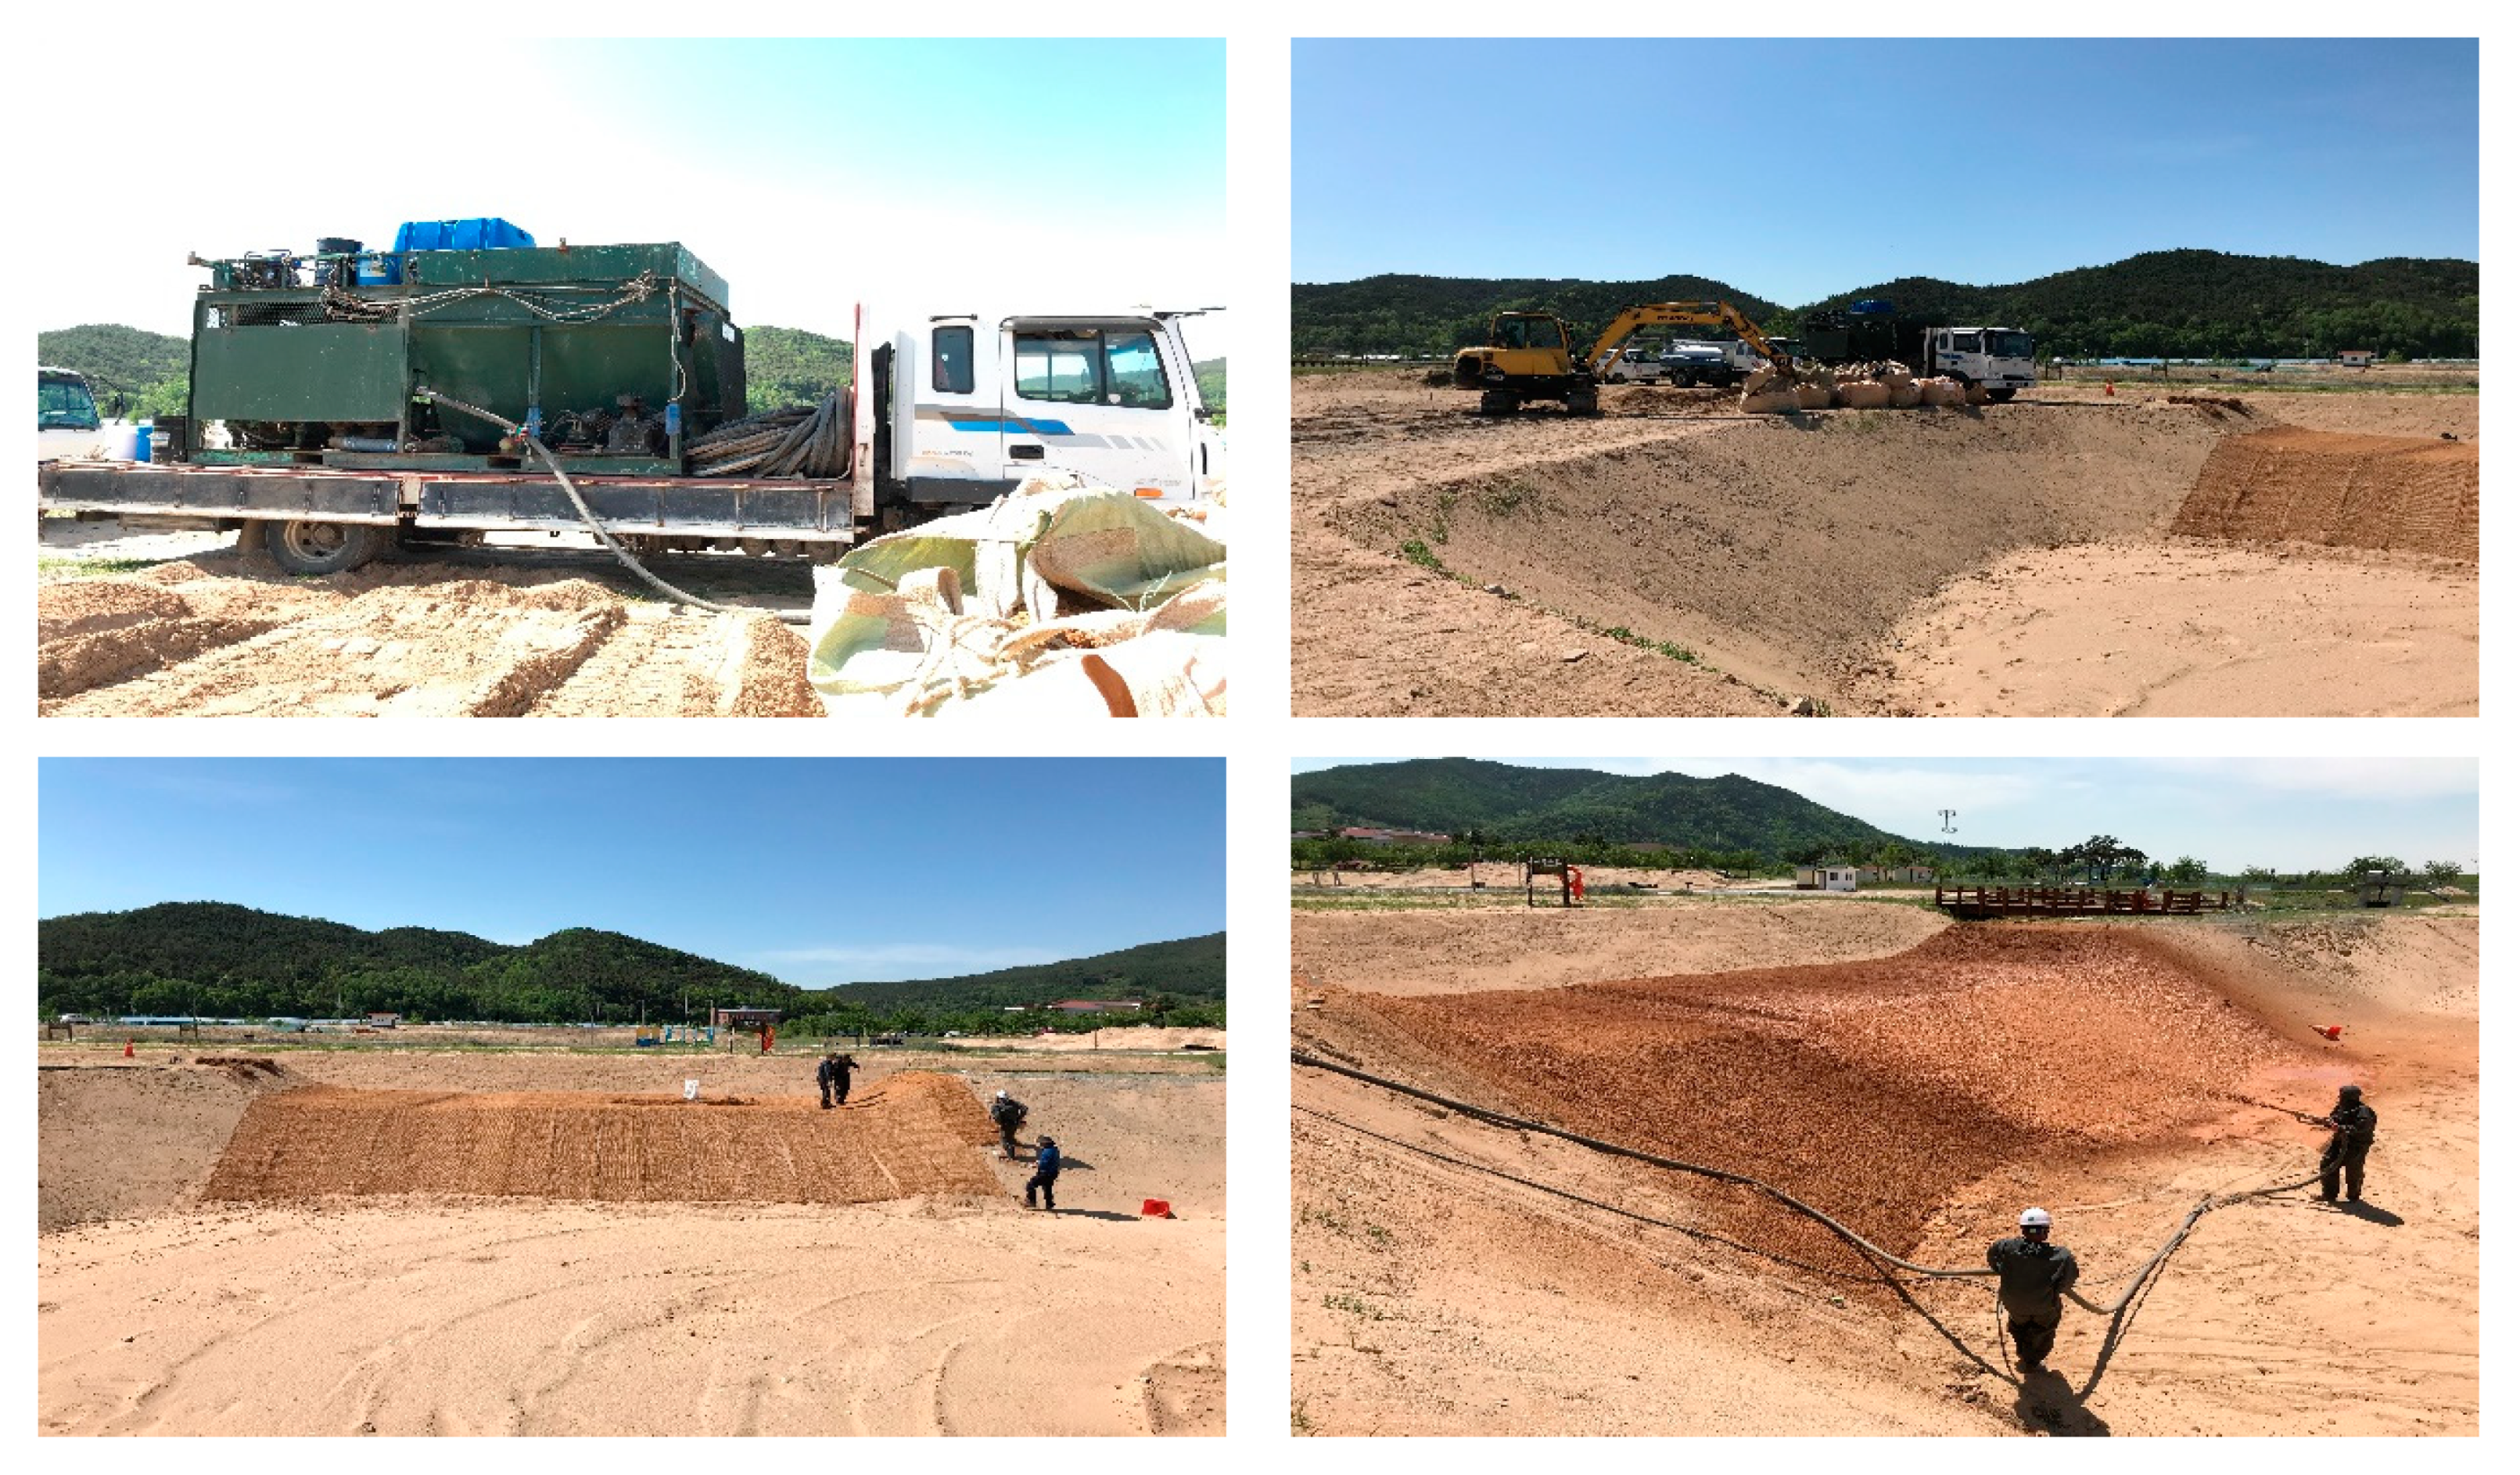
The wet construction method used in the field was utilized to apply the novel material mixed with biopolymers onto the surface of the levee. In this method, all the materials were mixed in a mixing tank and then pumped using the pump pressure. Subsequently, they were sprayed over a wide range through the nozzle using an air compressor. According to the construction sequence, a core net was installed on the surface of the levee to prevent soil loss, and sufficiently mixed materials, such as biopolymers, water, soil, and seeds, were sprayed over the levee surface at a thickness of 0.05 m by an experienced worker. Figure 3 depicts the treatment process implemented to apply the new material onto the surface of the levee.
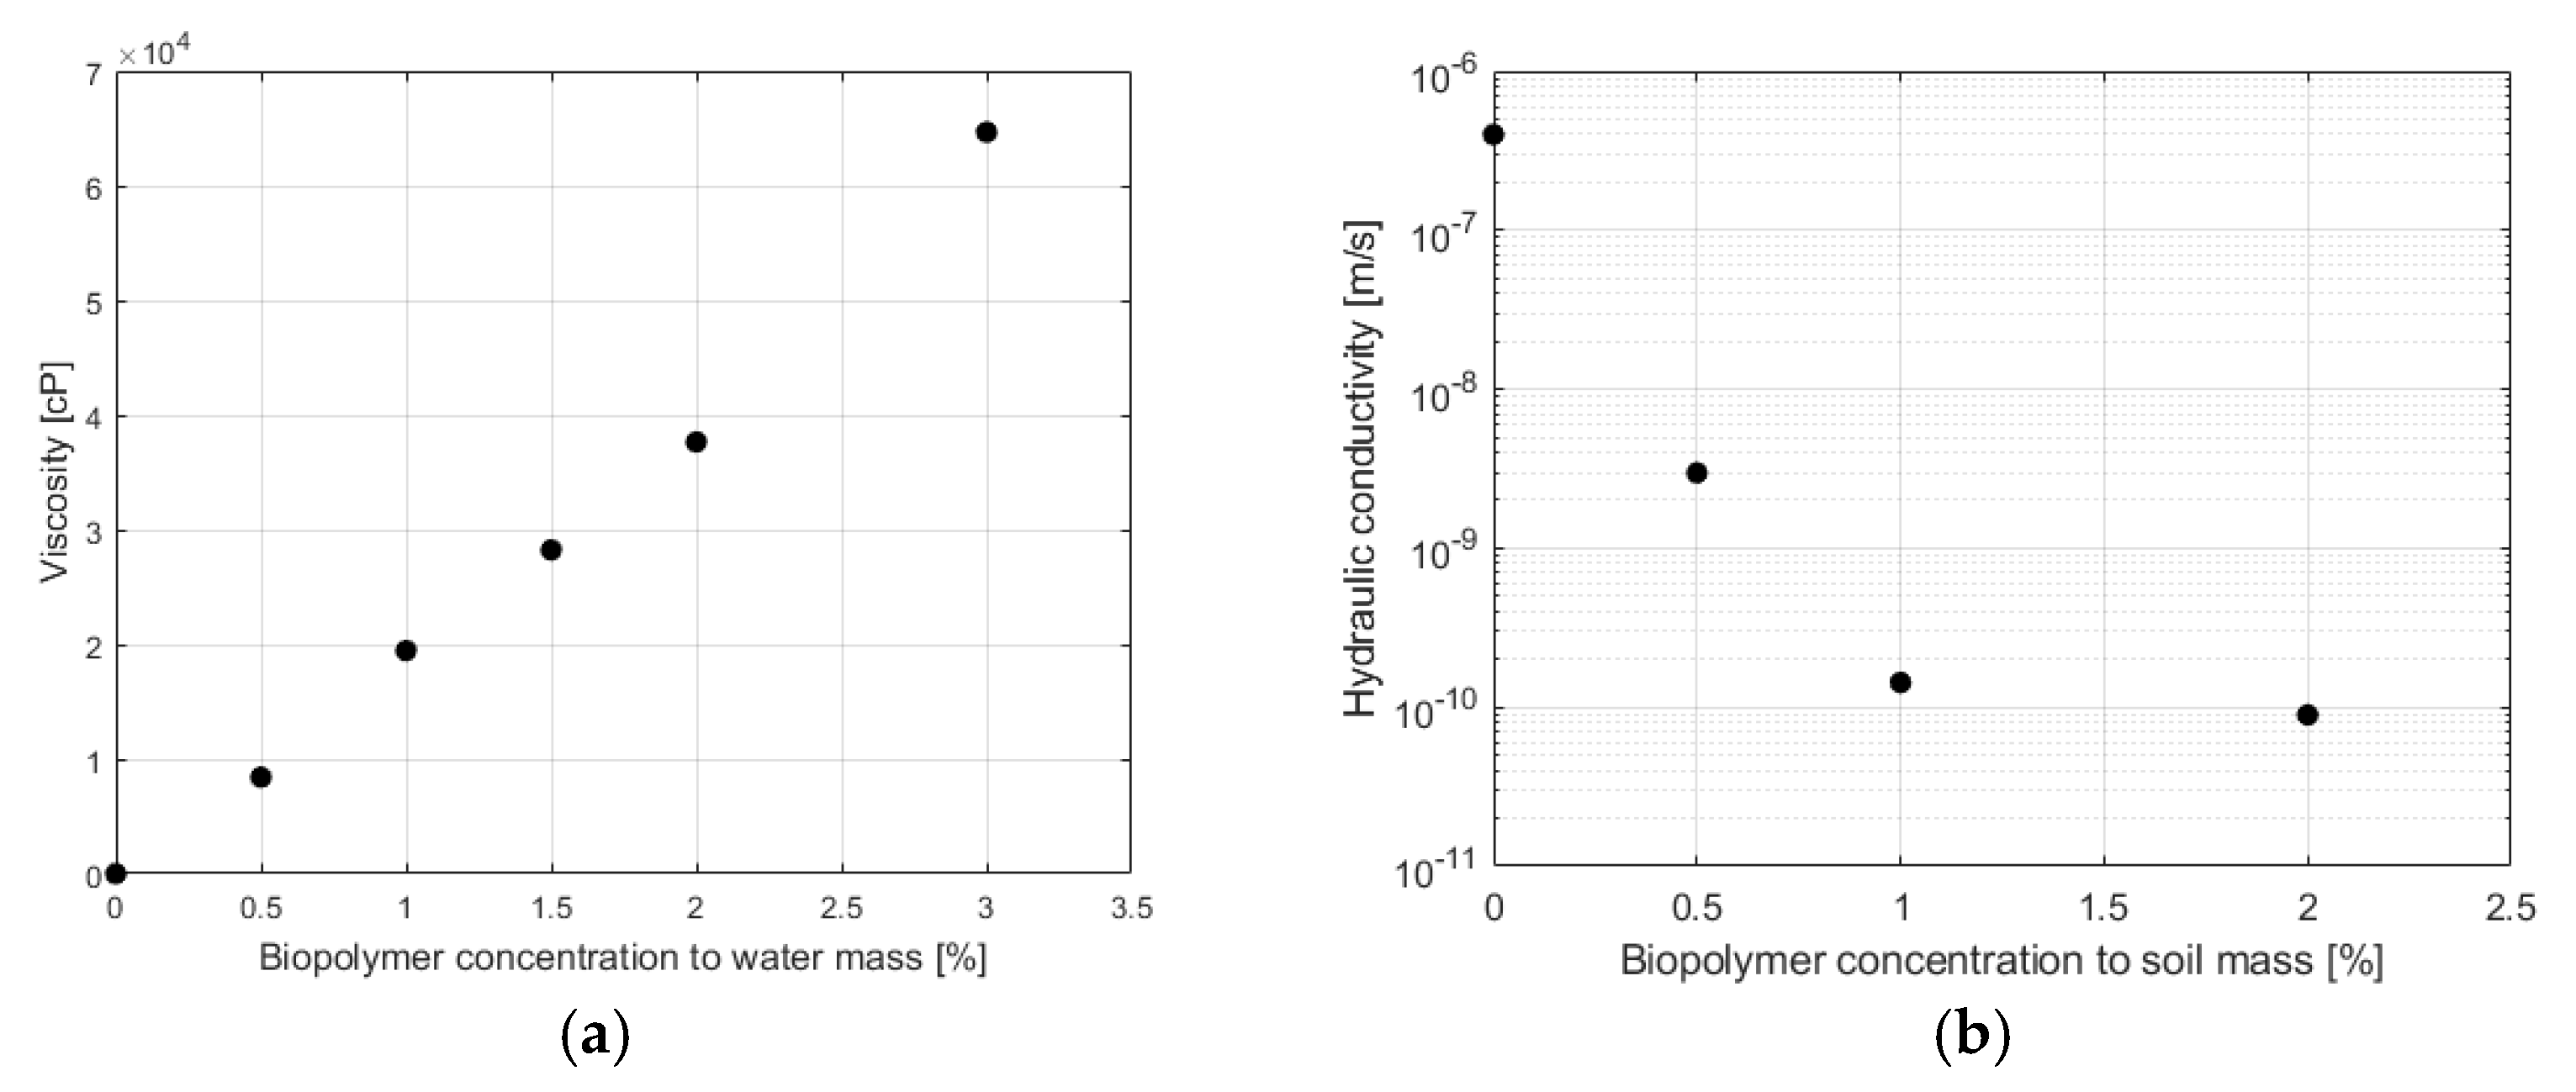
Biopolymers are organic precipitates developed from biological sources. They are commonly categorized into three types: polynucleotides, polypeptides, and polysaccharides. In this study, a blend of multiple polysaccharides was used, and the primary properties of these polysaccharides largely depended on the type, position, and physical structure of the linkages. The microbial-sourced polysaccharides were used to achieve the desired mechanical properties (viscosity, hydraulic conductivity, and swelling capacity), as depicted in Figure 4. The erosion resistance of the multiple polysaccharides was tested in a previous study, and the erosion resistance was improved by the ability of the proposed material to enhance inter-particle bonding, increase fluid viscosity, and induce greater pore-clogging [21]. These new materials based on biopolymers are expected to apply to various eco-friendly ground construction areas owing to their ground strength improvement, erosion inhibition, and vegetation growth improvement effects [22].
2.2. Experimental Method
The study primarily investigates the overtopping response of a levee treated with the novel material using a real-scale experiment. The quantitative analysis of the surface loss rate of the levee slope is examined to verify the levee collapse delay effect provided by the novel material. To analyze the irregular collapse behavior of the levees, 4K cameras were installed at the front and on both sides of the levee. In addition, various data required for analysis were collected using drones and the RTK GPS. Based on the collected data, the surface loss rate over time was quantitatively calculated through image analysis and 3D point cloud modeling.
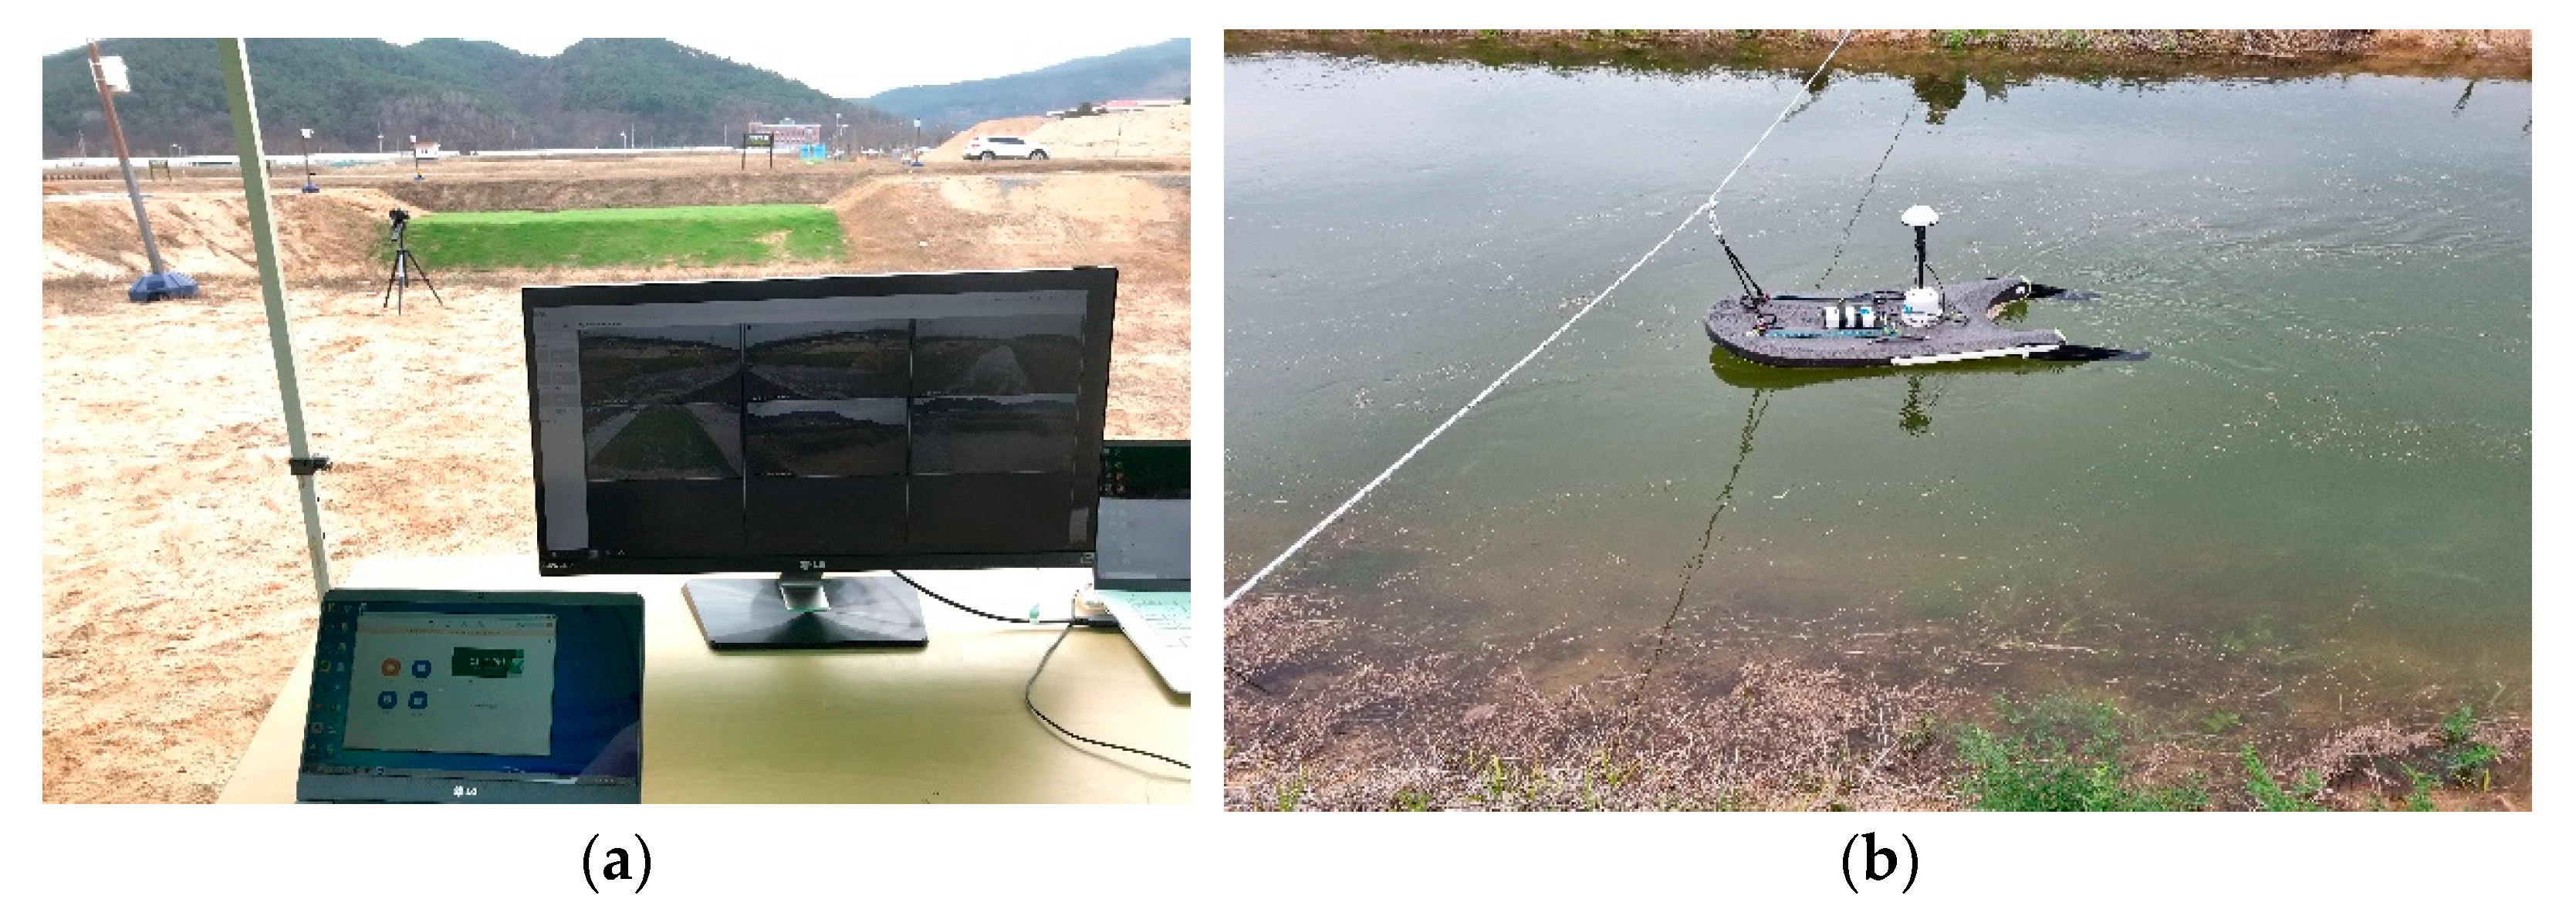
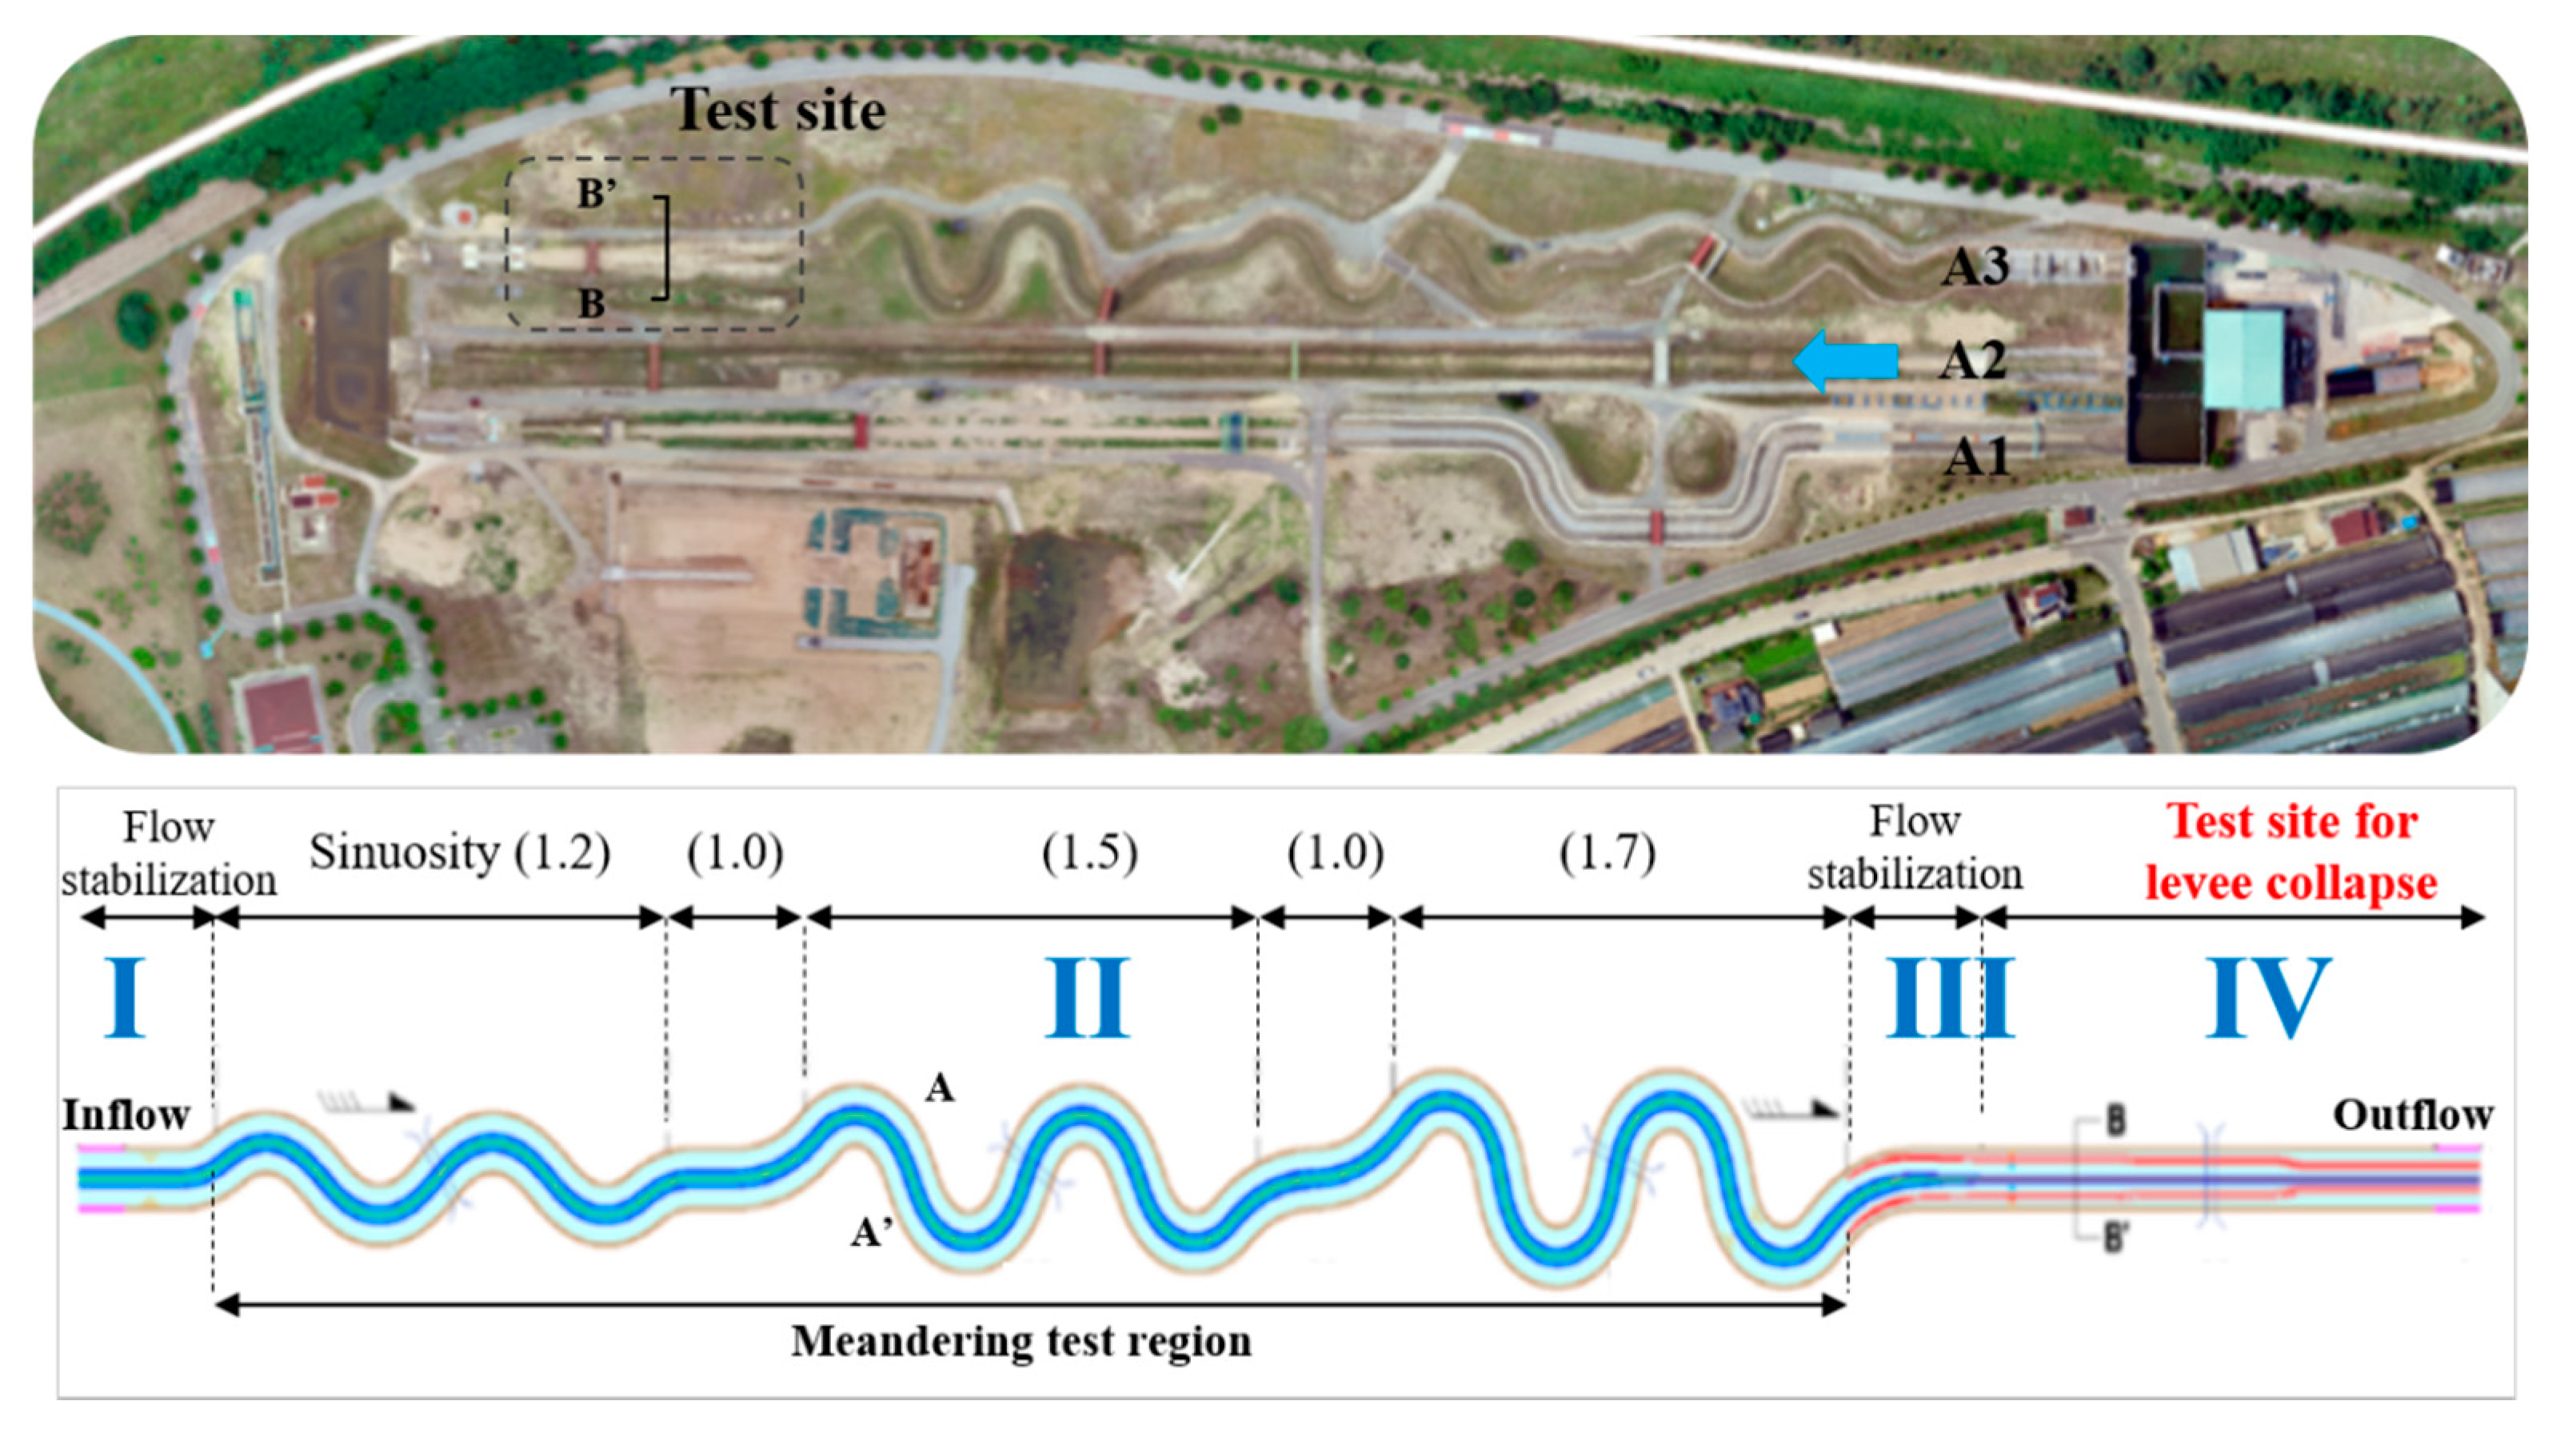
To analyze the erosion resistance effect caused by the delay of levee collapse based on the novel material, the same flow rate was used for each experimental condition. With REC, we can control a maximum flow rate of 10 m3/s using a pump facility and supply the flow using a water tank. Considering the flow in the A3 channel used to achieve levee collapse, the water level in the channel slowly increased up to the brink of overtopping by introducing a constant flow from the upstream area of the channel. A flow rate of 4 m3/s was then generated in a stable flow state to induce lateral overflow. The ADCP was used to measure and verify the flow rate supplied from the upstream and downstream areas through the pump facility (Figure 5). In addition, the flow rate was measured at the front and back of line B-B’ considering the bends of the A3 channel and location of overtopping (Figure 6). For the surface loss rate analysis, the analysis time point (time = 0) is at a time to start overtopping.
3. Results
3.1. Image Analysis of the Surface Loss Rate under Each Levee Condition
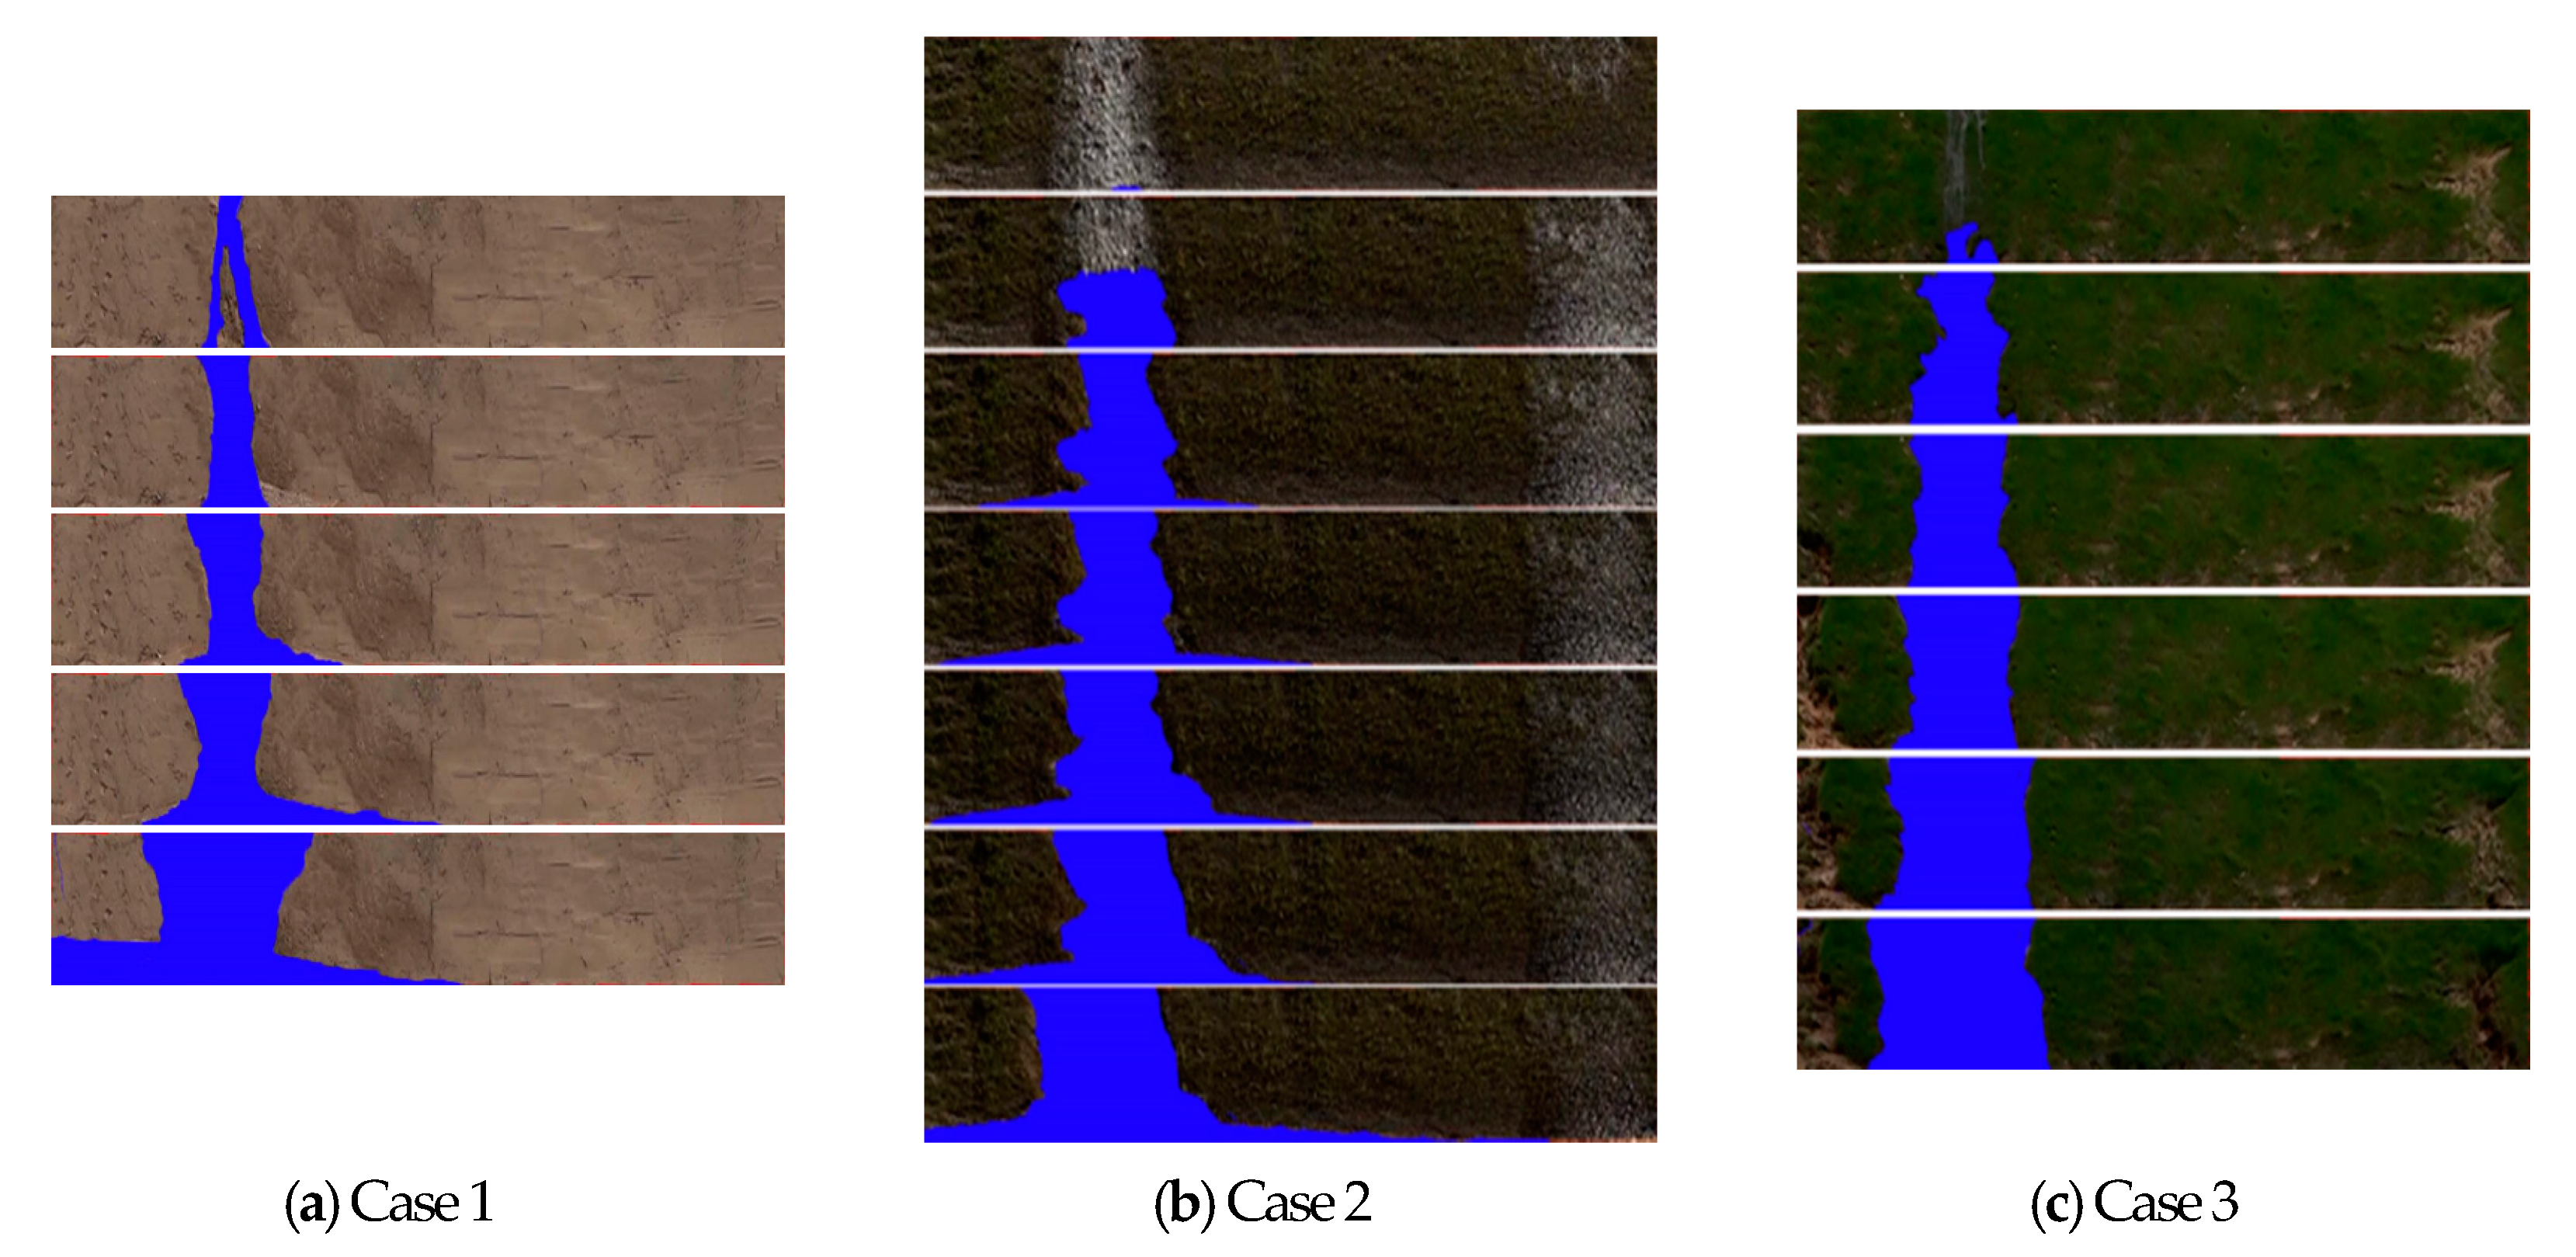
A pixel-based image analysis technique was implemented to quantitatively calculate the surface loss rate. It works by selecting the levee slope on the lowland side as an analysis target, capturing and correcting images at regular time intervals, designating the collapse range using graphic software, and measuring the change in the number of pixels compared to the total number of pixels (with a slope of 100%) by calculating the collapse scale. This is a useful analysis method for measuring the instantaneous changes in width caused by strong flows, such as those resulting from a levee collapse (Figure 7).
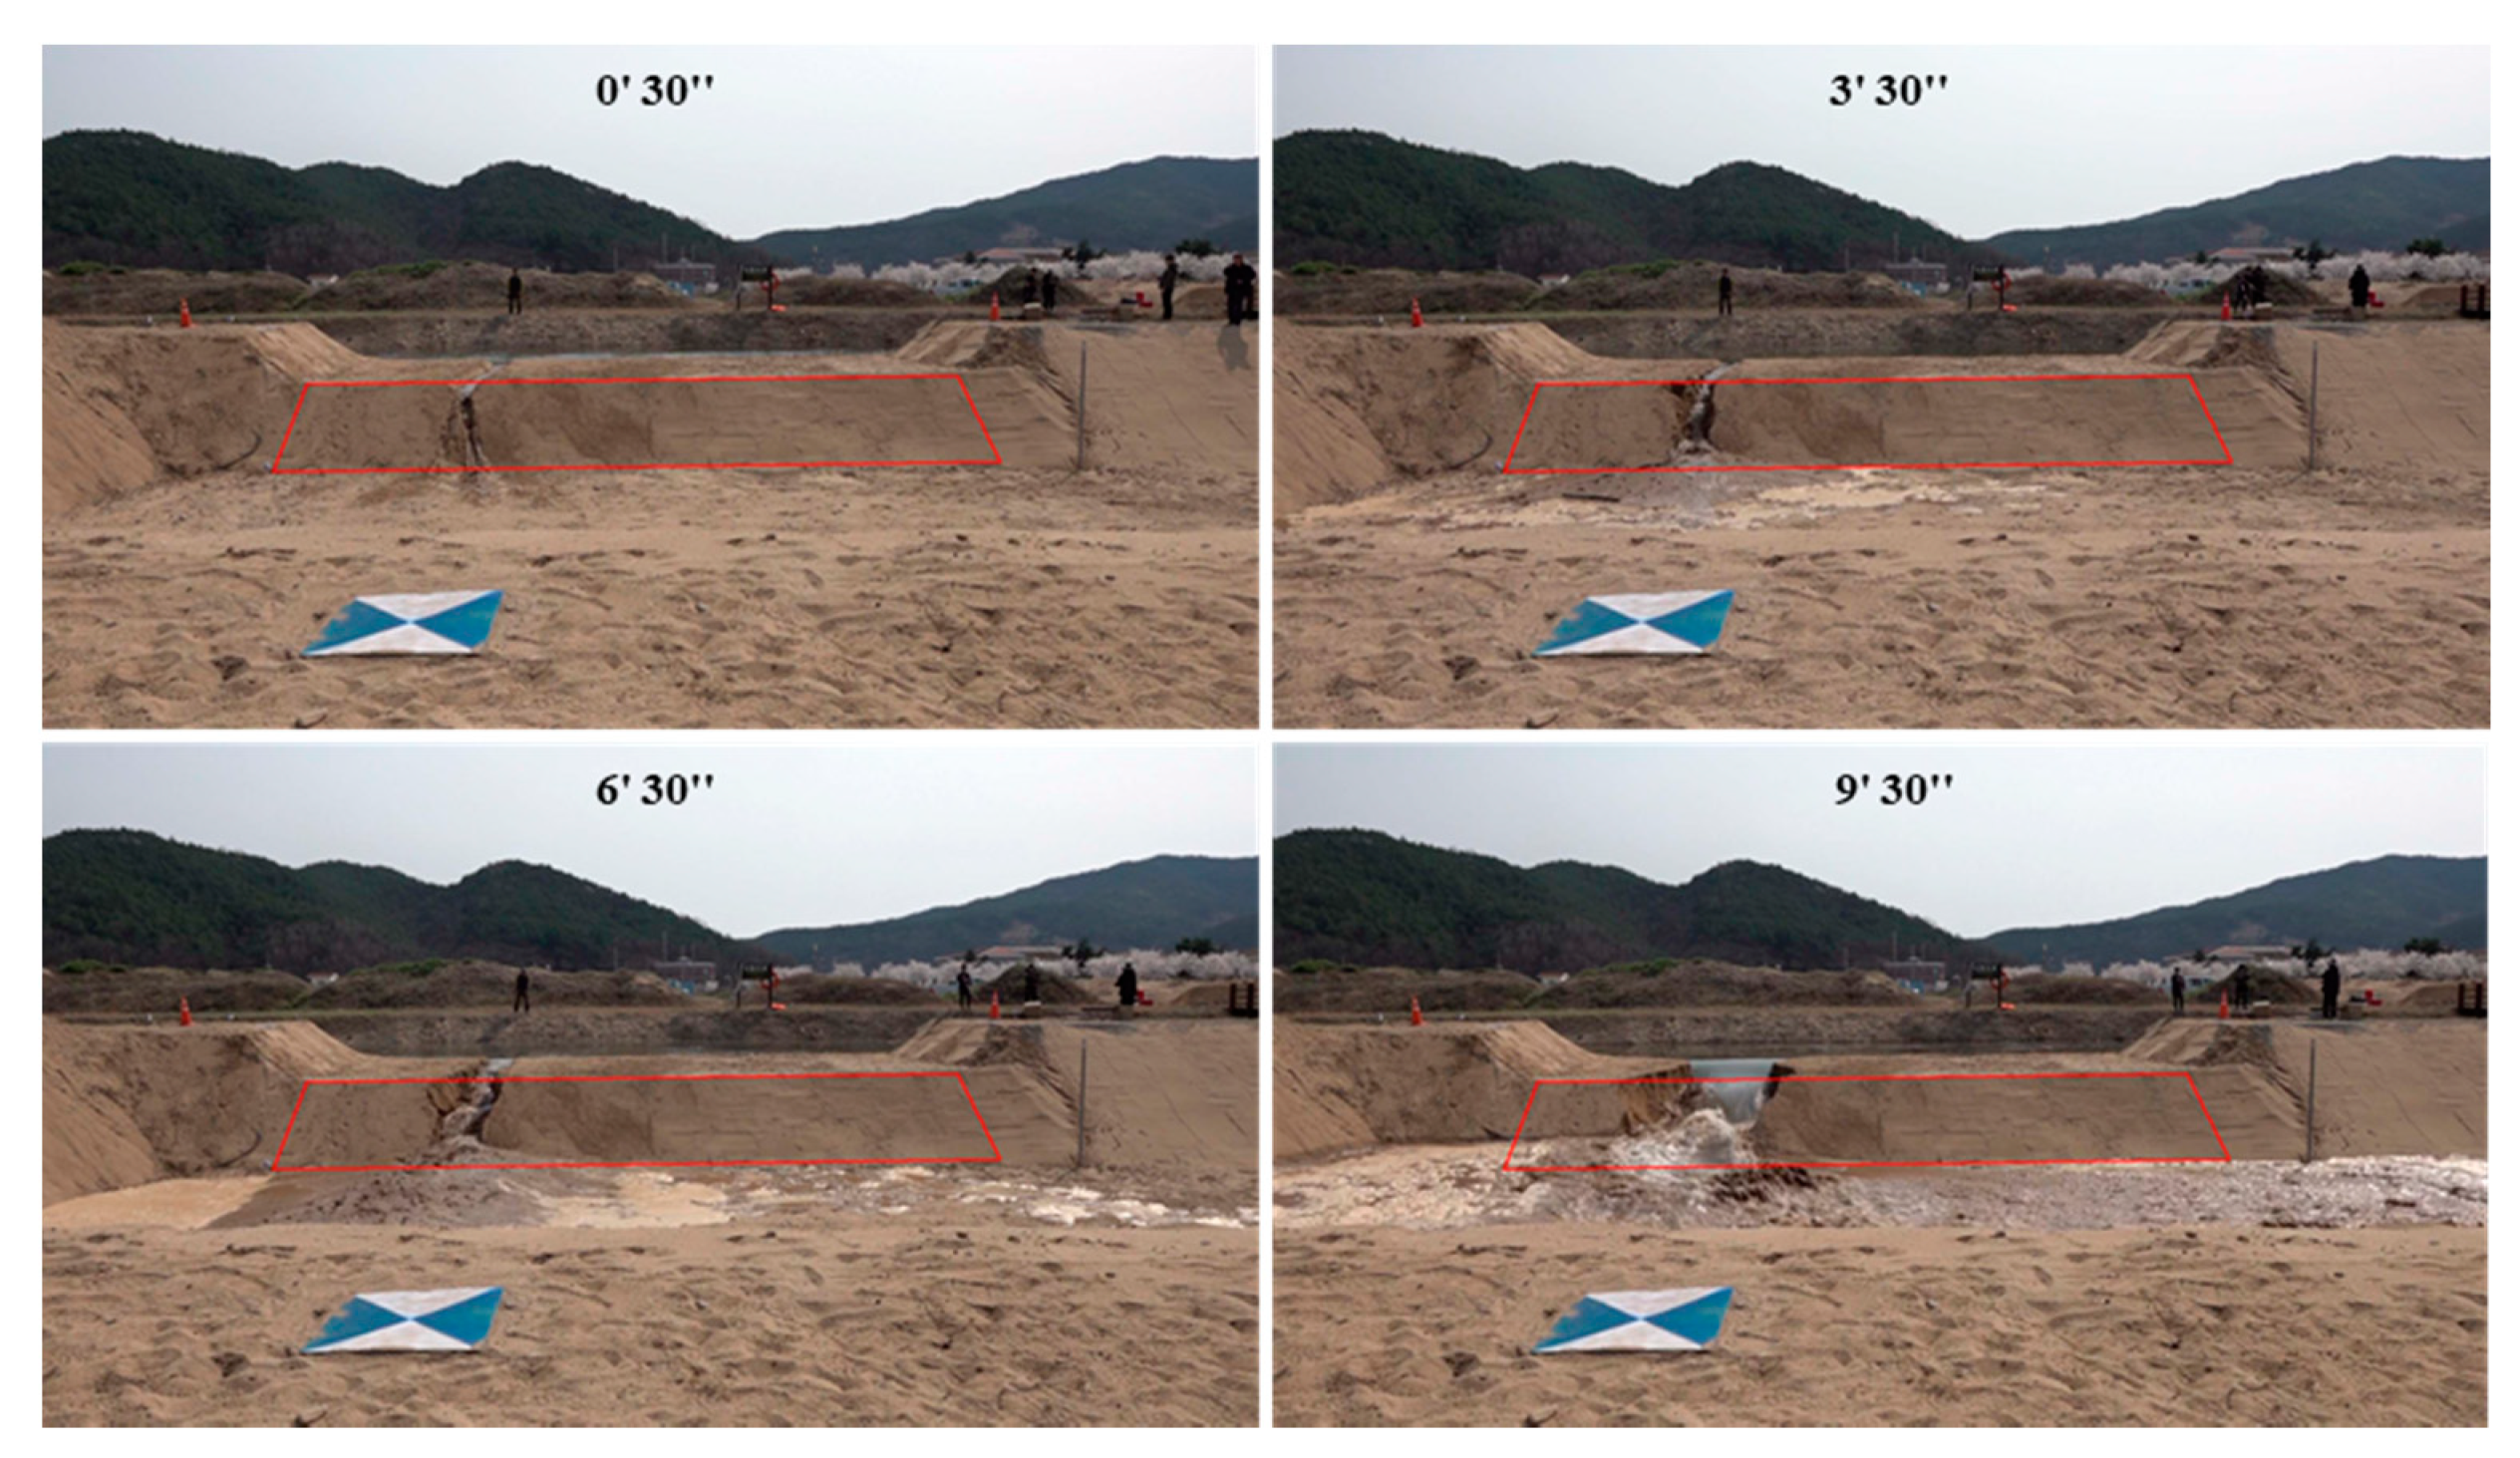
The surface loss rate calculation results show that the levee collapsed immediately after overtopping and developed into gully erosion as a small valley in Case 1. A surface loss rate of approximately 10.4% occurred after 5.5 min, and a loss rate of more than 20% was observed after 8.5 min. The erosion of the levee was then accelerated owing to the increase in the overflow discharge, and vertical erosion in the form of a right angle occurred in the cross-section of the overtopping region. A loss rate of 24.5% occurred 9 min after overtopping, and the experiment was then terminated (Figure 8).
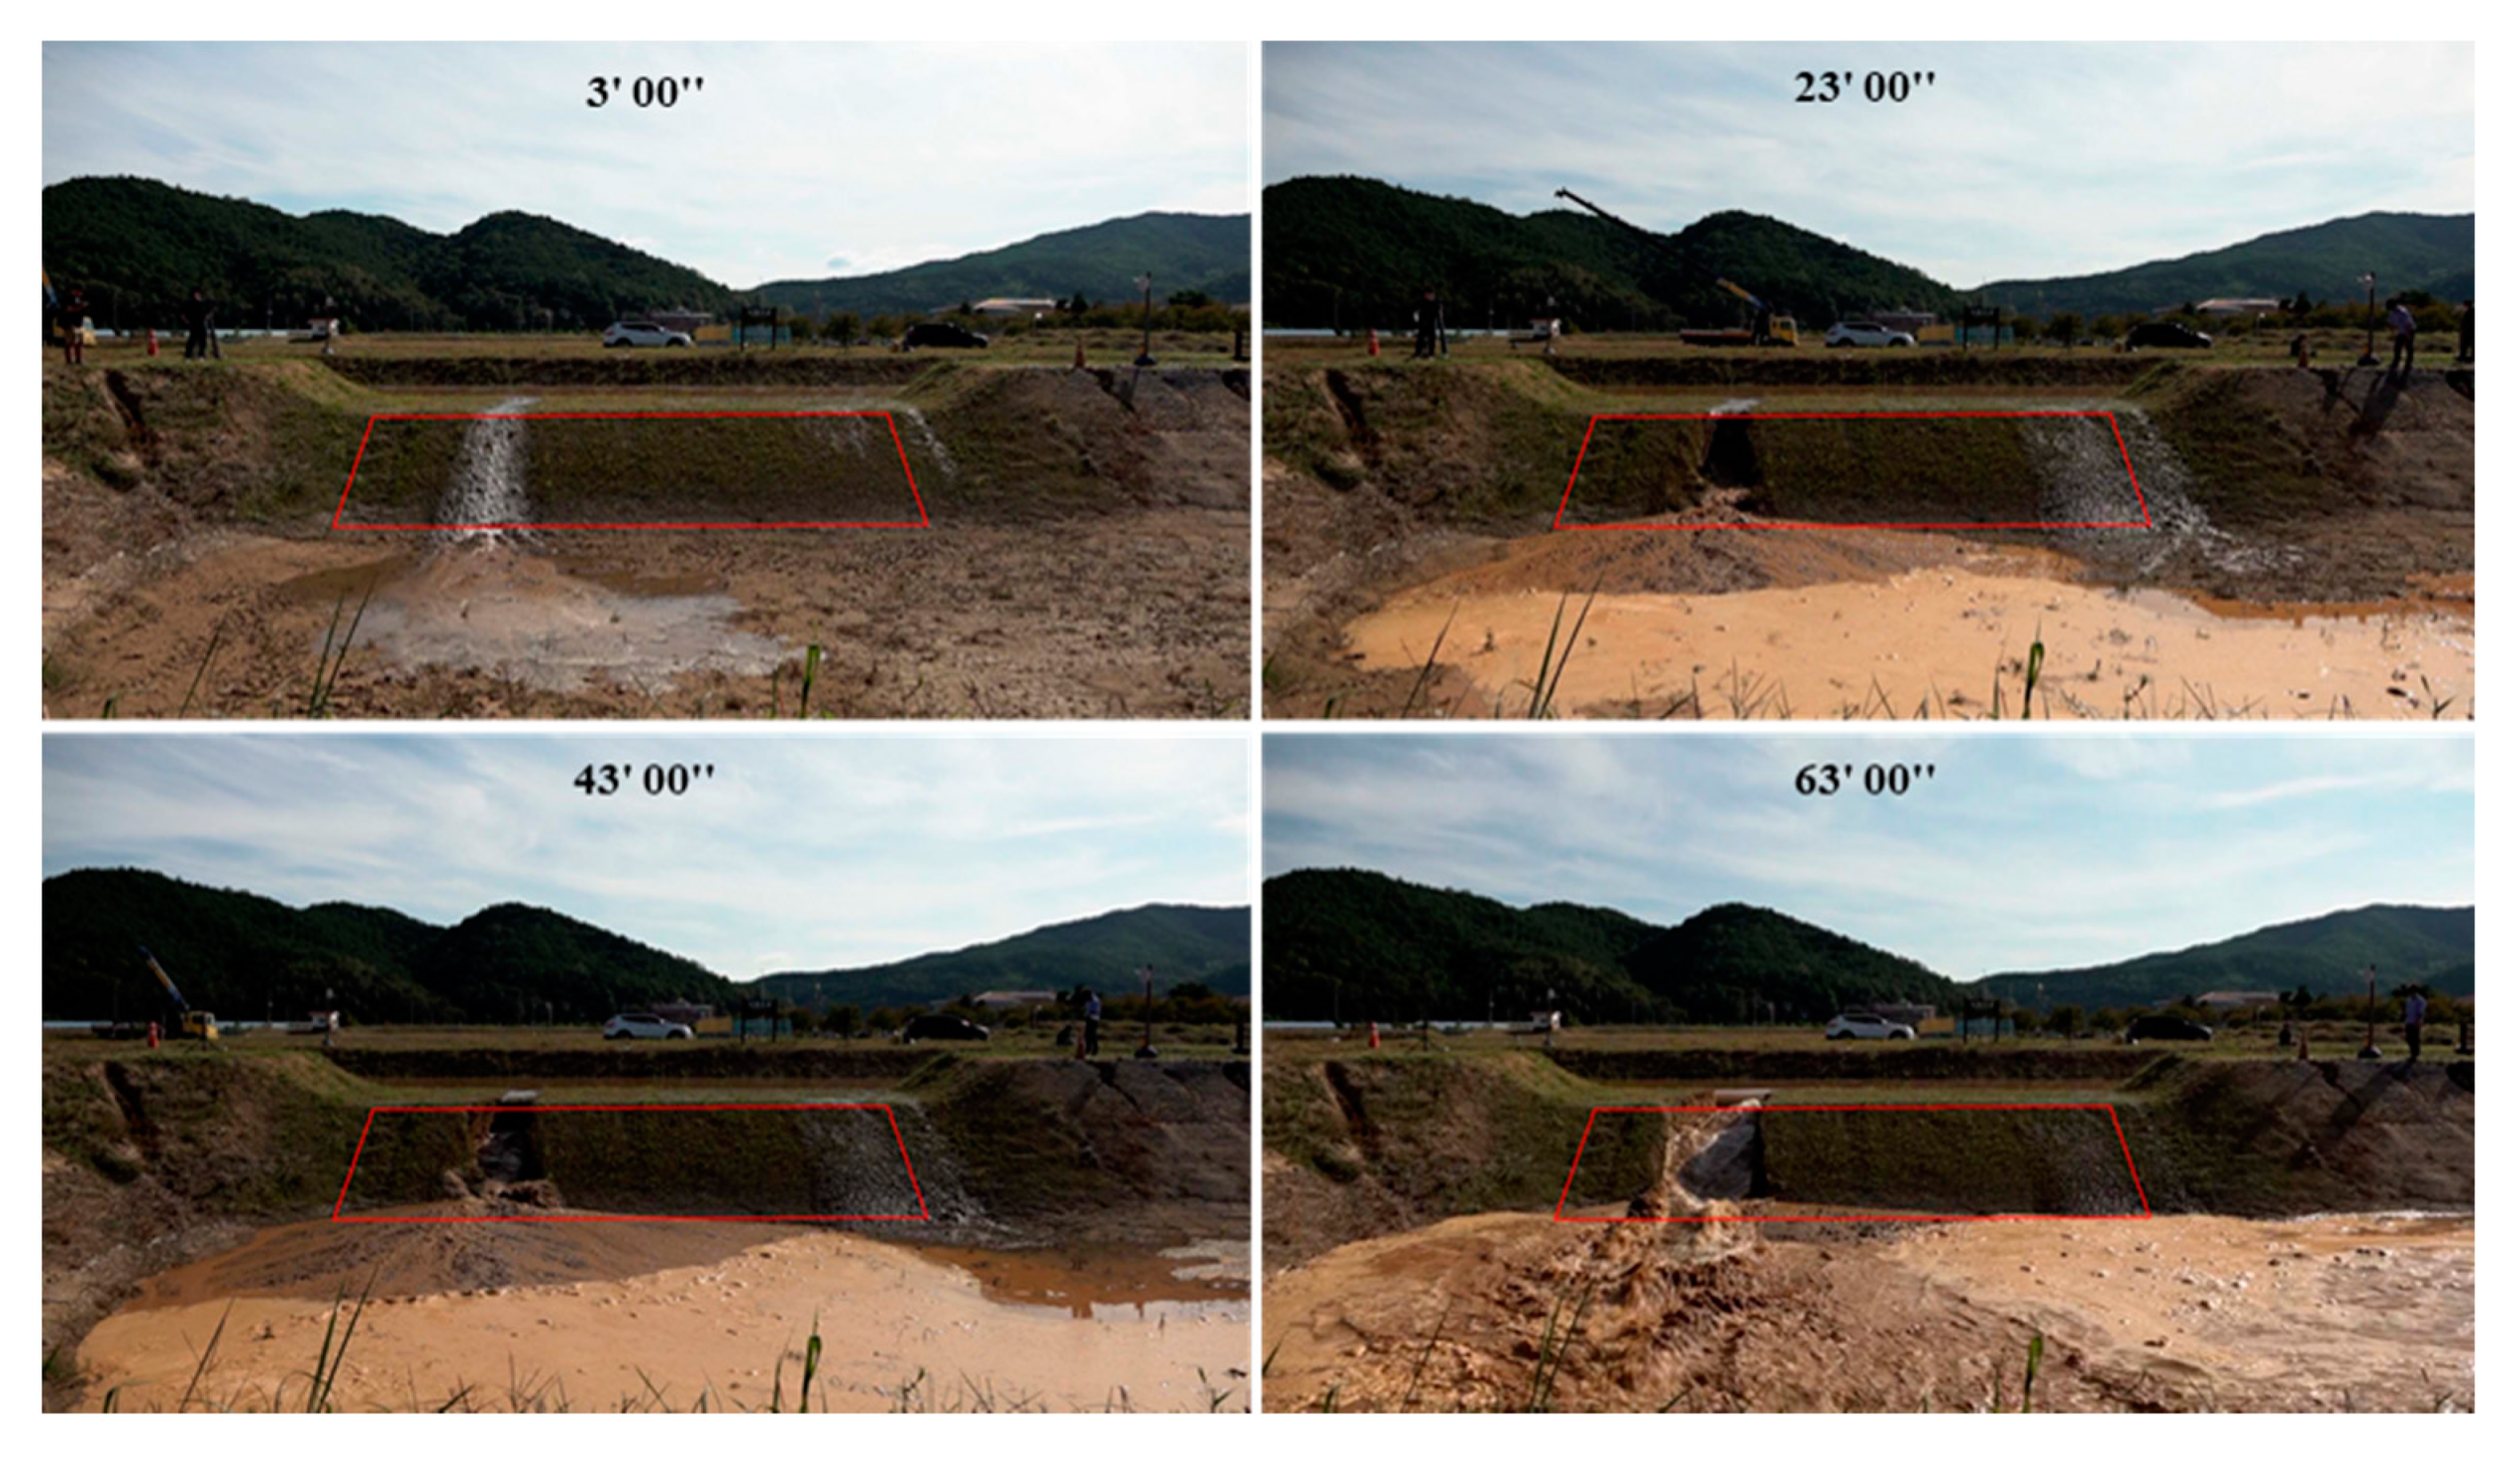
In Case 2, erosion was first observable with the naked eye 3 min after the start of the experiment. The failure area increased at the center and toe of the levee. However, a loss rate of less than 7% was observed after 13 min, indicating the slow progress of the collapse. A surface loss rate exceeding 15% occurred only after 33.3 min. The collapse progressed in the form of vertical erosion as a local scour was generated at the center of the slope via the strong vertical flow generated against the overtopping flow. A surface loss rate exceeding 24% was observed 63 min after the occurrence of overtopping. The experiment was subsequently terminated because the collapse was difficult to achieve owing to a sharp increase in the overflow discharge (Figure 9).
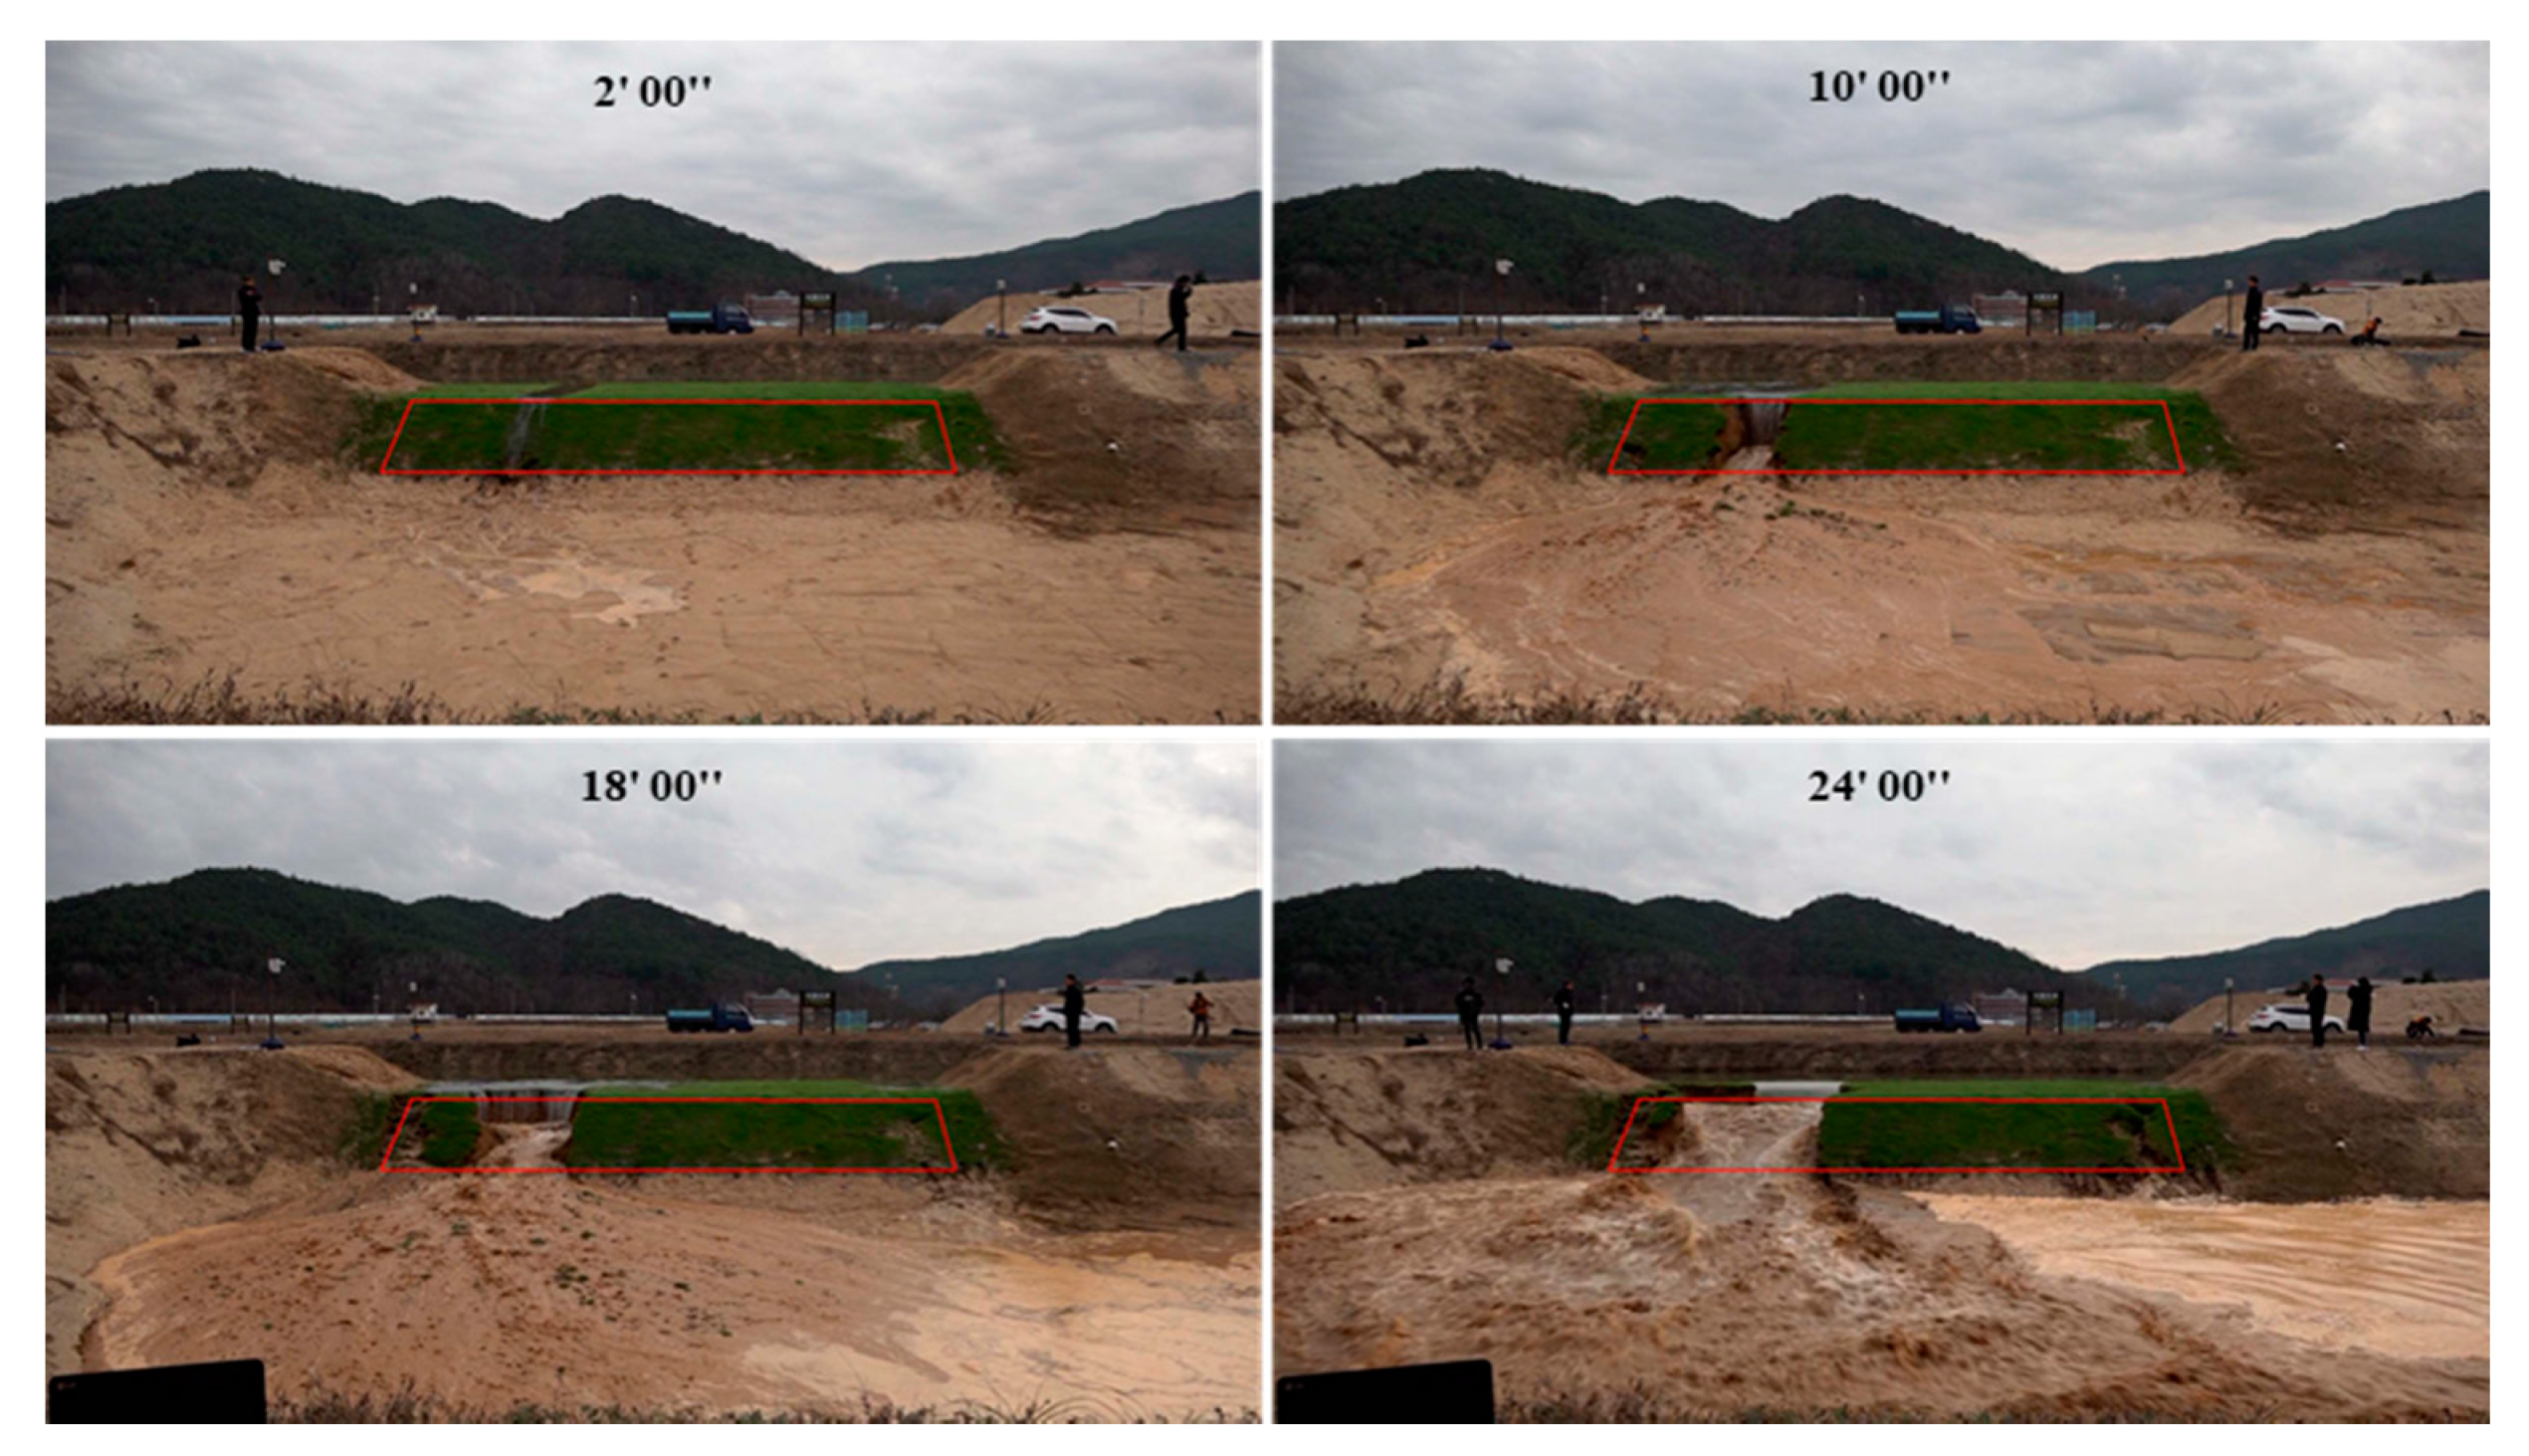
Case 3 was used to provide a direct comparison with the performance of the new material reinforcement method shown in Case 2. A surface loss rate of less than 10% was observed 6 min after the occurrence of overtopping, and a loss rate exceeding 14% occurred approximately 14 min after the occurrence of overtopping as the failure accelerated. Due to the influence of the vegetation roots for stabilizing the soil, the failure of the top of the levee occurred more slowly in Case 3 than in Case 1, but it was faster than that in Case 2. A surface loss rate of approximately 20% was observed 20 min after the occurrence of overtopping, and a sudden collapse occurred at the top when the failure on the levee slope ended. A surface loss rate of more than 26% was observed 24 min after the occurrence of overtopping, and the experiment was terminated owing to a sharp increase in the flow rate (Figure 10).
When the levee collapse time due to lateral overflow was examined using the image analysis technique, the collapse occurred immediately after overtopping in Case 1, while the collapse phenomenon was observed after approximately 3 min in Case 2. By comparing the surface loss rates of the three cases, we observed that the collapse delay effect by reinforcement with the new material (Case 2) is up to seven times greater than that of Case 1 and approximately 2.7 times greater than that of Case 3.
3.2. Comparison of the Cumulative Overflow Discharge and Surface Loss Rate
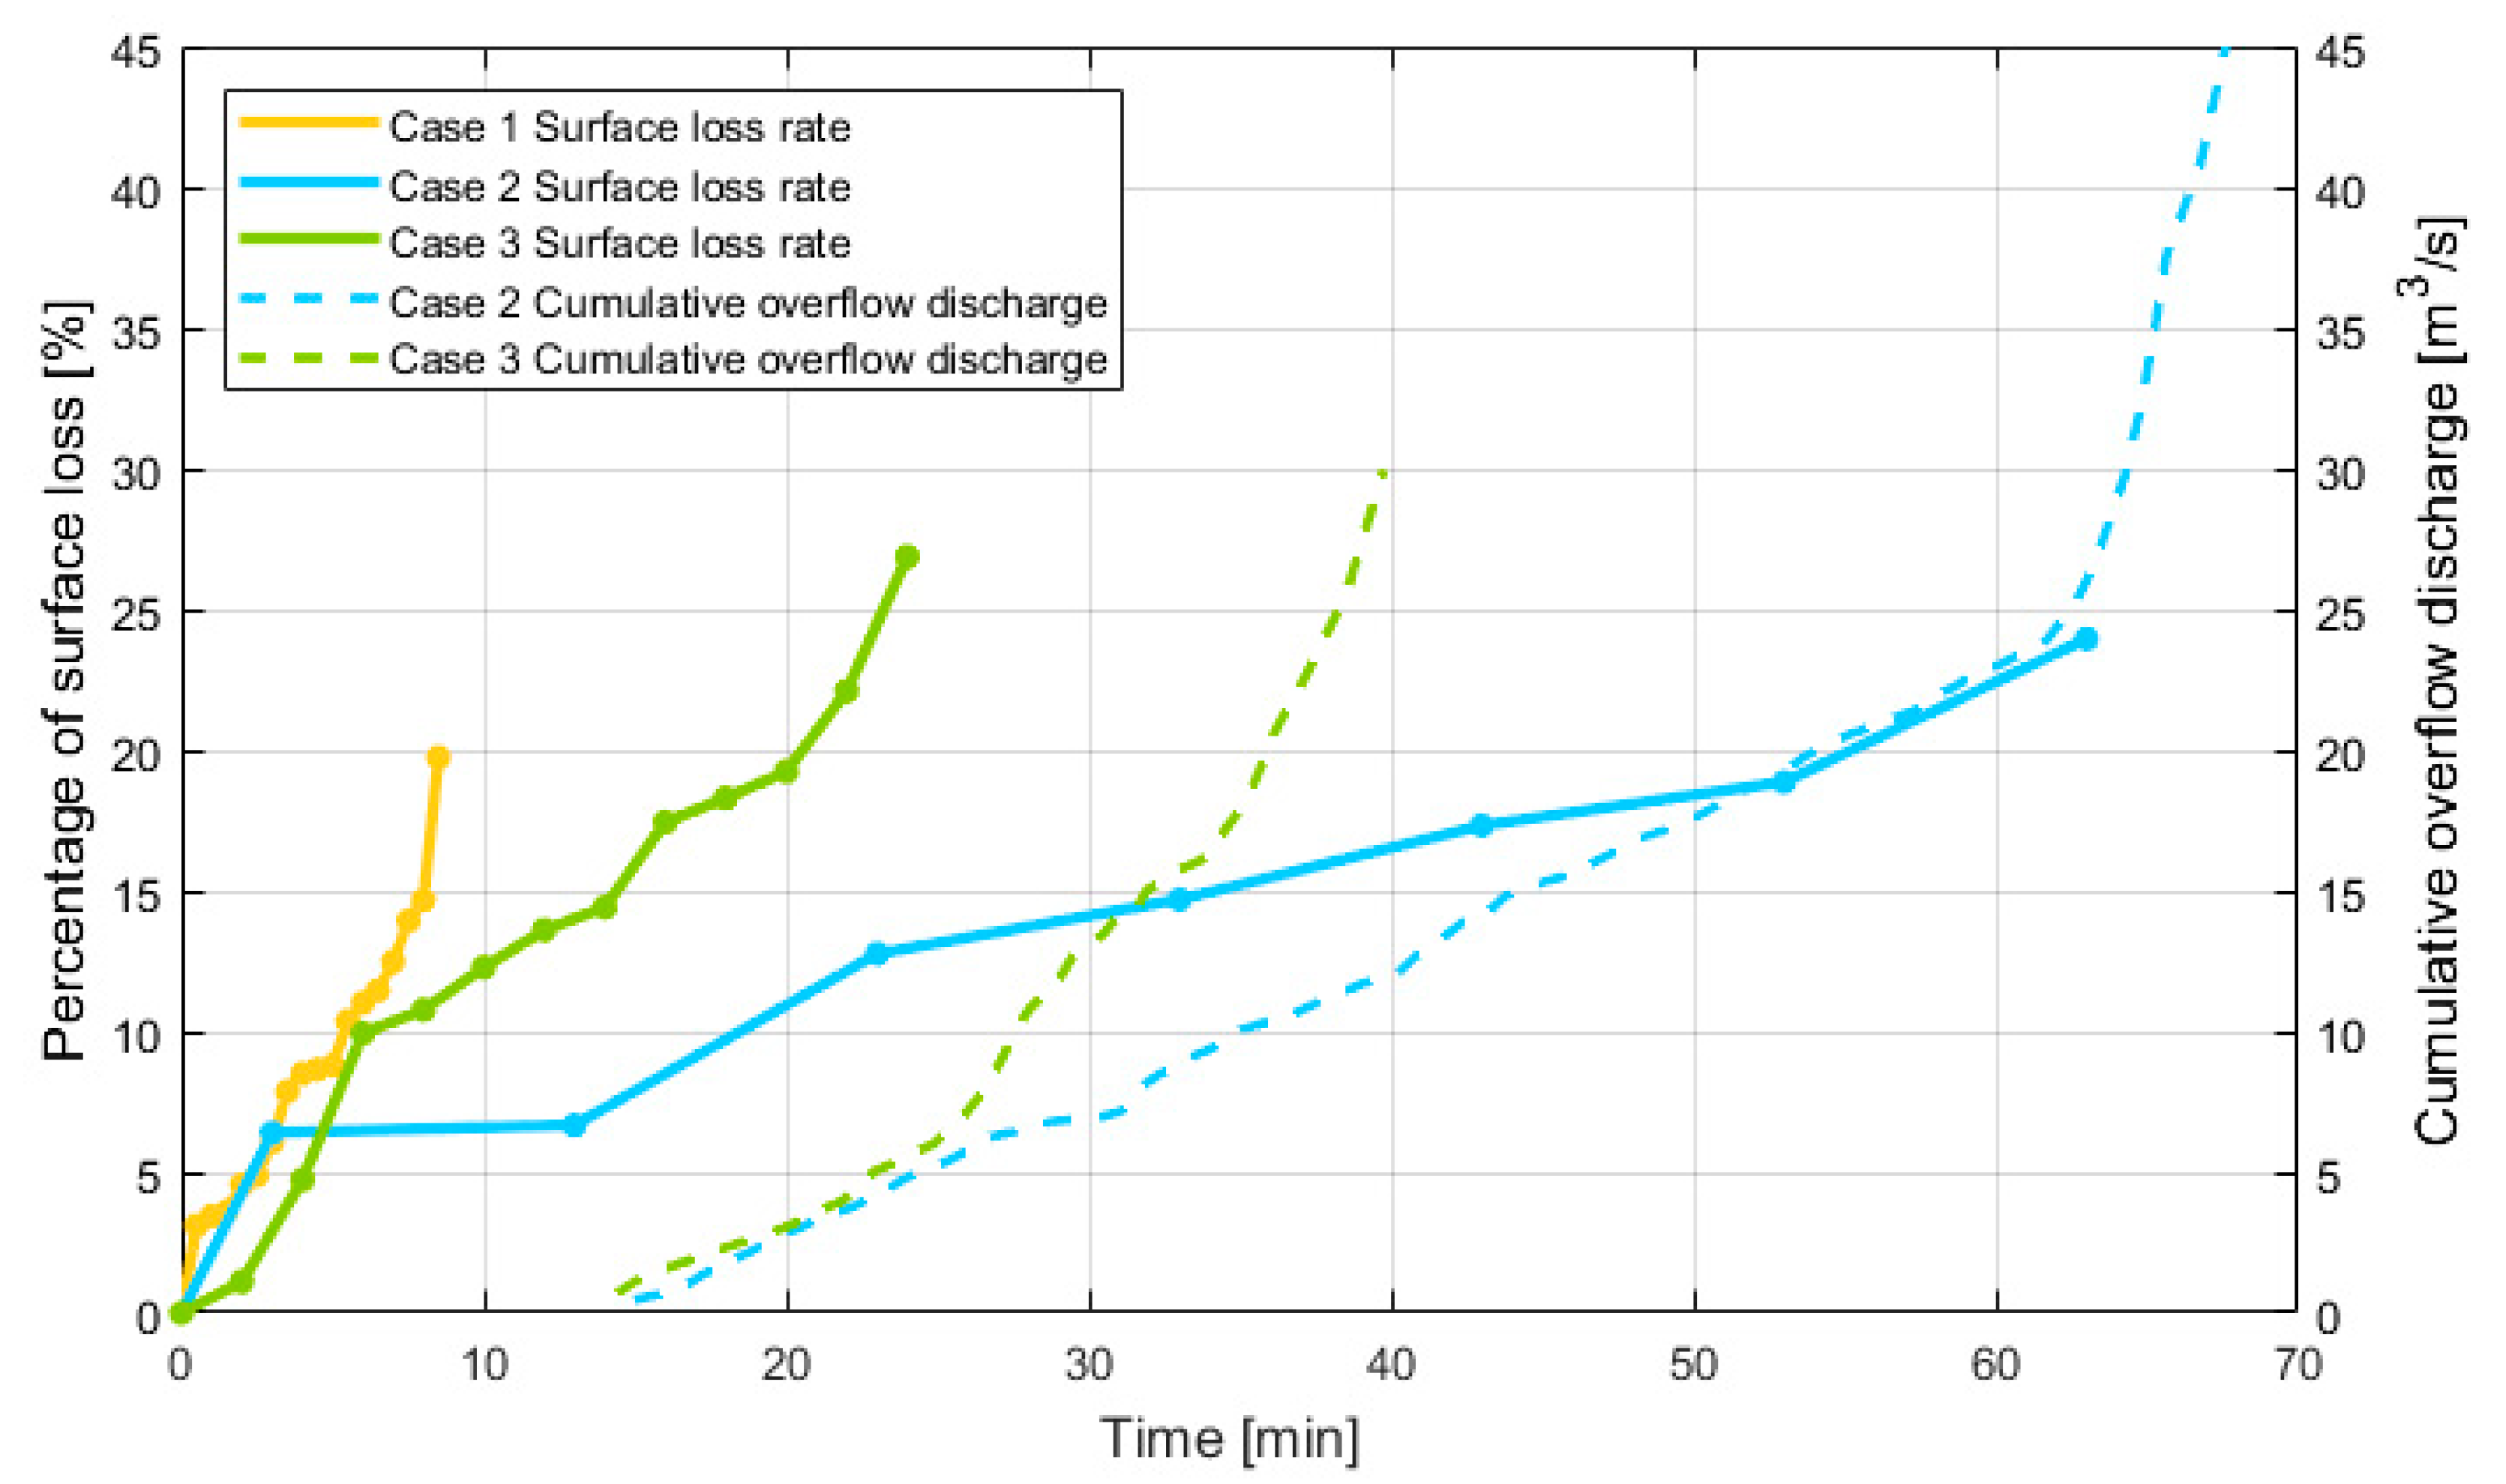
In this study, the lateral overflow discharge directly affecting the levee collapse was analyzed to examine the collapse delay effect of a levee reinforced with the novel material. The flow rate was measured using the ADCP, and the lateral overflow discharge was calculated by comparing the flow rates in the upstream and downstream areas. The cross-sectional average flow rate was measured at the same point in the upstream area of the A3 channel using two round-trips (i.e., at least four measurements were obtained) following the guidelines for ADCP flow rate measurement. The flow rate in the downstream area was measured after a sufficient time (approximately 15 min) for stabilization of the flow in the upstream area had elapsed. For Case 1, the ADCP flow rate measurement was unstable as the levee collapsed early, and the eroded sand particles generated turbid water. Therefore, these results were excluded from the final analysis. The flow rate measurement results from cases 2 and 3 showed that no error exceeding 5%, the criterion suggested by the Office of Surface Water of USGS, United States; the flow rate was equal to that supplied from the large-scale pump facility, i.e., nearly 4 m3/s. Figure 11 illustrates the cumulative overflow discharge calculated by analyzing the flow rate measurement results of cases 2 and 3, as well as the comparative results of the surface loss rates over time using the image pixel analysis technique.
The cumulative overflow discharge required 23 and 63 min to reach approximately 25 m3/s in cases 2 and 3, respectively, and the slopes of the cumulative overflow discharge toward the end of the experiment were approximately 0.3 and 0.5, respectively. These results demonstrate the superior erosion resistance of the levee reinforced with the novel material compared to the vegetation levee, as was demonstrated by the image analysis results presented in the previous section. Therefore, rapid levee collapse did not occur because the slope erosion rate was reduced by the relatively small overflow discharge of Case 2 compared to other levee conditions. The sharp increase in the cumulative overflow discharge was likely caused by the rapid collapse of the top of the levee owing to the strong vertical flow and expansion of the cross-section.
3.3. Analysis of the Surface Loss Rate Using Drones and 3D Point Cloud Modeling
It is challenging to analyze the levee collapse behavior that changes within a short period using the automatic drone imaging technique. Therefore, in this study, two drones (DJI Mavic Inspire and DJI Inspire 1 Pro) were simultaneously flown in the lateral and longitudinal directions to acquire the images required for analysis. The levee slope on the lowland side was selected as the analysis range, and modeling was performed using Pix4D, a 3D modeling software program. In general, 3 to 10 ground control points (GCPs) are required to increase the accuracy of the modeling results. In this study, three 3D GCPs were used in the experiment for Case 1 and four for Case 2 based on the Korea 2000/Central Belt 2010 (EGM 96 Geoid) coordinate system. The GCPs were installed on the left and right sides of the levee test section and at safe positions along the river and lowland sides because they must be preserved even after the experiment. The coordinate information was acquired using the RTK GPS. Case 3 was excluded from the final analysis because data acquisition failed as drone photography was difficult because of inclement weather conditions. Modeling was performed for matching the images after 6.5 and 12 min for Case 1 and after 5, 40, and 50 min for Case 2, based on the time at which overtopping toward the lowland area began. Table 2 lists the number of images used in each model and the modeling results.
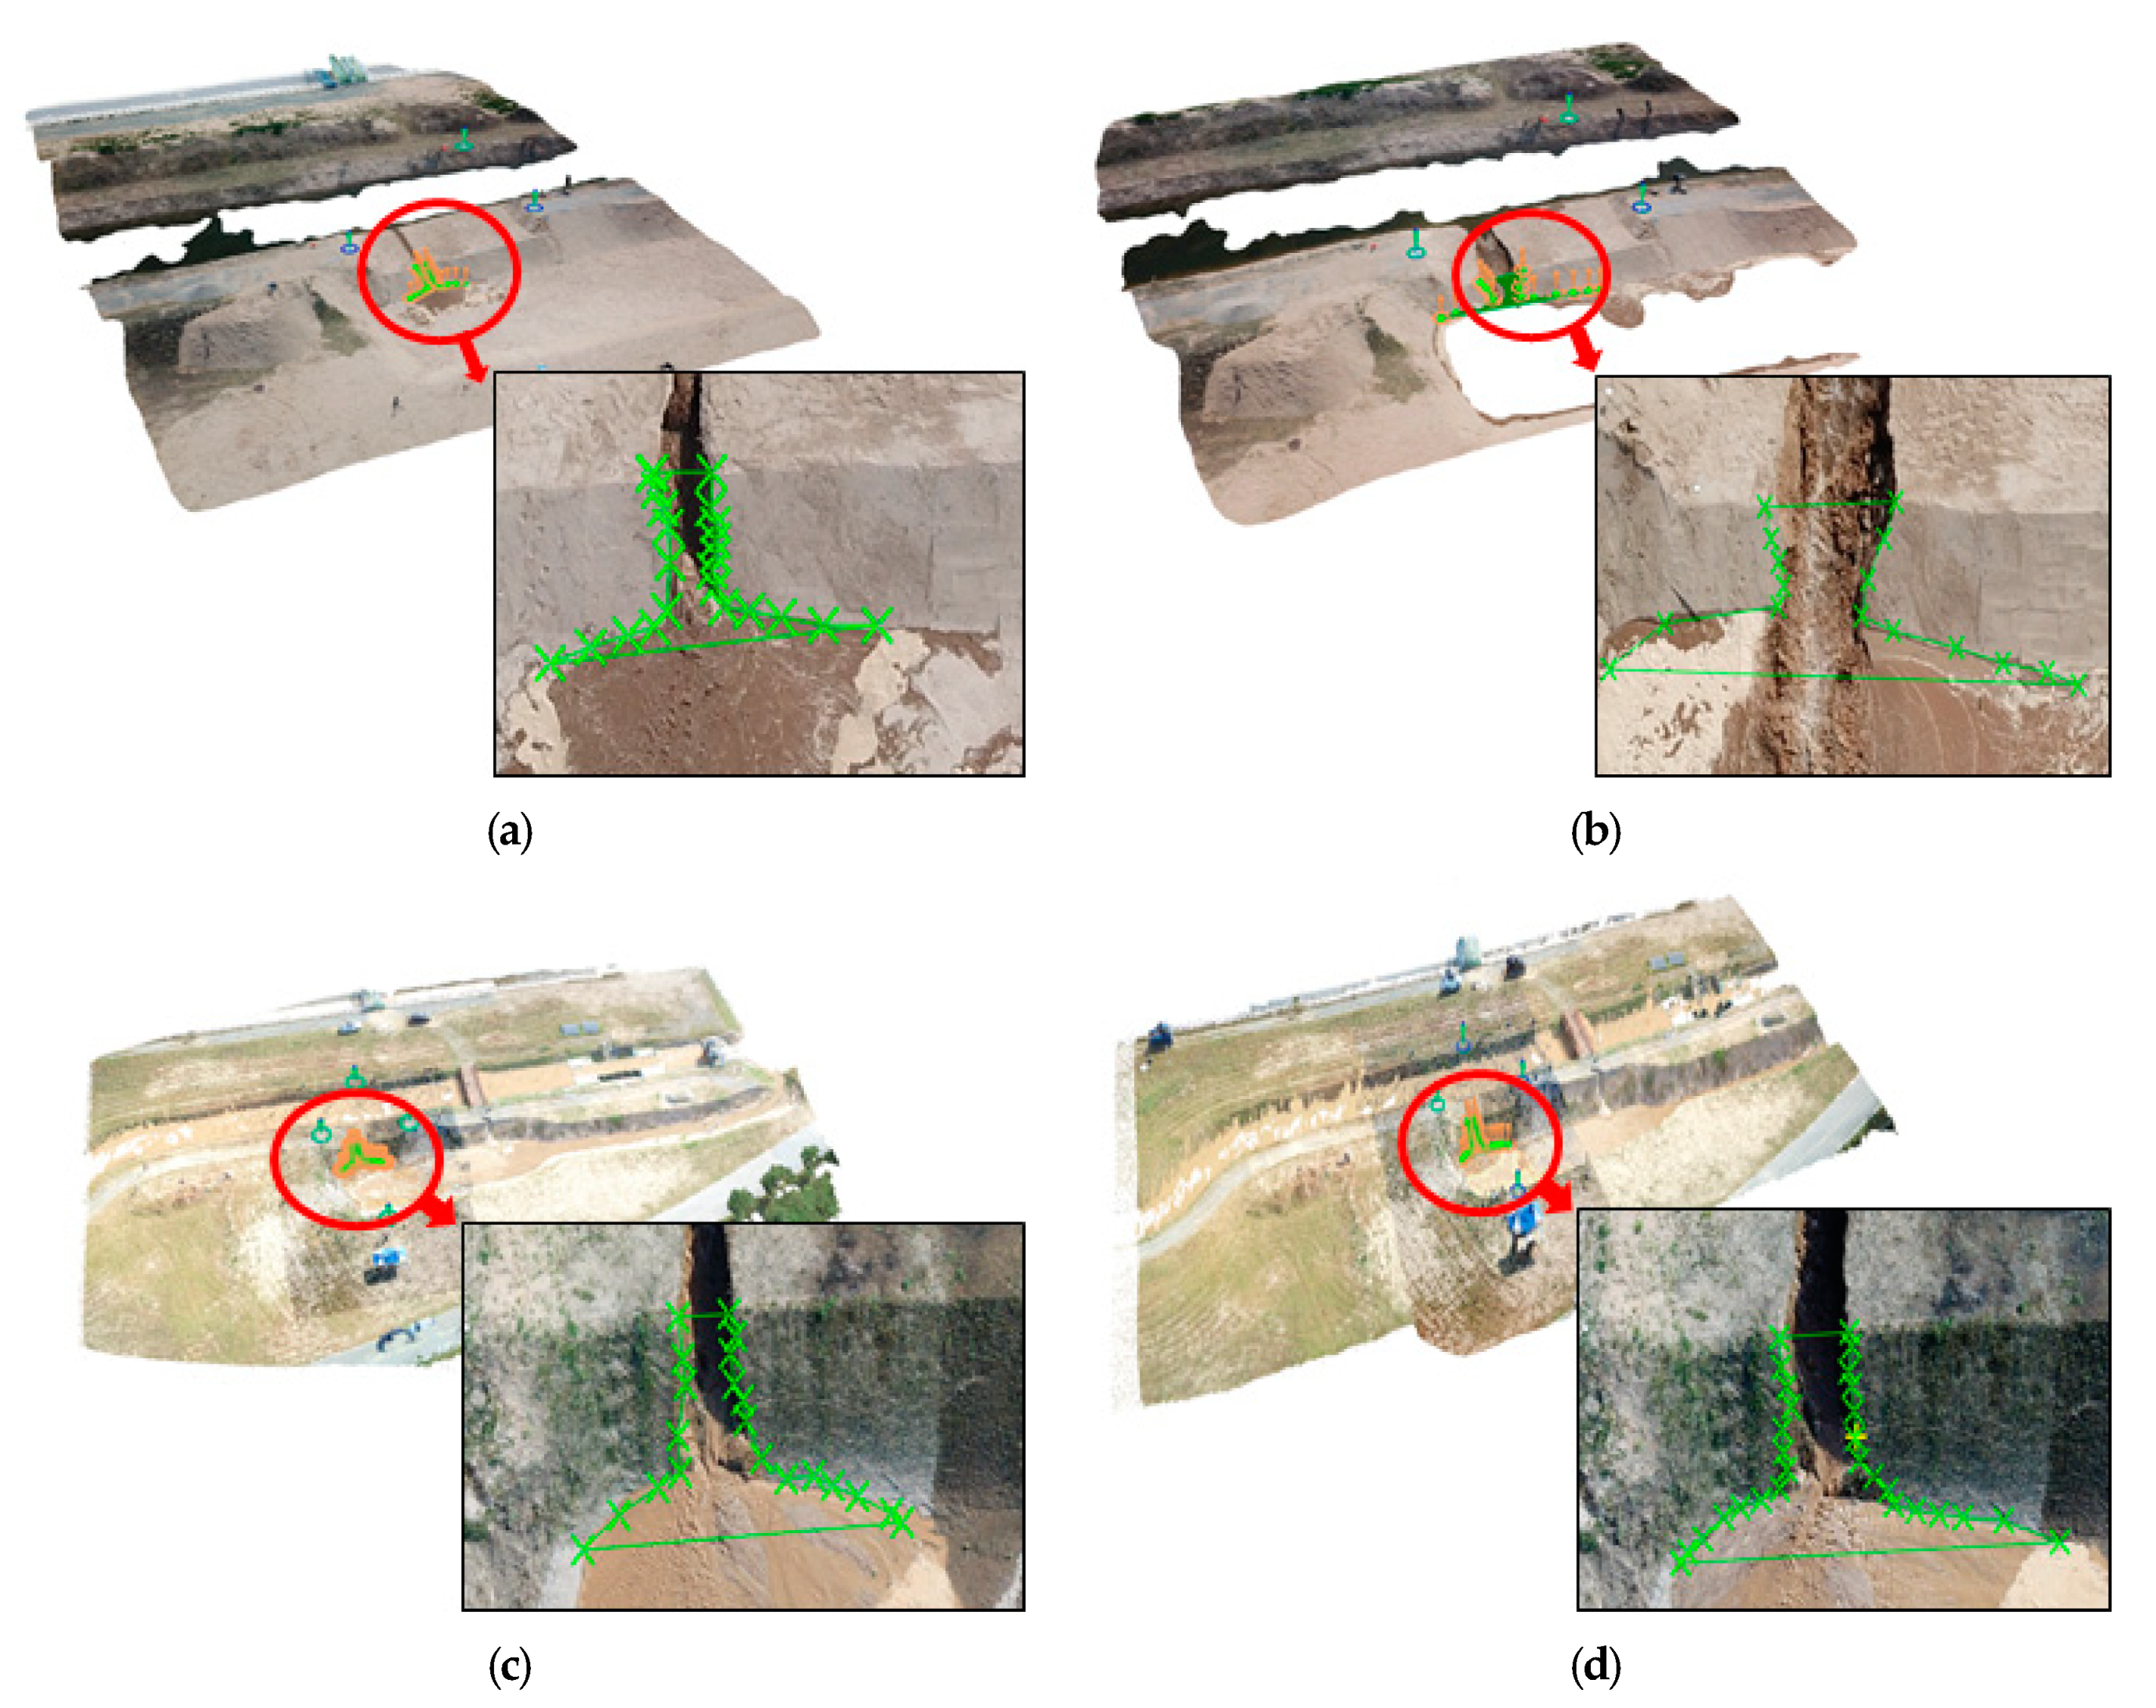
Indices for determining the accuracy of the 3D modeling results include the image quality, data, camera optimization, matching quality, and georeferencing mean RMS error, used to evaluate the positional accuracy criteria through proper GCP operation. Each index exhibited satisfactory results in all cases. In particular, the positional accuracy, which is vital in analyzing the levee slope area, also showed satisfactory results within 3 cm (Table 2). To verify the levee performances, the surface loss rates of the levee slopes were analyzed using drone images, and the modeling results were re-implemented in three dimensions (Figure 12).
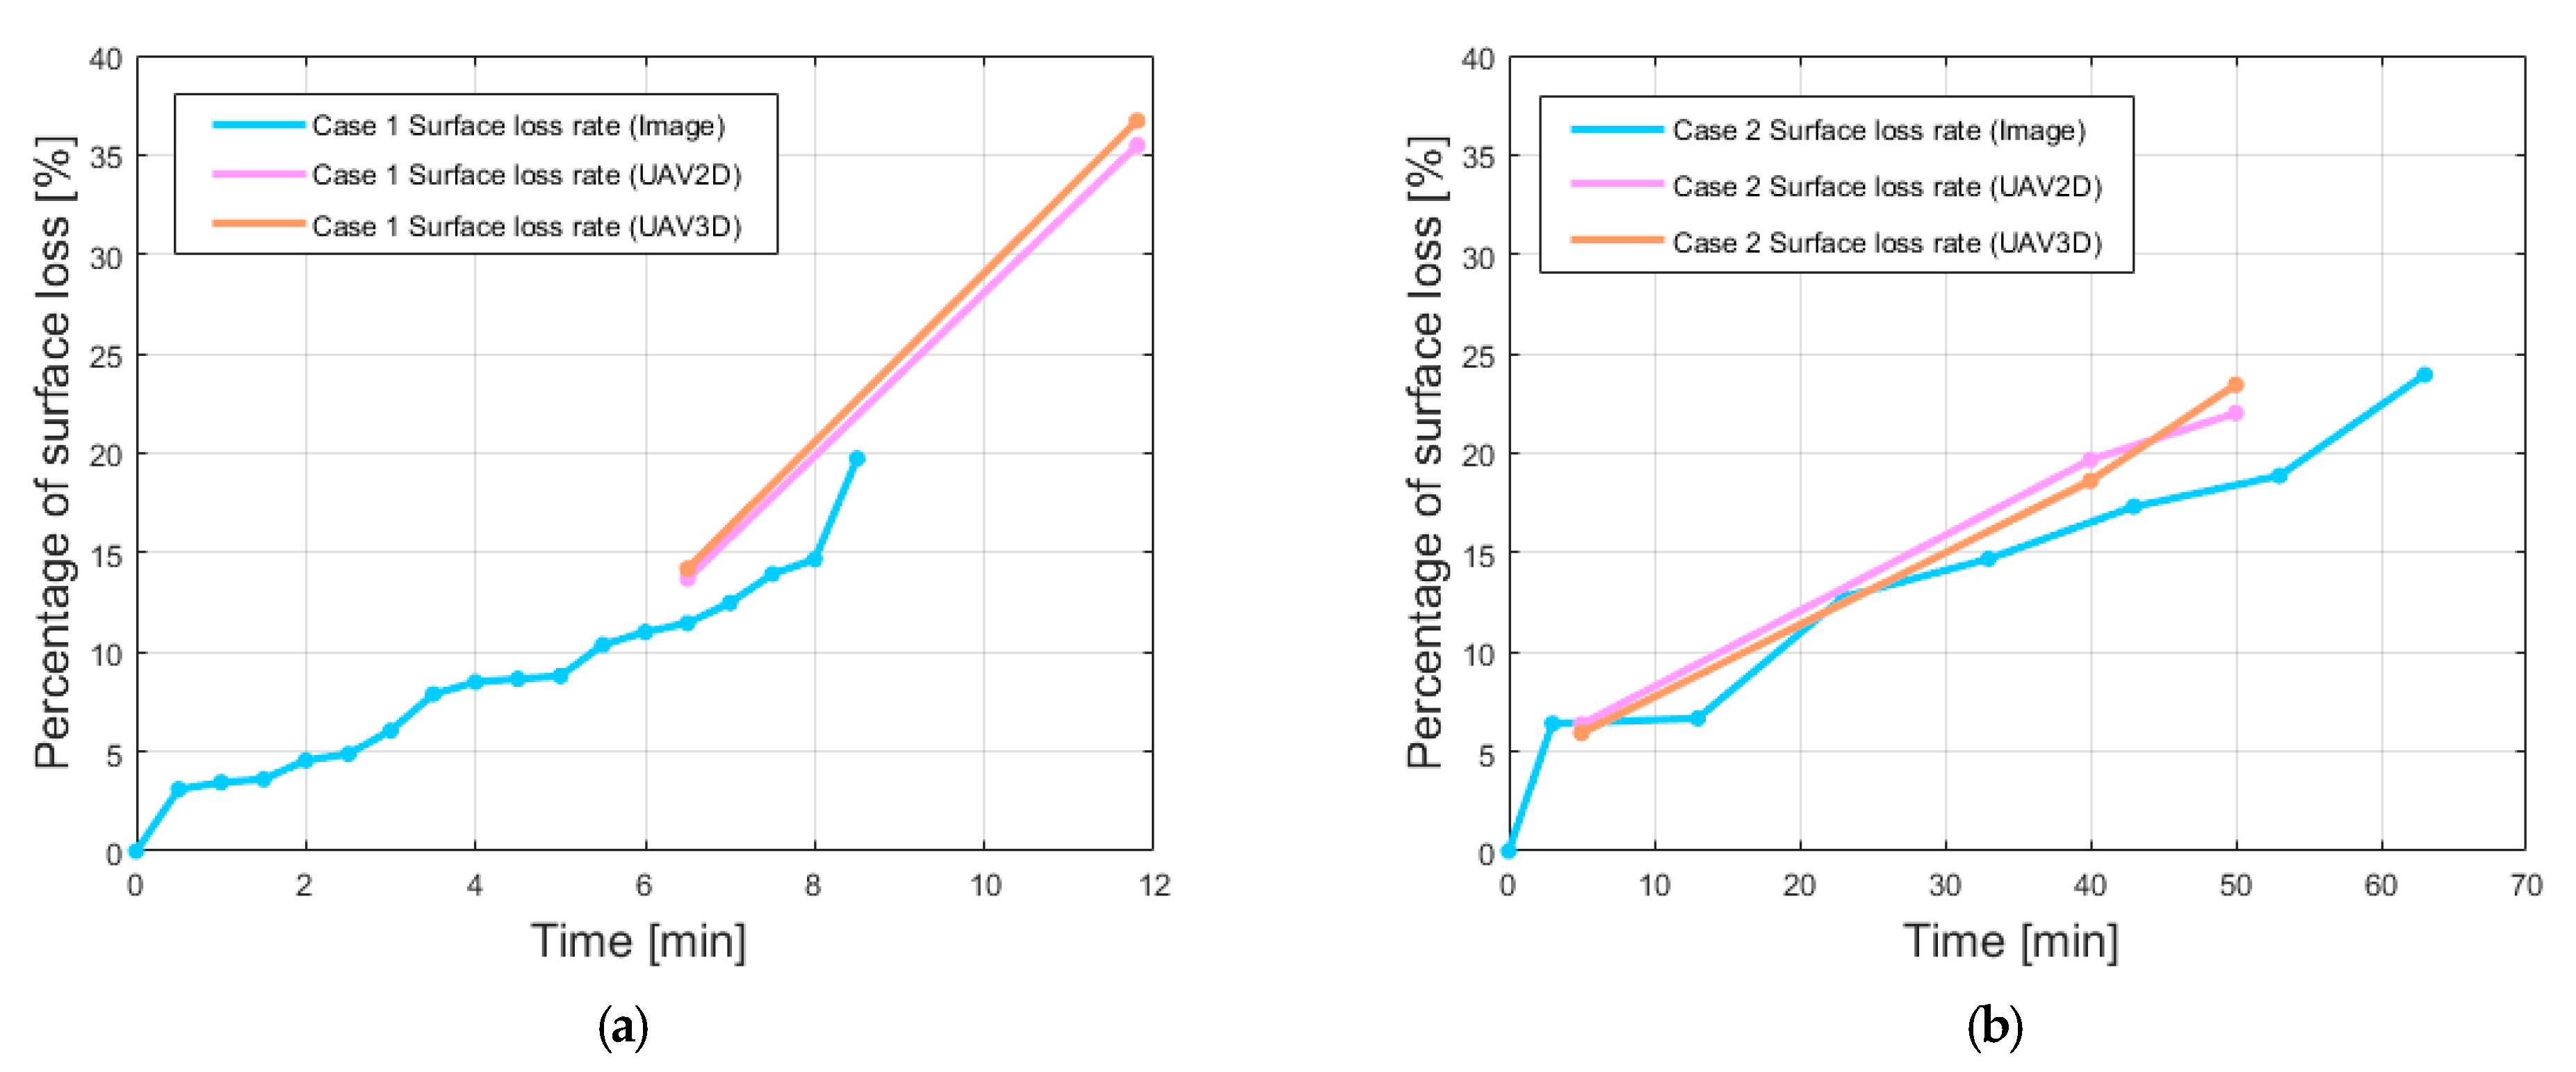
The surface loss rate corresponding to 6.5 min for the sand levee was 11.5% and 13.5% using the image pixel analysis technique and 3D point cloud model, respectively. Considering the levee reinforced with the novel material, the surface loss rates corresponding to 40 min were 17% and 19.6% for cases 1 and 2, respectively. There was no significant difference between the surface loss rate results depending on the analysis method, and the increasing tendencies of the surface loss rates over time were similar (Figure 13). Using the 3D point cloud modeling analysis, the loss rates for the area projected in two dimensions (2D) and the actual area that considered the height of the levee were obtained. The area projected in 2D and the actual 3D area exhibited errors of 4–7%. This indicates no significant difference in the loss area between the 2D and 3D analyses because the area of the target section (59 m2) was not large. Therefore, these analysis results demonstrate the reliability of the image pixel analysis technique for determining the surface loss rate.
4. Discussion
In this study, a novel material that utilized eco-friendly biopolymers was applied over the entire surface of a levee, and the overtopping response and collapse delay effect of the resulting levee were quantitatively investigated. The scaling effects of the hydraulic experiment were minimized by generating lateral overflow in the downstream area of the A3 channel at the Andong REC, and a real-scale experiment on levee collapse by lateral overflow was conducted to reproduce sufficient naturalness in the field through vegetation. Three levees with varying compositions were used: a sand levee (Case 1), vegetation levee reinforced with a novel biopolymer material (Case 2), and vegetation levee with no reinforcement (Case 3). Image analysis techniques (including image pixel analysis and 3D point cloud modeling) were used to compare the surface loss rates of these systems over time, and the erosion resistance capability of the vegetation levee to which biopolymers were applied was verified.
When the collapse delay effect was analyzed for each case using pixel-based image analysis, the time extending from the occurrence of overtopping to the end of the experiment was 9, 63, and 24 min for the sand levee, levee reinforced with the novel material, and vegetation levee, respectively. Therefore, the collapse delay effect of the levee reinforced with the novel material from the occurrence of a collapse to its end was approximately 7- and 2.7-times higher than those of the sand and vegetation levees, respectively. This collapse delay likely occurred because the erosion resistance capability of the reinforced levee was increased with the use of the novel material. The cumulative overflow discharge analysis results calculated using an ADCP demonstrated the erosion resistance of the levee reinforced with the new material before the collapse of the top of the levee, as well as a significant increase in the collapse cross-section. The 3D surface loss area of the actual levee analyzed using images captured by drones, and 3D point cloud modeling, exhibited no significant difference from the 2D image pixel analysis results. In addition, the increasing tendencies of the overall surface loss rates were similar.
In this study, the experiment was terminated if the loss rate of the levee slope on the lowland side was between 24% and 26% of the entire slope on the lowland side. This condition was utilized because measurements were difficult to obtain beyond this point owing to a sharp increase in the overflow discharge. To extend the experimental time and utilize a wider analysis range, the number of experimental channels must be increased.
To generalize the performance of the levee reinforcement method based on the novel biopolymer material presented in this study, it is necessary to further expand the research area and conduct additional experiments considering various conditions, such as the reinforcement position of the novel material and thickness of the applied layer. This levee reinforcement method based on the novel biopolymer material can be used to extend the aging and increase the safety of existing levees to minimize secondary damage, such as human casualties and property damage during a levee failure. Owing to the frequent occurrence of extreme floods, the proposed material can be applied to future levee design and construction, thereby enabling a prompt response to unexpected situations in the event of an emergency.
Author Contributions
Conceptualization, J.K.; Formal analysis, D.K.; Writing—original draft, W.K. and D.K.; Writing—review and editing, W.K. All authors have read and agreed to the published version of the manuscript.
Funding
This research was supported by the National Research Foundation of Korea (NRF) grant funded by the Korea government (No. 2021R1C1C2014394). This research was funded by Korea Agency for Infrastructure Technology Advancement, grant number (No. 21 AWMP-B114119-06).
Institutional Review Board Statement
Not applicable.
Informed Consent Statement
Not applicable.
Data Availability Statement
Not applicable.
Acknowledgments
This work utilized an experimental infrastructures at River Experiment Center of Korea Institute of Civil Engineering and Building Technology.
Conflicts of Interest
The authors declare no conflict of interest.
References
- Meunier, B.; Merwade, V. Prioritizing levee repairs: A case study for the city of Indianapolis, Indiana. Nat. Hazards 2014, 72, 997–1019. [Google Scholar] [CrossRef]
- Collenteur, R.A.; De Moel, H.; Jongman, B.; Di Baldassarre, G. The failed-levee effect: Do societies learn from flood disasters? Nat. Hazards 2015, 76, 373–388. [Google Scholar] [CrossRef]
- Ahn, M.; Ko, D.; Ji, U.; Kang, J. Experimental study on levee monitoring system for abnormality detection using fiber optic temperature sensing. Ecol. Resilient Infrastruct. 2019, 6, 120–127. [Google Scholar]
- Costa, J.E. Floods from Dam Failures; Open-File Rep. No. 85-560; USGS: Denver, CO, USA, 1985; p. 54. [Google Scholar]
- ASCE Task Committee on Dam/Levee Breaching. Earthen embankment breaching. J. Hydraul. Eng. 2011, 137, 1549–1564. [Google Scholar] [CrossRef]
- Tinney, E.R.; Hsu, H.Y. Mechanics of washout of an erodible fuse plug. Trans. Am. Soc. Civil. Eng. 1962, 127, 31–59. [Google Scholar] [CrossRef]
- Fujita, Y.; Tamura, T. Enlargement of breaches in flood levees on alluvial plains. Nat. Dis. Sci. 1987, 9, 37–60. [Google Scholar]
- Mohamed, M.A.A.; Morris, M.; Hanson, G.J.; Lakhal, K. Breach Formation: Laboratory and Numerical Modeling of Breach Formation. In Proceedings of the Dam Safety 2004, ASDSO Phoenix, Phoenix, AZ, USA, 26–30 September 2004. [Google Scholar]
- Hanson, G.J.; Cook, K.R.; Hunt, S.L. Physical modeling of overtopping erosion and breach formation of cohesive embankments. Trans. ASABE 2005, 48, 1783–1794. [Google Scholar] [CrossRef]
- van Damme, M. A process-based method for predicting lateral erosion rates. Nat. Hazards 2021, 107, 375–394. [Google Scholar] [CrossRef]
- Liu, W.C.; Wu, C.Y. Flash flood routing modeling for levee-breaks and overbank flows due to typhoon events in a complicated river system. Nat. Hazards 2011, 58, 1057–1076. [Google Scholar] [CrossRef]
- Huang, W.C.; Weng, M.C.; Chen, R.K. Levee failure mechanisms during the extreme rainfall event: A case study in Southern Taiwan. Nat. Hazards 2014, 70, 1287–1307. [Google Scholar] [CrossRef] [Green Version]
- Wahl, T.L.; Hanson, G.J.; Courivaud, J.R.; Morris, M.W.; Kahawita, R.; McClenathan, J.T.; Gee, D.M. Development of next-generation embankment dam breach models. In Proceedings of the 2008 U.S. Society on Dams Annual Meeting and Conference, Portland, OR, USA, April 28–May 2 2008; pp. 767–779. [Google Scholar]
- Zhang, J.; Li, Y.; Xuan, G.; Wang, X.; Li, J. Overtopping breaching of cohesive homogeneous earth dam with different cohesive strength. Sci. China Ser. E Technol. Sci. 2009, 52, 3024–3029. [Google Scholar] [CrossRef]
- Ko, D.; Kang, J. Biopolymer-reinforced levee for breach development retardation and enhanced erosion control. Water 2020, 12, 1070. [Google Scholar] [CrossRef] [Green Version]
- Kakinuma, T.; Shimizu, Y. Large-scale experiment and numerical modeling of a riverine levee breach. J. Hydraul. Eng. 2014, 140, 04014039. [Google Scholar] [CrossRef]
- Chinnarasri, C.; Jirakitlerd, S.; Wongwises, S. Embankment dam breach and its outflow characteristics. J. Civ. Eng. Environ. Syst. 2004, 21, 247–264. [Google Scholar] [CrossRef]
- Zhu, Y.; Visser, P.; Vrijling, J. Laboratory observations of embankment breaching. In Proceedings of the International Conference on Hydroscience and Engineering 2006, Philadelphia, PA, USA, 10–13 September 2006. [Google Scholar]
- Carrivick, J.L.; Smith, M.W. Fluvial and aquatic applications of structure from motion photogrammetry and unmanned aerial vehicle/drone technology. Wiley Interdiscip. Rev. Water 2019, 6, e1328. [Google Scholar] [CrossRef] [Green Version]
- Ko, D.; Kang, J.; Kang, W. Application of 3D point cloud modeling for performance analysis of reinforced levee with biopolymer. J. Korea Water Resour. Assoc. 2021, 54, 181–190. [Google Scholar]
- Kwon, Y.M.; Ham, S.M.; Kwon, T.H.; Cho, G.C.; Chang, I. Surface-erosion behaviour of biopolymer-treated soils assessed by EFA. Géotech. Lett. 2020, 10, 106–112. [Google Scholar] [CrossRef] [Green Version]
- Chang, I.; Im, J.; Cho, G.C. Introduction of microbial biopolymers in soil treatment for future environmentally-friendly and sustainable geotechnical engineering. Sustainability 2016, 8, 251. [Google Scholar] [CrossRef] [Green Version]
Figure 1.
Specifications of the hydraulic experiment model and experimental conditions.

Figure 2.
Particle size distribution curves for each experimental condition.

Figure 3.
Application of the new material onto the surface of the levee using the wet spray method.

Figure 4.
(a) Viscosity measurements of the blended biopolymer at different concentrations in relation to the mass of water. (b) Hydraulic conductivity of the blended biopolymer-treated standard sand (Jumunjin sand) at different concentrations in relation to the mass of the soil.
Figure 4.
(a) Viscosity measurements of the blended biopolymer at different concentrations in relation to the mass of water. (b) Hydraulic conductivity of the blended biopolymer-treated standard sand (Jumunjin sand) at different concentrations in relation to the mass of the soil.

Figure 5.
(a) Real-time image and (b) Acoustic Doppler Current Profiler (ADCP) measurement systems.

Figure 6.
Testing site at the Andong River Experiment Center (REC).

Figure 7.
Changes in real-time levee collapse width under different experimental conditions; (a) sand levee, (b) reinforced novel materials levee, and (c) vegetation levee (the width is 5.6 m, and the length is 12 m).
Figure 7.
Changes in real-time levee collapse width under different experimental conditions; (a) sand levee, (b) reinforced novel materials levee, and (c) vegetation levee (the width is 5.6 m, and the length is 12 m).

Figure 8.
Levee collapse pattern over time immediately after overtopping (Case 1).

Figure 9.
Levee collapse pattern over time immediately after overtopping (Case 2).

Figure 10.
Levee collapse pattern over time immediately after overtopping (Case 3).

Figure 11.
Comparison of the cumulative overflow discharge and surface loss rate over time.

Figure 12.
Surface loss rates obtained using 3D point cloud modeling; (a) sand levee at 6.5 min, (b) sand levee at 11.8 min, (c) reinforced novel materials levee at 40 min, and (d) reinforced novel materials levee at 50 min.
Figure 12.
Surface loss rates obtained using 3D point cloud modeling; (a) sand levee at 6.5 min, (b) sand levee at 11.8 min, (c) reinforced novel materials levee at 40 min, and (d) reinforced novel materials levee at 50 min.

Figure 13.
Surface loss rate using 3D point cloud modeling (a) sand levee, and (b) reinforced novel materials levee at 40 min.
Figure 13.
Surface loss rate using 3D point cloud modeling (a) sand levee, and (b) reinforced novel materials levee at 40 min.


Table 1.
Atterberg limits and classification of the Andong river sand mixed with red clay.
| Red Clay to Sand | Liquid Limit LL [%] | Plastic Limit PL [%] | Plasticity Index PI [%] | Uniformity Coefficient Cu | Curvature Coefficient Cg | Classification |
|---|---|---|---|---|---|---|
| 100:0 | 33 | 18 | 14 | N/A | N/A | SC |
| 50:50 | 27 | 15 | 11 | N/A | N/A | SC |
| 30:70 | 21 | 13 | 8 | N/A | N/A | SC |
| 0:100 | N/A | N/A | N/A | 2.7 | 0.89 | SP |
Table 2.
Number of images used in 3D modeling and positional accuracy evaluation results.
| Case | Case 1 | Case 2 | |||
|---|---|---|---|---|---|
| Time (min) | 6.5 | 11.8 | 5 | 40 | 50 |
| Number of images | 24 | 19 | 40 | 41 | 45 |
| Georeferencing mean RMS error [m] | 0.029 | 0.016 | 0.024 | 0.027 | 0.025 |
Publisher’s Note: MDPI stays neutral with regard to jurisdictional claims in published maps and institutional affiliations. |
© 2021 by the authors. Licensee MDPI, Basel, Switzerland. This article is an open access article distributed under the terms and conditions of the Creative Commons Attribution (CC BY) license (https://creativecommons.org/licenses/by/4.0/).
Share and Cite
MDPI and ACS Style
Kang, W.; Ko, D.; Kang, J. Erosion Resistance Performance of Surface-Reinforced Levees Using Novel Biopolymers Investigated via Real-Scale Overtopping Experiments. Water 2021, 13, 2482. https://doi.org/10.3390/w13182482
AMA Style
Kang W, Ko D, Kang J. Erosion Resistance Performance of Surface-Reinforced Levees Using Novel Biopolymers Investigated via Real-Scale Overtopping Experiments. Water. 2021; 13(18):2482. https://doi.org/10.3390/w13182482
Chicago/Turabian StyleKang, Woochul, Dongwoo Ko, and Joongu Kang. 2021. "Erosion Resistance Performance of Surface-Reinforced Levees Using Novel Biopolymers Investigated via Real-Scale Overtopping Experiments" Water 13, no. 18: 2482. https://doi.org/10.3390/w13182482
Note that from the first issue of 2016, this journal uses article numbers instead of page numbers. See further details here.