
Clarification of Biologically Treated Wastewater in a Clarifier with Suspended Sludge Layer


1
School of Architecture, Construction and Design, D. Serikbayev East Kazakhstan State Technical University, A.K. Protozanov, Ust-Kamenogorsk 070004, Kazakhstan
2
Institute of Geology, Petroleum and Mining Engineering, Stabayev University, Satbayev Str. 22, Almaty 0500013, Kazakhstan
3
Institute of Metallurgy and Ore Beneficiation, Shevchenko Str. 29/133, Almaty 050010, Kazakhstan
4
Faculty of Civil Engineering and Environmental Sciences, Bialystok University of Technology, 15-351 Białystok, Poland
*
Author to whom correspondence should be addressed.
Water 2021, 13(18), 2486; https://doi.org/10.3390/w13182486
Submission received: 22 July 2021
/
Revised: 5 September 2021
/
Accepted: 6 September 2021
/
Published: 10 September 2021
(This article belongs to the Special Issue Innovations in Water Research 2021)
Abstract
:The article presents the results of an experimental study on the clarification of biologically treated wastewater in a clarifier with a suspended sludge layer. The pilot plant was receiving effluent from trickling filters treating municipal wastewater. An experimental clarifier worked under steady-state conditions considering the influent characteristics and variable operating parameters in terms of flow velocities and height of the suspended layer. From the experimental dependences between different technological parameters it was found that the optimum range of the upward flow velocities providing a dynamic equilibrium of the suspended layer was 0.6–1.4 mm/s. Upward flow velocities below 0.5 mm/s can lead to sludge compaction at the bottom of the unit, while values greater than 1.8 mm/s may cause sludge washout. It was also found that higher suspended layer height values favor higher efficiency of the clarifier and can achieve suspended solids in the discharge of less than 5.0 mg/L; this height should be greater than 0.6 m Technological efficiency of the experimental clarifier was significantly higher than the conventional unit and was comparable with tertiary treatment technologies.
1. Introduction
Biological wastewater treatment is the main and most economical method of removing contaminants from wastewater, as it provides a deep decomposition of biodegradable substances based on the use of natural processes and catalysts. The process is generally of two types: suspended and fixed film growth systems [1]. While suspended growth systems (SGS), namely activated sludge reactors, predominate in large municipal treatment plants, fixed film systems (FFS) offer more technological variants (trickling filters, rotating biological contactors, packed bed reactors) that can be adjusted to more specific requirements and may offer multitude advantages (high biomass loading per unit reactor volume, higher mean cell retention time, operational ease of solids–liquid separation and resistance to shock loadings, etc.) [2,3]. Compared to aeration tanks with activated sludge, fixed film reactors are cost-effective for treating relatively small volumes of wastewater [4].
In recent years, various modifications of FFSs have been studied, mainly as a part of the third stage of wastewater treatment (promoting water reuse), especially in the aspect of the high-efficiency removal of biogenic compounds [5,6,7]. These systems have been thoroughly tested not only in terms of their technological efficiency but also the kinetics of the physicochemical and biochemical processes taking place in the biological reactors with attached biofilm and accompanying objects [8,9]. Since in FFS reactors not only the processes of biochemical decomposition of dissolved pollutants take place but also the separation of the suspended solids (often conglomerated in the coagulation process), such devices are often referred to as biofilters [4,10].
Secondary settling tanks (clarifiers) are an important element of biological wastewater treatment, the operation of which often determines the effectiveness of the entire process. In this case, the most common are radial clarifiers, less often they are horizontal or vertical. Especially in the case of final clarifiers receiving discharge from biofilters, the settling process should be carefully designed due to the much lower concentration of suspended matter in the outflow from the biofilters (only excess biofilm is present, no sludge for recirculation) [1]. However, the process of sludge separation from treated wastewater is also well recognized, and the mathematical models describing the operation of secondary clarifiers are well developed and widely used both in design practice and in operation. These are numerical models based most often on the mass transport analysis in subsequent layers of the clarifier (including the Takacs model with modifications) [11], multidimensional modeling using CFD (computational fluid dynamics) [12,13] or the CMM concept (consistent modeling methodology) [14].
One of the methods for increasing the efficiency of the secondary settling of activated sludge flocs or excessive biofilm slime from treated wastewater may be the use of a new type of biofilter in the form of a clarifier with a suspended sludge layer (CSSL) [15]. This technological solution differs from the aforementioned biofilters (used for example as the third stage of treatment) mainly in that the sludge layer is not attached to any carrier but is freely suspended in the active volume of the clarifier. The potential benefits of CSSL are due to the use of the entire biomass content in the treatment process and the increase in microorganism activity associated with their increased concentration in the tank. The agglomeration of sludge flocs or biofilm fragments in the clarifier also enhances the solids separation effect from the treated wastewater. Therefore, clarifiers with a suspended layer appear to be a very promising technology combining the advantages of biofilters and secondary settling tanks. This new technological method can improve the technical and economic characteristics of the process by significantly intensifying the treatment of wastewater from suspended solids and BOD; thereby, increasing the treatment efficiency and equipment performance, while ensuring high economic efficiency of the treatment system as a whole. Such an innovative technology can both replace secondary settling tanks and eliminate the need to apply the tertiary treatment (renewal of water).
The microbial community structure plays an important role in the functioning of biofilters [16,17,18]. The analysis of the physicochemical and microbiological properties of the activated sludge and biofilm shows their unquestionable similarity [19], hence it can be concluded about the potential applications of CSSL in both SGS and FFS treatment plants. The studies conducted so far [15,20] have shown the effectiveness of this method as secondary clarifiers. Moreover, in [21] the possibility of intensifying the biological processes of removing all nitrogen forms in the CSSL was described. However, a better understanding of the processes taking place in clarifiers with a suspended layer of biomass is necessary. Due to the complexity of the processes taking place in CSSL (separation, sedimentation, physicochemical and biochemical processes) and the lack of a sufficient experimental database, it is not possible to use the available mathematical models to optimize the technical and technological solutions, or to implement this technology on a larger scale. Therefore, it is necessary to conduct further research on the technological aspects of using CSSL in wastewater treatment processes. Filling this gap was the main motivation to undertake the research presented in the paper.
Earlier work focused mainly on the effectiveness of the removal of selected types of pollutants in CSSL, therefore, the aim of this research was to carry out an experimental study to determine the main technological parameters and relationships affecting the effectiveness of wastewater treatment in a CSSL. Among the specific research goals were: (1) observation and analysis of the suspended sludge layer formation, (2) determination of the effect of the vertical flow velocity and height of the suspended layer on the sludge concentration and (3) determination of the sludge volume index in the suspended layer and the concentration of suspended solids in the discharge from the CSSL.
2. Materials and Methods
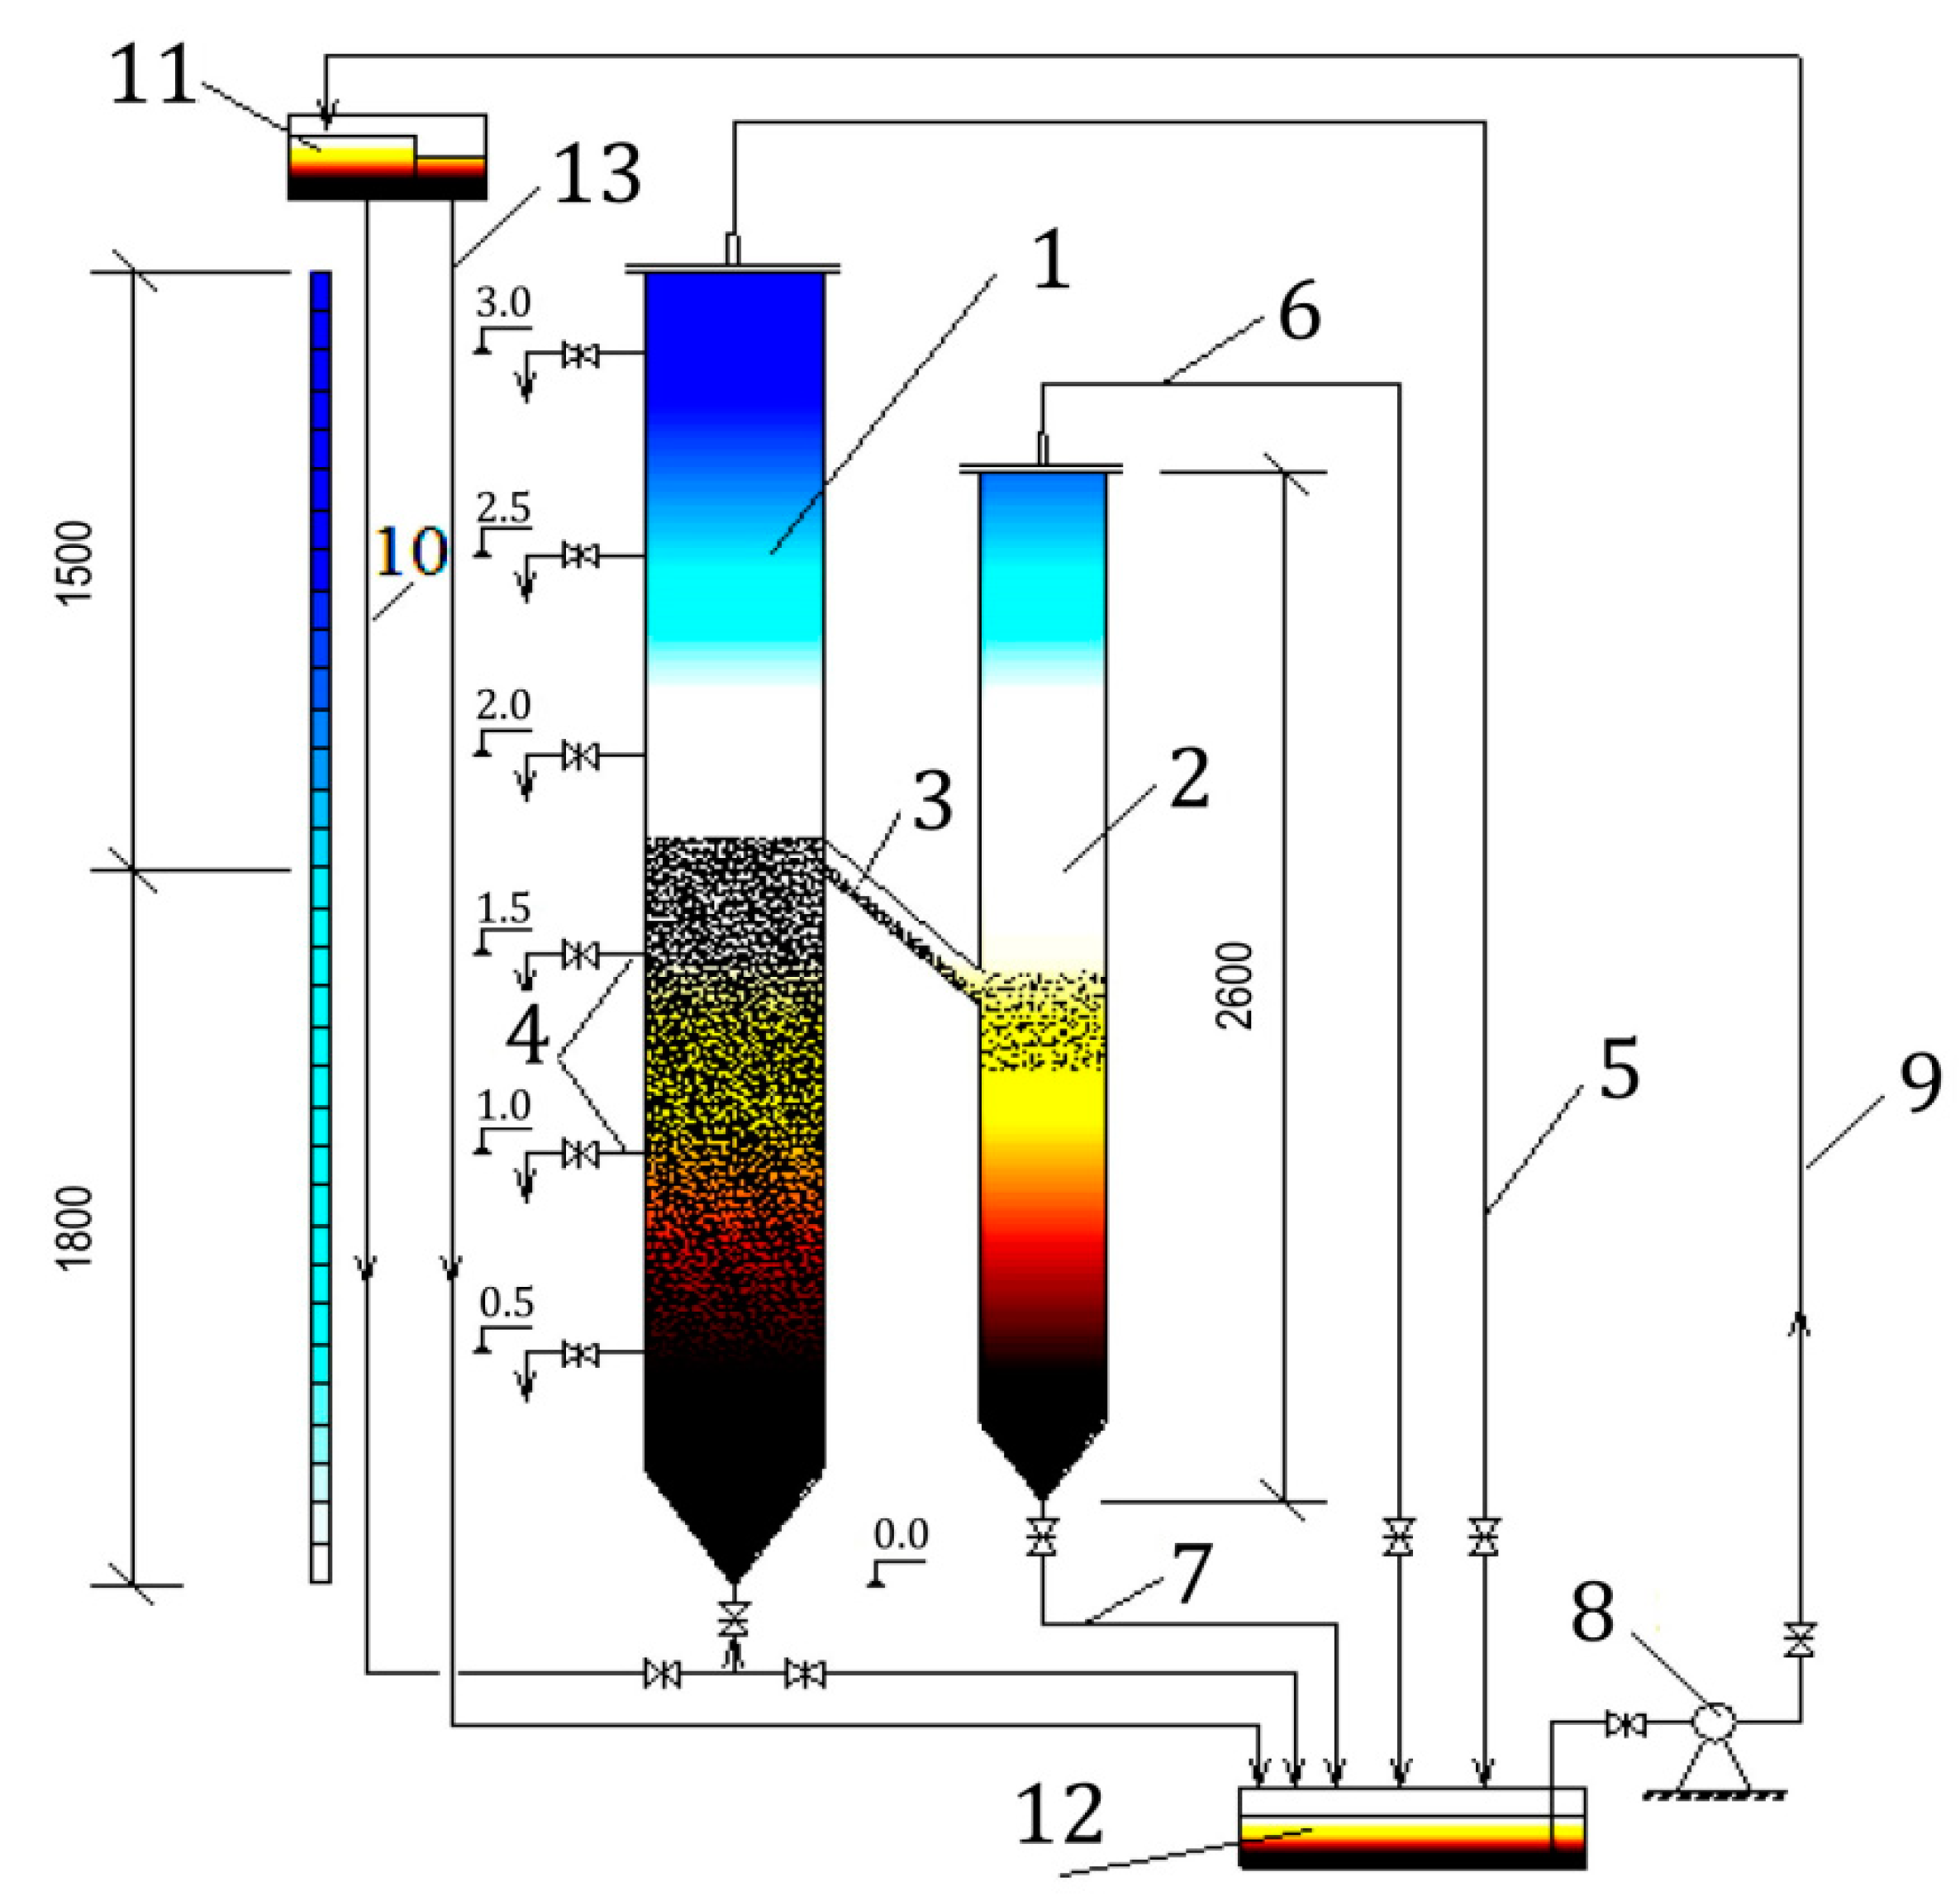
Research was carried out on a specially constructed experimental setup, the diagram of which is shown in Figure 1. The installation was mounted in a chlorination room located on the wastewater treatment plant with trickling filters (TFs) serving the Ust-Kamenogorsk Titanium–Magnesium Plant (Ust-Kamenogorsk, Kazakhstan).
The installation consisted of two cylindrical columns: clarifier with suspended layer (1) and sludge thickener (2). Clarifier with a diameter of 200 mm and total height of 3.3 m and a sludge thickener with a diameter of 150 mm and total height of 2.6 m were made of organic glass and interconnected by a sludge discharge pipe (3) with a diameter of 50 mm, located 1.8 m above the bottom of the clarifier. On the wall of the CSSL, at intervals of 0.5 m, four sampling nozzles were installed. The clarified water was discharged from the top of the clarifier through pipeline (5) with a valve to control the flow of water passing through the clarifier and the velocity of the upward flow. The sludge thickener was equipped with supernatant discharge (6) located at the top and thickened sludge discharge (7) located at bottom of the unit. The CSSL unit was supplied with biologically treated effluent from TFs, which was pumped from effluent channel (12) to an elevated reservoir serving as flow equalizer (11), installed at a height of 4.4 m. The excess water was discharged from the flow equalizer through an overflow pipe (13) to discharge channel (12).
Wastewater was supplied at the lower part of the clarifier under a suspended sludge (biofilm) layer; passing through the clarifier the water was filtered, purified and clarified. The height of suspended layer was limited by the position of wastewater overflow located 1.8 m above the bottom. Above the suspended layer, the protective layer was formed with assumed height of 1.5 m and clarified water layer at the top of the unit.
The height of the suspended layer was constantly increasing (due to biofilm residuals present in the effluent from TFs supplying experimental installation), the excess biofilm was removed from suspended layer through the sludge overflow pipe to sludge thickener. In case of rapid increase in suspended layer height, the removal of excess sludge from the clarifier was supported by forced suction, which was carried out by discharging water from the thickener. The thickened sludge was periodically discharged from (2) into the main channel, downstream from the point of wastewater intake to the CSSL.
To analyze the operation of the experimental setup, the following parameters were determined during the study:
- influent wastewater flow rate and quality, including: temperature, concentration of dissolved oxygen (DO-in), total suspended solids (TSS-in), ammonia nitrogen (NH3-in), nitrites (NO2-in), nitrates (NO3-in), biochemical oxygen demand (BOD5-in), chemical oxygen demand (COD-in);
- parameters of clarified water discharged from CSSL model (DO-out, TSS-out, NH3-out, NO2-out, NO3-out, BOD5-out, COD-out);
- parameters of the suspended layer: ash content, sludge volume index (SVI), concentration of biofilm sludge (CSL);
- microscopy of a biofilm in the suspended layer.
Studies on the separation of biofilms in a suspended sludge layer were carried out under steady-state clarifier operation. All measurements and sampling were carried out not earlier than 2–3 h after changing the hydraulic mode of the CSSL operation (i.e., changing the flow rate and, accordingly, the velocity of the upward flow).
The velocity of the upward water flow in the model during the experiments was determined indirectly from the continuity equation (vUP = Q/F), using the cross-sectional area of the clarifier (F) and the flow rate of water passing through the clarifier (Q), which was measured by the volumetric method.
The main parameter describing the efficiency of the clarifier was the concentration of total suspended solids in clarified water (TSS-out). Determination of TSS in the clarified water samples was carried out according to the standard method by the weighing method using membrane filters with pore size 0.45 µm. Additionally, the concentration of the biofilm sludge in the suspended layer (CSL), as well as the concentration of suspended solids in the wastewater entering the clarifier (TSS-in), were determined as TSS by weighing method using paper filters with pore size 2–3 µm [22]. To determine CSL, samples were taken through the sampling nozzles uniformly located along the height of the suspended layer (0.5 m, 1.0 m, 1.5 m, 1.8 m) to reflect different upstream speeds.
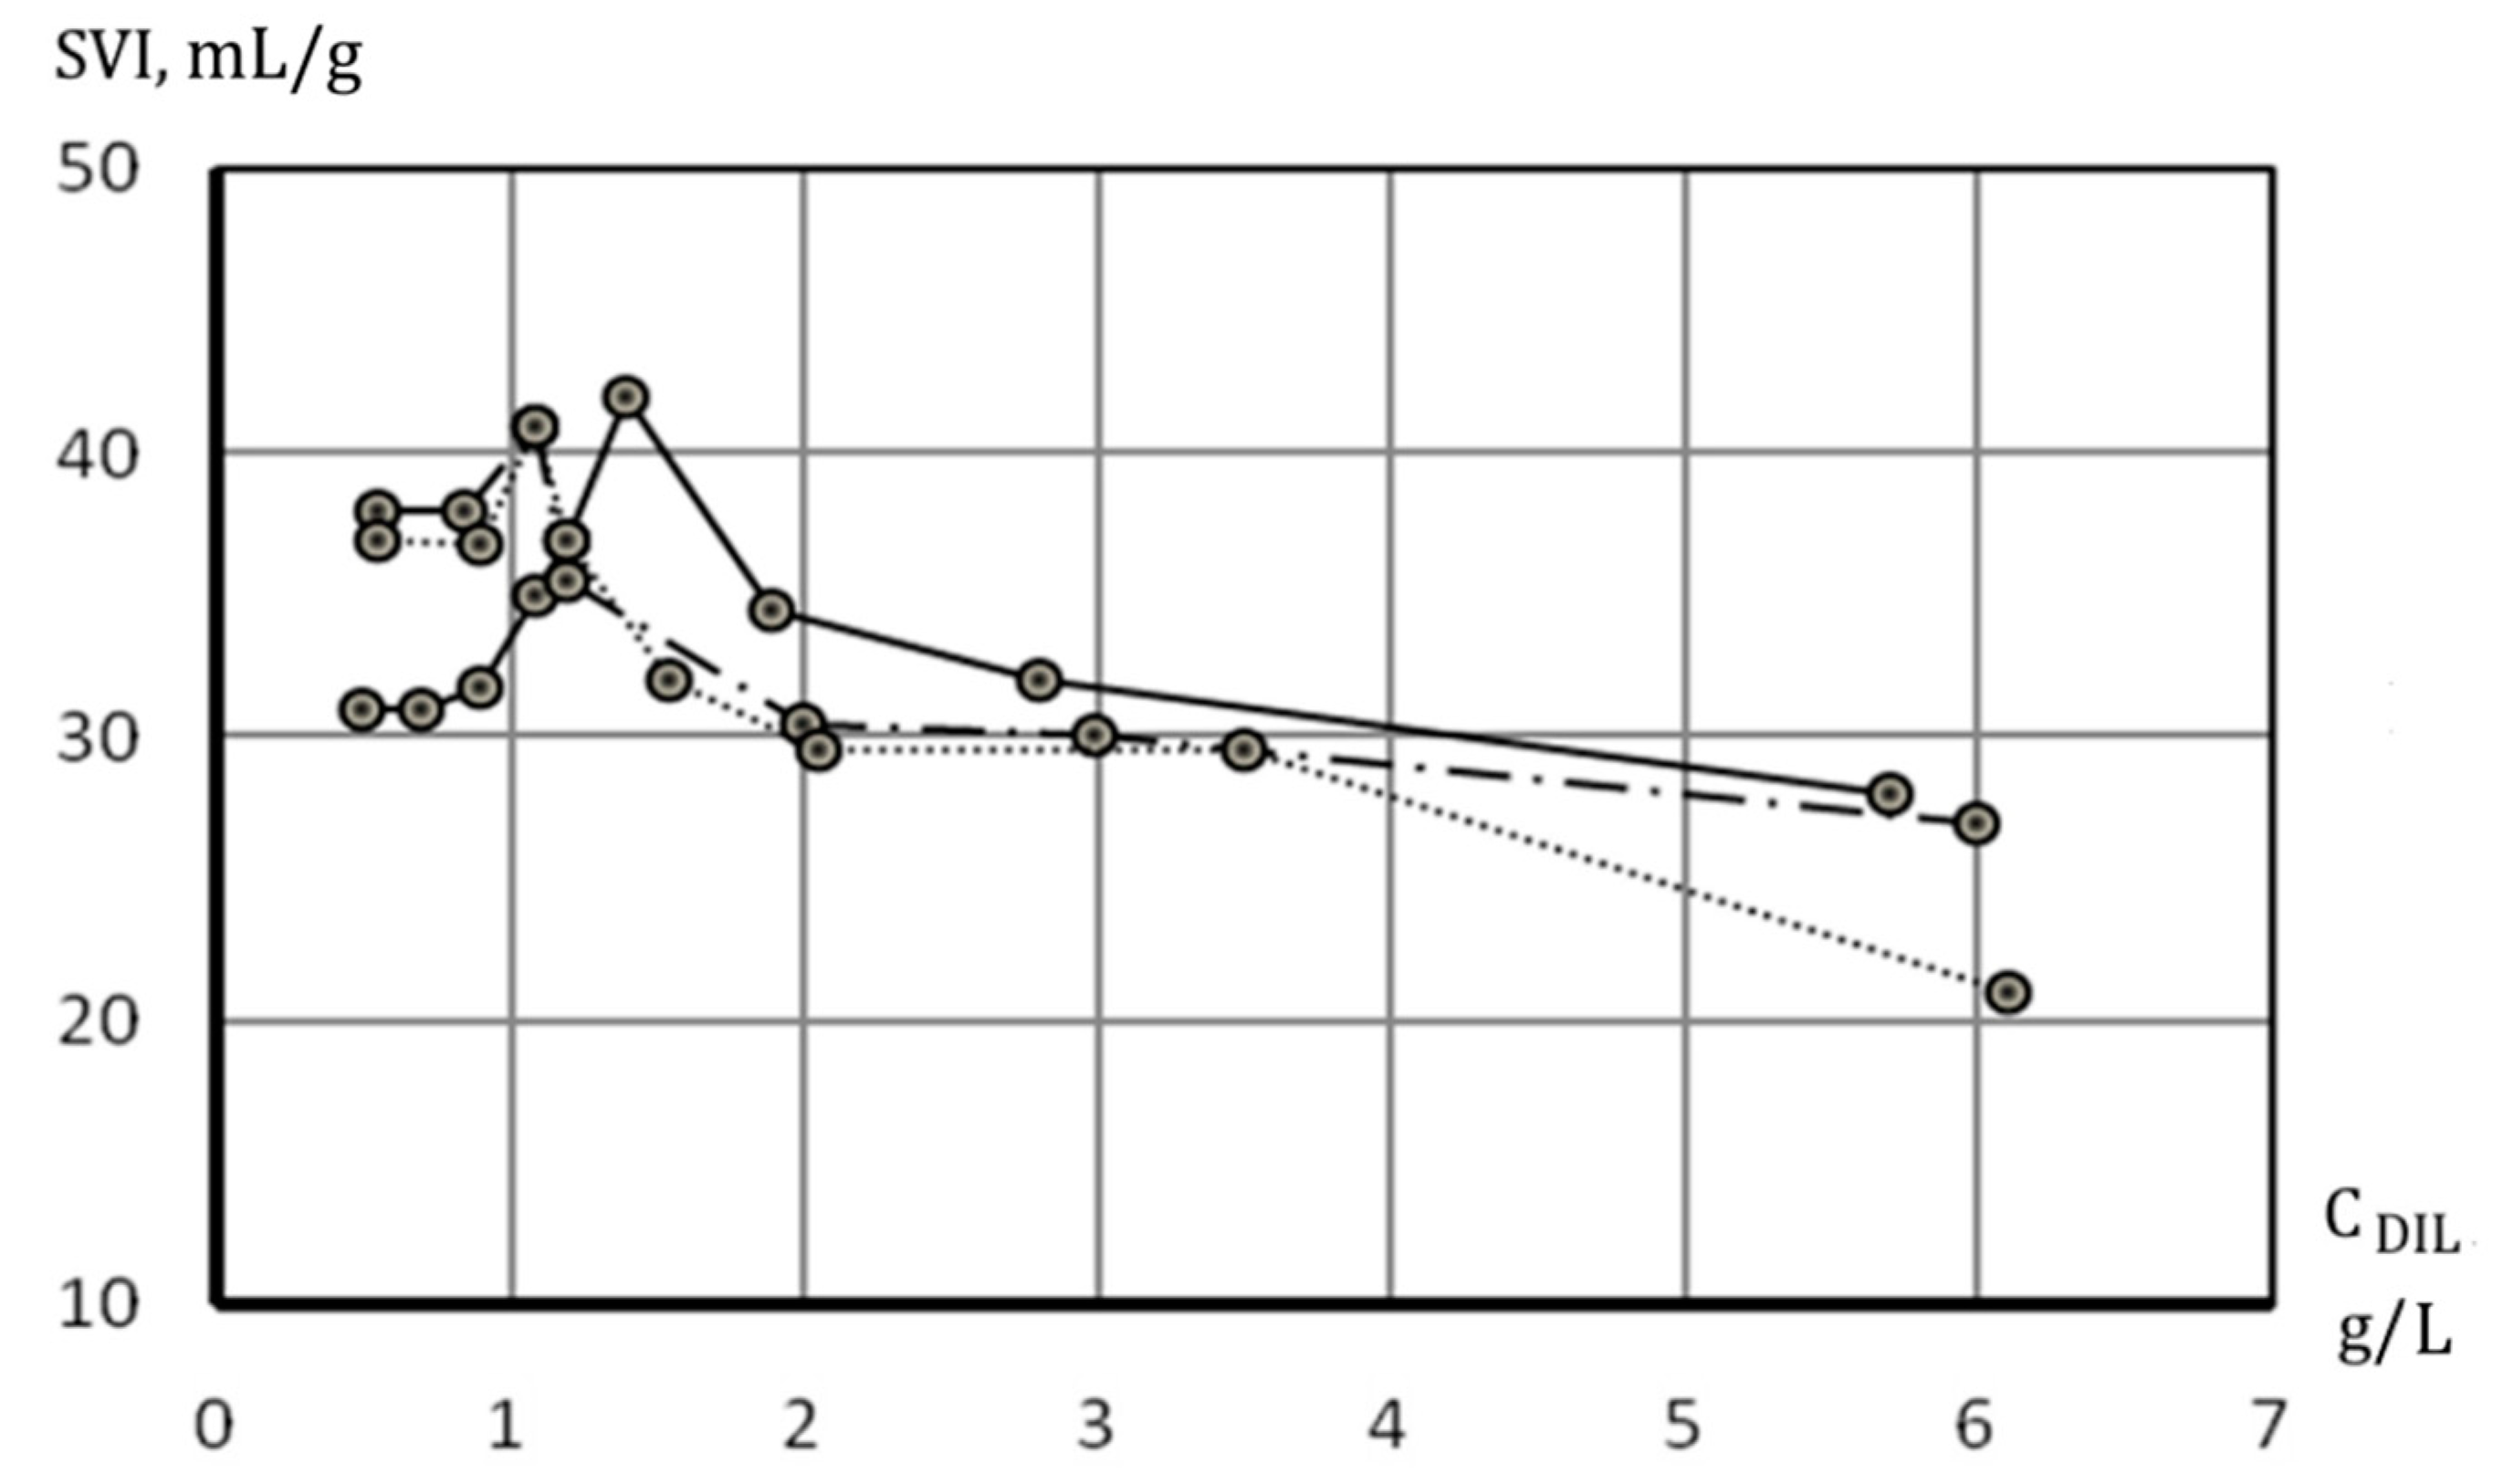
The sedimentation properties of the biofilm sludge forming the suspended layer were evaluated by the sludge volume index (SVI), which was determined as follows: the same volume of sludge taken from the suspended layer was diluted with pure water 2, 3, 4, 5, 6, 7, and 8 times and the concentration of total suspended solids in each diluted sample was determined (CDIL, g/L). Diluted samples were left for sedimentation in standard vessels with a capacity of 1000 mL for 30 min. After this time, the volume of settled sludge was recorded (V30, mL/L). The sludge index for each sample was determined as the ratio: SVI = V30/CDIL (in mL/g). Obtained results were used to create graph of SVI = f(CDIL) relationship that was used for monitoring of SVI in the model during experiments (Figure 2).
In laboratory studies, the content of dissolved oxygen was determined by the Winkler method; BOD5, COD, NH3, NO2, NO3, and ash, were also determined according to generally accepted standard methods [23,24,25,26].
Microbiological analysis of biofilm is one of the most efficient ways to control the operation of biological treatment plants. Therefore, to assess the microbial structure of the biofilm of the suspended layer, its microscopy was systematically carried out in the hydro-biological laboratory of the treatment plant.
The quality indicators of influent to CSSL (effluent from TF) varied during experiments and their average values are given in Table 1.
During experimental studies, following technological parameters, relationships and performance indicators of CSSL were examined:
- the formation of a suspended layer of biofilm floccules (sludge);
- sludge concentration in the suspended layer (CSL, g/L) as a function of the height of the suspended layer (HSL, m) and the upward flow velocity (vUP, mm/s) and sludge volume index (SVI, mL/g);
- the dependence of the concentration of the suspended solids in clarified water (TSS-out, g/L) on the velocity of the upward flow (vUP, mm/s);
- the relationship between the velocity of the upward flow (vUP, mm/s) and the height of the suspended layer (HSL, m);
- sludge volume index changes (SVI, cm3/g) over the height of the suspended layer (HSL, m);
- the effect of the height of the suspended layer (HSL, m) on the CSSL efficiency;
- parameters of the effluent from CSSL (DO-out, NH3-out, NO2-out, NO3-out, BOD5-out, COD-out).
Experimental studies were carried out with small interruptions for the replacement of pumps and prophylaxis of installations. Wide range of changes in the main technological parameters of the CSSL was examined, including: the velocity of the upward flow, the height of the suspended layer and the protective zone above it. The general technological regime of experimental setup was set within following boundary conditions:
- suspended solids in the inflow to CSLL, TSS-in = 20–60 mg/L;
- height of suspended layer, HSL = 0.33–1.8 m;
- changes in velocity of upward flow, vUP = 0.5–1.8 mm/s.
3. Results
3.1. Suspended Layer Formation
The effluent from the TFs entering the CSSL model contains biofilm floccules, unoxidized organic substances in a colloidal state and inorganic substances. Suspended solids (biofilm sludge) in the inflowing stream move continuously and randomly upwards, but the suspension layer as a whole is in a state of dynamic equilibrium due to the balance between the velocity of the upward flow and the sludge settling velocity. As the velocity of the inflowing stream increases, after exceeding some critical value, the thickness of the suspended sludge layer also increases due to the sludge particles movement upwards with the stream. Thus, the sludge settling velocity is the upper limit of the suspended layer formation. The lower limit is determined by hydrodynamic forces—when the hydrodynamic force of the upward flow on the biofilm floccules is less than the gravity of the particles, the layer is compacted and the sludge accumulates at the bottom of the CSSL. For normal operation of the clarifier, it is necessary then to maintain such an upward velocity, which would provide the most favorable conditions for the formation of floccules and their minimum destruction, and also would be sufficient to maintain the floccules in suspension.
The duration of the formation of the suspended layer depends on the concentration of suspended solids in the inflow to the clarifier. Due to the low TSS-in values (20–60 mg/L) during the initial filling of the installation, the CSSL was fed with settled sludge from the final clarifiers of the treatment plant, with a concentration of 2.0 g/L. During the initial filling (50–60 min), a suspended layer was formed with a height of 0.35 m–0.45 m. A further increase in the height of the suspended layer was carried out due to the bio-coagulation of suspended substances and floccules of biofilm delivered with effluent from the TF.
During the operation of the clarifier, a distinct boundary between two layers: (1) the suspended sludge layer where large floccules of biofilm are concentrated and (2) the clarified supernatant layer are established. In the first phase of CSSL operation, the transition between zones of the suspended layer and clarified water is “blurred”, but as more and more particles are retained in the suspended layer its thickness increases and supernatant above the sludge layer becomes brighter. Small particles that were not captured in the suspended layer form larger floccules in the “protective layer” and, after agglomeration, return to the suspended layer.
The interface between the two phases is almost horizontal in position. The suspended layer is a dark continuous mass of large agglomerated floccules. This indicates a high density of the resulting floccules and their good settling properties.
During the start-up of the experimental unit, the physical and microbiological structure of the suspended layer stabilized. After seven days of continuous operation of the CSSL, the microbial structure of the suspended layer was represented by the following types: Aspidisca—12, Opercularia coarctata—8, Rotaria-rotatoria—5, Vorticella convallaria—23, Opercularia glomerata—2, Vorticella microstoma—3, Vorticella alba—4, Rhabdostyla—2. The physiological state of the species was active and mobile. The color was brown, the smell was weak, the floccules were medium in size and they settled well. The distinct boundary between the suspension and supernatant phase was established, and the supernatant water was clear.
3.2. Sludge Concentration in the Suspended Layer
The changes in sludge concentration (CSL) at different heights of the suspended layer (HSL) and for different upward flow velocities were studied and the results presented in Figure 3. The graph shows an insignificant discrepancy in the distribution of the biofilm concentration over the height of the suspended layer in CSSL with a constant flow rate, i.e., at the constant velocity of the upward flow (vUP).
Smaller values of the sludge concentration are noted in the upper part of the suspended layer since lighter and finer floccules with a small hydraulic size are concentrated here. This is due to the partial destruction of the created floccules caused by the influence of hydrodynamic forces. The increase in sludge concentration in the lower zone of the clarifier compared with the upper zone is explained by the accumulation of larger floccules and particles of mineral origin in this area, in particular, shells identified in the effluent from the TF. To avoid clogging the CSSL, the mineral–organic sediment was periodically removed from the lower zone of the suspended layer since its accumulation could cause deterioration in the uniform distribution of water over the entire area of the clarifier and decay problems.
As the TSS-in in the influent to CSSL was relatively low and stable (30–50 mg/L), the influence of the suspended solids load on the concentration of the sludge in the suspended layer was not observed. Additionally, temperature changes, which during the experiment fluctuated between 18–19 °C, did not affect the parameters of the suspended layer.
3.3. The Role of Upward Flow Velocity
The concentration of sludge in the suspended layer (CSL) varies along the height of the suspended layer of the clarifier (HSL)—the observed difference between the top and bottom level was from 44% at vUP = 1.45 mm/s to 130% at vUP = 0.76 mm/s. Moreover, it is evident that with an increase in the velocity of the upward flow, the overall concentration of sludge (CSL) decreases significantly (Figure 3).
The studies found that the dynamic equilibrium of the suspended layer is maintained over a wide range of upward velocities in the clarifier (vUP from 0.5 to 1.8 mm/s). At velocities lower than 0.5 mm/s, the floccules are deposited on the bottom of the clarifier and compacted (CSL > 7 g/L). The upper limit of the preservation of the suspended layer is determined by the critical upward flow velocity—the velocity above which the sludge layer is washed out of the clarifier. In this study, the critical washout velocity was estimated at 1.8 mm/s. At vUP > 1.8 mm/s, CSL was 1.0–2.5 g/L or less. When vUP was maintained between 0.5 and 1.8 mm/s, the concentration of sludge in the suspended layer was in the range from 8.0 to 2.5 g/L. The dynamic of the changes in CSL with regard to vUP was not uniform: with an increase in the vUP from 0.5 to 1.2 mm/s a rapid drop in sludge concentration over the height of suspended layer was observed, while with vUP from 1.2 to 1.8 mm/s, sludge concentration decrease was rather smooth (Figure 3). At vUP greater than 1.8 mm/s, the suspended layer was destroyed and CSL approached the concentration of suspended solids in the incoming wastewater (CSL ≈ TSS-in) due to washout of the sludge.
3.4. Concentration of Suspended Solids in the Discharge from CSSL
One of the parameters determined during laboratory studies and used for the evaluation of CSSL efficiency was the concentration of suspended solids in the discharge from the clarifier (TSS-out). TSS-out was monitored with regard to varying velocity of the upward flow ranging from 0.3 to 2.0 mm/s. The results obtained for different technological regimes of the experimental installation (variable height of suspended layer, steady-state conditions) are presented on Figure 4.
Analysis of the graphs show that with HSL > 1.0 m, for vUP ranging from 0.6 to 1.6 mm/s, TSS-out was less than 6 mg/L, which is a significantly lower value than that observed in conventional secondary settling tanks. The graphs also show that for velocities over 1.6 mm/s there was a rapid growth of TSS-out (line 2, Figure 4), which confirms earlier findings that velocities ca 1.8–1.9 mm/s may be considered as critical in terms of the washout of sludge from the CSSL.
Low values of vUP promote highly efficient clarification. However, such a mode of operation enhances sludge compaction and the formation of inter-floccule channels, which leads to a breakthrough of contaminants directly to the effluent reducing the effect of treatment and, accordingly, the need for the organization of forced recycling of the suspended layer. For this reason, the minimum upward flow velocity at which a high efficiency of CSSL is ensured, should not be less than 0.6 mm/s.
In addition, it should be noted that the clarification efficiency in the CSSL significantly depends on the height of the suspended layer (HSL). According to the study results, a graph representing the relationship between TSS-out and HSL was prepared (Figure 5).
It can be noted that the efficiency of clarification in the CSSL working with different upward velocities follows a similar pattern, indicating that larger HLS values promote higher clarification efficiency (lower TSS-out). Some characteristic values of HSL may also be determined: to achieve a target TSS-out value less than 5.0 mg/L, then HSL should be larger than 0.6 m. On the other hand, HSL > 1.8 m does not produce further improvement in CSSL efficiency.
3.5. Sludge Volume Index in the Suspended Layer
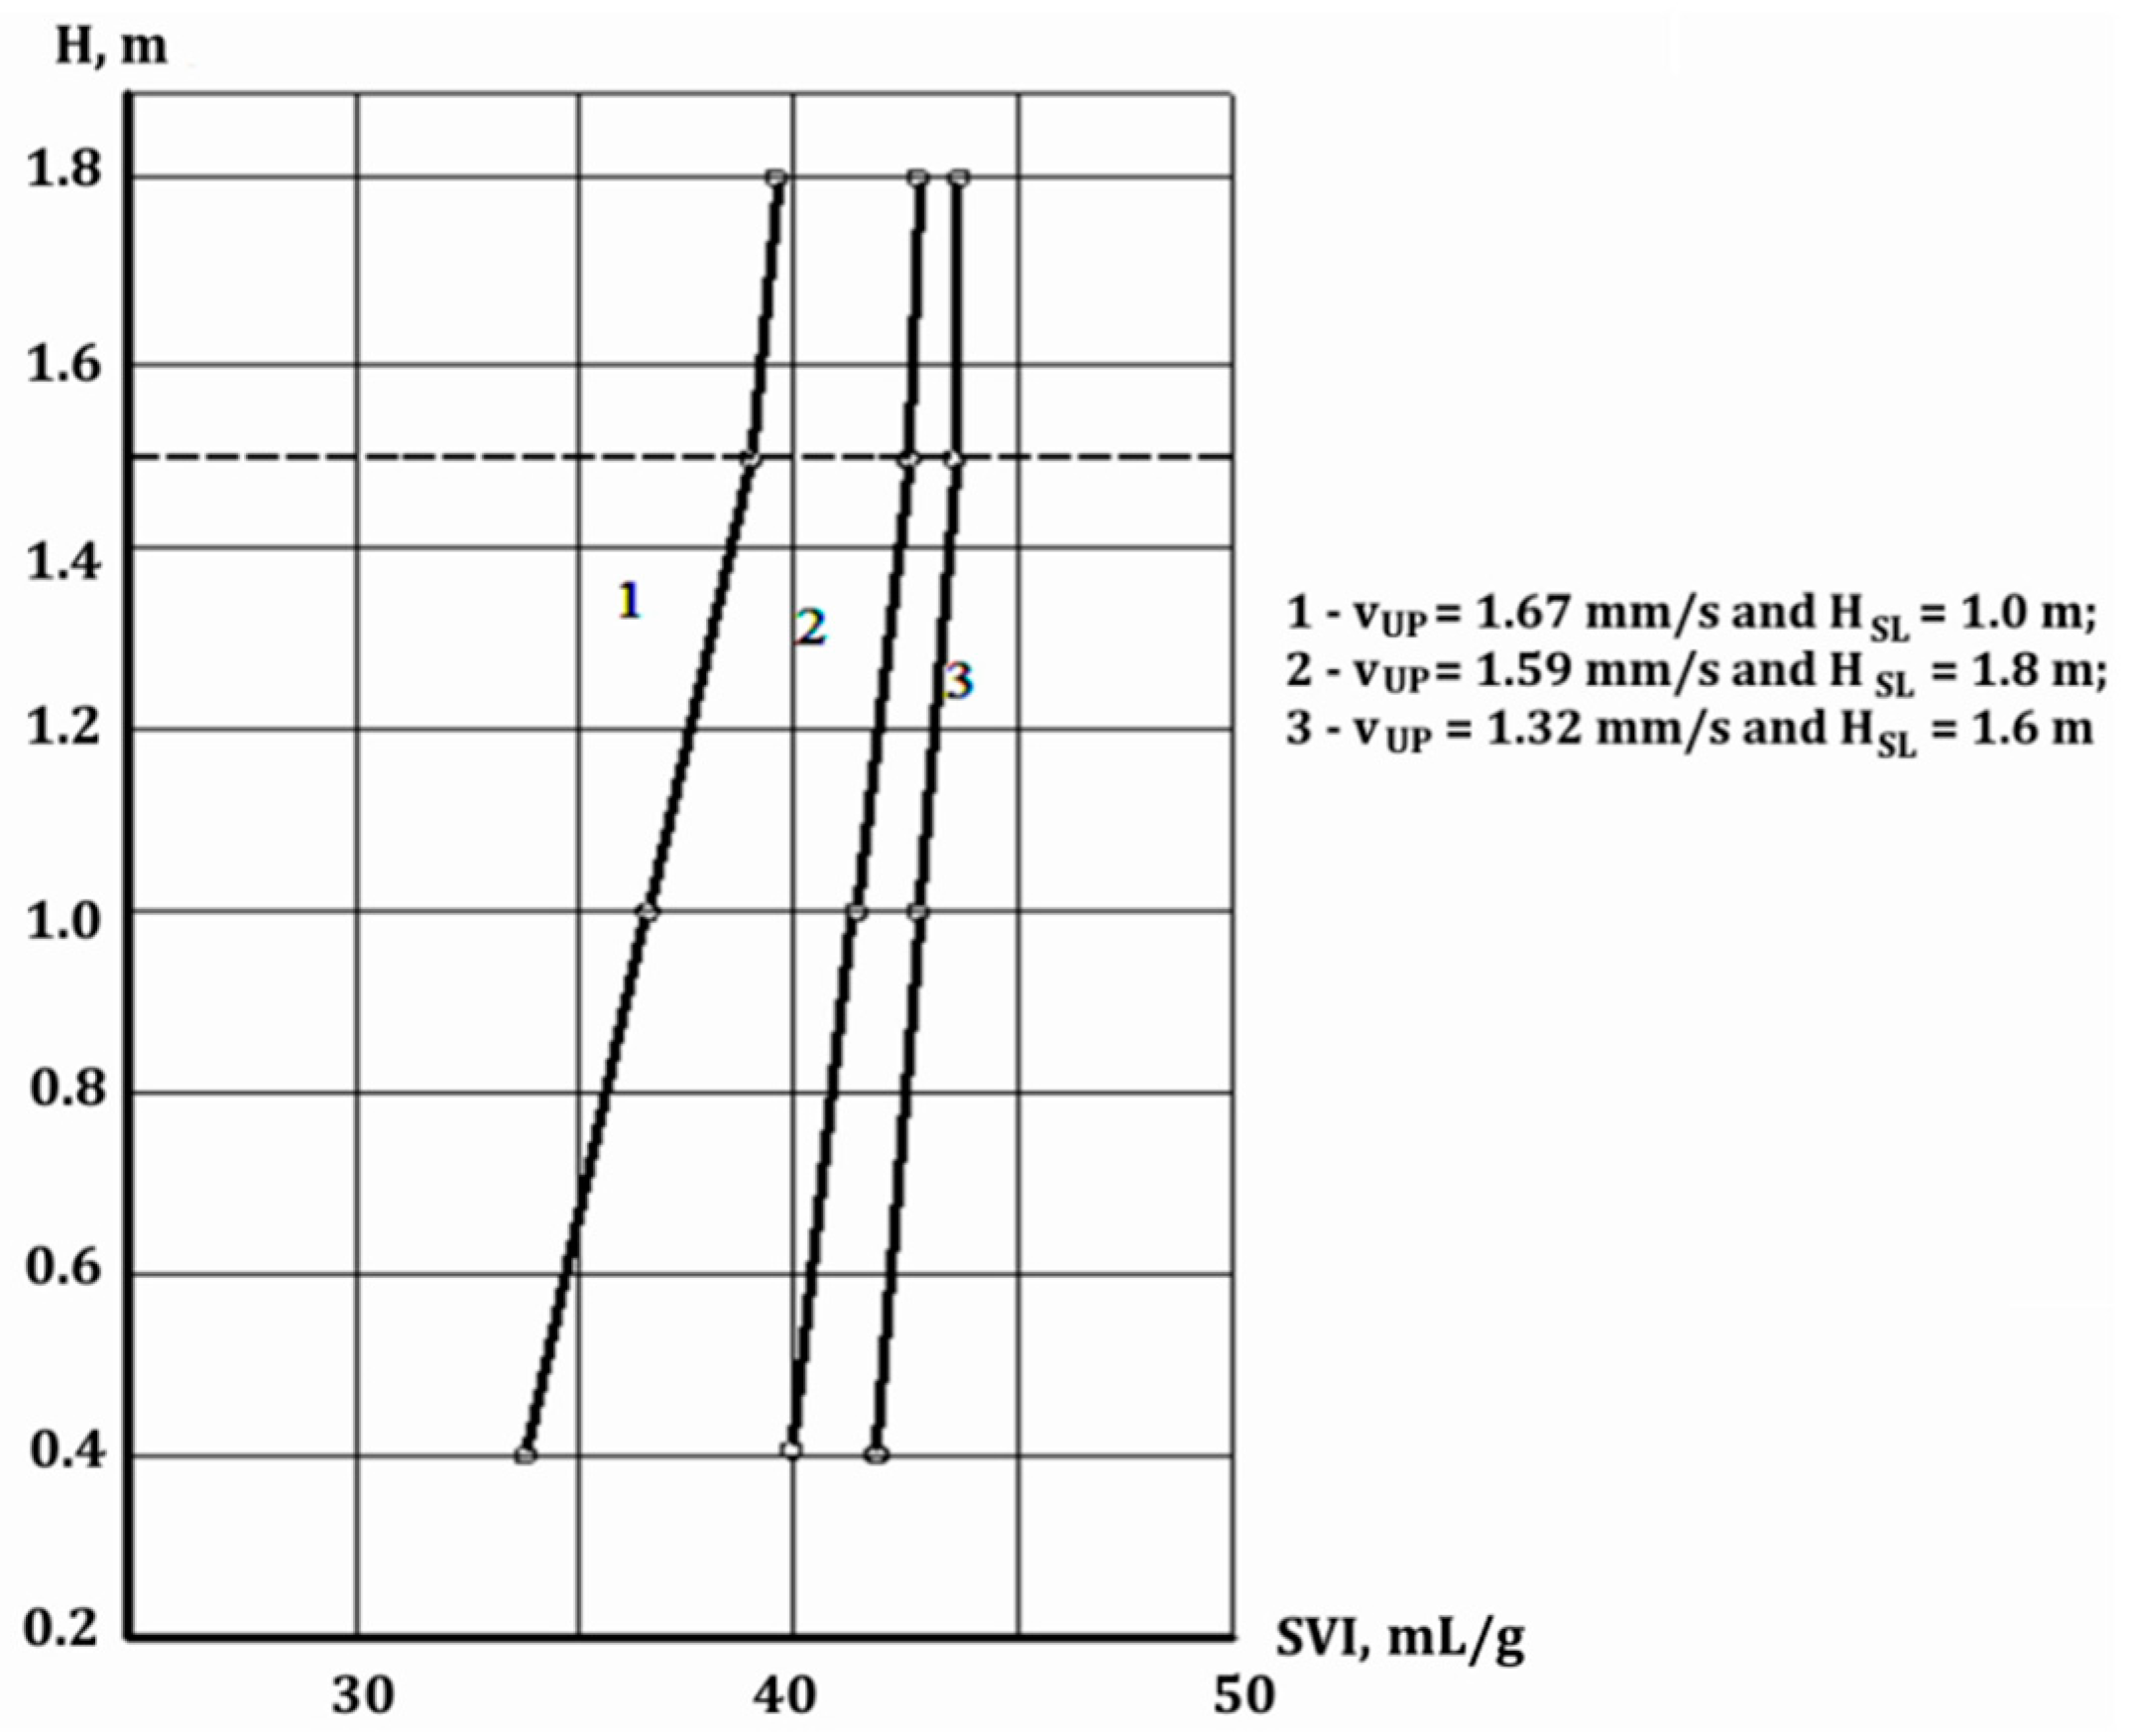
Sludge volume index (SVI) is a commonly accepted parameter describing the settling properties of the sludge. Sludge with an SVI in the range of 100–200 mL/g is considered to be well settled. Deeply mineralized (stabilized) sludge has an SVI in the range of 60–90 mL/g. On the other hand, large values of SVI (greater than 150–200 mL/g) indicate sludge bulking and poor settling properties. The results obtained from the experimental CSSL showed that SVI values determined for the suspended layer were in the range of 20–55 mL/g, indicating a deeply mineralized sludge, which has a good settling characteristic. Figure 6 presents SVI changes over the height of the suspended layer (HSL) for the variable operating conditions of CSSL.
It can be seen from the graphs that the SVI varies insignificantly over the height of the suspended layer and has the smallest value in the lower zone of the clarifier model and larger values in the upper zone at a given value of vUP. The increase in the SVI value along the HSL can be explained by a number of reasons, namely: the development of the denitrification process in the suspended layer and the release of gaseous nitrogen on the floccules of the biofilm (which was confirmed by the results of microscopy of the biofilm in the CSSL); the accumulation of fine floccules in the upper part of the suspended layer (which was confirmed by the results described in Section 3.2 and Figure 3) and by various combinations of the above.
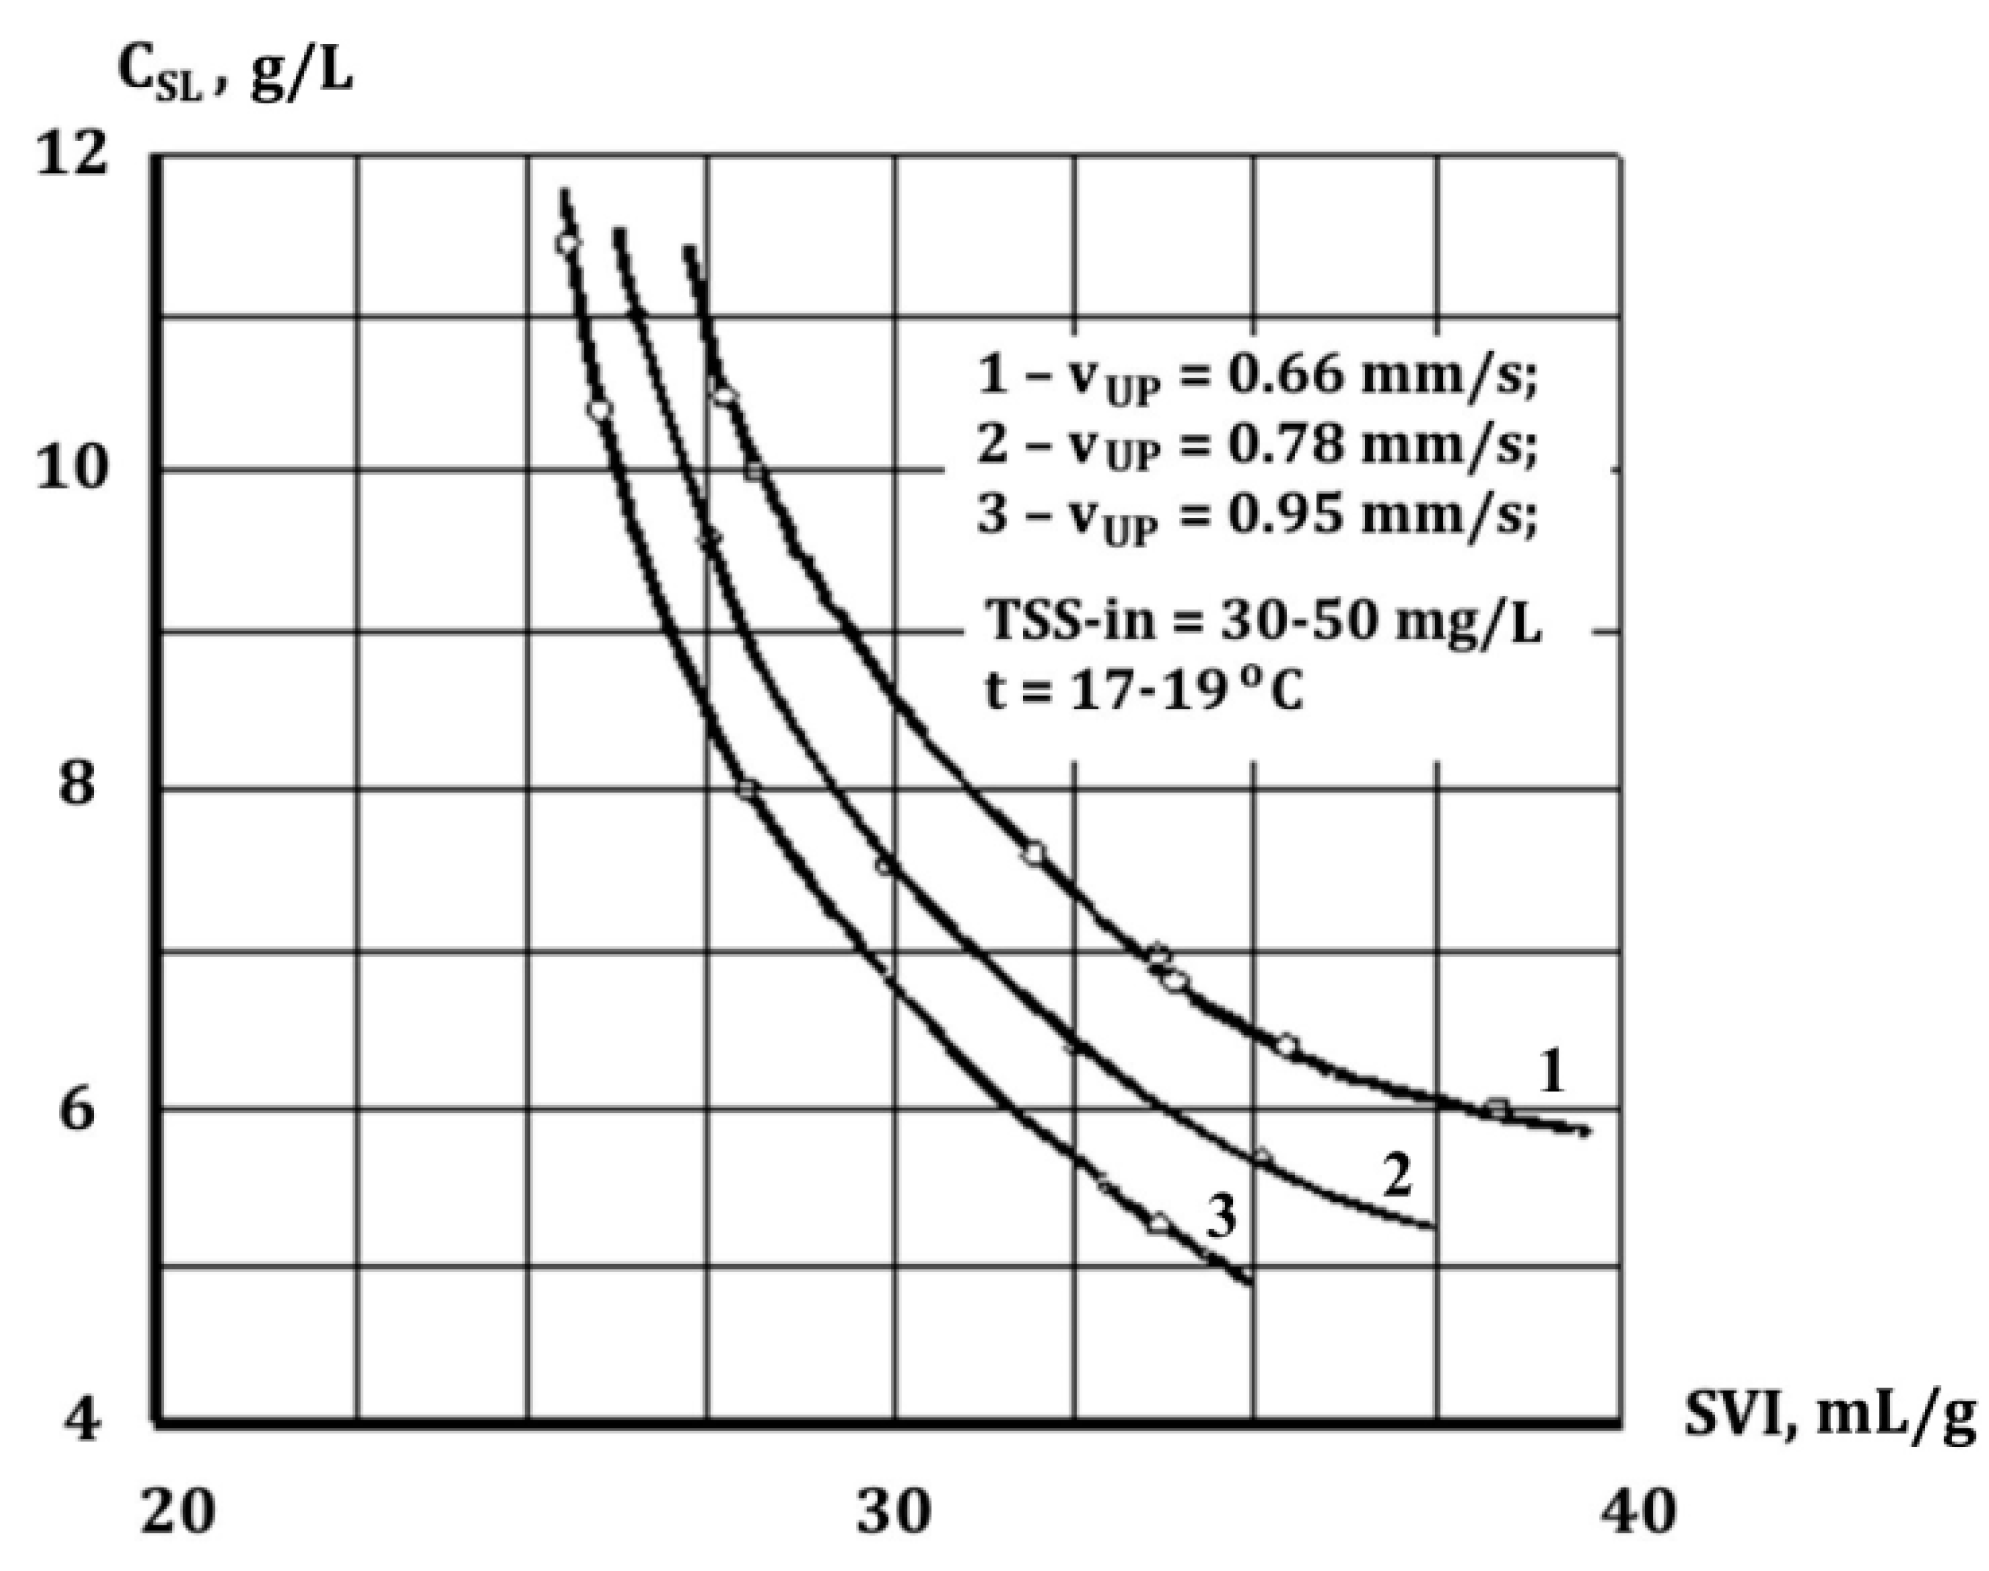
Figure 7 shows the relationship between the SVI and CSL (averaged values over the height of the suspended layer). It can be noticed that the SVI changes inversely with the change in sludge concentration (i.e., with an increase in CSL, the SVI decreases and vice versa). Additionally, higher values of vUP promote better settling properties (lower SVI).
3.6. Clarified Effluent from CSSL
One of the main advantages of CSSL is the combination of two treatment processes: filtration through the suspended sludge layer and the biological oxidation of organic matter and nutrients from wastewater by microorganisms forming a suspended layer. During the studies, a microbial analysis of the biofilm of the suspended layer was periodically carried out. The large species diversity of the microorganisms and their activity (as described in Section 3.1) suggest that, in the suspended layer, the biofilm is in a viable state and is involved in the processes of biochemical oxidation. This is also confirmed by the data in Table 2, which presents the average comparative data on the efficiency of wastewater treatment in the experimental CSSL model and existing objects of the wastewater treatment plant.
An analysis of the data presented in Table 2 proves that the efficiency of the suspended solids’ removal in the CSSL is much higher (90%) than in the conventional clarifier (37%). Moreover, the concentration of BOD and nitrogen compounds in the effluent from the CSSL is significantly lower than in the effluent from the secondary clarifier.
4. Conclusions
In this study, an experimental setup for the investigation of the clarifier with a suspended sludge layer, treating real effluent from trickling filters at a municipal wastewater treatment plant, was developed. The research was focused on the determination of the main technological parameters affecting treatment efficiency in the CLSS. The experimental dependences of the concentration of sludge in the suspended layer and the velocity of upward flow, height of the suspended layer and the sludge volume index were determined, which allowed optimal operational characteristic of the installation to be found. It was found that flow velocity is the key component that maintains the dynamic equilibrium of the suspended layer in the clarifier. For the examined installation, a lower bound limit prohibiting sludge compaction at the bottom (0.5 mm/s) and an upper bound limit preventing sludge washout (1.8 mm/s) were determined. Additionally, it was found that a higher sludge layer promotes more efficient removal of the suspended solids. The optimum range of the sludge layer height for the pilot plant was 0.6–1.8 m. The efficiency of the suspended solids’ removal was significantly higher in the CSSL than in the conventional secondary clarifier. In addition, the results of BOD and nitrogen removal were satisfactory and the quality of effluent from the CSSL was comparable with tertiary treatment on sand rapid filters. These results proved that the CSSL is a promising technology for treating the effluent from trickling filters working with municipal wastewater. However, further comparative studies are required to establish more reliable technological parameters of the CSSL for the wider area of applications, including activated sludge systems as well as different wastewater characteristics.
Author Contributions
Conceptualization, V.K.; methodology, V.K. and K.O.; formal analysis, V.K., K.O., E.K. and D.A.; investigation, V.K., K.O., E.K. and D.A.; resources, V.K.; data curation, V.K. and E.K.; writing—original draft preparation, V.K. and K.O.; writing—review and editing, E.K. and D.A.; visualization, V.K., E.K. and D.A.; supervision, V.K. and D.A.; project administration, V.K., K.O. and E.K.; funding acquisition, V.K., E.K. and D.A. All authors have read and agreed to the published version of the manuscript.
Funding
This research was funded by the Ministry of Education and Science of the Republic of Kazakhstan., grant number 2018/AP05132198. The APC was funded by the Ministry of Education and Science of the Republic of Kazakhstan., grant number AP08855852 and Polish Ministry of Science and Higher Education within the grant WZ/WBIIS/2/2019.
Institutional Review Board Statement
Not applicable.
Informed Consent Statement
Not applicable.
Data Availability Statement
Data is contained within the article.
Acknowledgments
The authors are grateful to the anonymous reviewers for their constructive comments and suggestions that led to significant improvements to the manuscript.
Conflicts of Interest
The authors declare no conflict of interest. The funders had no role in the design of the study; in the collection, analyses, or interpretation of data; in the writing of the manuscript, or in the decision to publish the results.
References
- Metcalf and Eddy Inc. Wastewater Engineering: Treatment and Reuse; McGraw-Hill: New York, NY, USA, 2003; pp. 548–554. [Google Scholar]
- Cohen, Y. Biofiltration—The treatment of fluids by microorganisms immobilized into the filter bedding material: A review. Bioresour. Technol. 2001, 77, 257–274. [Google Scholar] [CrossRef]
- Rodgers, M.; Zhan, X.M. Moving-medium biofilm reactors. Rev. Environ. Sci. Biotechnol. 2003, 2, 213–224. [Google Scholar] [CrossRef]
- Verma, M.; Brar, S.K.; Blais, J.F.; Tyagi, R.D.; Surampalli, R.Y. Aerobic Biofiltration Processes-Advances in Wastewater Treatment. Pract. Period. Hazard. Toxic Radioact. Waste Manag. 2006, 10, 264–276. [Google Scholar] [CrossRef]
- Jeong, J.; Hidaka, T.; Tsuno, H.; Oda, T. Development of biological filter as tertiary treatment for effective nitrogen removal: Biological filter for tertiary treatment. Water Res. 2006, 40, 1127–1136. [Google Scholar] [CrossRef] [PubMed]
- Aspegren, H.; Nyberg, V.; Andersson, B.; Gotthardsson, S.; Jansen Ia Cour, J. Post denitrification in a moving bed biofilm reactor process. Water Sci. Technol. 1998, 38, 31–38. [Google Scholar] [CrossRef]
- Payraudeau, M.; Paffoni, C.; Gousailles, M. Tertiary nitrification in an up flow biofilter on floating media: Influence of temperature and COD load. Water Sci. Technol. 2000, 41, 21–27. [Google Scholar] [CrossRef]
- Vigne, E.; Choubert, J.-M.; Canlerv, J.-P.; He’duit, A.; Sorensen, K.; Lessard, P. A biofiltration model for tertiary nitrification of municipal wastewaters. Water Res. 2010, 44, 4399–4410. [Google Scholar] [CrossRef] [PubMed]
- Viotti, P.; Eramo, B.; Boni, M.R.; Carucci, A.; Leccese, M.; Sbaffoni, S. Development and calibration of a mathematical model for the simulation of the biofiltration process. Adv. Environ. Res. 2002, 7, 11–33. [Google Scholar] [CrossRef]
- Hidaka, T.; Tsuno, H.; Kishimoto, N. Advanced treatment of sewage by pre-coagulation and biological filtration process. Water Res. 2003, 37, 4259–4269. [Google Scholar] [CrossRef]
- Takacs, I.; Patry, G.G.; Nolasco, D. A dynamic model of the clarification thickening process. Water Res. 1991, 25, 1263–1271. [Google Scholar] [CrossRef]
- Xanthos, S.; Ramalingam, K.; Lipke, S.; McKenna, B.; Fillos, J. Implementation of CFD modeling in the performance assessment and optimization of secondary clarifiers: The PVSC case study. Water Sci. Technol. 2013, 689, 1901–1913. [Google Scholar] [CrossRef] [PubMed]
- Das, S.; Bai, H.; Wu, C.; Kao, J.-H.; Barney, B.; Kidd, M.; Kuettel, M. Improving the performance of industrial clarifiers using three-dimensional computational fluid dynamics. Eng. Appl. Comput. Fluid Mech. 2015, 10, 130–144. [Google Scholar] [CrossRef] [Green Version]
- Burger, R.; Diehl, S.; Nopens, I. A consistent modelling methodology for secondary settling tanks in wastewater treatment. Water Res. 2011, 45, 2247–2260. [Google Scholar] [CrossRef] [PubMed]
- Shevtsov, V.S. The Study of Clarifiers with a Suspended Layer of Activated Sludge to Separate the Sludge Mixture. Ph.D. Thesis, Moscow State University, Moscow, Russia, 1985. [Google Scholar]
- Miura, Y.; Hiraiwa, M.N.; Ito, T.; Itonaga, T.; Watanabe, Y.; Okabe, O. Bacterial community structures in MBRs treating municipal wastewater: Relationship between community stability and reactor performance. Water Res. 2007, 41, 627–637. [Google Scholar] [CrossRef]
- Molina-Munoz, M.; Poyatos, J.M.; Sanchez-Peinado, M.M.; Hontoria, E.; Gonzalez-Lopez, J.; Rodelas, B. Microbial community structure and dynamics in a pilot-scale submerged membrane bioreactor aerobically treating domestic wastewater under real operation conditions. Sci. Total Environ. 2009, 407, 3994–4003. [Google Scholar] [CrossRef]
- Gray, N.G.; Miskin, I.P.; Kornilova, O.; Curtis, T.P.; Head, I.M. Occurrence and activity of Archaea in aerated activated sludge wastewater treatment plants. Environ Microbiol. 2002, 4, 158–168. [Google Scholar] [CrossRef] [PubMed]
- Witzig, R.; Manz, W.; Rosenberger, S.; Kruger, U.; Kraume, M.; Szewzyk, U. Microbiological aspects of a bioreactor with submerged membranes for aerobic treatment of municipal wastewater. Water Res. 2002, 36, 394–402. [Google Scholar] [CrossRef]
- Hunze, M. Simulation in der Kommunalen Abwasserreinigung; Oldenburg Industrieverlag: Munich, Germany, 2005; p. 380. ISBN 978-3-8356-3073-4. [Google Scholar]
- Sverdlikov, A.A. Deep Biological Wastewater Treatment of Nitrogen Compounds. Ph.D. Thesis, Nautchno Issledovatel’skiy Institut VODGEO, Moscow, Russia, 29 May 1996. Available online: http://tekhnosfera.com/view/407371/a#?page=1 (accessed on 25 February 2021).
- RD 52.24.468-2005: Suspended Solids and Total Impurities in Waters. Method for Carrying out Measurements of Mass Concentration by the Gravimetric Method (Reg. No. KZ.07.00.01182-2015). Available online: https://files.stroyinf.ru/Index2/1/4293837/4293837302.htm (accessed on 8 September 2021).
- GOST 31859-2012. Water. Method for Determination of Chemical Oxygen Demand; Standardinform: Moscow, Russia, 2014.
- NDP 10.1: 2: 3.131-2016. Method for Determining Biochemical Oxygen Demand after 5 Days of Incubation in Drinking, Nat-ural and Waste Water Samples by Amperometric Method; ZA O “Rosa”: Moscow, Russia, 2016.
- GOST 33045-2014. Water. Methods for the Determination of Nitrogen-Containing Substances; Standartinform: Moscow, Russia, 2019.
- FR 1.31.2008.04399 Methods for Measuring the Ash Content of Wet Activated Sludge; AKVAROS: Moscow, Russia, 2008.
Figure 1.
The scheme of the experimental installation. 1—clarifier (CSSL); 2—sludge thickener; 3—sludge outlet; 4—samplers; 5—discharge of clarified water from CSSL; 6—discharge of clarified water from the thickener; 7—discharge of thickened sludge; 8—pump; 9,10—feed pipelines TFs effluent; 11—flow equalizer; 12—channel with effluent from TFs; 13—overflow.

Figure 2.
Sludge volume index (SVI) as a function of suspended solids in the diluted sludge sample (CDIL) for the experimental CSSL.
Figure 2.
Sludge volume index (SVI) as a function of suspended solids in the diluted sludge sample (CDIL) for the experimental CSSL.

Figure 3.
Changes in sludge concentration (CSL) over the height of suspended layer (HSL) for different upward velocities (vUP).
Figure 3.
Changes in sludge concentration (CSL) over the height of suspended layer (HSL) for different upward velocities (vUP).

Figure 4.
Concentration of suspended solids in the effluent from CSSL (TSS-out) as a function of upward velocity (vUP) for different heights of suspended layer (HSL).
Figure 4.
Concentration of suspended solids in the effluent from CSSL (TSS-out) as a function of upward velocity (vUP) for different heights of suspended layer (HSL).

Figure 5.
TSS effluent from CSSL (TSS-out) versus height of suspended layer (HSL).

Figure 6.
Sludge volume index (SVI) and different heights of CSSL (H).

Figure 7.
Relationship between sludge concentration (CSL) and sludge volume index (SVI).


Table 1.
Quality indicators of the influent to CSSL model.
| Parameters, Indicators | Inflow to CSSL |
|---|---|
| TSS-in, mg/L | 40 |
| Wastewater temperature, °C | 17 |
| pH-in | 7.5 |
| BOD5-in, mg/L | 18 |
| DO-in, mg/L | 5.05 |
| NH3-in, mg/L | 17.5 |
| NO2-in, mg/L | 0.3 |
| NO3-in, mg/L | 4.5 |
Table 2.
Average wastewater quality indicators in the effluent from technological objects of Ust-Kamenogorsk wastewater treatment plant.
Table 2.
Average wastewater quality indicators in the effluent from technological objects of Ust-Kamenogorsk wastewater treatment plant.
| Sampling Points (Effluent) | Parameter, mg/L | |||||
|---|---|---|---|---|---|---|
| NH3 | NO2 | NO3 | DO | BOD5 | TSS | |
| Primary clarifiers | 20.5 | 0.53 | 0.955 | 4.2 | 34.8 | 58.0 |
| Trickling filters | 20.0 | 0.25 | 4.5 | 6.07 | 17.1 | 41.0 |
| Secondary clarifiers | 18.0 | 0.23 | 4.69 | 5.9 | 13.5 | 26.0 |
| Experimental unit (CSSL) | 11.0 | 0.36 | 3.13 | 5.6 | 6.9 | 4.0 |
Publisher’s Note: MDPI stays neutral with regard to jurisdictional claims in published maps and institutional affiliations. |
© 2021 by the authors. Licensee MDPI, Basel, Switzerland. This article is an open access article distributed under the terms and conditions of the Creative Commons Attribution (CC BY) license (https://creativecommons.org/licenses/by/4.0/).
Share and Cite
MDPI and ACS Style
Kolpakova, V.; Ospanov, K.; Kuldeyev, E.; Andraka, D. Clarification of Biologically Treated Wastewater in a Clarifier with Suspended Sludge Layer. Water 2021, 13, 2486. https://doi.org/10.3390/w13182486
AMA Style
Kolpakova V, Ospanov K, Kuldeyev E, Andraka D. Clarification of Biologically Treated Wastewater in a Clarifier with Suspended Sludge Layer. Water. 2021; 13(18):2486. https://doi.org/10.3390/w13182486
Chicago/Turabian StyleKolpakova, Valentina, Kairat Ospanov, Erzhan Kuldeyev, and Dariusz Andraka. 2021. "Clarification of Biologically Treated Wastewater in a Clarifier with Suspended Sludge Layer" Water 13, no. 18: 2486. https://doi.org/10.3390/w13182486
Note that from the first issue of 2016, this journal uses article numbers instead of page numbers. See further details here.