
Performance Assessment System to Wastewater Utilities Strategic Planning


Urban Water Unit, National Laboratory for Civil Engineering, LNEC, Av. Brasil 101, 1700-066 Lisbon, Portugal
*
Author to whom correspondence should be addressed.
Water 2021, 13(18), 2489; https://doi.org/10.3390/w13182489
Submission received: 6 August 2021
/
Revised: 2 September 2021
/
Accepted: 8 September 2021
/
Published: 10 September 2021
(This article belongs to the Special Issue Infrastructure Asset Management of Urban Water Systems)
Abstract
:Urban water utilities face growing challenges in compliance with increasingly demanding legislation, tightening budgets, ageing personnel, decreasing infrastructure reliability, increasing operational costs, regulatory pressure, and climate change. Within this context, tracking the alignment of the performance with the mission and strategic objectives of the organization, based on reliable and up-to-date data, is of utmost importance to enable effective and continual improvement management. Organizational performance assessment in the water sector has been a topic of growing attention since the 1990s due to the increase in the role of regulators and tighter legislation. Proactive utilities are incorporating sustainability, resource efficiency, resilience, and continual improvement principles in their practices. Strategic planning provides the road map for management and interconnecting the different areas of the organization. An essential component of strategic management planning is the adoption of a tailored performance assessment system (PAS), allowing a better response to these challenges from the water utility management perspective. This paper presents a novel PAS at the strategic level, which was tested and validated with wastewater utilities, in a co-creation process. The proposed PAS fully adopts the objectives recommended in international standards, with a corresponding set of criteria and metrics, and a validated proposal of reference values for the metrics.
1. Introduction
Urban water utilities face current and future challenges involving compliance with demanding legislation, tightening budgets, ageing personnel, decreasing infrastructure reliability, increasing operational costs, and regulatory pressure [1,2]. In addition, external risk sources are increasing the pressure faced by these utilities, both related to natural phenomena, e.g., climate change, and human action, e.g., interference in systems control by cyber-attacks.
Within this context, tracking performance aligned with the mission and strategic objectives of the utility, based on reliable and up-to-date data, is of utmost importance to enable effective and continual improvement management. Organizational performance assessment in the water sector has been a topic of growing attention since the 1990s, due to the increase in the role of regulators (economic, environmental, health, and quality of service) [3,4,5,6] and tighter legislation. Proactive utilities are incorporating sustainability, resource efficiency, resilience, and continual improvement principles into their practices [7,8,9].
Strategic planning provides the road map for management, facilitating the interconnection of work areas of the utility (organizational, financial, infrastructure asset management, risk management, among others) [10,11,12]. Strategic planning ought to set the direction for the long term. This planning is unique to each utility, depends on utility’s circumstances, involves the entire organization, and materializes in the form of strategies [12].
The water and wastewater sector provides an essential and specific public service. Several features add to the complexity of providing this service, including being a natural monopoly; high demand for capital-intensive infrastructure; the associated infrastructure is largely buried [13,14]; and there are numerous interactions between the components of the infrastructure and the natural and built environment. The service needs to be provided continuously using infrastructure systems which, in turn, comprise components with limited useful lives that require expensive maintenance and rehabilitation [13]. Performance assessment is essential to evaluate and monitor the activity of water sector utilities, thereby supporting decision making and encouraging continuous improvement while allowing utilities to benchmark [3,4,15].
The benefits of adopting a performance assessment system (PAS) include diagnosis of the quality of service, support for the decision-making processes, identification of significant opportunities for improvement, monitoring the continual improvement processes [10,11,12], and promoting transparent communication. The use of multidimensional performance measures and organizational factors makes a positive contribution to an effective PAS [16,17].
Components of strategic management planning include the collection of contextual information, the definition of the PAS, diagnosis of the current situation (supported by the PAS), selection of future scenarios, setting targets in the planning horizon, identification of strategies to reach the set targets, identification of resources to implement the strategies, and definition of plan monitoring (also supported by the PAS) [7].
A tailored PAS allows a better response to challenges from the management perspective of the water utility. PAS have been applied in water supply and wastewater systems, covering several service objectives and criteria [18,19], frequently with a regulator perspective or directed to a specific concern. However, they are often limited in addressing the strategic objectives recommended in international standards (e.g., EN 752:2017, ISO 24,500 series) [20,21,22,23] and in incorporating key areas from tactical plans. This is especially noted as a setback by water utilities focused on wastewater, stormwater, and combined systems.
Developments reported in the literature predominantly relate to water supply, with fewer studies on wastewater and stormwater systems, and even fewer for natural or nature-based water systems. Several publications by [6,10,11,12,24,25,26,27,28] present a structured PAS to support effective and robust management of urban water systems but are mostly directed to infrastructure asset management (IAM). Many adopt a wide-ranging structure aiming to respond to regulatory or legal requirements [29,30], therefore without fully exploring important technical aspects for the strategic management of the services provided in all dimensions. For instance, in Portugal, the regulator ERSAR (acronym in Portuguese for the national regulator of public water supply, urban wastewater, and urban waste management services) undertakes a national quality of service assessment, based on a PAS. ERSAR incorporates the legal and economic, quality of service, drinking water quality, and user interface regulation of the utilities [15]. This system allows a yearly assessment and national benchmarking. In this country, the legislation requires (Decree-law 194/2009) utilities serving over 30,000 inhabitants to produce an IAM plan. This legal obligation confirms the value of using a PAS and has spurred utilities to annually produce the required information.
Some utilities use the regulator’s PAS to support their strategic planning; others rely on a PAS developed specifically for IAM or a given objective [28]. At the strategic level, the PAS needs to incorporate the relevant management issues, incorporating the objectives of the utility and other essential points of view influencing the overall performance. These are generally more developed at the tactical level but need to be extended and depicted at the strategic level. Strategically relevant tactical areas include infrastructure asset management, adaptation to climate change, control of water losses, management of undue inflows, or energy management. Incorporating tactical concerns in the strategic PAS is a step forward toward aligning planning levels in the organization.
The definition of a PAS is not a straightforward task. Previous work illustrates the difficulty to achieve a coherent strategic PAS and the advantages of having a common framework for utilities, allowing for wider self-testing of the system and reference values [31]. A PAS structure centered on the definition of objectives, assessment criteria, and metrics (O-C-M), complemented with reference values, allows a robust comparison between utilities and systems. Such a PAS facilitates the implementation of continual improvement principles typically used in quality systems standards [7]. It facilitates consistent utility assessment over time and targets fine-tuning [18,19].
The objectives for water sector utilities are well defined by international standards (EN 752:2017; ISO 24,500 series) [20,21,22,23]. The criteria allow the evaluation of several aspects or principles of these objectives. The metrics are parameters or functions used to assess the criteria. Reference values are used to classify and judge the metrics results, preferably after validation by utilities.
During the development of strategic plans, after undertaking the diagnosis it is possible to set achievable targets, understood as the values to be reached for each metric for a set deadline. The targets are related to the characteristics and resources of the organization; selected strategies are instrumental to achieve those targets.
Given the mentioned gaps, the aim of this paper is to present a PAS specifically developed to support strategic management of wastewater, stormwater, and combined systems, bolstering these systems’ assessment. The methodology adopted considers existing assessment approaches and is aligned with current challenges expressed in international standards. Innovative aspects of the methodology comprise: adoption of a holistic view of the urban water systems (regarding, e.g., interactions of water supply and drainage systems); flexibility in the application (e.g., depending on the utility, the type of systems, or data availability); valorization, at the strategic level, of common tactical concerns; and the contribution of utilities in a co-creation and validation approach. Using this applied research approach enabled the development of a PAS that is usable by and useful for utilities, and which encourages the adoption of novel approaches to the management of wastewater, stormwater, and combined systems.
2. Methods and Data
2.1. General Approach
The comprehensive approach being proposed aims at setting a standard that allows comparability and performance evaluation over time and benchmarking, of utilities.
The methodology aligns with the IAM process, which involves full integration between objectives, criteria, metrics, and targets, at three decision levels: strategic, tactical, and operational. It provides a standardized procedure for evaluating actual performance and appraising intervention options over an analysis period [7,32] (Figure 1). At each level, a diagnosis based on a predefined performance assessment system, using available information, is the foundation for evaluation and priority setting that, together with a set of courses of action, leads to further developments.
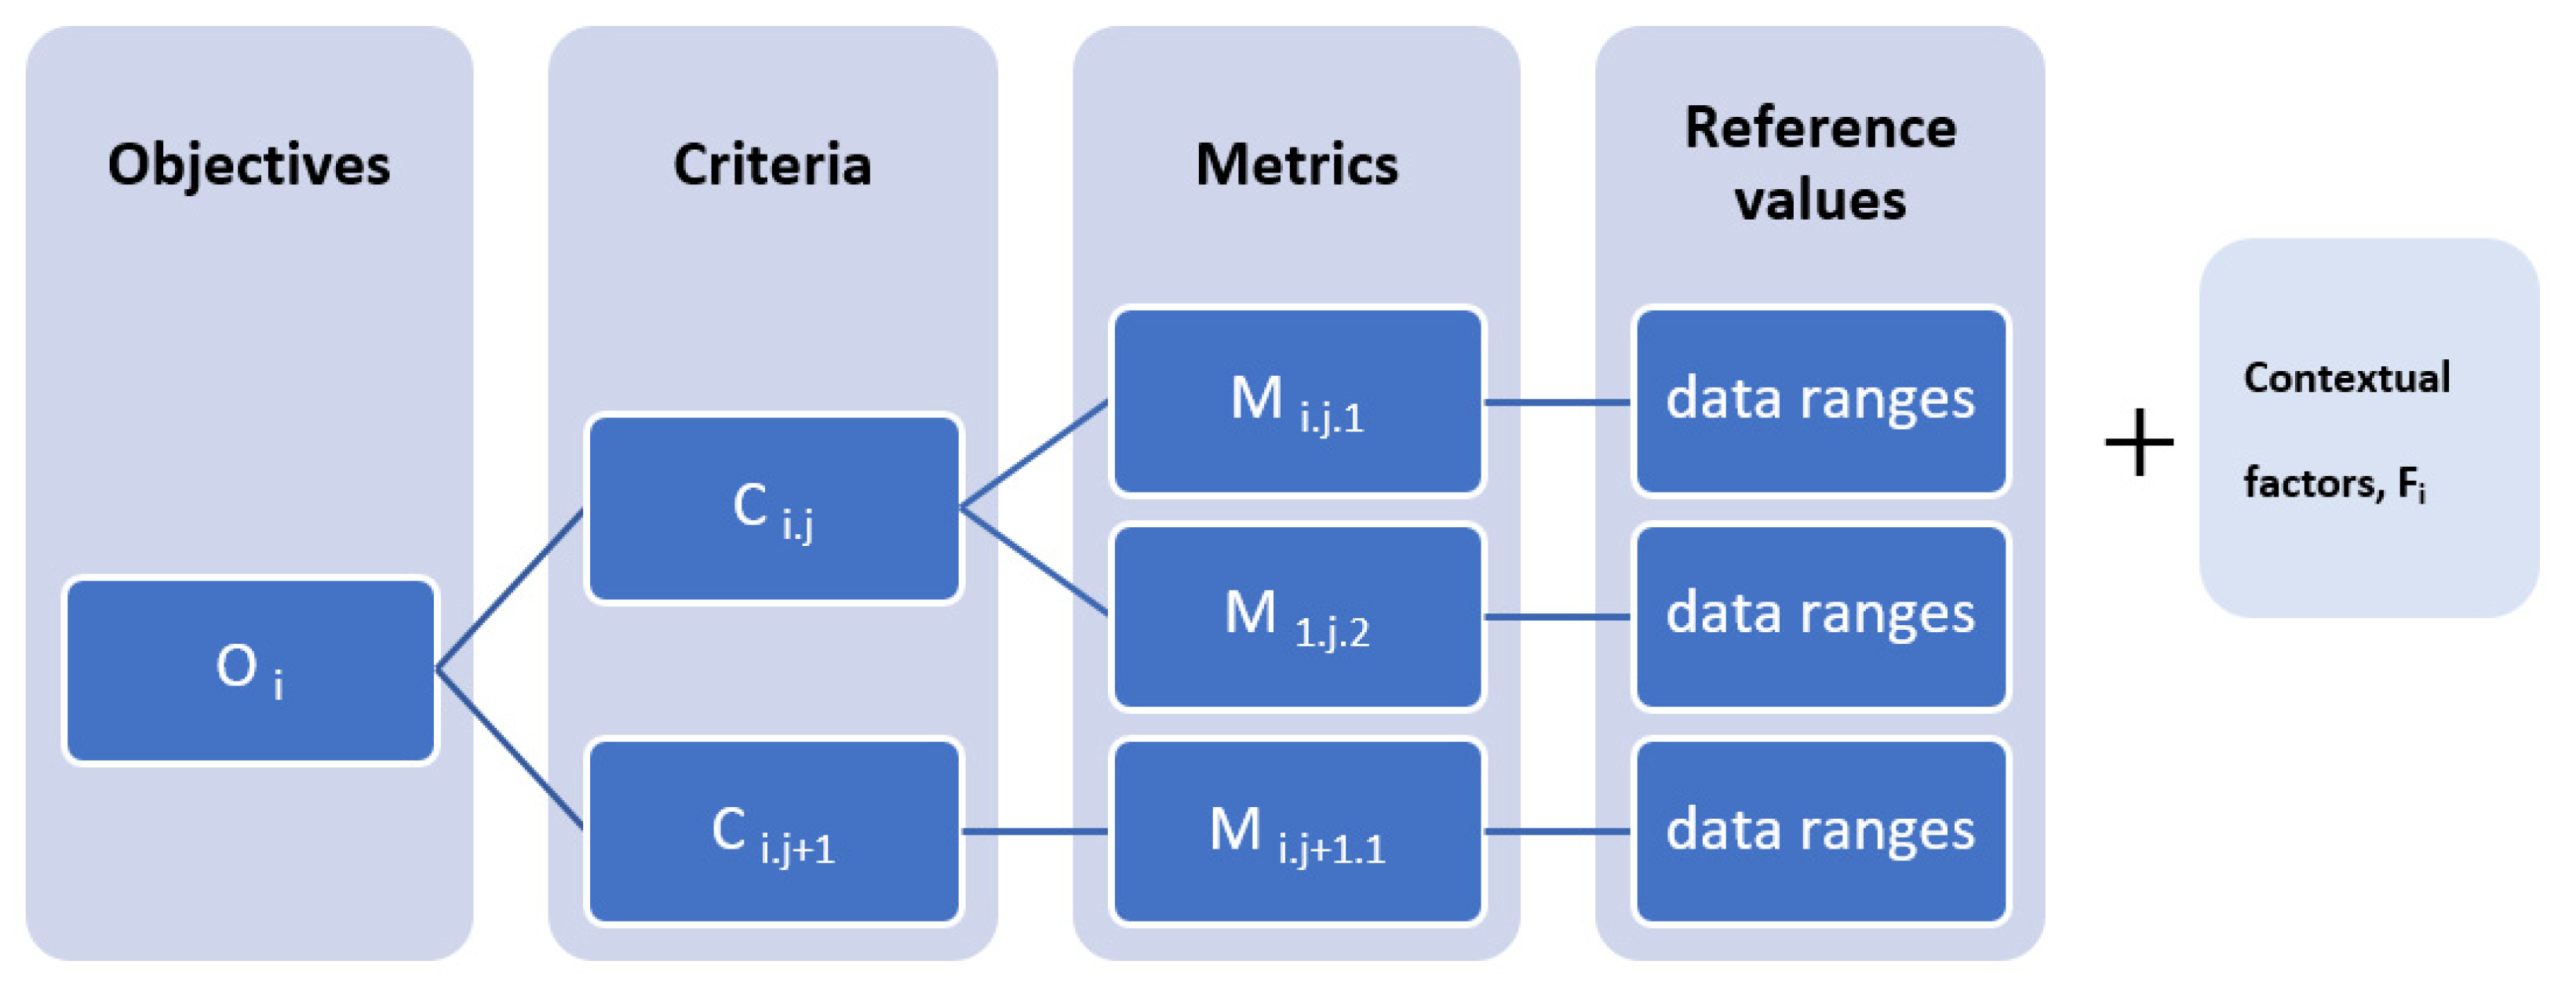
The methodology for constructing a PAS to support strategic planning of wastewater and stormwater management utilities comprises a stepwise development, aligned with the literature. It is based on an objectives-criteria-metrics-reference values (O-C-M-RV) tree structure as proposed by [18,19]. Including contextual factors provides a circumstantial dimension to the analysis, allowing gaps in quantifiable information to be overcome (Figure 2).
For strategic PAS development, the leading principles include: the applicability to diverse wastewater utilities; the adoption of a global view of the organization; the alignment of the decision levels (strategic, tactical, and operational); the consideration of all sectors of the utility; and incorporation of multiple perspectives relevant to the utility objectives. Furthermore, technical performance and organizational management need to be incorporated. Integration with other organizational systems, coordination with other relevant stakeholders, and ensuring the inclusion of important elements of performance that are difficult to quantify are also sought [33].
The desired result is a comprehensive standard PAS, responding to common utility mission and objectives, that can be applied even in the face of data scarcity and is compatible with increasing levels of available data, in a continuous improvement process.
The methodology adopted follows three steps: (i) development of the strategic PAS, including O-C-M; (ii) testing and validation of the strategic PAS together with wastewater utilities’ teams; and (iii) validation of the range of reference values.
Interpretation of the metrics’ results should not be limited to evaluating each metric individually using the corresponding reference range; each objective needs to be assessed globally. The contextual factors, external or internal, should also be considered in this analysis. The targets are utility-specific, defined during the development of the plan, considering the different planning periods; the definition of targets is outside the scope of the present paper.
2.2. Strategic PAS Development
In this first step, setting the strategic objectives for wastewater utilities is straightforward because they are standardized in Europe and globally [20,22] and, in general, are reflected in the vision and mission of the utilities. Recent issues, such as climate change and resilience to relevant changes in circumstances or catastrophic events, among others, should also be incorporated.
Criteria are the different perspectives to assess each objective. These perspectives should cover the essential aspects behind the objective, avoiding overlaps with criteria under other objectives.
The metrics are measures used to quantify the criteria, reducing the subjectivity in the objective’s assessment. Repetition of performance metrics in the system should be avoided; even when a similar perspective is used, the metrics should be adjusted to the specifics of the objective and fit within the pre-defined assessment criteria.
Criteria and metrics need to be defined clearly and concisely to reduce subjectivity in the implementation. The unequivocal definition of each metric is crucial; metrics must provide a measure that is independent of the conditions of the utility.
A PAS that uses data available for most utilities is preferable. However, metrics should be fit for purpose. Although using the best available data is advantageous and reasonable for any wastewater utility, metrics requiring either qualitative or more detailed data should be included in the PAS to encourage the gradual improvement of data collection. Assessment of the metadata on data quality and reliability is a good practice for informed decision making and to improve data collection and processing activities. Under the perspective of quality measurement systems, metrics should be auditable [30]. Parsimony in the number of criteria and metrics is of utmost importance to facilitate the adoption by utilities.
In Portugal, the variables included in the regulators’ system are a good starting point for metrics selection. Systems available in the literature were analyzed, together with PAS defined in previous research, legislation and regulation requirements, and strategic national and European development guidance [5,6,8,10,25,30,34,35,36,37,38,39].
After the first version of the criteria and metrics for each objective, cross-analysis was carried out to identify overlaps and gaps. This iterative process ended when a comprehensive PAS responding to the mentioned leading principles was assembled. In parallel, the identification of relevant contextual factors was carried out.
The result was a first strategic PAS ready to be tested and validated by wastewater utilities. All variables were considered for the period of one year, as the reference period for the strategic assessment.
2.3. Strategic PAS Testing and Validation
This step is intended to revise and adjust criteria and metrics, confirm the calculation procedure, improve the descriptions, check sources of information for metrics’ calculation, and verify adequacy to different utilities. Overall, this testing and validation step seeks to ensure the coherence and feasibility of the application of the proposed strategic PAS.
Testing and validation were carried out in two sequential phases. Testing by the research team involved using publicly available data from the Portuguese regulator [29] and from a subset of water utilities. After testing, an improved version of the PAS was prepared for validation.
Validation comprised the development of a structured calculation tool provided to facilitate the PAS application, enabling understanding to be confirmed and errors to be identified. The validation was carried out in a joint effort between the researchers and teams from a subset of utilities. These teams used the tool to apply the PAS to their systems. The result was an updated version of the PAS with adjustments in the variables and metrics, customized to the sector practices and needs, as an acceptable standard for the strategic assessment of wastewater utilities. The capacitation of utilities’ teams involved is a co-benefit of this validation phase.
The Portuguese water sector has two main types of wastewater utilities: those responsible for wastewater bulk transport and treatment (Type A) and those responsible for collection and transport (sometimes including treatment) utilities (Type B). The Portuguese assessment system for the quality of service undertaken by the ERSAR recognizes the types of utilities mentioned. For the testing, the data used for calculating metrics were those publicly available for all the Portuguese water utilities (12 of type A and 257 of type B) in 2018 [29]. The main characteristics of the Portuguese systems are given in Table 1.
The validation involved a subset of nine wastewater utilities, representative of the Portuguese sector. Participating utilities manage systems of different dimensions and context, as given in Table 2. Utilities supplied available data for the period from 2015 to 2019. Systems are referred to anonymously.
2.4. Reference Values Range Selection
The last step of the methodology is the selection and validation of reference values range for the metrics of the validated strategic PAS. Reference values are used to classify and judge the metrics results, typically for three classes of quality of service provided: good, fair, and poor.
The reference values for a metric can be set from theoretical concepts or legislation related to that metric, reference values used by the regulator for similar metrics, a literature review, and statistical analysis of the validation results. In the case of the latter, statistics calculated for the nine utilities (when data were available) included the 25th, 50th, and 75th percentiles, and average, maximum, and minimum values. These statistics supported the selection of upper and lower boundaries of reference values for each class. The type of utility, contextual factors, and the expected accuracy of variables for an average utility were considered.
The first proposal of the research team was improved in joint sessions with utilities’ multidisciplinary teams. The inclusion of their feedback and suggestions supported the applicability of the final reference values. This consultation was found to be critical to ensuring the acceptance of the resulting set of reference values. The reference values are fundamental in the O-C-M-RV structure for a fair, transparent, and systematic application of the PAS.
3. Results and Discussion
3.1. Strategic PAS for Wastewater Utilities
The final validated strategic PAS includes seven objectives, 19 criteria, and 42 metrics. The objectives are presented in Table 3. The perspectives found necessary to assess each objective are expressed by the criteria in Table 4. The number of criteria per objective varying from two to four was considered adequate.
The validated list of 42 metrics, which were defined to allow an objective assessment of each criterion, is presented in Table 5 together with the reference values. Within the 42 metrics: nine are derived from the database of the Portuguese regulator [39]; five are derived from the IWA manual of best practices on performance indicators for wastewater services [34]; one was proposed by [38]; and 27 are new metrics, specifically developed herein. Among the new metrics, six are qualitative and easier to determine (list of options) and eight use variables from the ERSAR system.
Each criterion integrates between one to six metrics. These metrics were found to be adequate to evaluate the proposed criteria, taking into consideration eventual interrelations between metrics. Whenever applicable, different reference values for type A and B utilities are given. Green stands for good performance, yellow for fair performance, and red for poor performance. Publication reference is included for metrics from other assessment systems.
Due to the high number of proposed metrics, the complete descriptions and formulations are presented in Appendix A (Table A1).
3.2. Results from Testing and Validation
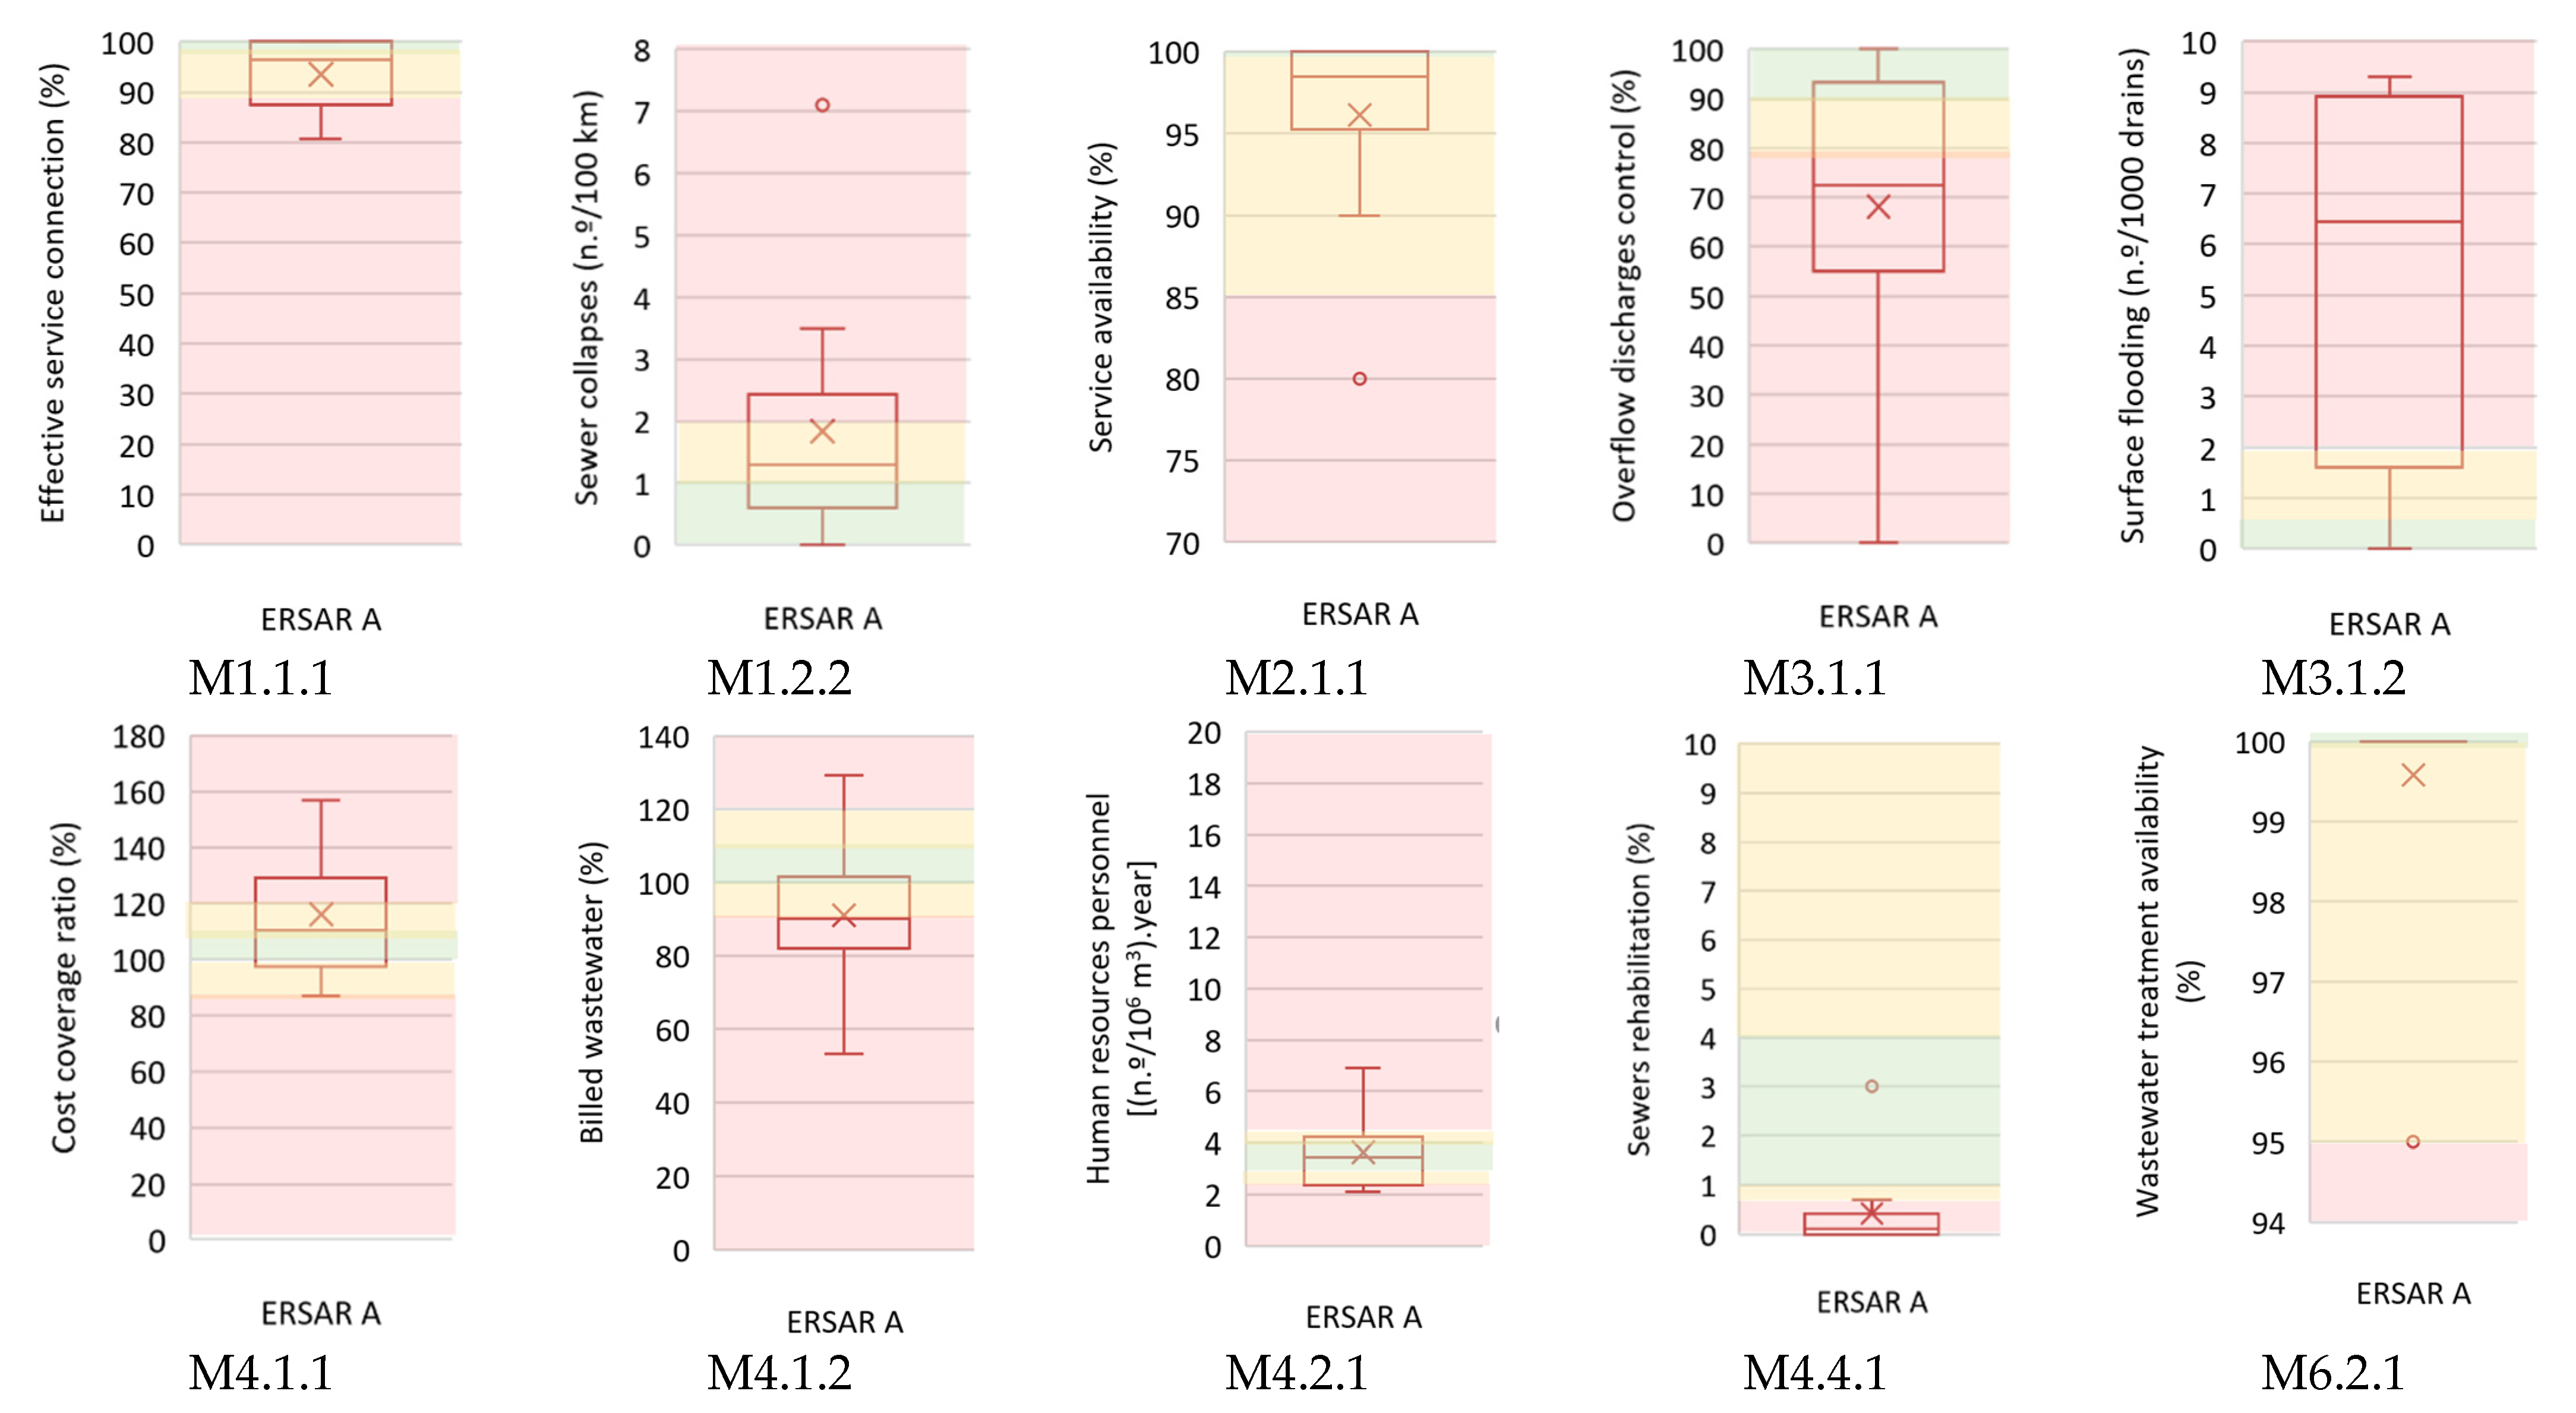
The ERSAR annual reports [29] contribute to increasing the quantity and quality of data available from all national utilities. Although designed to provide a national overview of the sector, they contribute to other areas of study. The results of the PAS testing benefit from these data. Results for the 10 metrics obtained with ERSAR data for 2018 are presented in Figure 3 and Figure 4 for type A and type B utilities, respectively. The reference ranges included in the figures are those defined by the regulator, except for M4.1.2 because this is a novel metric from this work using the regulators’ public database. Green areas stand for good performance, yellow areas for fair performance, and red areas for poor performance, according to the reference values in Table 5. At the country scale, there are wide variations in the performance; improvements in the sector are clear when looking at results for some years (not included herein).
Analysis of the results from validation shows that despite the number of metrics (42), all participating utilities had conditions to respond up to 21 metrics (50%) using available data in the utilities: 10 metrics from the ERSAR system [39]; six qualitative metrics; and five metrics from the IWA manual [34].
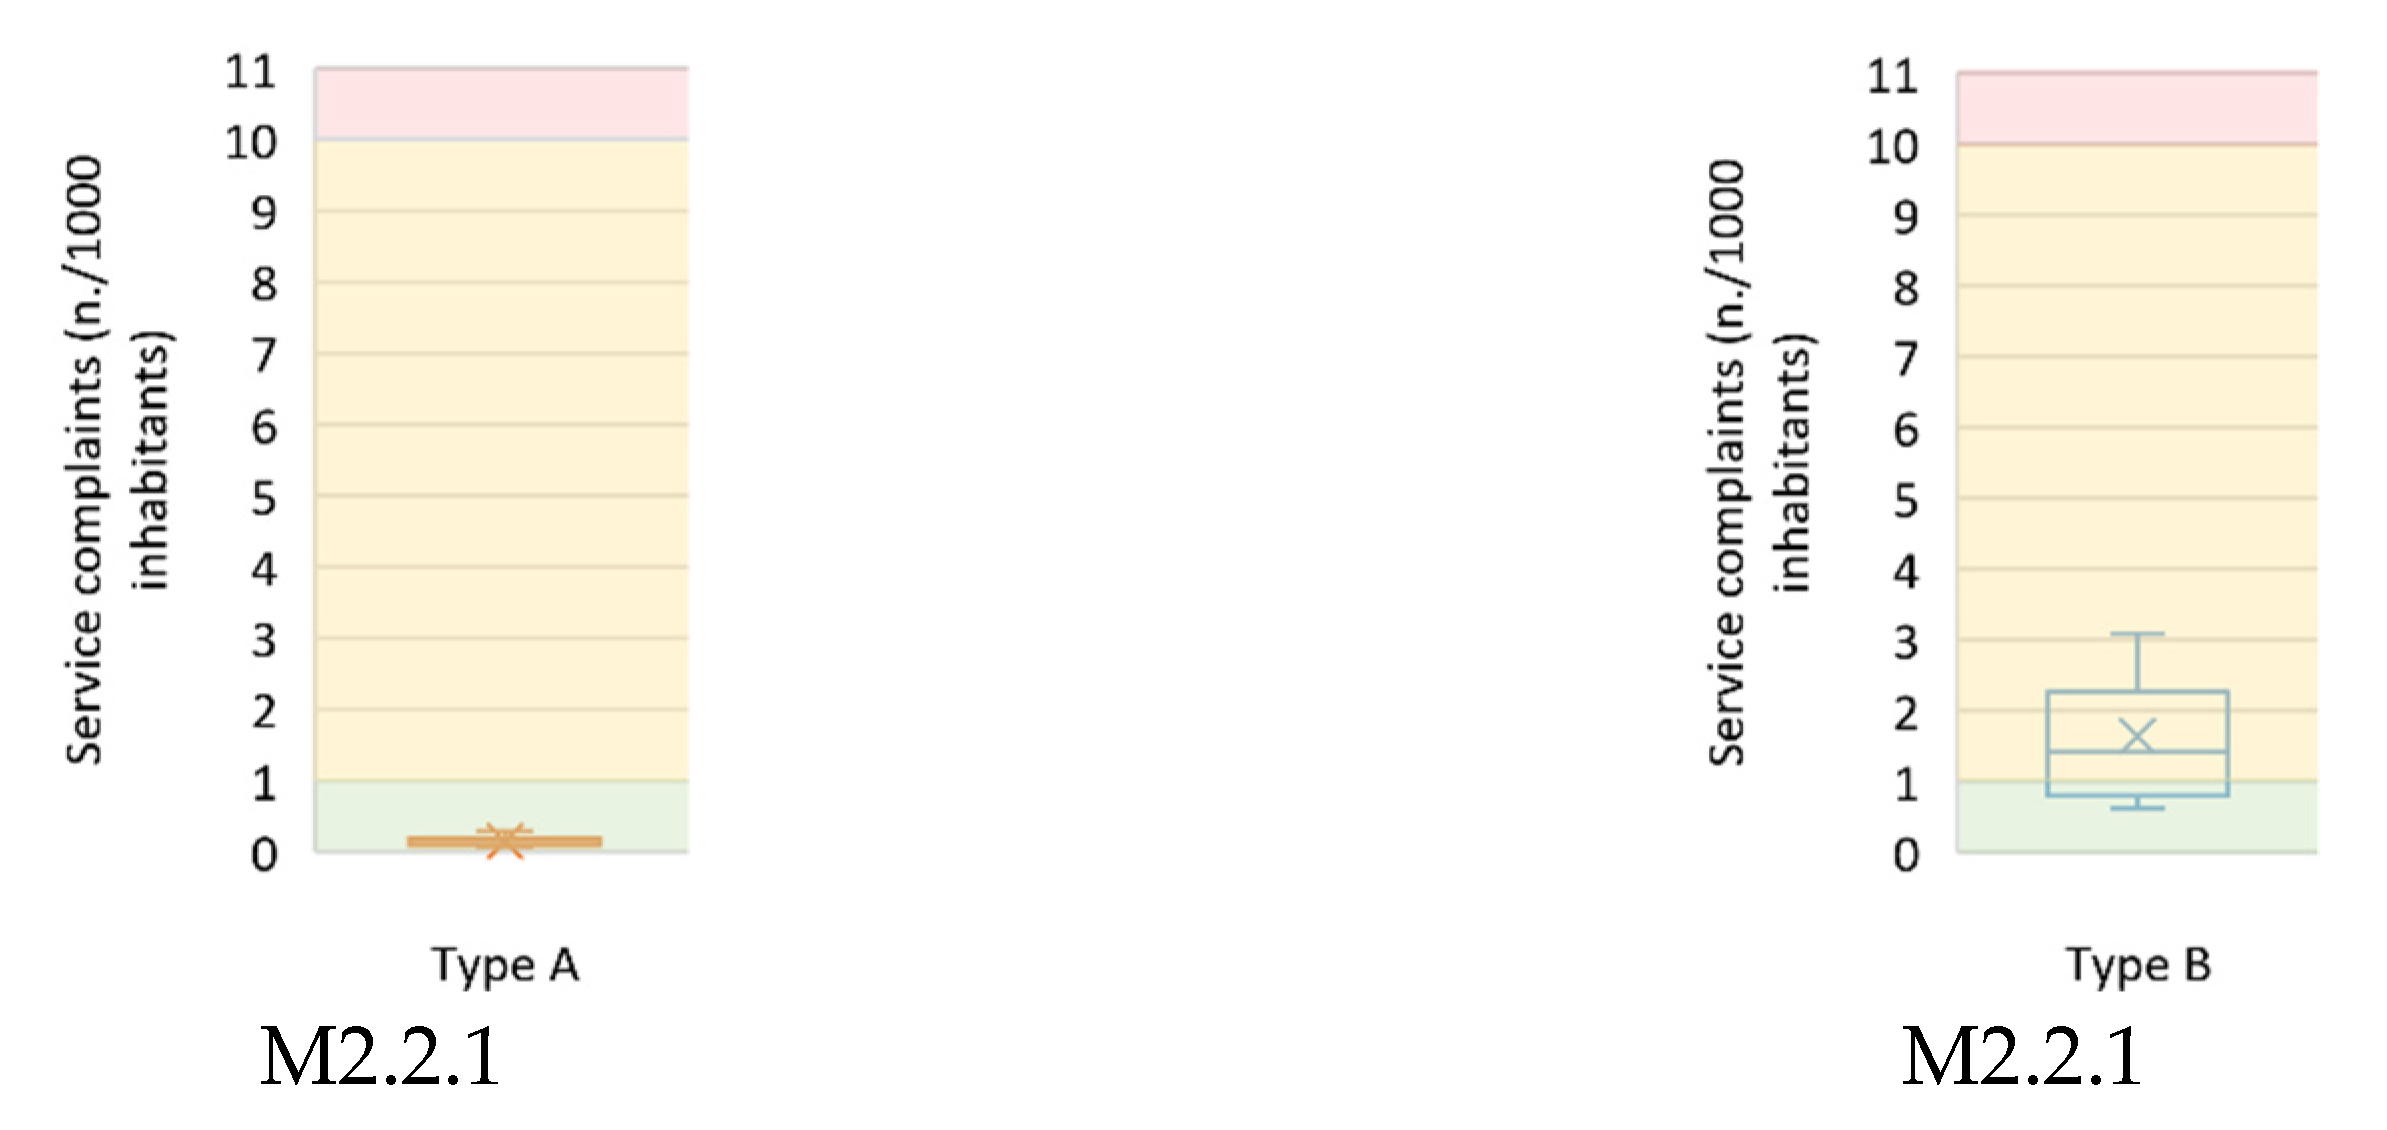
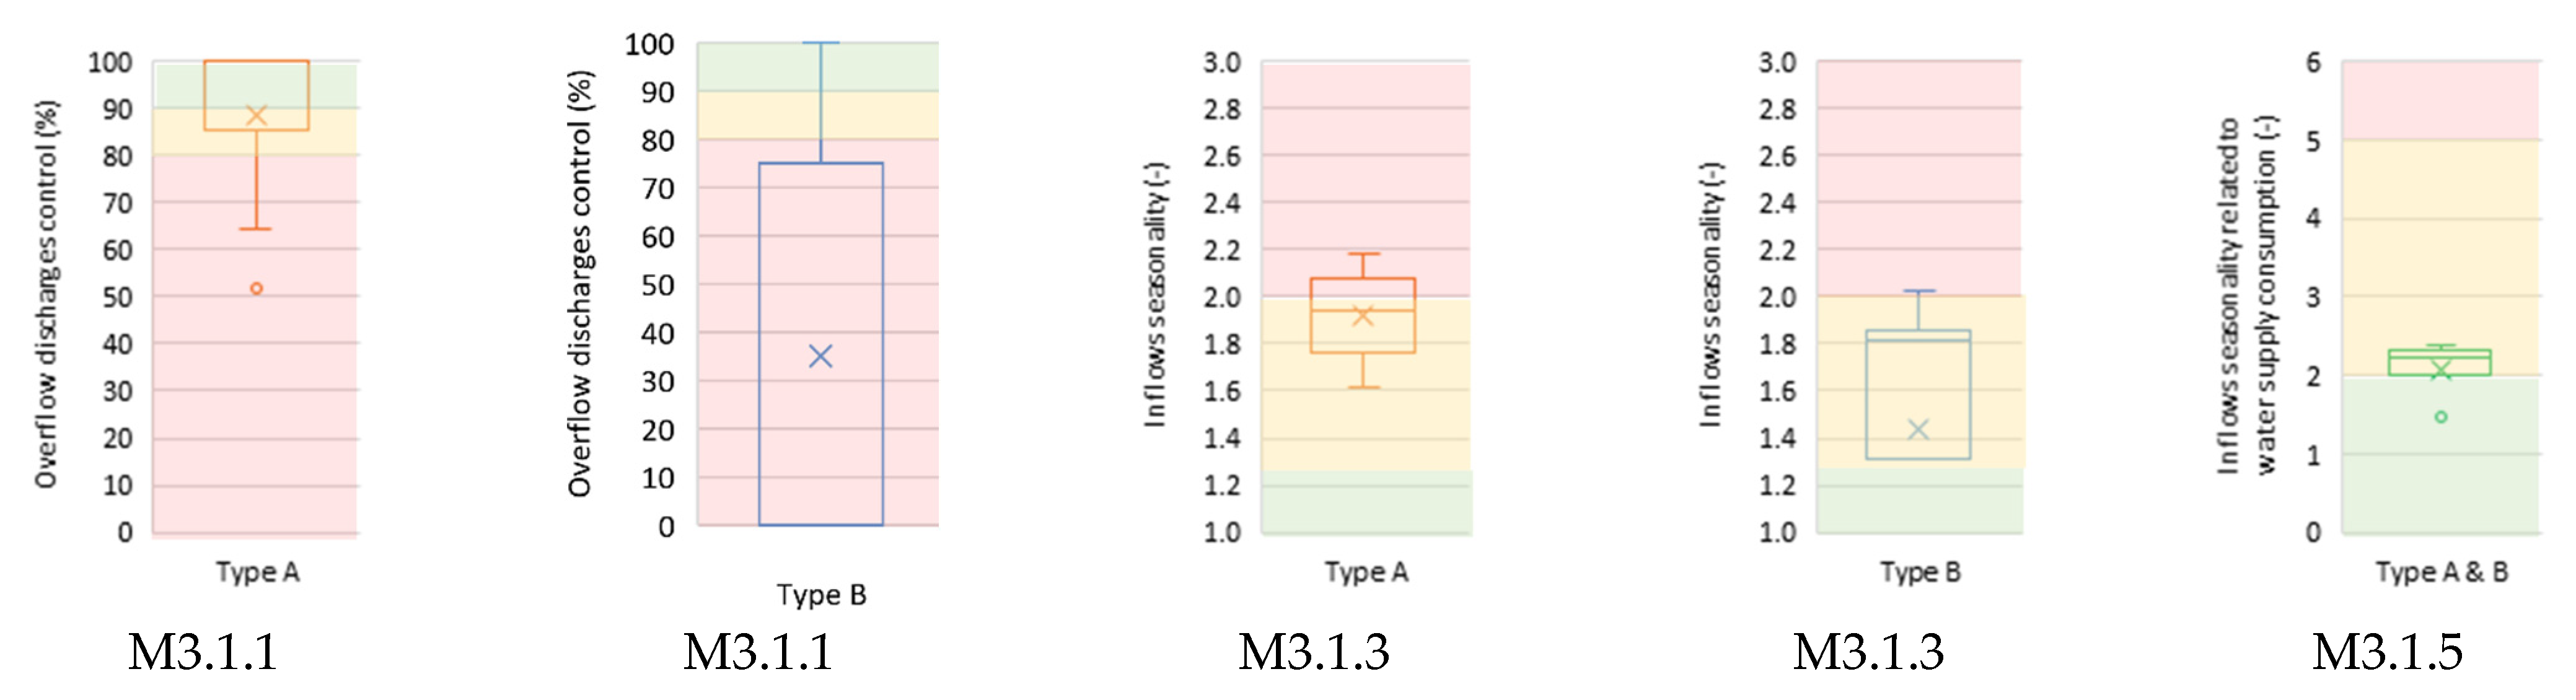
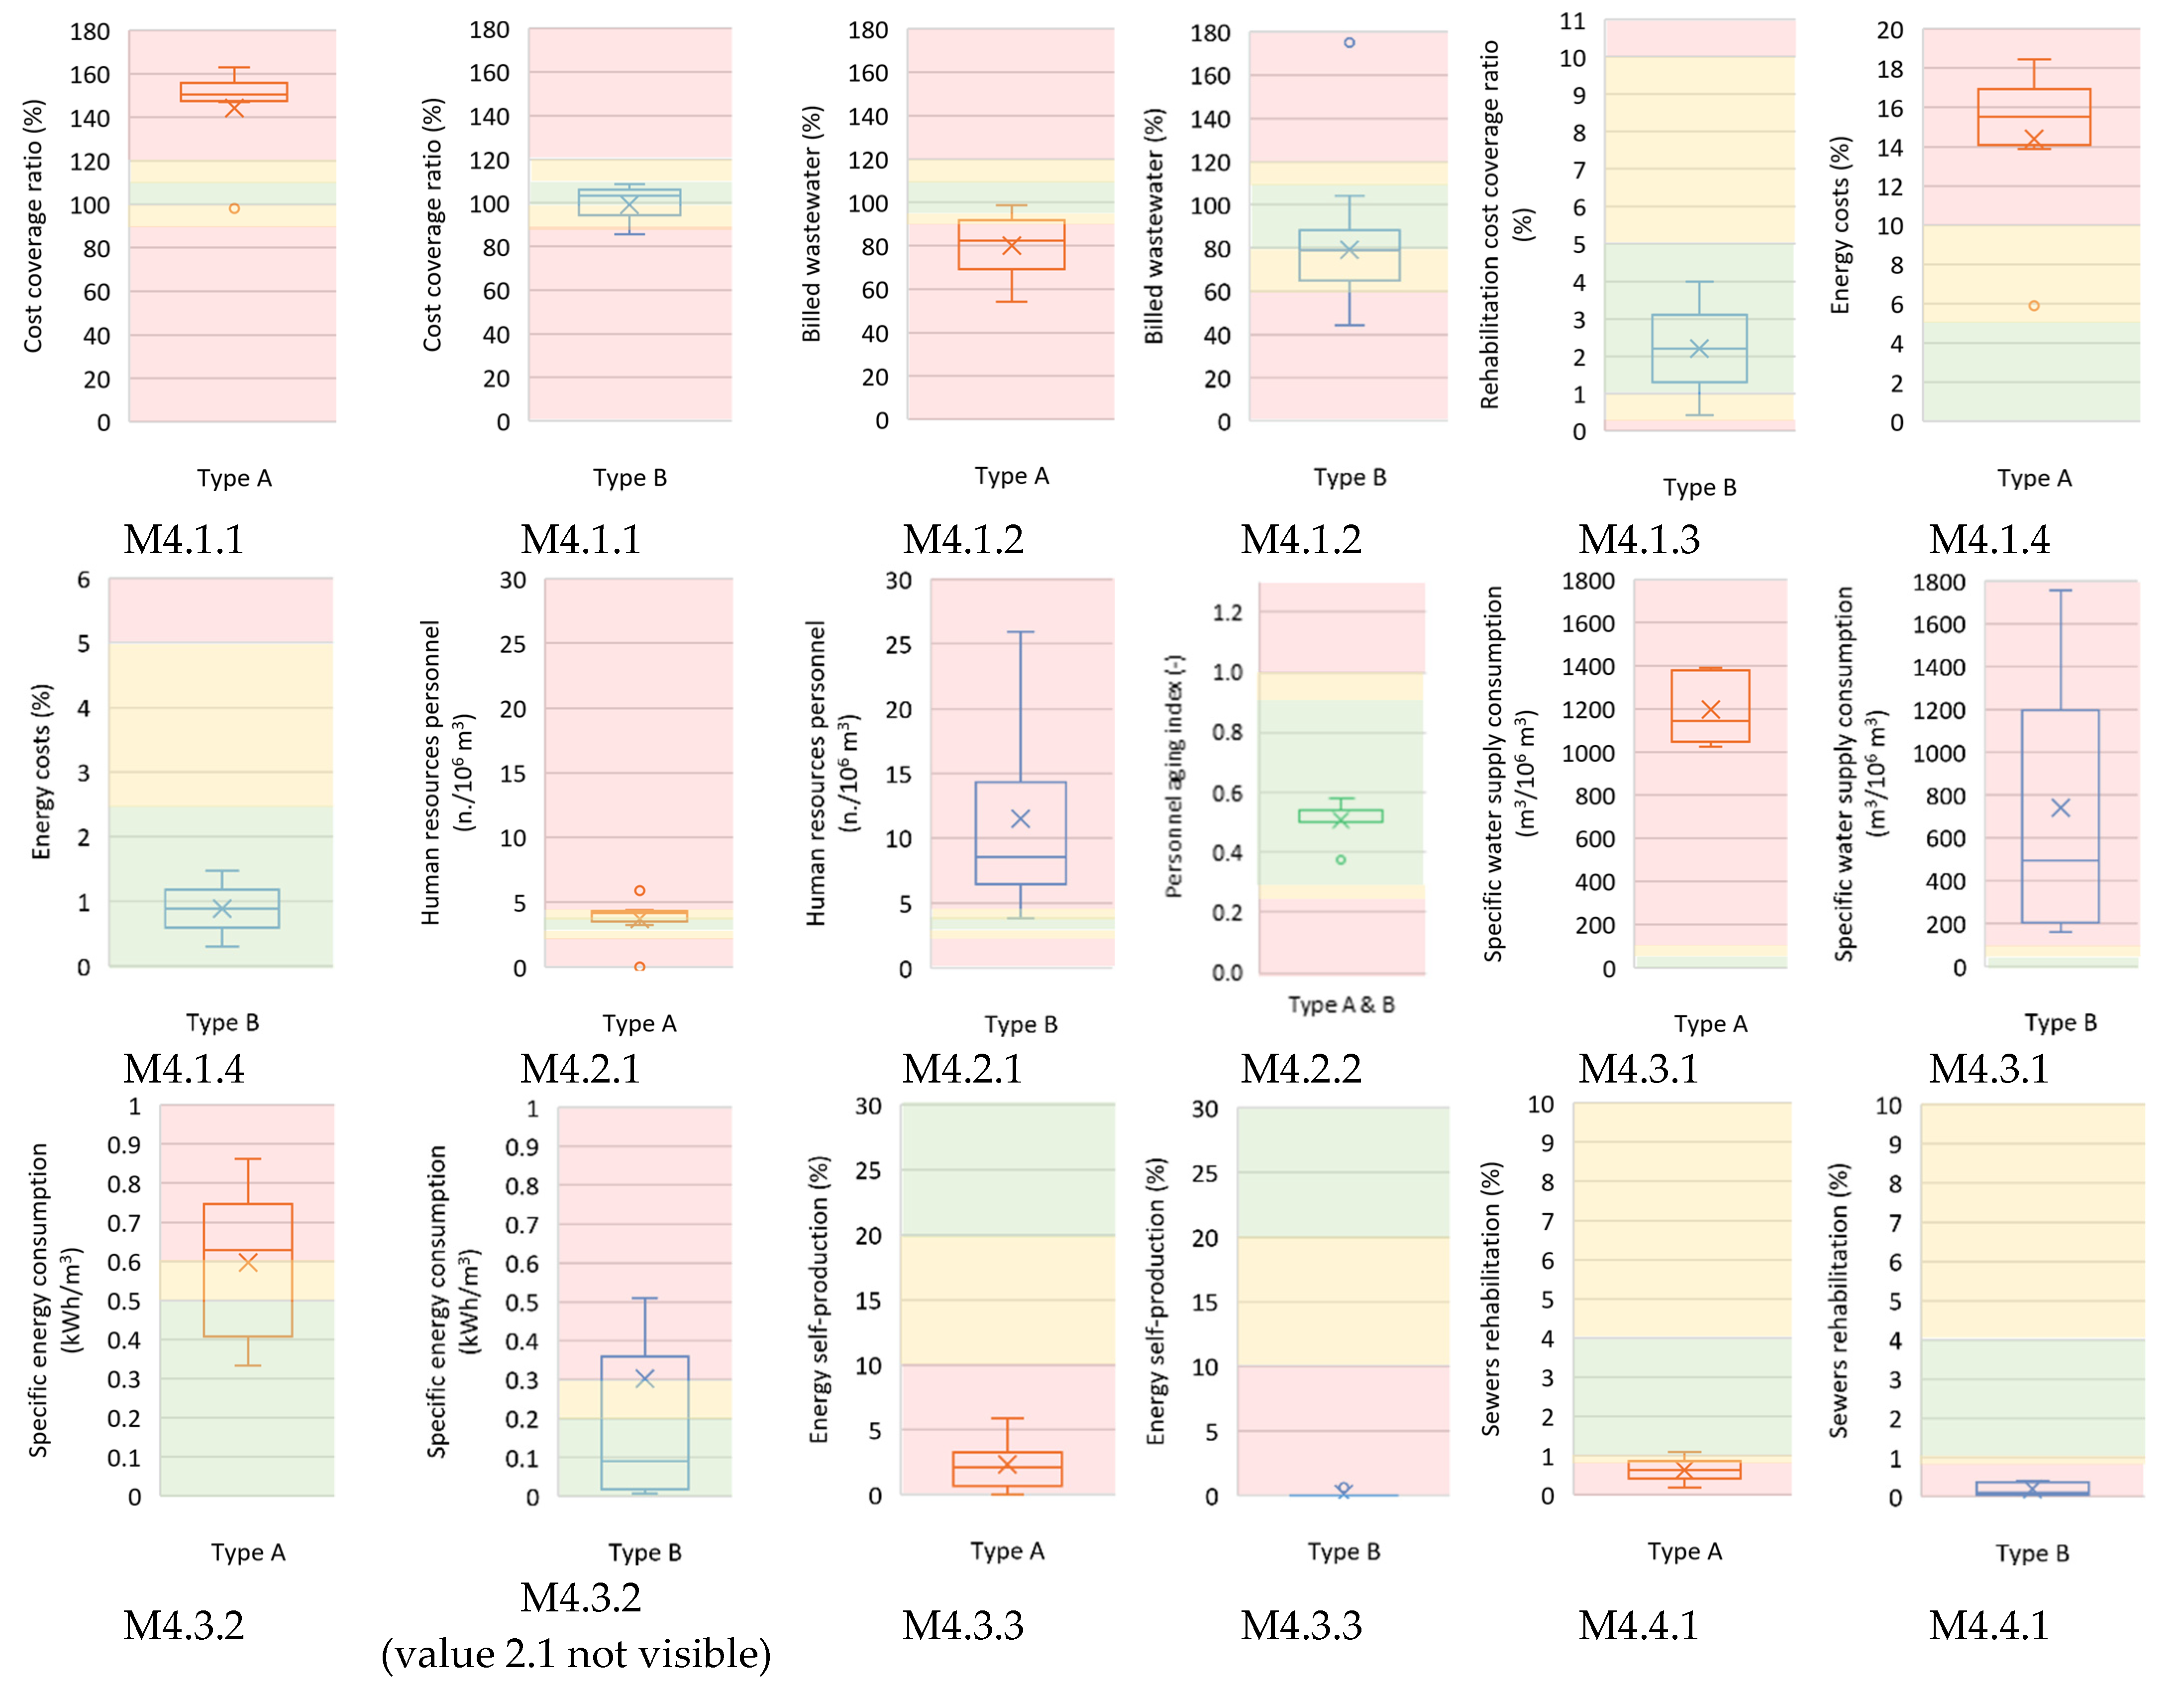
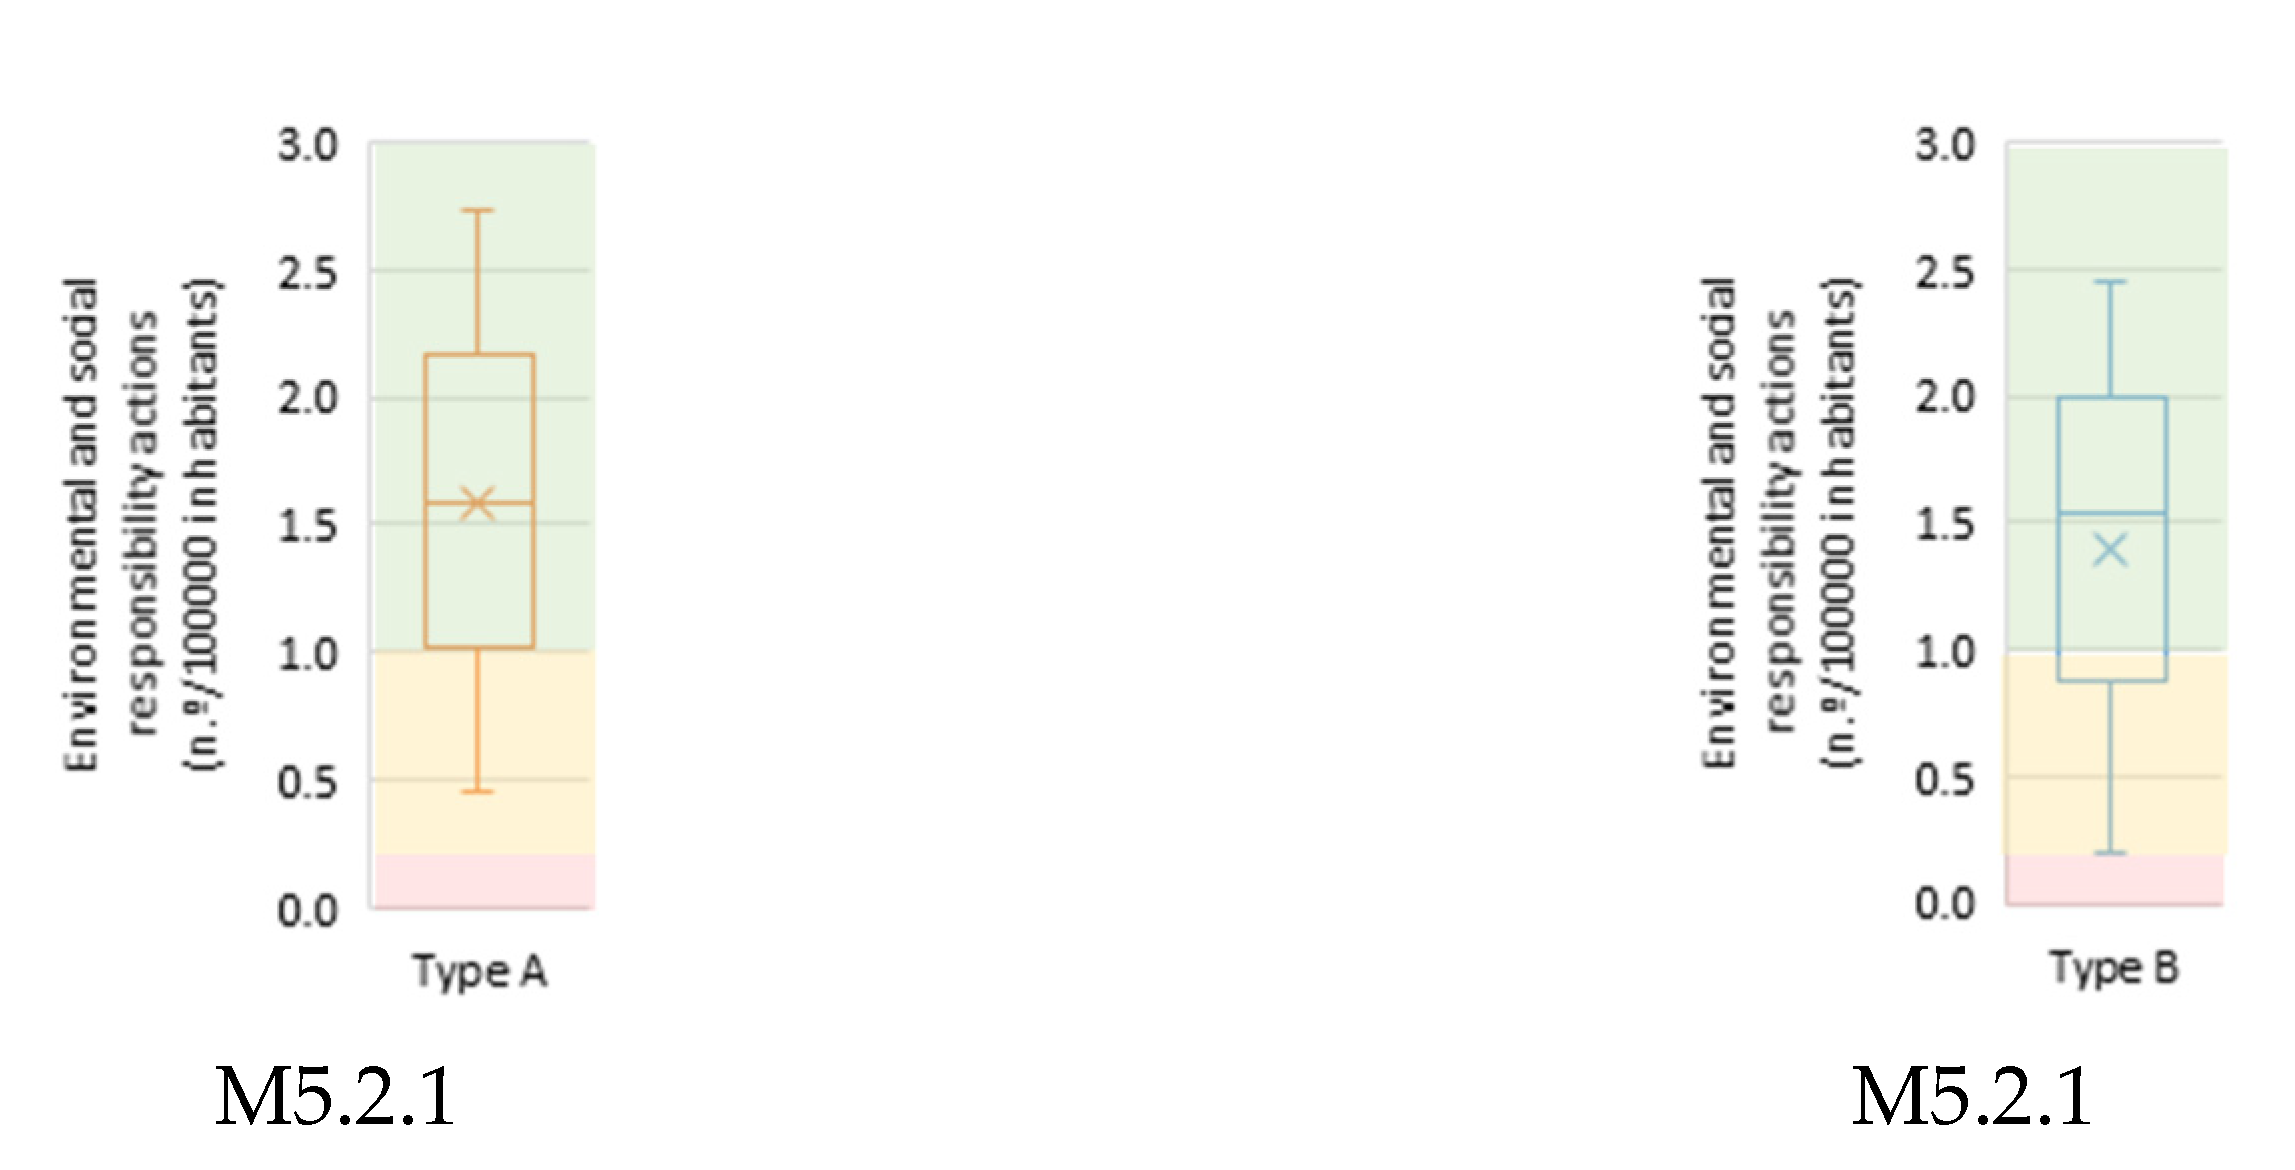
Results from the validation in nine utilities are presented in Figure 5, Figure 6, Figure 7, Figure 8, Figure 9, Figure 10 and Figure 11, one per objective. Data are mainly for 2018 and 2019, except for one utility that has data for nine metrics from 2015 to 2019. Because the number of values is low, for some metrics graphs are not included and, for others, the plots are for both utility types, and the box and whiskers plots are green. Otherwise, type A and B are represented separately, and have orange and blue box and whiskers plots, respectively. The reference ranges in the figures result from the validation step (green, yellow, and red areas stand for good, fair, and poor performance, respectively).
A few metrics do not apply to all wastewater utilities. For instance, if the utility region does not have surface waters with recreational or similar uses, M1.1.2 and M1.1.3 are not applicable. Some metrics require monthly data (M3.1.3 and M3.1.5) and data that might not be readily available (e.g., monthly water consumption for M3.1.5). Results for such metrics are not represented graphically.
For objective 1, regarding the risk to public health, the level of connections to the service (M1.1.1) throughout the country has a median close to the lower limit of good and fair performance, respectively, for type A and B utilities (Figure 3 and Figure 4). In validation the results are similar.
The results for validation are presented in Figure 5. For M1.1.2, permanent discharges, only one utility reported a significant number of households not connected because of technical complexity, and therefore is not represented graphically. For M1.1.4, knowledge about untreated discharges, only one utility has full knowledge (good); the remaining are aware of the existence of discharges but without full confirmation. Globally, risks to public health are associated with overflows because of unclear requirements and legislation. Unless monitoring is improved, and despite the extensive investments in treatment facilities, non-treated discharges to surface water remain a hazard to public health.
For public safety, both flooding and collapses (M1.2.1 and M1.2.2) are the major risk sources identified, with significant dispersion varying from poor to good results globally, both in testing and validation.
Objective 2, meeting users’ needs and expectations, indicates infrastructures are mostly available (M2.1.1 median evaluated as fair, Figure 3 and Figure 4); validation results are good for type B utilities and varies from fair to poor for type A.
Service complaints (M2.2.1, Figure 6) translate to good and fair performance for type A and B utilities, respectively. The closer relation to the user for the latter explains the differences.
In the provision of services in normal conditions and emergencies, objective 3, the continuity of service has the most common faults highlighted as problematic, with poor results for M3.1.1 (overflow discharges) and M3.1.2 (surface flooding) of the ERSAR system (Figure 3, Figure 4 and Figure 7). The exceptions are the validation results for only three type A utilities (Figure 7).
A major cause of these evaluations is the large volume of undue inflows, which remain a challenge to quantify because of the limited availability of measurements for drainage systems. To address this issue, the proposed metrics for assessing seasonality (M3.1.3 and M3.1.5) allow for some quantification of the magnitude of the problem, even if they do not consider the discharged volumes, which are typically not measured. This is an example of a set of metrics to be used depending on available information; if all are calculated, the results are helpful considering the different perspectives to understand the magnitude of the problems. The seasonality of metric inflows related to water supply consumption (M3.1.5) is more robust than metric M3.1.3 because it incorporates the fluctuations in the current population (residents and visitors).
The metric M3.1.4, exceedance inflow, requires the processing of detailed data (e.g., flow data and precipitation data with register intervals lower than 15 min). At present, most utilities do not have measurement systems for continuous flow monitoring at the entry of all treatment plants; therefore, M3.1.4 was applied only to subsystems and not to the global systems. Tests carried out with subsystem measurement, not detailed in this paper, show good potential for this metric despite underestimating the undue inflows when overflows are not measured.
Safety and emergencies management (criterion 3.2) is still an area requiring developments for most utilities participating in the validation, with only one having an implemented contingency and emergency plan. Regarding adaptation to climate change effects (criterion 3.3), efforts to develop plans are still incipient, with only one utility responding that a plan is already implemented and monitored.
In objective 4, sustainability of the utility, four complementary perspectives are used: economic and financial; human resources; efficiency in the use of resources; and infrastructural sustainability. For the first, Figure 3 and Figure 4 show that the values for metric 4.1.1 (cost coverage ratio) vary significantly from type A to type B utilities in Portugal, the former having income values over actual costs, and the latter tending to not cover the costs. For the utilities in the validation step, this is aggravated in type A, whereas type B is within a range of good and fair (Figure 8).
Results from testing for billed wastewater (M4.1.2) reveal a trend of underbilling, especially for type A utilities. In the validation, for the billed wastewater (M4.1.2), the odd values of one utility (with data for six years) dominate the statistics because there are only two more values, one per utility, in 2019. For the first utility, the result is contrary to the cost cover ratio because of contractual conditions with fixed volumes and tariffs. The two metrics allow evaluating if costs and volumes (and tariffs) are balanced.
Calculation of some metrics requires adaptations in internal procedures to ensure gathering of necessary data. This is the case for M4.1.3, M4.1.4, M4.1.5, and M4.1.6, for economic and financial sustainability criterion, and M4.3.1, M4.3.2, and M4.3.3, for the criterion on resources use efficiency. In the validation, it was possible to calculate some of these metrics for a few utilities.
The rehabilitation cost coverage ratio (M4.1.3) was only calculated for type B utilities and results tend to indicate under coverage of costs. Energy costs (M4.1.4) are higher for type A than type B utilities for the validation group; although the reference values consider the former to be more energy-intensive (because of the higher number of WWTP and pumping stations), performance is poor, showing relevant opportunities for improvement. All of the latter have an evaluation of good.
Only three utilities calculated the human resources cost metric, M4.1.5. One utility has consistent values in a good performance for the past six years; the other two have poor performance presenting quite low values. This should be analyzed together with criterion 4.2, human resources sustainability, for a broader picture.
For human resources sustainability (criterion 4.2), the M4.2.1 (human resources personnel) results for type A utilities are more consistent with ERSAR reference values, with a fair to good evaluation, both in testing and validation. For type B utilities, both groups are evaluated as poor, due to higher values per unit volume processed. In general, these reference values of ERSAR are seen as very strict to ensure all operations, especially of these utilities, even if sustained by economic criteria.
The personnel ageing index [38] is valued as important by participants because it complements M4.2.1; many utilities struggle with the ageing of the staff, endangering the sustainability of experienced staff is insufficient in the future.
In terms of resources use efficiency (criterion 4.3), all results for metrics M4.3.1, M4.3.2, and M4.3.3, which respectively relate to water consumption, energy consumption, and energy self-production, reveal a need to promote efficiency in potable water consumption, by using alternative sources, and in energy consumption and self-production. For the latter, poor performance is observed in all utilities (Figure 8, M4.3.3), with almost no investment in type B utilities. Opportunities include solar, wind, and hydropower energy with the additional benefit of contributing to the use of clean energies performance (criterion 6.3) and the ambitious European targets for the coming decades.
In the criterion on infrastructural sustainability (4.4), the three metrics cover the dimensions of performance, risk, and cost. The metrics relate to improving the infrastructure (M4.4.1, sewers rehabilitation), a proxy of risk associated with sewers failure (M4.4.2, sewers with insufficient structural condition), and the value of the infrastructure (M4.4.3, infrastructure value index). All results for metric M4.4.1 indicate a poor situation throughout the country in rehabilitation activity, which is much poorer than that recommended by the regulator. The rehabilitation costs ratio (M4.1.3) complements the perspective of the activity of M4.4.1. Metric M4.4.2 requires undertaking a visual inspection of components. Because it only applies to the inspected length, interpretation of results should consider if results represent the entire system. None of the utilities participating in validation has representative data of the whole system allowing for coding and classification. The infrastructure value index, M4.4.3, proposed by [40], represents a measure of the infrastructure maturity, reflecting the loss of value of the components with time because of deterioration. It shows investment needs in rehabilitation. Despite the interest of the regulator to apply this metric, only one utility in the validation has a result of fair.
The two metrics of objective 5 (promotion of sustainable development of the community) are key to promote governance, and participants consider the metrics to give internal and external visibility to this area. For M5.1.1 (operational plan for interventions in public space), only one utility indicated the existence of a plan; the others do not have a complete specific plan for reducing the negative impact on economic activities. Results in Figure 9 predominantly reflect a good performance, with a few on fair, for M5.2.1.
Under objective 6 (protection of the environment), aspects related to water pollution are still very dependent on qualitative information because quantification of volume, duration, and the number of untreated discharges is lacking (criterion 6.1). Knowledge about untreated discharges is insufficient because measurement devices are not in place or recommended by responsible authorities (M6.1.1). Only one utility has an implemented plan for control of untreated discharges (M6.1.2).
For wastewater treatment (criterion 6.2), type A utilities often do not have the information on the number of households and thus very few respond to the regulator (Figure 3); in the validation, the three participating utilities have results of good. For M6.2.2, all utilities in the validation have a result of good.
In terms of pollution prevention and control (criterion 6.3), the metrics on alternative water sources (M6.3.1) and on the transition to low carbon energy (M6.3.2) are valued as incentives for less proactive utilities (Figure 10). Regarding climate change mitigation and adaptation (criterion 6.4), results from validation indicate better results for type A utilities (most results as fair) than for type B (most results on poor). These differences are related to the older infrastructure and equipment, and to low data reliability, in type B utilities.
The management of occupational safety and health requirements at work (objective 7) has significant potential for improvement, especially for absenteeism (Figure 11, M7.2.1 and M7.2.2).
Utilities taking part in the validation step can be divided into two groups, depending on the previous experience of the teams’ members in using PAS, namely, to respond to the regulator or other projects. The more experienced teams calculated a higher number of metrics. The few already having a strategic plan were able to revise it, incorporating parts of the strategic PAS described in this paper.
It should be highlighted that the calculation of metrics that require more detailed data are globally less feasible in wastewater systems (compared to water supply systems) because the subsector continues to face difficulties regarding information availability and collection. Therefore, not all of the proposed metrics can be currently calculated by the wastewater utilities. However, the proposal already incorporates developments that are expected in the future, namely, the desired improvements in flow and precipitation monitoring.
4. Conclusions
A tailored PAS is an essential component of strategic management planning for water utilities, for tracking performance in alignment with its mission and strategic objectives based on reliable and up-to-date data, and to enable effective and continual improvement management.
This has been a topic of growing attention since the 1990s. Nonetheless, few studies have been undertaken on wastewater and stormwater systems. PAS reported in the literature do not fully explore relevant technical aspects for strategic management; others adopt a system focused on the infrastructure and fail to incorporate other essential management dimensions. Adopting an objective-driven approach and incorporating tactical concerns in the strategic PAS, as proposed herein, is a step forward toward aligning planning levels in the organization, from long- to short-term planning.
In the present paper, a novel PAS to support the strategic management of non-water supply urban water systems is presented. The main outcomes are the following:
- PAS development is centered on the definition of objectives, assessment criteria, and metrics (O-C-M) specifically designed for drainage systems.
- The objective-driven structure is grounded in objectives that are widely accepted in international standards. Most of the proposed metrics were developed herein, and a small number are qualitative. A considerable number of others were derived or adapted from publicly available consolidated assessment systems.
- Metrics are thoroughly complemented with reference values, validated with wastewater utilities, allowing robust diagnosis and comparisons between utilities and systems, and over time. Testing with nationwide data and a validation process involving a few utilities, in a co-creation approach, allowed for a scrutinized and robust PAS, endorsed by participating utilities.
- A holistic view of the urban water systems is provided, allowing existing interactions to be incorporated (between water supply and drainage systems, drainage systems and natural system) and several other perspectives, internal (e.g., financial or organizational) or external (e.g., social or environmental).
- Flexibility in the application is ensured, depending on the utility, the type of systems, and data availability.
The results provide a common framework for strategic assessment of wastewater utilities, allowing evaluation of performance over time and benchmarking with other utilities supported by the water utility contextual information, in addition to facilitating communication. One of the main conclusions is the applicability of a significant number of metrics to utilities and the advantage of including qualitative metrics to monitor developments and gaps in data. Such a PAS aims at facilitating the gradual adoption of novel approaches to wastewater and stormwater system management to address specific inefficiencies and improvement opportunities.
It should be highlighted that the calculation of metrics requiring more detailed data are globally less feasible in wastewater systems, because the subsector continues to face difficulties regarding information availability and collection. Therefore, although not all the proposed metrics may be currently calculated by the wastewater utilities, the PAS already incorporates developments expected in the future, namely, the unavoidable improvement in flows and precipitation monitoring.
The validated strategic PAS is a contribution to the strategic planning in wastewater utilities. Further developments in the utilities are required to improve data reliability and reduce the uncertainty in the results. Although it is not convenient to make frequent substantial changes to the strategic PAS, incorporating further advances in legal or other types of requirements is essential to ensure the adequacy of the system.
Author Contributions
Conceptualisation, investigation, methodology, M.d.C.A. and R.S.B.; Data collection and calculations, M.d.C.A., R.S.B. and C.J.; writing—original draft preparation, M.d.C.A.; writing—review and editing M.d.C.A., M.A.C., R.S.B. and C.J. All authors have read and agreed to the published version of the manuscript.
Funding
This paper received no funding.
Institutional Review Board Statement
Not applicable.
Informed Consent Statement
Not applicable.
Acknowledgments
The authors are grateful to the following Portuguese utilities for the collaboration in the validation of the PAS, in particular: Águas do Algarve, Águas do Norte, Águas da Serra, Câmara Municipal de Lisboa, Câmara Municipal do Seixal, Infralobo, INOVA and SMAS de Sintra.
Conflicts of Interest
The authors declare no conflict of interest.
Appendix A

Table A1.
Complete metrics description and formulation.
| Metric | Formulation |
|---|---|
| Objective 1|Protection of public health and safety | |
| Criterion 1.1: Risk to public health | |
| M1.1.1: Effective service connection (%) | |
| M1.1.2: Permanent discharges (nº/1000 drains) | |
| M1.1.3: Critical overflow devices (%) | |
| M1.1.4: Knowledge about untreated discharges (-) | List of options #1–Good: (i) Confirmed that does not exist by field survey; Fair: (ii) Exist with confirmation by field survey, or (iii) To the knowledge of the water utility does not exist, without full confirmation or (iv) In the knowledge of the water utility exist, without full confirmation; Poor: (v) Not enough information for evaluation. |
| Criterion 1.2: Risk to public safety | |
| M1.2.1: Surface flooding per unit served area (n./100 km2) | |
| M1.2.2: Sewer collapses (n./100 km) | |
| Objective 2|Meeting users’ needs and expectations | |
| Criterion 2.1: Service coverage and availability | |
| M2.1.1: Service availability (%) | |
| Criterion 2.2: Users satisfaction with provided service | |
| M2.2.1: Service complaints (n./1000 inhabitants) | |
| Objective 3|Provision of services under normal conditions and emergencies | |
| Criterion 3.1: Continuity of service in normal conditions and emergencies | |
| M3.1.1: Overflow discharges control (%) | |
| M3.1.2: Surface flooding (n./1000 drains) | |
| M3.1.3: Inflows seasonality (-) | |
| M3.1.4: Exceedance inflows (-) | |
| M3.1.5: Inflows seasonality related to water supply consumption (-) | |
| Criterion 3.2: Safety and emergencies management | |
| M3.2.1: Existence of contingency and emergency plans (-) | Does the water utility have contingency and emergency plans, are they being implemented and monitored?List of options #2–Good: (i) Yes; Fair: (ii) Partially. The utility has a plan; it is implemented, but not monitored or (iii) Partially. The utility has a plan, but it is not implemented, or (iv) Partially. The utility has an incomplete plan; Poor: (v) No. |
| Criterion 3.3: Adaptation to climate change effects in water utilities | |
| M3.3.1: Climate change adaptation plan (-) | Does the water utility have a climate change adaptation and mitigation plan, is it implemented and monitored?List of options #2–Good: (i) Yes; Fair: (ii) Partially. The utility has a plan; it is implemented, but not monitored or (iii) Partially. The utility has a plan, but it is not implemented, or (iv) Partially. The utility has an incomplete plan; Poor: (v) No. |
| Objective 4|Sustainability of the utility | |
| Criterion 4.1: Economic and financial sustainability | |
| M4.1.1: Cost coverage ratio (%) | |
| M4.1.2: Billed wastewater (%) | |
| M4.1.3: Rehabilitation cost coverage ratio (%) | |
| M4.1.4: Energy costs (%) | |
| M4.1.5: Human resources costs (%) | |
| M4.1.6: Indemnities costs (%) | |
| Criterion 4.2: Human resources sustainability | |
| M4.2.1: Human resources personnel (n./106 m3) | |
| M4.2.2: Personnel aging index (-) | |
| Criterion 4.3: Resources use efficiency | |
| M4.3.1: Specific water supply consumption (m3/106 m3) | |
| M4.3.2: Specific energy consumption (kWh/m3) | |
| M4.3.3: Energy self-production (%) | |
| Criterion 4.4: Infrastructural sustainability | |
| M4.4.1: Sewers rehabilitation (%) | |
| M4.4.2: Sewers with insuficient structural integrity (%) | |
| M4.4.3: Infrastructure value index (-) | |
| Objective 5|Promotion of community sustainable development | |
| Criterion 5.1: Reduction of the negative impact on economic activities | |
| M5.1.1: Operational plan for interventions in public space (-) | The water utility has an operational plan to minimize disruption of economic activities because of utility interventions in public space?List of options #2–Good: (i) Yes; Fair: (ii) Partially. The utility has a plan; it is implemented, but not monitored or (iii) Partially. The utility has a plan, but it is not implemented, or (iv) Partially. The utility has an incomplete plan; Poor: (v) No. |
| Criterion 5.2: Contribution to environmental sustainability and region socio-economic development | |
| M5.2.1: Environmental and social responsibility actions (n./105 inhabitants) | |
| Objective 6|Protection of the environment | |
| Criterion 6.1: Discharges reduction | |
| M6.1.1: Knowledge about untreated discharges (-) | List of options #1–Good: (i) Confirmed that does not exist by field survey; Fair: (ii) Exist with confirmation by field survey, or (iii) To the knowledge of the water utility does not exist, without full confirmation or (iv) In the knowledge of the water utility exist, without full confirmation; Poor: (v) Not enough information for evaluation. |
| M6.1.2: Plan for control of untreated discharges (-) | Does the water utility have a control plan for untreated discharges, is it being implemented and monitored?List of options #2–Good: (i) Yes; Fair: (ii) Partially. The utility has a plan; it is implemented, but not monitored or (iii) Partially. The utility has a plan, but it is not implemented, or (iv) Partially. The utility has an incomplete plan; Poor: (v) No. |
| Criterion 6.2: Wastewater treatment | |
| M6.2.1: Wastewater treatment availability (%) | |
| M6.2.2: Disposal of operational wastes (%) | |
| Criterion 6.3: Pollution prevention and control | |
| M6.3.1: Alternative water sources (%) | |
| M6.3.2: Transition to low carbon energy (-) | |
| Criterion 6.4: Climate change mitigation and adaptation | |
| M6.4.1: Energy consumption per population equivalent (kWh/e.p.) | |
| Objective 7|Management of occupational health and safety | |
| Criterion 7.1: Compliance with safety and health requirements at work | |
| M7.1.1: Personnel vaccination (%) | |
| M7.1.2: Personnel trained in confined spaces (%) | |
| Criterion 7.2: Hazard monitoring associated with safety and health at work | |
| M7.2.1: Work accidents (n./100 employees) | |
| M7.2.2: Absenteeism (day/100 employees) | |
References
- Ashley, R.; Hopkinson, P. Sewer systems and performance indicators into the 21st century. Urban Water 2002, 4, 123–135. [Google Scholar] [CrossRef]
- Nafi, A.; Tcheng, J.; Beau, P. Comprehensive Methodology for Overall Performance Assessment of Water Utilities. Water Resour. Manage. 2015, 29, 5429–5450. [Google Scholar] [CrossRef]
- Ganjidoost, A.; Knight, M.A.; Unger, A.J.A.; Haas, C.T. Benchmark performance indicators for utility water and wastewater pipelines infrastructure. J. Water Resour. Plan. Manag. 2018, 144, 04018003. [Google Scholar] [CrossRef]
- Molinos-Senante, M.; Donoso, G.; Sala-Garrido, R.; Villegas, A. Benchmarking the efficiency of the Chilean water and sewerage companies: A double-bootstrap approach. Environ. Sci. Pollut. Res. 2018, 25, 8432–8440. [Google Scholar] [CrossRef] [PubMed]
- Akimov, A.; Simshauser, P. Performance measurement in Australian water utilities. Current state and future directions. Aust. J. Public Adm. 2019, 79, 111–142. [Google Scholar] [CrossRef] [Green Version]
- Santos, L.F.; Galvão, A.; Cardoso, M.A. Performance indicators for urban storm water systems: A review. Water Policy 2019, 21, 221–244. [Google Scholar] [CrossRef]
- Alegre, H.; Almeida, M.C.; Covas, D.; Cardoso, M.A.; Coelho, S.T. Integrated approach for infrastructure asset management of urban water systems. In Proceedings of the International Water Association 4th Leading Edge Conference on Strategic Asset Management, Mülheim an der Ruhr, Germany, 27–30 September 2011. [Google Scholar]
- EEA. Performance of Water Utilities beyond Compliance. Sharing Knowledge Bases to Support Environmental and Resource-Efficiency Policies and Technical Improvements; EEA Technical Report No 5/2014; Publications Office of the European Union: Luxembourg, 2014; Available online: https://www.eea.europa.eu/api/SITE/publications/performance-of-water-utilities-beyond-compliance (accessed on 14 March 2021).
- EPA. Moving toward Sustainability: Sustainable and Effective Practices for Creating Your Water Utility Roadmap; Office of Wastewater Management at U.S. EPA: Washington, DC, USA, 2018. Available online: https://www.epa.gov/sites/production/files/2018-11/documents/eum_practices_roadmap_final_508-10-2018.pdf (accessed on 18 March 2021).
- van den Berg, C.; Danilenko, A. The IBNET Water Supply and Sanitation Performance Blue Book 2011: The International Benchmarking Network for Water and Sanitation Utilities Databook; The World Bank: Washington, DC, USA, 2011. [Google Scholar] [CrossRef]
- Vilanova, M.R.N.; Magalhães Filho, P.; Balestieri, J.A.P. Performance measurement and indicators for water supply management: Review and international cases. Renew. Sustain. Energy Rev. 2015, 43, 1–12. [Google Scholar] [CrossRef]
- Alegre, H.; Baptista, J.M.; Cabrera, E., Jr.; Cubillo, F.; Duarte, P.; Hirner, W.; Merkel, W.; Parena, R. Performance Indicators for Water Supply Services, 3rd ed.; Manual of Best Practice Series; IWA Publishing: London, UK, 2016; ISBN 978-178-0406-32-9. [Google Scholar]
- Burns, P.; Hope, D.; Roorda, J. Managing infrastructure for the next generation. Autom. Constr. 1999, 8, 689–703. [Google Scholar] [CrossRef]
- Baptista, J.M. The Regulation of Water and Waste Services: An Integrated Approach (Rita-Ersar); IWA Publishing: London, UK, 2014. [Google Scholar] [CrossRef]
- Burdescu, R.; van den Berg, C.; Janson, N.; Alvarado, O. A Benchmark for the Performance of State-Owned Water Utilities in the Caribbean; International Bank for Reconstruction and Development, The World Bank: Washington, DC, USA, 2020; Available online: https://openknowledge.worldbank.org/handle/10986/33251 (accessed on 14 May 2021).
- Tung, A.; Baird, K.; Schoch, H.P. Factors influencing the effectiveness of performance measurement systems. Int. J. Oper. Prod. Manag. 2011, 31, 1287–1310. [Google Scholar] [CrossRef]
- Baird, K. The effectiveness of strategic performance measurement systems. Int. J. Product. Perform. Manag. 2017, 66, 3–21. [Google Scholar] [CrossRef]
- Almeida, M.C.; Cardoso, M.A. Infrastructure Asset Management of Wastewater and Rainwater Services; Technical Guide n. 17; ERSAR, LNEC, IST: Lisbon, Portugal, 2010; ISBN 978-989-8360-05-2. (In Portuguese) [Google Scholar]
- Alegre, H.; Covas, D. Infrastructure Asset Management of Water Services; Technical Guide n. 16; ERSAR, LNEC, IST: Lisbon, Portugal, 2010; ISBN 978-989-8360-04-5. (In Portuguese) [Google Scholar]
- CEN. EN 752:2017. Drain and Sewer Systems Outside Buildings. Sewer System Management; European Committee for Standardization: Brussels, Belgium, 2017. [Google Scholar]
- ISO. ISO 24510:2007. Activities Relating to Drinking Water and Wastewater Services—Guidelines for the Assessment and for the Improvement of the Service to Users; International Organization for Standardization: Geneva, Switzerland, 2007. [Google Scholar]
- ISO. ISO 24511:2007. Activities Relating to Drinking Water and Wastewater Services—Guidelines for the Management of Wastewater Utilities and for the Assessment of Drinking Water Services; International Organization for Standardization: Geneva, Switzerland, 2007. [Google Scholar]
- ISO. ISO 24512:2007. Service Activities Relating to Drinking Water and Wastewater—Guidelines for the Management of Drinking Water Utilities and for the Assessment of Drinking Water Services; International Organization for Standardization: Geneva, Switzerland, 2007. [Google Scholar]
- Cardoso, M.A.; Coelho, S.T.; Matos, R.; Alegre, H. Performance assessment of water supply and wastewater systems. Urban Water J. 2004, 1, 55–67. [Google Scholar] [CrossRef]
- Cabrera, E.; Pardo, M.A. (Eds.) Performance Assessment of Urban Infrastructure Services: Drinking Water, Wastewater and Solid Waste; IWA Publishing: London, UK, 2008; ISBN 9781843391913. [Google Scholar]
- Cardoso, M.A. Performance Assessment of Urban Drainage Systems; LNEC Thesis and Research Series; LNEC: Lisbon, Portugal, 2008; ISBN 978-972-49-2132-7. (In Portuguese) [Google Scholar]
- Canneva, G.; Guérin-Schneider, L. National monitoring of water utility performance in France. Water Sci. Technol. Water Supply 2011, 6, 745–753. [Google Scholar] [CrossRef]
- Beceiro, P.; Galvão, A.; Brito, R.S. Resilience assessment framework for nature-based solutions in stormwater management and control: Application to cities with different resilience maturity. Sustainability 2020, 12, 10040. [Google Scholar] [CrossRef]
- ERSAR. Annual Report on Water and Waste Services in Portugal (RASARP); ERSAR: Lisbon, Portugal, 2019; Volume 1, ISBN 978-989-8360-36-6. Available online: http://www.ersar.pt/pt/publicacoes/relatorio-anual-do-setor (accessed on 15 January 2021). (In Portuguese)
- Alegre, H.; Covas, D.; Almeida, M.C. Integrated Planning of Urban Water Services: A Global Approach; TRUST Manual of Best Practice; European Comission: Brussels, Belgium, 2015; Volume 1. [Google Scholar]
- Almeida, M.C.; Cardoso, M.A.; Brito, R.S.; Beceiro, P.; Jorge, C. Approach to assess undue inflows into sewers. In Proceedings of the IWA Specialist Conference on Benchmarking and Performance Assessment, Vienna, Austria, 15–17 May 2017; Cabrera, E., Estruch, E., Eds.; IWA Benchmarking and Performance Assessment Specialist Group: London, UK, 2017; pp. 105–117. [Google Scholar]
- Cardoso, M.A.; Almeida, M.C.; Silva, M.S. Sewer asset management planning—Implementation of a structured approach in wastewater utilities. Urban Water J. 2016, 13, 15–27. [Google Scholar] [CrossRef]
- Van Aken, E.M.; Letens, G.; Coleman, G.D.; Farris, J.; Van Goubergen, D. Assessing maturity and effectiveness of enterprise performance measurement systems. Int. J. Product. Perform. Manag. 2005, 54, 400–418. [Google Scholar] [CrossRef]
- Matos, R.; Cardoso, A.; Ashley, R.; Duarte, P.; Molinari, A.; Schulz, A. Performance Indicators for Wastewater Services—Manual of Best Practices; IWA Publishing: London, UK, 2003. [Google Scholar]
- Krause, M.; Cabrera, E.; Cubillo, F.; Diaz, C.; Ducci, J. Aquarating. An International Standard for Assessing Water and Wastewater Services; IWA: London, UK; Inter-American Development Bank: Washington, DC, USA, 2018. [Google Scholar]
- AWWA. Benchmarking Performance Indicators for Water and Wastewater Utilities: 2013 Survey Data and Analyses Report; American Water Works Association: Denver, CO, USA, 2015. [Google Scholar]
- Toffol, S. Sewer System Performance Assessment—An Indicators based Methodology. Ph.D. Thesis, University of Innsbruck, Innsbruck, Austria, 2006. [Google Scholar]
- Feliciano, J.; Almeida, R.; Santos, A.; Ramalho, P.; Ganhão, A.; Covas, D.; Alegre, H. Assessing human resources renovation needs in water utilities. Water Pract. Technol. 2016, 11, 728–735. [Google Scholar] [CrossRef] [Green Version]
- LNEC; ERSAR. Guide for Assessing the Quality of Water and Waste Services Provided to Users—3rd Generation of the Assessment System; National Civil Engineering Laboratory, Water and Waste Services Regulatory Authority: Lisbon, Portugal, 2019. (In Portuguese) [Google Scholar]
- Alegre, H. Infrastructure asset management of water supply and sewer and treatment of wastewater. In Research and Postgraduate Program Presented to Obtain the Title of “Qualified for the Exercise of Scientific Research Coordination Functions”; LNEC: Lisbon, Portugal, 2008. (In Portuguese) [Google Scholar]
Figure 1.
Typical planning in IAM.


Figure 3.
Results of testing applied to data available from ERSAR report for 2018 (12 type A utilities).
Figure 3.
Results of testing applied to data available from ERSAR report for 2018 (12 type A utilities).

Figure 4.
Results of testing applied to data available from ERSAR report for 2018 (257 type B utilities).
Figure 4.
Results of testing applied to data available from ERSAR report for 2018 (257 type B utilities).

Figure 5.
Results of the validation applied to the wastewater utilities: objective 1.

Figure 6.
Results of the validation applied to the wastewater utilities: objective 2.

Figure 7.
Results of the validation applied to the wastewater utilities: objective 3.

Figure 8.
Results of the validation applied to the wastewater utilities: objective 4.

Figure 9.
Results of the validation applied to the wastewater utilities: objective 5.

Figure 10.
Results of the validation applied to the wastewater utilities: objective 6.

Figure 11.
Results of the validation applied to the wastewater utilities: objective 7.

Table 1.
Characteristics of systems used in testing.
| Type | n | Service Connections Range (n.) | Total Sewer Length Range (km) | Pumping Stations (n.) | WWTP (n.) |
|---|---|---|---|---|---|
| A | 12 | 17,489–1,127,557 | 28–1498 | 1–380 | 1–396 |
| B | 257 | 904–296,022 | 9–2545 | 0–517 | 0–59 |
Table 2.
Characteristics of systems used in validation.
| Utility/Type | Service Connections (n.) | Total Sewer Length (km) | Pumping Stations (n.) | WWTP (n.) |
|---|---|---|---|---|
| 1/A | 35,204 | 32 | 3 | 23 |
| 2/A | 311,490 | 447 | 192 | 65 |
| 3/B | 19,772 | 546 | 66 | 9 |
| 4/A | 488,725 | 1498 | 380 | 176 |
| 5/B | 55,363 | 1539 | 85 | 16 |
| 6/B | 158,303 | 977 | 26 | 16 |
| 7/B | 2220 | 55 | 2 | 0 |
| 8/B | 29,722 | 444 | 17 | 1 |
| 9/B | 75,016 | 619 | 0 | 0 |
Table 3.
Strategic objectives for wastewater utilities.
| Objective | Description |
|---|---|
| O1: Protection of public health and safety | Minimize the risk to public health and safety associated with the provided service and managed infrastructure at all life-cycle stages, including design, construction, operation, maintenance, and rehabilitation. |
| O2: Meeting users’ needs and expectations | Ensure that the activity meets the users’ needs and expectations, established rationally. |
| O3: Provision of services in normal conditions and emergencies | Ensure service continuity in the collection, transport, treatment and disposal of wastewater, stormwater, and waste, under normal operating conditions. Ensure application of actions plans prepared ahead to respond to planned or emergency service interruptions. |
| O4: Sustainability of the utility | Ensure infrastructure maintenance and capacity to meet the current and future users’ needs, including economic and financial aspects. |
| O5: Promotion of community sustainable development | Develop the activity contributing to sustainable development principles and practices in the environmental, economic, and social aspects. |
| O6: Protection of the environment | Minimize adverse impact on the environment (e.g., pollution control, conservation of natural resources and nature) during all phases of the service provision. |
| O7: Management of occupational health and safety | Promote workers’ safety and health. |
Table 4.
Strategic assessment criteria.
| Objective | Criteria | Description |
|---|---|---|
| O1: Protection of public health and safety | C1.1: Risk to public health | Ensure minimization of the risk to the health of populations from activities related to systems management |
| C1.2: Risk to public safety | Ensure minimization of the risk to the safety of populations from activities related to systems management | |
| O2: Meeting users’ needs and expectations | C2.1: Service coverage and availability | Responsibility for the geographic coverage of the services, taking reasonable measures to provide the service throughout |
| C2.2: User’s satisfaction with service provided | Ensure quality of the service provided to users according to applicable law and regulations | |
| O3: Provision of services in normal conditions and emergencies | C3.1: Service continuity in normal conditions and emergencies | Ensure service continuity to users connected to the systems available, considering climate change scenarios |
| C3.2: Safety and emergencies management | Ensure, in the event of emergencies affecting the service or the safety of users, service recovery within a reasonable time and reduction of associated risks considering climate change scenarios | |
| C3.3: Adaptation to climate change effects in utilities | Ensure planning, activities, and monitoring to increase resilience to climate change | |
| O4: Sustainability of the utility | C4.1: Economic and financial sustainability | Ensure the capacity to cover the costs of present and future activities |
| C4.2: Human resources sustainability | Ensure the adequate dimension in terms of utility human resources | |
| C4.3: Resources use efficiency | Promote sustainable use of water, energy, and other resources | |
| C4.4: Infrastructural sustainability | Ensure the structural integrity of systems and their components | |
| O5: Promotion of community sustainable development | C5.1: Reduction of the negative impact on economic activities | Ensure that systems’ management activities minimize negative effects on current or future economic activities (e.g., traffic disturbance, recreational and tourist activities) |
| C5.2: Contribution to environmental sustainability & region socio-economic development | Promote actions in the community to encourage environmental and community sustainability; contribute to the socio-economic development of the region; promote utility social responsibility | |
| O6: Protection of the environment | C6.1: Discharges reduction | Minimize untreated discharges from wastewater and stormwater systems and comply with legal discharges requirements |
| C6.2: Wastewater treatment | Efficiently treat wastewater before discharge into the environment. Ensure proper disposal of sludge and other wastes | |
| C6.3: Pollution prevention and control | Minimize negative environmental effects from the utility activity | |
| C6.4: Climate change mitigation and adaptation | Ensure planning, activities, and monitoring to reduce the contribution to climate change | |
| O7: Management of occupational health and safety | C7.1: Compliance with safety and health requirements at work | Ensure compliance with safety and health at work requirements to minimize risks to workers |
| C7.2: Hazard monitoring for safety and health at work | Monitor the risk associated with safety and health at work |
Table 5.
Complete PAS with O-C-M-RV.
| Metric | Reference Values (Good; Fair; Poor) |
|---|---|
| Objective 1|Protection of public health and safety | |
| Criterion 1.1: Risk to public health | |
| M1.1.1: Effective service connection (%) [39] | A:100; [90, 100[; [0, 90[; B: [95, 100]; [90, 95[; [0, 90[ |
| M1.1.2: Permanent discharges (n./1000 drains) | 0; ]0, 5]; ]5, +∞[ |
| M1.1.3: Critical overflow devices (%) | 0; ]0, 10]; ]10,100[ |
| M1.1.4: Knowledge about untreated discharges (-) | #1i); #1ii) or #1iii) or #1iv); #1v) (1) |
| Criterion 1.2: Risk to public safety | |
| M1.2.1: Surface flooding per unit served area (n./100 km2) | [0, 5[; [5, 20]; ]20, +∞[ |
| M1.2.2: Sewer collapses (n./100 km) [39] | A: 0; ]0, 1]; ]1, +∞[; B: 0; ]0, 2]; ]2, +∞[ |
| Objective 2|Meeting users’ needs and expectations | |
| Criterion 2.1: Service coverage and availability | |
| M2.1.1: Service availability (%) [39] | A: 100; [85, 100[; [0, 85[; B: [90, 100]; [80, 90[; [0, 80[ |
| Criterion 2.2: Users’ satisfaction with provided service | |
| M2.2.1: Service complaints (n./1000 inhabitants) [34] | [0, 1]; ]1, 10]; ]10, +∞[ |
| Objective 3|Provision of services in normal conditions and emergencies | |
| Criterion 3.1: Continuity of service in normal conditions and emergencies | |
| M3.1.1: Overflow discharges control (%) [39] | ]90, 100]; ]80, 90]; [0, 80] |
| M3.1.2: Surface flooding (n./1000 drains) [39] | A: [0, 0.5[; [0.5, 2.0[; [2.0, +∞[; B: [0, 0.25[; [0.25, 1.0[; [1.0, +∞[ |
| M3.1.3: Inflows seasonality (-) | [1, 1.25[; [1.25, 2.0[; [2.0, +∞[ |
| M3.1.4: Exceedance inflows (-) | [0, 2.0[; [2.0, 5.0[; [5.0, +∞[ |
| M3.1.5: Inflows seasonality related to water supply consumption (-) | [0, 1.5[; [1.5, 3.0[; [3.0, +∞[ |
| Criterion 3.2: Safety and emergencies management | |
| M3.2.1: Existence of contingency and emergency plans (-) | #2i); #2ii) or #2iii) or #2iv); #2v) (2) |
| Criterion 3.3: Adaptation to climate change effects in utilities | |
| M3.3.1: Climate change adaptation plan (-) | #2i); #2ii) or #2iii) or #2iv); #2v) (2) |
| Objective 4|Sustainability of the utility | |
| Criterion 4.1: Economic and financial sustainability | |
| M4.1.1: Cost coverage ratio (%) [39] | [100, 110]; [90, 100[ or ]110, 120]; [0, 90[ or ]120, +∞[ |
| M4.1.2: Billed wastewater (%) | A: [95, 110]; [90, 95[ or ]110, 120]; [0, 90[ or ]120, +∞[ B: [80, 110]; [60, 80[ or ]110, 120]; [0, 60[ or ]120, +∞[ |
| M4.1.3: Rehabilitation cost coverage ratio (%) | [1, 5]; [0.25, 1[ or ]5, 10]; [0, 0.25[ or ]10, +∞[ |
| M4.1.4: Energy costs (%) | A: [0, 5]; ]5, 10]; ]10, 100]; B: [0, 2.5]; ]2.5, 5]; ]5, 100] |
| M4.1.5: Human resources costs (%) | [20, 30]; [10, 20[ or ]30, 40]; [0, 10[ or ]40, 100] |
| M4.1.6: Indemnities costs (%) | 0; ]0, 1.0]; ]1.0, 100] |
| Criterion 4.2: Human resources sustainability | |
| M4.2.1: Human resources personnel (n./106 m3) [39] | A: [3.0, 4.0]; [2.5, 3[ or ]4, 4.5]; [0, 2.5[ or ]4.5, +∞[ B:[5.0, 10.0]; [2.5, 5[ or ]10, 12.5]; [0, 2.5[ or ]12.5, +∞[ |
| M4.2.2: Personnel ageing index (-) [38] | [0.32, 0.94]; [0.26, 0.32[ or ]0.94, 1.0]; [0, 0.26[ or ]1.0, 1.26] |
| Criterion 4.3: Resources use efficiency | |
| M4.3.1: Specific water supply consumption (m3/106 m3) | [0, 50]; ]50, 100]; ]100, +∞[ |
| M4.3.2: Specific energy consumption (kWh/m3) | A: [0, 0.5]; ]0.5, 0.6]; ]0.6, +∞[; B: [0, 0.2]; ]0.2, 0.3]; ]0.3, +∞[ |
| M4.3.3: Energy self-production (%) | [20, 100]; [10, 20[; [0, 10[ |
| Criterion 4.4: Infrastructural sustainability | |
| M4.4.1: Sewers rehabilitation (%) [39] | [1.0, 4.0]; [0.8, 1.0[ or ]4.0, 20.0[; [0, 0.8[ or [20, +∞[ |
| M4.4.2: Sewers with insufficient structural integrity (%) | [0, 1]; ]1, 10]; ]10, 100] |
| M4.4.3: Infrastructure value index (-) [40] | [0.4, 0.6]; [0.2, 0.4[; or ]0.6, 0.8]; [0, 0.2[ or ]0.8, 1.0] |
| Objective 5|Promotion of community sustainable development | |
| Criterion 5.1: Reduction of the negative impact on economic activities | |
| M5.1.1: Operational plan for interventions in public space (-) | #2i); #2ii) or #2iii) or #2iv); #2v) (2) |
| Criterion 5.2: Contribution to environmental sustainability and region socio-economic development | |
| M5.2.1: Environmental and social responsibility actions (n./100,000 inhabitants) | [1, +∞[; [0.2, 1.0[; [0, 0.2[ |
| Objective 6|Protection of the environment | |
| Criterion 6.1: Discharges reduction | |
| M6.1.1: Knowledge about untreated discharges (-) | #1i); #1ii) or #1iii) or #1iv); #1v) (1) |
| M6.1.2: Plan for control of untreated discharges (-) | #2i); #2ii) or #2iii) or #2iv); #2v)(2) |
| Criterion 6.2: Wastewater treatment | |
| M6.2.1: Wastewater treatment availability (%) [39] | 100; [95, 100[; [0, 95[ |
| M6.2.2: Disposal of operational wastes (%) | 100; [95, 100[; [0, 95[ |
| Criterion 6.3: Pollution prevention and control | |
| M6.3.1: Alternative water sources (%) | [75, 100]; [30, 75[; [0, 30[ |
| M6.3.2: Transition to low carbon energy (-) | A: [90, 100]; [80, 90[; [0, 80[; B: [80, 100]; [70, 80[; [0, 70[ |
| Criterion 6.4: Climate change mitigation and adaptation | |
| M6.4.1: Energy consumption per population equivalent (kWh/e.p.) | A: [0, 30]; ]30, 50]; ]50, +∞[; B: [0, 20]; ]20, 60]; ]60, +∞[ |
| Objective 7|Management of occupational health and safety | |
| Criterion 7.1: Compliance with safety and health requirements at work | |
| M7.1.1: Personnel vaccination (%) [34] | [95, 100]; [90, 95[; [0, 90[ |
| M7.1.2: Personnel trained in confined spaces (%) [34] | [80, 100]; [40, 80[; [0, 40[ |
| Criterion 7.2: Hazard monitoring associated with safety and health at work | |
| M7.2.1: Work accidents (n./100 employees) [34] | [0, 10]; ]10, 30]; ]30, +∞[ |
| M7.2.2: Absenteeism (n./100 employees) [34] | [0, 10]; ]10, 30]; ]30, +∞[ |
| (1) List of options #1—Good: (i) Confirmed that does not exist by field survey; Fair: (ii) Exist with confirmation by field survey, or (iii) To the knowledge of the water utility does not exist, without full confirmation or (iv) In the knowledge of the water utility exist, without full confirmation; Poor: (v) Not enough information for evaluation. (2) List of options #2—Good: (i) Yes; Fair: (ii) Partially. The utility has a plan; it is implemented, but not monitored or (iii) Partially. The utility has a plan, but it is not implemented, or (iv) Partially. The utility has an incomplete plan; Poor: (v) No. | |
Publisher’s Note: MDPI stays neutral with regard to jurisdictional claims in published maps and institutional affiliations. |
© 2021 by the authors. Licensee MDPI, Basel, Switzerland. This article is an open access article distributed under the terms and conditions of the Creative Commons Attribution (CC BY) license (https://creativecommons.org/licenses/by/4.0/).
Share and Cite
MDPI and ACS Style
Almeida, M.d.C.; Brito, R.S.; Jorge, C.; Cardoso, M.A. Performance Assessment System to Wastewater Utilities Strategic Planning. Water 2021, 13, 2489. https://doi.org/10.3390/w13182489
AMA Style
Almeida MdC, Brito RS, Jorge C, Cardoso MA. Performance Assessment System to Wastewater Utilities Strategic Planning. Water. 2021; 13(18):2489. https://doi.org/10.3390/w13182489
Chicago/Turabian StyleAlmeida, Maria do Céu, Rita Salgado Brito, Catarina Jorge, and Maria Adriana Cardoso. 2021. "Performance Assessment System to Wastewater Utilities Strategic Planning" Water 13, no. 18: 2489. https://doi.org/10.3390/w13182489
Note that from the first issue of 2016, this journal uses article numbers instead of page numbers. See further details here.