Article

Spatiotemporal Variation of Water Supply and Demand Balance under Drought Risk and Its Relationship with Maize Yield: A Case Study in Midwestern Jilin Province, China

1
School of Environment, Northeast Normal University, Changchun 130024, China
2
State Environmental Protection Key Laboratory of Wetland Ecology and Vegetation Restoration, Northeast Normal University, Changchun 130024, China
3
Key Laboratory for Vegetation Ecology, Ministry of Education, Changchun 130024, China
4
School of Horticulture, Jilin Agricultural University, No. 2888 Xincheng Street, Nanguan, Changchun 130117, China
5
College of Urban and Environmental Sciences, Changchun Normal University, Changchun 130032, China
*
Author to whom correspondence should be addressed.
Water 2021, 13(18), 2490; https://doi.org/10.3390/w13182490
Submission received: 10 August 2021 / Revised: 1 September 2021 / Accepted: 6 September 2021 / Published: 10 September 2021
(This article belongs to the Special Issue Optimization of Water Use in Agricultural Systems)

Abstract

:
Under the background of global warming, the frequent occurrence and long-term persistence of drought events have substantial negative effects on agricultural production. As the main maize production area in midwestern Jilin Province, frequent drought and a shortage of irrigation water pose substantial threats to the production of maize. We analyzed the balance of water supply and demand in each growth period and the degree of maize yield affected by drought. The results indicate that the FIO-ESM climate model can effectively simulate the changes in temperature and precipitation, and was highly applicable to the study area. From 1980 to 2020, the drought risk indices for the sowing to jointing, jointing to tasseling, tasseling to milk-ripe, and milk-ripe to maturity stages were 0.62, 0.52, 0.48, and 0.60, respectively. In the future, the chances of a RCP8.5 scenario drought risk and an enhanced RCP4.5 scenario have eased. Spatially, the high-risk areas shift in a “west−central−southwest” pattern. Effective precipitation will decrease in the future, while the increasing water requirement of maize increases the dependence on irrigation water. The irrigation requirement index is more than 70% for all periods, particularly in the milk-ripe to maturity stage. The relative meteorological yields were positively correlated with the CWDI of the whole growth period, with the rate of reduction in maize yield and the yield reduction coefficient of variation at a high level of risk between 1980 and 2020. In the future, the negative impact of drought risk on the yield of maize lessened with no obvious trend in production. In particular, the rate of reduction and reduction coefficient of variation for the RCP8.5 scenario were 1.24 and 1.09, respectively.

1. Introduction

According to the Fifth Assessment Report of the United Nations Intergovernmental Panel on Climate Change [1], global climate change, dominated by warming, has accelerated the global water cycle over the previous century owing to surging population pressure and changes in the natural environment [2,3]. Not only does it increase the occurrence of extreme hydrological events and the risk of flood and drought disasters [4,5], it also leads to a redistribution of water resources at different scales [6,7]. Changes in precipitation and soil moisture content, a higher temperature, and greater evapotranspiration will have a significant impact on the demand for agricultural irrigation [8,9]. The resulting water scarcity is a major threat to global food security and is a constraint on sustainable agricultural development [10,11,12]. The main factor that limits agricultural production in China, a large agricultural country, is water, as approximately 70% of the country’s grain depends on agricultural irrigation.
Irrigated agriculture is of substantial importance to agricultural development in China [13], and the ongoing research on the impact of climate change on agricultural water use has become a topical issue [14,15,16,17]. Approximately 80% of China’s arable land is located north of the Yangtze River [18], where natural precipitation has trouble meeting the demands for crop growth in both time and quantity [19,20]. Northeast China, as the main grain producing area of the country, also faces this situation. Moreover, owing to the complex geographical and geomorphological features in the middle and high latitudes of northeast China, the amount of heat and precipitation are affected by the East Asian continental monsoon climate, and the spatial distribution is uneven. In recent years, northeast China has frequently been subjected to droughts, which is expected to increase in the future [21,22,23]. Crop phenology, irrigation requirements, and yields will change as a result of drought risk [24,25]. Therefore, it is necessary to actively explore the supply and demand of crop water in arid and semiarid areas, develop water-saving irrigation strategies, and improve irrigation efficiency so as to manage the challenges of irrigated agriculture under future climate change.
Maize (Zea mays L.) is the largest food crop in China. As a basic crop, it plays a pivotal role in food and feed processing, and in the production of industrial raw materials and other fields in China [26]. Midwestern Jilin Province, the center of the “Golden Corn Belt” in Northeast China, primarily grows mid-late ripening varieties once a year [27]. In 2019, the sown area and yield of maize in Jilin Province were 4.22 × 10⁴ km2 and 3.05 × 10⁷ t, respectively, comprising 10.22% and 11.68% of the national maize area sown, respectively, and 11.68% of production (National Bureau of Statistics of the People’s Republic of China, 2020). Jilin Province plays an indispensable role and has an important responsibility in the domestic maize industry [28]. In recent years, the climate in Jilin Province has generally been warming and drying [29,30]. The frequency and intensity of droughts are increasing, and the losses caused by droughts are increasing yearly [31]. Climate change exacerbates the risk of drought, with implications for the balance and supply of water for maize [32,33,34].
As a continuous system, the soil-plant-atmosphere continuum (SPAC) ensures the water cycle that is required for crop growth (Figure 1). Precipitation, as the main source of water in the system, is an important material basis to maintain the growth of maize [35,36]. However, only part of the effective precipitation can be used by maize during the process of precipitation. It is absorbed by the roots of plants through the soil, enters the stem, and diffuses through leaf transpiration [37]. When effective precipitation cannot meet the water requirements of plant transpiration and soil evaporation, maize is in a water deficit [38,39]. Severe water stress will adversely affect the yield of maize during any period of growth [40,41,42].
Zhang et al. constructed a dynamic drought risk assessment (DDRA) model of maize for different growth periods based on risk assessment theory [43]. The risk of drought for the emergence-tasseling stage was found to have increased during the period from 1981 to 2014. Guo et al. found that drought during the milking stage of maize in the Songliao Plain played a decisive role in the final yield [44]. Studies of the relationship between drought risk and maize yield have been fruitful [24]. However, relatively few studies have been conducted on the balance of water supply and demand at different growth periods of maize based on drought risk. Timely supplemental irrigation can be used to alleviate the negative impact of drought. Irrigation strategies are adapted to suit the water requirements of maize at different periods of growth so as to conserve irrigation water to ensure the final yield and quality [45].
Our aims included the following: (1) To analyze the changes in climate characteristics in midwestern Jilin Province from 1980 to 2020. The optimal model was selected from the 33 climate models published by the Coupled Model Intercomparison Program 5 (CMIP5) for a future period (2041–2071). (2) To analyze the spatial and temporal distribution of drought risk during different growth periods on maize in the study area. Based on this background, the changes in water supply and demand balance and the irrigation requirement index (IRI) of maize were discussed. (3) Equations that fit the relative meteorological yield of maize to the crop water deficit index (CWDI) were developed to predict the yield of maize under different future scenarios. The meteorological yield reduction rate and the coefficient of variation of meteorological yield reduction were then used to evaluate maize disasters. (4) The results can provide a reference for sustainable agricultural development under the background of drought risk and water shortage. It has both theoretical and practical implications for specifying rational irrigation systems and improving the efficiency of irrigation.
This paper is divided into four main sections. It begins with an introduction, which presents the purpose of the study through an analysis of the research context. This is followed by a detailed presentation of the data and research methodology in the second part. The third part of the results and discussion focuses on the following four elements: options for future climate models, spatial and temporal distribution of current and future droughts in the study area, maize water supply and demand balance at different periods, and quantifying the effects of drought on maize yields at different times. The fourth part is the conclusion.

2. Materials and Methods
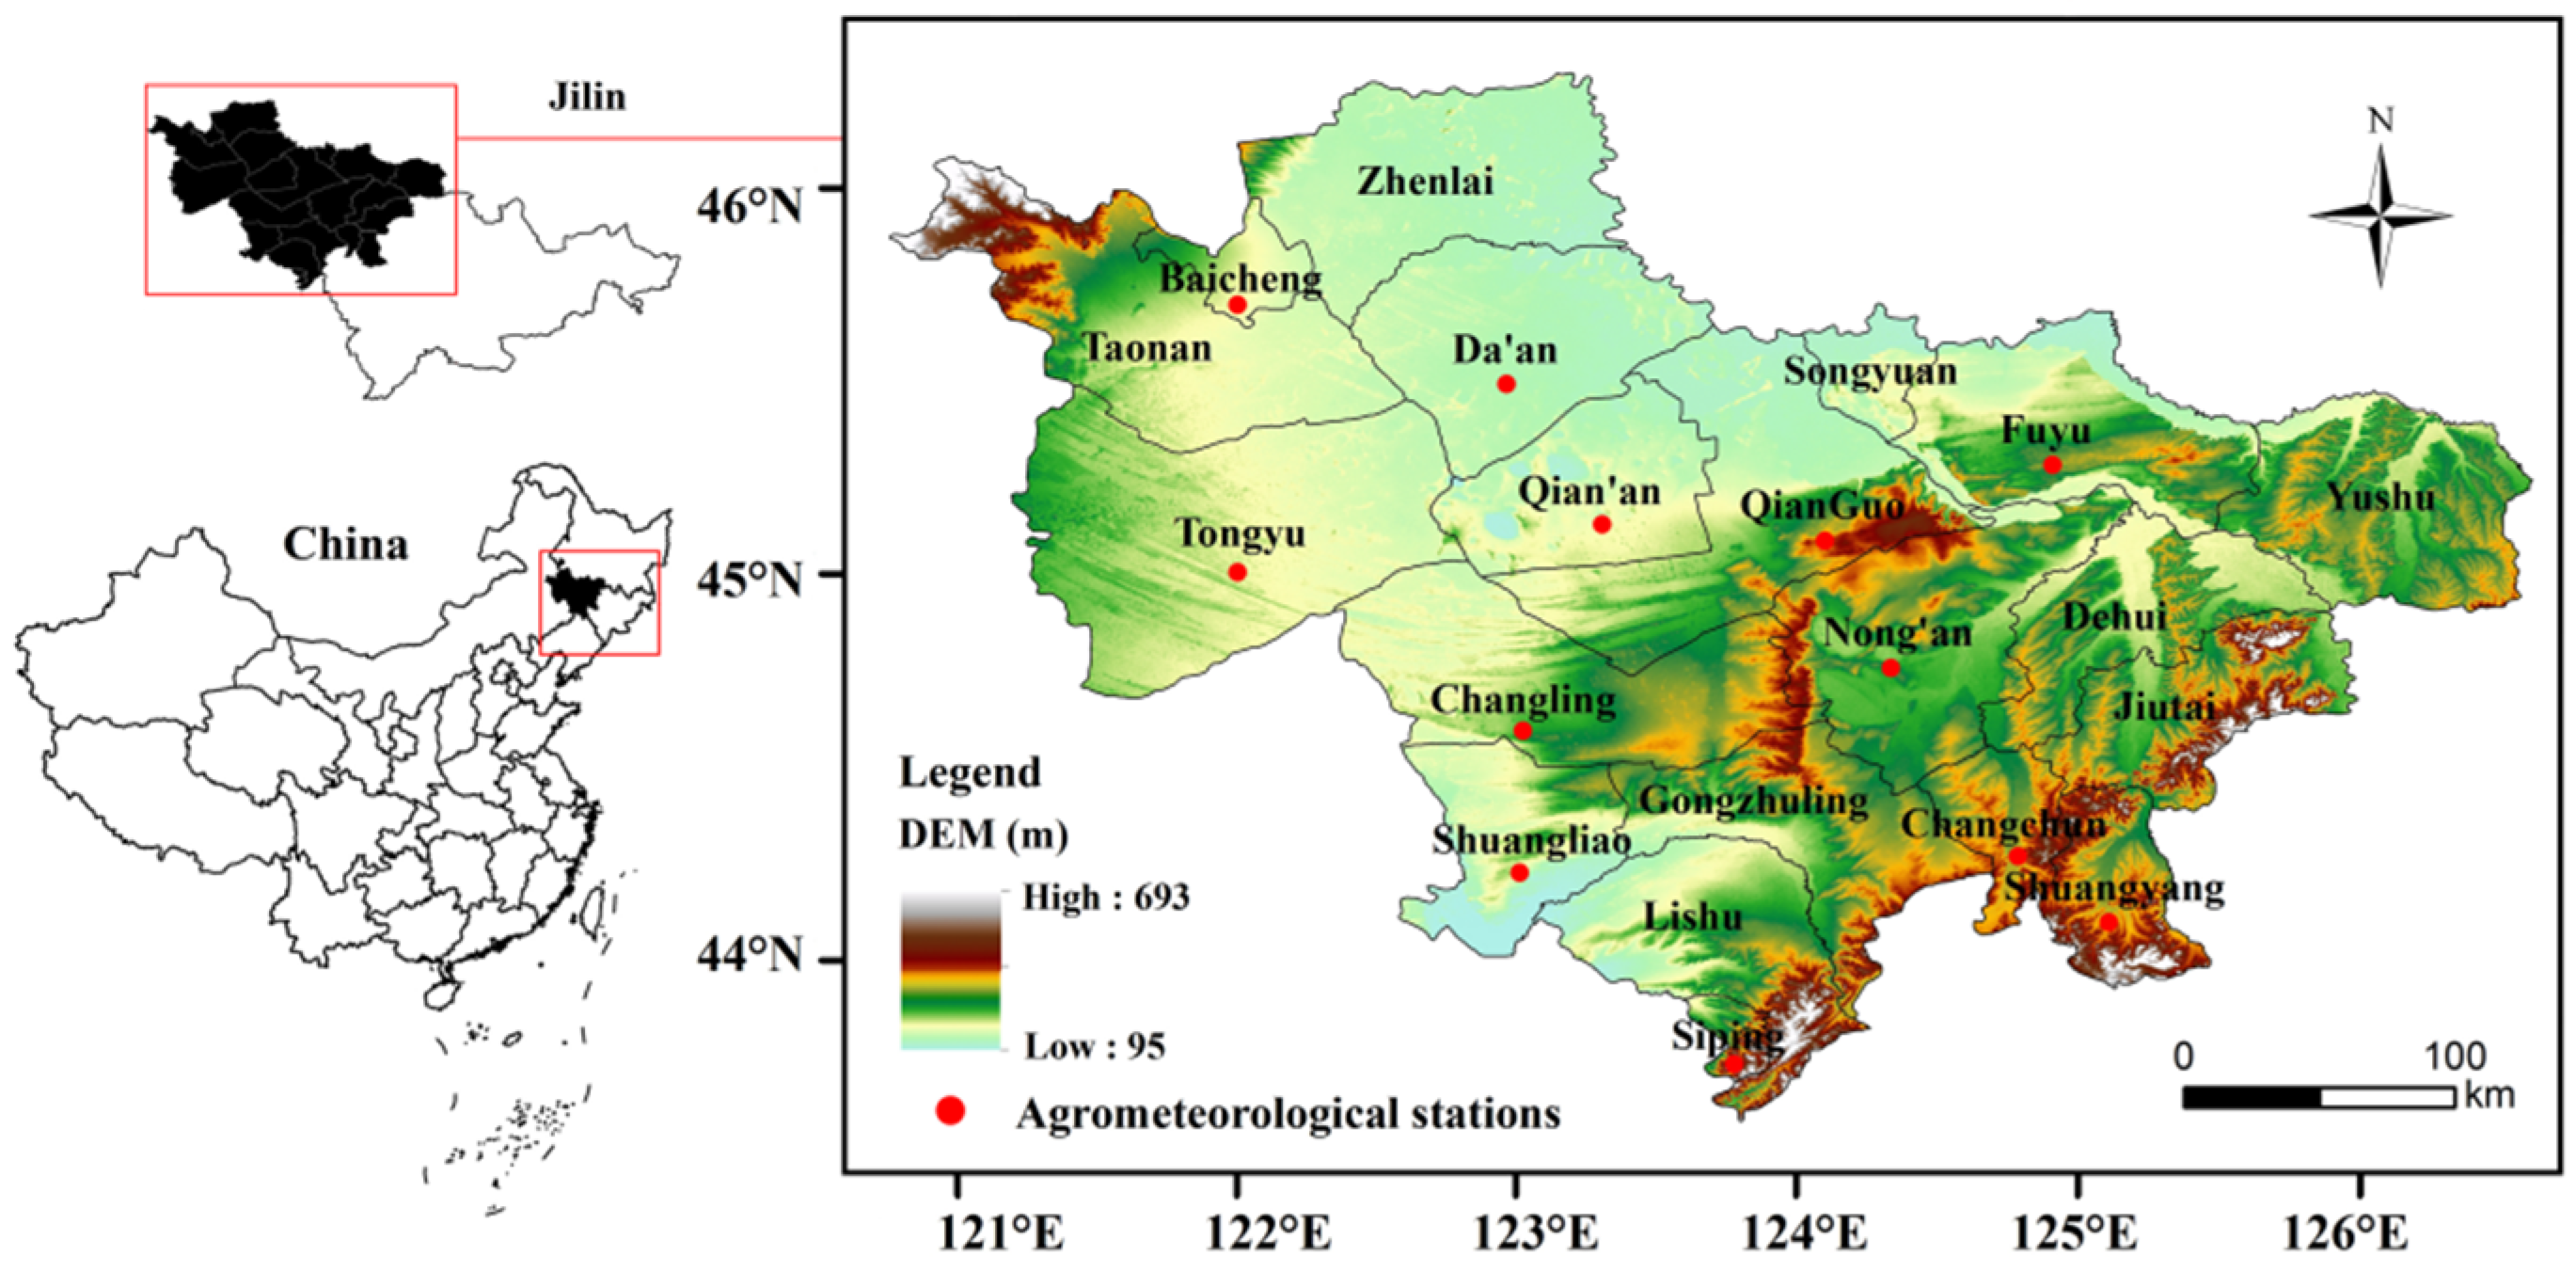
2.1. Study Area

The area around 45th parallel of the northern latitude is the best area in which to grow maize, and at the same latitude, the Ukraine, midwestern USA and northeast China are known as the three golden corn belts. China’s Golden Corn Belt is located in the northeast Plain, with the core area at midwestern Jilin Province. Midwestern Jilin Province is located southwest of Songnen Plain, the western area of the Inner Mongolia Autonomous Region, the northern part of Heilongjiang Province, and the eastern part of Horqin grassland (43°16′–46°18′ N, 121°38′–127°45′ E). The total land area is 8.19 × 10⁴ km2, and the terrain is relatively flat and gradually increases from the west to east. It has a temperate continental monsoon climate with an average annual temperature of 4–6 °C and adequate sunshine. The annual rainfall ranges from 200–600 mm and is primarily concentrated between June and September (Figure 2).
Twenty counties are located in the central and western regions of Jilin Province, with Yushu, Nong’an, Gongzhuling, Lishu, Fuyu, Changling, and Qianguolos Mongol Autonomous County listed as the top 10 grain-producing counties in the country. The yields of grain and its use as a commodity are at the forefront of the country. With the effects of global warming in recent years, droughts have been frequent and prolonged in the region, resulting in major losses to food production. As Jilin Province is the main base of corn production in China, it plays a substantial role in national food security. Therefore, it is urgent to reduce the impact and losses of meteorological disasters on agriculture in Jilin Province.

2.2. Data

Meteorological data, which included daily observations of the maximum temperature, minimum temperature, average temperature, precipitation, relative humidity, water vapor pressure, and 2 m wind speed from 12 meteorological stations in midwestern Jilin Province, were collected from the National Meteorological Information Center (http://data.cma.cn/ accessed on 10 August 2021) for the period from 1960 to 2020. Data that were abnormal or missing a longer time series were removed to ensure the integrity of the data for that time period. Historical disaster data were obtained from the statistical yearbooks of Jilin and the China Meteorological Disasters Dictionary—Jilin Volume. The data on maize production and the area in which it was sown were from the 1984–2020 Statistical Yearbook of Jilin. The data on maize sowing dates, the length of each fertility stage, and harvest dates were from the respective county statistical bureaus. The Coupled Model Intercomparison Program 5 (CMIP5) climate model data were used in this study (Table S1). To facilitate a comparison of the observations, bilinear interpolation was used to interpolate each model data to a 0.25° × 0.25° grid point. The CMIP5 used representative concentration pathway (RCP) emission scenarios for different radiation-forced targets, primarily including RCP2.6, RCP4.5, P6.0, and RCP8.5 [46]. The RCP 4.5 (medium radiative forcing scenario) refers to a stable radiative forcing of 4.5 W/m2 by 2100, and the RCP 8.5 (high radiative forcing scenario) refers to radiative forcing greater than 8.5 W/m2 by 2100 [47]. Thirty years of projected daily meteorological data from 2041–2071 (RCP4.5 and RCP8.5) were selected for the future period.

2.3. Methodology

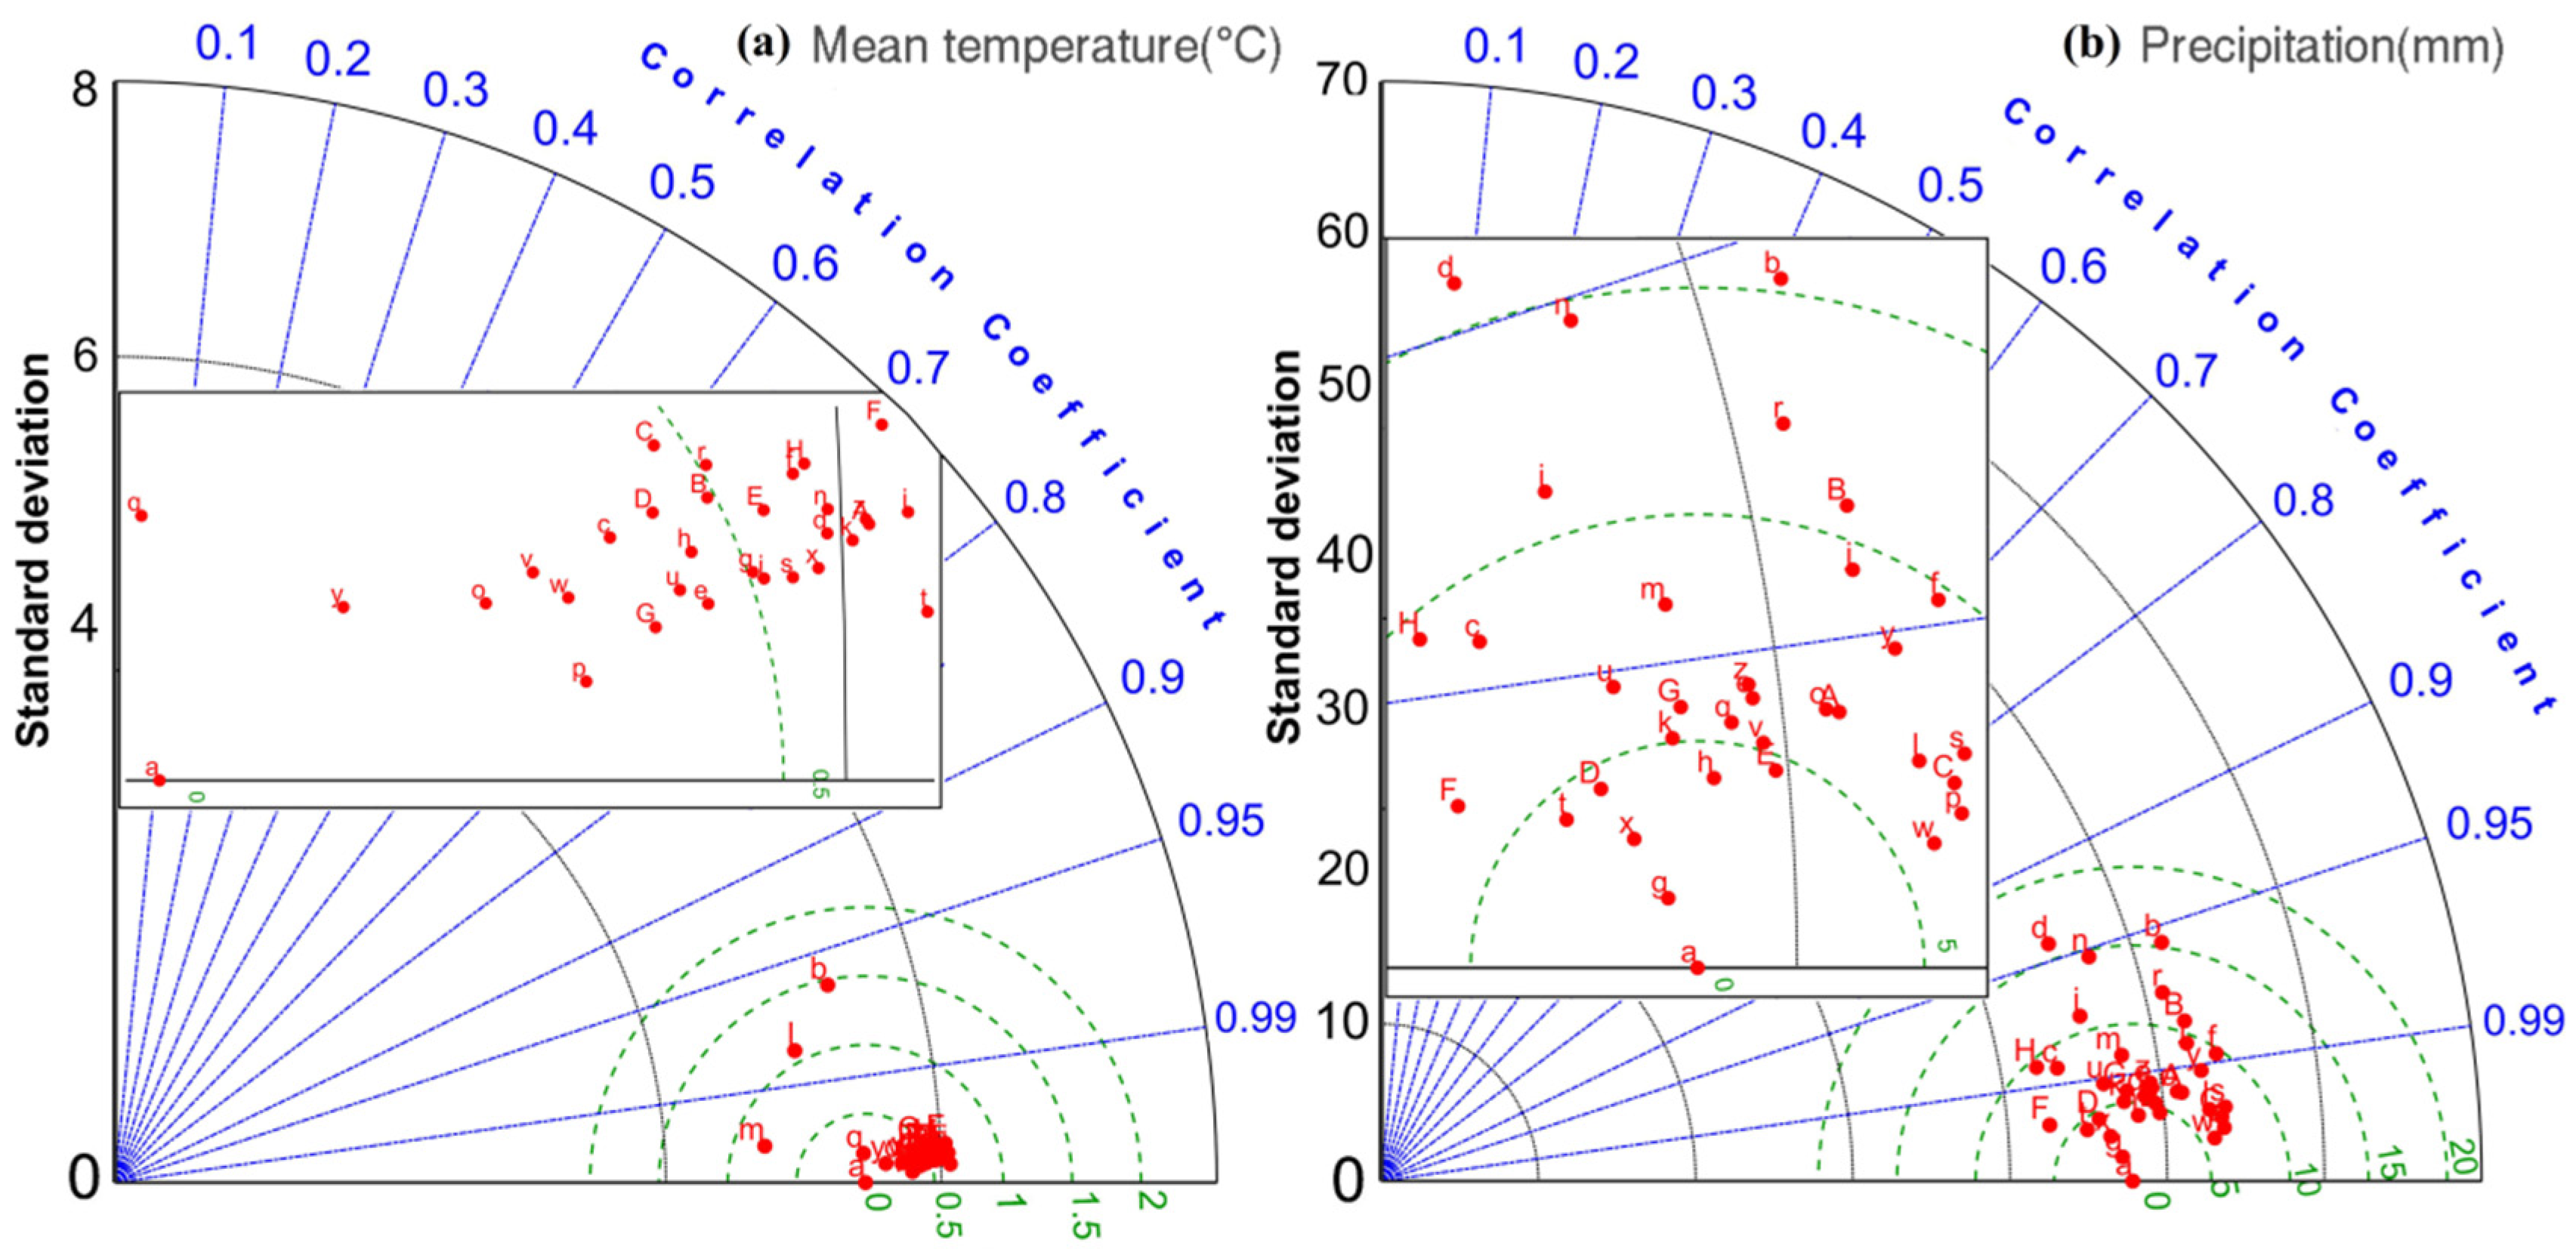
2.3.1. Taylor Diagram

A common method used to determine whether the climate model results are close to observations is to calculate the correlation coefficient and root mean square error between the two. The correlation coefficient (R) focuses on the similarity between the two patterns, while the root mean square error (RMSE) is an assessment of the closeness of the two dispersions. Taylor presented the Taylor diagram at the Program for Climate Model Diagnosis and Intercomparison (PCMDI) technical presentation, which simultaneously plots the correlation coefficient and root mean square error on a two-dimensional graph [48]. The formula is as follows:
R = 1 N ± n = 1 N ( f n f ¯ ) ( r n r ¯ ) σ f σ r
RMSE = [ 1 N n = 1 N ( f n r n ) 2 ]
if   E ¯ = f ¯ r ¯ ,   RMSE = { 1 N n = 1 N [ ( f n f ¯ ) ( r n r ¯ ) ] } ,  
then   R M S E 2 = σ f 2 + σ r 2 2 σ f σ r R
where f n is the model data, r n is the observed data, σ f is the model standard deviation, σ r is the observed data standard deviation, the superscript “-” is the mean, and N is the number of grid points in the study area. According to the cosine theorem, the angle between σ f 2 and σ r 2 is the correlation coefficient, while the length of the opposite side is root mean square error. Observation points that are closer enable a more effective simulation capability for the study area.

2.3.2. Crop Water Deficit Index (CWDI)

The CWDI is the ratio of the difference between the crop water requirement and the natural water supply to the crop water requirement. The formula by Wang et al. [49] is as follows:
CWDI = aCWDI i + bCWDI i 1 + cCWDI i 2 + dCWDI i 3 + eCWDI i 4
where CWDI i , CWDI i 1 , CWDI i 2 , CWDI i 3 , and CWDI i 4 represent the water deficit index at i; and the first four for 10-day periods, respectively, and a , b , c , d , and e represent the cumulative weight index, taking values of 0.3, 0.25, 0.2, 0.15 and 0.1, respectively [50].
CWDI = ( ( E T c i P e i ) E T c i × 100 % ( E T c i P e i ) 0 ( E T c i < P e i ) )
where E T c is the water requirement of maize (mm), P e i is the effective precipitation (mm), i stands for each growth stage, and E T c is obtained by multiplying the reference evapotranspiration ( E T 0 ) with the crop coefficient ( K c ), calculated as follows:
E T c = E T 0 × K c
K c values: sowing-jointing = 0.378, jointing-tasseling = 0.689, tasseling-milk-ripe = 1.185, and milk-ripe-maturity = 0.759.
E T 0 was calculated using the Penman−Monteith equation that was recommended by the Food and Agriculture Organization of the United Nations (FAO) in 1998, as follows:
ET 0 = 0.408 R n + γ 900 T + 273 U 2 ( e s e a ) + γ ( 1 + 0.34 U 2 )
where R n is the net radiation available at the crop surface (MJ/m2), is the slope of the vapor pressure curve (k Pa/°C), T is the average temperature (°C), ( e s e a ) is the vapor pressure deficit (k Pa),   γ is the psychometric constant (k Pa/°C), and U 2 is the wind speed at 2 m height (m/s).

2.3.3. Effective Precipitation (Pe) and Irrigation Requirement Index (IRI)

The Pe is generally calculated using an empirical effective rainfall utilization factor [51,52] as follows:
Pe = j · P j
where P j is the daily precipitation (mm/d); P e is the daily effective precipitation (mm/d); is the effective utilization coefficient; j   = 0, P j   ≤ 3 mm; j = 1, 3 mm <   P j   ≤ 50 mm; j   = 0.8, 50 mm < P j   ≤ 150 mm, and j   = 0.7, P j   > 150 mm.
The IRI reflects the dependence of crop on irrigation [51,53]. The formula is as follows:
IRI = ETc Pe
The higher the IRI value, the greater the dependence of crops on irrigation and vice versa [54].

2.3.4. Maize Yield Treatments

Food yield generally includes the trend yield, climate yield, and social fluctuation yield [55], calculated as follows:
Y = Y t + Y c + Y e
where Y is the actual unit yield (kg/hm2); Y t is the trend yield (kg/hm2); Y c is the climate yield (kg/hm2); and Y e is the random error (kg/hm2), which is generally negligible. The trend yields were calculated using the 5a sliding average method in which climate yields that exclude the trend yield more effectively reflect the fluctuations in actual maize yields that are affected by drought [44]. Thus, the relative meteorological yield ( Y w ) shown below is a comparable relative value not affected by differences in the level of agricultural technology in different historical periods, as well as in time and space.
Y w = ( Y Y t ) Y t
A year with a negative relative meteorological yield of maize is defined as a yield reduction year, and the meteorological yield reduction rate, and is calculated as follows:
r = x i n
where x i is the sum of negative relative meteorological yield of maize and n is the total number of samples. r is used to describe the location of concentration of negative values in relative meteorological yield, i.e., the concentration of years of yield reduction, which characterizes the average level of yield reduction of maize subject to natural risk for that subject. The higher the rate of meteorological yield reduction, the higher the degree of damage caused by the disaster, and vice versa, as shown below:
v = ( X i r ) 2 ( n 1 ) / r
where v is the meteorological yield reduction coefficient of variation and X i is the annual relative meteorological yield from year to year (Table 1).

2.3.5. Calculation of the Crop Drought Risk Index

Drought frequency was used to evaluate the frequency of drought occurring at a meteorological station in the study area during the study time period [57]. The calculation formula is as follows:
F i = n N × 100 %
where F i is the frequency of drought occurrence, N is the total length of the time series, and n is the number of occurrences of a given level of drought in a given growth stage.
The CWDI of maize at different growth stages was taken as the calculated data, and the discrete domain of the CWDI U = {1, 2, …, 99, 100} was taken and used to determine the probability of the occurrence of different levels of drought based on the theoretical model of information diffusion and the classification of drought levels. The crop drought risk index was used as an indicator for crop drought risk assessment. The formula is as follows:
E = k = 1 n P k L k
where P k is the probability of occurrence of the k drought level, L k is the median CWDI of the k drought level, and n is the drought level.
The equation for normalization is as follows:
E = E k E m i n E m a x E m i n
where E is the post-polarization disaster risk index, E k is the meteorological drought risk index in any series, E m a x is the maximum value in the series, and E m i n is the minimum value in the series.

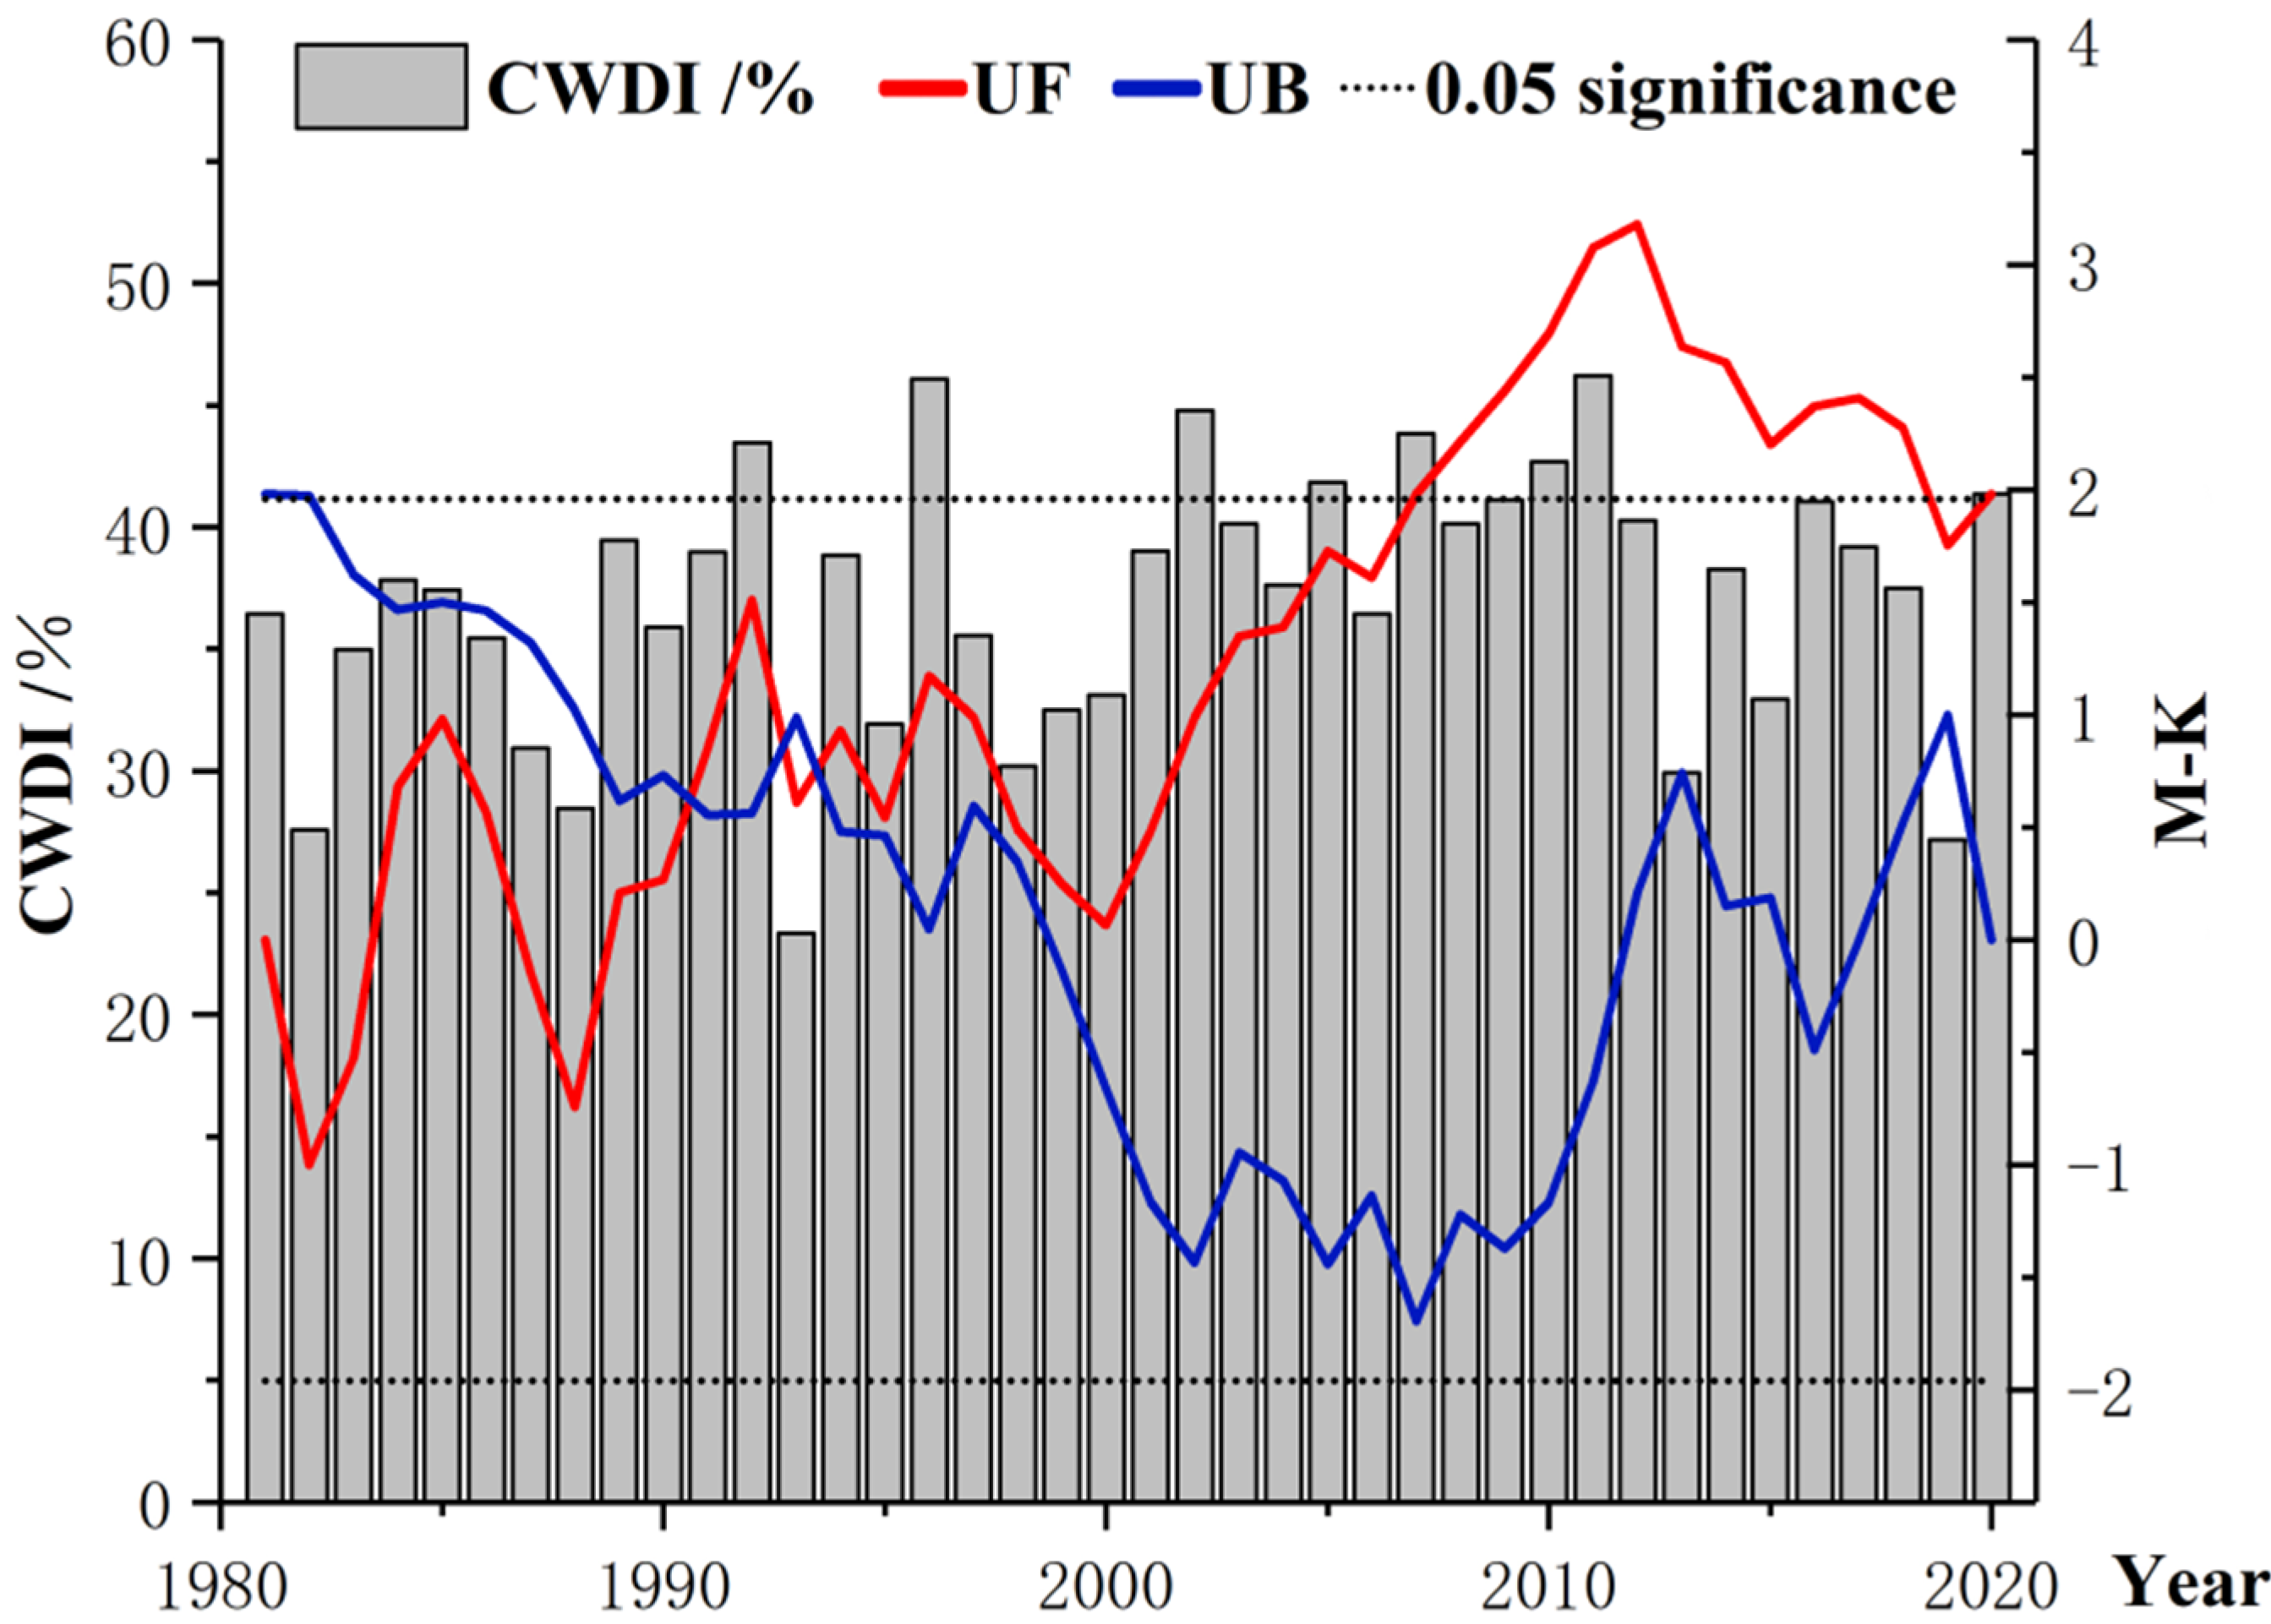
2.3.6. Mann-Kendall Mutation Test

The M-K test was originally proposed and developed by H.B. Mann [58] and M.G. Kendall [59], and it is an effective tool recommended by the World Meteorological Organization for extracting trends in series variability. The level of significance of changes in the CWDI over the time series was evaluated using the M-K test, where significance only represents the level of confidence that the trend change can be made and is not related to the speed of change.

3. Results and Discussion

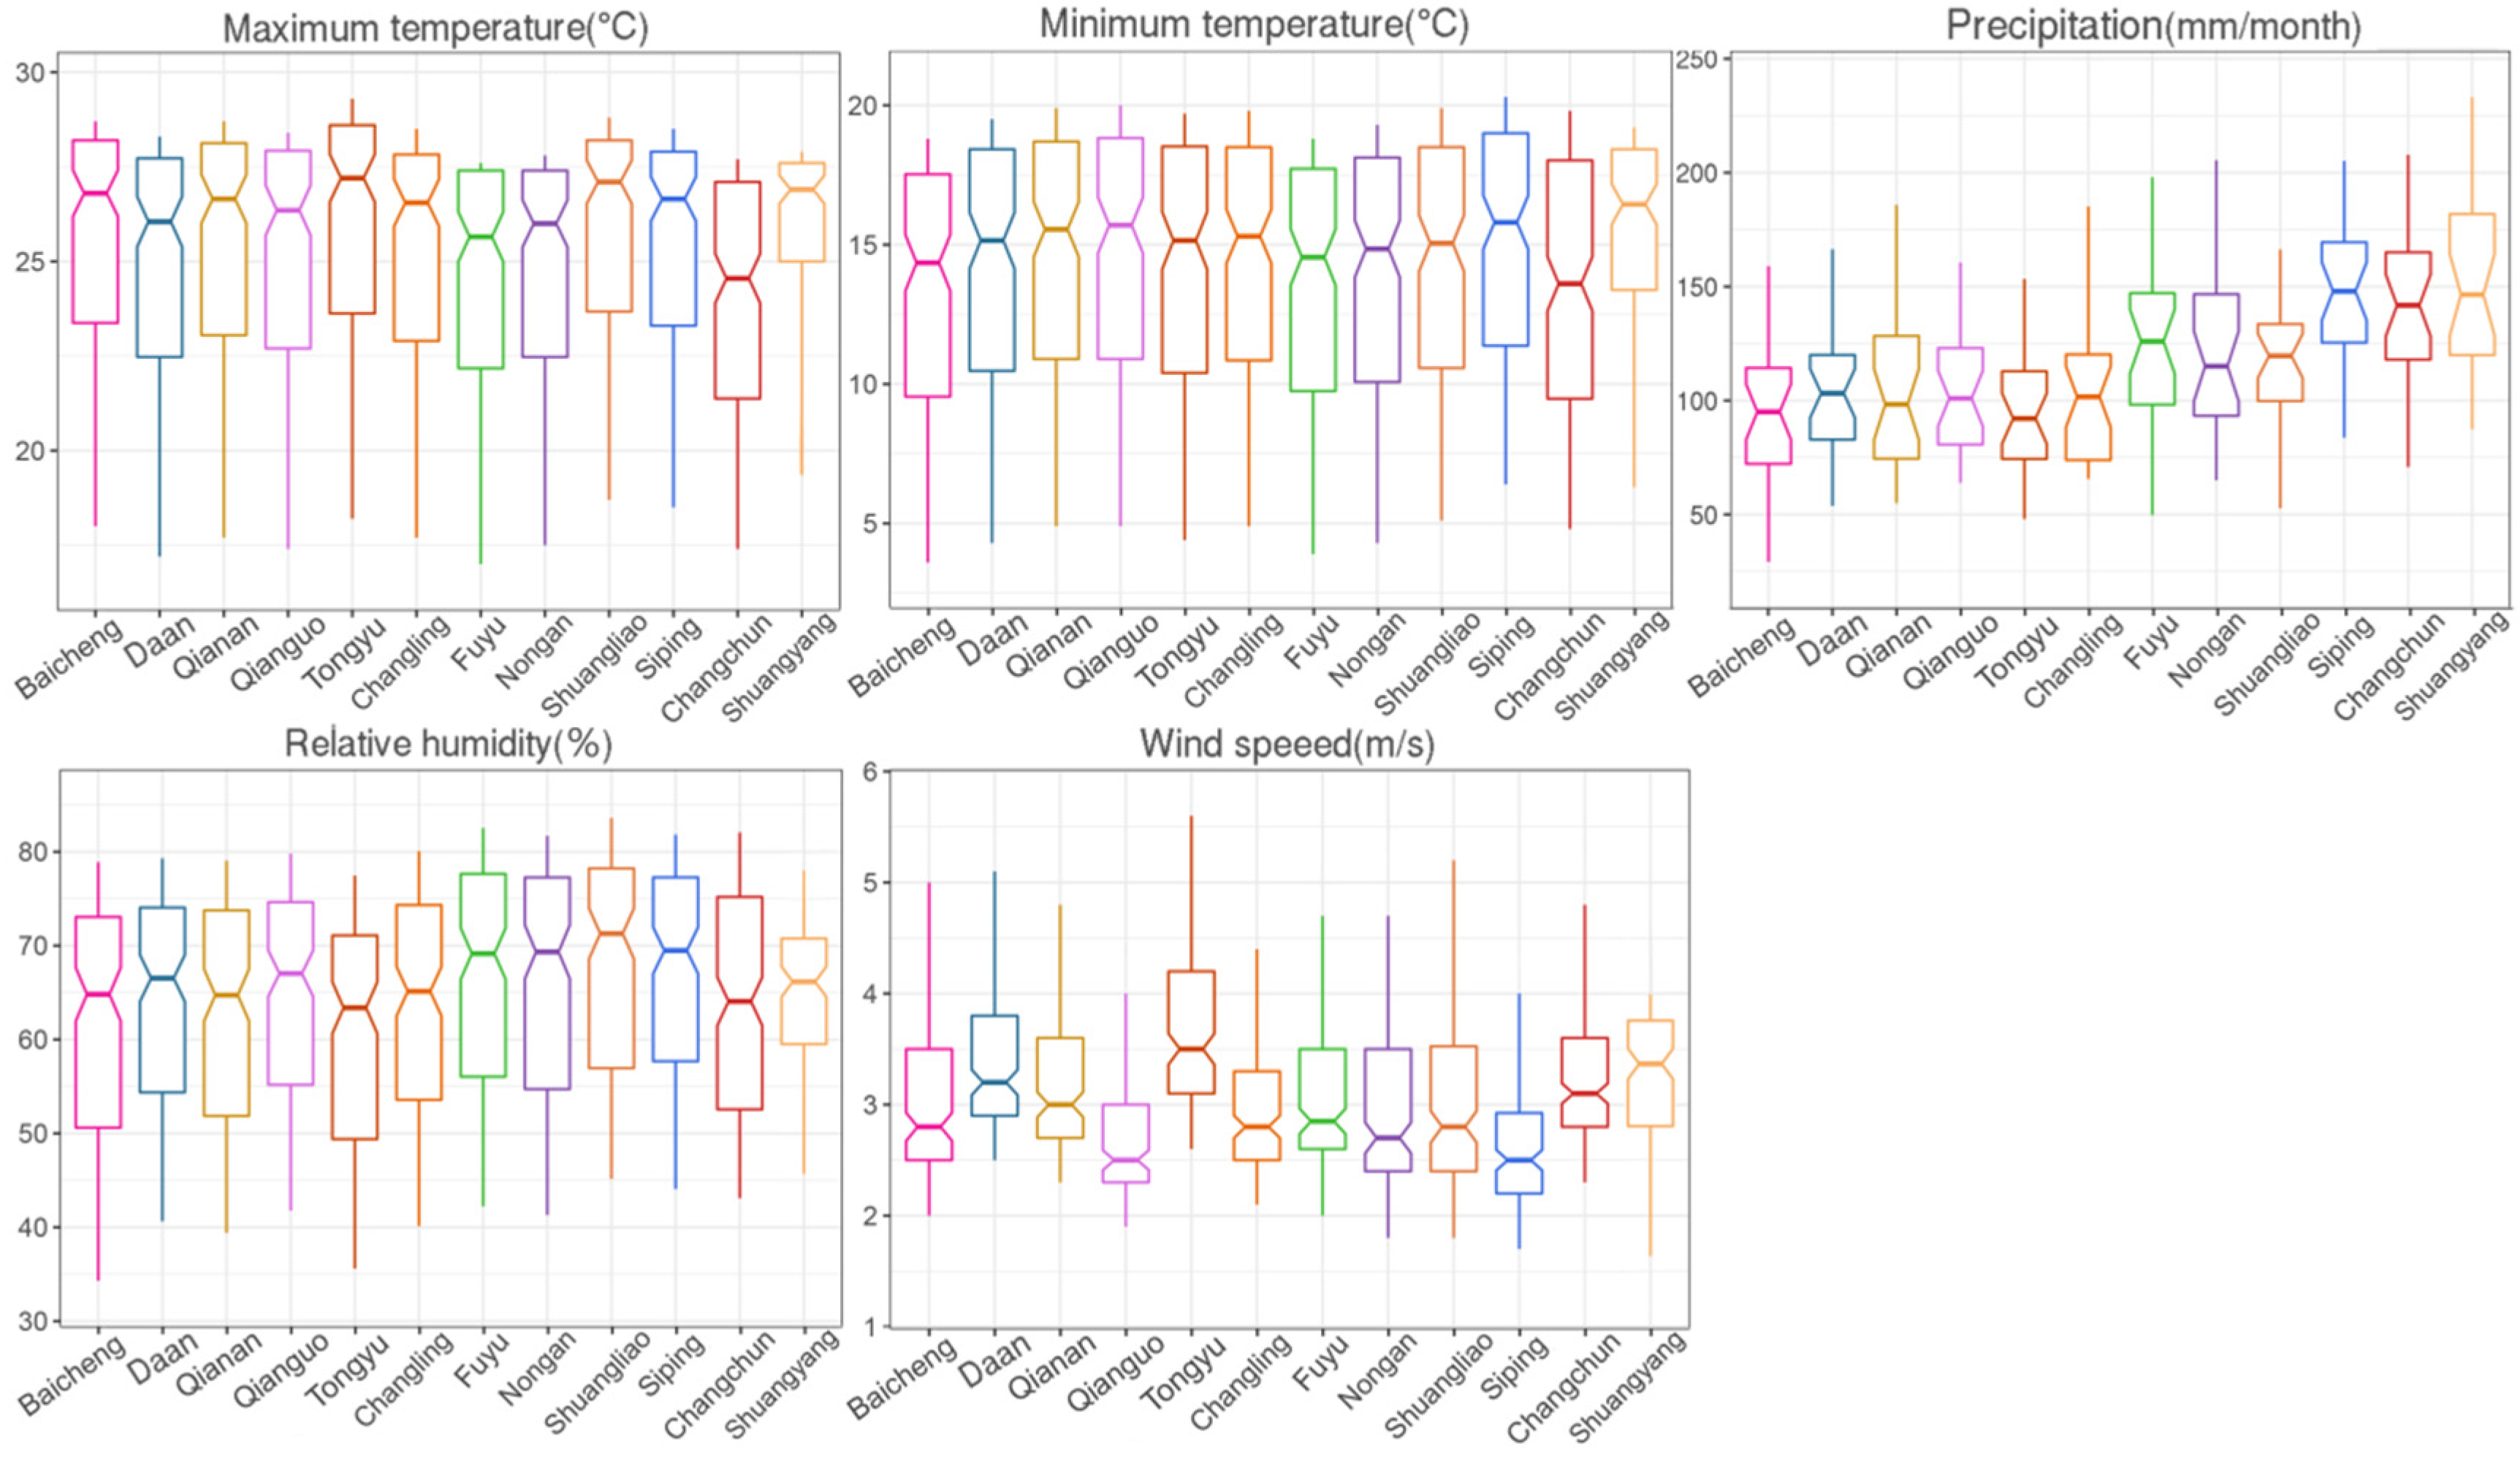
3.1. Climatology of the Study Area

Figure 3 shows the change of climatic conditions in midwestern Jilin Province from 1980 to 2020. The maximum and minimum temperatures were 27 °C and 15 °C, respectively. The relatively low maximum and minimum temperatures in Changchun may be owing to its location at a higher altitude (236.8 m). The optimal temperatures for maize growth are from 25 °C to 31 °C. When the temperature is low, the nutrient consumption of respiration is larger, and the growth of maize is relatively slow. When temperatures get too high, maize stops growing. The trend of a decrease in precipitation decreases from southeast to northwest, and is significantly affected by topography. The monthly mean precipitation distribution is very uneven with approximately 100–170 mm in the southeast and up to 160 mm in local areas, such as Siping and Shuangyang. The precipitation is relatively light in the northwest. The average relative humidity of each county is 60–70%, which is favorable for maize growth. Variations in the wind speed are the result of a combination of many factors, including climate, human activity and built environment, and circulation, and there is no obvious trend in change among the counties.

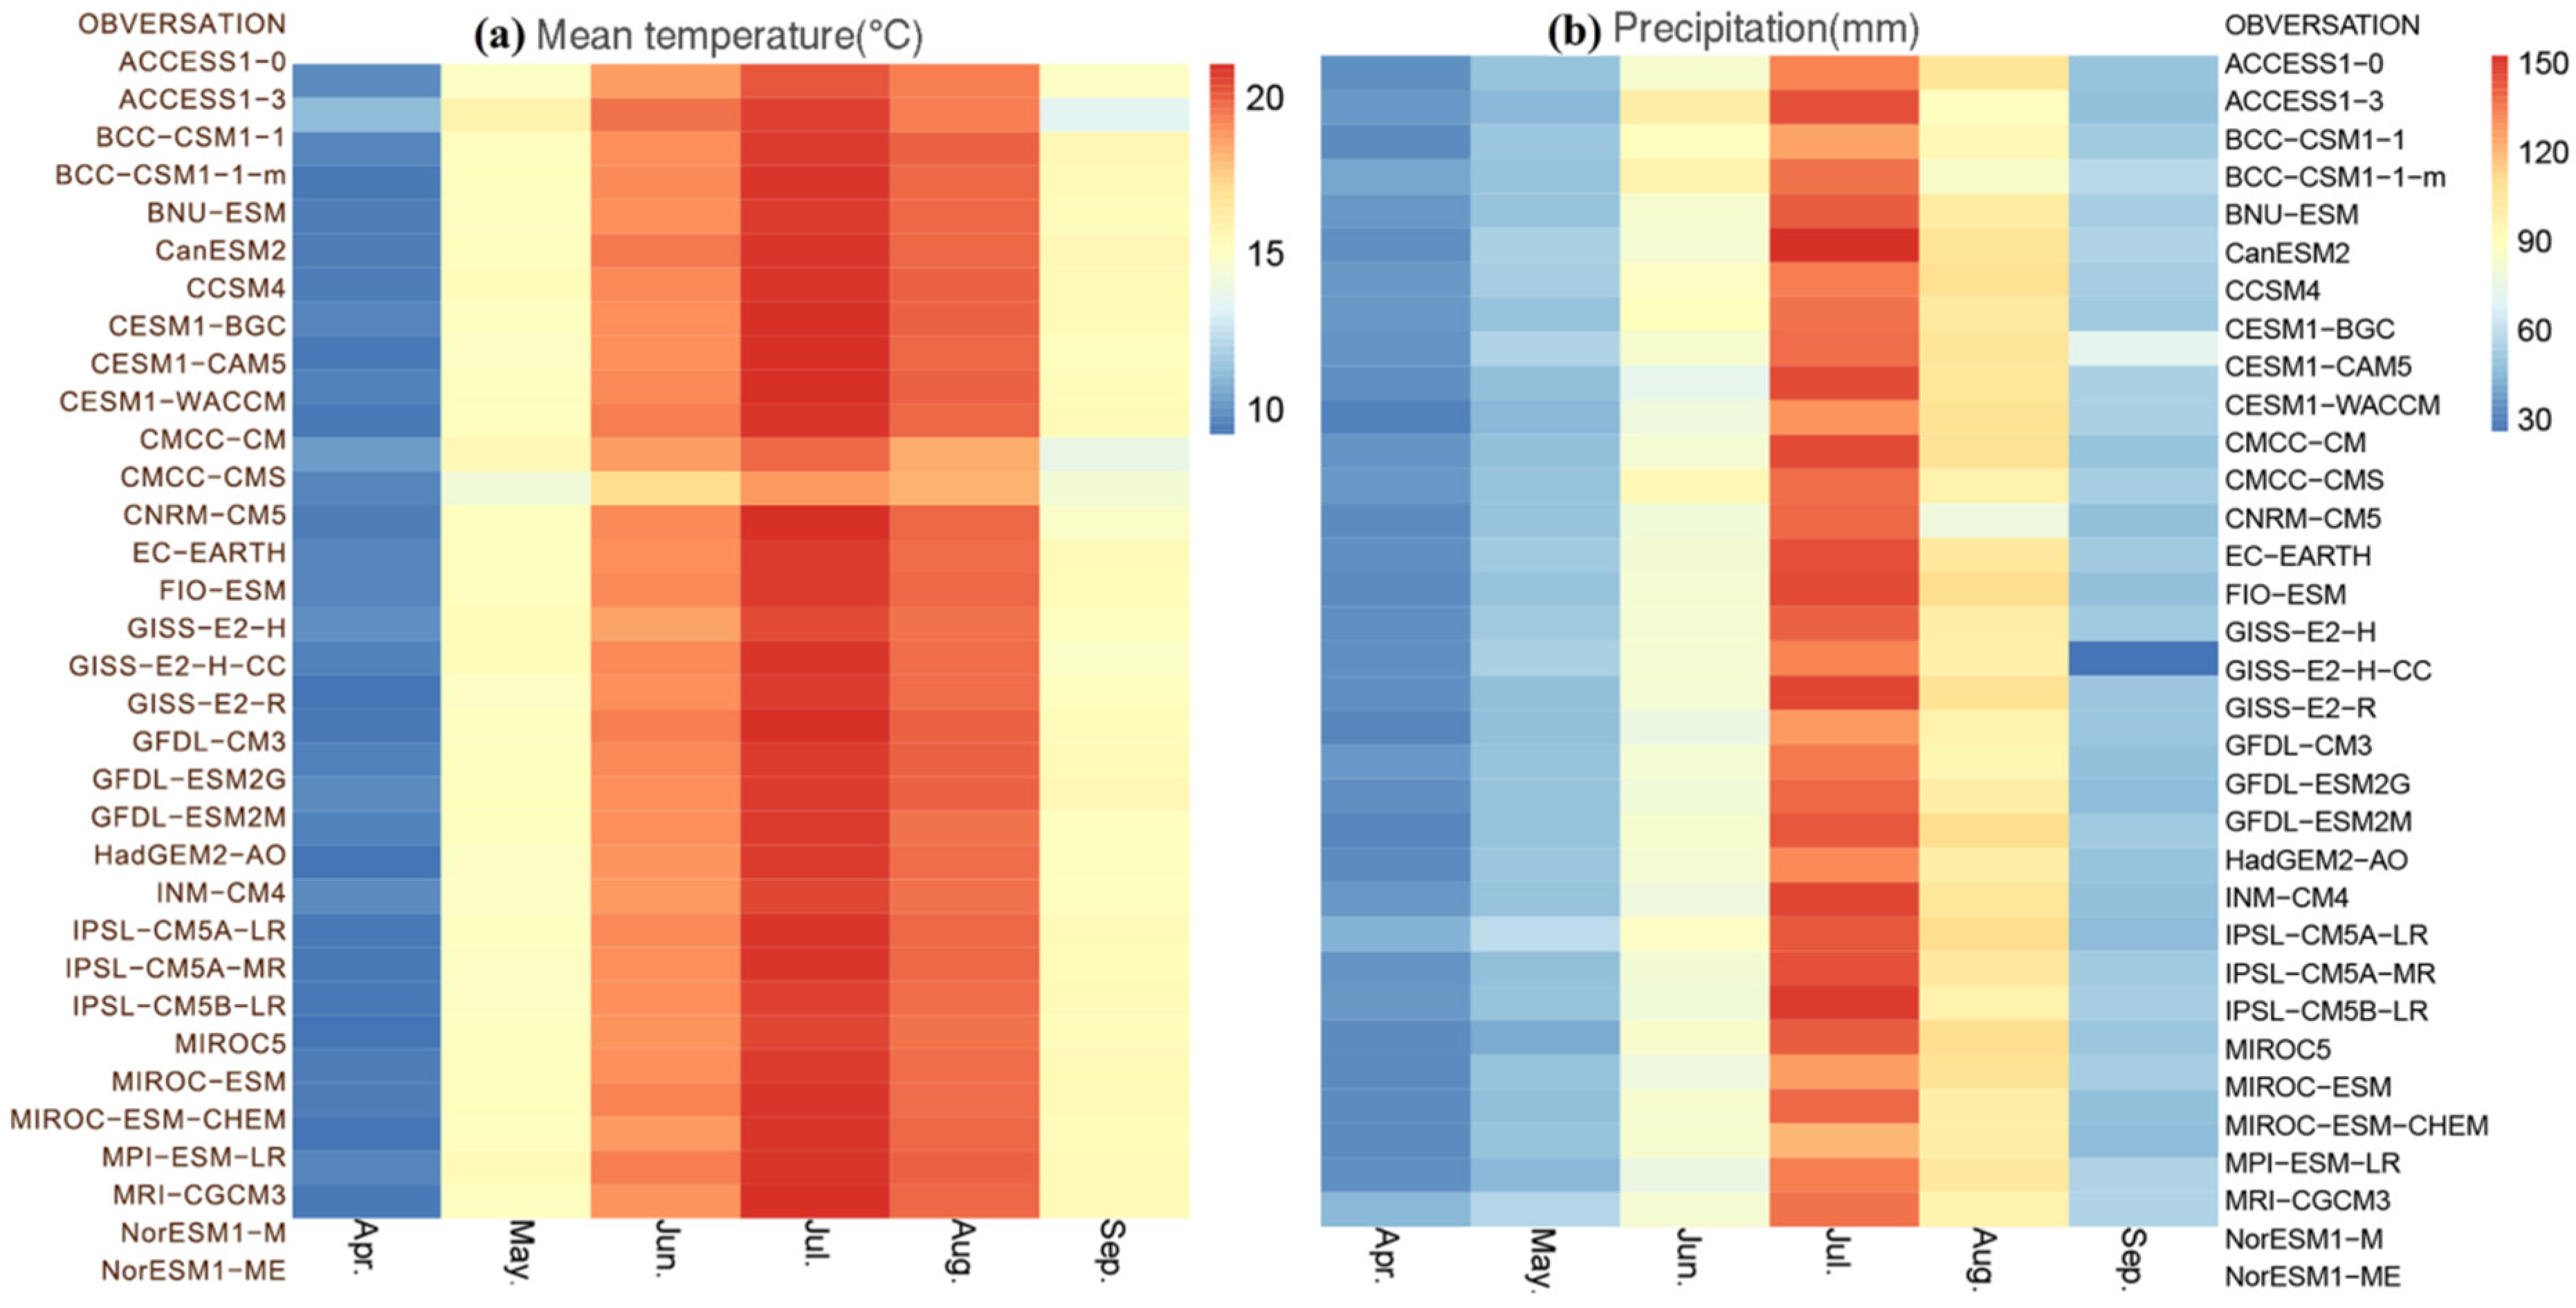
3.2. Future Climate Scenario Simulations

The data on temperature and precipitation of the maize growth period from 1980 to 2020 were compared with the data of each model. Most models effectively simulated temperature (Figure 4a). The best and worst models for simulation were CESM1-WACCM and GISS-E2-R, respectively. For precipitation (Figure 4b), the models were generally numerically low. The average monthly precipitation for the historical period was 2.38 mm, and the simulated value of each model ranged from 2.05 to 2.7 mm, with the ACCESS1-0 simulated value the closest to observations. BNU-ESM deviated the most from observations and greatly underestimated the precipitation during the historical period.
As shown in Figure 5a, the models represent a relative concentration of points, and all have R > 0.99 for the temperature simulations. The models that were more effective for temperature simulation were FIO-ESM, IPSL-CM5A-LR, CCSM4, BCC-CSM1-1-m, and CanESM2, in that order. For precipitation (Figure 5b), the R between all the models and observations was >0.9, but most models were negatively correlated with the observations. In addition, the large variation in RMSE across the models indicates that the results varies considerably from model to model and between models and observations. The models that were more effective at simulation were FIO-ESM, CCSM4, MIROC-ESM, GFDL-ESM2M, and MIROC5, in their order of effectiveness. Overall, the models simulate temperature better than precipitation. The FIO-ESM model from China was chosen for this study.

3.3. Analysis of the CWDI Change

To verify the reliability of the M−K test results, we used the Sen’s Slope for each variable in the different periods. The results showed that the M−K test has some reliability (Table S2). Figure 6 shows that the average CWDI for the maize growth period was 37%. The maximum value was 46.21% in 2011, and the minimum value was 23.35% in 1993. The UF and UB curves crossed in 1991, 1993, and 1994, indicating a sudden change in the CWDI during those three years. Overall, the UF and UB statistics were basically >0, indicating an upward trend in variation, which also indicates that the degree of maize water shortage was increasing yearly. A comparison of the UF statistics with two 0.05 significant level lines indicated that in 2012, the UF statistic was > the 0.05 significant level line, indicating that the CWDI during the growth period of maize in that year had reached a significant upward trend.

3.4. Analysis of Drought Change Characteristics

In combination with different grades of drought division (Table 2), the drought risk index of normal, mild, moderate, severe, and extreme drought during different growth periods was determined. The spatial distribution was based on the inverse distance weighted model (IDW) (Figure 7). From 1980 to 2020, the drought risk indices were 0.62, 0.52, 0.48, and 0.60 for sowing to jointing, jointing to tasseling, tasseling to milk-ripe, and milk-ripe to maturity, respectively. The spatial intensity of drought risk diminished from west to east. Extreme drought events occurred in Baicheng, Taonan, and western Zhenlai during the sowing to jointing stage. The risk of drought then gradually diminished to the southeast with no drought in Changling, Changchun, or Shuangyang. From the jointing to milk-ripe stage, a circular spread of increased drought risk centered around the Changling area. Baicheng, Taonan, Zhenlai, Tongyu, and Siping are areas with a high incidence of drought. During milk-ripe to maturity, the drought situation changed a little with the exception that the northeast region changed from moderate to severe drought. In 2041–2071, the RCP4.5 scenario showed that the drought degree would be more serious during each period of maize growth, and the risk of severe drought was concentrated in the northwest and gradually decreased southward. Relatively high risk of drought in the west due to low precipitation [60,61]. The drought risk index of each growth period was 0.67, 0.53, 0.54, and 0.71, respectively. Unlike historical periods, drought events will occur frequently in the Changling region, and severe drought events will occur in the jointing to maturity period. Under the RCP8.5 scenario, a severe drought event will occur in Baicheng from sowing to jointing. Subsequently, there will be a clear trend of decreasing toward the southeast, and no drought is projected to occur in many areas in the east. From jointing to tasseling, Changling will be at risk for extreme drought. Severe drought will occur around Changling and in the northwest of the study area. From the tasseling to milk-ripe stage, the western region is at risk for extreme drought. From the milk-ripe to maturity stage, the drought situation will be more serious, and the drought risk index was calculated as being 0.66. Drought risk in the west will be spatially distributed radially and will diminish from west to east. In different periods, the occurrence of mild drought will be less frequent, while there will be a more frequent occurrence of severe and extreme drought. Baicheng and its surrounding areas will have a high incidence of drought. During the milk-ripe to maturity stage, drought will force a reduction in photosynthetic rate [62], with a significant impact on dry matter accumulation and grain filling [63,64]. Therefore, the balance of maize water supply and demand should be fully considered, and reasonable irrigation should be implemented in areas with high drought incidence to safeguard the yield and quality of maize.

3.5. Analysis of Water Supply and Demand Situation of Maize

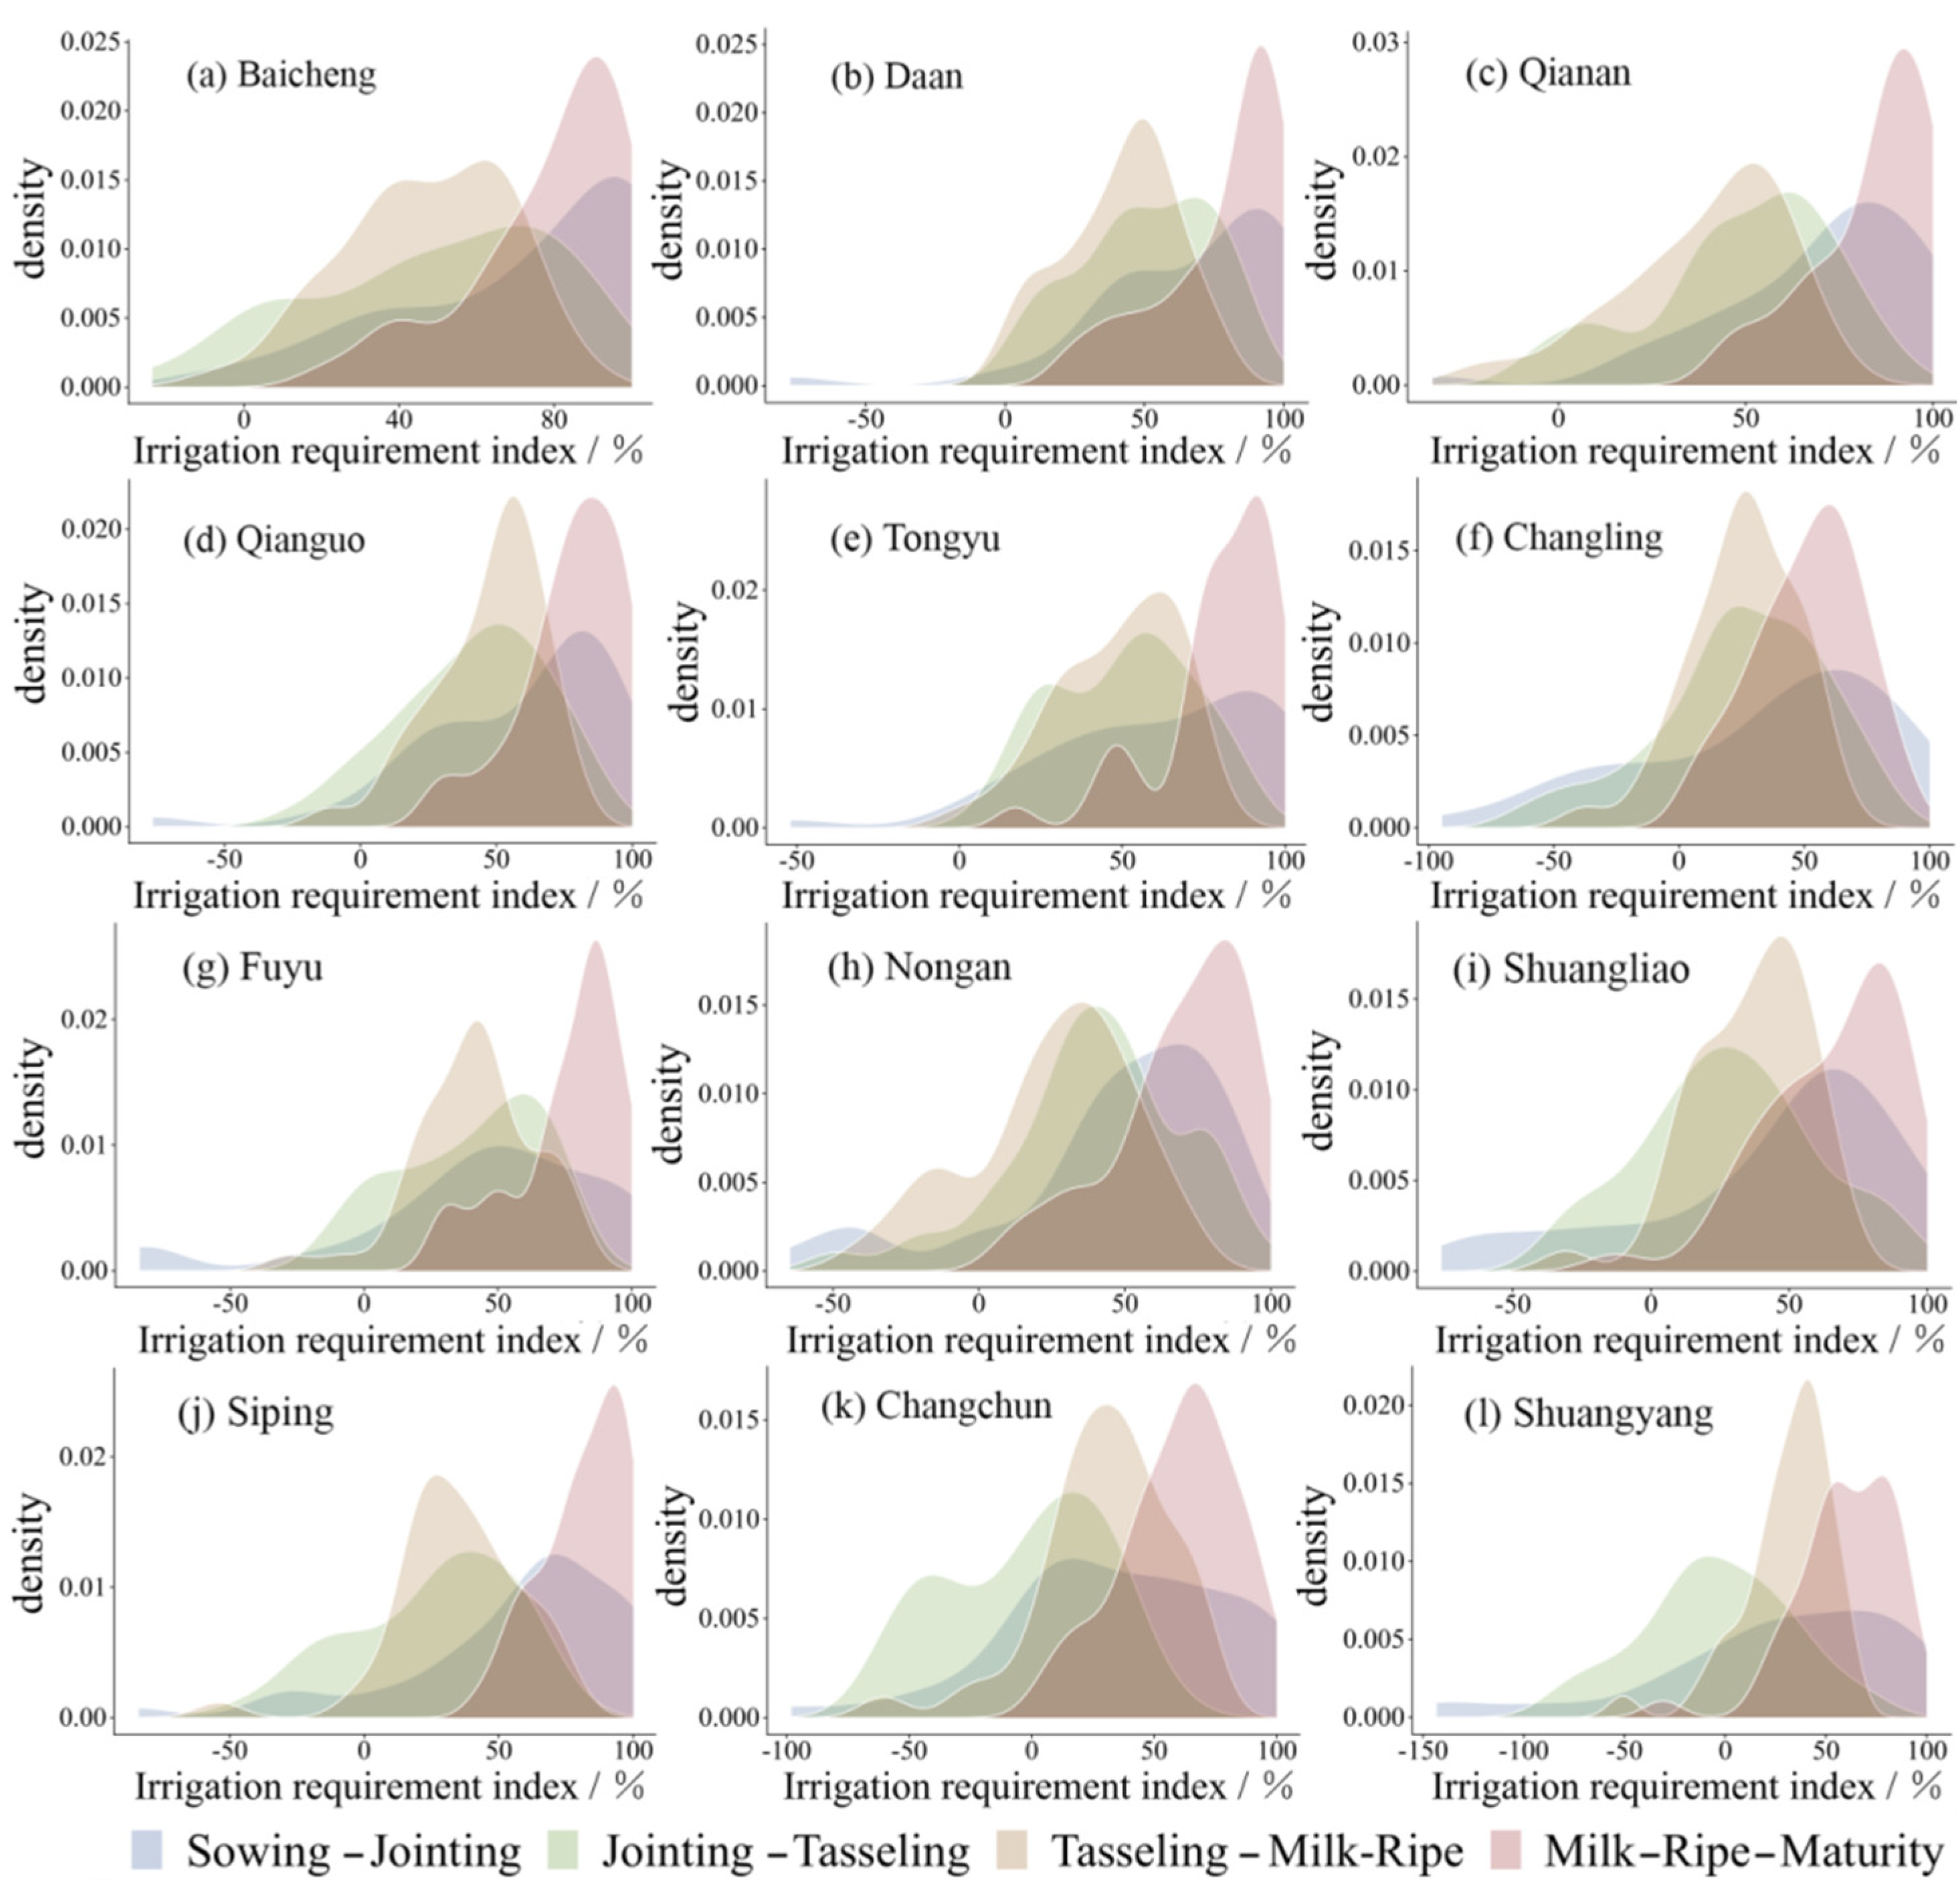
3.5.1. Analysis of the Irrigation Requirement Index

Figure 8 shows the density distribution of IRI during the growth period of maize in the study area from 1980 to 2020. Overall, from sowing to jointing, the IRI in each region was 20–60%. Maize in this period had a small demand for water, and the Pe was largely adequate for early maize growth. The IRI between jointing and tasseling were −4.31% and −2.29% in Shuangyang and Changchun, respectively, indicating that no extra irrigation was needed in this area. The period when maize enters its nutritional growth stage is a sensitive period for water requirements [65]. Strong evaporation of the soil and high transpiration of the plant coincided with the beginning of the rainy season and abundant rainfall, which greatly alleviated the demand of maize for water. The maize plants are most metabolically active from the tasseling to milk-ripe stage, and require more irrigation. The IRI in each county was the highest from milk-ripe to maturity at approximately 80%. If maize was in a water deficit state during this period, the whole growth period was shortened by 15 days and the empty stalk rate increased by 24.3%. Causing a deterioration of corn ear spike traits [66,67], more than 50% of the loss of grain yields may have been owing to water stress during this period [68]. Sufficient water is needed as a soluble medium to transport the nutrients accumulated in the stem and leaves to the grain. However, during this time, Jilin Province is in the late summer and early autumn with less precipitation and high temperatures.
Geographically (Figure 9), the eastern and central regions have a strong demand for irrigation, with a smaller IRI in the southwest.
The spatial distribution of IRI corresponds to the drought conditions in each period (Figure 7). Areas that are drier are more dependent on irrigation, and areas with no or less drought, have a low or even negative IRI. The maize IRI showed a trend of milk-ripe-maturity > sowing-jointing > tasseling-milk-ripe > jointing-tasseling (Figure 9). The IRI was >50% at both the sowing-jointing and milk-ripe-maturity stages. At the maturity stage, the IRI was >70% for all the periods. Because the jointing stage had just entered the monsoon and the maturity stage was near the end of monsoon, the precipitation and frequency of precipitation were less than those in other growth periods, and the risk of water shortage was relatively high.

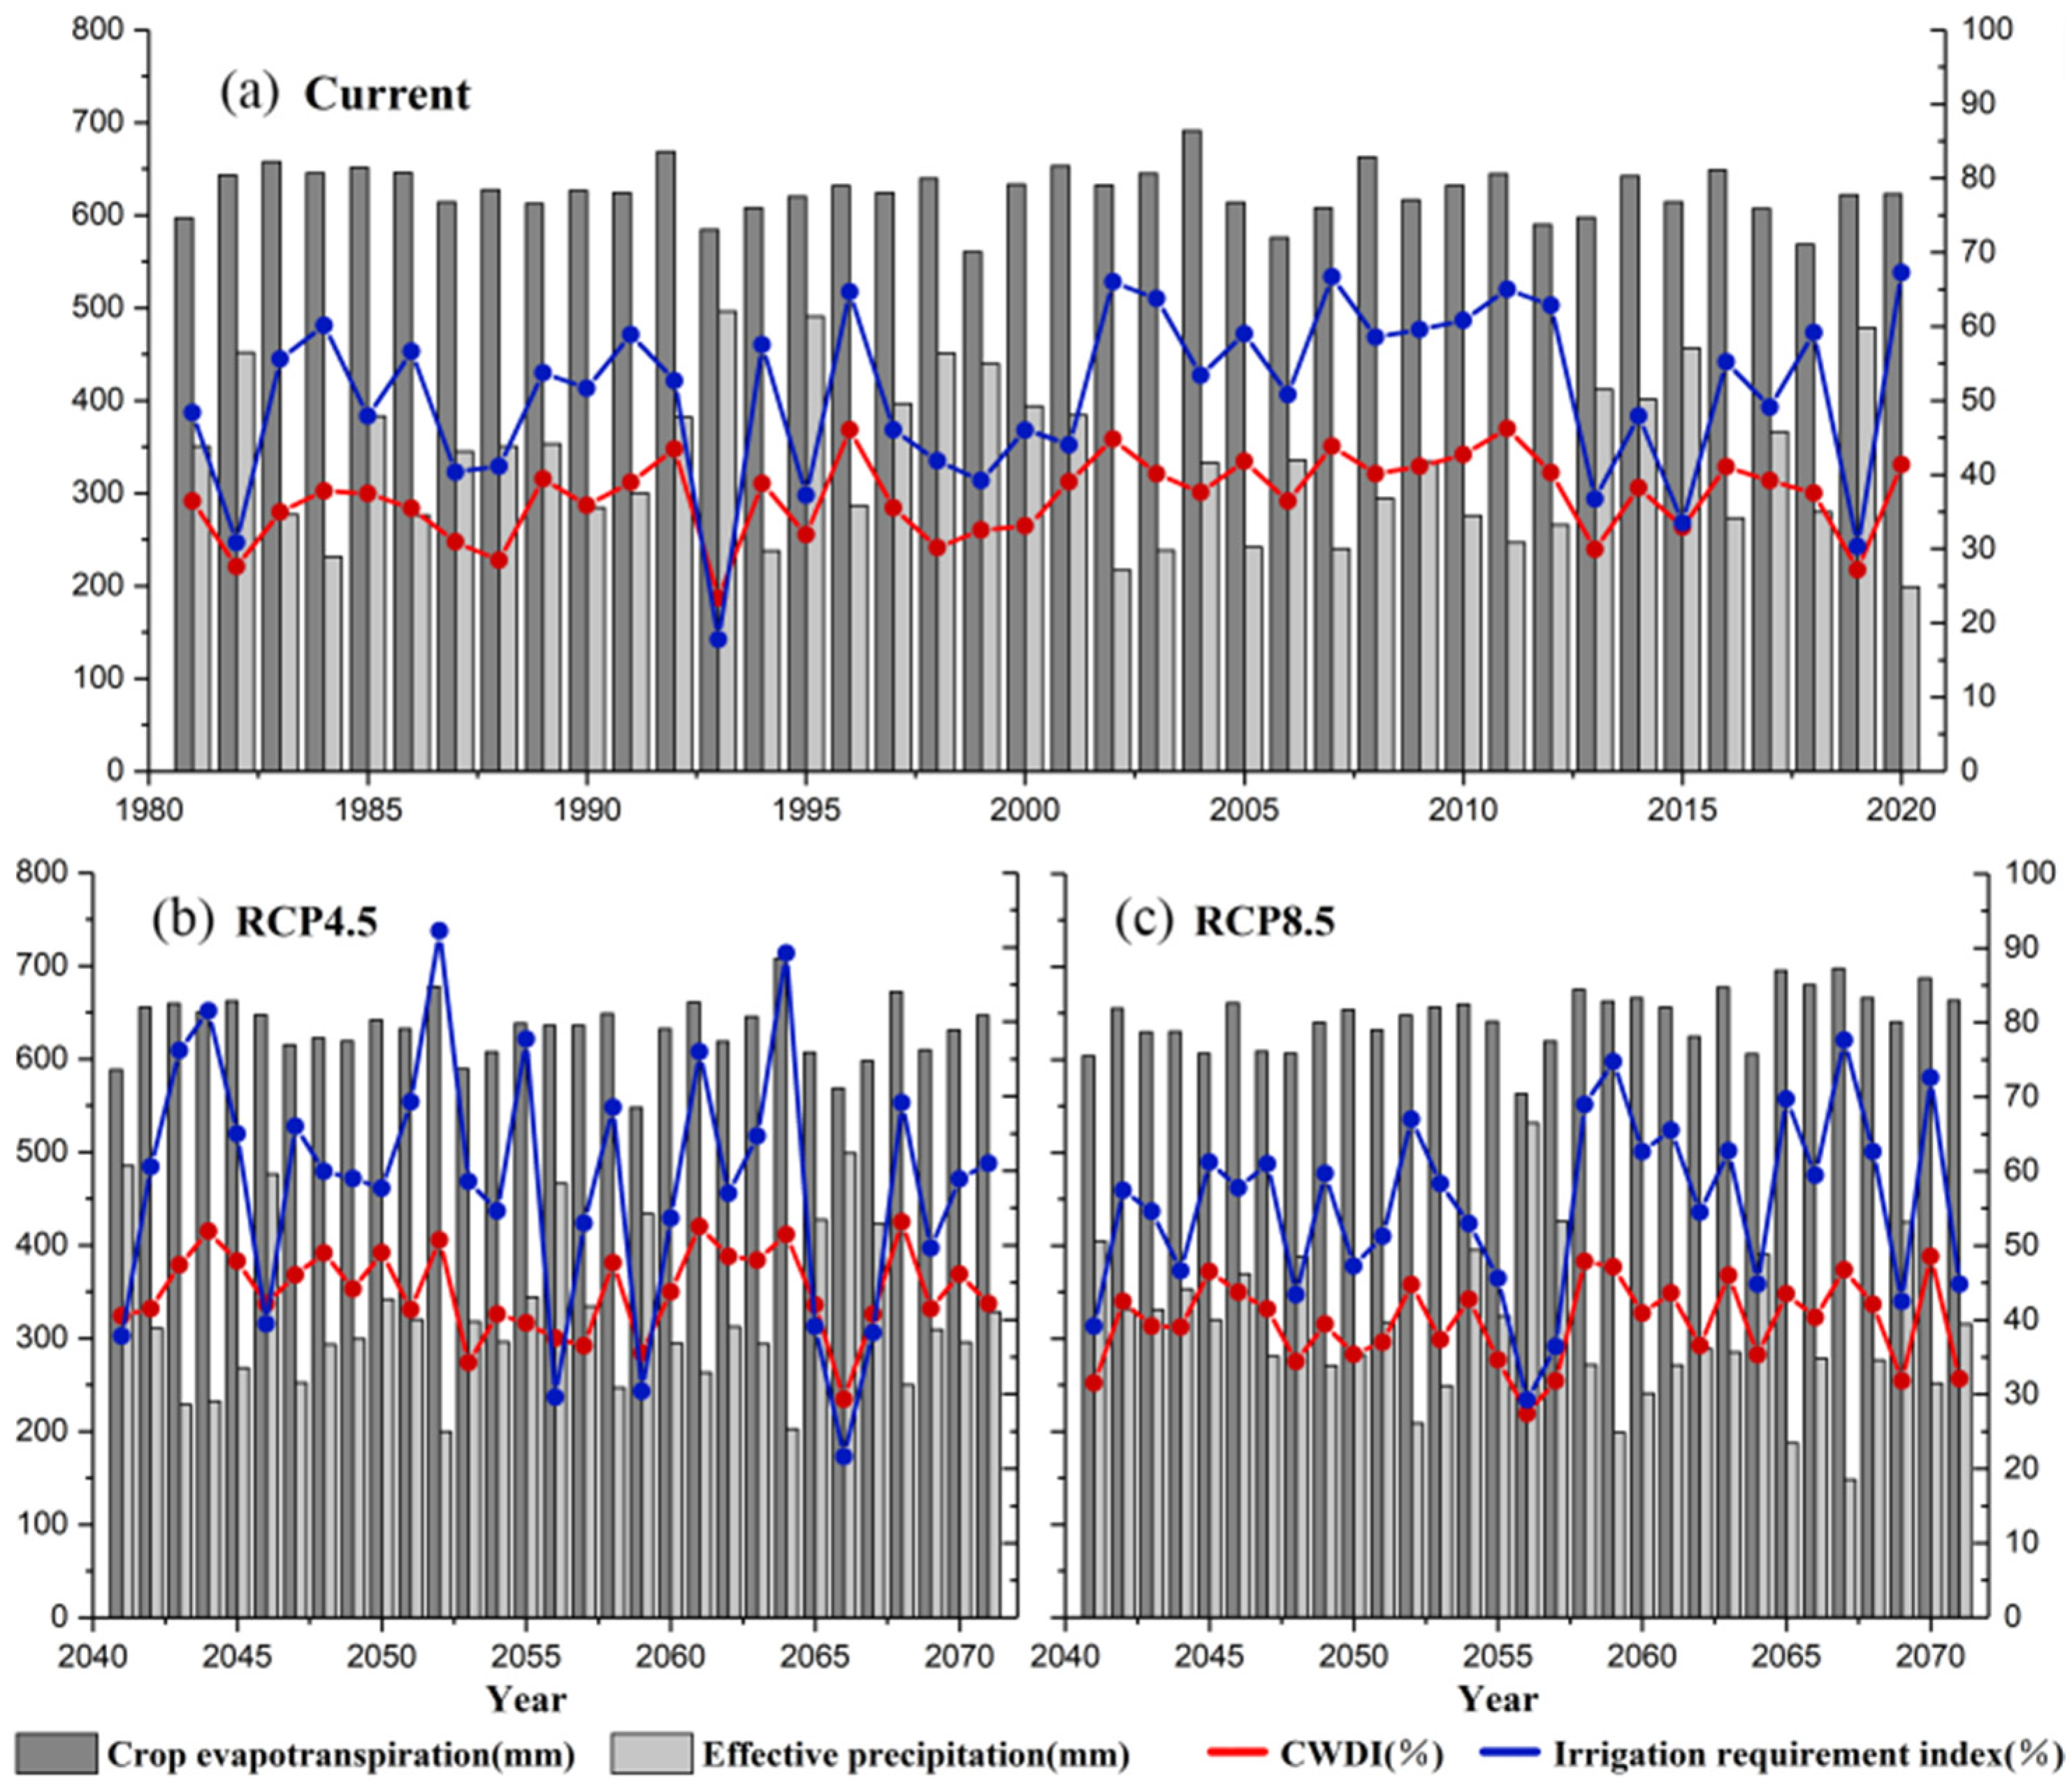
3.5.2. Analysis of the Temporal Trends of Maize Water Supply and Demand

The water supply and demand trend of maize in midwestern Jilin Province is shown in Figure 10. During 1980–2020, the CWDI and IRI had similar trends. Both reached their minimum values in 1993 (CWDI = 23.35%, IRI = 17.76%). During the same year, the Pe reached a 40-year maximum of 496.14 mm. The changes in ETc and Pe were inversely correlated, i.e., as one fell and the other one increased. The ETc fluctuated slightly over 40 years with an average value of 625.22 mm. The maximum and minimum occurred in 2004 (691.28 mm) and 1999 (560.51 mm), respectively. In the future, the ETc is projected to be higher in both the RCP4.5 (631.54 mm) and RCP8.5 (645.76 mm) scenarios compared with those between 1980 and 2020. These scenarios suggest that there will be significant temperature increases in the future and a clear trend toward warming and drying in midwestern Jilin Province, which is consistent with previous results [39,69]. Increasing precipitation did not increase the Pe. Instead, the Pe is 324.17 mm in the RCP4.5 scenario and 310.28 mm in the RCP8.5 scenario. Both will decrease compared with the value between 1980 and 2020 (Pe = 336.37 mm). This may be owing to the effect of substantial warming offsetting the effects of precipitation, increasing evapotranspiration and allowing less Pe to be used by crops. Under the scenario of RCP4.5, the CWDI fluctuated greatly, and the maximum and minimum appeared in 2068 (53.14%) and 2066 (29.32%), respectively. The minimum IRI will occur in 2066 (21.61%). In the same year, the Pe will be the largest (499.17 mm). Interestingly, the minimum Pe (199.81 mm) will occur in the same year as the maximum IRI (91.03%), and both are projected to occur in 2052. Under the RCP8.5 scenario, the average IRI is 55.88%. With the increasing risk of drought, the IRI in study area is at a high level (Figure 9). Previous studies have shown that the change in IRI may be affected by temperature, precipitation, and the concentration of CO2 [70]. Increased temperatures may enhance respiration, leading to a decrease in the net photosynthetic rate, further reducing the efficiency of water use by crops and increasing the need for irrigation. As a C4 crop, elevated concentrations of CO2 in the future may affect respiration and photosynthesis in maize, thus, affecting material accumulation and yield. The increase of CO2 will cause stomatal closure and reduce transpiration and water loss. However, a warming climate will increase the water loss from transpiration and soil. Stomatal closure will shorten, and the amount of water loss will increase over the long-term. Even if the irrigation pressure on the crop is relieved over the short term, it will eventually increase the demand for irrigation water, particularly in arid and semiarid areas, which will undoubtedly decrease the profitability of maize industry [71,72].

3.6. Change of Maize Yield

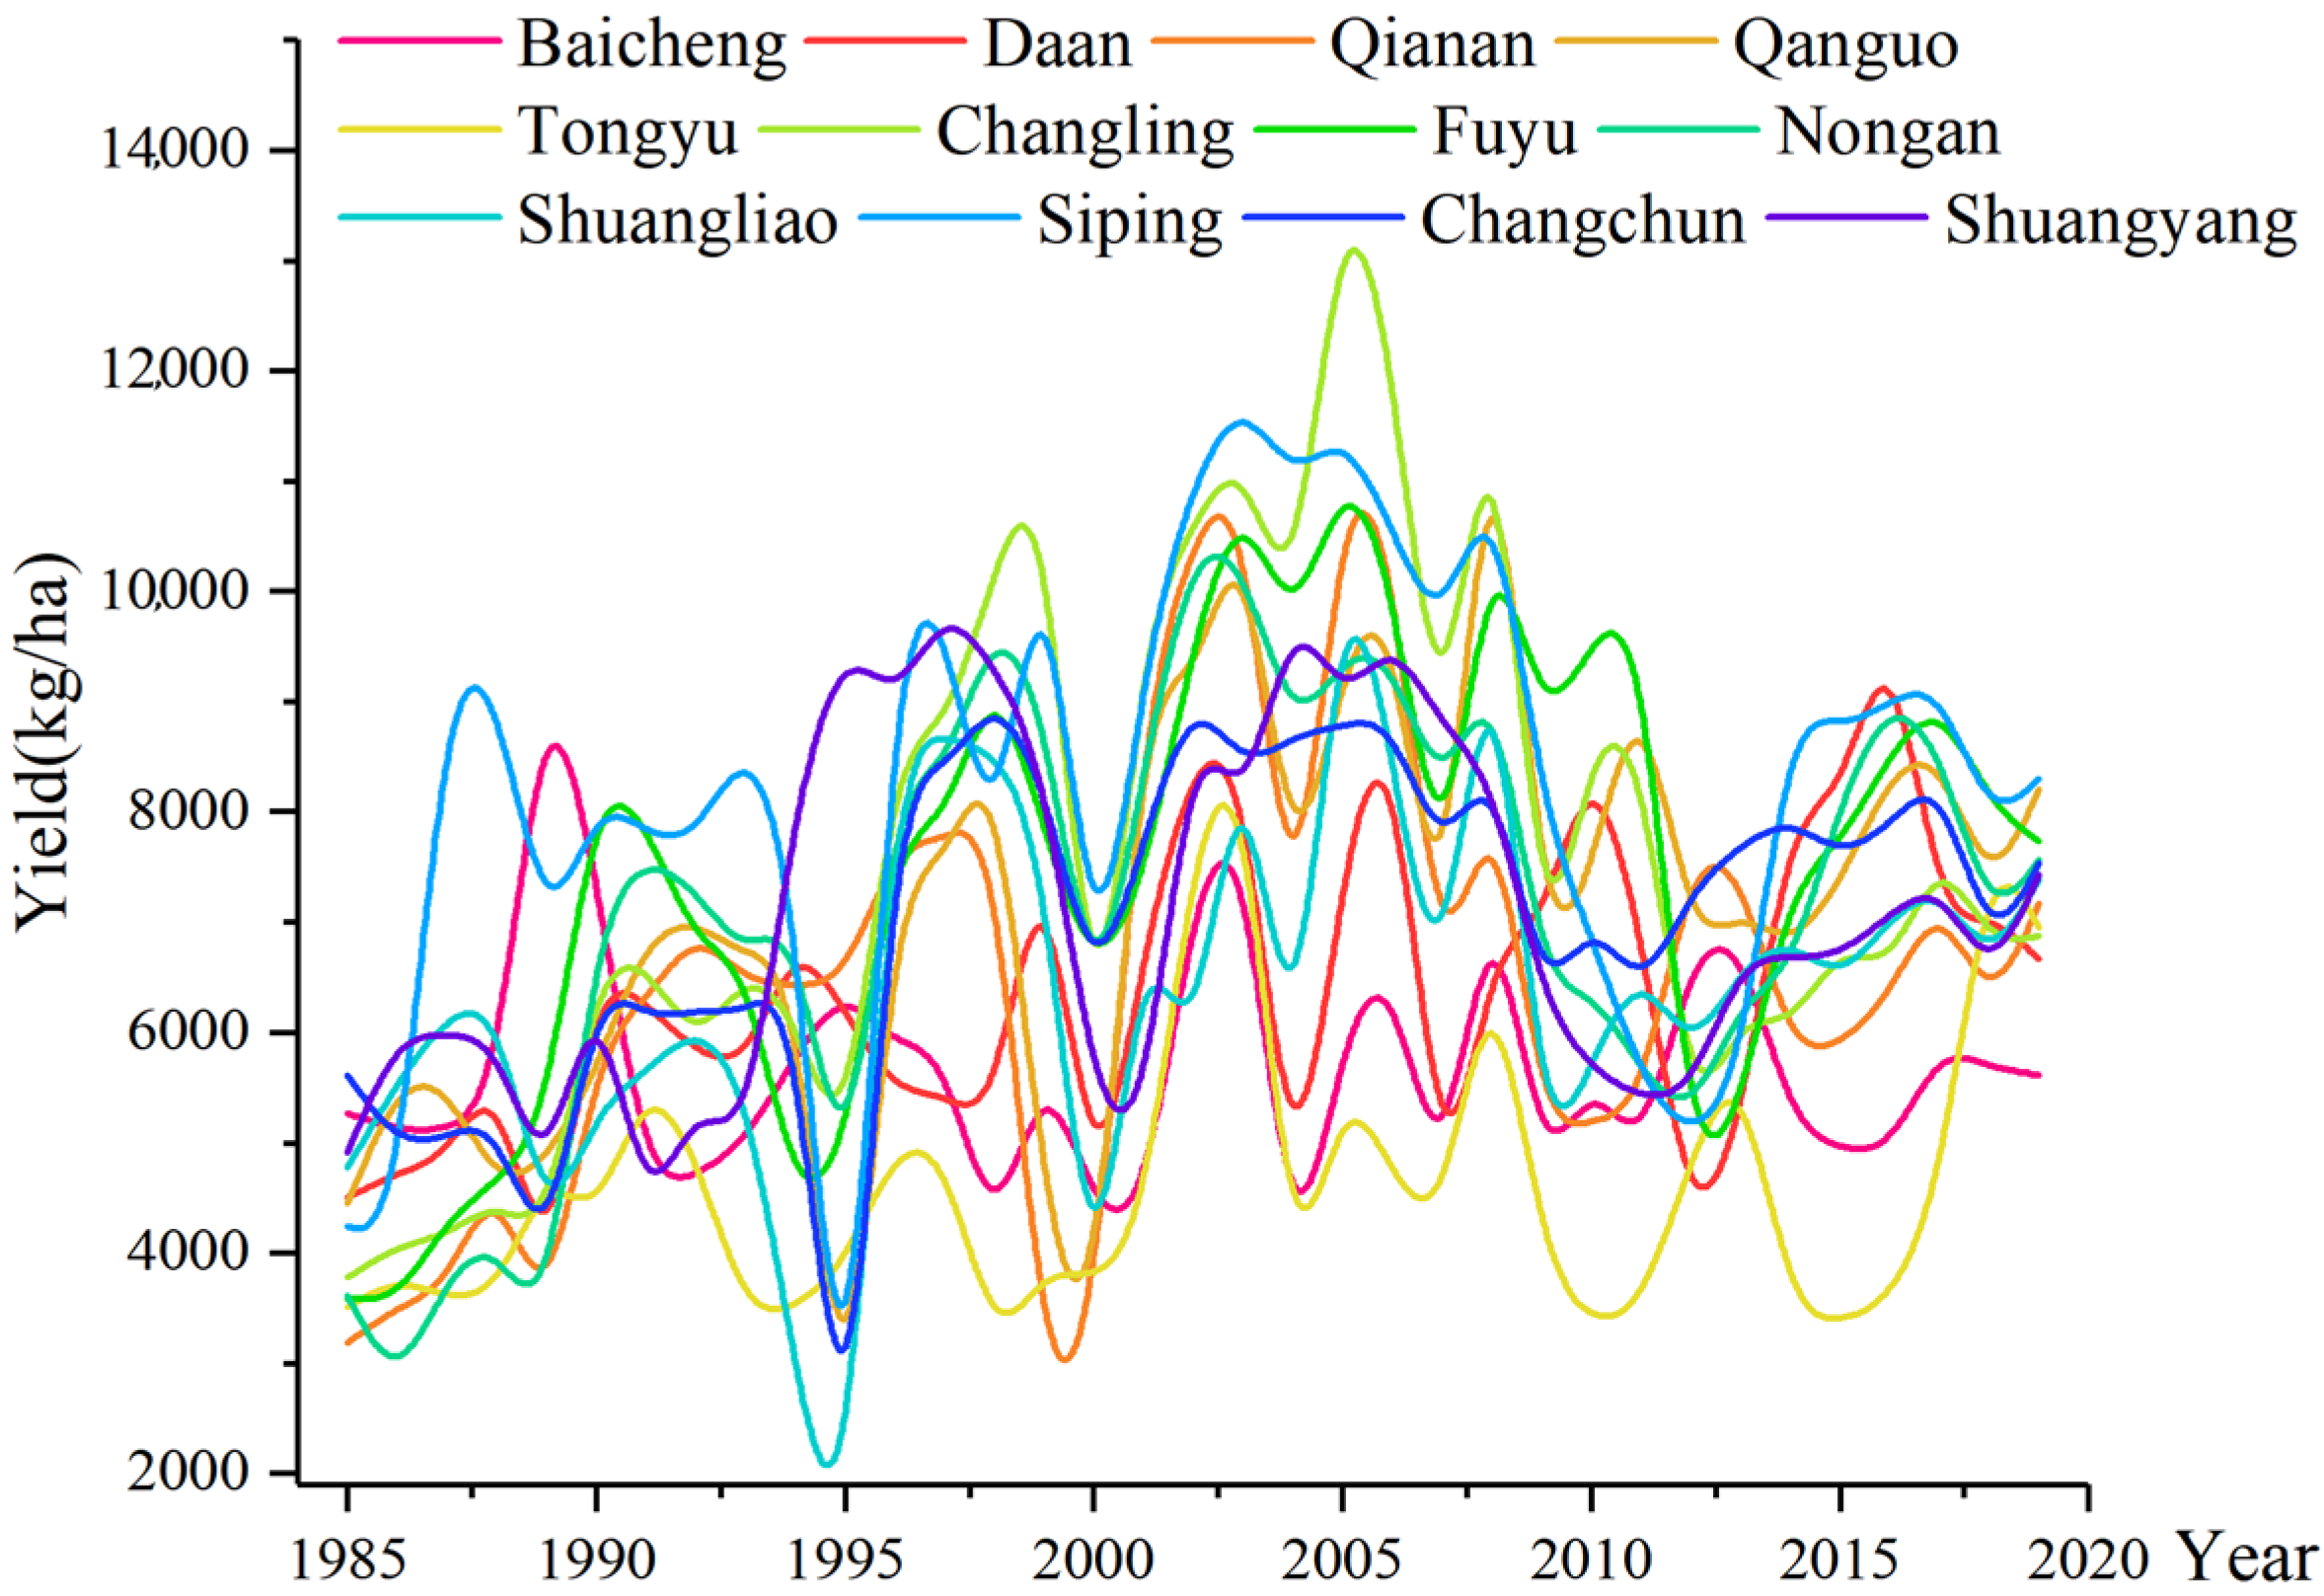
3.6.1. Analysis of the Maize Yield Changes in the Midwestern Jilin Province

Figure 11 shows the change in the maize yield unit area from 1985 to 2020 in midwestern Jilin Province. The average annual maize yield unit across the counties was 7002.24 kg/ha. Siping, Changling, Shuangliao, Shuangyang, and Gan an all tended to reduce production. The lowest maize yield unit area in several counties occurred in 1989 and 1995, and a review of the Statistical Yearbook and the Disaster Dictionary revealed that the drought was severe in many counties in those years. Between 2003 and 2005, the maximum yield unit area of maize was achieved in many areas. In 2005, Changling was 13,976.08 kg/ha and Fuyu was 11,182.27 kg/ha. After 2010, the fluctuation in maize yields was relatively stable.

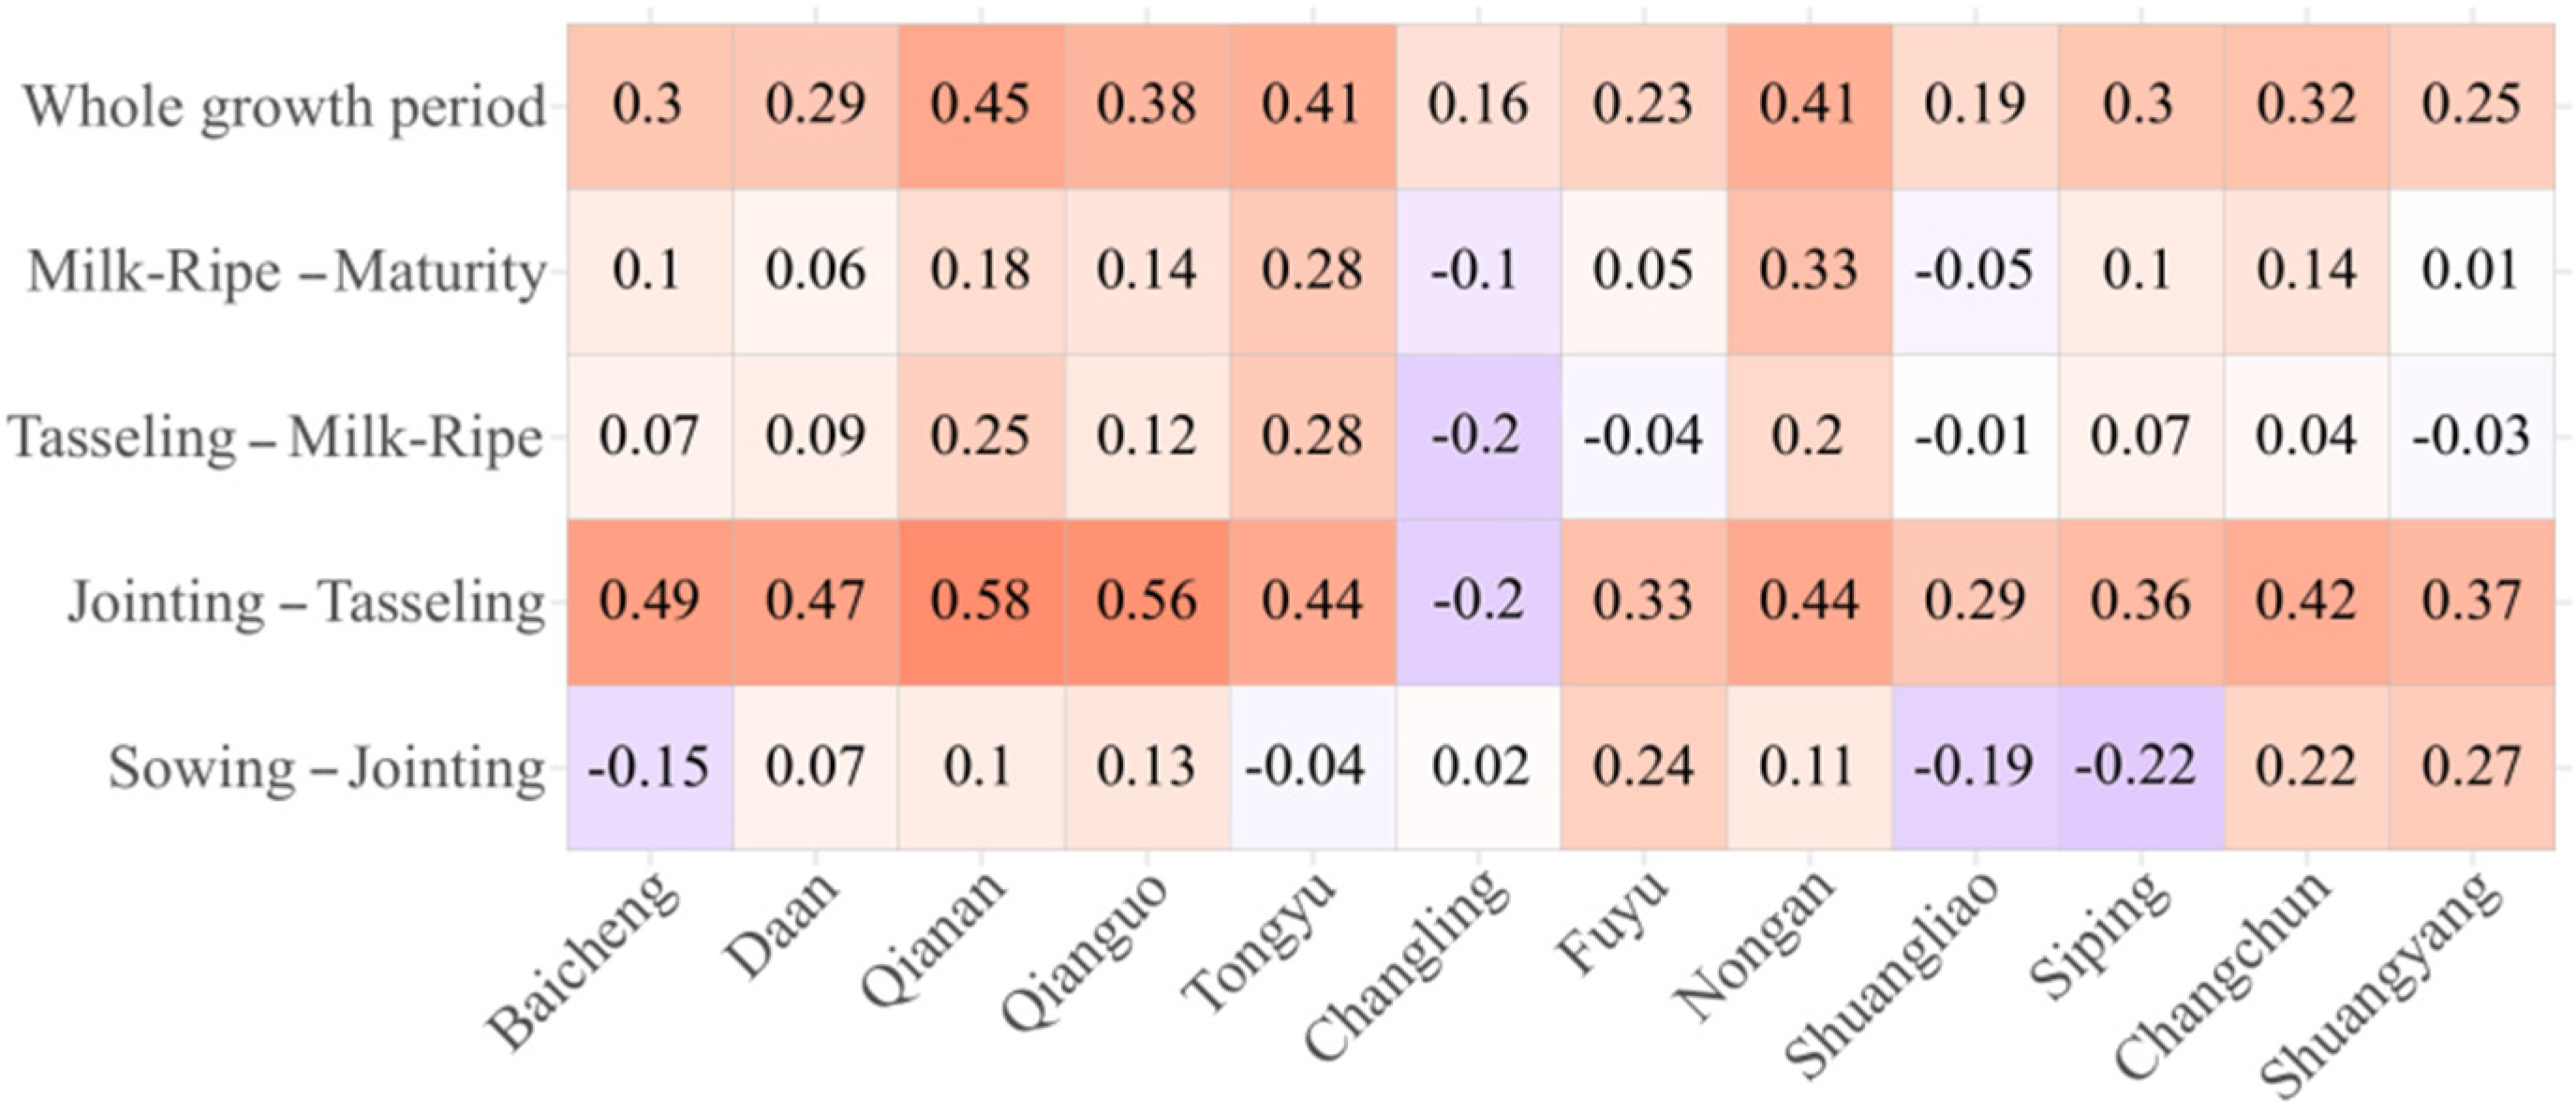
3.6.2. Relationship between Maize Yw and the CWDI

The results of a correlation analysis of maize Yw and CWDI in midwestern Jilin Province are shown in Figure 12. The Yw of maize was positively correlated with the CWDI in most areas, with a higher correlation from jointing to tasseling. This was true for Baisheng, Da’an, Qian’an, and Qianguo in particular. This indicates that the yield of maize is more affected by the water deficit during the period from jointing to tasseling. There was a negative correlation between the CWDI and Yw from sowing to jointing, and the correlation was weak. Maize plants are short at this time, and the temperature is lower. Thus, less water is required. In addition, the correlation between the two was weak at each growth stage in Changling, in which the yields were less affected by water stress. The CWDI had the highest correlation with maize Yw during the whole growth period. Therefore, the CWDI was selected to analyze the whole growth period to establish a regression equation with Yw to analyze future changes in the yield of maize.

3.6.3. The Impact of Drought on Maize Yields

As shown in Table 3, the average rate in reduction of yield and average coefficient of variation of maize were 10.18 and 1.52 from 1980 to 2020, respectively. Both values indicate a high risk (Table 1). The rate of yield reduction in Qian’an and Changchun was higher, which indicated that maize was affected by drought. The coefficient of variation in meteorological yield reduction was high in all counties, particularly in Fuyu and Tongyu. Under different scenarios in the future, with the exception of Da’an and Qianguo, the rate of yield reduction and coefficient of variation in many counties were at a low level. This indicates that the trend in the reduction of maize yield will be relatively concentrated in the future; the change in yield will be relatively stable, and there will be fewer extremes of abundant or lean years. This may be because the occurrence of natural disasters is often local and sudden. As maize is a global and strategic food crop, the stability of its yield is influenced by many factors, such as policies, markets, and technology.

3.7. Limitations of This Study

Despite these important findings, there are some limitations that should be noted. The climate, topography, and soil conditions between different regions can have an impact on Kc and Pe. Thus, the methods of calculating Kc and Pe should be refined in future studies to obtain more accurate results. In this study, only the CWDI was used as an index to study the risk of maize drought in midwestern Jilin Province, which excluded the disturbance of soil water stress. More indicators should be added in future studies that factor in the characteristics of the crop. In fact, the factors that affect the balance of crop water supply and demand are very complex, and it will be more effective to reveal the influencing process if we can combine it with the mechanically strong crop growth model. The factors that affect the requirements for irrigation water include the crop area sown, cropping system, and altitude and latitude, among others. However, this study did not examine the differences among different maize planting varieties, such as their period of growth and the resistance of variety. These factors merit supplementation and further study in the future.

4. Conclusions

In this study, we used midwestern Jilin Province, the main maize production area of China, as the study area to explore the spatiotemporal characteristics of maize water supply and demand balance and drought risk under climate change. Simultaneously, the impact of meteorological disasters on the yield is predicted. The main conclusions are as follows:
(1) We compared the 33 models published by CMIP5 with observations from agrometeorological stations in the study area from 1960 to 2020. We found that the simulation of temperature in each model is generally better than that of precipitation. The FIO-ESM, developed by the First Institute of Oceanography of the State Oceanic Administration of China, can very effectively simulate temperature and precipitation. It is applicable to the prediction of future scenario changes in Jilin Province.
(2) The drought risk was higher from sowing to jointing and from milk-ripe to maturity, followed by jointing to tasseling and from tasseling to milk-ripe. In the future, midwestern Jilin Province will still face a great threat of drought. The drought risk index of the whole growth period was 0.61 and 0.56, respectively. Spatially, the high risk areas show a “west-central-southwest” shift pattern. Baicheng, Tongyu, Zhenlai, and Da’an are at a high risk of drought. The higher risk of drought has a greater impact on maize production, and drought resistance measures should be intensified during the milk-ripe stage. There should be an enhancement of agricultural drainage and irrigation facilities.
(3) Pe has always had difficulty in meeting the maize demand for water in the study area, particularly during the milk-ripe to maturity stage. Soil tillage techniques that store water and retain moisture should be used in spring. Mitigate yield losses due to drought through irrigation during the summer and autumn drought prone periods. Improving irrigation conditions and gradually replacing the less efficient water use techniques of well irrigation will help address the substantial challenges facing irrigated agriculture in the midwestern Jilin Province in the future.
(4) The Yw of maize in midwestern Jilin Province positively correlated with the CWDI. In 2041–2071, the impact of damage to maize yield is moderated under both climate scenarios. Future climate change may have some positive effects on maize production. In particular, maize yields are less affected by meteorological disasters under the RCP8.5 scenario.

Supplementary Materials

The following are available online at https://www.mdpi.com/article/10.3390/w13182490/s1, Figure S1: Correlation of various statistics for different periods (Current, RCP 4.5, RCP 8.5), Table S1: Information of 33 global climate models from CMIP5, Table S2: M-K test and Sen’s slope of variable for different periods.

Author Contributions

Conceptualization, Y.M. and Z.T.; Data curation, Y.M. and K.L.; Funding acquisition, J.Z.; Methodology, Y.M.; Writing—original draft, Y.M. and C.Z.; Writing—review and editing, S.D. and X.L. All authors have read and agreed to the published version of the manuscript.

Funding

This study is supported by the National Key Research and Development Program of China (2019YFD1002201); The National Natural Science Foundation of China (41877520, 42077443); The Science and Technology Development Planning of Jilin Province (20190303018SF); Key Research and Projects Development Planning of Jilin Province (20200403065SF); Industrial technology research and development project supported by Development and Reform Commission of Jilin Province (2021C044-5); and The Science and Technology Planning of Changchun (19SS007).

Institutional Review Board Statement

Not applicable.

Informed Consent Statement

Not applicable.

Data Availability Statement

The data presented in this study are available on request from the corresponding author.

Acknowledgments

We appreciate the editors and the reviewers for their constructive suggestions and insightful comments, which helped greatly to improve this manuscript.

Conflicts of Interest

The authors declare no conflict of interest.

References

  1. IPCC. Working Group I Contribution to the IPCC Fifth Assessment Report. In Climate Change 2013: The Physical Science Basis: Summary for Policymakers; Cambridge University Press: Cambridge, UK, 2014. [Google Scholar]
  2. Ji, F.; Wu, Z.; Huang, J.; Chassignet, E. Evolution of land surface air temperature trend. Nat. Clim. Chang. 2014, 6, 462–466. [Google Scholar] [CrossRef]
  3. Paparrizos, S.; Matzarakis, A. Assessment of future climate change impacts on the hydrological regime of selected Greek areas with different climate conditions. Hydrol. Res. 2017, 48, 1327–1342. [Google Scholar] [CrossRef]
  4. Gao, X.; Shi, Y.; Giorgi, F. A high resolution simulation of climate change over China. Sci. China Earth Sci. 2011, 54, 462–472. [Google Scholar] [CrossRef]
  5. Thomas, A. Agricultural irrigation demand under present and future climate scenarios in China. Glob. Planet Chang. 2008, 60, 306–326. [Google Scholar] [CrossRef]
  6. Bodner, G.; Nakhforoosh, A.; Kaul, H.P. Management of crop water under drought: A review. Agron. Sustain. Dev. 2015, 35, 401–442. [Google Scholar] [CrossRef]
  7. Wang, Y.; Zhou, B.; Qin, D.; Wu, J.; Gao, R.; Song, L. Changes in mean and extreme temperature and precipitation over the arid region of northwestern China: Observation and projection. Adv. Atmos. Sci. 2017, 34, 289–305. [Google Scholar] [CrossRef]
  8. Aliyari, F.; Bailey, R.T.; Arabi, M. Appraising climate change impacts on future water resources and agricultural productivity in agro-urban river basins. Sci. Total Environ. 2021, 788, 147717. [Google Scholar] [CrossRef] [PubMed]
  9. Masia, S.; Trabucco, A.; Spano, D.; Snyder, R.L.; Sušnik, J.; Marras, S. A modelling platform for climate change impact on local and regional crop water requirements. Agric. Water Manag. 2021, 255, 107005. [Google Scholar] [CrossRef]
  10. Hamdy, A.; Ragab, R.; Scarascia-Mugnozza, E. Coping with water scarcity: Water saving and increasing water productivity. Irrig. Drain. 2003, 52, 3–20. [Google Scholar] [CrossRef]
  11. Qin, Z.; Tang, H.; Li, W.; Zhang, H.; Zhao, S.; Wang, Q. Modelling impact of agro-drought on grain production in China. Int. J. Disast. Risk Reduct. 2014, 7, 109–121. [Google Scholar] [CrossRef]
  12. Zhang, J.; Yang, J.; An, P.; Ren, W.; Pan, Z.; Dong, Z.; Han, G.; Pan, Y.; Pan, S.; Tian, H. Enhancing soil drought induced by climate change and agricultural practices: Observational and experimental evidence from the semiarid area of northern China. Agric. Forest Meteorol. 2017, 243, 74–83. [Google Scholar] [CrossRef]
  13. Xiong, W.; Conway, D.; Lin, E.; Xu, Y.; Ju, H.; Jiang, J.; Holman, I.; Li, Y. Future cereal production in China: The interaction of climate change, water availability and socio-economic scenarios. Glob. Environ. Chang. 2009, 19, 34–44. [Google Scholar] [CrossRef]
  14. Golfam, P.; Ashofteh, P.S.; Loáiciga, H.A. Modeling adaptation policies to increase the synergies of the water-climate-agriculture nexus under climate change. Environ. Dev. 2021, 37, 100612. [Google Scholar] [CrossRef]
  15. Gurara, M.A.; Jilo, N.B.; Tolche, A.D. Impact of climate change on potential evapotranspiration and crop water requirement in Upper Wabe Bridge watershed, Wabe Shebele River Basin, Ethiopia. J. Afr. Earth Sci. 2021, 180, 104223. [Google Scholar] [CrossRef]
  16. Zareian, M.J. Optimal water allocation at different levels of climate change to minimize water shortage in arid regions (Case Study: Zayandeh-Rud River Basin, Iran). J. Hydro-Environ. Res. 2021, 35, 13–30. [Google Scholar] [CrossRef]
  17. Grusson, Y.; Wesström, I.; Svedberg, E.; Joel, A. Influence of climate change on water partitioning in agricultural watersheds: Examples from Sweden. Agric. Water Manag. 2021, 249, 106766. [Google Scholar] [CrossRef]
  18. Deng, X.; Shan, L.; Zhang, H.; Turner, N.C. Improving agricultural water use efficiency in arid and semiarid areas of China. Agric. Water Manag. 2006, 80, 23–40. [Google Scholar] [CrossRef]
  19. Seneviratne, S.I.; Corti, T.; Davin, E.L.; Hirschi, M.; Jaeger, E.B.; Lehner, I.; Orlowsky, B.; Teuling, A.J. Investigating soil moisture-climate interactions in a changing climate: A review. Earth Sci. Rev. 2010, 99, 125–161. [Google Scholar] [CrossRef]
  20. Zhu, X.; Xu, K.; Liu, Y.; Guo, R.; Chen, L. Assessing the vulnerability and risk of maize to drought in China based on the AquaCrop model. Agric. Syst. 2021, 189, 103040. [Google Scholar] [CrossRef]
  21. Chang, H.; He, G.; Wang, Q.; Li, H.; Zhai, J.; Dong, Y.; Zhao, Y.; Zhao, J. Use of sustainability index and cellular automata-Markov model to determine and predict long-term spatio-temporal variation of drought in China. J. Hydrol. 2021, 598, 126248. [Google Scholar] [CrossRef]
  22. Guna, A.; Zhang, J.; Tong, S.; Bao, Y.; Han, A.; Li, K. Effect of Climate Change on Maize Yield in the Growing Season: A Case Study of the Songliao Plain Maize Belt. Water 2019, 11, 2108. [Google Scholar] [CrossRef] [Green Version]
  23. Wang, R.; Zhang, J.; Wang, C.; Guo, E. Characteristic Analysis of Droughts and Waterlogging Events for Maize Based on a New Comprehensive Index through Coupling of Multisource Data in Midwestern Jilin Province, China. Remote Sens. 2020, 1, 60. [Google Scholar] [CrossRef]
  24. Bertolino, L.T.; Caine, R.S.; Gray, J.E. Impact of stomatal density and morphology on water-use efficiency in a changing world. Front. Plant Sci. 2019, 10, 225. [Google Scholar] [CrossRef] [Green Version]
  25. Tanasijevic, L.; Todorovic, M.; Pereira, L.S.; Pizzigalli, C.; Lionello, P. Impacts of climate change on olive crop evapotranspiration and irrigation requirements in the Mediterranean region. Agric. Water Manag. 2014, 144, 54–68. [Google Scholar] [CrossRef]
  26. Gustafson, D.I.; Jones, J.W.; Porter, C.H.; Hyman, G.; Edgerton, M.D.; Gocken, T.; Shryock, J.; Doane, M.; Budreski, K.; Stone, C.; et al. Climate adaptation imperatives: Untapped global maize yield opportunities. Int. J. Agric. Sustain. 2014, 12, 471–486. [Google Scholar] [CrossRef]
  27. Zhang, J. Risk assessment of drought disaster in the maize-growing region of Songliao Plain, 795 China. Agric. Ecosyst. Environ. 2004, 102, 133–153. [Google Scholar] [CrossRef]
  28. Liu, Z.; Yang, X.; Hubbard, K.G.; Lin, X. Maize potential yields and yield gaps in the changing climate of northeast China. Glob. Chang. Biol. 2012, 18, 3441–3454. [Google Scholar] [CrossRef]
  29. Zhao, Z.; Lin, C.; Xie, Y.; Chen, Y.; Lin, Y.; Yi, S. The novel Chinese abacus adder. In Proceedings of the 2007 International Symposium on VLSI Design, Automation and Test (VLSI-DAT), Hsinchu, Taiwan, 25–27 April 2007; IEEE: Piscataway, NJ, USA, 2007; pp. 1–4. [Google Scholar] [CrossRef]
  30. Guo, E.; Zhang, J.; Wang, Y.; Quan, L.; Zhang, R.; Zhang, F.; Zhou, M. Spatiotemporal variations of extreme climate events in Northeast China during 1960–2014. Ecol. Indic. 2019, 96, 669–683. [Google Scholar] [CrossRef]
  31. Xu, X.; Ge, Q.; Zheng, J.; Dai, E.; Zhang, X.; He, S.; Liu, G. Agricultural drought risk analysis based on three main crops in prefecture-level cities in the monsoon region of east China. Nat. Hazards 2013, 66, 1257–1272. [Google Scholar] [CrossRef]
  32. Zhou, Z.; Shi, H.; Fu, Q.; Li, T.; Gan, T.G.; Liu, S. Assessing spatiotemporal characteristics of drought and its effects on climate-induced yield of maize in Northeast China. J. Hydrol. 2020, 588, 125097. [Google Scholar] [CrossRef]
  33. Xu, H.; Tian, Z.; He, X.; Wang, J.; Sun, L.; Fischer, G.; Fan, D.; Zhong, H.; Wu, W.; Pope, E.; et al. Future increases in irrigation water requirement challenge the water-food nexus in the northeast farming region of China. Agric. Water Manag. 2019, 213, 594–604. [Google Scholar] [CrossRef]
  34. Kunrath, T.R.; Lemaire, G.; Teixeira, E.; Brown, H.E.; Ciampitti, I.A.; Sadras, V.O. Allometric relationships between nitrogen uptake and transpiration to untangle interactions between nitrogen supply and drought in maize and sorghum. Eur. J. Agron. 2020, 120, 126145. [Google Scholar] [CrossRef]
  35. Patanè, C.; Tringali, S.; Sortino, O. Effects of deficit irrigation on biomass, yield, water productivity and fruit quality of processing tomato under semi-arid Mediterranean climate conditions. Sci. Hortic. 2011, 129, 590–596. [Google Scholar] [CrossRef]
  36. Bonfante, A.; Sellami, M.H.; Abi Saab, M.T.; Albrizio, R.; Basile, A.; Fahed, S.; Giorio, P.; Langella, G.; Monaco, E.; Bouma, J. The role of soils in the analysis of potential agricultural production: A case study in Lebanon. Agric. Syst. 2017, 156, 67–75. [Google Scholar] [CrossRef]
  37. Philip, J.R. Plant water relations: Some physical aspects. Ann. Rev. Plant Physiol. 1966, 17, 245–268. [Google Scholar] [CrossRef]
  38. Gornall, J.; Betts, R.; Burke, E.; Clark, R.; Camp, J.; Willett, K.; Wiltshire, A. Implications of climate change for agricultural productivity in the early twenty-first century. Philos. Trans. R. Soc. 2010, 365, 2973. [Google Scholar] [CrossRef] [PubMed]
  39. Schmidhuber, J.; Tubiello, F.N. Global food security under climate change. Proc. Natl. Acad. Sci. USA 2007, 50, 19703–19708. [Google Scholar] [CrossRef] [PubMed] [Green Version]
  40. Zhao, J.; Guo, J. Multidecadal changes in moisture condition during climatic growing period of crops in Northeast China. Phys. Chem. Earth Parts A/B/C 2015, 87–88, 28–42. [Google Scholar] [CrossRef]
  41. Liu, Y.; Zhang, J.; Qin, Y. How global warming alters future maize yield and water use efficiency in China. Technol. Forecast. Soc. Chang. 2020, 160, 120229. [Google Scholar] [CrossRef]
  42. Zou, Y.; Saddique, Q.; Ali, A.; Xu, J.; Khan, M.I.; Qing, M.; Azmat, M.; Cai, H.; Siddique, K.H. Deficit irrigation improves maize yield and water use efficiency in a semi-arid environment. Agric. Water Manag. 2021, 243, 106483. [Google Scholar] [CrossRef]
  43. Attia, A.; El-Hendawy, S.; Al-Suhaibani, N.; Alotaibi, M.; Tahir, M.U.; Kamal, K.Y. Evaluating deficit irrigation scheduling strategies to improve yield and water productivity of maize in arid environment using simulation. Agric. Water Manag. 2021, 249, 106812. [Google Scholar] [CrossRef]
  44. Zhang, F.; Chen, Y.; Zhang, J.; Guo, E.; Wang, R.; Li, D. Dynamic drought risk assessment for maize based on crop simulation model and multi-source drought indices. J. Clean. Prod. 2019, 233, 100–114. [Google Scholar] [CrossRef]
  45. Guo, E.; Liu, X.; Zhang, J.; Wang, Y.; Wang, C.; Wang, R.; Li, D. Assessing spatiotemporal variation of drought and its impact on maize yield in Northeast China. J. Hydrol. 2017, 553, 231–247. [Google Scholar] [CrossRef]
  46. Norwood, C.A. Water use and yield of limited-irrigated and dryland corn. Soil Sci. Soc. Am. J. 2000, 64, 365–370. [Google Scholar] [CrossRef]
  47. Meinshausen, M.; Smith, S.J.; Calvin, K.; Daniel, J.S.; Kainuma, M.L.T.; Lamarque, J.-F.; Matsumoto, K.; Montzka, S.A.; Raper, S.C.B.; Riahi, K.; et al. The RCP greenhouse gas concentrations and their extensions from 1765 to 2300. Clim. Chang. 2011, 109, 213. [Google Scholar] [CrossRef] [Green Version]
  48. Taylor, K.E.; Stouffer, R.J.; Meehl, G.A. An overview of CMIP5 and the experiment design. Bull. Am. Meteorol. Soc. 2012, 93, 485–498. [Google Scholar] [CrossRef] [Green Version]
  49. Taylor, K.E. Summarizing multiple aspects of model performance in a single diagram. J. Geophys. Res. 2001, 106, 7183–7192. [Google Scholar] [CrossRef]
  50. Wang, R.; Zhang, J.; Guo, E.; Li, D.; Si, H.; Si, A. Spatiotemporal characteristics of drought and waterlogging during maize growing season in midwestern Jilin province for recent 55 years. J. Nat. Disasters 2018, 27, 186–197. [Google Scholar] [CrossRef]
  51. Kang, S.; Cai, H. Agricultural Water Management Science; China Agricultural Press: Beijing, China, 1996. (In Chinese) [Google Scholar]
  52. Döll, P.; Siebert, S. Global modeling of irrigation water requirements. Water Resour. Res. 2002, 38, 1037. [Google Scholar] [CrossRef]
  53. Patwardhan, A.S.; Nieber, J.L.; Johns, E.L. Effective Rainfall Estimation Methods. J. Irrig. Drain. Eng. 1990, 116, 182–193. [Google Scholar] [CrossRef]
  54. Shen, Y.; Li, S.; Chen, Y.; Qi, Y.; Zhang, S. Estimation of regional irrigation water requirement and water supply risk in the arid region of Northwestern China 1989–2010. Agric. Water Manag. 2013, 128, 55–64. [Google Scholar] [CrossRef]
  55. Zhang, Y.; Wang, Y.; Niu, H. Effects of temperature, precipitation and carbon dioxide concentrations on the requirements for crop irrigation water in China under future climate scenarios. Sci. Total Environ. 2019, 656, 373–387. [Google Scholar] [CrossRef]
  56. Lobell, D.B.; Asner, G.P. Climate and management contributions to recent trends in U.S. Agric. Yields Sci. 2003, 299, 1032. [Google Scholar] [CrossRef]
  57. Mitra, S.; Srivastava, P. Spatiotemporal variability of meteorological droughts in southeastern USA. Nat. Hazards 2017, 86, 1007–1038. [Google Scholar] [CrossRef]
  58. Mann, H.B. Nonparametric tests against trend. Econometrica 1945, 13, 245–259. [Google Scholar] [CrossRef]
  59. Kendall, M.G. Rank Correlation Methods; Hafner: New York, NY, USA, 1962. [Google Scholar]
  60. Song, Z.; Guo, J.; Zhang, Z.; Kou, K.; Deng, A.; Zheng, C.; Ren, J.; Zhang, W. Impacts of planting systems on soil moisture, soil temperature and corn yield in rainfed area of Northeast China. Eur. J. Agron. 2013, 50, 66–74. [Google Scholar] [CrossRef]
  61. Wu, J.; He, B.; Lü, A.; Zhou, L.; Liu, M.; Zhao, L. Quantitative assessment and spatial characteristics analysis of agricultural drought vulnerability in China. Nat. Hazards 2011, 56, 785–801. [Google Scholar] [CrossRef]
  62. Karl, T.R.; Knight, R.W. Secular Trends of Precipitation Amount, Frequency, and Intensity in the United States. Bull. Am. Meteorol. Soc. 1998, 79, 231–241. [Google Scholar] [CrossRef]
  63. Mitchell, J.C.; Petolino, J.F. Heat Stress Effects on Isolated Reproductive Organs of Maize. J. Plant Physiol. 1988, 133, 625–628. [Google Scholar] [CrossRef]
  64. Schlenker, W.; Roberts, M.J. Nonlinear temperature effects indicate severe damages to U.S. crop yields under climate change. Proc. Natl. Acad. Sci. USA 2009, 106, 15594–15598. [Google Scholar] [CrossRef] [Green Version]
  65. Wan, W.; Liu, Z.; Li, K.; Wang, G.; Wu, H.; Wang, Q. Drought monitoring of the maize planting areas in Northeast and North China Plain. Agric. Water Manag. 2021, 245, 106636. [Google Scholar] [CrossRef]
  66. Cakir, R. Effect of water stress at different development stages on vegetative and reproductive growth of cron. Field Crops Res. 2004, 89, 1–16. [Google Scholar] [CrossRef]
  67. Abrecht, D.G.; Carberry, P.S. The influence of water deficit prior to tassel initiation on maize growth, development and yield. Field Crops Res. 1993, 31, 55–69. [Google Scholar] [CrossRef]
  68. Liu, Y.; Yang, H.; Li, J.; Li, Y.; Yan, H. Estimation of irrigation requirements for drip-irrigated maize in a sub-humid climate. J. Integ. Agric. 2018, 17, 677–692. [Google Scholar] [CrossRef]
  69. Yu, Z.; Li, X. Recent trends in daily temperature extremes over northeastern China (1960–2011). Quatern. Int. 2015, 380, 35–48. [Google Scholar] [CrossRef]
  70. Ma, A.; Dan, L.; Yuewen, H.U. The extreme dry/wet events in northern China during recent 100 years. J. Geogr. Sci. 2004, 14, 275–281. [Google Scholar] [CrossRef]
  71. Leng, G.Y.; Tang, Q.H. Modeling the impacts of future climate change on irrigation over China: Sensitivity to adjusted projections. J. Hydrometeorol. 2014, 15, 2085–2103. [Google Scholar] [CrossRef]
  72. Turral, H.; Svendsen, M.; Faures, J.M. Investing in irrigation: Reviewing the past and looking to the future. Agric. Water Manag. 2010, 97, 551–560. [Google Scholar] [CrossRef]
Figure 1. Maize water supply and demand balance processes.
Water 13 02490 g001
Figure 2. Location of the study area.
Water 13 02490 g002
Figure 3. Climatic characteristics in midwestern Jilin Province for 1980–2020.
Water 13 02490 g003
Figure 4. Heat maps of the temperature and precipitation of midwestern Jilin Province between the observations and simulation results for 1980–2020.
Water 13 02490 g004
Figure 5. Taylor diagrams for temperature and precipitation of midwestern Jilin region between the observations and simulation results for 1980–2020.
Water 13 02490 g005
Figure 6. Variation of CWDI in the growing season and using the M−K test.
Water 13 02490 g006
Figure 7. Spatial distribution of drought risk in midwestern Jilin Province.
Water 13 02490 g007
Figure 8. Density distribution of the IRI in maize at different growth period.
Water 13 02490 g008
Figure 9. Spatial distribution of the irrigation requirement index (IRI).
Water 13 02490 g009
Figure 10. Annual trends in maize water supply and demand.
Water 13 02490 g010
Figure 11. Fluctuation in the yield of maize in prefectural regions.
Water 13 02490 g011
Figure 12. Pearson’s correlation coefficient of CWDI and Yw in maize growth period in midwestern Jilin Province.
Water 13 02490 g012
Table 1. Classification standard for yield reduction rate and yield reduction coefficient of variation [56].
IndicatorLowMiddleHigh
Yield reduction rate (r)r ≤ 2.892.89 < r ≤ 4.11r ≥ 4.11
Yield reduction coefficient of variation (v)v ≤ 1.341.34 < v ≤1.51v ≥ 1.51
Table 2. Classification standard for drought based on the CWDI (Crop water deficit index).
GradeSowing-JointingJointing-TasselingTasseling-Milk-RipeMilk-Ripe-Maturity
NormalCWDI ≤ 50CWDI ≤ 35CWDI ≤ 35CWDI ≤ 50
Mild50 < CWDI ≤ 6535 < CWDI ≤ 5035 < CWDI ≤ 4550 < CWDI≤60
Moderate65 < CWDI ≤ 7550 < CWDI ≤ 6045 < CWDI ≤ 5560 < CWDI ≤ 70
Severe75 < CWDI ≤ 8560 < CWDI ≤ 7055 < CWDI ≤ 6570 < CWDI ≤ 80
ExtremeCWDI > 85CWDI > 70CWDI > 65CWDI > 80
Table 3. Level of maize disaster risk in midwestern Jilin Province.
StationMeteorological Yield Reduction Rate (r)Meteorological Yield Reduction Coefficient of Variation (v)
CurrentRCP 4.5RCP 8.5CurrentRCP 4.5RCP 8.5
Baicheng7.245.083.501.591.691.31
Daan9.362.233.451.461.951.74
Qianan11.584.516.181.490.660.91
Qianguo2.82.943.151.361.831.73
Tongyu7.924.332.721.731.721.48
Changling7.813.267.251.491.290.95
Fuyu9.422.795.131.780.911.05
Nongan3.731.33.471.661.330.94
Shuangliao14.75.272.771.530.580.35
Siping9.961.998.821.450.720.63
Changchun19.536.744.941.211.210.86
Shuangyang18.155.292.381.480.971.13
Publisher’s Note: MDPI stays neutral with regard to jurisdictional claims in published maps and institutional affiliations.

