Article

Simulating Rainfall Interception by Caatinga Vegetation Using the Gash Model Parametrized on Daily and Seasonal Bases

by
Daniela C. Lopes
1,*,
Antonio José Steidle Neto
1,
Thieres G. F. Silva
2,
Luciana S. B. Souza
2,
Sérgio Zolnier
3 and
Carlos A. A. Souza
2
1
Campus Sete Lagoas, Federal University of São João del-Rei, Rodovia MG 424, Km 47, Sete Lagoas 35701-970, Minas Gerais, Brazil
2
Academic Unit of Serra Talhada, Federal Rural University of Pernambuco, Serra Talhada 56900-000, Pernambuco, Brazil
3
Department of Agricultural Engineering, Federal University of Viçosa, Av. Peter Henry Rolfs, s/n, Viçosa 36570-000, Minas Gerais, Brazil
*
Author to whom correspondence should be addressed.
Water 2021, 13(18), 2494; https://doi.org/10.3390/w13182494
Submission received: 16 August 2021 / Revised: 2 September 2021 / Accepted: 9 September 2021 / Published: 11 September 2021
(This article belongs to the Special Issue Hydrology in Water Resources Management)

Abstract

:
Rainfall partitioning by trees is an important hydrological process in the contexts of water resource management and climate change. It becomes even more complex where vegetation is sparse and in vulnerable natural systems, such as the Caatinga domain. Rainfall interception modelling allows extrapolating experimental results both in time and space, helping to better understand this hydrological process and contributing as a prediction tool for forest managers. In this work, the Gash model was applied in two ways of parameterization. One was the parameterization on a daily basis and another on a seasonal basis. They were validated, improving the description of rainfall partitioning by tree species of Caatinga dry tropical forest already reported in the scientific literature and allowing a detailed evaluation of the influence of rainfall depth and event intensity on rainfall partitioning associated with these species. Very small (0.0–5.0 mm) and low-intensity (0–2.5 mm h−1) events were significantly more frequent during the dry season. Both model approaches resulted in good predictions, with absence of constant and systematic errors during simulations. The sparse Gash model parametrized on a daily basis performed slightly better, reaching maximum cumulative mean error of 9.8%, while, for the seasonal parametrization, this value was 11.5%. Seasonal model predictions were also the most sensitive to canopy and climatic parameters.

Graphical Abstract

1. Introduction

Water availability is limited in arid and semiarid regions, with rainfall interception playing an important role on site and catchment water balances, as well as in the context of climate change [1]. Rainfall partitioning by trees is an intricate process, mainly affected by canopy and weather factors, such as the characteristics of rainfall events, becoming even more complex where vegetation is sparse [2]. Thus, rainfall interception modelling appears as an important tool for extrapolating experimental results both in time and space, helping to better understand this hydrological process, as well as to implement effective water resource management and land use planning.
Many mathematical models have been developed, validated and successfully applied to simulate rainfall partitioning in different forest types, including coniferous and hardwood stands [3,4,5], rainforests [6,7], deciduous and sparse canopies [8,9,10], mixed stands [11] and crops [12]. However, there are few studies about simulating or evaluating the rainfall interception in Caatinga vegetation [1,13,14,15,16]. This domain corresponds to an area of tropical dry forest with deciduous tree-shrubs, which covers close to one million km2 in the Northeast of Brazil, occupying around 50% of this region [17]. Caatinga is a fragile ecosystem due to the scarce water resources and the anthropogenic pressures, mainly the intensive exploitation of the region by agriculture and livestock [18]. There is a high temporal and spatial variability of the rainfall regime in this domain, both considering annual and individual events. Specifically, rainfall that occurs in the semi-arid Northeast of Brazil is concentrated over a short period, with the dry season lasting from five to nine months and resulting in uncertainties about the water regime [1]. Caatinga ecosystem is highly dynamic and its vegetation responds quickly to climatic conditions due to morphological and physiological adaptations to aridity by many species of plants. The Caatinga species comprise a whole range of deciduousness, including plants that retain their leaves throughout all the year and other that are leafless during seven months each year [15,17]. The main factor that controls the structure and distribution of vegetation is the precipitation, but photoperiod and nutrients also affect the Caatinga species [18].
More studies about rainfall interception in the Caatinga domain are important to increase the spatial and temporal accuracy in rainfall partitioning simulations and to better understand this process in dry tropical forests. Additionally, these studies may also benefit watershed and forest managers of other similar arid and semiarid ecosystems, since dry tropical forests are recognized as one of the world’s major biomes and are found in a wide area extending from the Amazon basin in South America towards northern Mexico and the Caribbean [19].
The analytical Gash models [9,20] are most often used when predicting rainfall interception due to their ease of use, low parameter requirement and low programming complexity [21]. These models are capable of estimating rainfall partitioning by using a series of parameters based on canopy structure, evaporation rate and rainfall regime [22]. The original analytical Gash model [20] represents rainfall input as series of discrete storms, each comprising a wetting up period, a saturation period and a drying out period [7]. The sparse version [9] encompasses the case of forest stands with significant open spaces between tree canopies, also introducing some minor corrections [21]. The main difference between these two versions is that the sparse model is based on evaporation and canopy storage per unit area of canopy cover rather than per unit of ground area. This overcame a limitation in the description of sparse forests by the original model, which can prevent the simulated canopy from wetting up [9,11].
Both original and sparse Gash models [9,20] are typically applied using mean annual or seasonal rainfall intensity and evaporation rates, which are considered as constant parameters in all events during the simulated period [2,8,13]. The same occurs with the canopy storage capacity, canopy cover fraction and threshold value required to saturate the canopy [5,23,24]. The sparse Gash model was already parametrized on a daily basis, considering a linear relationship between leaf area index and canopy storage capacity during the plant cycle [12,22]. These model adaptations, based on estimates of parameters for individual storm events, were also compared to other methodologies [3], reinforcing that the daily changes, observed in canopy structures, especially for deciduous vegetation, tend to reduce systemic simulation inaccuracies.
Although a number of works have been focused on applying and evaluating the Gash model with different parametrizations and for distinct forest types, its parametrizations on daily and seasonal bases were not studied for the Caatinga domain. These procedures tend to better represent the effects of changes in canopy cover on the rainfall interception process, mainly in this deciduous ecosystem, where canopy structure often changes gradually, but relatively rapidly. Furthermore, the adjustments and modifications required to perform such simulations allow a more detailed and accurate evaluation of the influence of rainfall depth and event intensity on rainfall partitioning. Therefore, the objective of this study was to parametrize the sparse Gash model on daily and seasonal bases, validating these approaches for simulating rainfall interception from five Caatinga species (Spondias tuberosa, Commiphora leptophloeos, Cnidoscolus quercifolius, Aspidosperma pyrifolium and Cenostigma pyramidale), improving the description of this hydrological process already reported in the scientific literature for dry tropical forests by enhancing the temporal and spatial accuracy of the estimates performed by the model. Additionally, the influence of rainfall depth and event intensity on rainfall partitioning associated with these species was evaluated.

2. Materials and Methods

2.1. Meteorological and Rainfall Measurements

This study was conducted within a private property with Caatinga vegetation area of 81,000 m2 and density of 930 trees ha−1, located in the Floresta municipality, Pernambuco State, Brazil (08°18′31″ S, 38°31′37″ W, 378 m a.s.l.). Vegetation in the experimental plot is mainly composed by the native species Spondias tuberosa, Commiphora leptophloeos, Cnidoscolus quercifolius, Aspidosperma pyrifolium and Cenostigma pyramidale (Figure 1), which are randomly distributed over the study site and are representative of the Caatinga domain [17,25,26,27]. Table 1 presents the main characteristics of these tree species [19], which are common to other species found in the Caatinga domain [14,16].
The climate of the region according to the Köppen classification is BSh, corresponding to a tropical semiarid hot type [28], and the Thornthwaite Aridity Index is 0.48 [29], confirming the region as semiarid. Average annual precipitation, wind speed and net solar radiation are 489.3 mm, 2.3 m s−1 and 22.2 MJ m−2 day−1, respectively. Mean annual air temperature is around 26.1 °C, with mean monthly temperatures ranging from 23.3 °C in July to 28.3 °C in November. Mean annual relative humidity is 61.9%, with mean monthly values between 50.3% in October and 70.4% in April.
Micrometeorological measurements were performed by electronic sensors installed on a galvanized iron tower at 8 m above the ground (Figure 1). Data were registered and stored in a datalogger (CR10X, Campbell Scientific, Logan, UT, USA) and measurements were conducted continuously from 1 March 2016 to 30 September 2017. The wind speed and direction were measured by an anemometer (03002 Wind Sentry, R. M. Young Company, Traverse, MI, USA). A quantum sensor (SQ-321, Apogee Instruments, Logan, UT, USA) measured the photosynthetically active radiation (PAR), while radiation balance was measured by a net radiometer (NR-Lite, Kipp & Zonen, Delft, The Netherlands) and the global solar radiation was obtained by a pyranometer (SP-230, Apogee Instruments, Logan, UT, USA). An automatic rain gauge (CS700-L, Hydrological Services Pty, Sydney, Australia) registered the gross rainfall.
The photosynthetically active radiation transmitted through the canopies was measured at two below-canopy positions, previously defined in representative trees of the predominant Caatinga species in the study area, by hand-moving two linear quantum sensors (SQ-321, Apogee Instruments, Logan, UT, USA) from one tree to another. Additionally, three aspirated psychrometers, made of T-type thermocouples (copper-constantan), were used for obtaining the dry and wet bulb temperatures at 0.5, 1.5 and 2.5 m above the mean canopy level. Two soil heat flux plates (HFT3-REBS, Hukseflux, Delft, The Netherlands) were also installed in the top soil layer at a depth of approximately 0.05 m.
A ceptometer (LP-80, Decagon Devices, Pullman, DC, USA) was used to measure the fractional interception of photosynthetically active radiation. The incident radiation measurements were performed in open areas without physical obstacles, not including cloudy days or at dusk. The transmitted radiation measurements occurred under the tree canopies. One incident and four transmitted radiation measurements in different directions (north, east, south and west) were executed for each sample of predominant Caatinga species, during 14 campaigns with 135 readings each. Based on the fractional interceptions of photosynthetically active radiation, the integrated microprocessor of the ceptometer estimated the leaf area index based on a simplified version of the Norman–Jarvis radiation transmission and scattering model [30,31]. Polynomial equations were then fitted to measure fractional interception of photosynthetically active radiations obtained by the ceptometer and registered in the datalogger for estimating daily leaf area indices for each studied species.
Throughfall was measured by 15 manual collection gauges, placed randomly underneath the vegetation canopy, comprising three gauges per predominant Caatinga species. Measurements were performed after each rainfall event and the gauges were installed at 1.0 m above ground level, presenting orifices of 0.07 m2. Gauges were installed at a half-way distance between canopy edge projection and stem in order to minimize the effects of spatial variability on the magnitude of average throughfall [13]. The area under each tree was divided by three diagonals considering the crown projected limits, totaling six sampling points equally spaced at angles of 60°. The gauges were distributed in three sampling points, being representative of a 120° circular sector bisected by the gauge longitudinal axis and centered on the tree position. Each gauge was relocated after every three rainfall events to a new position correspondent to the empty sampling point located beside it and following the area clockwise. This procedure minimizes errors originating from spatial variability and improves long-term sampling [32,33]. Furthermore, it allows to derive reliable mean throughfall per tree, even with a limited number of gauges [2,10,23,34].
Stemflow was measured after each rainfall event by installing twelve zinc gutters of 0.15 m in height, attached to the tree stems at 1.3 m above ground level and connected to individual plastic containers. A hose was fed into each plastic container and measurements were performed with a graduated test tube, with the purpose of reducing evaporation. Due to the tortuous trunks and rough bark of S. tuberosa and C. leptophloeos, the stemflow monitoring was restricted to the other three species, which presented a projected crown radius greater than 0.2 m and were sub-divided into two classes of diameter at breast height [35], that were 0.05 m ≤ DBH < 0.10 m and 0.10 m ≤ DBH ≤ 0.20 m. This sampling plan assured reliable stemflow measurements, since the two unmonitored trees have canopy structures similar to other species with low stemflow [36]. Spondias tuberosa presents low inclined branches with many flow path obstructions that create drip points, enhancing throughfall production, while Commiphora leptophloeos has horizontal leaves and only one stem.
The effective rainfall interception was obtained for each rain event by subtracting the gross rainfall by the sum of measured throughfall and stemflow [34,37]. Each rainfall event was defined as a period when cumulative gross rainfall exceeded 0.2 mm, provided that there was a minimum of 6 h without rainfall between events [2,7,24,38]. A consistency analysis was performed on the rainfall and micrometeorological data with electronic spreadsheet functions to remove all inconsistent values and outliers. Visual analysis of graphs relating the variables to time complemented the data evaluation.

2.2. Sparse Gash Model Parametrized on Daily and Seasonal Bases

A daily parametrization for the sparse Gash model was proposed in this study for simulating the rainfall interception of Caatinga species [3,12,22] and was compared with a seasonal parametrization (Table 2), which was based on mean constant parameters for rainy and dry seasons.
In both approaches, the net rainfall interception was estimated as [9]
IN = IC + IW + IS + IA,
where IN is the net rainfall interception (mm), IC is the interception insufficient to saturate the canopy (mm), IW is the rainfall interception during canopy wetting (mm), IS is the rainfall interception during saturated canopy conditions (mm) and IA is the evaporation after rain ceased (mm).
The original and sparse Gash models also include a formulation for stemflow and evaporation of water stored on wetted trunks. However, the cumulative stemflow accounted for only 0.7% of total rainfall for the five studied Caatinga species and was considered negligible during simulations in this work. Thus, an equivalent interception was calculated, corresponding to the difference between gross rainfall and throughfall [7,8,34].

2.3. Estimation of Meteorological and Canopy Parameters

The threshold value required to saturate the canopy (PS, mm) was obtained on a seasonal or daily basis, depending on the model approach, as [9,12,22]
P Sy = ( R y S Cy E Cy ) ln ( 1 E Cy R y ) ,
P Si = ( R i S Ci E Ci ) ln ( 1 E Ci R i ) ,
When using the parametrization on a daily basis, the rainfall rate (Ri, mm h−1) was the average rainfall intensity during all hours in each storm event [22]. For the seasonal sparse Gash model, mean rainfall rates (Ry, mm h−1) were calculated separately [24], for rainy (December–May) and dry (June–November) seasons and then applied in a generalized form to all individual rainfall events. Rainy and dry periods were determined according to the rainfall pattern observed in the studied region, as well as the phenological and leaf area index data of the five studied Caatinga species [1,16,19].
The evaporation rate from wet canopy (Em, mm h−1), which represents the evaporation from the canopy during the storms, was also calculated for each storm event for the parametrization on a daily basis, while mean values were obtained for rainy and dry seasons when using the seasonal approach. This parameter was estimated hourly based on the Penman–Monteith equation [39], excluding the non-storm periods, with the canopy resistance set to zero [40] and using the momentum method for estimating the aerodynamic resistance [5,39]. The estimated evaporation rates from wet canopy were then divided by the canopy cover fractions before being applied in the models (Ec, mm h−1), adjusting the original values for a complete canopy in proportion to the canopy cover [9].
The canopy cover fraction (c, dimensionless) described the vegetation density. Daily canopy cover fractions were calculated according to the Beer–Lambert equation [41]:
c = 1 − PB/PA = 1 − e−k L,
where PA is the incoming photosynthetically active radiation on canopy (µmol m−2 s−1), PB is the transmitted photosynthetically active radiation through the canopy (µmol m−2 s−1), k is the extinction coefficient (dimensionless) and L is the leaf area index (m2 m−2).
The Beer–Lambert model describes the radiation transmittance through crop canopies as an exponential-type attenuation process, which can be also associated with the fractional photosynthetically active radiation, as well as with the leaf area index [12]. Daily canopy cover fractions were directly applied in the sparse Gash model parametrized on a daily basis, while average values for rainy and dry seasons were obtained when performing simulations with the seasonal parametrization.
The canopy storage capacity (S, mm) corresponded to the amount of water remaining in the canopy after rainfall and throughfall cease, considering evaporation equals to zero [42,43]. This parameter depends on the intensity and duration of the storm, as well as the spatial and temporal variability of trees [44]. In this study, S was assumed to have a linear relationship with the leaf area index [12]. Furthermore, the canopy storage capacity was adjusted per unit area of cover (Sc, mm), by dividing the original S value by the canopy cover fraction before applying it in the models [9].
The mean method was used for estimating a specific S value [3,45], representing the depth of water retained by leaves of each studied species. For this, scatter plots of measured rainfall interception versus gross rainfall were plotted for a number of rain events large enough to saturate the canopy of each Caatinga species and the specific canopy storage capacities were derived from the intercepts of the regression lines fitted to these data. That is, two regression lines were created, relating rainfall interception to gross rainfall for storms that are either insufficient or sufficient to saturate the canopy. The slope of each regression line was determined by an iterative least square fitting procedure. The difference between gross rainfall and throughfall at the intersection point of these two regression lines provided the estimate of S. The use of rainfall interception when plotting the regression lines yields the least stochastic errors, mainly when rainfall outside the canopy is measured without observational scatter and rainfall inside the canopy is observed with scatter [13,45]. For the simulations with daily parametrization, specific S values were multiplied by the daily leaf area index of each species, resulting in different daily S values. When applying the seasonal parametrization, daily S values were averaged considering rainy and dry periods.

2.4. Validation Analysis

The predictive capacity of the adjusted model was evaluated by the statistical parameters cumulative mean relative error, mean bias error, index of agreement and Nash–Sutcliffe efficiency [23,46,47]:
CMRE = 100 | C I C S | C S ,
MBE =   ( P j O j ) w ,
d = 1   ( P j O j ) 2   ( | P j O m | + | O j O m | ) 2 ,
E = 1   ( P j O j ) 2   ( O j O m ) 2 ,
where CMRE is the cumulative mean relative error (%), CI is the real cumulative rainfall interception (mm), CS is the simulated cumulative rainfall interception (mm), MBE is the mean bias error (mm), Oj is the measured rainfall interception (mm), Pj is the predicted rainfall interception (mm), w is the number of testing data (dimensionless), d is the index of agreement (dimensionless), Om is the average experimental rainfall interception (mm) and E is the Nash–Sutcliffe efficiency (dimensionless).
Values of MBE close to zero indicate that the model is useful for prediction, with negative and positive values suggesting underestimates and overestimates, respectively [46]. This indicator is related with the unit in which the evaluated property is expressed, as well as with the dataset range of values, which, in this study, represents the rainfall interception, in mm.
The CMRE, d and E values are standardized measures in which cross-comparisons for a variety of models, regardless of units, are possible. That is, these indicators are not measures of correlation or association in the formal sense, but rather measures of the degree to which the predictions obtained from a model are error-free [47,48]. E and d vary from 0 to 1, with the maximum value representing a perfect agreement between observed and predicted data. CMRE ranges between 0 and 100%. Based on approximately 111 scientific research studies about rainfall interception modelling [21], the cumulative mean error was classified in five qualitative groups: bad (>30%), applicable (10–30%), good (5–10%), very good (1–5%) and extremely good (<1%).
Additionally, validation graphs of the measured rainfall interceptions against the predicted ones were plotted. Aiming at verifying the model accuracy, the t-test was applied to the intercept (b) of each linear regression to check whether it was significantly different from 0 and to the line angular coefficient (a) to confirm whether it was significantly different from 1, at the level of 1% probability.

2.5. Statistical and Sensitivity Analyses

Sensitivity analyses were performed to identify the relative importance of canopy and climatic parameters (S, c, Em and R) in both daily and seasonal parametrizations of sparse Gash model. For this, the values of each parameter were increased and decreased by up to 50% of their original values and the simulated results were compared to measured data [5,11,24].
Measured rainfall interceptions and estimated model parameters were also submitted to variance analysis and averages were compared by the F and Scott–Knott tests (p < 0.05) through the SISVAR software (Federal University of Lavras-UFLA, Lavras, Minas Gerais, Brazil) [49]. Statistical differences between Caatinga species, storm classes and simulation periods were evaluated.

3. Results

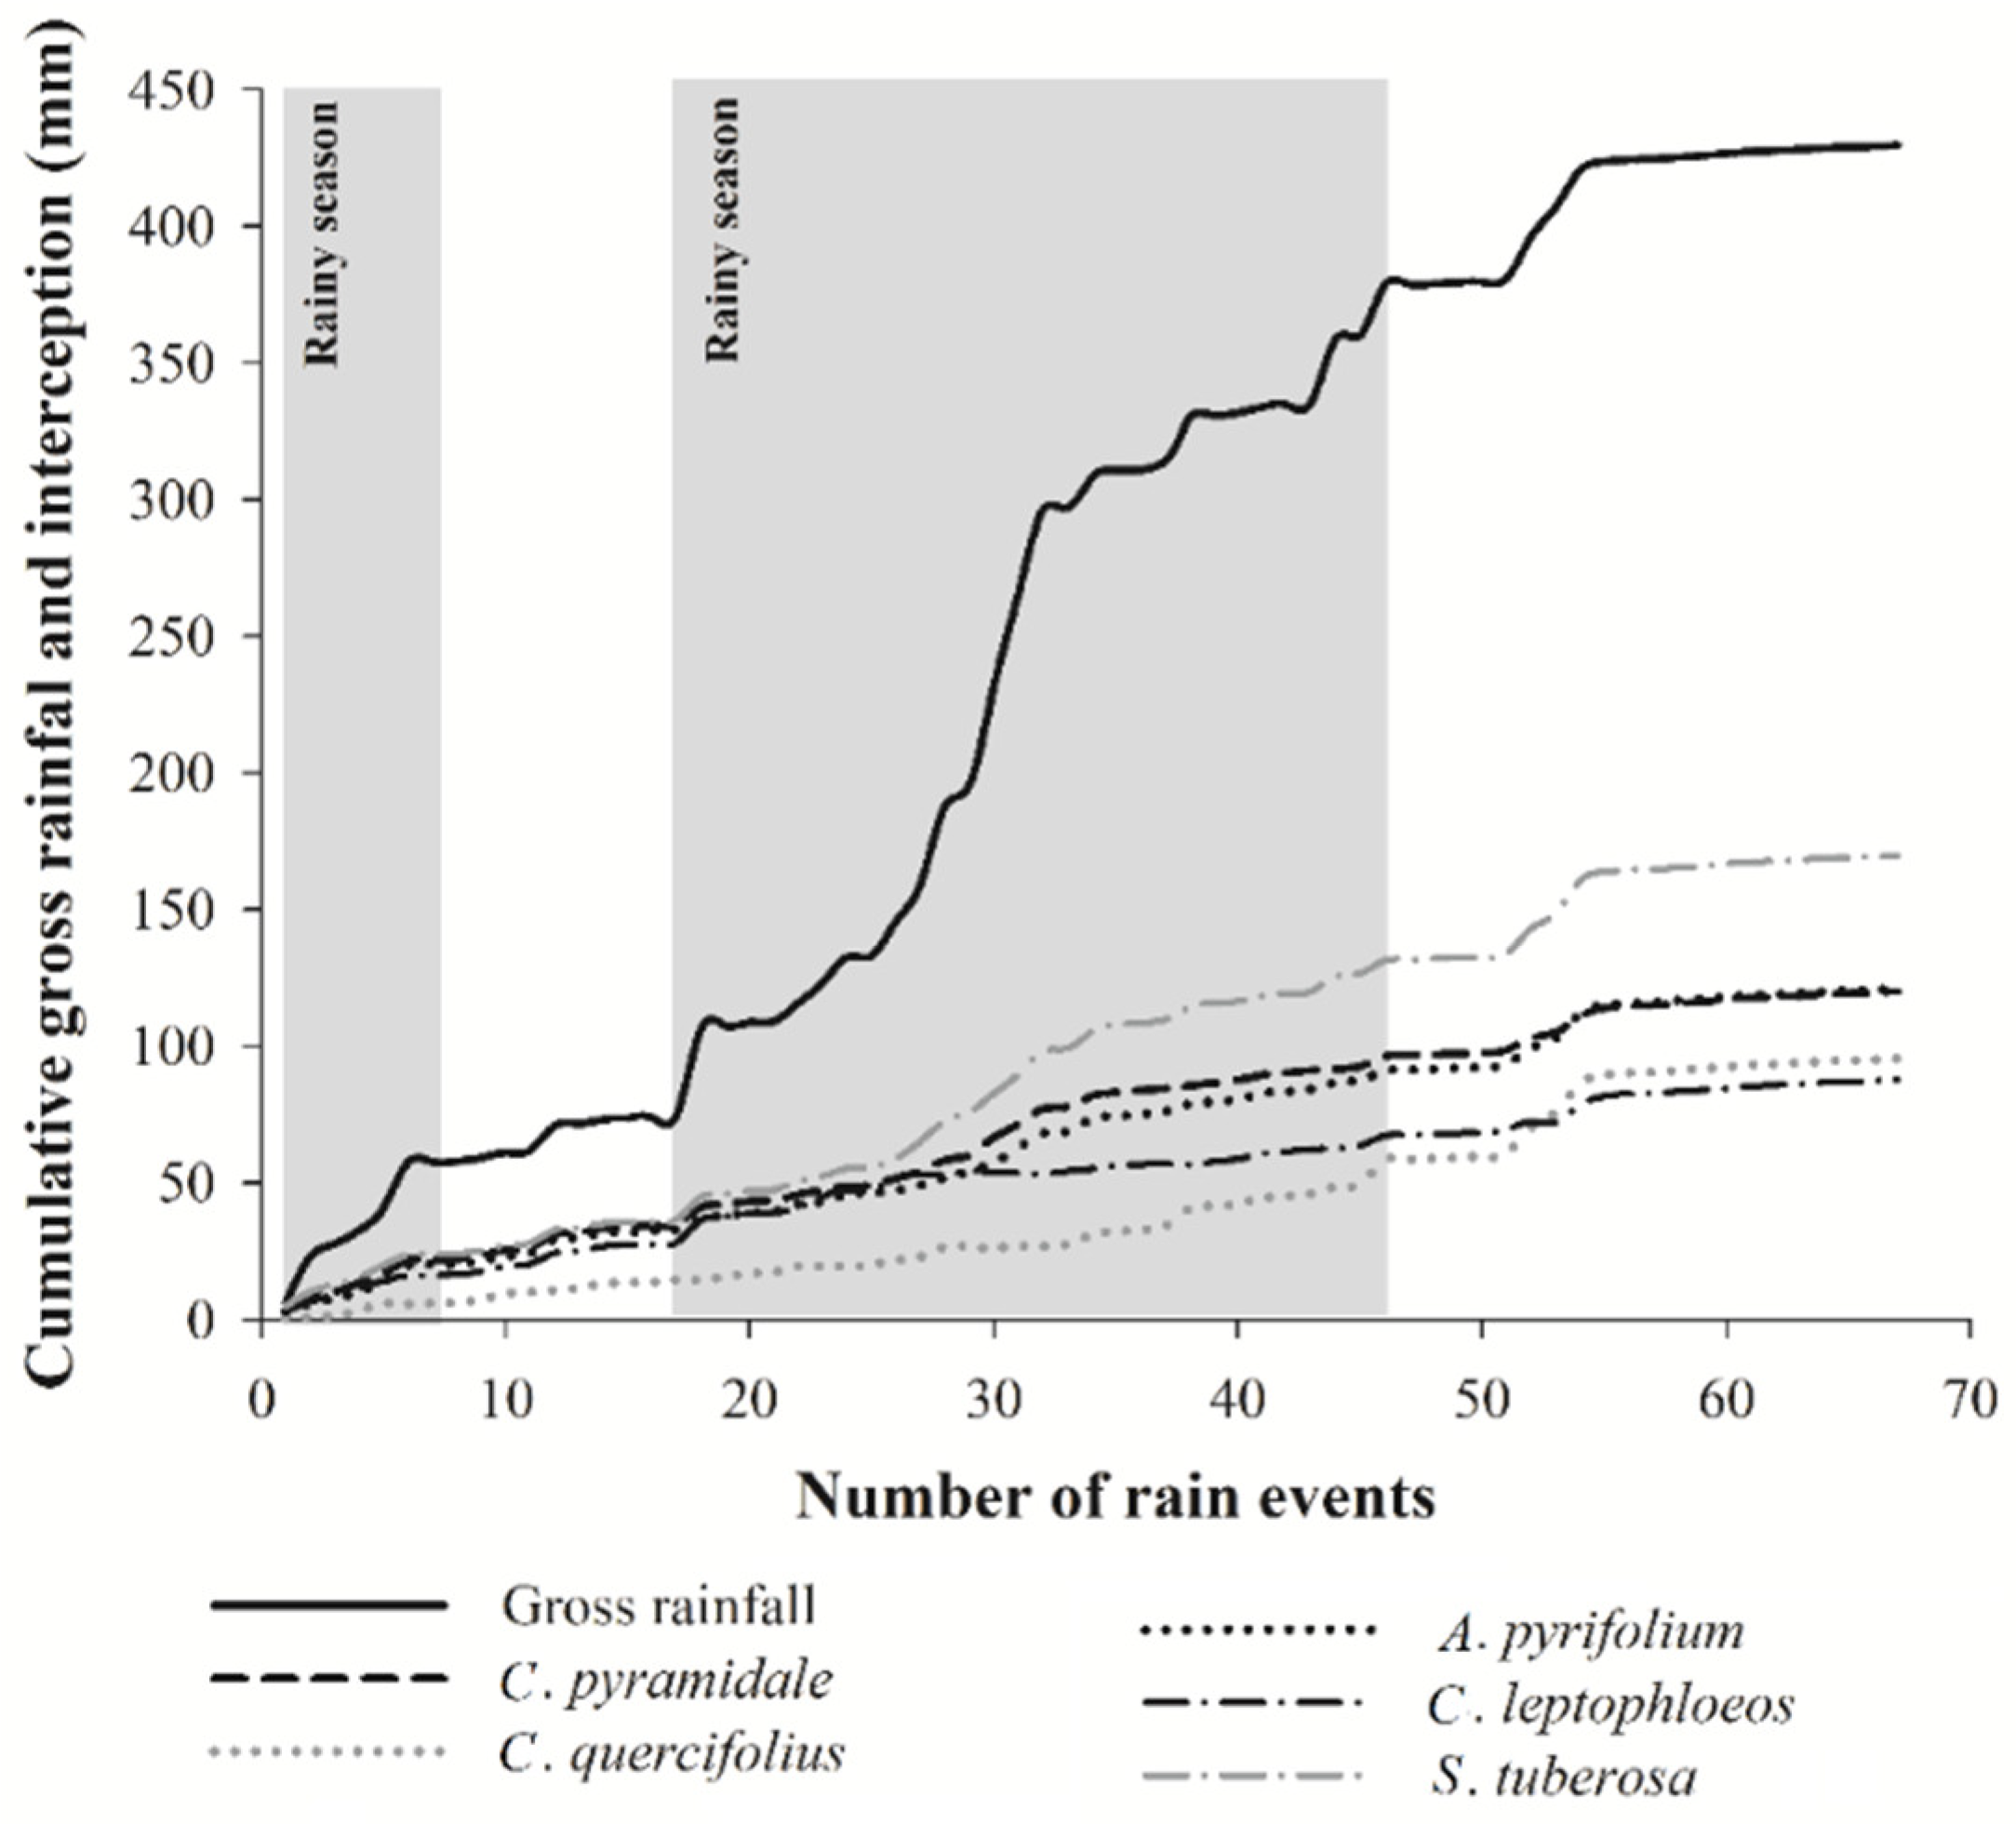
3.1. Rainfall Partitioning

The total measured rainfall between 1 March 2016 and 30 September 2017 was 429.5 mm, generated by 66 discrete rainfall events. From these, 343.7 mm (80.0%) occurred during the rainy season, while 85.8 mm (20.0%) occurred during the dry season. The average, maximum and minimum event-based rainfall amounts were 6.5 (±9.3), 36.4 and 0.2 mm, respectively. Rainfall intensities varied from 1.2 to 19.2 mm h−1, with an average of 3.2 (±2.9) mm h−1.
Statistical analyses indicated that the frequency distributions of the event size (Table 3) and intensity (Figure 2) among annual analysis, rainy and dry seasons did not differ significantly. The very small events (0.0–5.0 mm) were significantly more frequent than the other four classes. However, as shown in Table 3, they contributed with the lowest percentages to total gross rainfall during the rainy season and for the annual analysis. When evaluating the dry season, events from 20.1 to 40.0 mm were not observed and small events (5.1–10.0 mm) were responsible for the lowest percentages of total gross rainfall. The highest percentages of total gross rainfall were verified for the very large events (30.1–40.0 mm) during the rainy season and for middle events (10.1–20.0 mm) during dry and annual periods.
When evaluating rainfall intensity, events from 0 to 2.5 mm h−1 presented significantly higher frequency of occurrence. Figure 2 shows that these low intensity rainfall events contributed to a higher percentage of gross rainfall only during the dry season, while middle and large intensity rainfall events (2.6–10 mm h−1) were responsible for the greatest percentages of gross rainfall both for annual and rainy season conditions.
As shown in Figure 3, the annual cumulative interception values were between 90.5 and 169.7 mm, resulting in average proportions of gross rainfall into interception of 27.9% (±6.5). When considering the rainy and dry seasons, the cumulative interceptions ranged from 43.5 to 114.7 mm and from 35.6 to 55.0 mm, with proportions of gross rainfall to interception of 17.2% (±5.7) and 10.7% (±1.8), respectively. Additionally, the annual average proportions of gross rainfall to throughfall and stemflow were 71.6% (±7.5) and 0.7% (±0.2), respectively.
Observing the different storm size classes (Table 4), the proportions of gross rainfall into interception of very small storms (<5 mm) were significantly higher for all studied Caatinga species. Statistical analysis also showed that there was no significant difference between large (20.1–30.0 mm) and very large (30.1–40.0 mm) storms, as well as between small (5.1–10.0 mm) and middle (10.1–20.0 mm) storms. Filtering by significantly equal rainfall classes (<5, 5.1–20.0, 20.1–40 mm), the proportions of gross rainfall to interception tended to decrease as gross rainfall increased. For very large events (30.1–40 mm), C. quercifolius presented a significantly lower percentage of rainfall interceptions (Figure 3 and Table 4) and, for the other storm classes, there was also a trend of smaller values when compared with the other studied species.

3.2. Model Parameters

The leaf area indices, as well as the parameters for the adapted Gash model applied to the five studied Caatinga species, are shown in Table 5. The values of each parameter and leaf area index did not significantly differ among Caatinga species, but S. tuberosa presented a larger leaf area index, Sc and c, which also helps to explain the significantly higher rainfall interception observed during the experimental trial. Parameters and leaf area index were statistically equal between seasons and annual analysis, but their numerical differences contributed to improve the simulation results, as discussed below.

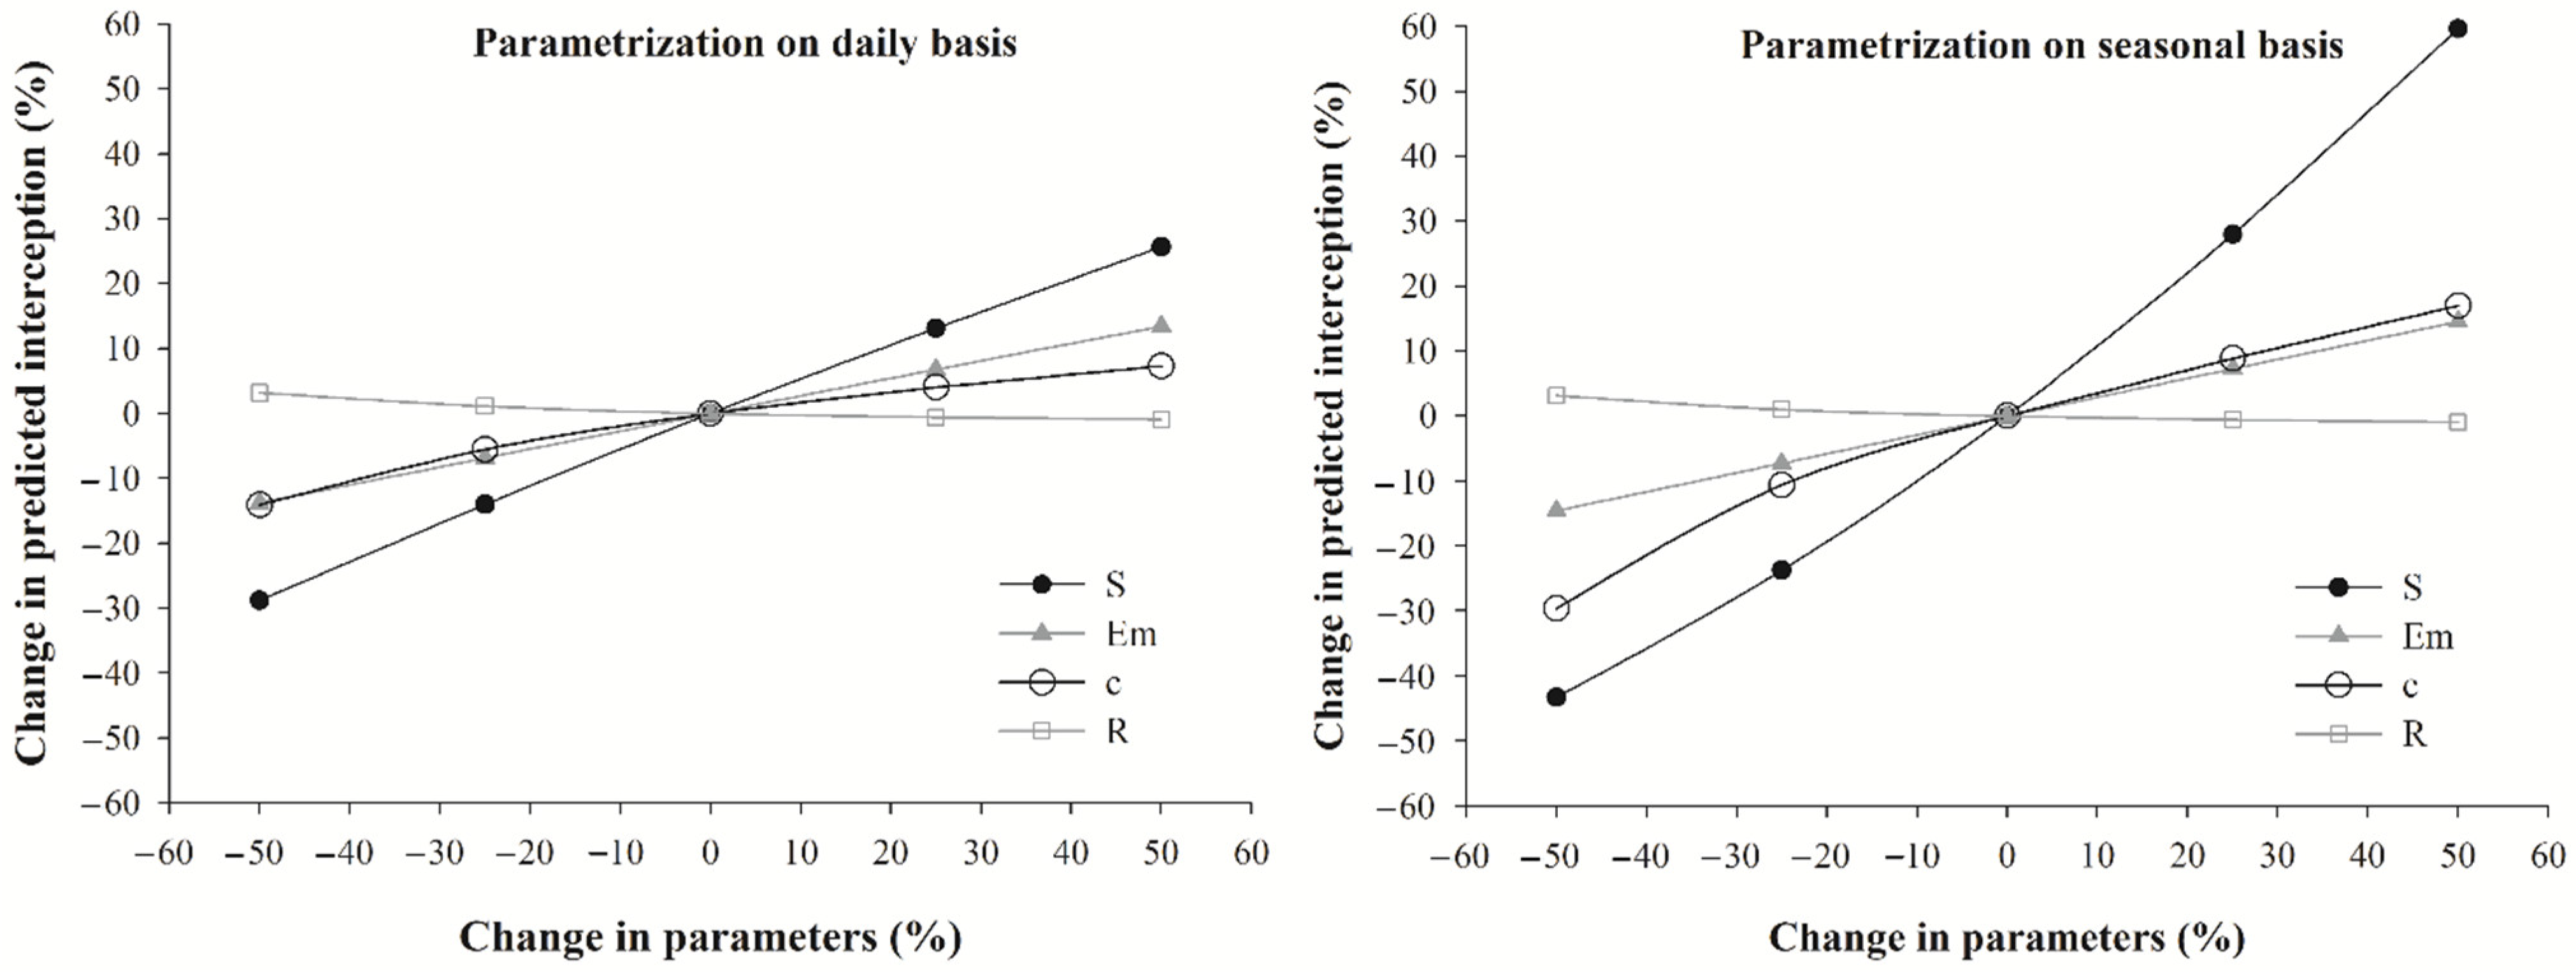
3.3. Sensitivity Analyses

The sensitivity analysis of the canopy and climatic parameters to rainfall interception is presented in Figure 4. Variations observed for the five studied species were averaged for each model, since they presented very similar patterns.
Canopy storage capacity (S), canopy cover fraction (c) and evaporation rate from wet canopy (Em) presented positive relationships with interception, whereas mean rainfall rate (R) resulted in a negative relationship with interception. All parameters were sensitive to interception, but S had larger effects on the Caatinga rainfall partitioning, followed by Em, c and R, respectively. Seasonal model predictions were most sensitive to canopy and climatic parameters, which were more pronounced for the S variable.
The sensitivity analysis showed that Em changes could lead from −13.8 (±1.5) to 13.4 (±1.3)% errors in rainfall interception when applying the sparse Gash model parametrized on a daily basis, while, for the seasonal approach, errors could vary from −14.6 (±1.6) to 14.5 (±1.6)%. Considering the R parameter, a −50% change in daily and seasonal parametrizations caused an average 3.2 (±1.5)% difference in the simulated rainfall interception.
For the daily parametrization, a decrease of 50% in c resulted in an average decrease of 14.1% (±0.8) in simulated interception, while an increase of 50% resulted in an average rise of 7.3% (±0.5). When applying the seasonal parametrization, a decrease of 50% in c could lead to an average decrease of 29.7% (±3.4) in simulated interception, while an increase of 50% could lead to an average rise of 17.0% (±0.9).
If the value of S increased by 50%, simulated rainfall interception tended to rise by 25.7% (±1.2) and 59.6 (±3.2) on average by applying the daily and seasonal parametrizations, respectively. On the other hand, the decrease of 50% resulted in average reductions of 28.8% (±1.4) and 43.3% (±2.3) for daily and seasonal parametrizations, respectively.

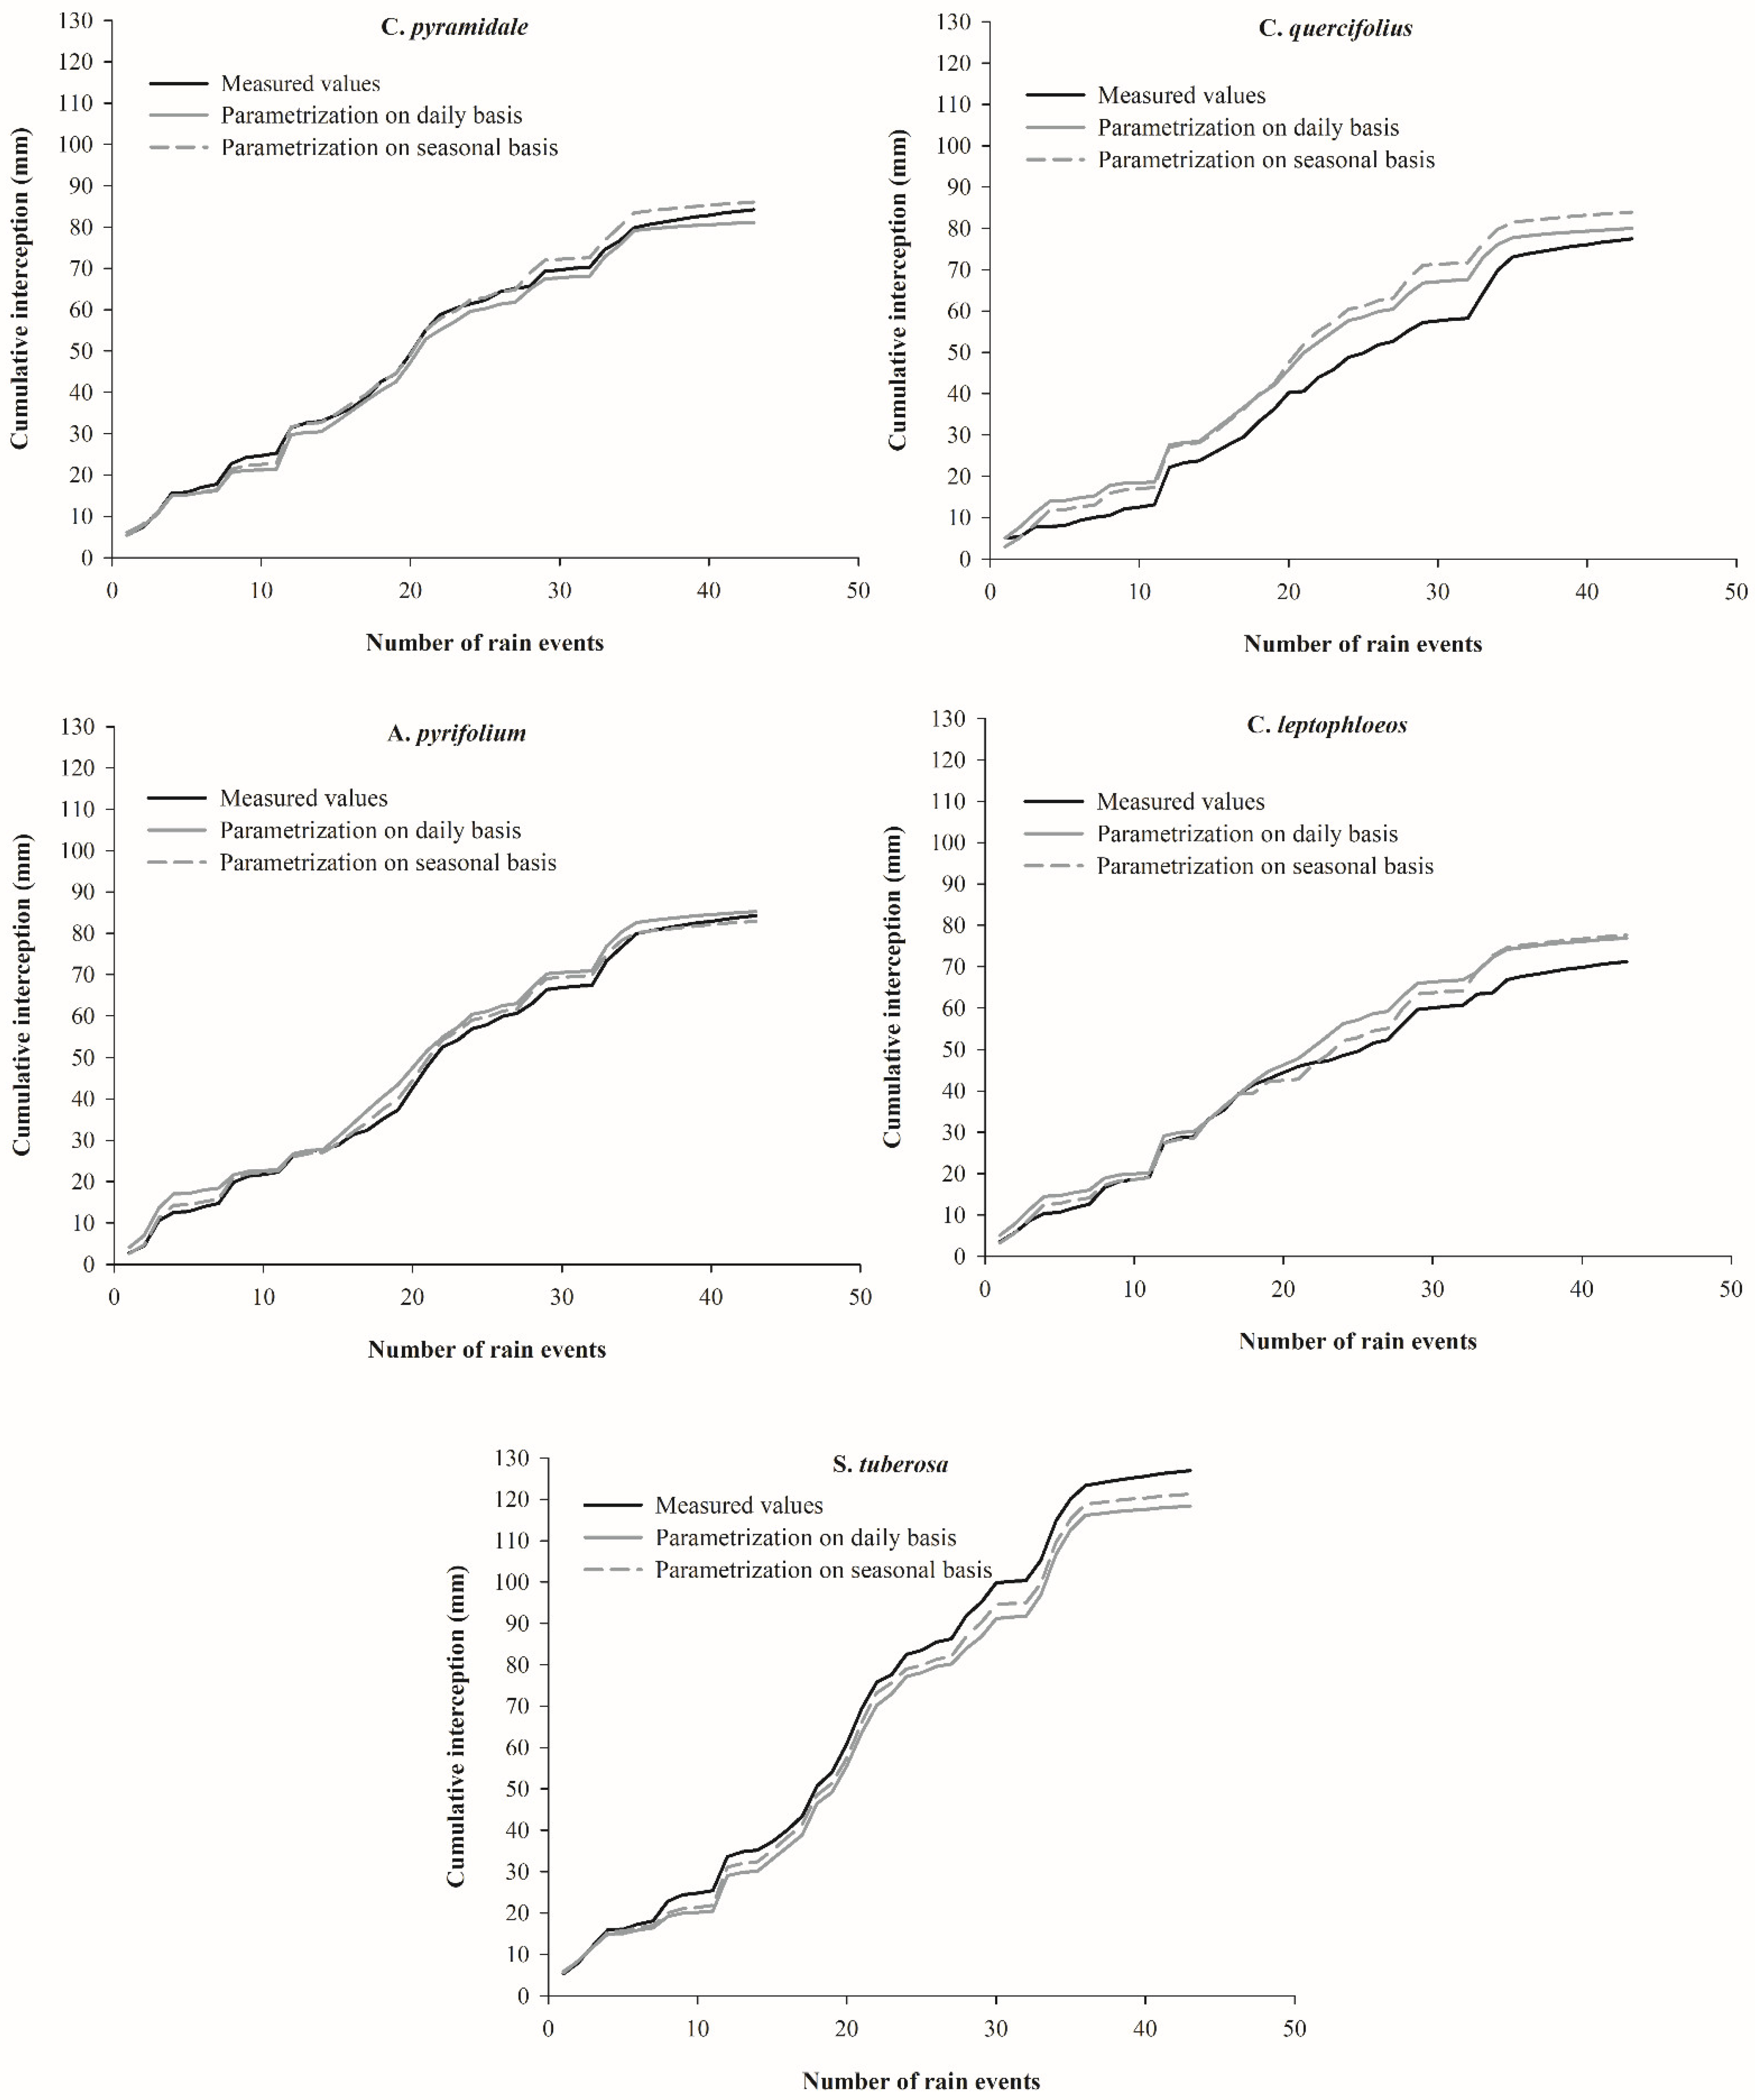
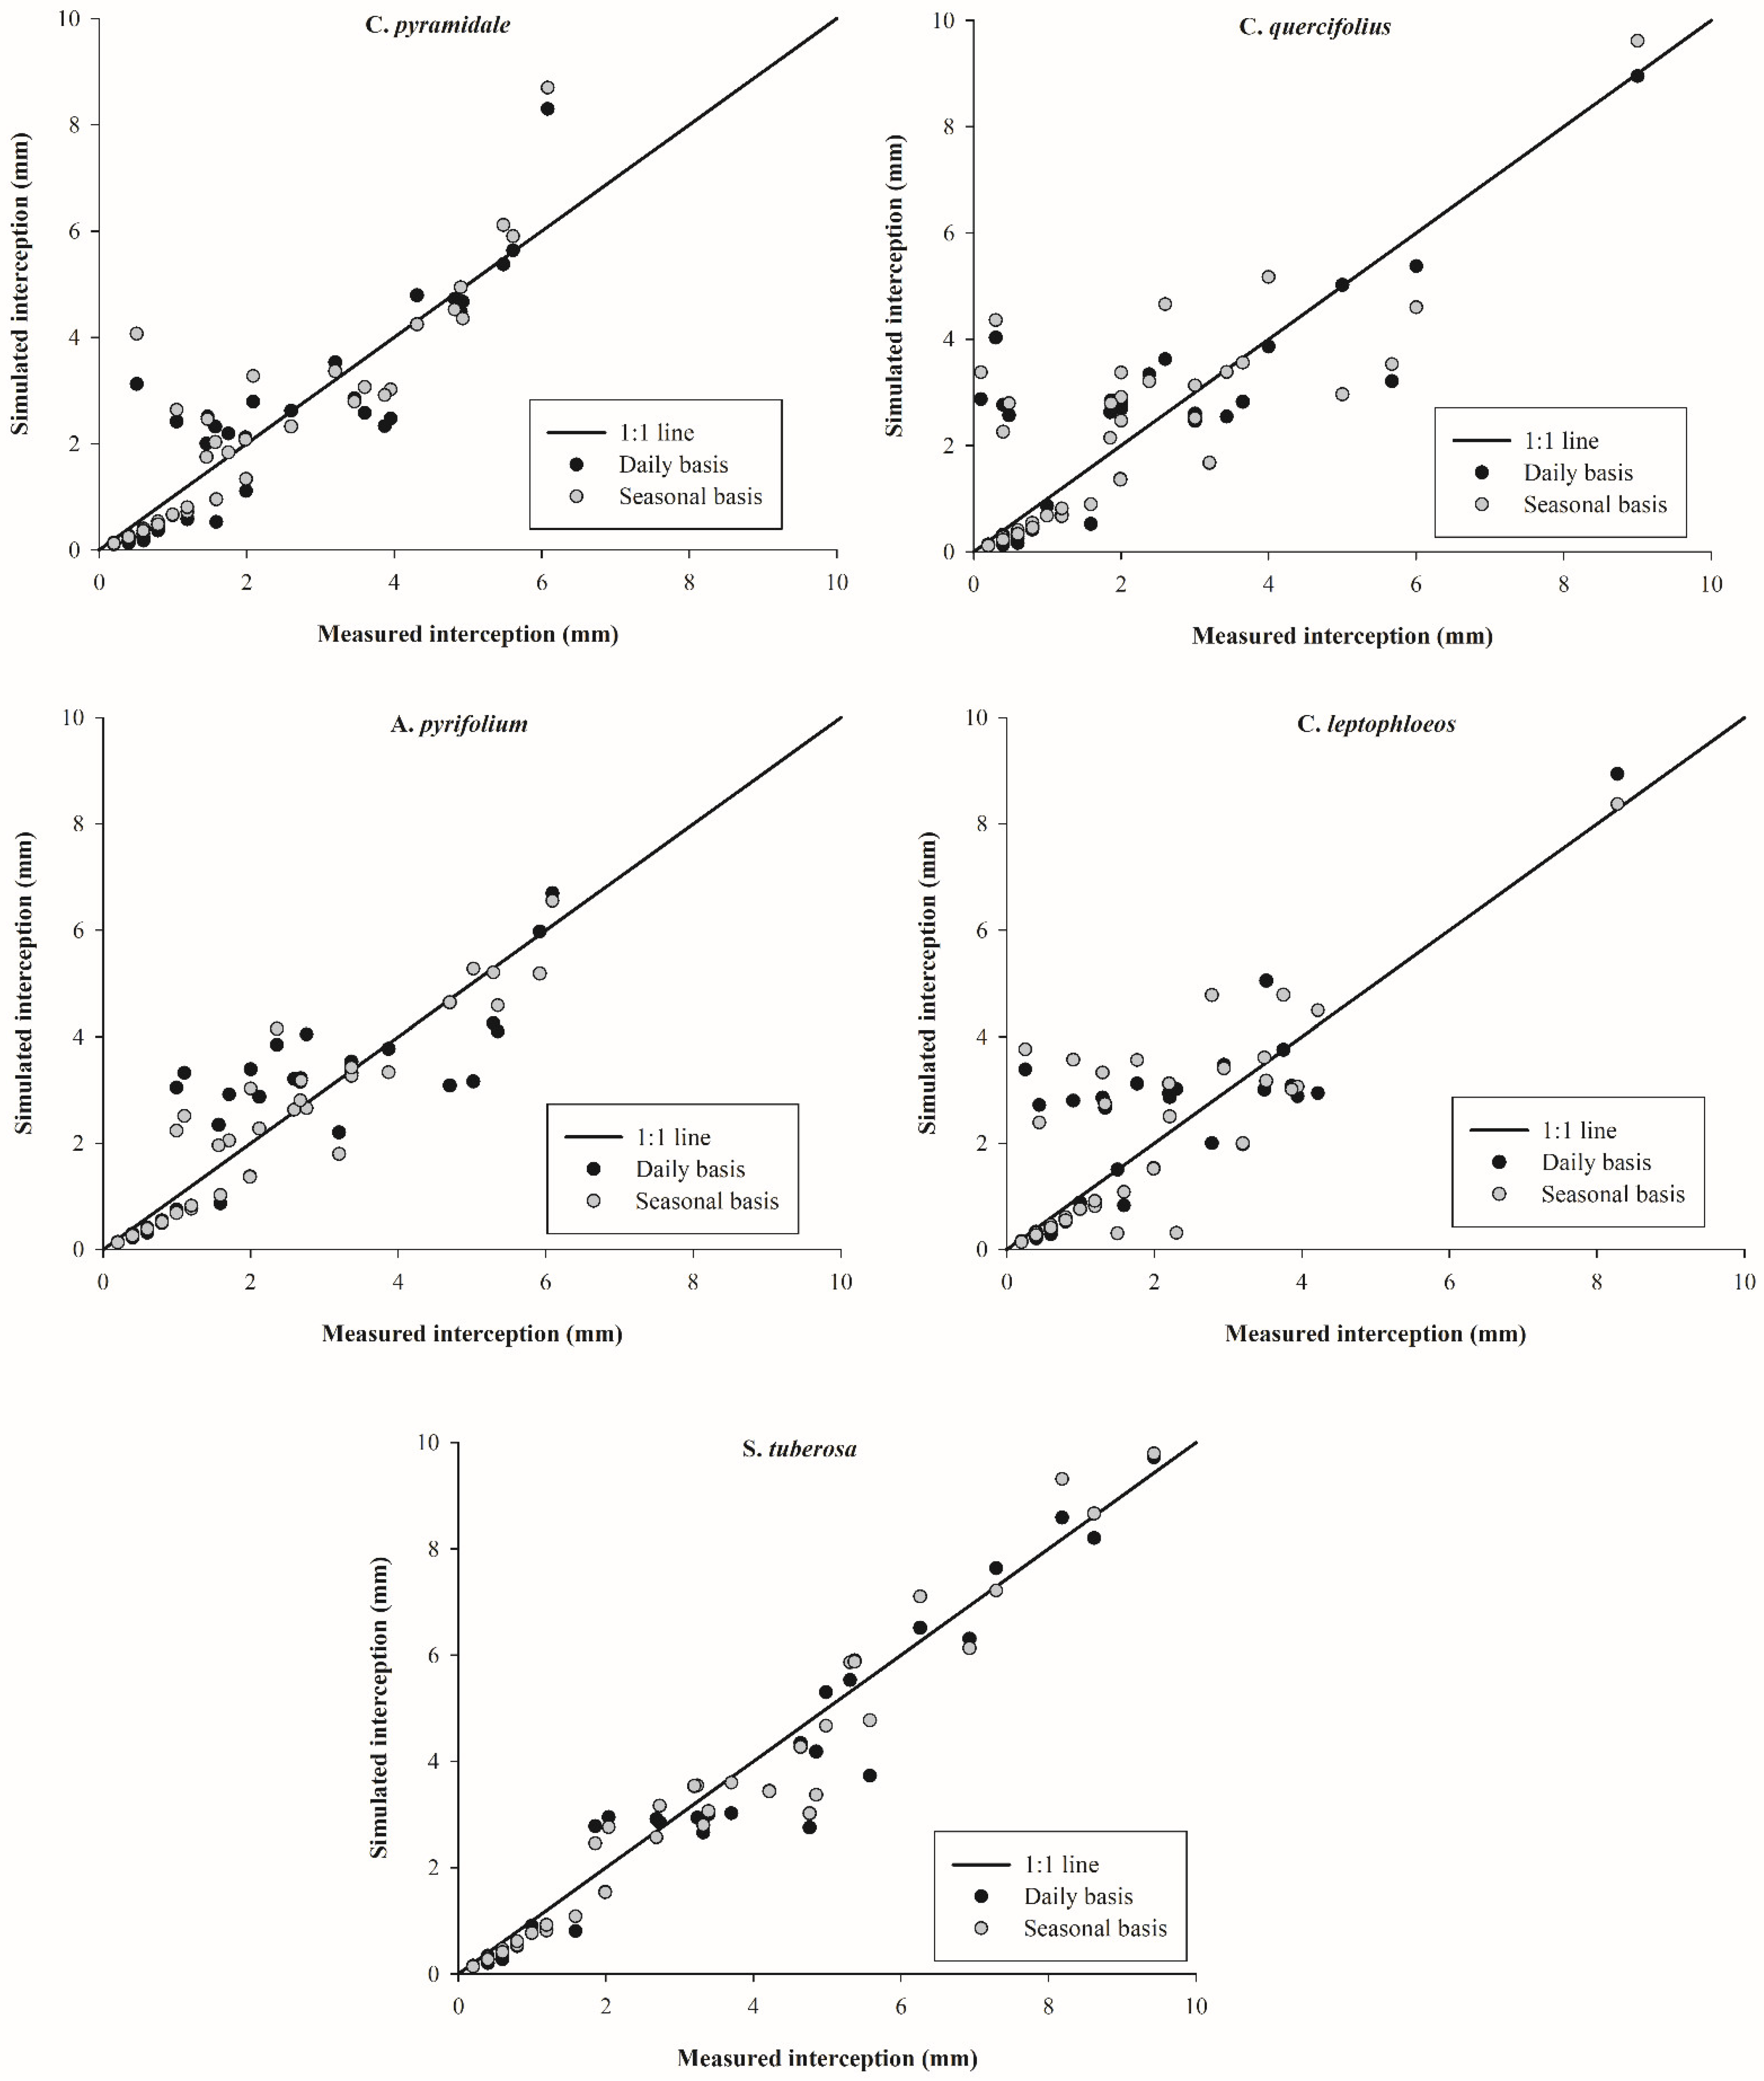
3.4. Rainfall Interception Simulations

Figure 5 shows that the daily and seasonal parametrizations performed very similarly, when simulating cumulative rainfall interception, with the daily parametrization performing slightly better, except for S. tuberosa. The average annual proportions of gross rainfall into interception were simulated as 27.1% (±5.1), when applying the daily parametrization, and as 26.5% (±5.3), when using the seasonal parametrization. Compared with the measured data, the differences were 0.8 and 1.4%, respectively. When considering the tree species, simulations for A. pyrifolium and C. pyramidale resulted in more accurate estimates. These species reached cumulative relative mean errors from 1.23 to 3.69%, considered very good [21]. The cumulative relative mean errors for the other species varied from 5.00 to 8.98% and were considered good [21].
On a per storm analysis (Figure 6), when estimates were evaluated for individual rainfall events, both simulation approaches also performed similarly, with the daily parametrization presenting slightly less scatter. Prediction errors were higher mainly for small, middle and large storms (5.1–30 mm), with interceptions between 0.2 and 6 mm. Among the tree species, best results were obtained with S. tuberosa.
The reliability of the proposed models for Caatinga species was also proven by the statistical indicators (Table 6). MBE varied from −0.20 to 0.15 mm for daily and seasonal parametrizations, indicating predicted values close to measured ones and confirming the model trends of slightly underestimating the S. tuberosa interception for both tested approaches, as well as for A. pyrifolium with seasonal parametrization and C. pyramidale with daily parametrization. The other cases showed trends of slightly overestimating. The d and E averages were 0.94 (±0.04) and 0.75 (±0.80), respectively, when applying seasonal simulations. For the daily parametrization, these indices reached 0.94 (±0.03) and 0.76 (±0.12) on average, respectively. The d and E results proved the high accuracy and the very good agreement between measured and predicted interceptions for all Caatinga species, as well as the slightly better performance of the daily parametrization.

4. Discussion

4.1. Rainfall Partitioning

The partitioning pattern observed in this study for the five Caatinga species agreed with other studies of semiarid regions [1,2,16,24], where rainfall is concentrated over a short period. Highly variable rainfall depths per event (0.2–40 mm) were also reported when applying the Gash model to deciduous shrubs in the semiarid Qinghai–Tibet Plateau [22]. Furthermore, mean values of gross rainfall per event (7.2 and 5.1 mm) close to the average value found in this work were verified for semiarid regions of Spain and Iran, respectively [2,23]. On the other hand, average Caatinga rainfall intensities (3.2 mm h−1) were higher than those observed in other semiarid regions. For example, a mean rainfall intensity of 1.7 mm h−1 was found when modelling the interception in central–western Spain [2], while rainfall intensities equal to 1.8 and 2.3 mm h−1 were reported for semiarid regions of China and Kenya, respectively [24,50]. The frequency distributions of the event size and intensity were in agreement with other studies about rainfall partitioning in semiarid regions [16,23,24].
Average rainfall interception was significantly higher during the rainy season, which is justified by the largest number of rainfall events and greatest rainfall amounts observed during this period, but also by the reduction in leaf amounts, as well as canopy cover, during the dry season. Rainfall interception of S. tuberosa was significantly higher than those verified for the other studied Caatinga species. This difference can likely be related with canopy characteristics, mainly the number of stems, diameter at breast height and tree crown projected area (Table 1), on which further studies are required. Additionally, the leafless periods of S. tuberosa corresponds to around 3 months [26], while the other species are leafless from approximately 4 to 7 months [25,27,51] and the emergence of leaves strongly affects the interception process, modifying the redistribution by the tree and the profile of rainwater.
The trend of decreasing the proportions of gross rainfall to interception as gross rainfall increases was also verified in other studies [23]. Additionally, the lower percent rainfall interceptions of C. quercifolius can be explained since the peak of its leaf fall lasts around 5 months [25] and this tree produces small leaves during the dry season that only attain their maximum size during the rainy season. For this, it presents a less dense canopy, which tends to facilitate water flow in throughfall [15].
Results obtained in this study confirm the findings of other scientific research studies [1,8,16,23], which suggested that changes in the proportions of gross rainfall to interception are mainly associated with the size of gross rainfall and can be explained since most of the gross rainfall is stored in the canopy during the very small and small rainfall storms. On the other hand, canopies tend to saturate during large and very large rainfall events, increasing throughfall, while the remaining rainfall is stored in the canopies and lost as evaporation during the storm event [9].

4.2. Model Parameters

Average leaf area indices observed in the Caatinga domain were similar to those verified for species of other semiarid regions, such as those for R. pseudoacacia in the Shaanxi province, China [52], as well as for Q. ilex and Q. pyrenaica in Sardon stands, Spain [2]. However, S. tuberosa stood out in this study, maintaining most of its leaves during the dry season, as well as reaching higher individual leaf area indices, when compared with other Caatinga species and native trees of different semiarid regions [22,23]. The average leaf area indices for rainy and dry seasons (Table 5) reflected the seasonal variations of this parameter, which increased linearly from the beginning to the end of the rainy season and decreased linearly during the dry season for all studied species. Indeed, the peak of leaf flush for the Caatinga species tends to coincide with the rainy season, but this process is also affected by the photoperiod [25].
Despite rainfall interception is known to be closely related to the leaf area index [53], other factors influence this process. The increase in canopy density causes leaves to touch, hindering the fully saturation of the entire canopy [12]. Furthermore, wind may reduce canopy storage capacity, as well as branch shape, and leaf inclination and canopy thickness may turn the leaves less wettable.
As expected and as shown in Table 5, both c and Sc followed the pattern observed in the leaf area index for all studied species, with average values of the rainy season larger than those of the dry season. The same behavior was verified for the PS values, since all of these parameters derived from the leaf area index in the parametrizations performed in this study. The c values were similar to other simulations of rainfall interception for deciduous forests in semiarid regions [8,14,22], but Sc and PS were larger. These results are consistent with the larger leaf area indices verified mainly during the rainy season and are probably also associated with the height of the studied Caatinga species (Table 1). The Sc and PS values obtained in this study can be also justified by the distinct forest structures among semiarid regions, since the canopy morphology and physiology interfere in the parametrization, including the leaf amounts and canopy cover during leafed and leafless periods [17]. Additionally, Sc and PS are closely related to Caatinga weather conditions, mainly rainfall distribution and intensity [38]. The estimate of Sc also depended on the specific canopy storage capacity, which was based on the mean method, relating the observed gross rainfall, interception and throughfall that were either insufficient or sufficient to saturate the canopy. On the other hand, the PS also depended on the evaporation rate from wet canopy, which was estimated by the Penman–Monteith equation, considering meteorological (air temperature, net radiation, vapor pressure deficit and wind speed) and vegetation characteristics (crop height).
Canopy coverage is an important parameter in both daily and seasonal parametrizations, since it is a structural parameter, directly related to the free throughfall coefficient and the leaf area index [5]. The free throughfall coefficient, which is assumed to be one minus canopy cover, affects soil water content and nutrient cycling, since it reflects the fraction of rainfall passing through the canopy without contacting the tree surface or removing dry leaves and twigs in the canopy [24]. Indeed, Table 5 shows a trend of species with smaller leaf area indices and greater leafless periods (C. pyramidale and C. quercifolius) presenting lower canopy coverages, with consequent larger free throughfall coefficients. The obtained c values can also explain the lower rainfall interceptions verified for C. quercifolius, as well as the significantly high interceptions from S. tuberosa. These species presented respectively the lowest (0.27) and the largest (0.97) canopy coverages when applying the daily parametrization, with C. quercifolius resulting in the greatest range of c values during the study and the smallest canopy coverage during the dry season (Table 5). Additionally, S. tuberosa was the species with the largest c values both in dry and rainy seasons. Thus, there is a trend of S.tuberosa species protect the Caatinga floor from raindrop splash erosion, also delaying the peaks in storm runoffs, as was verified in semiarid Northeast of China [24] and Brazil [54]. On the other hand, these trees could contribute to the enhancement of soil water scarcity in the Caatinga domain, since the high c values lead to less throughfall reaching the forest floor. However, detailed comprehension about these effects merit further studies.
Considering the daily parametrization, Em was highly changeable during the studied events, varying between 0.19 and 0.94 mm h−1, with an average of 0.40 (±0.14) mm h−1. The Em values observed during rainy and dry seasons reached 0.41 (±0.02) and 0.39 (±0.02) mm h−1 on average, respectively. Scaled to canopy cover, Ec values ranged from 0.24 to 2.50 mm h−1, with an average of 0.67 (±0.36) mm h−1 for the daily parametrization, while the seasonal approach resulted in Ec values of 0.62 (±0.08) and 0.57 (±0.05) mm h−1 on average during rainy and dry seasons, respectively (Table 5). Maximum in-storm evaporation rates from 1.83 to 3.98 mm h−1 were also observed in tropical dry and semiarid regions of Mexico [47], but the average evaporation rates found in this study were larger than those of semiarid regions of Spain, Iran and China [2,23,24]. These results are related with the semiarid climate type of Caatinga, which is mainly characterized by high temperatures and solar radiation, tending to increase evaporation rates when compared with other semiarid and dry tropical stands [1]. The higher evaporation rates and the distinct rainfall intensities affected the Ec/R ratios, which were lower during the rainy season (0.15 ±0.01), reaching average values of 0.26 (±0.03) during the dry season. When applying the daily parametrization, Ec/R presented minimum values between 0.03 and 0.04, while maximum values varied from 0.79 to 0.86 for the five studied species.
The differences observed between seasonal and daily parametrizations, regarding the sensitivity analysis, are expected, since the seasonal model uses two sets of constant parameters, while the daily parametrization considers the daily changes of canopy structure and weather conditions, tending to better represent the associated components and processes of rainfall interception. The sensitivity analysis agreed with other studies [53,55], which found that canopy storage capacity is among the most influential parameters on simulated rainfall interception in deciduous vegetation. Other factors that affect the sensitivity of model predictions are the rainfall and climate characteristics, such as raindrop size distribution, rainfall intensity and wind speed, though those factors are not included in the Gash model [24]. Additionally, canopy basal area and height interfere in the parametrization process, as well as the woody light-blocking elements from the canopy with respect to diameter growth, represented by the wood area index [56].

4.3. Rainfall Interception Simulations

The good results observed when simulating cumulative rainfall interception may be consequence of using leaf area indices during estimates of c and S, as well as the simulations based on daily or seasonal parameter variations, which allowed the proposed models to describe the rainfall interception patterns better than other approaches [13,14].
When considering the per-storm simulations (Figure 6), very large rain events (30.1–40 mm) were less frequent (Table 3), representing 6.1% of total gross rainfall, and were not observed during the dry season. This probably led to less events with interceptions greater than 6 mm and, consequently, less scatter was verified for these situations. There were more outliers for smaller interceptions, with simulated values moving further from the 1:1 line in both parametrizations and showing that model estimation was less accurate in some individual events. For these cases, the daily parametrization was also subtly better than the seasonal one. These discrepancies certainly affected the statistical indicators (Table 6). However, the scatter patterns agreed with other works [8,23] and, despite the observed discrepancies when comparing measured and simulated individual interceptions, both daily and seasonal parametrizations resulted in a good fit, with all intercept and angular coefficients not significantly differing from 0 and 1, respectively (Table 6). Additionally, the determination coefficients between measured and predicted values varied from 65.0 to 96.0%. These results indicate the absence of constant and systematic errors, confirming the good reproducibility of the estimates from the proposed models when applied to the Caatinga vegetation.
Results of this study indicate that parametrization on daily and seasonal bases improved estimates for rain events where interception is less dependent on Sc than on Ec/R, that is, for larger and more intense events. During heavy storms the canopy tends to rapidly saturate, decreasing the influence of canopy storage capacity and increasing the control of Ec/R [8]. This behavior also explains the minor error propagation, observed when cumulative interception was simulated (Figure 5). However, for other ecosystems, this trend should be better investigated.
The sparse Gash model parametrized on a daily basis is indicated for vegetation densities that change gradually, but relatively rapidly, as well as for vegetation that changes more slowly, but is subject to infrequent rainfall [12]. It requires leaf area index monitoring and a more complex implementation, but represents important conceptual improvements in the rainfall interception simulations, giving accurate estimates from low to high intensity storms, as well as for events with different amounts. However, when it is not possible to use the more expensive instrumentation required for parametrizing this approach, or the greater data processing during simulations, the seasonal sparse Gash model is capable of considering the variability of Caatinga species regarding foliation and defoliation, which is reflected by the canopy and climate parameters associated with rainy and dry periods. It does not require leaf area monitoring and equations are simplified, resulting in a less complex simulation with reliable approximations.

4.4. Limitations and Constraints

The methodological challenges in measurement and data processing when modelling and validating rainfall interception are associated with the complex and expensive micrometeorological instrumentation, as well as the long data acquisition periods required in this process. Additionally, throughfall is highly spatially heterogeneous at small scales, while rainfall interception and stemflow are variable across species, requiring a measurement scheme capable of sufficiently take into account these differences, but also coherent with the financial and logistical constraints. For this, it is important to attempt to correctly locate the gauges and divide the area under each tree, also systematically performing the relocation of gauges by applying well defined methods and minimizing errors originating from spatial variability. These precautions were followed in this study, agreeing with other works [2,10,13,16,33] that had proved the possibility of monitoring throughfall, stemflow and rainfall interception by considering fewer sample trees per studied species in a credible way.
Among the Gash model parameters, canopy storage capacity and evaporation rate from wet canopy are the most difficult to obtain individually [21,47]. The quantification of canopy storage capacity can be determined experimentally for a particular species using laboratory methods [12]. However, the indirect methods are relatively low-cost and require no complex instrumentation, having been preferred in most of studies for Gash model parametrization [3,7,8,23], despite the long measurement period required. In this work, a regression-based method was applied, but future efforts for obtaining reliable measurements of this parameter or decomposing it into easily measurable physical components are encouraged [55]. The measurement of the evaporation rate from wet canopy also involves high costs and technical difficulties and this parameter is frequently estimated by means of the Penman–Monteith method [47,52]. This method was used in this study, performing very well, despite requiring data of many micrometeorological variables. Other formulations and methods that overcome the high data input requirements of the Penman–Monteith equation have been proposed [2,24,34], but the best method for this purpose remains controversial and deserves further attention [47].
Finally, climate change is altering the water cycle and world ecosystems, with precipitation and phenological responses of plants to habitat being directly affected. Considering the Brazilian semi-arid region, the global climate change scenarios indicate that the aridity of the region will tend to increase in the next century, evidencing its vulnerability [18]. Therefore, a good comprehension of the hydrological processes and the study of their behaviors considering the climate change projections is essential for the evaluation of water availability and the anthropogenic effects in Caatinga. Thus, rainfall interception modelling based on these projections and the use of validated models for studies of land management are required.

5. Conclusions

Observed cumulative rainfall interceptions varied from 10.1 to 26.7% of gross rainfall during the rainy season and from 8.3 to 12.8% during the dry season for the five studied Caatinga species, indicating that significantly lower throughfall and stemflow reached the soil as available water input during the dry periods of 2016 and 2017. The frequency distributions of the event size and intensity did not differ significantly between dry and rainy seasons, with the very small (0.0–5.0 mm) and low-intensity (0–2.5 mm h−1) events being significantly more frequent. However, the highest percentages of total gross rainfall were verified for the very large events (30.1–40.0 mm) during the rainy season and for middle events (10.1–20.0 mm) when considering the dry season. The low intensity storms contributed to a higher percentage of gross rainfall only during the dry season, while middle and large intensity rainfall events (2.6–10 mm h−1) were responsible for the greatest percentages of gross rainfall during the rainy season. The sparse Gash model parametrized on a daily basis performed slightly better than the seasonal one, but both approaches resulted in very good or good agreement between the modelled and estimated interception, with cumulative mean relative errors between 1.23 and 8.98%. Seasonal model predictions were the most sensitive to canopy and climatic parameters, with canopy storage capacity presenting larger effects on the Caatinga rainfall partitioning, followed by Em, c and R, respectively, for both simulation approaches. Future works should focus on finding reliable methods for measuring canopy storage capacity, as well as on formulations capable of accurately estimating the evaporation rate from wet canopy requiring smaller input variables. Furthermore, the Gash model should be parametrized for other Caatinga species, with the validated approaches providing a basis for studies of land management, including the evaluation of degraded areas and effects of climate changes.

Author Contributions

Conceptualization, D.C.L. and A.J.S.N.; data curation, L.S.B.S. and C.A.A.S.; methodology, D.C.L., A.J.S.N., T.G.F.S. and S.Z.; resources, T.G.F.S. and S.Z.; validation, D.C.L. and A.J.S.N.; writing—original draft, D.C.L.; writing—review and editing, A.J.S.N. All authors have read and agreed to the published version of the manuscript.

Funding

This research was funded by the Research Support Foundation of the Pernambuco State (FACEPE-APQ-0215-5.01/10 and FACEPE-APQ-1159-1.07/14), the National Council for Scientific and Technological Development (CNPq-475279/2010-7, 476372/2012-7, 305286/2015-3, 309421/2018-7 and 152251/2018-9) and the Coordination for the Improvement of Higher Education Personnel (CAPES-Finance Code 001).

Institutional Review Board Statement

Not applicable.

Informed Consent Statement

Not applicable.

Conflicts of Interest

The authors declare no conflict of interest.

References

  1. Brasil, J.B.; Andrade, E.M.; Queiroz Palácio, H.A.; Medeiros, P.H.A.; Santos, J.C.N. Characteristics of precipitation and the process of interception in a seasonally dry tropical forest. J. Hydrol. 2018, 19, 307–317. [Google Scholar] [CrossRef]
  2. Hassan, S.M.T.; Ghimire, C.P.; Lubczynski, M.W. Remote sensing upscaling of interception loss from isolated oaks: Sardon catchment case study, Spain. J. Hydrol. 2017, 555, 489–505. [Google Scholar] [CrossRef]
  3. Pypker, T.G.; Tarasoff, C.S.; Koh, H.S. Assessing the efficacy of two in direct methods for quantifying canopy variables associated with interception loss of rainfall in temperate hardwood forests. Open J. Mod. Hydrol. 2012, 2, 29–40. [Google Scholar] [CrossRef] [Green Version]
  4. Rutter, A.J.; Morton, A.J.; Robins, P.C. A predictive model of rainfall interception in forests. II. Generalization of the model and comparison with observations in some coniferous and hardwoods stands. J. Appl. Ecol. 1975, 12, 367–380. [Google Scholar] [CrossRef]
  5. Shi, Z.; Wang, Y.; Xu, L.; Xiong, W.; Yu, P.; Gao, J.; Zhang, L. Fraction of incident rainfall within the canopy of a pure stand of Pinus armandii with revised Gash model in the Liupan Mountains of China. J. Hydrol. 2010, 385, 44–50. [Google Scholar] [CrossRef]
  6. Calder, I.R. A stochastic model of rainfall interception. J. Hydrol. 1986, 89, 65–71. [Google Scholar] [CrossRef]
  7. Link, T.E.; Unsworth, M.; Marks, D. The dynamics of rainfall interception by a seasonal temperate rainforest. Agric. For. Meteorol. 2004, 124, 171–191. [Google Scholar] [CrossRef] [Green Version]
  8. Fathizadeh, O.; Hosseini, S.M.; Keim, R.F.; Boloorani, A.D. A seasonal evaluation of the reformulated Gash interception model for semiarid deciduous oak forest stands. For. Ecol. Manag. 2018, 409, 601–613. [Google Scholar] [CrossRef]
  9. Gash, J.H.C.; Lloyd, C.R.; Lachaud, G. Estimating sparse forest rainfall interception with an analytical model. J. Hydrol. 1995, 170, 79–86. [Google Scholar] [CrossRef]
  10. Steidle Neto, A.J.; Ribeiro, A.; Lopes, D.C.; Sacramento Neto, O.B.; Souza, W.G.; Santana, M.O. Simulation of rainfall interception of canopy and litter in Eucalyptus plantation in tropical climate. For. Sci. 2012, 58, 54–60. [Google Scholar] [CrossRef] [Green Version]
  11. Su, L.; Zhao, C.; Xu, W.; Xie, Z. Modelling interception loss using the revised Gash model: A case study in a mixed evergreen and deciduous broadleaved forest in China. Ecohydrology 2016, 9, 1580–1589. [Google Scholar] [CrossRef]
  12. Van Dijk, A.I.J.M.; Bruijnzeel, L.A. Modelling rainfall interception by vegetation of variable density using an adapted analytical model. Part 1. Model description. J. Hydrol. 2001, 247, 230–238. [Google Scholar] [CrossRef]
  13. Lopes, D.C.; Steidle Neto, A.J.; Queiroz, M.G.; Souza, L.S.B.; Zolnier, S.; Silva, T.G.F. Sparse Gash model applied to seasonal dry tropical forest. J. Hydrol. 2020, 590, 125497. [Google Scholar] [CrossRef]
  14. Medeiros, P.H.A.; Araujo, J.C.; Bronstert, A. Interception measurements and assessment of Gash model performance for a tropical semiarid region. Rev. Ciênc. Agron. 2009, 40, 165–174. [Google Scholar] [CrossRef]
  15. Silva, A.C.F.; Souto, J.S.; Santana, J.A.S.; Souto, P.C.; Nascimento, J.A.M. Distribution of rainwater by species of caatinga vegetation. Afr. J. Agric. Res. 2018, 13, 2239–2248. [Google Scholar] [CrossRef]
  16. Queiroz, M.G.; Silva, T.G.F.; Zolnier, S.; Souza, C.A.A.; Souza, L.S.B.; Araújo, G.N.; Jardim, A.M.R.F.; Moura, M.S.B. Partitioning of rainfall in a seasonal dry tropical forest. Ecohydrol. Hydrobiol. 2020, 20, 230–242. [Google Scholar] [CrossRef]
  17. Machado, I.C.S.; Barros, L.M.; Sampaio, E.V.S.B. Phenology of Caatinga species at Serra Talhada, PE, Northeastern Brazil. Biotropica 1997, 29, 57–68. [Google Scholar] [CrossRef]
  18. Vieira, R.D.S.P.; Tomasella, J.; Alvalá, R.C.S.; Sestini, M.F.; Affonso, A.G.; Rodriguez, D.A.; Barbosa, A.A.; Cunha, A.P.M.A.; Valles, G.F.; Crepani, E.; et al. Identifying areas susceptible to desertification in the Brazilian northeast. Solid Earth 2015, 6, 347–360. [Google Scholar] [CrossRef] [Green Version]
  19. Queiroz, M.G.; Silva, T.G.F.; Zolnier, S.; Souza, C.A.A.; Souza, L.S.B.; Steidle Neto, A.J.; Araújo, G.G.L.; Ferreira, W.P.M. Seasonal patterns of deposition litterfall in a seasonal dry tropical forest. Agric. For. Meteorol. 2019, 279, 107712. [Google Scholar] [CrossRef]
  20. Gash, J.H.C. An analytical model of rainfall interception by forests. Q. J. R. Meteorol. Soc. 1979, 105, 43–55. [Google Scholar] [CrossRef]
  21. Muzylo, A.; Llorens, P.; Valente, F.; Keizer, J.J.; Domingo, F.; Gash, J.H.C. A review of rainfall interception modelling. J. Hydrol. 2009, 350, 191–206. [Google Scholar] [CrossRef] [Green Version]
  22. Zhang, S.Y.; Li, X.Y.; Jiang, Z.Y.; Li, D.Q.; Lin, H. Modelling of rainfall partitioning by a deciduous shrub using a variable parameters Gash model. Ecohydrology 2018, 11, e2011. [Google Scholar] [CrossRef]
  23. Sadeghi, S.M.M.; Attarod, P.; Van Stan II, J.T.; Pypker, T.G.; Dunkerley, D. Efficiency of the reformulated Gash’s interception model in semiarid afforestations. Agric. For. Meteorol. 2015, 201, 76–85. [Google Scholar] [CrossRef]
  24. Ma, C.; Li, X.; Luo, Y.; Shao, M.; Jia, X. The modelling of rainfall interception in growing and dormant seasons for a pine plantation and a black locust plantation in semi-arid Northwest China. J. Hydrol. 2019, 577, 123849. [Google Scholar] [CrossRef]
  25. Lima, A.L.A.; Rodal, M.J.N. Phenology and wood density of plants growing in the semi-arid region of northeastern Brazil. J. Arid Environ. 2010, 74, 1363–1373. [Google Scholar] [CrossRef]
  26. Lins Neto, E.M.F.; Almeida, A.L.S.; Peroni, N.; Castro, C.C.; Albuquerque, U.P. Phenology of Spondias tuberosa Arruda (Anacardiaceae) under different landscape management regimes and a proposal for a rapid phenological diagnosis using local knowledge. J. Ethnobiol. Ethnomed. 2013, 9, 10. [Google Scholar] [CrossRef] [Green Version]
  27. Moura, V.G.M. Sazonalidade Fenológica e Aspectos Funcionais de Espécies Lenhosas da Caatinga: Acompanhamento com Camera Hemisférica e in Loco. Master’s Thesis, Universidade Federal Rural de Pernambuco, Recife, Brazil, 2018. [Google Scholar]
  28. Alvares, C.A.; Stape, J.L.; Sentelhas, P.C.; Gonçalves, J.L.M.; Sparovek, G. Köppen’s climate classification map for Brazil. Meteorol. Z. 2013, 22, 711–728. [Google Scholar] [CrossRef]
  29. Thornthwaite, C.W. An approach toward a rational classification of climate. Geogr. Rev. 1948, 38, 55–94. [Google Scholar] [CrossRef]
  30. Norman, J.M.; Jarvis, P.G. Photosynthesis in Sitka Spruce (Picea Sitchensis (Bong.) Carr.). III. Measurements of Canopy Structure and Interception of Radiation. J. Appl. Ecol. 1974, 11, 375–398. [Google Scholar] [CrossRef]
  31. Pokovai, K.; Fodor, N. Adjusting Ceptometer Data to Improve Leaf Area Index Measurements. Agronomy 2019, 9, 866. [Google Scholar] [CrossRef] [Green Version]
  32. Bryant, M.L.; Bhat, S.; Jacobs, J.M. Measurements and modeling of throughfall variability for five forest communities in the southeastern US. J. Hydrol. 2005, 312, 95–108. [Google Scholar] [CrossRef]
  33. Lloyd, C.R.; Gash, J.H.C.; Shuttleworth, W.J. The measurement and modelling of rainfall interception by Amazonian rain forest. Agric. For. Meteorol. 1998, 43, 277–294. [Google Scholar] [CrossRef]
  34. Pereira, F.L.; Gash, J.H.C.; David, J.S.; David, T.S.; Monteiro, P.R.; Valente, F. Modelling interception loss from evergreen oak Mediterranean savannas: Application of a tree-based modelling approach. Agric. For. Meteorol. 2009, 149, 680–688. [Google Scholar] [CrossRef] [Green Version]
  35. Bäse, F.; Elsenbeer, H.; Neill, C.; Krusche, A.V. Differences in throughfall and net precipitation between soybean and transitional tropical forest in the southern Amazon, Brazil. Agric. Ecosyst. Environ. 2012, 159, 19–28. [Google Scholar] [CrossRef] [Green Version]
  36. Levia, D.F.; Frost, E.E. A review and evaluation of stemflow literature in the hydrologic and biogeochemical cycles of forested and agricultural ecosystems. J. Hydrol. 2003, 274, 1–29. [Google Scholar] [CrossRef]
  37. He, Z.-B.; Yang, J.J.; Du, J.; Zhao, W.-Z.; Liu, H.; Chang, X.X. Spatial variability of canopy interception in a spruce forest of the semiarid mountain regions of China. Agric. For. Meteorol. 2014, 188, 58–63. [Google Scholar] [CrossRef]
  38. Murakami, S. Application of three canopy interception models to a young stand of Japanese cypress and interpretation in terms of interception mechanism. J. Hydrol. 2007, 342, 305–319. [Google Scholar] [CrossRef]
  39. Allen, R.G.; Pereira, L.S.; Raes, D.; Smith, M. Crop Evapotranspiration: Guidelines for Computing Crop Water Requirements; Irrigation and Drainage Paper 56; Food and Agriculture Organization of the United Nations (FAO): Rome, Italy, 1998. [Google Scholar]
  40. Valente, F.; David, J.S.; Gash, J.H.C. Modelling interception loss for two sparse eucalypt and pine forests in central Portugal using reformulated Rutter and Gash analytical models. J. Hydrol. 1997, 190, 141–162. [Google Scholar] [CrossRef]
  41. Oyarzún, R.; Stöckle, C.; Wu, J.; Whiting, M. In field assessment on the relationship between photosynthetic active radiation (PAR) and global solar radiation transmittance through discontinuous canopies. Chil. J. Agric. Res. 2011, 71, 122–131. [Google Scholar] [CrossRef] [Green Version]
  42. Cuartas, L.A.; Tomasella, J.; Nobre, A.D.; Hodnett, M.G.; Waterloo, M.J.; Múnera, J.C. Interception water-partitioning dynamics for a pristine rainforest in Central Amazonia: Marked differences between normal and dry years. Agric. For. Meteorol. 2007, 145, 69–83. [Google Scholar] [CrossRef]
  43. Motahari, M.; Attarod, P.; Pypker, T.G.; Etemad, V.; Shirvany, A. Rainfall interception in a Pinus eldarica plantation in a semiarid climate zone: An application of the Gash model. J. Agric. Sci. Technol. 2013, 15, 981–994. [Google Scholar]
  44. Véliz-Chávez, C.; Mastachi-Loza, C.A.; González-Sosa, E.; Becerril-Piña, R.; Ramos-Salinas, N.M. Canopy storage implications on interception loss modelling. Am. J. Plant Sci. 2014, 5, 3032–3048. [Google Scholar] [CrossRef] [Green Version]
  45. Klaasen, W.; Bosveld, F.; Water, E. Water storage and evaporation as constituents of rainfall interception. J. Hydrol. 1998, 212–213, 36–50. [Google Scholar] [CrossRef] [Green Version]
  46. Lopes, D.C.; Steidle Neto, A.J.; Vasco Júnior, R. Comparison of equilibrium models for grain aeration. J. Stored Prod. Res. 2015, 60, 11–18. [Google Scholar] [CrossRef]
  47. Návar, J. Fitting rainfall interception models to forest ecosystems of Mexico. J. Hydrol. 2017, 548, 458–470. [Google Scholar] [CrossRef]
  48. Willmott, C.J. On the validation of models. Phys. Geogr. 1981, 2, 184–194. [Google Scholar] [CrossRef]
  49. Ferreira, D.F. Sisvar: A computer statistical analysis system. Ciên. Agrotecnol. 2011, 35, 1039–1042. [Google Scholar] [CrossRef] [Green Version]
  50. Jackson, N.A. Measured and modelled rainfall interception loss from an agroforestry system in Kenya. Agric. For. Meteorol. 2000, 100, 323–336. [Google Scholar] [CrossRef]
  51. Amorim, I.L.D.; Sampaio, E.V.D.S.B.; Araújo, E.D.L. Phenology of woody species in the Caatinga of Seridó, RN, Brazil. Rev. Árvore 2009, 33, 491–499. [Google Scholar] [CrossRef]
  52. Jiao, L.; Lu, N.; Sun, G.; Ward, E.J.; Fu, B. Biophysical controls on canopy transpiration in a black locust (Robinia pseudoacacia) plantation on the semi-arid Loess Plateau, China. Ecohydrology 2016, 9, 1068–1081. [Google Scholar] [CrossRef]
  53. Liu, Z.; Wang, Y.; Tian, A.; Liu, Y.; Ashley, A.W.; Wang, Y.; Zuo, H.; Pengtao, Y.; Xiong, W.; Xu, L. Characteristics of canopy interception and its simulation with a revised Gash model for a larch plantation in the Liupan Mountains, China. J. For. Res. 2018, 29, 187–198. [Google Scholar] [CrossRef]
  54. Santos, J.C.N.; Andrade, E.M.; Medeiros, P.H.A.; Guerreiro, M.J.S.; Palácio, H.A.Q. Effect of Rainfall Characteristics on Runoff and Water Erosion for Different Land Uses in a Tropical Semiarid Region. Water Resour. Manag. 2017, 31, 173–185. [Google Scholar] [CrossRef]
  55. Linhoss, A.C.; Siegert, C.M. A comparison of five forest interception models using global sensitivity and uncertainty analysis. J. Hydrol. 2016, 538, 109–116. [Google Scholar] [CrossRef] [Green Version]
  56. Sun, X.; Onda, Y.; Kato, H. Incident rainfall partitioning and canopy interception modelling for an abandoned Japanese cypress stand. J. For. Res. 2014, 19, 317–328. [Google Scholar] [CrossRef]
Figure 1. Study area, monitored trees and micrometeorological tower.
Water 13 02494 g001
Figure 2. Frequency distributions (bars) and percentages of gross rainfall of the intensity of rainfall events (lines) at the Caatinga domain in Brazil during the measurement period (annual, rainy and dry seasons) from 1 March 2016 to 30 September 2017.
Water 13 02494 g002
Figure 3. Cumulative measured gross rainfall and interception values from March 2016 to September 2017 at the Caatinga domain in Brazil.
Water 13 02494 g003
Figure 4. Sensitivity analysis of the Gash model parametrized on daily and seasonal bases applied to the Caatinga domain in Brazil.
Water 13 02494 g004
Figure 5. Cumulative measured interception values compared with those estimated by the sparse Gash model parametrized on daily and seasonal bases for each Caatinga species in Brazil.
Water 13 02494 g005
Figure 6. Validation graphs of experimental interception values against those predicted by the sparse Gash model parametrized on daily and seasonal bases applied to Caatinga species.
Water 13 02494 g006
Table 1. Main characteristics of the tree species used in the rainfall interception measurement: number of individuals (N), average diameter at breast height (DBH), average number of stems (NB), average tree height (H) and average tree crown projected area (CPA).
Scientific NameDBH
(m)
NS
(-)
H
(m)
CPA
(m2)
N
(-)
C. pyramidale0.0834.919.4415
C. quercifolius0.1326.533.735
A. pyrifolium0.0734.112.5280
C. leptophloeos0.1515.564.710
S. tuberosa0.2154.999.910
Table 2. Equations describing the components of rainfall interception in the seasonal and daily parametrizations of the sparse Gash model proposed in this paper.
Interception ComponentSeasonal BasisDaily Basis
For m storms insufficient to saturate the canopy (PG ≤ PS)
Evaporation from the whole canopy (IC) i = 1 m cy PGi i = 1 m ci PGi
For n storms sufficient to saturate the canopy (PG > PS)
Wetting up of canopy (IW)n cy (PSy − Scy) i = 1 n ci (PSi − Sci)
Wet canopy evaporation during storms (IS) c y E cy R y i = 1 n (PGi − PSy) c i E ci R i i = 1 n (PGi − PSi)
Evaporation after storms cease (IA)n cy Scy i = 1 n ci Sci
M, number of storms insufficient to saturate the canopy (dimensionless); i, mean value for a rainfall event (dimensionless); c, canopy cover fraction (dimensionless); y, mean value for rainy or dry season (dimensionless); PG, gross rainfall (mm); n, number of storms sufficient to saturate the canopy (dimensionless); PS, threshold value required to saturate the canopy (mm); Sc, canopy storage capacity per unit area of cover (mm); Ec, evaporation rate from wet canopy per unit area of cover (mm h−1); R, rainfall rate or rainfall intensity (mm h−1).
Table 3. Number of events (NE), cumulative gross rainfall (CGR) and percentage of gross rainfall (PGR) in different rainfall classes during the study period.
Classes (mm)
0.0–5.05.1–10.010.1–20.020.1–30.030.1–40.0
Annual Analysis
NE (-)43 (65.2%)7 (10.6%)10 (15.2%)2 (3.0%)4 (6.1%)
CGR (mm)46.053.9144.952.2132.5
PGR (%)10.712.633.712.130.9
Rainy Season
NE (-)18 (50.0%)6 (16.7%)6 (16.7%)2 (5.6%)4 (11.1%)
CGR (mm)27.345.086.852.2132.5
PGR (%)7.913.125.315.238.6
Dry Season
NE (-)25 (83.3%)1 (3.3%)4 (13.3%)0 (0.0%)0 (0.0%)
CGR (mm)18.79.058.10.00.0
PGR (%)21.810.567.70.00.0
Table 4. Proportions of gross rainfall portioned into interception (I:GR) considering five rainfall classes.
Classes (mm)
0.0–5.05.1–10.010.1–20.020.1–30.030.1–40.0
Annual Analysis (I:GR—%)
C. pyramidale82.134.425.08.617.3
C. quercifolius78.111.332.712.01.1
A. pyrifolium80.537.028.29.713.7
C. leptophloeos80.235.717.01.36.9
S. tuberosa87.046.242.324.723.1
Rainy Season (I:GR—%)
C. pyramidale41.425.314.18.617.3
C. quercifolius37.410.49.012.01.1
A. pyrifolium39.827.713.29.713.7
C. leptophloeos39.828.48.11.36.9
S. tuberosa46.337.420.524.723.1
Dry Season (I:GR—%)
C. pyramidale40.79.110.90.00.0
C. quercifolius40.71.023.70.00.0
A. pyrifolium40.79.315.10.00.0
C. leptophloeos40.77.38.90.00.0
S. tuberosa40.78.821.80.00.0
Table 5. Measured leaf area indices (L) and estimated canopy storage capacity per unit area of cover (Sc), relative evaporation rate per unit area of cover (Ec/R), evaporation rate from wet canopy (mm h−1), canopy cover fraction (c) and threshold value required to saturate the canopy (PS) for the sparse Gash model parametrized on daily and seasonal bases applied to each studied Caatinga species. Values in brackets represent standard deviations.
VegetationSc
(mm)
L
(mm2 mm−2)
Ec/R
(-)
Em
(mm h−1)
c
(-)
PS
(mm)
Daily Basis
C. pyramidale2.3–3.40.4–1.60.04–0.830.20–0.850.29–0.722.8–5.4
C. quercifolius1.7–4.40.5–4.00.04–0.790.21–0.940.27–0.942.3–4.9
A. pyrifolium2.8–4.00.9–2.00.03–0.790.19–0.800.52–0.803.3–4.6
C. leptophloeos1.9–4.40.9–4.00.03–0.860.20–0.890.48–0.952.2–4.8
S. tuberosa1.8–4.80.8–7.00.03–0.830.20–0.850.46–0.972.1–5.0
Seasonal Basis (Rainy Season)
C. pyramidale2.30 (±0.2)1.04 (±0.3)0.16 (±0.2)0.40 (±0.11)0.67 (±0.1)2.50
C. quercifolius2.85 (±0.6)1.82 (±0.7)0.17 (±0.2)0.44 (±0.12)0.68 (±0.2)3.13
A. pyrifolium2.58 (±0.3)1.44 (±0.2)0.15 (±0.2)0.38 (±0.10)0.69 (±0.1)2.79
C. leptophloeos2.89 (±0.5)2.02 (±0.6)0.14 (±0.1)0.42 (±0.12)0.76 (±0.10)3.12
S. tuberosa2.97 (±0.6)2.22 (±0.8)0.14 (±0.2)0.40 (±0.12)0.77 (±0.12)3.19
Seasonal Basis (Dry Season)
C. pyramidale2.10 (±0.2)0.85 (±0.3)0.27 (±0.2)0.38 (±0.16)0.60 (±0.1)2.45
C. quercifolius2.49 (±0.4)1.30 (±0.6)0.31 (±0.2)0.42 (±0.18)0.56 (±0.2)2.98
A. pyrifolium2.45 (±0.3)1.28 (±0.2)0.24 (±0.2)0.36 (±0.15)0.64 (±0.1)2.78
C. leptophloeos2.55 (±0.4)1.59 (±0.5)0.25 (±0.1)0.40 (±0.17)0.68 (±0.1)2.93
S. tuberosa2.56 (±0.4)1.69 (±0.6)0.24 (±0.2)0.38 (±0.15)0.68 (±0.1)2.92
Table 6. Summary statistics of interception values predicted by the sparse Gash model parametrized on daily and seasonal bases applied to Caatinga species on storm-based rainfall analysis.
Vegetationa
(-)
b
(-)
R2
(-)
MBE
(mm)
d
(-)
E
(-)
Daily Basis
S. tuberosa0.99−0.190.96−0.200.990.95
C. leptophloeos0.930.260.720.130.920.66
A. pyrifolium0.900.220.770.020.940.75
C. quercifolius0.820.390.690.060.910.66
C. pyramidale1.01−0.100.83−0.070.970.79
Seasonal Basis
S. tuberosa1.02−0.200.96−0.130.990.96
C. leptophloeos0.930.260.660.150.890.53
A. pyrifolium0.980.010.90−0.030.970.89
C. quercifolius0.820.460.650.150.900.59
C. pyramidale1.03−0.020.820.040.950.77
Publisher’s Note: MDPI stays neutral with regard to jurisdictional claims in published maps and institutional affiliations.

