Article

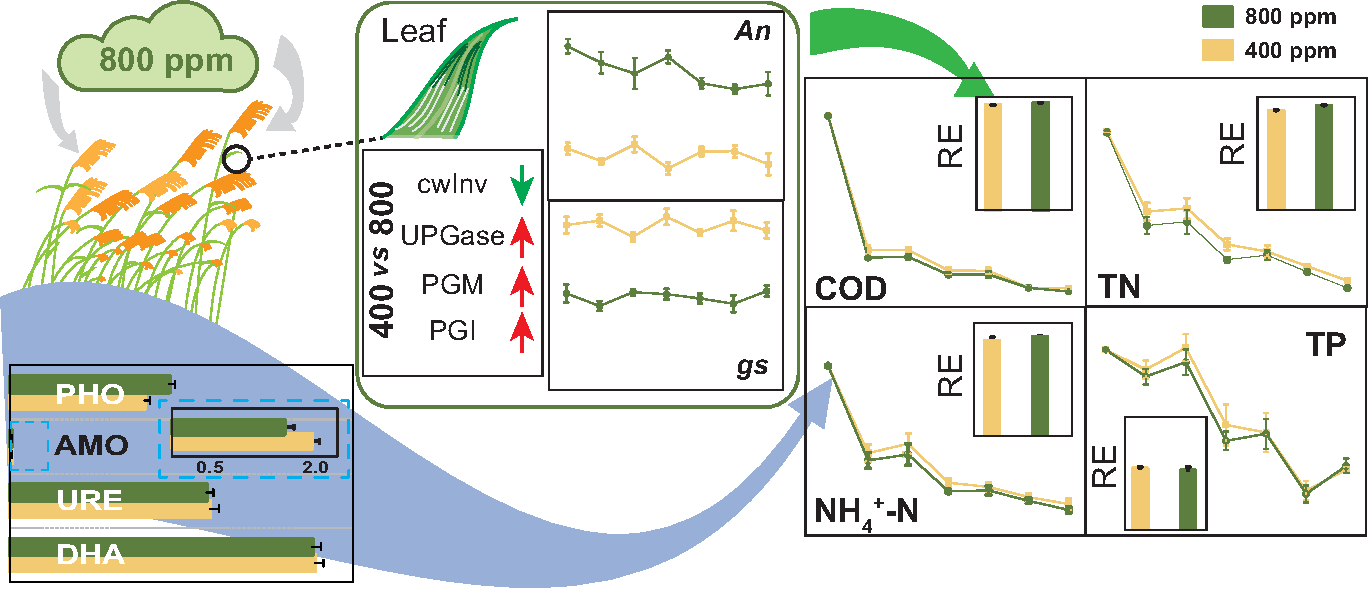
Effects of Elevated Atmospheric CO2 Concentration on Phragmites australis and Wastewater Treatment Efficiency in Constructed Wetlands

1
Crop Research Institute, Shandong Academy of Agricultural Sciences, Jinan 250100, China
2
Key Laboratory of Mollisols Agroecology, Northeast Institute of Geography and Agroecology, Chinese Academy of Sciences, Changchun 130102, China
3
College of Advanced Agricultural Sciences, University of Chinese Academy of Sciences, Beijing 100049, China
4
Department of Plant Physiology, Slovak Agricultural University, 94976 Nitra, Slovakia
5
Department of Botany and Plant Physiology, Czech University of Life Sciences Prague, Kamycka 129, 16500 Prague, Czech Republic
*
Author to whom correspondence should be addressed.
Equally contributed as first authors.
Water 2021, 13(18), 2500; https://doi.org/10.3390/w13182500
Submission received: 30 July 2021 / Revised: 8 September 2021 / Accepted: 9 September 2021 / Published: 12 September 2021
(This article belongs to the Special Issue Pollutants Removal from Wastewater Using Constructed Wetlands)

Abstract

:
Elevated atmospheric CO2 concentration (e[CO2]) has been predicted to rise to more than 400 ppm by the end of this century. It has received extensive attention with regard to the pros and cons of e[CO2] effects in terrestrial and marine ecosystems, while the effects of e[CO2] on wastewater treatment efficiency in constructed wetlands (CWs) are rarely known. In this study, the atmospheric CO2 concentration was set as 400 ppm (that is, ambient [CO2]) and 800 ppm (that is, e[CO2]). The physiological performance of Phragmites australis and microbial enzyme activities in constructed wetlands in response to e[CO2] were tested. Significantly higher net photosynthetic rate and plant growth were found under e[CO2]. The concentrations of nitrate, total anions, and total ions in the xylem sap of Phragmites australis were reduced, while the uptake of N and P in plants were not affected under e[CO2] condition. In addition, the ammonia monooxygenase activity was reduced, while the phosphatase activity was enhanced by e[CO2]. The increased removal efficiency of chemical oxygen demand and total nitrogen in CWs could be ascribed to the changes in physiological performance of Phragmites australis and activities of microbial enzymes under e[CO2]. These results suggested that the future atmospheric CO2 concentration could affect the wastewater treatment efficiency in CWs, due to the direct effects on plants and microorganisms.

Graphical Abstract

1. Introduction

Since the Industrial Revolution, the atmospheric concentration of carbon dioxide ([CO2]) has risen from 280 ppm to more than 400 ppm, and it has been predicted to reach levels of 420 ppm (RCP2.6) to 1300 ppm (RCP8.5) by the end of this century (IPCC, 2013). The effects of elevated [CO2] (e[CO2]) on terrestrial and marine ecosystems have attracted extensive attention, because it directly affects the photosynthesis and growth of plants, soil microorganisms, and ocean acidification [1,2,3].
Net photosynthesis (An) has a tight relationship with e[CO2] stimulation because e[CO2] enhances photosynthetic carbon assimilation, whereas it inhibits photorespiration in plants [4]. The stimulations of photosynthesis in plants grown under e[CO2] are mostly positive [5]. Across a range of free-air CO2 enrichment (FACE) trials, the maximum An was 31% higher in the e[CO2] plots than in the ambient [CO2] control [6]. However, variations in CO2 response were found among various plant species by meta-analysis: trees show the strongest response to e[CO2] with an increase proportion of 47% in maximum An; while forbs show a weaker response with an increase proportion of 15% in An. The enhanced An could affect the carbohydrate metabolism and, hence, benefit plant growth, and various enzymes play key roles in this process [7]. In leaves, the conversion of carbohydrates in cytosol to sucrose takes place via the function of sucrose phosphate synthase (SPS) and sucrose phosphate phosphatase (SPP) [8]. When plant cells shunt sucrose from the cytoplasmic matrix into other organs, the sucrose can be transported by catabolism in the presence of sucrose synthase (SuSy) or invertases (namely, cytoplasmic invertase, cytInv; vacuolar invertase, vacInv; cell wall invertase, cwInv) [9]. In addition, it should be noted that e[CO2] induces different expression levels of various active enzymes that are in the same metabolism pathway, leading to changes in plant biomass [7].
Notably, e[CO2] contributes to retaining more carbon (C) in the soil via plant litter, thereby enhancing soil carbon deposition [10]. Meanwhile, e[CO2] also has the ability to lower the pH of rhizosphere soils, thereby enhancing the element release to change the element absorption of plants [10]. In previous studies, not only nutrient elements but also heavy metal elements (e.g., copper and cadmium) were easily absorbed by plants under e[CO2] through enhanced metal solubility and bioavailability caused by soil pH change [10,11]. However, it has been recognized that e[CO2] inhibits mineral absorption through plants roots. One interpretation of the above findings is that the mass flow or diffusion of mineral acquisition by roots has a decline [12]. This is related to the stomatal-closure-induced lower transpiration rate under e[CO2] [13]. In an existing study, it was shown that e[CO2] is effective for promoting root growth, thereby improving the capacity of ion uptake [14]. The e[CO2] is an important factor shaping the soil microbiome. As a short-term effect, e[CO2] stimulates microbial respiration, increases the microbial biomass, and changes the microbial community [15]. It is noteworthy to point out that the changes in plant growth and rhizodeposition indirectly affect microbial function. As a long-term effect, there is evidence that e[CO2] causes oligotroph enrichment due to the increase of C consumption used to stimulate plant and microbial growth. Meanwhile, the nitrogen (N) cycle is accelerated in the e[CO2] condition, which may be attributed to the increase of nitrogen fixers (such as, Rhizobiales) or ammonia oxidizers [16]. In addition, aquatic plants take up N and P during the whole growing period, and their rhizosphere provides a beneficial shelter for the microbiome, which plays a critical role in nitrification and denitrification, thereby restraining the eutrophication of waterbodies [17].
As a decentralized wastewater treatment infrastructure, constructed wetlands (CWs) are thought to be effective for removing potential pollutions such as N, phosphorus (P), and organics [18]. Meanwhile, the removal efficiency of CWs for the above pollutants is dominated by interacting processes, including plant uptake, microbial metabolism, and adsorption of substrate [19], and these processes are subjected to the effects of different environmental factors, such as temperature and nanoparticles [20,21,22]. For instance, at low temperature, the oxygen transfer efficiency of the plants, the adsorption and sedimentation velocity of the substrate, and microbial metabolism rate are all reduced, adversely affecting the pollutant removal in CWs [20]. As a major biological community responsible for pollutant removal in CWs, microbes are also disturbed by environmental changes, showing lower microbial activity and metabolic rate in CWs at low temperature [20]. However, to the authors’ knowledge, the performance and pollutant removal in CWs under e[CO2] have not been reported yet, though they will inevitably need to be assessed under the future climate.
In this study, the impacts of e[CO2] (800 ppm) on N and P removal in CWs were explored under a 60-day exposure. This study aimed to (i) test An, carbohydrate metabolism and uptake of N and P in plants in CWs under e[CO2]; (ii) investigate the potential impact of e[CO2] on microbial enzyme activities; and (iii) reveal the changes in pollutant removal in CWs under e[CO2].

2. Materials and Methods

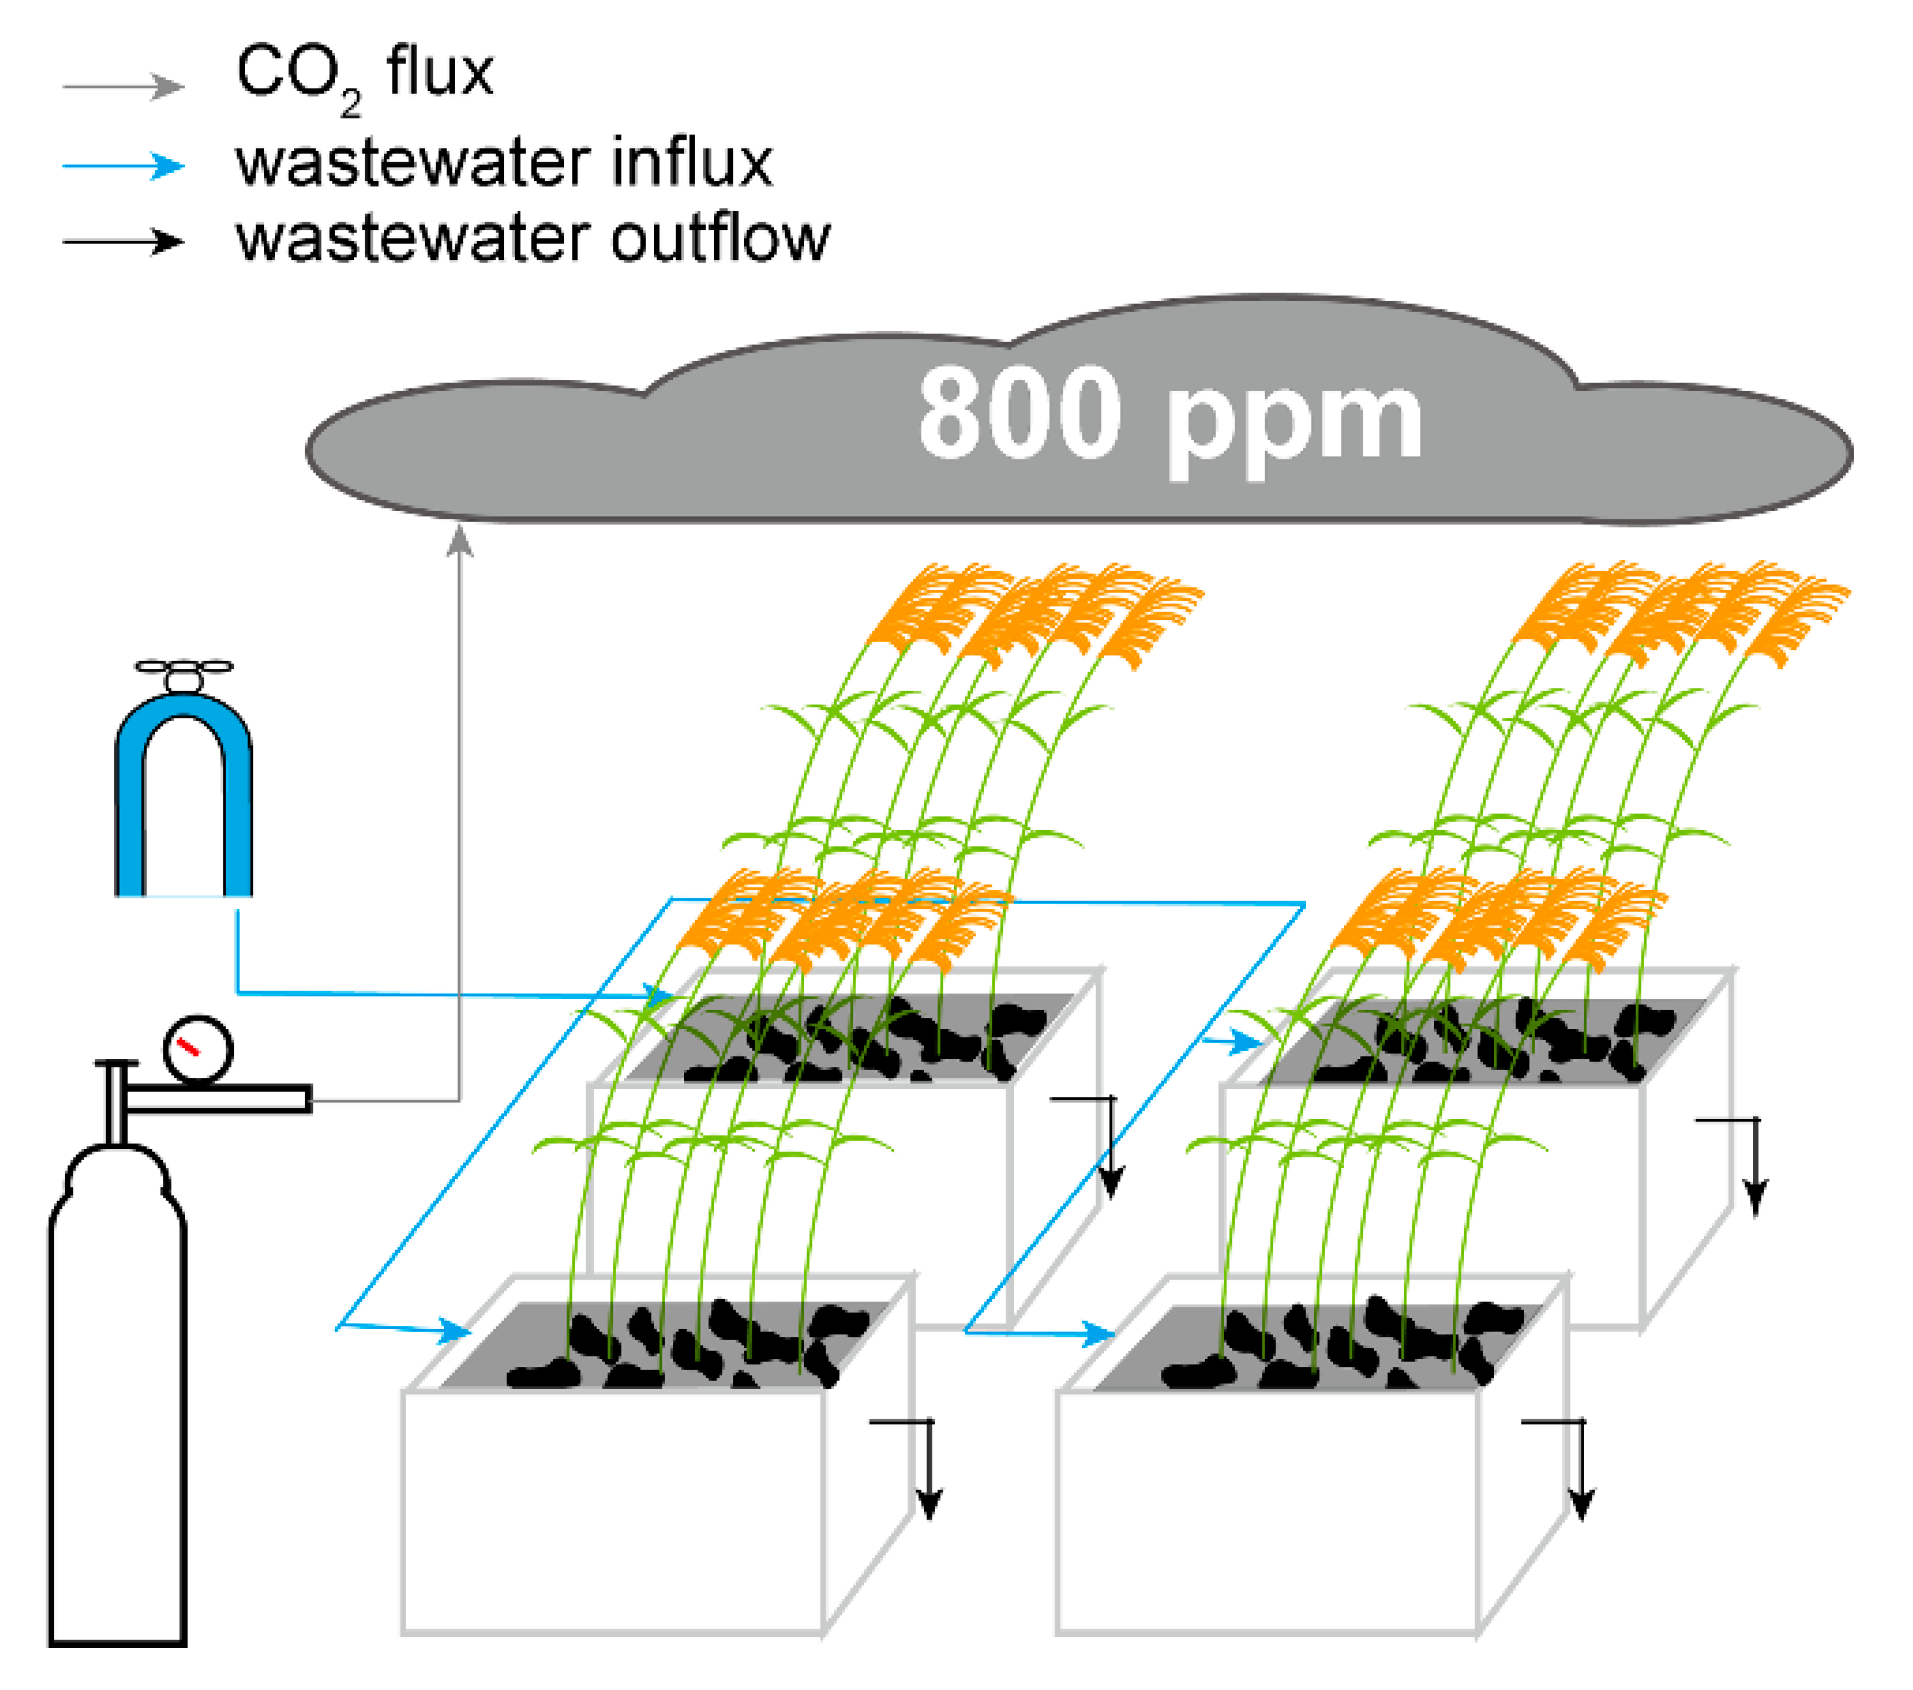
2.1. Experimental Setup and Synthetic Wastewater

Six subsurface-flow CW microcosms were setup in CO2-controlled chambers (Kesheng, Ningbo, China) in Northlake Science Park, Changchun, China. The CWs (45 cm × 30 cm × 35 cm) were filled with artificial gravel (8–10 mm in diameter) to an even depth of 35 cm (Figure 1). The water level was 30 cm. Six Phragmites australis seedlings with uniform size (approximately 55 cm in plant height) and vigor, were transplanted from the natural environment into each CW on 15 August 2019. The Phragmites australis plants included six leaves per tiller. The Phragmites australis plants were fed with 1/10 Hoagland solution for 30 days before the formal experiment, during this period the plants developed new leaves and roots. When the formal experiment started, three CWs were moved into the chamber at elevated CO2 concentration (e[CO2], 800 ppm), while another three CWs were kept at ambient CO2 concentration (a[CO2], 400 ppm). The actual CO2 concentration in the e[CO2] and a[CO2] chambers during the experimental period is shown in Figure 2. The climate conditions in the chambers were set to a day/night temperature of 26/20 °C, a relative humidity of approximately 70%, and a 16 h photoperiod with a photosynthetic active radiation of 400 μmol m−2 s−1. Synthetic wastewater was prepared following Wiessner et al. [18], containing 61.15 mg L−1 total organic carbon (TOC), 30.8 mg L−1 total nitrogen (TN), and 2.5 mg L−1 total phosphorus (TP) with a chemical oxygen demand (COD) of 163 mg L−1. During the experiment, 40 L of synthetic wastewater was added to each CW microcosm, and the sequencing fill and draw batch mode was applied, with each batch maintained for 6 days. After 10 batches (60 days), the samplings and measurements were initiated.

2.2. Samplings and Measurements

2.2.1. Water Samplings and Analysis

When the CWs’ operation was stable, a 250 mL water sample was collected by the drain tap at 1 cm from the bottom for each CW microcosm every day (from the influent day) in the typical target experimental batch. The concentrations of COD, TN, NH4+-N, and TP in water samples were analyzed according to the Water and Wastewater Monitoring and Analysis Methods [23]. The above measurements were obtained on six consecutive days. The removal efficiencies (REs) of COD, TN, NH4+-N, and TP were calculated as follows:
R E   ( % ) = ( 1 C e C i ) × 100
where Ce and Ci indicate effluent and influent concentrations (mg L−1) of a given parameter. Under e[CO2], the effluent concentrations of COD, TN, NH4+-N, and TP were 8.85 ± 0.67, 3.03 ± 0.18, 2.37 ± 0.25, and 1.22 ± 0.08 mg L−1, respectively; the influent concentrations of COD, TN, NH4+-N, and TP were 164.21 ± 0.54, 30.57 ± 0.29, 15.13 ± 0.11, and 2.50 ± 0.02 mg L−1, respectively. Under a[CO2], the effluent concentrations of COD, TN, NH4+-N and TP were 11.69 ± 0.39, 4.31 ± 0.13, 2.89 ± 0.50, and 1.18 ± 0.03 mg L−1, respectively; the influent concentrations of COD, TN, NH4+-N, and TP were 164.15 ± 0.76, 30.62 ± 0.22, 15.15 ± 0.09, and 2.50 ± 0.02 mg L−1, respectively.

2.2.2. Biomass, Leaf Area, Total Root Length, and Elemental Analysis

At the end of the experiment, total leaf area per plant was measured with a leaf area meter (LI-3100, Li-Cor, Inc., Lincoln, NE, USA). The roots were cleaned with ultrapure water, and the total root length was analyzed with a WinRHIZO root analysis system (WinRHIZO 2012a, Regent Instruments Canada Inc., Montreal, Canada). Shoot and root samples were oven-dried at 70 °C for 72 h and weighed to get dry weight (DW). Then, the dry samples were ground to a fine powder for C and N analysis by the Dumas dry combustion method [24]. Herein, the dry sample (200 mg) was transferred onto tinfoil placed in an automated sample loader. Then, the sample was burned, and the N2 was quantified when it passed a conductivity cell. The total P concentration was measured after ashing at 450 °C and solubilizing in hydrochloric acid and nitric acid by spectrophotometric analysis using a spectrophotometer at 410 nm after the addition of ammonium vanadomolybdate reagent [25]. Ammonium molybdate (25 g) was dissolved in boiling water (that is, Solution A). Ammonium vanadate (1.25 g) was dissolved in boiling water and diluted with nitric acid (that is, Solution B). Subsequently, Solution A was added into Solution B followed by dilution with deionized water, namely ammonium vanadomolybdate reagent.

2.2.3. Analysis of Xylem Sap Constituents and Leaf Water Potential

At the end of the experiment, midday leaf water potential was measured with a pressure chamber (Soil Moisture Equipment Corp., Santa Barbara, CA, USA) on fully expanded upper canopy leaves. Xylem sap was collected by pressurizing the roots of the Phragmites australis plants in a Scholander-type pressure chamber. The underground part of the plant was sealed in the pressure chamber, and the shoot was detopped at 5 cm from the stem base. Xylem sap (1 mL) was stored in an Eppendorf-vial wrapped with aluminum foil. All sap samples were frozen immediately after sampling and stored at −80 °C until analysis. The anions and cations in the xylem sap were measured by ion chromatography (Metrohm, Herisau, Switzerland). The anions were determined on a Metrosep A Supp 4 analytical column, and the cations were determined on a Metrosep C4-100 analytical column. For the above measurements, the anions included F, Cl, SO42−, NO3, NO2, PO43−, and Br, and the cations included Li+, Na+, K+, Ca2+, Mg2+, and NH4+.

2.2.4. Gas Exchange

Photosynthetic rate (An) and stomatal conductance (gs) were measured every day before water samplings for the target experimental batch. A portable photosynthesis system equipped with a 6400-02 LED leaf chamber (LI-Cor, Lincoln, USA) was used to measure the above indicators of the fully expanded upper canopy leaf (the marked leaves in each treatment). Before measurement, the plants were stimulated with environmental light for 2 h. The leaf chamber provided a controlled environment, maintaining a photosynthetic photon flux density (PPFD) of 1200 μmol m−2 s−1 and a CO2 concentration of 400 μmol mol−1. The above measurement was carried out on six consecutive days. On each measurement occasion, three leaves were taken for each treatment.

2.2.5. Carbohydrate Metabolism Enzyme Activities

The activities of key carbohydrate metabolism enzymes in Phragmites australis plants were measured according to the proposal of Jammer et al. [26]. The activities of invertases including cytInv, vacInv, and cwInv were analyzed in a miniaturized end-point assay and expressed in nkat mg−1, FW. The phosphofructokinase (PFK), phosphoglucoisomerase (PGI), phosphoglucomutase (PGM), fructokinase (FK), hexokinase (HXK), SuSy, UDP-glucose pyrophorylase (UGPase), glucose-6-phosphated dehydrogenase (G6PDH), ADP-glucose pyrophorylase (AGPase), and aldolase (Ald) were determined using kinetic enzyme assays. The analyses of enzyme activities for each sample were run three times with blanks using an Epoch Microplate Spectrophotometer (BioTek, Bad Friedrichshall, Germany) with a 96-well microtiter format.

2.2.6. Microbial Enzyme Activities

The dehydrogenase (DHA) activity was determined by the methods of Wang et al. [27] and Hu et al. [28]. The urease (URE) activity was determined according to Klose and Tabatabai [29]. The ammonia monooxygenase (AMO) activity was measured following the method of Zheng et al. [30]. Phosphatase (PHO) activity was analyzed according to the method of Schinner and Mersi [31] and Hu et al. [28].

2.3. Statistical Analysis

All data were subjected to the one-way ANOVA using the SigmaSATA (V3.5, Systat Software, San Jose, USA). Duncan’s multiple range test was applied to assess the differences between [CO2] treatments at a significance level of p < 0.05.

3. Results

3.1. Plant Growth and Photosynthesis as Affected by e[CO2]

After a 66-day incubation under different [CO2] conditions, the e[CO2] plants had significantly higher leaf area, shoot DW, and root DW than that under a[CO2], while total root length did not appear to be remarkably different in e[CO2] plants (Table 1). The e[CO2] induced the enhancement of C content in plants, while no significant difference was found in contents of N and P between the two [CO2] treatments. The gas exchange parameters of Phragmites australis plants were measured every day for the target experimental batch. The An in the upper canopy leaves was markedly increased by 51%–97% under e[CO2] treatment (Figure 3). However, the gs was markedly decreased by 37%–51% under e[CO2] treatment.

3.2. Xylem Sap Constituents as Affected by e[CO2]

In the e[CO2] condition, Phragmites australis plants had a decline in the nitrate concentration in xylem sap (Table 2). By contrast, the concentrations of phosphate and ammonium in xylem sap were not affected by either a[CO2] or e[CO2]. With respect to anions and cations, different trends were found, namely, the reduction of anion concentrations but no significant difference in the concentration of cations in e[CO2] plants in contrast to those in a[CO2] plants. Accordingly, the sum of anions and cations was significantly reduced in Phragmites australis plants under e[CO2]. Most notably, e[CO2] had a reduction influence on Ψleaf in Phragmites australis.

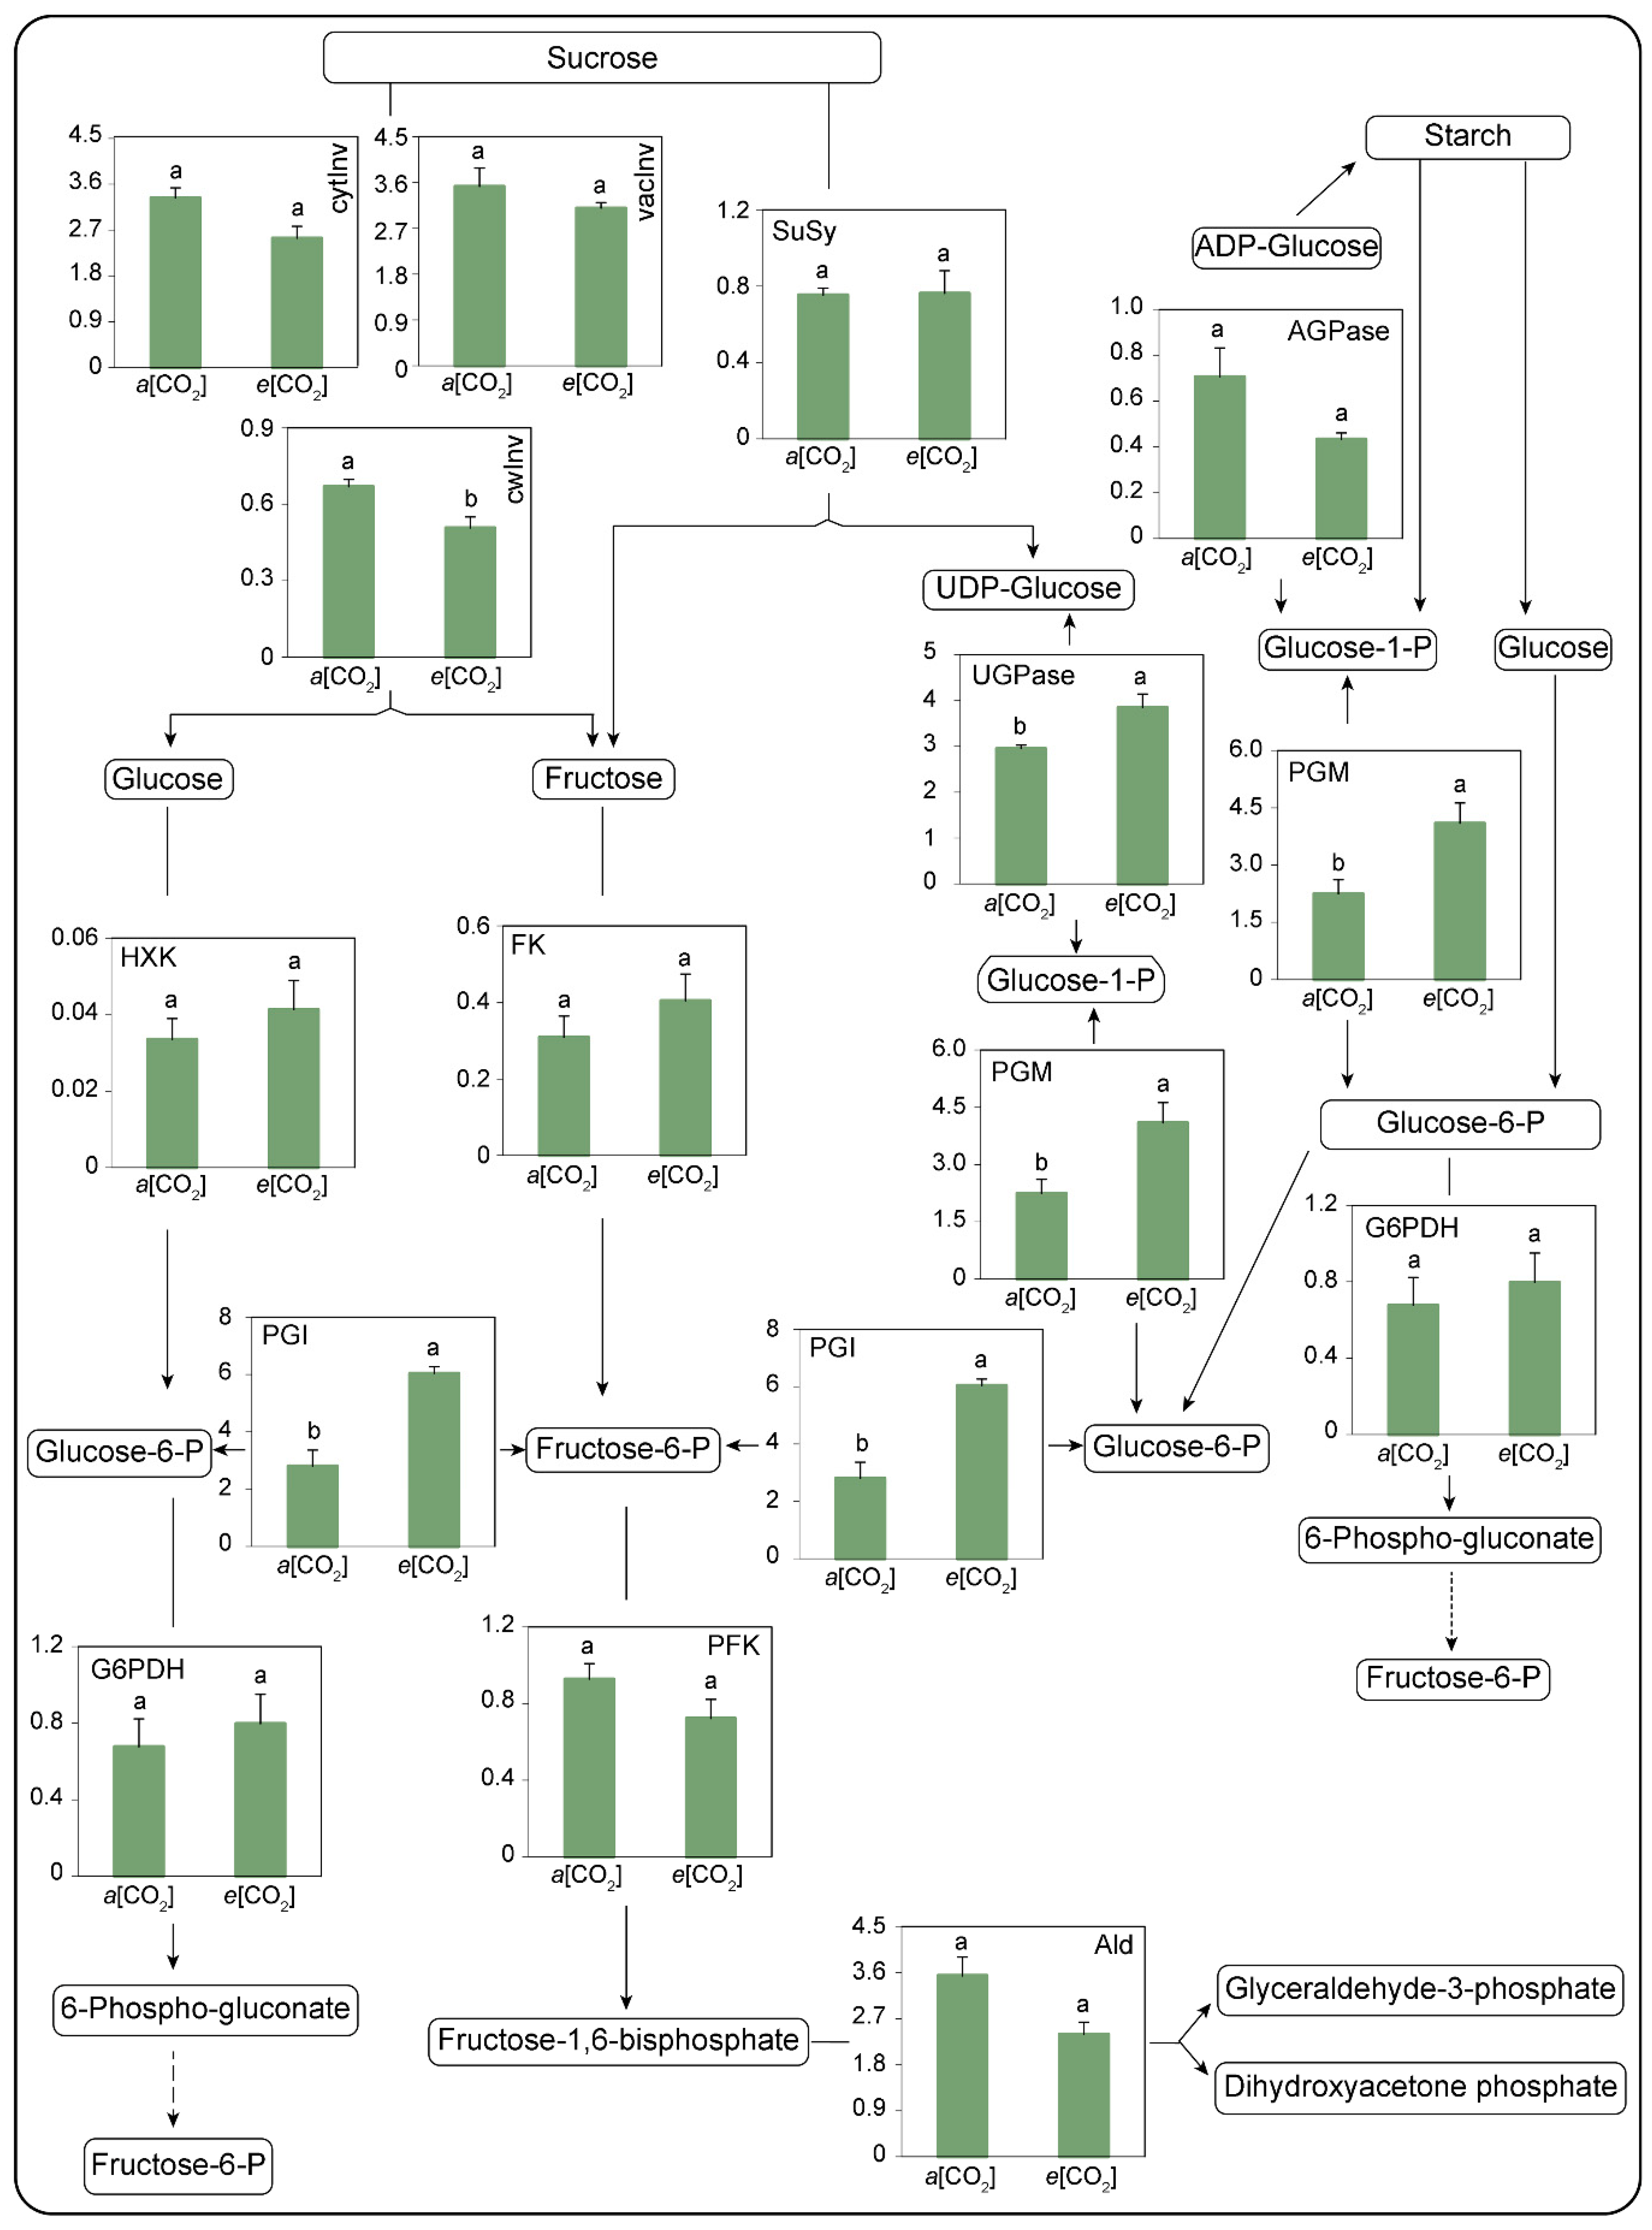
3.3. Carbohydrate Metabolism Enzymes as Affected by e[CO2]

The activities of 13 key carbohydrate metabolism enzymes in the fully expanded upper canopy leaves of Phragmites australis as affected by e[CO2] are shown in Figure 4 and Figure S1. The e[CO2] plants possessed significantly lower cwInv activity than the a[CO2] plants, while they had similar activities of cytInv and vacInv. When plants were exposed to e[CO2], there were no significant effects on all enzyme activities except for UGPase, PGM, and PGI, which appeared to be significantly increased.

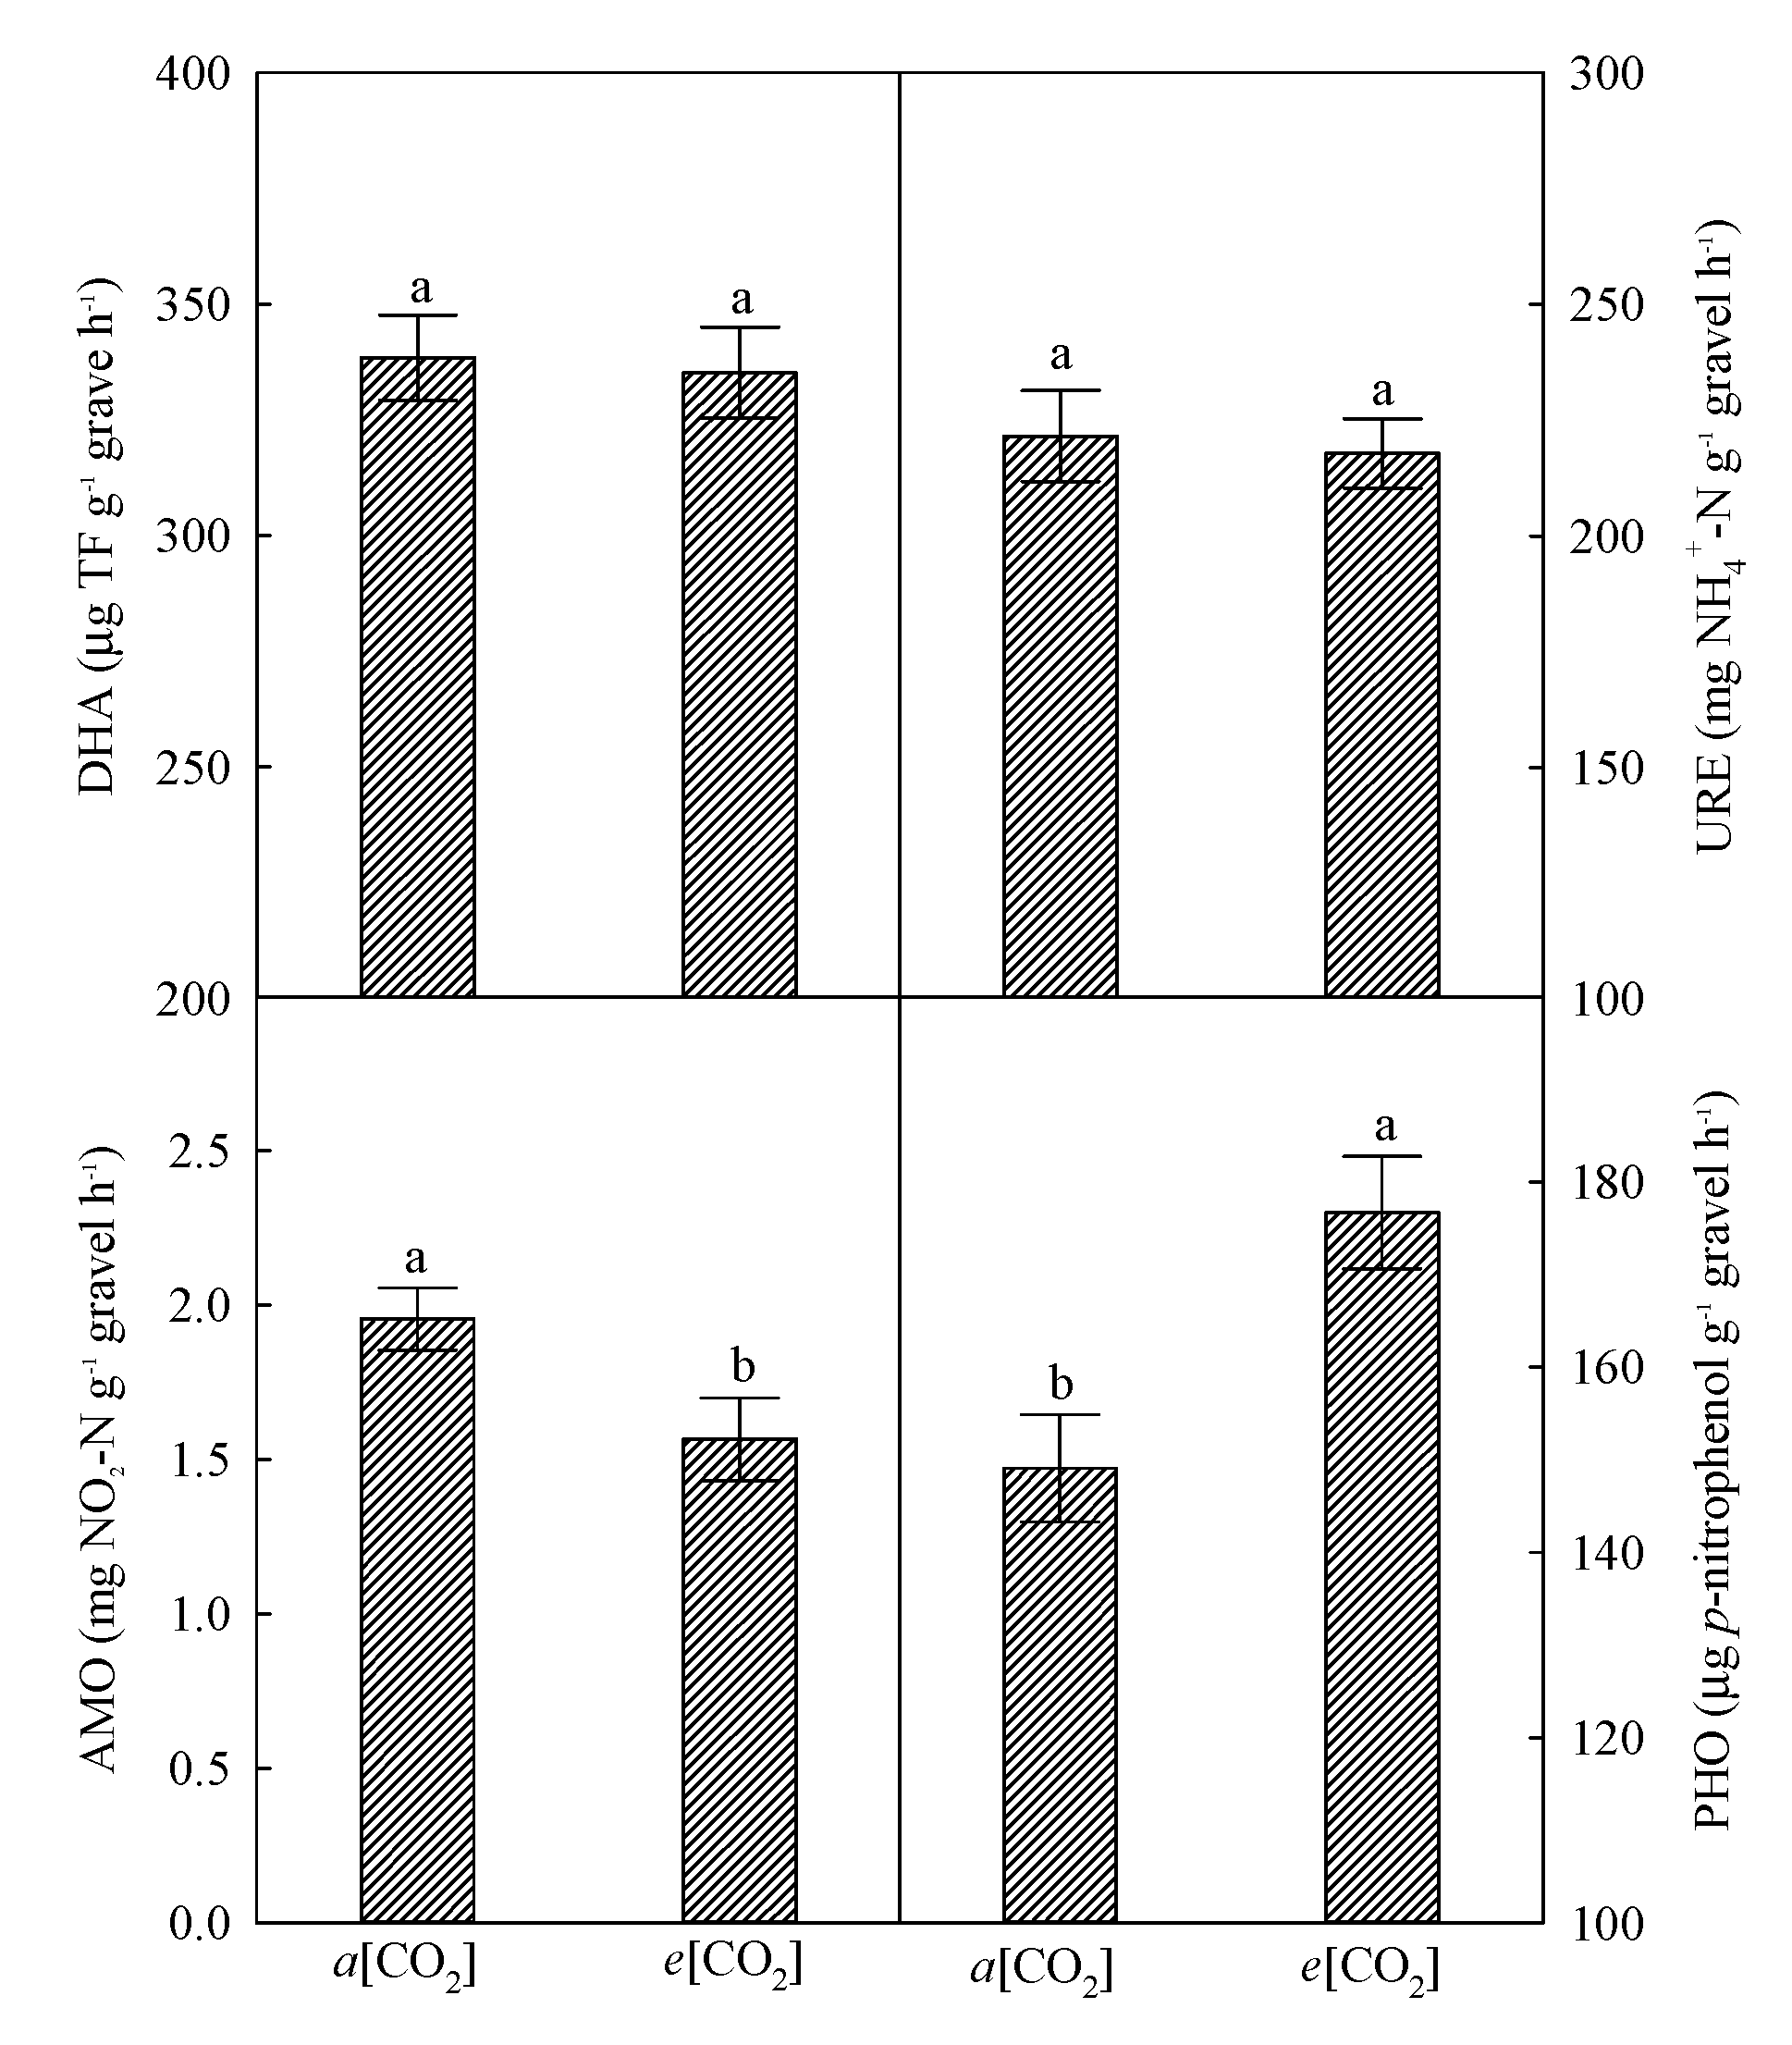
3.4. Microbial Enzymes as Affected by e[CO2]

Four microbial enzyme activities showed different expression levels, with the significant decrease of AMO activity, the significant increase of PHO activity, and no significant difference in the activities of DHA and URE being seen in e[CO2] plants (Figure 5).

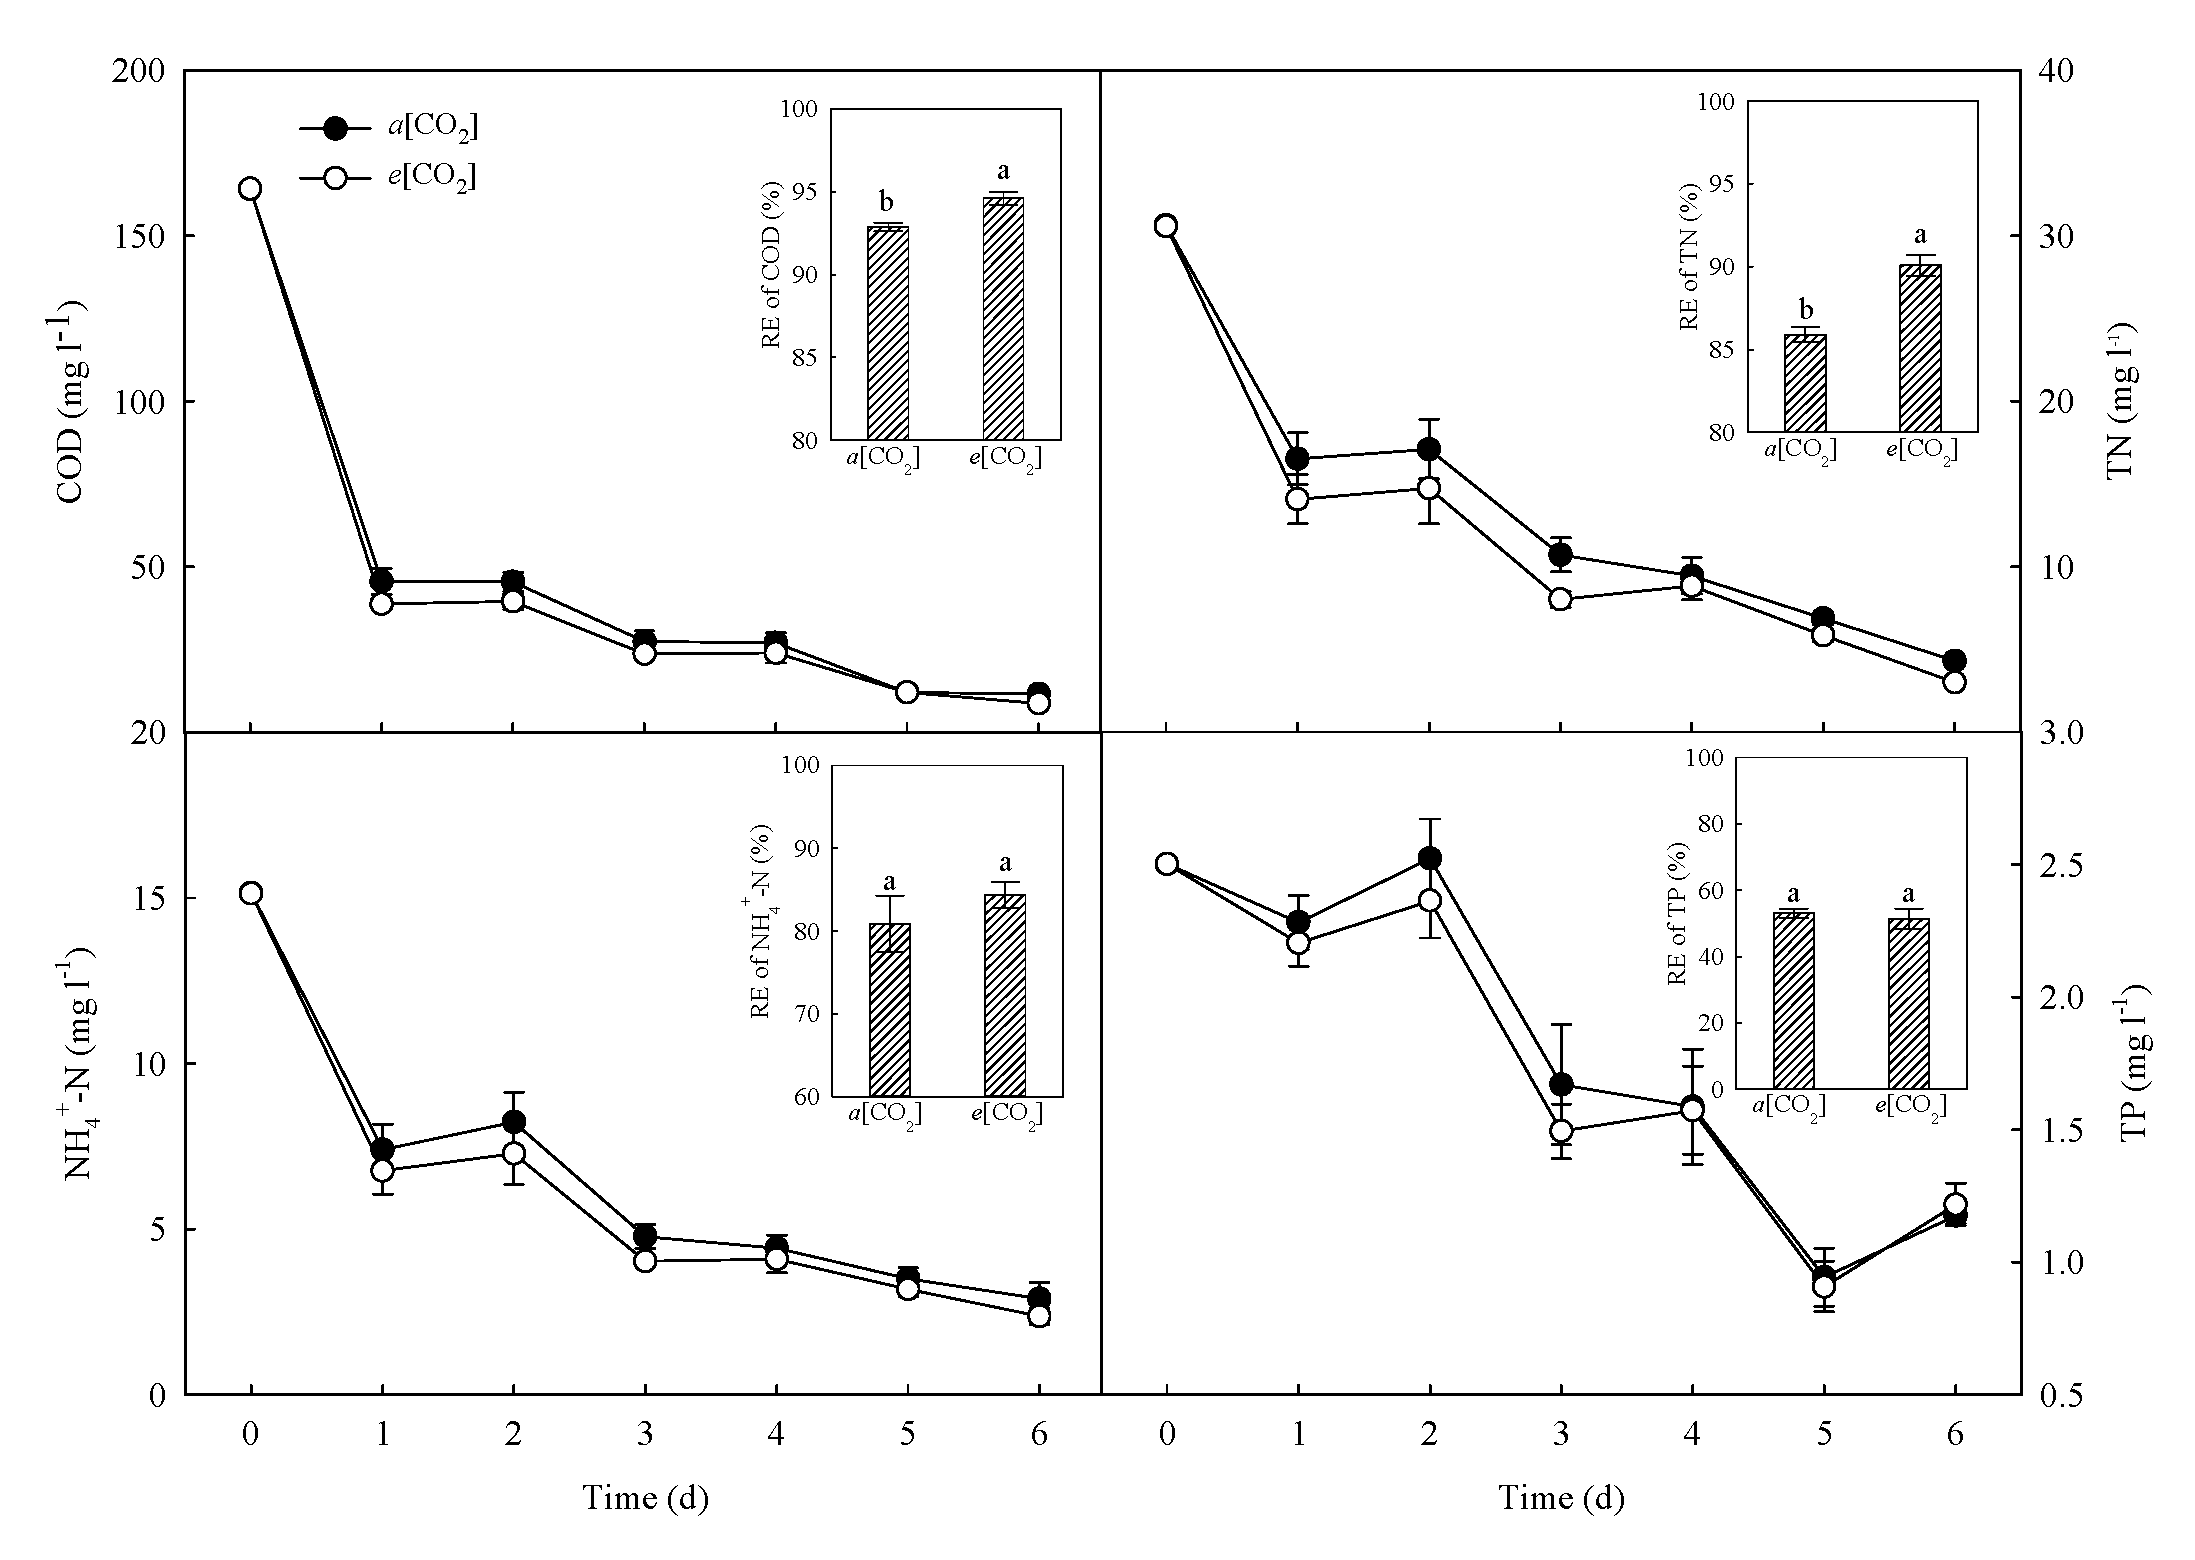
3.5. Treatment Performance of CWs as Affected by e[CO2]

A sharp decrease was found in the effluent concentrations of COD on Day 1 for both CWs under a[CO2] and e[CO2] (Figure 6). Lower effluent COD concentration was found in CWs in the e[CO2] condition, except for Day 5. Conversely, the RE of COD in CWs in the e[CO2] condition (94.6%) was significantly higher than that in the a[CO2] condition (92.8%). A similar trend was seen in the effluent concentrations of TN and NH4+-N in CWs under both [CO2] conditions. The effluent concentration of TN in CWs under e[CO2] was significantly lower than that in CWs under a[CO2] from Day 1 to Day 6. The effluent concentration of NH4+-N was also slightly less in CWs under e[CO2] in contrast to that under a[CO2], albeit the difference was not statistically significant. By contrast, e[CO2] induced a significantly high RE of TN in CWs (90.1%) but did not significantly affect the RE of NH4+-N in CWs. In addition, the effluent concentration of TP on Day 6 and the RE of TP had no significant difference in the presence of the e[CO2] treatment.

4. Discussion

4.1. Effects of e[CO2] on Plant Performance in CWs

As a major part of CWs, the plants play central roles in pollutant removal; their growth and interaction with other factors in CWs directly affect the CWs’ performance [28]. The physiological processes including photosynthesis, ion uptake, and carbohydrate metabolism would be influenced by e[CO2] [6,7,13].
The changes in plant physiological status were expected to play a role in the microbial activity and contaminant removal in CWs [22]. In present study, the Phragmites australis plant growth had an increase trend in the presence of e[CO2], showing a larger leaf area and a higher biomass in e[CO2] plants. However, the contents of N and P were similar in the plants, regardless of atmospheric CO2 concentration, though e[CO2] had significantly higher C content, indicating that the uptake and accumulation of N and P were not changed though the biomass of Phragmites australis plants was obviously increased by e[CO2]. This should be ascribed to the dilution effect. The dilution of ions by the enhanced plant growth has been documented well in various plant species including crops and annual grass under e[CO2] [32,33,34].
The promoted plant growth of Phragmites australis in CWs was caused by the higher photosynthetic carbon assimilation in the presence of e[CO2]. The An in the upper canopy leaf was significantly higher by 51%–97% under e[CO2], in contrast to that under a[CO2]. This indicated that e[CO2] enhanced the plant growth in CWs by increasing the contribution of photosynthesis to the carbohydrate accumulation in Phragmites australis. This e[CO2]-induced plant growth promotion has been reported in most kinds of plant species [35,36,37,38]. It should be also noted that the gs of Phragmites australis in the e[CO2] condition was significantly reduced, in contrast to that in a[CO2] control. This was because the high [CO2] triggered the stomatal closure, thus leading to the lower gs [39]. In addition, the e[CO2]-induced stomatal closure also resulted in reduced transpiration rate of Phragmites australis in CWs, inducing a corresponding decrease of the ions mass flow to the root surface [12], thereby lowering ion absorption including that of N and P. The nitrate concentration in the xylem sap of Phragmites australis was decreased by e[CO2], while the concentrations of phosphate and ammonium were not affected. In addition, the concentration of total ions and leaf water potential were both reduced by e[CO2]. Though no clear correlation between the contents of N and P in Phragmites australis and e[CO2] was found in our results, the changes in xylem sap constituents showed a trend that e[CO2] might reduce the level of total ions, hence affecting the N and P uptake and accumulation of plants in CWs.
In this study, the key carbohydrate metabolism enzymes exhibited different expression levels in the presence of e[CO2]. Sucrolytic enzyme activity (cwInv) was reduced by e[CO2], while the starch-biosynthesis-related enzyme (PGM) was enhanced by e[CO2] in the leaves of Phragmites australis in CWs. This was in agreement with the finding in sugarcane that the cwInv gene appeared to be downregulated in leaves under e[CO2] [40]. For the leaf PGM activity, a similar response to e[CO2] was found in Triticum aestivum [7]. However, the PGM activity in Brassica napus was weakly but not significantly increased in the e[CO2] condition, suggesting that the e[CO2]-induced PGM activity in leaves might be plant species dependent [26]. In the sucrose biosynthesis pathway, the UGPase activity in leaves of Phragmites australis was significantly enhanced by e[CO2]. UGPase is a regulator for UDP-glucose metabolism, and UDP-glucose is a precursor of sucrose, starch, and structural polysaccharides [41]. Thus, higher UGPase activity would benefit sucrose biosynthesis in Phragmites australis under e[CO2]. In the glycolysis pathway, the PGI activity was the only enzyme activity enhanced by e[CO2]. Sucrose is synthesized in the cytosol from fructose-6-phosphate, and PGI is a key member of the enzyme cascade for this process, which is responsible for reversible conversion of fructose-6-phosphate to glucose-6-phosphate [41]. Thus, higher PGI activity under e[CO2] indicated that fructan metabolism in the leaves was promoted by e[CO2], which benefited the plant growth in CWs.

4.2. Effects of e[CO2] on Microbial Enzyme Activity in CWs

Several microbial enzymes, such as DHA, URE, AMO, and PHO, play key roles in the microbial physiological metabolism processes, hence affecting the pollutant removal in CWs [28]. Among the microbial enzymes, DHA is responsible for the biodegradation of organic compounds [42]. Here, a remarkable effect on DHA activity in the e[CO2] condition was found, indicating that the process of organic compound biodegradation was similar in CWs, whether it was under a[CO2] or e[CO2]. URE and AMO are involved in organic N transformation and nitrification [43,44]. Compared with that under a[CO2], AMO activity was decreased in CWs under e[CO2], while URE activity was not affected. This result indicated that the changed organic N nitrification might affect the TN removal in CWs under e[CO2]. PHO is the key enzyme involved in the process of P transformation [43]. Interestingly, PHO activity showed a remarkable increased trend in the e[CO2] condition, which might affect the TP removal in CWs.

4.3. Effects of e[CO2] on Treatment Performance of CWs

Changes in plants and microorganisms bearing diverse physiological functionalities would directly affect the wastewater treatment efficiency in CWs [28]. In the present study, the RE of COD in CWs was significantly promoted by e[CO2]. This could be attributed to the e[CO2]-induced promotion in plant growth and the microorganisms’ activities. The biodegradation of organics is driven by aerobic and anaerobic microorganisms, which is related to the oxygen availability in CWs. It should be noted that DHA activity was less influenced by e[CO2], which is not in line with the difference in RE of COD. This suggested that the changes in DHA activity could not explain all difference in COD removal under various [CO2] conditions. For the N removal, e[CO2] significantly increased the RE of TN, while it had no significant effect on the RE of NH4+-N. It has been well documented that the microbially driven processes of nitrification and denitrification are the pivotal players for N removal in CWs [45]. Under e[CO2], nitrification was enhanced in CWs, as exemplified by the higher AMO activity, which benefited the N removal in CWs. This could be also related to the changes in pH of soil and water induced by e[CO2] [46]. The prevailing consensus is that combined e[CO2] and higher temperature increases nitrification rates and shifts the community structure of nitrifying communities [46,47]. Here, it was found that the concentration of NH4+-N in the e[CO2] condition was slightly lower than that in the a[CO2] condition. However, a current study indicated that e[CO2] had no remarkable effect on the composition and activity of nitrifier communities in soil, which was not in line with the results in the present study [48]. The different responses of nitrifier communities should be ascribed to the variations in soil moisture content. The prevailing viewpoint is that the inorganic carbon does not directly act as the carbon source of denitrifying microorganisms, and it does not directly affect the denitrification. Hence, e[CO2] could have an effect on denitrification via regulating physicochemical and biological environments in waterbodies, mainly including three environmental factors, namely, pH, dissolved oxygen, and NO3 availability. The denitrifying enzyme activities and NO3 availability depend on the change of pH caused by e[CO2] in waterbodies, thereby dominating denitrification efficiency. In addition, the RE of TP in CWs was not significantly affected by e[CO2], which agreed with the similar P uptake of Phragmites australis under both conditions. Higher acquisition of P under e[CO2] was reported in some crop species, but it depended on the physiological P-acquiring mechanisms of crops and the soil P condition [49,50].

5. Conclusions

To capture the impacts of e[CO2] (800 ppm) on N and P removal in CWs, aquatic plant performance, microbial enzyme activities, and pollutant removal were investigated in the e[CO2] condition. It should be noted that e[CO2] significant promoted photosynthetic carbon assimilation and plant growth, in relation to a[CO2] in our study. The uptakes of N and P in plants were not affected by e[CO2], while the concentrations of xylem sap constituents were changed. This indicates that plant uptake of N and P is not tightly correlated with increased plant biomass under e[CO2], and e[CO2]-induced stomatal closure causing reduced transpiration is responsible for the reduced absorption of N and P in plants. In addition, the ammonia monooxygenase activity declined in the e[CO2] condition, whereas the phosphatase activity increased. The increased removal efficiency of COD and TN in CWs could be ascribed to the changes in physiological performance of Phragmites australis and activity of microbial enzymes under e[CO2]. This study provides compelling evidence that future atmospheric CO2 concentration could affect the wastewater treatment efficiency in CWs, due to its direct effects on plants and microorganisms.

Supplementary Materials

The following are available online at https://www.mdpi.com/article/10.3390/w13182500/s1, Figure S1: t Specific activities of key carbohydrate metabolism enzyme in leaves of Phragmites australis grown under ambient (a[CO2], 400 ppm) and elevated (e[CO2], 800 ppm) atmospheric CO2 concentrations.

Author Contributions

Z.W.: conceptualization, formal analysis, and investigation. S.L. (Suxin Li): writing—original draft and visualization. S.L. (Shengqun Liu): supervision and project administration. F.W.: supervision and project administration. L.K.: formal analysis, investigation, and resources. X.L.: writing—review and editing, supervision, project administration, and funding acquisition. M.B.: supervision and formal analysis. All authors have read and agreed to the published version of the manuscript.

Funding

This research was funded by the National Key Research and Development Program of China (2018YFD0300601), the Taishan Scholars Project (tsqn201812123), the CAS Pioneer Hundred Talents Program (C08Y194), the Science and Technology Development Program of Jilin Province (20190201118JC), and the project EPPN2020-OPVaI-VA-ITMS313011T813.

Conflicts of Interest

The authors declare no conflict of interest.

References

  1. Levitan, O.; Rosenberg, G.; Setlik, I.; Setlikova, E.; Grigel, J.; Klepetar, J.; Prasil, O.; Berman-Frank, I. Elevated CO2 enhances nitrogen fixation and growth in the marine cyanobacterium Trichodesmium. Glob. Chang. Biol. 2007, 13, 531–538. [Google Scholar] [CrossRef]
  2. Kirschbaum, M.U.F. Modelling forest growth and carbon storage in response to increasing CO2 and temperature. Tellus. B 1999, 51, 871–888. [Google Scholar] [CrossRef] [Green Version]
  3. Cao, L.; Caldeira, K. Atmospheric CO2 stabilization and ocean acidification. Geophys. Res. Lett. 2008, 35, L19609. [Google Scholar] [CrossRef]
  4. Drake, J.E.; Aspinwall, M.J.; Pfautsch, S.; Rymer, P.D.; Reich, P.B.; Smith, R.A.; Crous, K.Y.; Tissue, D.T.; Ghannoum, O.; Tjoelker, M.G. The capacity to cope with climate warming declines from temperate to tropical latitudes in two widely distributed Eucalyptus species. Glob. Chang. Biol. 2015, 21, 459–472. [Google Scholar] [CrossRef]
  5. Dusenge, M.E.; Duarte, A.G.; Way, D.A. Plant carbon metabolism and climate change: Elevated CO2 and temperature impacts on photosynthesis, photorespiration and respiration. New. Phytol. 2019, 221, 32–49. [Google Scholar] [CrossRef] [Green Version]
  6. Ainsworth, E.A.; Rogers, A. The response of photosynthesis and stomatal conductance to rising [CO2]: Mechanisms and environmental interactions. Plant. Cell. Environ. 2007, 30, 258–270. [Google Scholar] [CrossRef]
  7. Li, X.; Ulfat, A.; Shokat, S.; Liu, S.; Zhu, X.; Liu, F. Responses of carbohydrate metabolism enzymes in leaf and spike to CO2 elevation and nitrogen fertilization and their relations to grain yield in wheat. Environ. Exp. Bot. 2019, 164, 149–156. [Google Scholar] [CrossRef]
  8. Huber, S.C. Role of sucrose-phosphate synthase in partitioning of carbon in leaves. Plant. Physiol. 1983, 71, 818–821. [Google Scholar] [CrossRef] [Green Version]
  9. Roitsch, T.; González, M.C. Function and regulation of plant invertases: Sweet sensations. Trends. Plant. Sci. 2004, 9, 606–613. [Google Scholar] [CrossRef]
  10. Guo, H.; Zhu, J.; Zhou, H.; Sun, Y.; Yin, Y.; Pei, D.; Ji, R.; Wu, J.; Wang, X. Elevated CO2 levels affects the concentrations of copper and cadmium in crops grown in soil contaminated with heavy metals under fully open-air field conditions. Environ. Sci. Technol. 2011, 45, 6997–7003. [Google Scholar] [CrossRef]
  11. Rajkumar, M.; Prasad, M.N.V.; Swaminathan, S.; Freitas, H. Climate change driven plant–metal–microbe interactions. Environ. Int. 2013, 53, 74–86. [Google Scholar] [CrossRef]
  12. Houshmandfar, A.; Fitzgerald, G.J.; Tausz, M. Elevated CO2 decreases both transpiration flow and concentrations of Ca and Mg in the xylem sap of wheat. J. Plant. Physiol. 2015, 174, 157–160. [Google Scholar] [CrossRef]
  13. Li, X.; Jiang, D.; Liu, F. Soil warming enhances the hidden shift of elemental stoichiometry by elevated CO2 in wheat. Sci. Rep. 2016, 6, 23313. [Google Scholar] [CrossRef]
  14. Benlloch-Gonzalez, M.; Berger, J.; Bramley, H.; Rebetzke, G.; Palta, J.A. The plasticity of the growth and proliferation of wheat root system under elevated CO2. Plant. Soil. 2013, 374, 963–976. [Google Scholar] [CrossRef]
  15. Dan, N.; Natalie, S.; Arunima, B.; Emily, B.G.; Christopher, R.A.; Ryan, M.; Mary, L.; Kirsten, S.H.; Janet, K.J. Soil microbiomes under climate change and implications for carbon cycling. Annu. Rev. Env. Resour. 2020, 45, 29–59. [Google Scholar] [CrossRef]
  16. Guenet, B.; Lenhart, K.; Leloup, J.; Giusti-Miller, S.; Pouteau, V.; Mora, P.; Nunan, N.; Abbadie, L. The impact of long-term CO2 enrichment and moisture levels on soil microbial community structure and enzyme activities. Geoderma 2012, 170, 331–336. [Google Scholar] [CrossRef]
  17. Saeed, T.; Sun, G. A review on nitrogen and organics removal mechanisms in subsurface flow constructed wetlands: Dependency on environmental parameters, operating conditions and supporting media. J. Environ. Manag. 2012, 112, 429–448. [Google Scholar] [CrossRef]
  18. Wiessner, A.; Kappelmeyer, U.; Kuschk, P.; Kastner, M. Influence of the redox condition dynamics on the removal efficiency of a laboratory-scale constructed wetland. Water. Res. 2005, 39, 248–256. [Google Scholar] [CrossRef]
  19. Zhang, X.; Wang, T.; Xu, Z.; Zhang, L.; Dai, Y.; Tang, X.; Tao, R.; Li, R.; Yang, Y.; Tai, Y. Effect of heavy metals in mixed domestic-industrial wastewater on performance of recirculating standing hybrid constructed wetlands (RSHCWs) and their removal. Chem. Eng. J. 2020, 379, 122363. [Google Scholar] [CrossRef]
  20. Ji, M.; Hu, Z.; Hou, C.; Liu, H.; Ngo, H.H.; Guo, W.; Lu, S.; Zhang, J. New insights for enhancing the performance of constructed wetlands at low temperatures. Bioresour. Technol. 2020, 301, 122722. [Google Scholar] [CrossRef] [PubMed]
  21. Yang, X.; Chen, Y.; Guo, F.; Liu, X.; Su, X.; He, Q. Metagenomic analysis of the biotoxicity of titanium dioxide nanoparticles to microbial nitrogen transformation in constructed wetlands. J. Hazard. Mater. 2020, 384, 121376. [Google Scholar] [CrossRef]
  22. Yang, X.; Chen, Y.; Liu, X.; Guo, F.; Su, X.; He, Q. Influence of titanium dioxide nanoparticles on functionalities of constructed wetlands for wastewater treatment. Chem. Eng. J. 2018, 352, 655–663. [Google Scholar] [CrossRef]
  23. Administration, T.S.E.P. Water and Wastewater Monitoring and Analysis Methods, 4th ed.; China Environmental Science Press: Beijing, China, 2002. [Google Scholar]
  24. Etheridge, R.D.; Pesti, G.M.; Foster, E.H. A comparison of nitrogen values obtained utilizing the Kjeldahl nitrogen and Dumas combustion methodologies (Leco CNS 2000) on samples typical of an animal nutrition analytical laboratory. Anim. Feed. Sci. Tech. 1998, 73, 21–28. [Google Scholar] [CrossRef]
  25. Stuffins, C.B. The determination of phosphate and calcium in feeding stuffs. Analyst 1967, 92, 107–111. [Google Scholar] [CrossRef]
  26. Jammer, A.; Gasperl, A.; Luschin-Ebengreuth, N.; Heyneke, E.; Chu, H.; Cantero-Navarro, E.; Grosskinsky, D.K.; Albacete, A.A.; Stabentheiner, E.; Franzaring, J.; et al. Simple and robust determination of the activity signature of key carbohydrate metabolism enzymes for physiological phenotyping in model and crop plants. J. Exp. Bot. 2015, 66, 5531–5542. [Google Scholar] [CrossRef] [PubMed] [Green Version]
  27. Wang, S.; Gao, M.; Li, Z.; She, Z.; Wu, J.; Zheng, D.; Guo, L.; Zhao, Y.; Gao, F.; Wang, X. Performance evaluation, microbial enzymatic activity and microbial community of a sequencing batch reactor under long-term exposure to cerium dioxide nanoparticles. Bioresour. Technol. 2016, 220, 262–270. [Google Scholar] [CrossRef] [PubMed]
  28. Hu, X.; Liu, X.; Yang, X.; Guo, F.; Su, X.; Chen, Y. Acute and chronic responses of macrophyte and microorganisms in constructed wetlands to cerium dioxide nanoparticles: Implications for wastewater treatment. Chem. Eng. J. 2018, 348, 35–45. [Google Scholar] [CrossRef]
  29. Klose, S.; Tabatabai, M.A. Urease activity of microbial biomass in soils as affected by cropping systems. Biol. Fertility. Soils. 2000, 31, 191–199. [Google Scholar] [CrossRef]
  30. Zheng, X.; Chen, Y.; Wu, R. Long-term effects of titanium dioxide nanoparticles on nitrogen and phosphorus removal from wastewater and bacterial community shift in activated sludge. Environ. Sci. Technol. 2011, 45, 7284–7290. [Google Scholar] [CrossRef] [PubMed]
  31. Schinner, F.; Mersi, W.V. Xylanase-, CM-cellulase- and invertase activity in soil: An improved method. Soil. Biol. Biochem. 1990, 22, 511–515. [Google Scholar] [CrossRef]
  32. McGrath, J.M.; Lobell, D.B. Reduction of transpiration and altered nutrient allocation contribute to nutrient decline of crops grown in elevated CO2 concentrations. Plant. Cell. Environ. 2013, 36, 697–705. [Google Scholar] [CrossRef]
  33. de Graaff, M.A.; van Groenigen, K.J.; Six, J.; Hungate, B.; van Kessel, C. Interactions between plant growth and soil nutrient cycling under elevated CO2: A meta-analysis. Global. Change. Biol. 2006, 12, 2077–2091. [Google Scholar] [CrossRef]
  34. Huxman, T.E.; Charlet, T.N.; Grant, C.; Smith, S. The effects of parental CO2 and offspring nutrient environment on initial growth and photosynthesis in an annual grass. Int. J. Plant Sci. 2001, 162, 617–623. [Google Scholar] [CrossRef]
  35. Pedersen, O.; Colmer, T.D.; Garcia-Robledo, E.; Revsbech, N.P. CO2 and O2 dynamics in leaves of aquatic plants with C3 or CAM photosynthesis—Application of a novel CO2 microsensor. Ann. Bot. 2018, 122, 605–615. [Google Scholar] [CrossRef] [Green Version]
  36. Boatman, T.G.; Davey, P.A.; Lawson, T.; Geider, R.J. CO2 modulation of the rates of photosynthesis and light-dependent O2 consumption in Trichodesmium. J. Exp. Bot. 2018, 70, 589–597. [Google Scholar] [CrossRef] [Green Version]
  37. Ikawa, H.; Chen, C.P.; Sikma, M.; Yoshimoto, M.; Sakai, H.; Tokida, T.; Usui, Y.; Nakamura, H.; Ono, K.; Maruyama, A.; et al. Increasing canopy photosynthesis in rice can be achieved without a large increase in water use-a model based on free-air CO2 enrichment. Glob. Chang. Biol. 2017, 24, 1321–1341. [Google Scholar] [CrossRef]
  38. Ainsworth, E.A.; Long, S.P. What have we learned from 15 years of free-air CO2 enrichment (FACE)? A meta-analytic review of the responses of photosynthesis, canopy properties and plant production to rising CO2. New. Phytol. 2005, 165, 351–371. [Google Scholar] [CrossRef]
  39. Li, S.; Li, X.; Wei, Z.; Liu, F. ABA-mediated modulation of elevated CO2 on stomatal response to drought. Curr. Opin. Plant Biol. 2020, 56, 174–180. [Google Scholar] [CrossRef]
  40. de Souza, A.P.; Gaspar, M.; da Silva, E.A.; Ulian, E.C.; Waclawovsky, A.J.; Nishiyama, M.Y., Jr.; Dos Santos, R.V.; Teixeira, M.M.; Souza, G.M.; Buckeridge, M.S. Elevated CO2 increases photosynthesis, biomass and productivity, and modifies gene expression in sugarcane. Plant. Cell. Environ. 2008, 31, 1116–1127. [Google Scholar] [CrossRef]
  41. Kleczkowski, L.A. Glucose activation and metabolism through UDP-glucose pyrophosphorylase in plants. Phytochemistry 1994, 37, 1507–1515. [Google Scholar] [CrossRef]
  42. Yang, X.; Pan, H.; Wang, P.; Zhao, F. Particle-specific toxicity and bioavailability of cerium oxide (CeO2) nanoparticles to Arabidopsis thaliana. J. Hazard. Mater. 2017, 322, 292–300. [Google Scholar] [CrossRef]
  43. Kong, L.; Wang, Y.; Zhao, L.; Chen, Z. Enzyme and root activities in surface-flow constructed wetlands. Chemosphere 2009, 76, 601–608. [Google Scholar] [CrossRef]
  44. Zheng, X.; Su, Y.; Chen, Y. Acute and chronic responses of activated sludge viability and performance to silica nanoparticles. Environ. Sci. Technol. 2012, 46, 7182–7188. [Google Scholar] [CrossRef]
  45. Chen, X.; Zhu, H.; Bañuelos, G.; Shutes, B.; Yan, B.; Cheng, R. Biochar reduces nitrous oxide but increases methane emissions in batch wetland mesocosms. Chem. Eng. J. 2020, 392, 124842. [Google Scholar] [CrossRef]
  46. Nguyen, L.T.T.; Broughton, K.; Osanai, Y.; Anderson, I.C.; Bange, M.P.; Tissue, D.T.; Singh, B.K. Effects of elevated temperature and elevated CO2 on soil nitrification and ammonia-oxidizing microbial communities in field-grown crop. Sci. Total Environ. 2019, 675, 81–89. [Google Scholar] [CrossRef] [PubMed]
  47. Azam, F.; Gill, S.; Farooq, S. Availability of CO2 as a factor affecting the rate of nitrification in soil. Soil. Biol. Biochem. 2005, 37, 2141–2144. [Google Scholar] [CrossRef]
  48. Seneca, J.; Pjevac, P.; Canarini, A.; Herbold, C.W.; Zioutis, C.; Dietrich, M.; Simon, E.; Prommer, J.; Bahn, M.; Potsch, E.M.; et al. Composition and activity of nitrifier communities in soil are unresponsive to elevated temperature and CO2, but strongly affected by drought. ISME. J. 2020, 14, 3038–3053. [Google Scholar] [CrossRef]
  49. O’Sullivan, J.B.; Jin, J.; Tang, C. Elevated CO2 promotes the acquisition of phosphorus in crop species differing in physiological phosphorus-acquiring mechanisms. Plant. Soil. 2020, 455, 397–408. [Google Scholar] [CrossRef]
  50. Jiang, M.; Caldararu, S.; Zhang, H.; Fleischer, K.; Crous, K.Y.; Yang, J.; de Kauwe, M.G.; Ellsworth, D.S.; Reich, P.B.; Tissue, D.T.; et al. Low phosphorus supply constrains plant responses to elevated CO2: A meta-analysis. Glob. Chang. Biol. 2020, 16, 5856–5873. [Google Scholar] [CrossRef]
Figure 1. A schematic diagram of the CW system.
Water 13 02500 g001
Figure 2. The actual CO2 concentration in 400 and 800 ppm chambers during the experimental period.
Water 13 02500 g002
Figure 3. Photosynthetic rate (An) and stomatal conductance (gs) in leaves of Phragmites australis grown under ambient (a[CO2], 400 ppm) and elevated (e[CO2], 800 ppm) atmospheric CO2 concentrations in six consecutive days. Data are expressed as means ± SEM (n = 3).
Water 13 02500 g003
Figure 4. Specific activities of key carbohydrate metabolism enzyme in leaves of Phragmites australis grown under ambient (a[CO2], 400 ppm) and elevated (e[CO2], 800 ppm) atmospheric CO2 concentrations. Different small letters mean significant difference at p < 0.05 level. Data are expressed as means ± SEM (n = 3). AGPase, ADP-glucose pyrophorylase; Ald, aldolase; cytInv, cytoplasmic invertase; cwInv, cell wall invertase; FK, fructokinase; Fructose-6-P, fructose-6-phosphate; Glucose-1-P, glucose-1-phosphate; Glucose-6-P, glucose-6-phosphate; G6PDH, glucose-6-phosphate dehydrogenase; HXK, hexokinase; PFK, phosphofructokinase; PGI, phosphoglucoisomerase; PGM, phosphoglucomutase; SuSy, sucrose synthase; UGPase, UDP-glucose pyrophorylase; vacInv, vacuolar invertase.
Water 13 02500 g004
Figure 5. Activities of dehydrogenase, urease, ammonia monooxygenase, and phosphatase of microorganisms on the gravel under ambient (a[CO2], 400 ppm) and elevated (e[CO2], 800 ppm) atmospheric CO2 concentrations. Different small letters mean significant difference at p < 0.05 level. Data are expressed as means ± SEM (n = 3).
Water 13 02500 g005
Figure 6. Effluent concentrations and removal efficiency (RE) of chemical oxygen demand, ammonia nitrogen, total nitrogen, and total phosphorus in the constructed wetlands on six consecutive days under ambient (a[CO2], 400 ppm) and elevated (e[CO2], 800 ppm) atmospheric CO2 concentrations. Different small letters mean significant difference at p < 0.05 level. Data are expressed as means ± SEM (n = 3).
Water 13 02500 g006
Table 1. Leaf area; total root length; dry weight (DW); and C, N, P content of Phragmites australis grown under ambient (a[CO2], 400 ppm) and elevated (e[CO2], 800 ppm) atmospheric CO2 concentrations. Different small letters mean significant difference at p < 0.05 level. Data are expressed as means ± SEM (n = 3).
TreatmentLeaf Area (cm2 Plant−1)Total Root Length (cm Plant−1)Shoot DW (g Plant−1)Root DW (g Plant−1)C Content (g)N Content (g)P Content (g)
a[CO2]84.2 ± 3.0 b209.3 ± 5.2 a139.0 ± 4.4 b48.8±1.2 b52.7 ± 0.8 b5.2 ± 0.1 a1.1 ± 0.1 a
e[CO2]101.2 ± 3.1 a223.5 ± 8.4 a174.8 ± 3.4 a64.3±2.3 a73.8 ± 2.8 a5.9 ± 0.3 a1.2 ± 0.1 a
Table 2. Xylem sap constituents and leaf water potential (Ψleaf) of Phragmites australis grown under ambient (a[CO2], 400 ppm) and elevated (e[CO2], 800 ppm) atmospheric CO2 concentrations. Different small letters mean significant difference at p < 0.05 level. Data are expressed as means ± SEM (n = 3).
TreatmentNitrate (mol m−3)Phosphate (mol m−3)Ammonium (mol m−3)∑Anions (mol m−3)∑Cations (mol m−3)∑(Anions + Cations) (mol m−3)Ψleaf (MPa)
a[CO2]42.54 ± 1.69 a4.87 ± 0.43 a5.93 ± 1.06 a71.37 ± 5.04 a80.08 ± 1.24 a151.45 ± 4.34 a−0.42 ± 0.01 a
e[CO2]37.10 ± 1.23 b3.00 ± 0.35 a4.29 ± 0.68 a57.37 ± 3.58 b73.15 ± 3.76 a130.52 ± 6.61 b−0.51 ± 0.02 b
Publisher’s Note: MDPI stays neutral with regard to jurisdictional claims in published maps and institutional affiliations.

