
Hydrological Similarity-Based Parameter Regionalization under Different Climate and Underlying Surfaces in Ungauged Basins


1
School of Urban and Environmental Sciences, Huaiyin Normal University, Huaian 223300, China
2
Research Institute of Huai River Eco-Economic Belt, Key Research Base of Philosophy and Social Sciences of Colleges, Universities in Jiangsu Province, Huaian 223300, China
3
State Key Laboratory of Hydrology-Water Resources and Hydraulic Engineering, Nanjing Hydraulic Research Institute, Nanjing 210029, China
4
Research Center for Climate Change, Ministry of Water Resources, Nanjing 210029, China
*
Author to whom correspondence should be addressed.
Water 2021, 13(18), 2508; https://doi.org/10.3390/w13182508
Submission received: 14 July 2021
/
Revised: 31 August 2021
/
Accepted: 9 September 2021
/
Published: 13 September 2021
(This article belongs to the Special Issue Management and Monitoring of Urban and Rural Ecological Water Resources)
Abstract
:Hydrological similarity-based parameter regionalization is the dominant method used for runoff prediction in ungauged basin. However, the application of this approach depends on assessing hydrological similarity between basins. This study used data for runoff, climate, and the underlying surface of the Hulan River Basin and Poyang Lake Basin to construct a novel physical hydrological similarity index (HSI). The index was used to compare the efficiency of transfer of the parameters of commonly used regionalization methods and to finally apply parameters to ungauged basins. The results showed that: (1) Precipitation is the main climatic factor regulating magnitude of runoff in the Poyang Lake Basin. Spring runoff in Hulan River Basin was regulated by precipitation and temperature. (2) The GR4J and CemaNeigeGR4J models achieved reasonable simulations of runoff of Poyang Lake Basin and Hulan River Basin. Although CemaNeigeGR4J considers snowmelt, the model simulations of spring runoff in the Hulan River Basin were not accurate. (3) There was a significant correlation between climate, the underlying surface, and hydrological model parameters. There were fewer significant correlations between environmental factors and between environmental factors and hydrological model parameters in the Hulan River Basin compared to those in the Poyang Lake Basin, possibly due to less sub-basins in the Hulan River Basin. (4) The HSI based on a combination of principal component analysis and the entropy method efficiently identified the most similar gauged basin for an ungauged basin. A significant positive correlation existed between the HSI and parameter transfer efficiency. The relationship between the HSI and transfer efficiency could be represented by logistic regression and linear regression in the Poyang Lake Basin and Hulan River Basin, respectively. The HSI was better able to quantify the hydrological similarity between basins in terms of climate and underlying surface and can provide a scientific reference for the transfer of hydrological model parameters in an ungauged basin.
1. Introduction
Runoff results from the combined effects of various factors affecting a watershed, including meteorology, vegetation, soil, and topography. A hydrological model discretizes the characteristic elements of watershed meteorology, soil, vegetation, and hydrology to accurately describe the hydro-physical process [1]. Uncertainty of hydrological model parameters is an important source of uncertainty in hydrological prediction. This uncertainty can be reduced by obtaining observed data required to determine the values of unknown parameters for hydrological models [2,3,4]. Parameter optimization algorithms are usually applied to basins with observed data to obtain simulations of runoff that are as close as possible to the observed runoff. However, a hydrological model cannot predict magnitude of runoff in ungauged basin. At present, most basins globally lack observed runoff data and the basins that already have data may become ungauged due to environmental changes [5]. There is an urgent need to identify methods of calibrating hydrological model parameters in ungauged basins so as to conduct hydrological forecasting [6,7]. The “Predictions in Ungauged Basins (PUB)” program of the International Association of Hydrological Sciences (IAHS) stressed that regionalization based on hydrological similarity is the most scientific and effective way to achieve hydrological forecasting in ungauged basins [8].
Parameter regionalization involves the use of the parameters of a hydrological model of a gauged basin to deduce the parameters of an ungauged basin based on the hydrological similarity framework. Methods used in parameter regionalization mainly include regression, physical similarity, and spatial proximity [9,10,11]. Under physical similarity, a reference watershed most similar to the ungauged basin is identified, following which the parameters of the reference basin are transferred to the ungauged basin [12]. The success of this method depends on the selection of watershed attributes for hydrologically similarity [13]. Spatial proximity assumes that climate and basin attributes change smoothly in space. Measures of spatial proximity, such as the distance between watershed outlets or the centroids of watersheds, can be used to select the reference basin [14]. Although this method has generally been successfully applied in basins with high gauge density, spatial proximity does not always translate to hydrological similarity [8]. The regression method associates hydrological model parameters with the attributes of gauged basins through empirical relationships, following which these regression equations can be used to estimate model parameters in ungauged basins [15]. Since parameter regression ignores the causal relationship between watershed attributes and watershed response, explaining regression results from the perspective of hydrological processes can be difficult [9]. Although the efficiency of regionalization is different among different regions and different hydrological models, the physical similarity and spatial proximity methods of regionalization have been relatively more successful than other methods [8,16,17].
Parameter regionalization by methods such as physical similarity and spatial proximity requires the selection of a reference basin that is hydrologically similar to the ungauged basin. “Hydrological similarity” or “watershed similarity” assumes that despite the complexity of the basin responses due to the heterogeneity and variation in hydrological processes, watershed behavior retains a certain degree of organization and predictability [18]. This concept allows the migration of hydrological information from a reference basin to an ungauged basin [19,20]. In the physical similarity method, the similarity index for finding the donor catchments to generate a set of model parameters can be applied to the target catchment. In physical similarity, the definition of catchment similarities and the inconsistent number of catchment attributes selected in different regions will affect the final results [21]. The hydrological system is complex and it is difficult to quantitatively describe hydrological similarity. Previous studies typically selected certain climatic and underlying surface factors defining hydrological similarity by comparing differences between basins [16,22]. For example, Yang et al. [23] selected 16 catchment descriptors to calculate physical similarity, and Ragettli et al. [24] collected 58 catchment attributes, and the selected attributes were quite different. So, the calculation of hydrological similarity is complicated by the difficulty associated with the selection of climate and underlying surface factors and the subjectivity of the calculation of environmental weights. The present study proposes a novel physical similarity index by combining principal component analysis and the entropy method. The index is used to assess the hydrological similarity between basins. The present study applied the index to the Hulan River Basin and Poyang Lake Basin. Leave-one-out cross-validation was used to analyze the efficiency of parameter transfer for spatial proximity and physical similarity so as to achieve parameter transfer to an ungauged basin.
2. Study Area, Data, and Methodology
2.1. Study Area
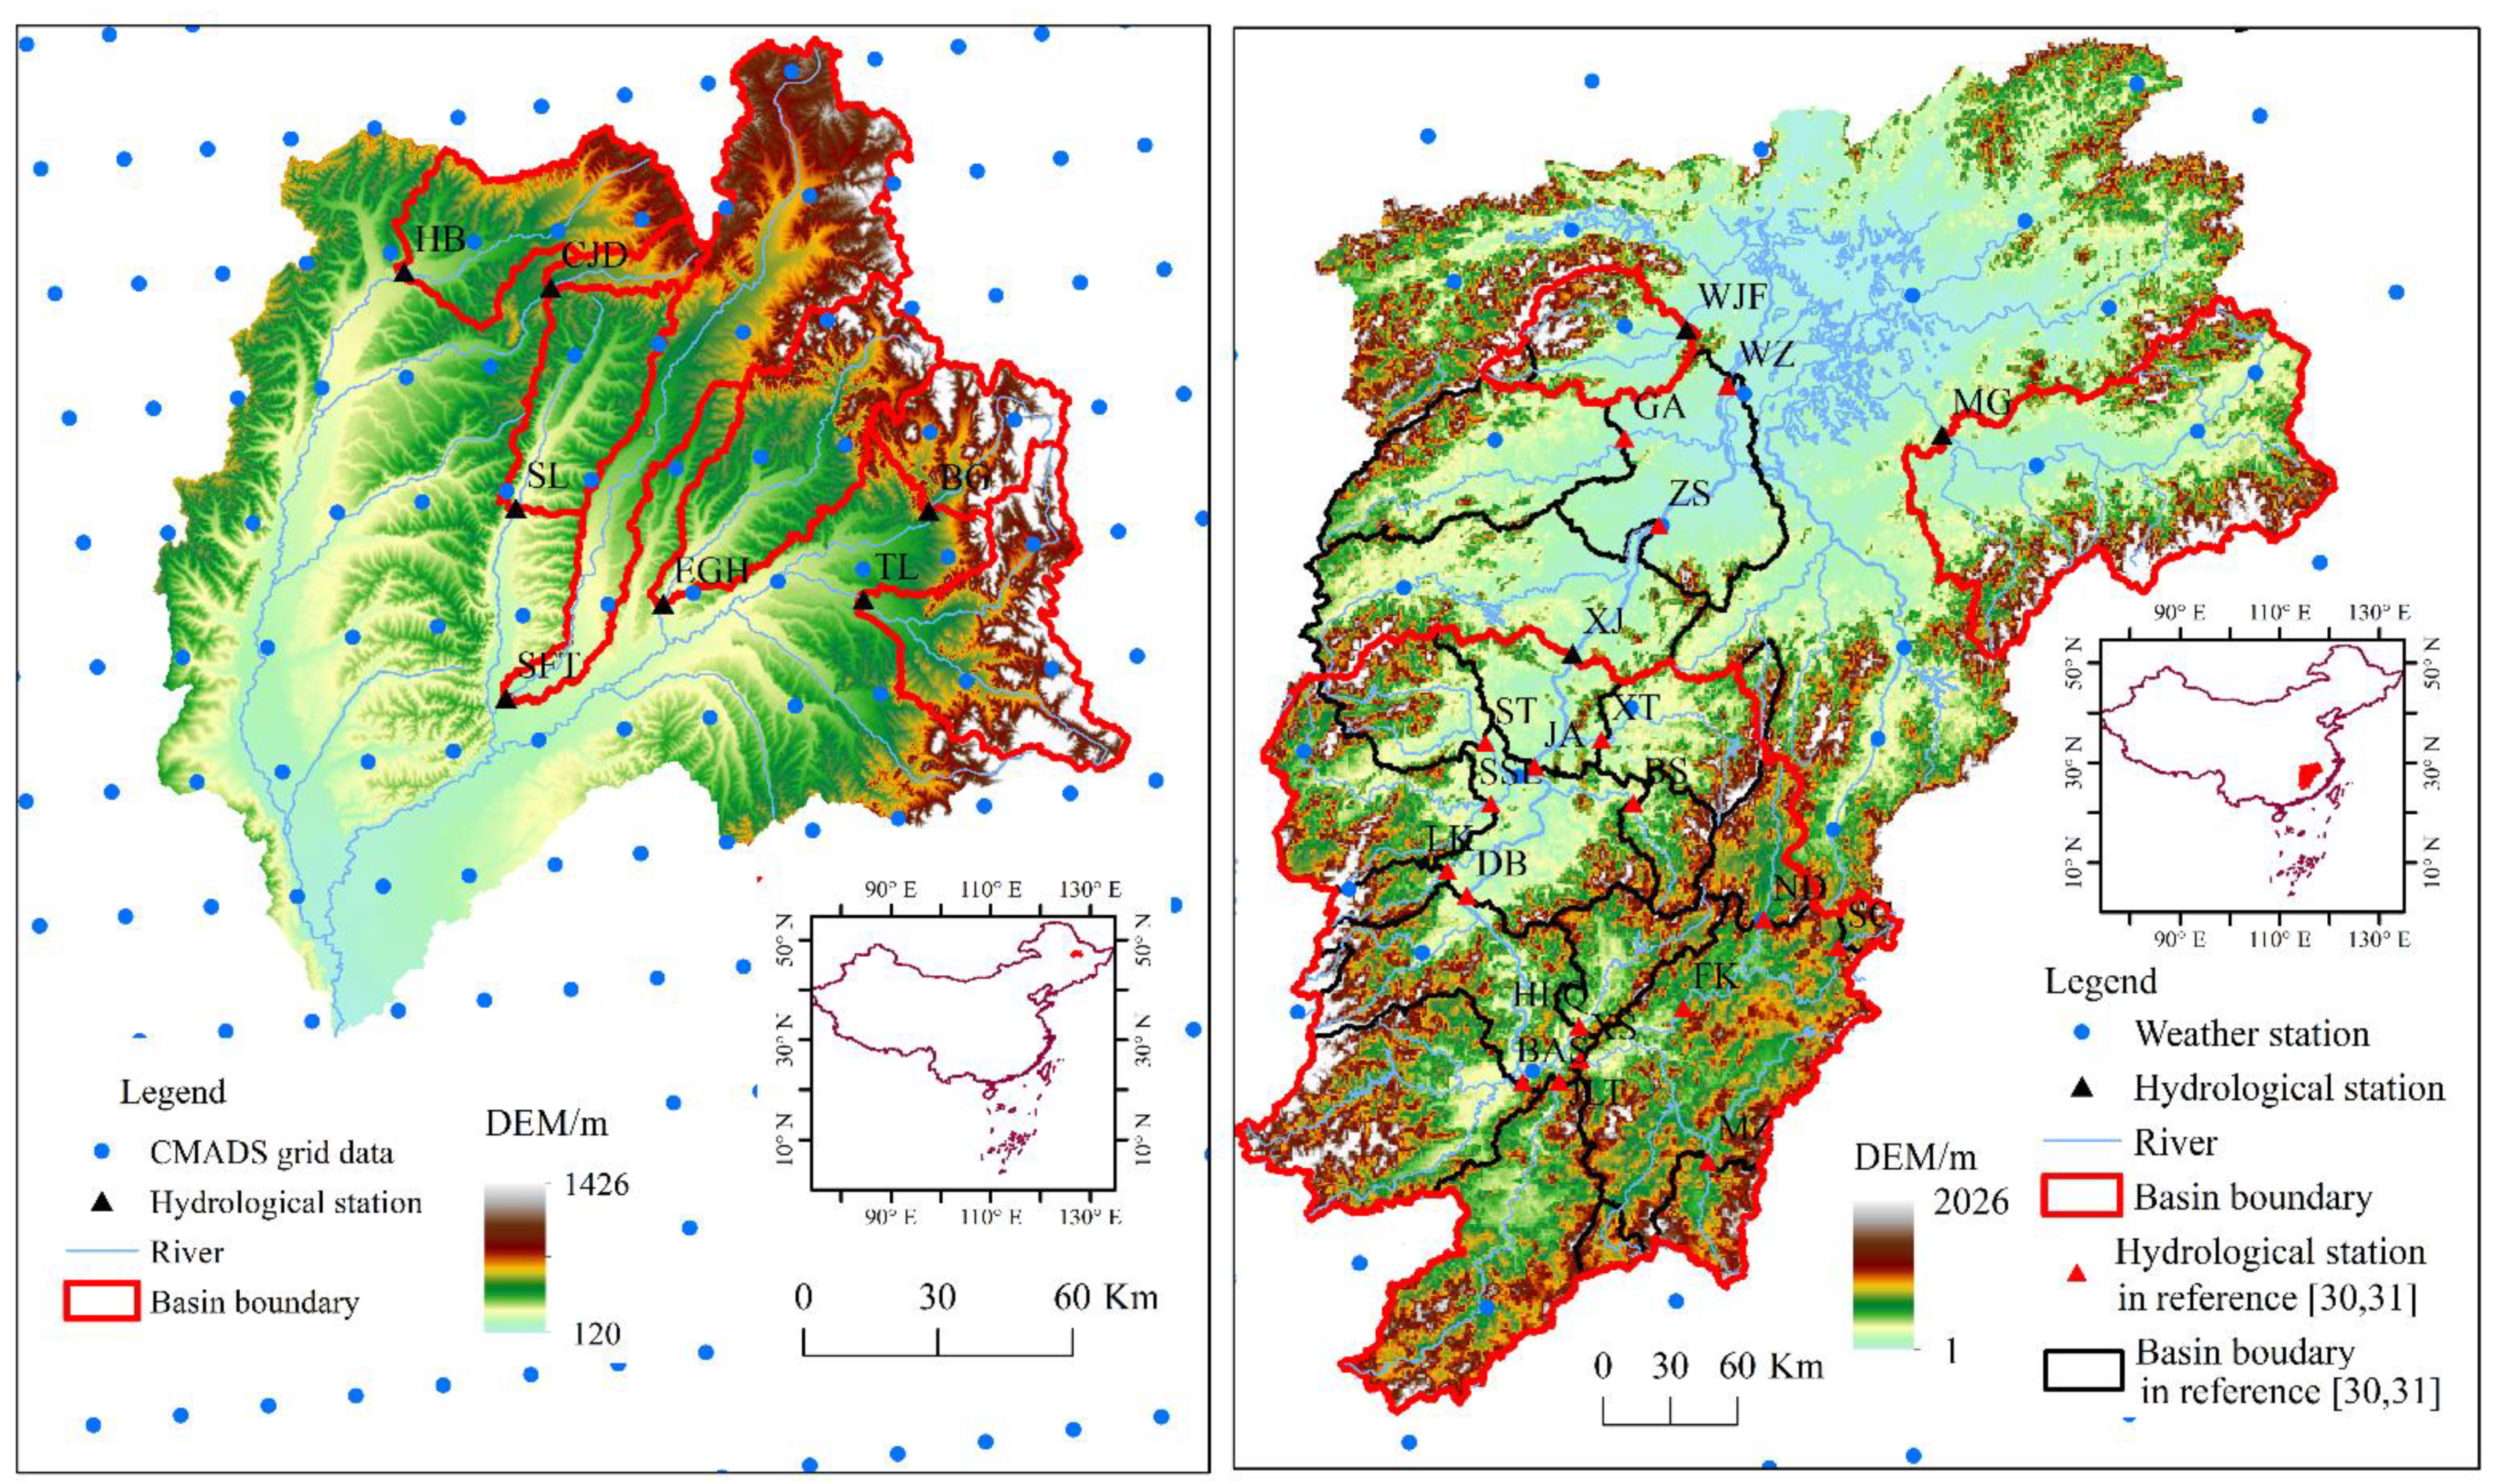
Runoff simulations and predictions in ungauged basins (PUB) are one of the most important and challenging issues in China. In the current research, two basins (Hulan River Basin and Poyang Lake Basin) were applied to assess the applicability of the novel physical hydrological similarity index (HSI). The Hulan River Basin falls in central Heilongjiang Province between 125.90° E and 128.80° E and 46.18° N and 48.13° N and is a primary tributary of the left Songhua River Basin. The total length of the Hulan River is 523 km and the total area of the basin is 35,683 km2. The Lanxi Hydrological Station measures a catchment area of 27,736 km2 (Figure 1, Table 1). Mountainous areas, hills, and plains account for 37%, 22%, and 41% of the total area, respectively. The Hulan River is a fan-shaped branched river system with elevation decreasing from northeast to southwest, ranging between 7 and 1427 m. The Hulan River Basin falls in a temperate continental monsoon climate zone with an average annual temperature of 0–3 °C, with the lowest and highest temperatures occurring in January and July at −21 to −26 °C and 20 to 23 °C, respectively. Precipitation of the year shows an uneven distribution, with an average annual precipitation of 574.7 mm, mainly distributed from June to September, accounting for more than 70% of the yearly total [25].
The Poyang Lake Basin falls in the northern part of Jiangxi Province between 24.49° N and 30.08° N and 113.58° E and 118.48° E and has a total area of 1.622 × 10⁵ km2 (Figure 1, Table 1). The sub-basins of the Poyang Lake Basin include the Xiushui, Raohe, Xinjiang, Fuhe, and Ganjiang river basins. The basin is surrounded by mountains on three sides and plains, hills, and basins are staggered in the central basin. The topography of the Poyang Lake Basin consists of mainly of hills and mountains, accounting for ~78% of the total area. The Poyang Lake basin has a typical subtropical humid monsoon climate, with abundant precipitation, sufficient sunshine, and strong evaporation. The annual average temperature of the Poyang Lake basin is 18 °C whereas average annual precipitation from 1960 to 2012 is 1676 mm. The Poyang Lake Basin shows seasonal precipitation, with the rainy season generally beginning in April and the max precipitation occurring from May to June. Runoff increases rapidly during the rainy season and decreases from July. The Poyang Lake basin begins to enter the dry season from September, which persists until December [26]. The Poyang Lake basin accounts for 9% of the Yangtze River basin area and transports 15.5% of the total water of the Yangtze River. Therefore, the Poyang Lake basin is an important storage lake system of the Yangtze River and plays an important role in regulating climate, controlling soil erosion, regulating floods, degrading pollutants, and maintaining the ecological environment and biodiversity [27].
2.2. Data
Data for daily temperature, precipitation, sunshine hours, wind speed, and air pressure in the Poyang Lake Basin from 1960 to 2010 were obtained from the China Meteorological Data Service Centre (http://data.cma.cn/en, accessed on 6 April 2020). These data underwent quality control and were assessed to be of good quality. Daily meteorological data for the Hulan River Basin extending from 2008 to 2016 were obtained from the China Meteorological Assimilation Driving Dataset [28,29] with a spatial resolution of 0.25° × 0.25°. These data included average temperature, maximum and minimum temperature, precipitation, average solar radiation, average pressure, specific humidity, relative humidity, and average wind speed, all at a daily timestep. Daily runoff data for the Hulan River from 2008 to 2016 were obtained from the Hydrological Yearbook (Table 1). The data for the Xiushui, Xinjiang, and Ganjiang rivers for 1960 to 2010, represented by the Wanjiabu, Meigang, and Xiajiang stations (black triangle in the Figure 1), were obtained from the Hydrological Yearbook. The hydrological model parameters of other stations in the Ganjiang River Basin (red triangle in the Figure 1) were derived from these data [30,31].
The environmental factors affecting the process of runoff generation and convergence were divided into seven categories: (1) climate; (2) vegetation and land use; (3) soil; (4) landform and geology; (5) topography; (6) human activities, and; (7) watershed morphology. Each type of factor includes several environmental factors and a total of 80 climate and underlying surface factors were constructed (Table 2). The climate data comes from China Meteorological Data Service Centre (http://data.cma.cn/en accessed on 8 March 2020) (CMADS). The annual potential evapotranspiration (Evap) was calculated by the FAO-56 Penman-Monteith formula. The aridity index (AI) was calculated by AI = Evap/Pre (annual evapotranspiration/precipitation), and all climate variables were averaged from 2008 to 2016. The vegetation and land use mainly includes three categories: vegetation index, such as LAI, NDVI, and vegetation coverage (FVC); land use, such as proportion of farmland (Farml), proportion of forest (Forestl), proportion of grassland, etc.; the proportion of different types of forest and grassland. The year of vegetation and land use is 2015 and can be downloaded from Resource and Environment Science and Data Center (http://www.resdc.cn accessed on 8 March 2020). Soil factors mainly include mechanical composition (sand, silt, and clay), the proportion of each soil type, and the proportion of soil available water content and soil reference depth. Among them, the soil mechanical composition and soil type data come from the Resource and Environment Science and Data Center, and the soil available water content and soil reference depth are available from the world Soil database (HWSD). Landform and geology mainly include landforms (the proportion of plains, tableland, hills, and mountains) and the proportion of geological coverage types (sedimentary rocks, volcanic rocks, etc.). The landform data comes from Resource and Environment Science and Data Center, and the geological data comes from the world lithology map (https://ccgm.org accessed on 12 March 2020). The terrain characteristics include watershed elevation, aspect, slope, topographic index, and wetness index, which are calculated from 90 m DEM data. Human activities mainly include rasterized population, GDP, night light intensity of DMSP/OLS sensor in 2015; similarly, the above data also comes from Resource and Environment Science and Data Center. Watershed morphology includes description parameters of basin boundary and river morphology, and all the indices can be calculated by ArcGIS. Additionally, standard deviation of an index is the standard deviation of all grid values in the basin. Detailed information on these indices can be found in [32].
2.3. Methods
2.3.1. GR Hydrological Model
The Génie Rural Journalier model (GR) model is a conceptual rainfall-runoff model which has been verified for different climatic conditions around the world and is widely used in flood forecasting and water resources planning [33]. There are three categories of GR model according to the number of model parameters, with the GR4J, GR5J, and GR6J models requiring 4, 5, and 6 parameters, respectively. The GR model can be coupled with the Cema-Neige snow module proposed by Valéry et al. [34], thereby greatly expanding the scope of its application. The input data requirements of the model are relatively simple and include daily precipitation, daily potential evapotranspiration, daily runoff, watershed area, and elevation. These simple data requirements can ensure the efficiency of leave-one-out cross-validation in the regionalization of areas lacking data. The present study applied the GR4J and CemaNeigeGR4J models to the Poyang River Basin and Hulan River Basin, respectively. Daily potential evapotranspiration was calculated using the Food and Agriculture Organization (FAO)-56 Penman-Monteith formula. The slight differences in the length of data at each hydrological station required the first year of data to be used for the model warm-up period, 2/3 of the subsequent data to be used for calibration, and the last 1/3 of data used for verification. The four parameters of the GR4J model are production store capacity (PSC; mm), inter-catchment exchange coefficient (IEC; unit mm d−1), routing store capacity (RSC; mm), and unit hydrograph time constant (UHT, unit d). In addition to the four parameters of the GR4J model, the CemaNeigeGR4J model includes the weighting coefficient for snowpack thermal state (STC) and the degree-day melt coefficient (DMC, mm/°C/d). The global optimization algorithm based on differential evolution was used to calibrate the parameters of the GR4J model by maximizing the Nash efficiency coefficient (NSE). For the specific calculation process, refer to [35].
2.3.2. Parameter Regionalization
The applicability of different regionalization methods remains under discussion and development. The present study chose physical similarity and spatial proximity approaches since these approaches have better outcomes for parameter transfer compared to other methods. The ungauged basin was determined by the leave-one-out method, i.e., given N basins, one of the gauged basins was set as the ungauged basin and the remaining N-1 basins were set as the gauged basins for cross-validation.
According to the first law of geography, the watersheds of close proximity have hydrological characteristics that are more similar than those further away. Spatial similarity is expressed by the Euclidean distance Dtd:
In Equation (1), (xt, yt) and (xd, yd) represent centroid coordinates of the target basin and reference basin, respectively.
Under the physical similarity approach, a gauged basin with similar physical characteristics to the ungauged watershed is set as the reference watershed and the model parameters of the reference basin are transferred to ungauged basin. Similar hydrological basins should have similar watershed characteristics. Therefore, determining the main climatic and underlying surface characteristics affecting hydrological response becomes the key to the transfer of parameters from gauged basins to ungauged basin. However, most previous studies on the relationship between hydrological model parameter and the environmental factors focused on limited climate and underlying surface factors, leading to certain limitations in the results [27]. The factors controlling hydrological processes include climate, topography, geology, soil, and land cover. The analysis of many environmental factors is needed to fully understand their inter-dependent impacts on runoff generation and confluence processes. However, this can lead to multicollinearity between basin attributes, since factors such as aridity index (AI), precipitation, and Normalized Difference Vegetation Index (NDVI) are highly correlated. Therefore, dimensionality reduction methods can be used to reduce the number of variables while retaining most of the attribute information. Principal component analysis (PCA) is the most used method of reducing linear dimensionality; PCA maps n-dimensional features to k-dimensions. This k-dimensional feature is a new orthogonal feature, also called the principal component, is reconstructed based on the original n-dimensional feature. PCA can transform many related variables into a set of fewer unrelated variables. The number of principal components is determined by scree plot and parallel analysis.
The physical similarity index is referred to Burn and Boorman [36], Kay et al. [37], and He et al. [38], and finally constructed in the present study was as follows:
In Equation (2), PCAa,i and PCAb,i denote the i-th (i = 1, 2, …, 7) principal component loadings of basins a and b, respectively and βi is the principal component weight of the i-th hydrological feature, which is determined by the entropy method to avoid the subjectivity resulting from artificial assignment. A high HSI indicates a higher degree of hydrological similarity between basin a and b.
2.3.3. Correlation and Regression Analysis
Correlation analysis is used to analyze the relationship between climate and underlying surface factors and the relationship between simulation efficiency and climate and underlying surface factors. On this basis, regression analysis was used to clarify the relationship between hydrological similarity and parameter transfer efficiency.
3. Results
3.1. Hydrological Changes in the Hulan River Basin and Poyang Lake Basin
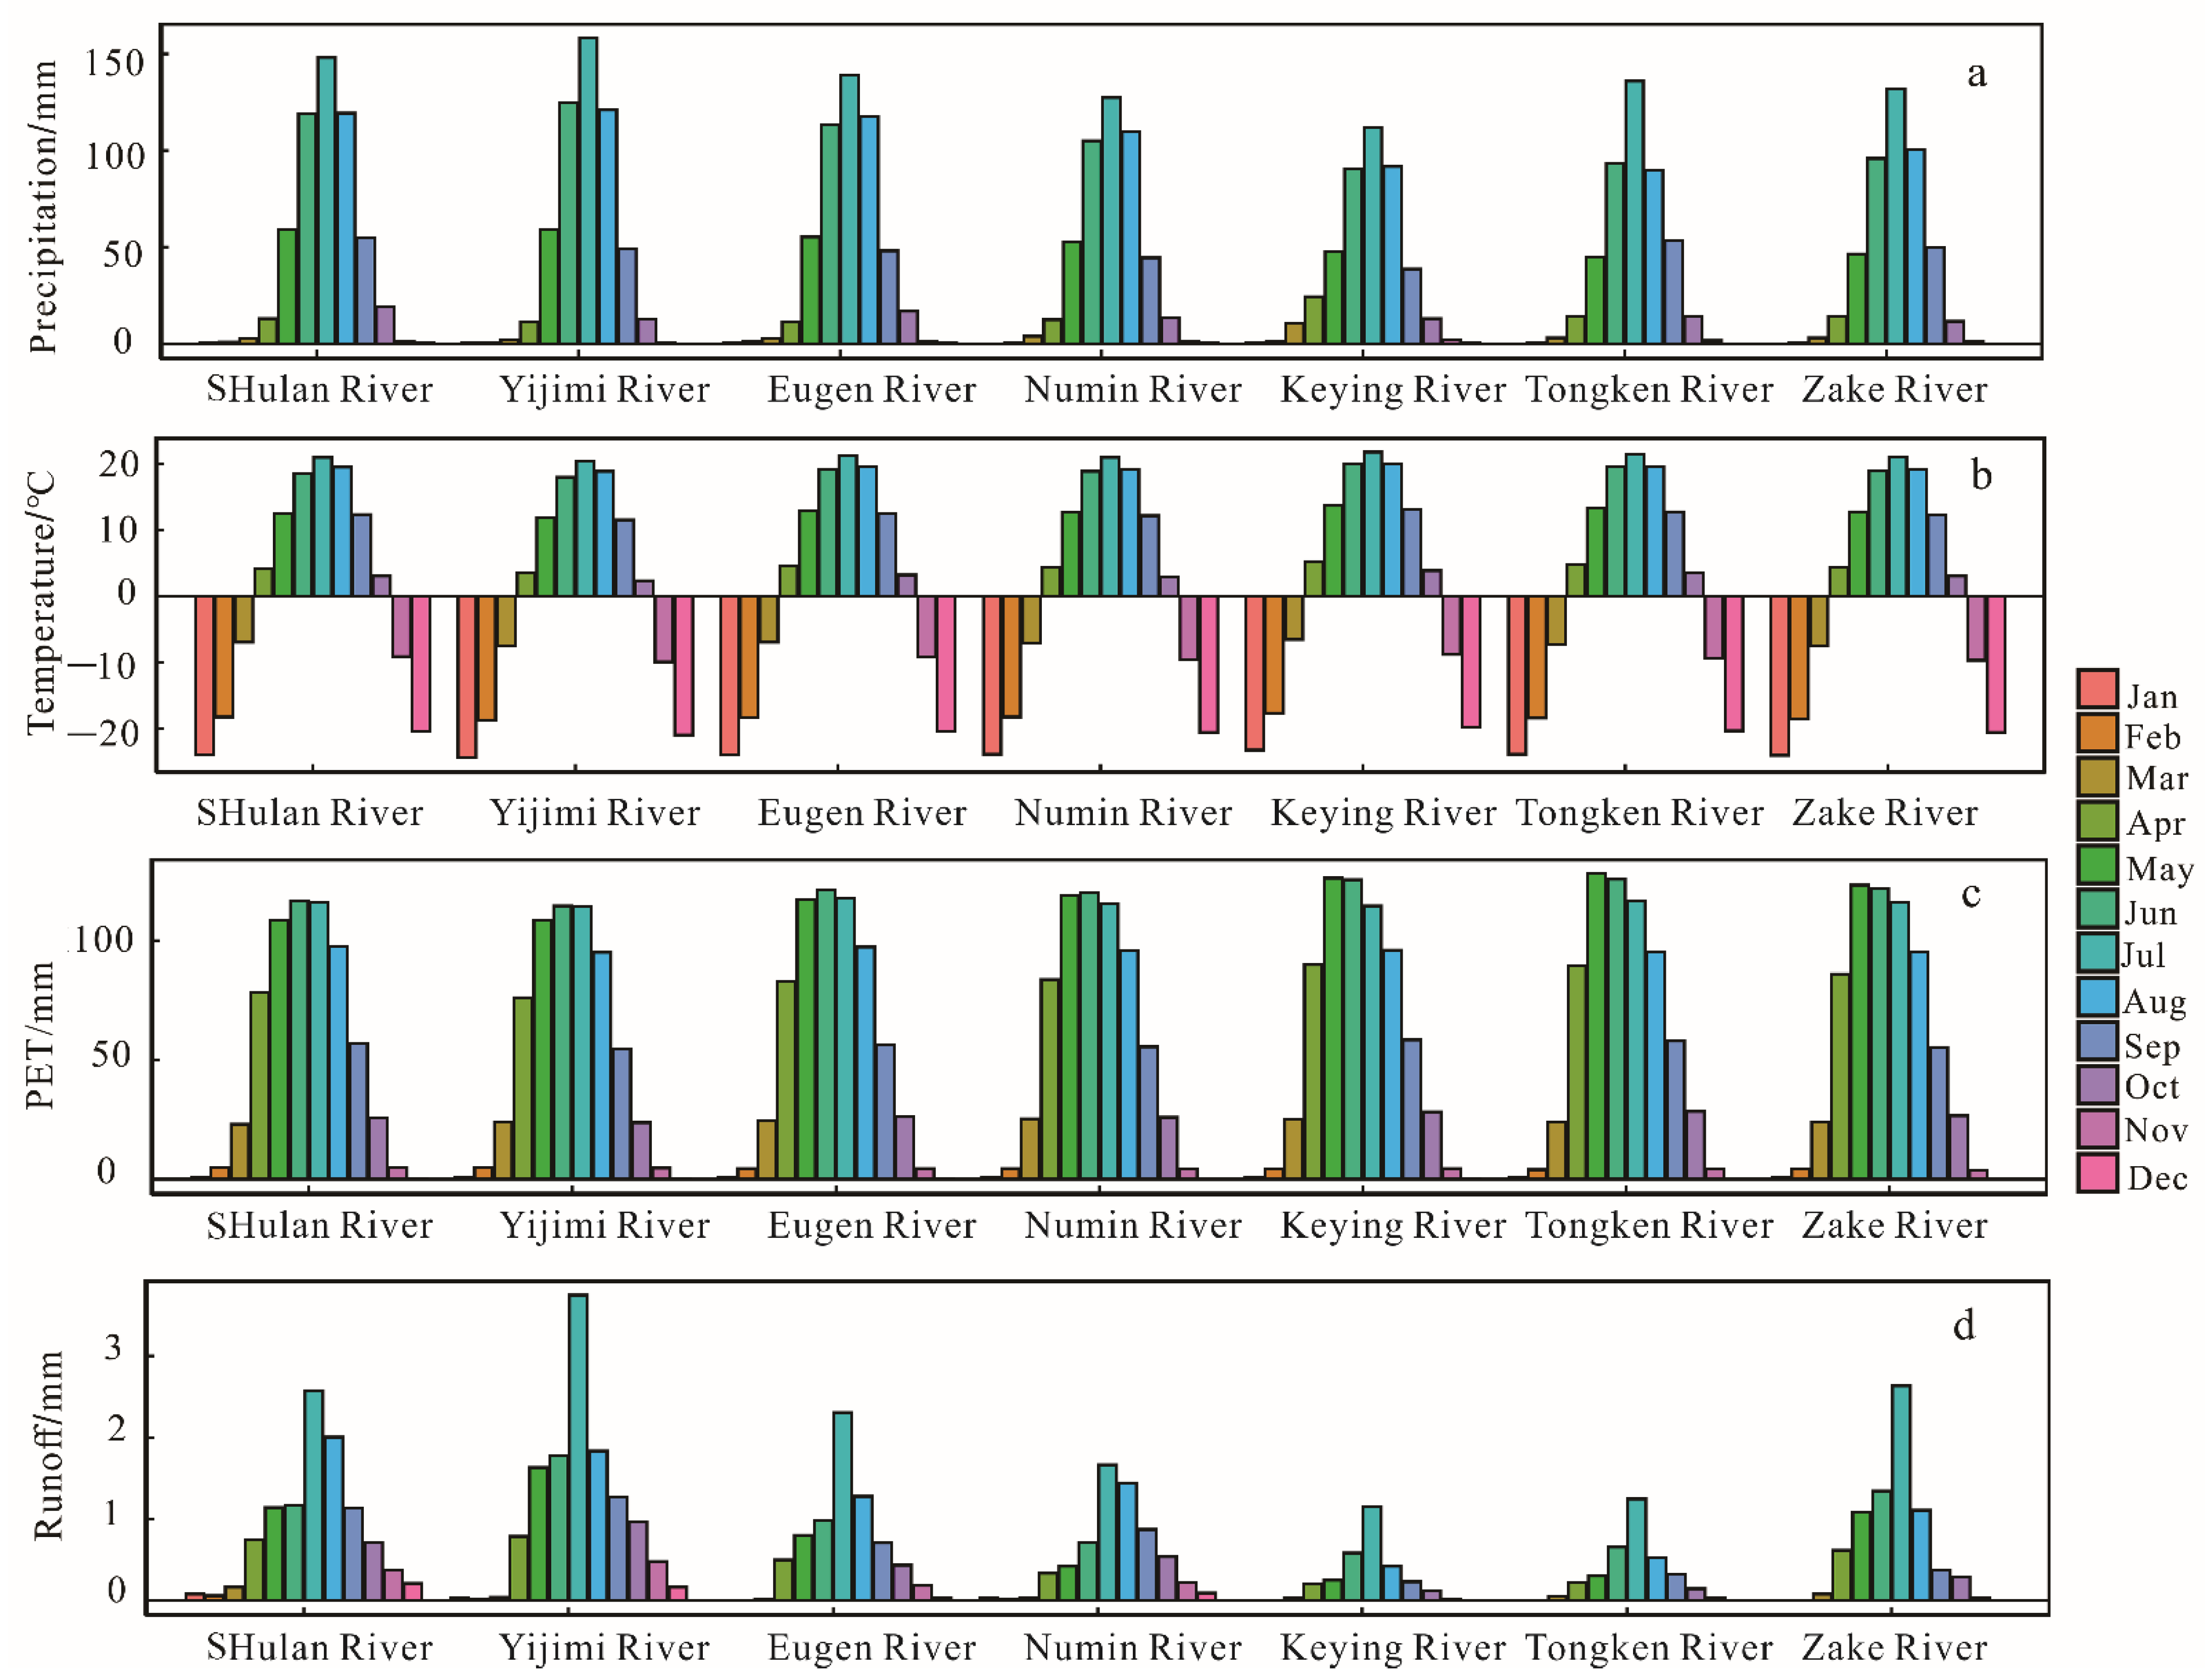
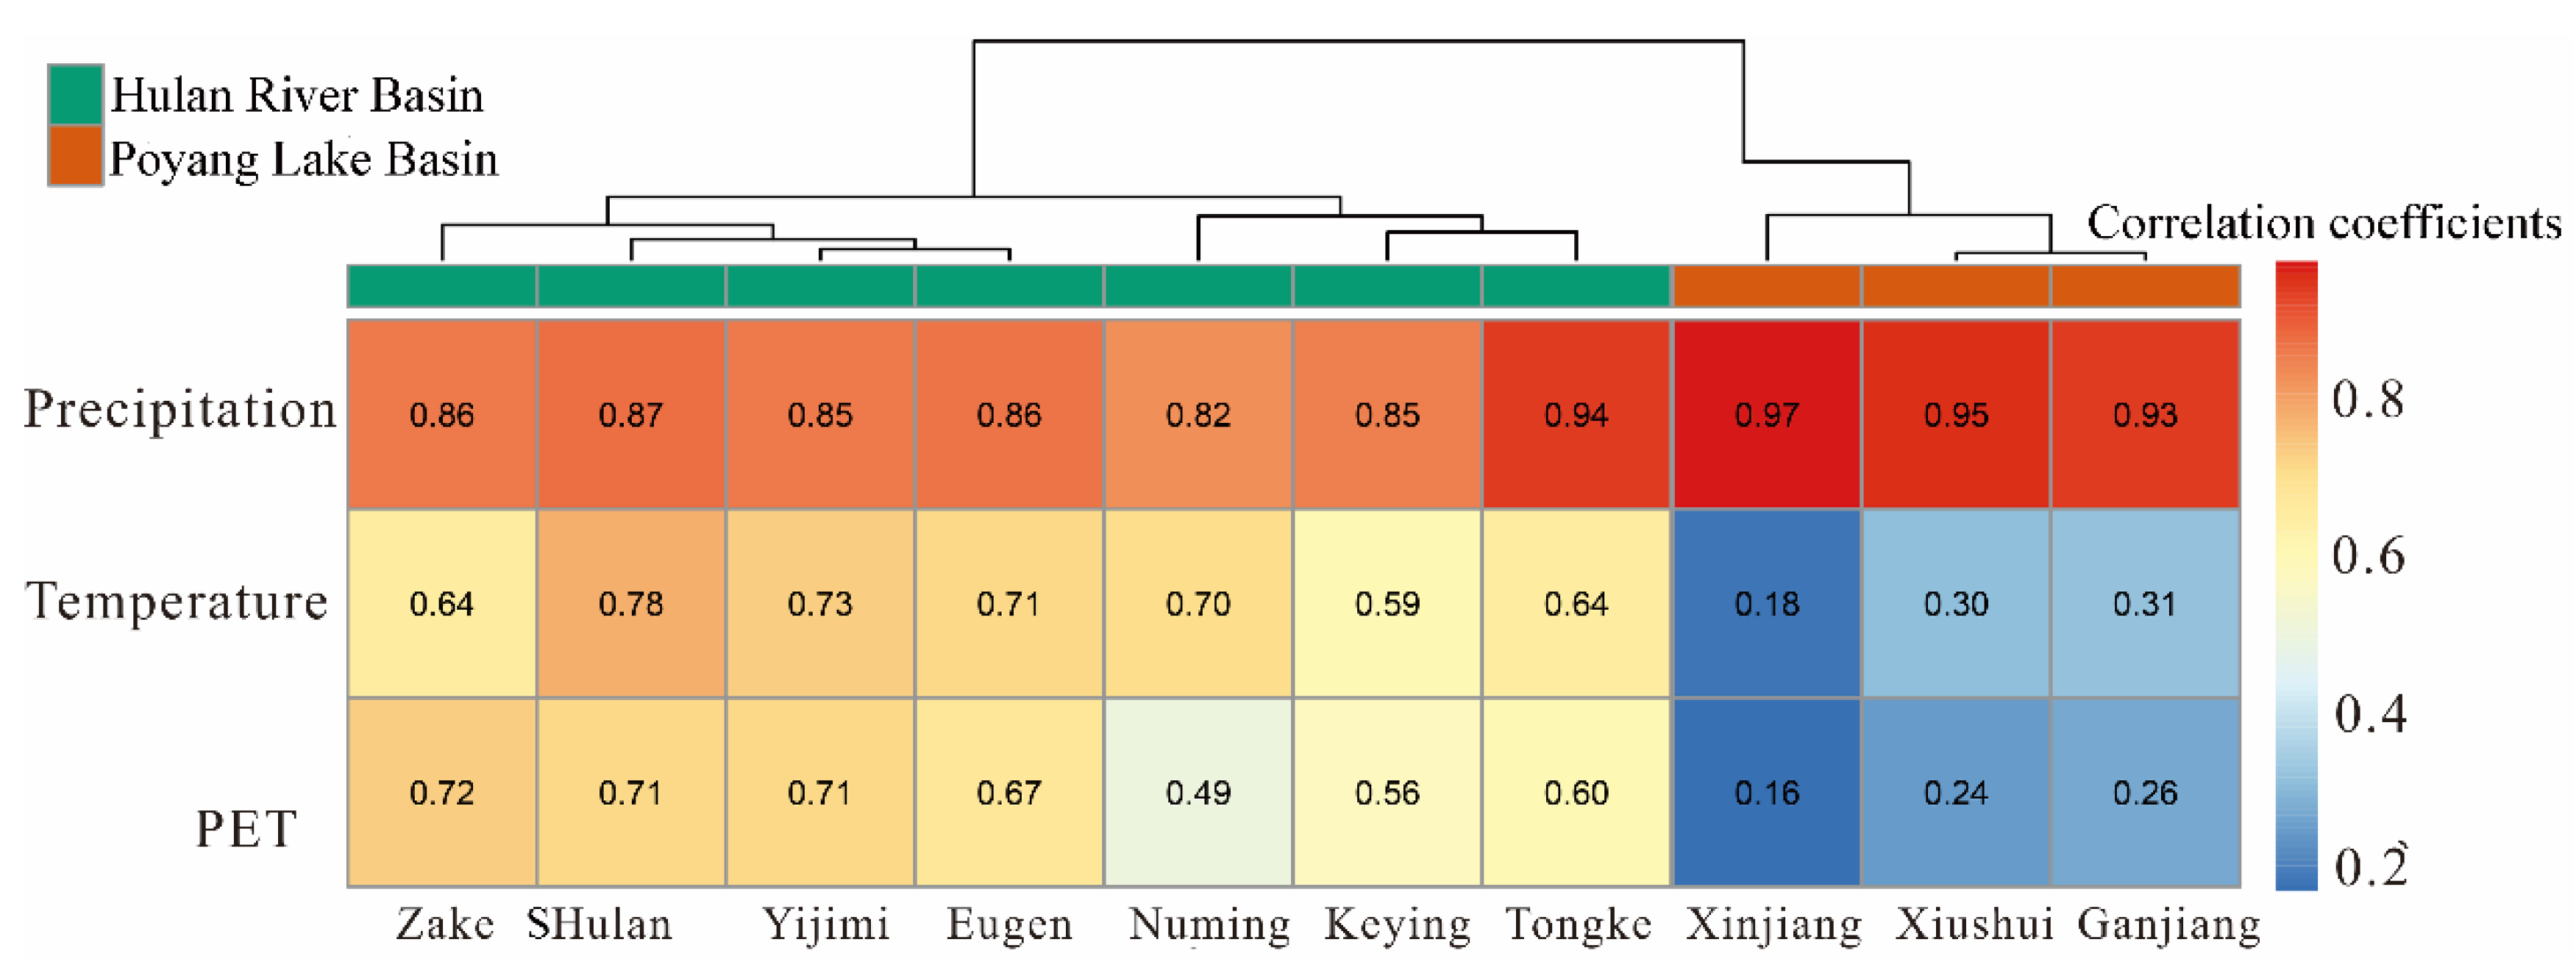
The average precipitation in the Hulan River Basin ranges from 620 mm to 674 mm. The Keyin River and Tongken River have the largest annual precipitation, both exceeding 700 mm, whereas the Yijimi River has the least precipitation at only 620 mm. Potential evapotranspiration was significantly negatively correlated with precipitation. The Keyin River and Tongken River had the lowest potential evapotranspiration at 432 mm and 450 mm, respectively. The potential evaporation (PE) of the Small Hulan River (SHulan River), Yijimi River, and Eugen River all exceeded 506 mm. Temperature and precipitation were roughly positively correlated. The Keyin River had the highest average annual temperature of 1.8 °C, which may be related to a lower altitude (Figure 2 and Figure 3). The Yijimi River had the lowest annual average temperature of 0.42 °C, which may be related to higher altitudes in most areas. The Yijimi River had the maximum flow of 1.06 mm d−1, whereas the Keyin and Tongken rivers had the lowest flow at 0.25 mm d−1 and 0.29 mm d−1, respectively. A significant positive correlation existed between runoff and precipitation, with the correlation coefficients for this relationship of all basins exceeding 0.82 (Figure 3). The period of May to September experiences relatively concentrated precipitation and excessive runoff (Figure 2). This result indicates that precipitation is the main source of runoff in the Hulan River Basin. The monthly distributions of runoff for all sub-basins of the Hulan River Basin in general showed a “single peak” (Figure 2). Runoff was relatively low from January to March. Temperature increased from below zero to above zero from April until July and August, coinciding with ice and snow melt, an increase in precipitation, and an increase in the river water level. Subsequent to the runoff, temperature continued to drop, precipitation dropped sharply, and river runoff returned to a low value (Figure 2). The spatial distribution of correlation coefficients (Figure 3) showed a significant positive correlation between temperature and runoff, indicating that snowmelt as well as rainfall acts to recharge runoff in the Hulan River Basin.
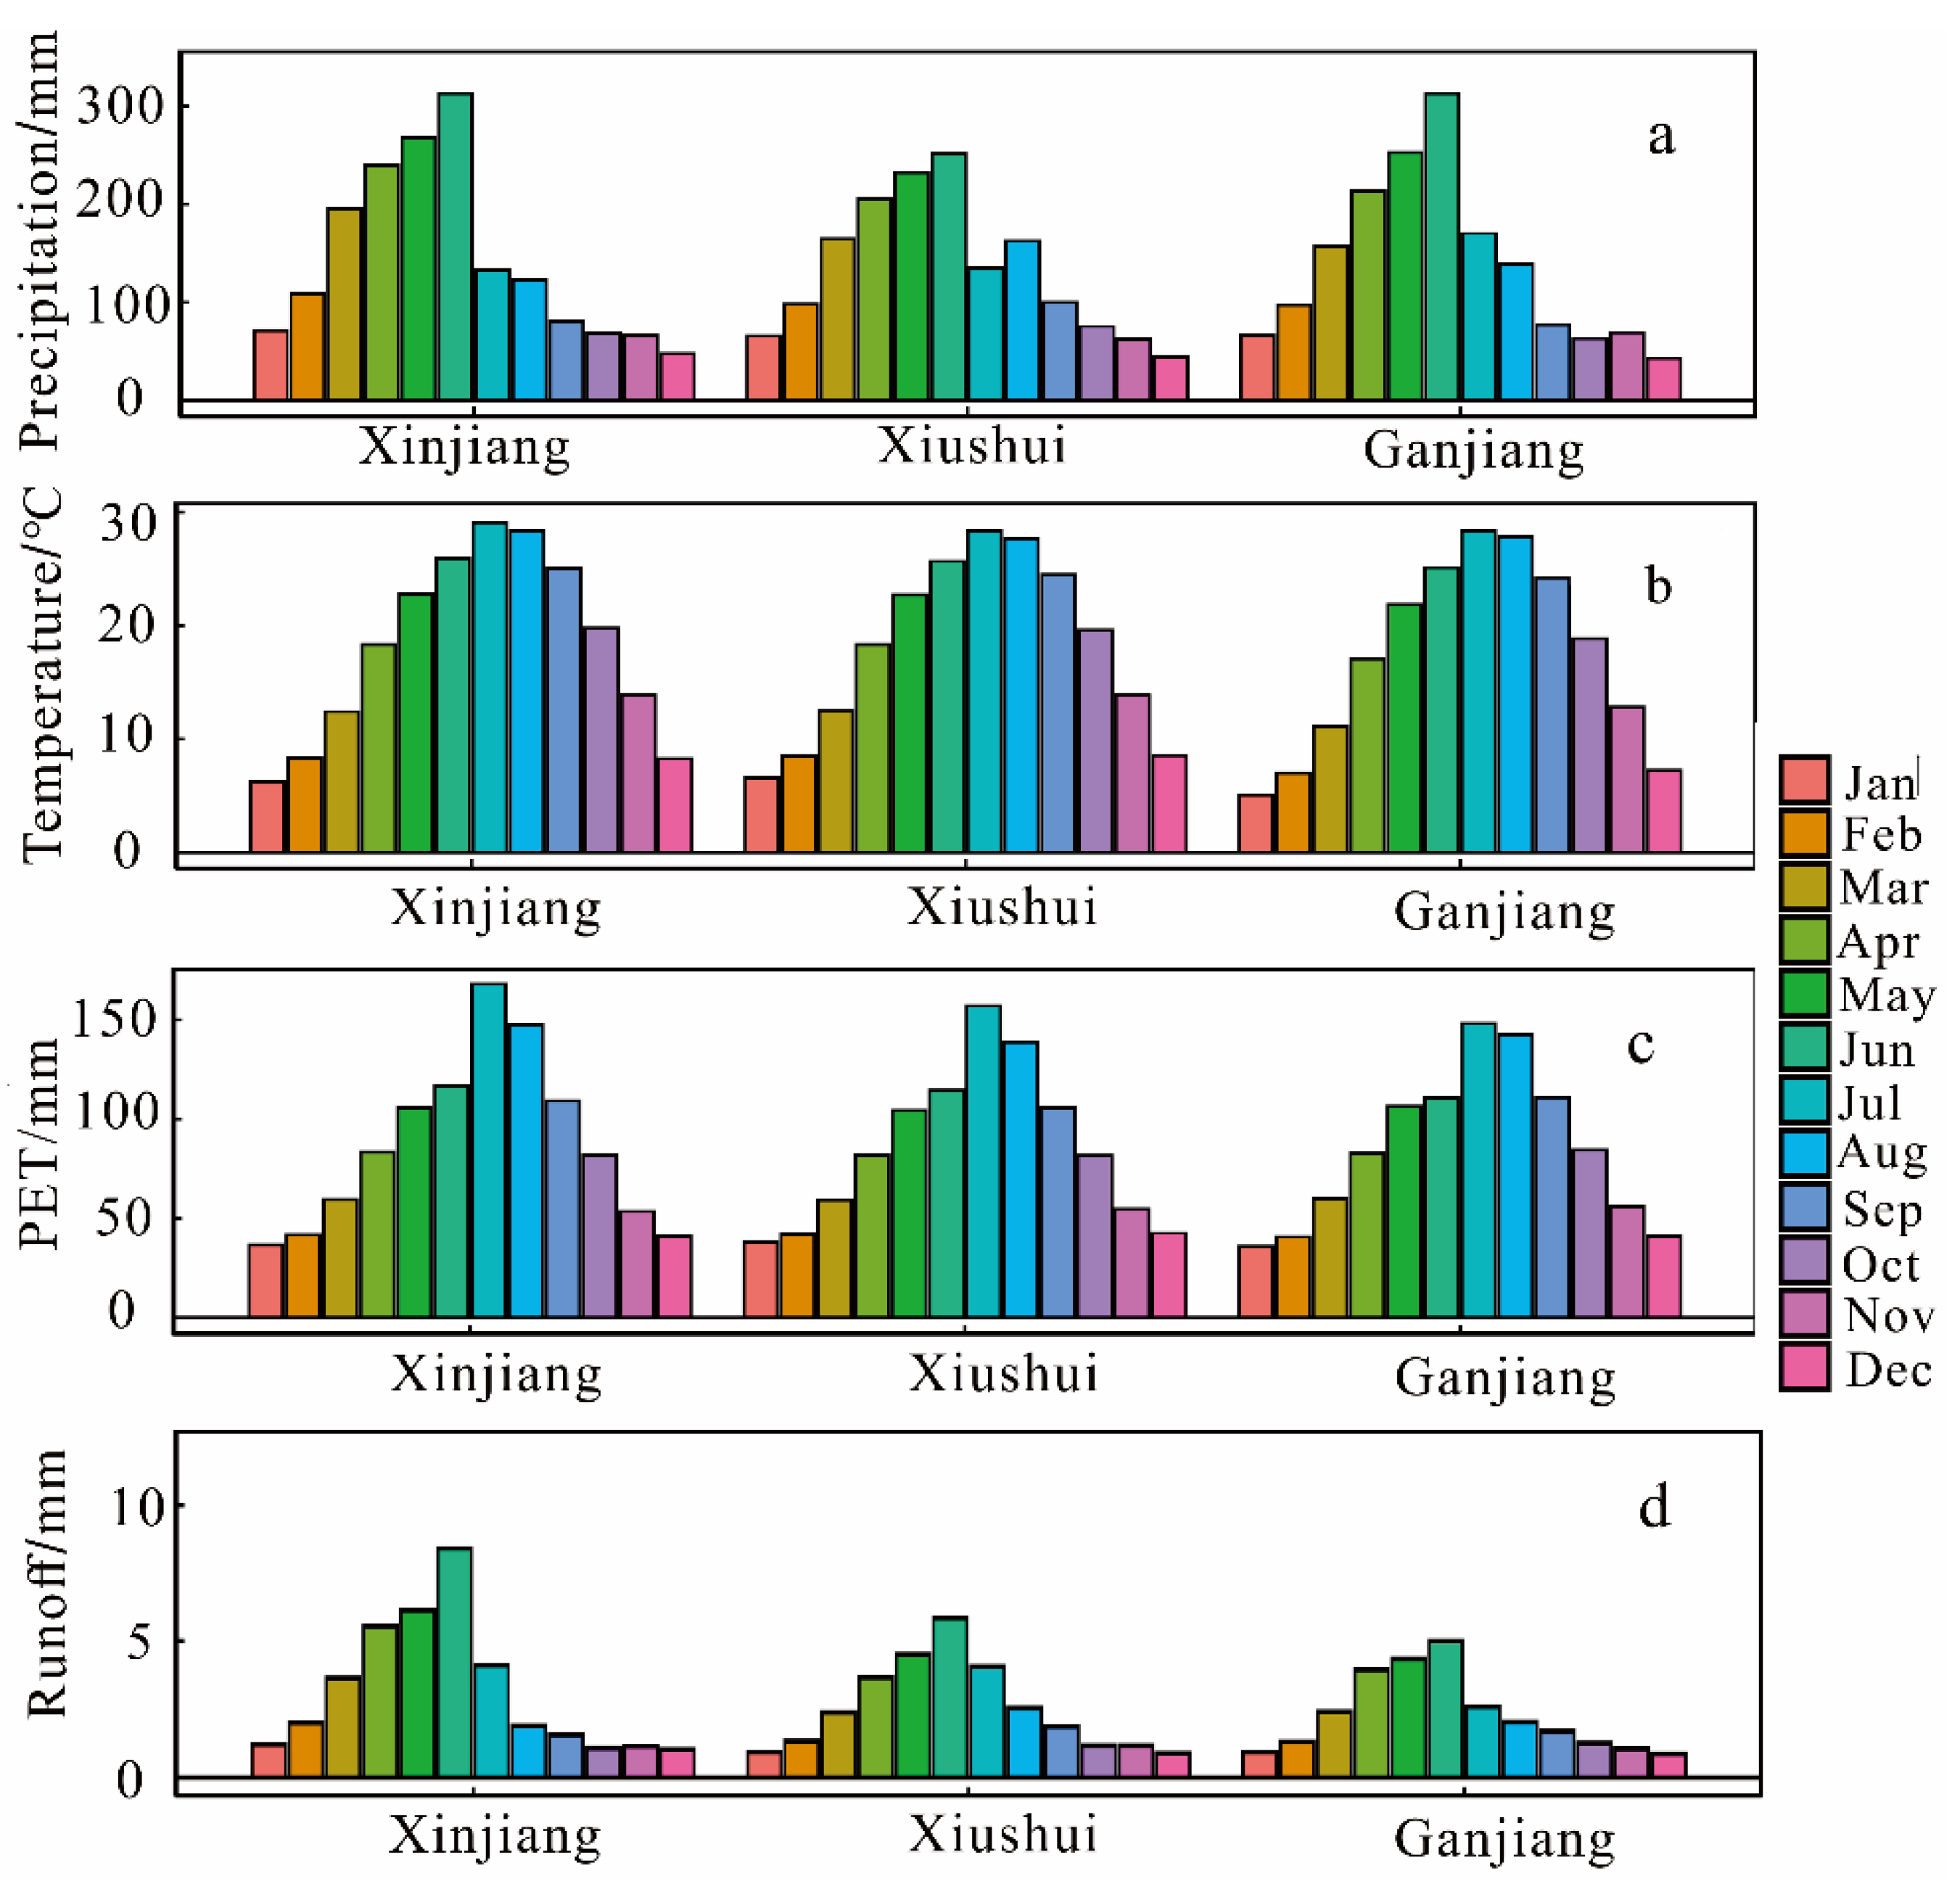
The Xinjiang River sub-basin had the largest annual average precipitation among the three sub-basins of Poyang Lake at 1808 mm, whereas those of the Xiushui and Ganjiang river basins were 1660 mm and 1596 mm, respectively. Potential evapotranspiration between the Xiushui River and the Ganjiang River was close to 1020 mm, whereas the Xinjiang River sub-basin had the largest PE at 1050 mm. The temperatures of the Ganjiang and Xinjiang river sub-basins were close at 18 °C, whereas that of the Xiushui River basin was 17.2 °C due to its relatively high altitude. As for precipitation, the Xinjiang River sub-basin had the largest runoff at 3.14 mm d−1, whereas the Ganjiang River had the runoff at 2.28 mm d−1. Monthly changes in precipitation and runoff were synchronized. Precipitation and runoff gradually increased from January to June, whereas they simultaneously decreased from August to December (Figure 4). Although the correlation coefficient between precipitation and runoff exceeded 0.9, there were significant relationships between runoff and the other climate variables (Figure 3). This result indicated that among the climate factors, changes to precipitation had the largest effect on runoff in the Poyang Lake Basin.
3.2. Hydrological Simulation Using the GR Model
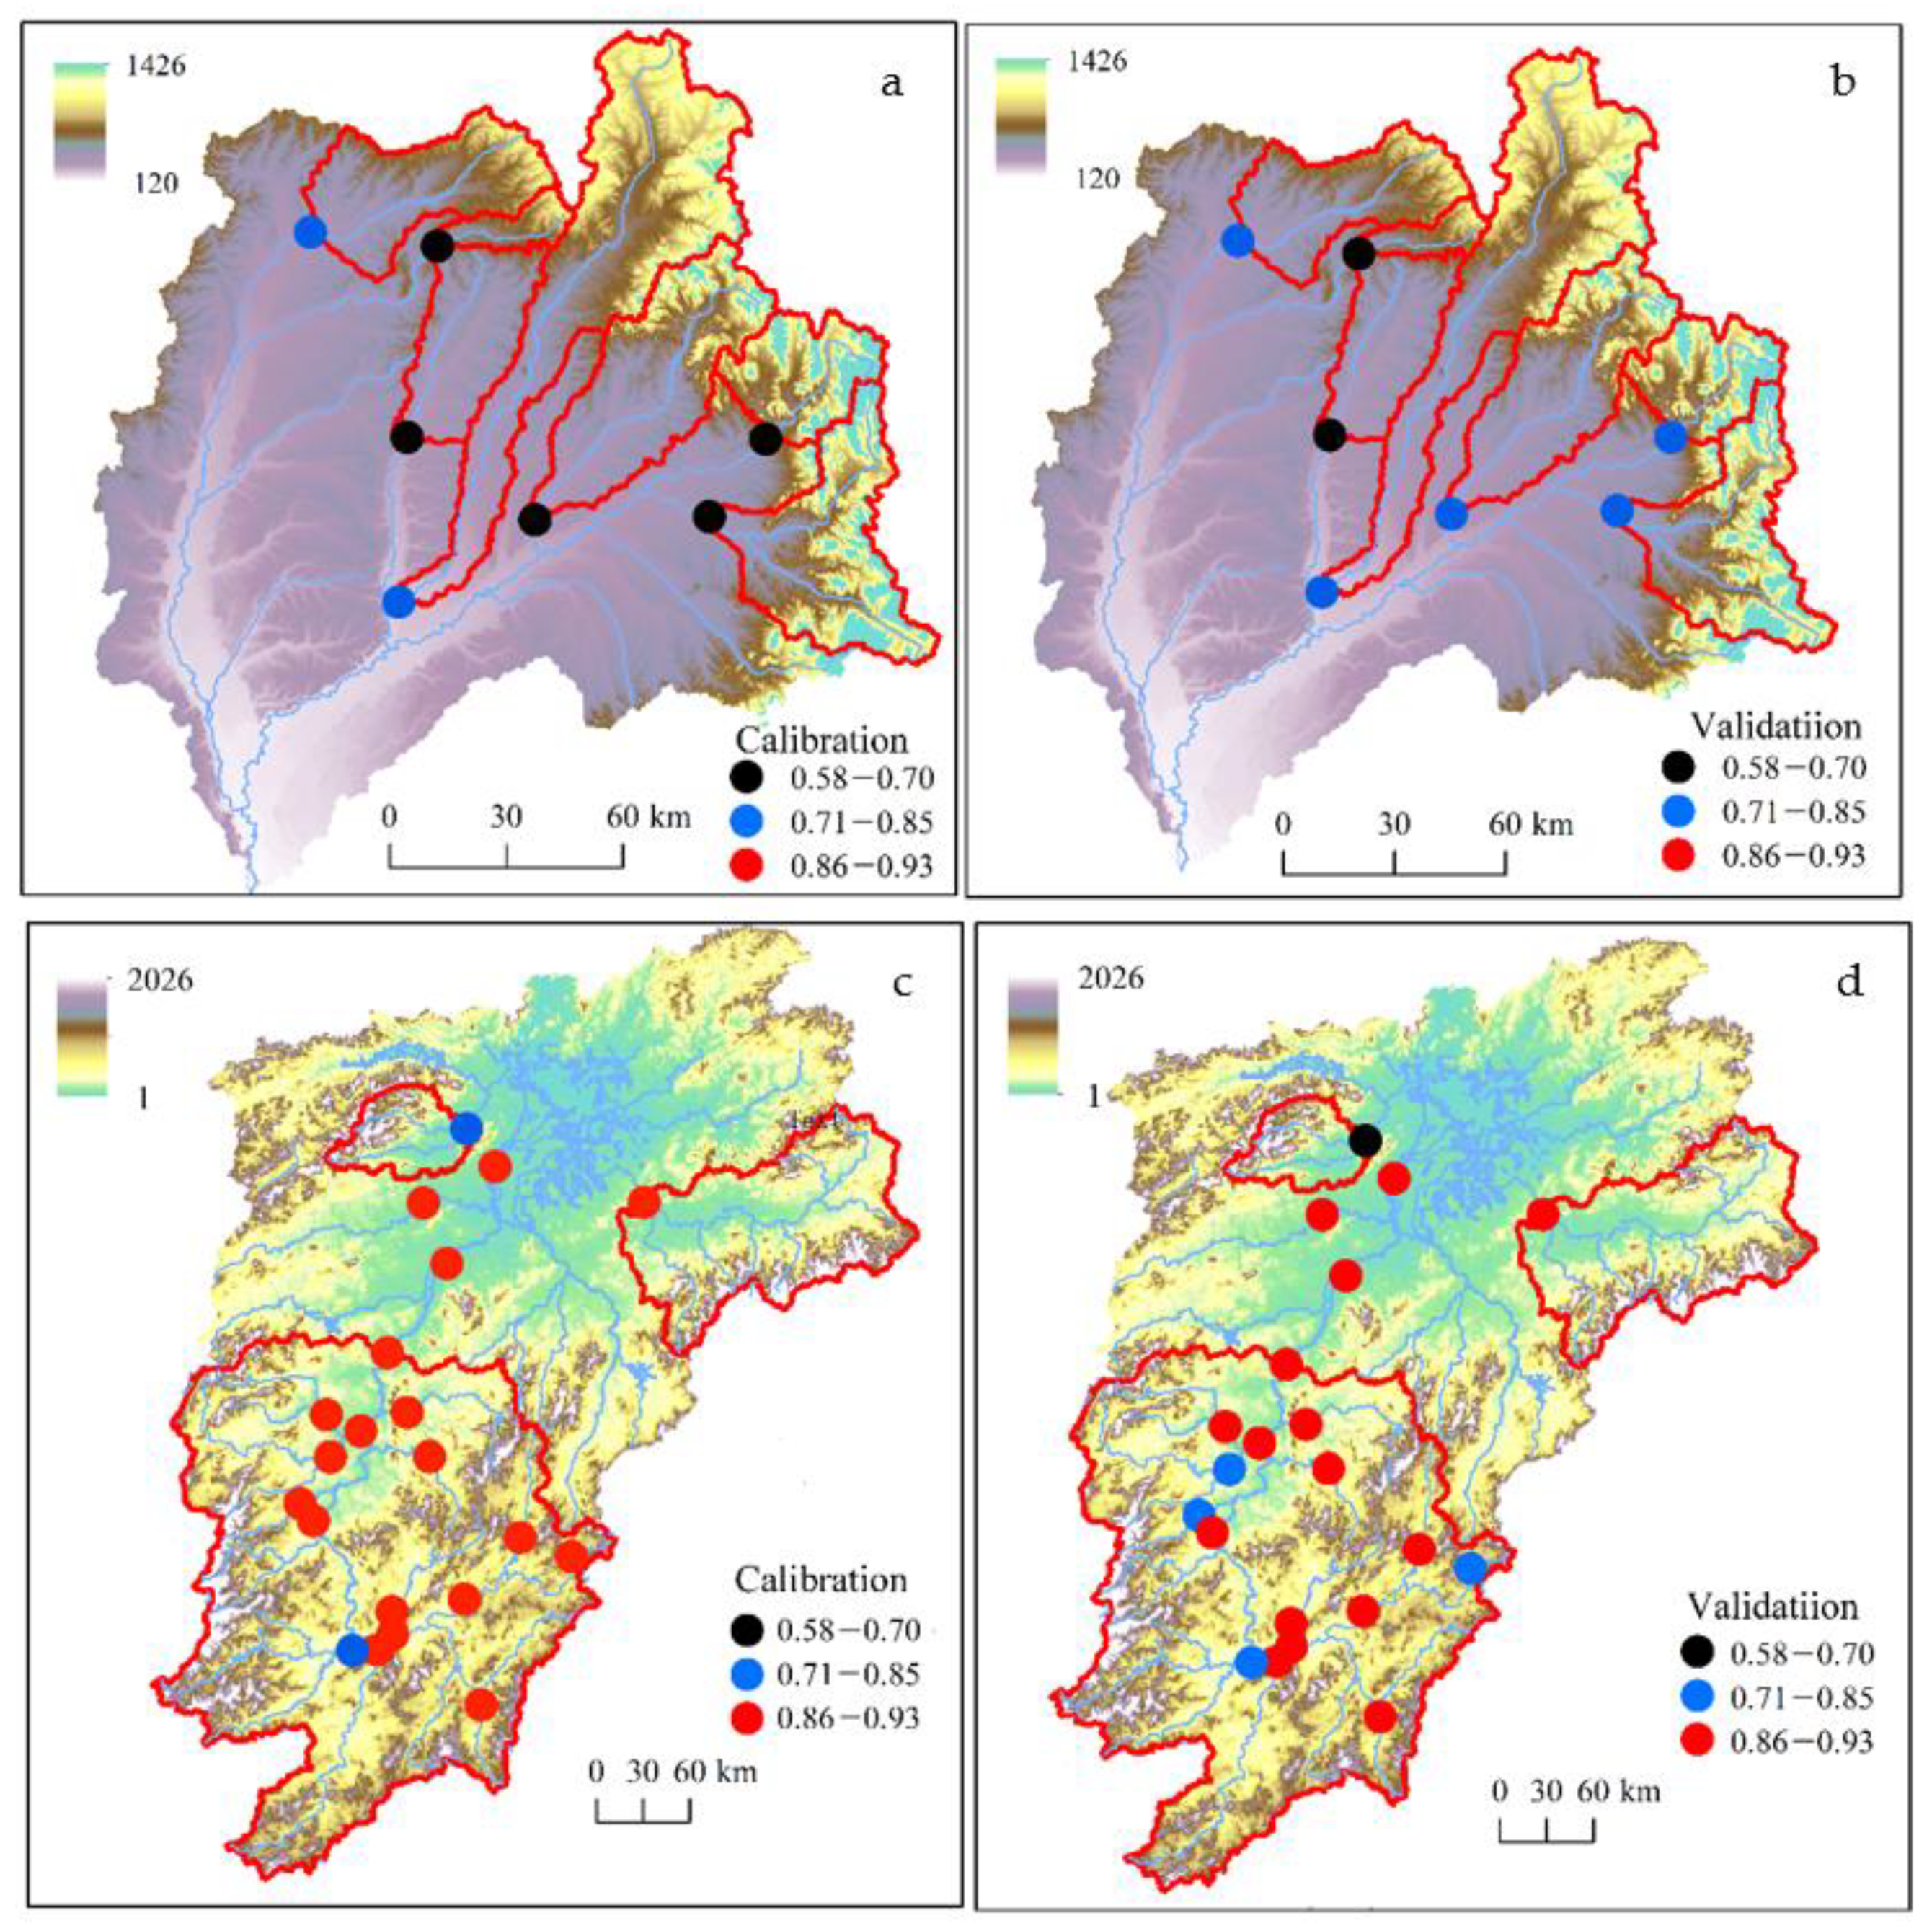
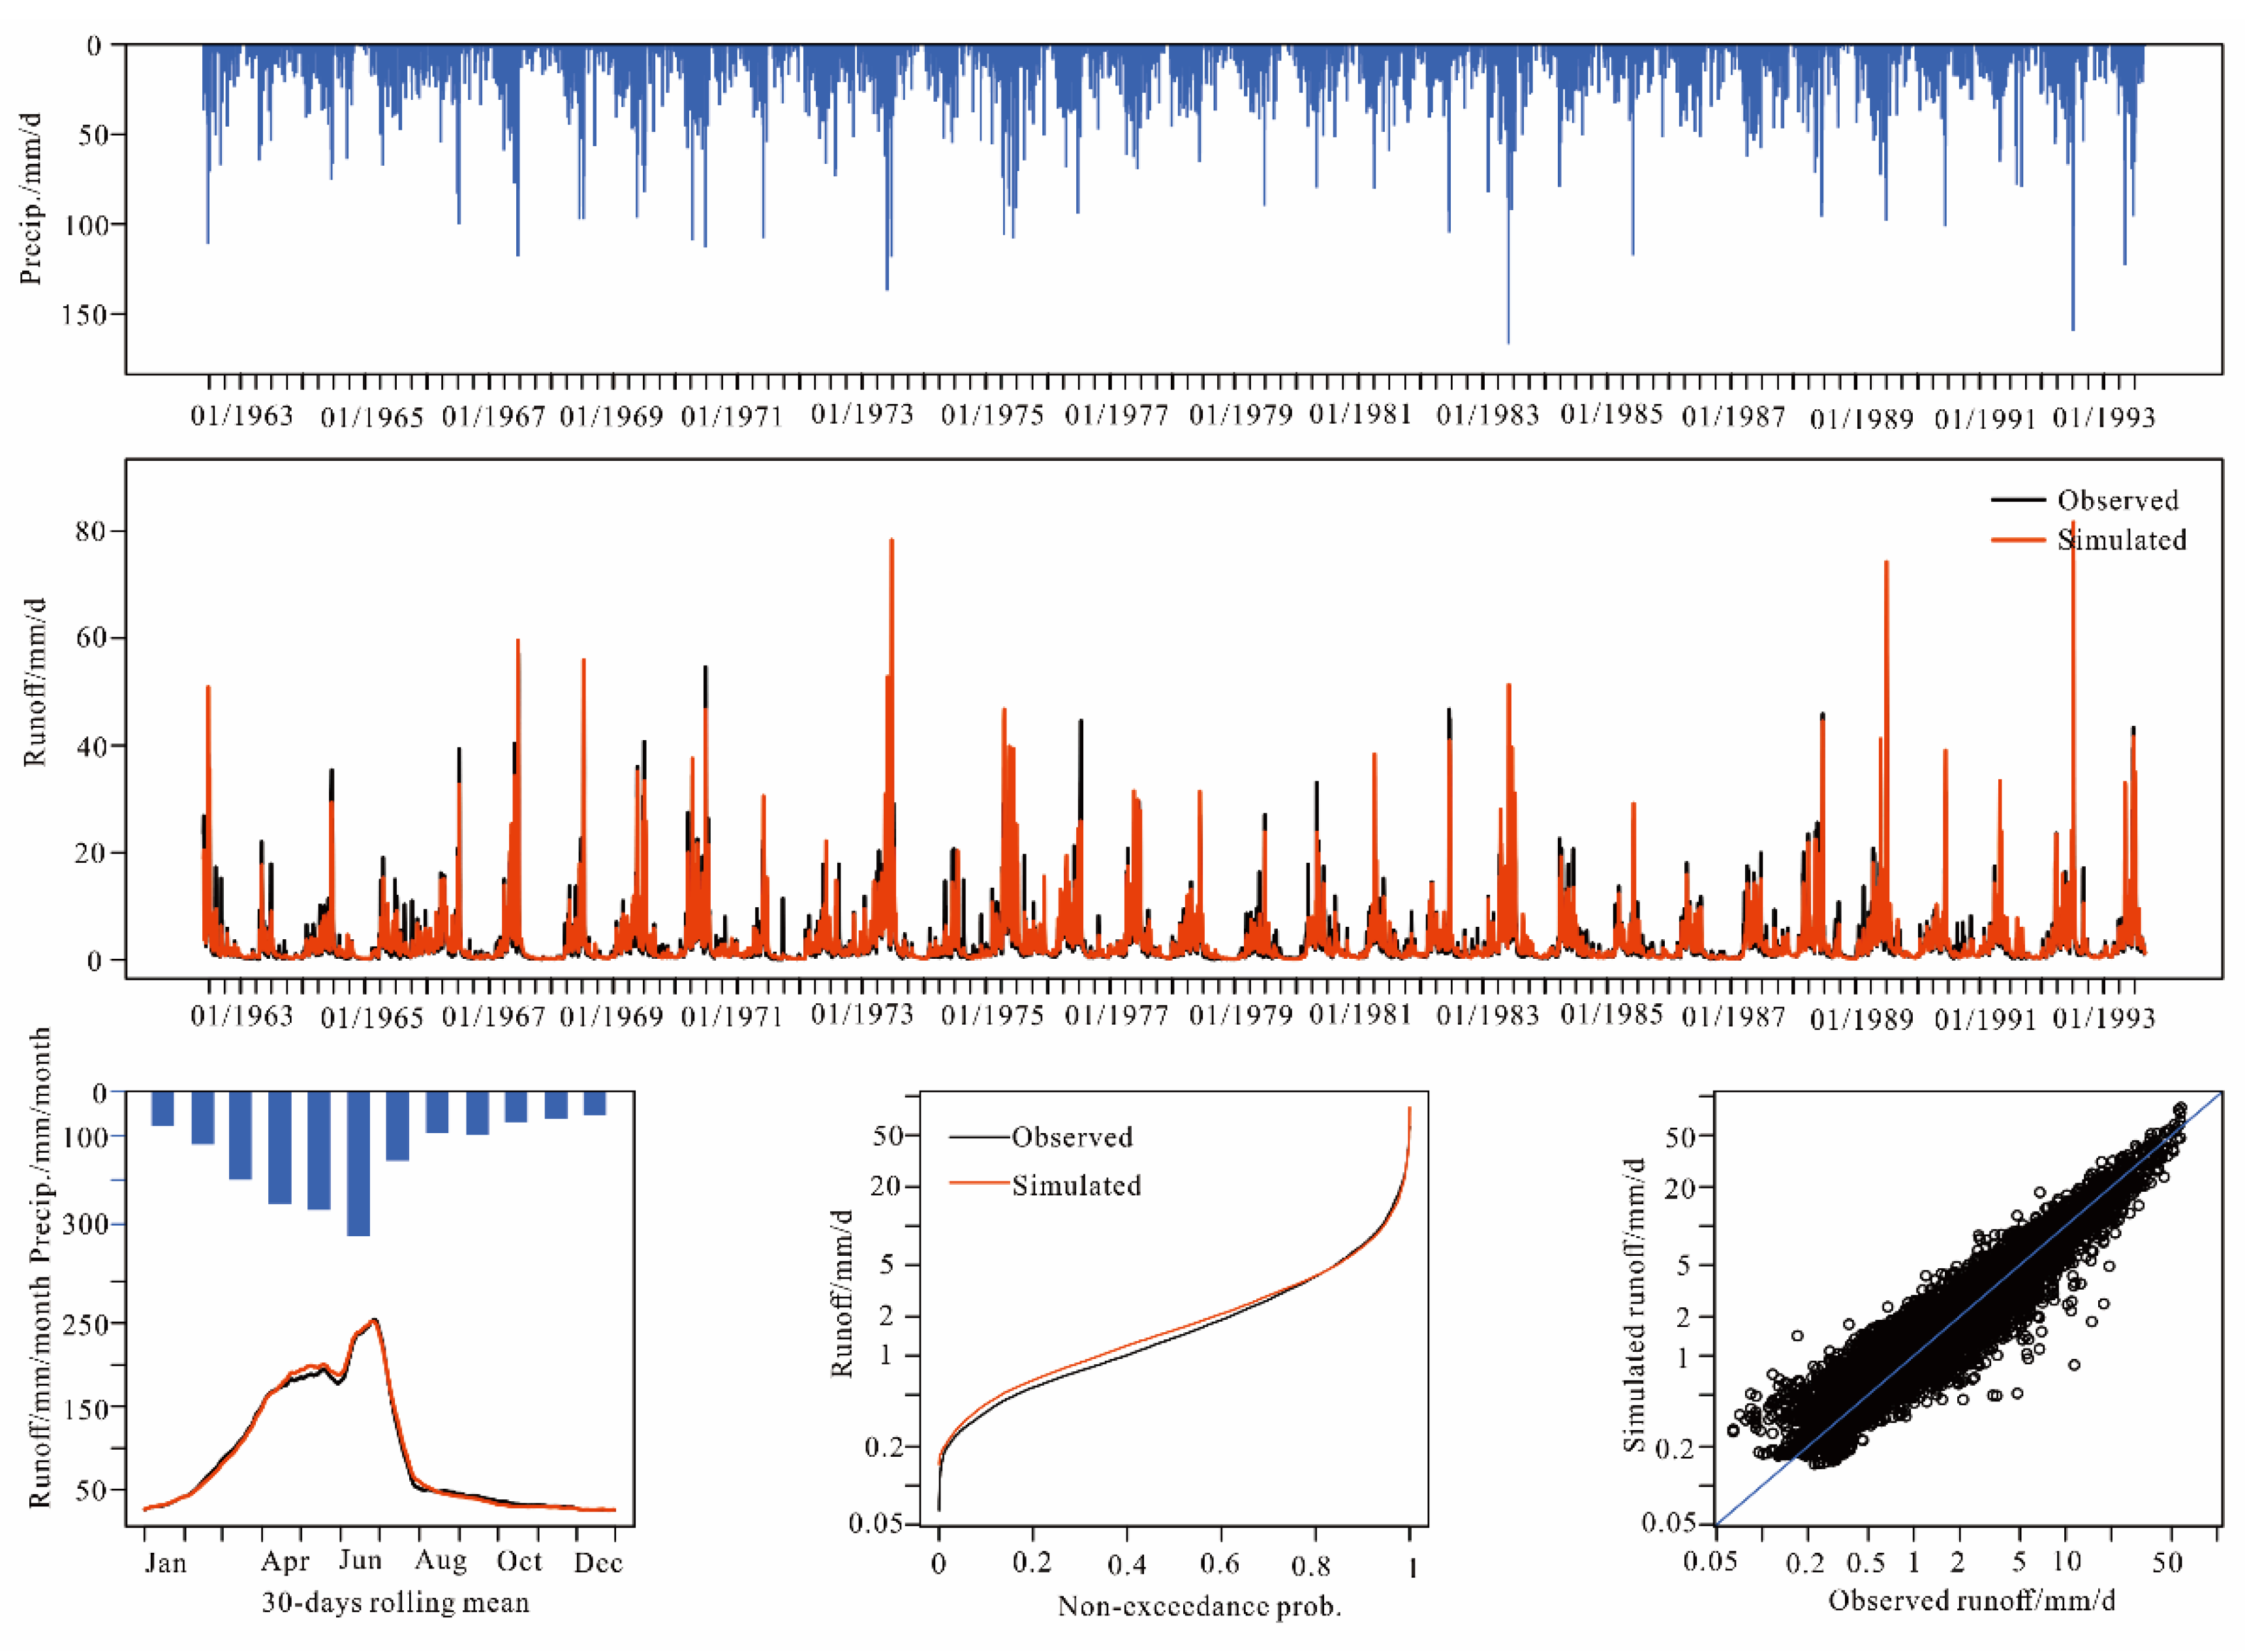
The Nash-Sutcliffe efficiency coefficients (NSE) exceeded 0.65 for both the calibration and validation periods in the Hulan River Basin. The coefficient of determination exceeded 0.85 for most stations in the Poyang Lake Basin. These results indicated that the CemaNeige GR4J and GR4J models performed better in simulating the changes to runoff in these basins (Figure 5). The model simulation for the Meigang Station in the Xinjiang River Basin showed that the GR4J model was able to simulate the changes in daily runoff relatively well (Figure 6) and an average NSE of both the calibration and validations close to 0.9. The simulation of daily runoff in the Hulan River showed that although the CemaNeigeGR4J was able to accurately simulate summer runoff, the simulation of spring runoff was not good (Figure S1). This result shows that although the snowpack module is added to the GR4J, the model was not able to reflect the changes in spring runoff in the Hulan River Basin.
3.3. Hydrological Model Parameter Relationships with Climate and Underlying Surface Factors
There were significant correlations between hydrological parameters and some environmental factors (Table S1). For example, precipitation was significantly negatively correlated with potential evapotranspiration and the aridity index in the Poyang Lake Basin, whereas there were significant positive correlations between precipitation and the proportion of forest (Forestl), Leaf Area Index (LAI), and elevation. There were significant correlations between LAI and Normalized Difference Vegetation Index (NDVI) and between soil types and the proportion of sand, silt, and clay. There was also a significant correlation between Gross Domestic Product (GDP) and population.
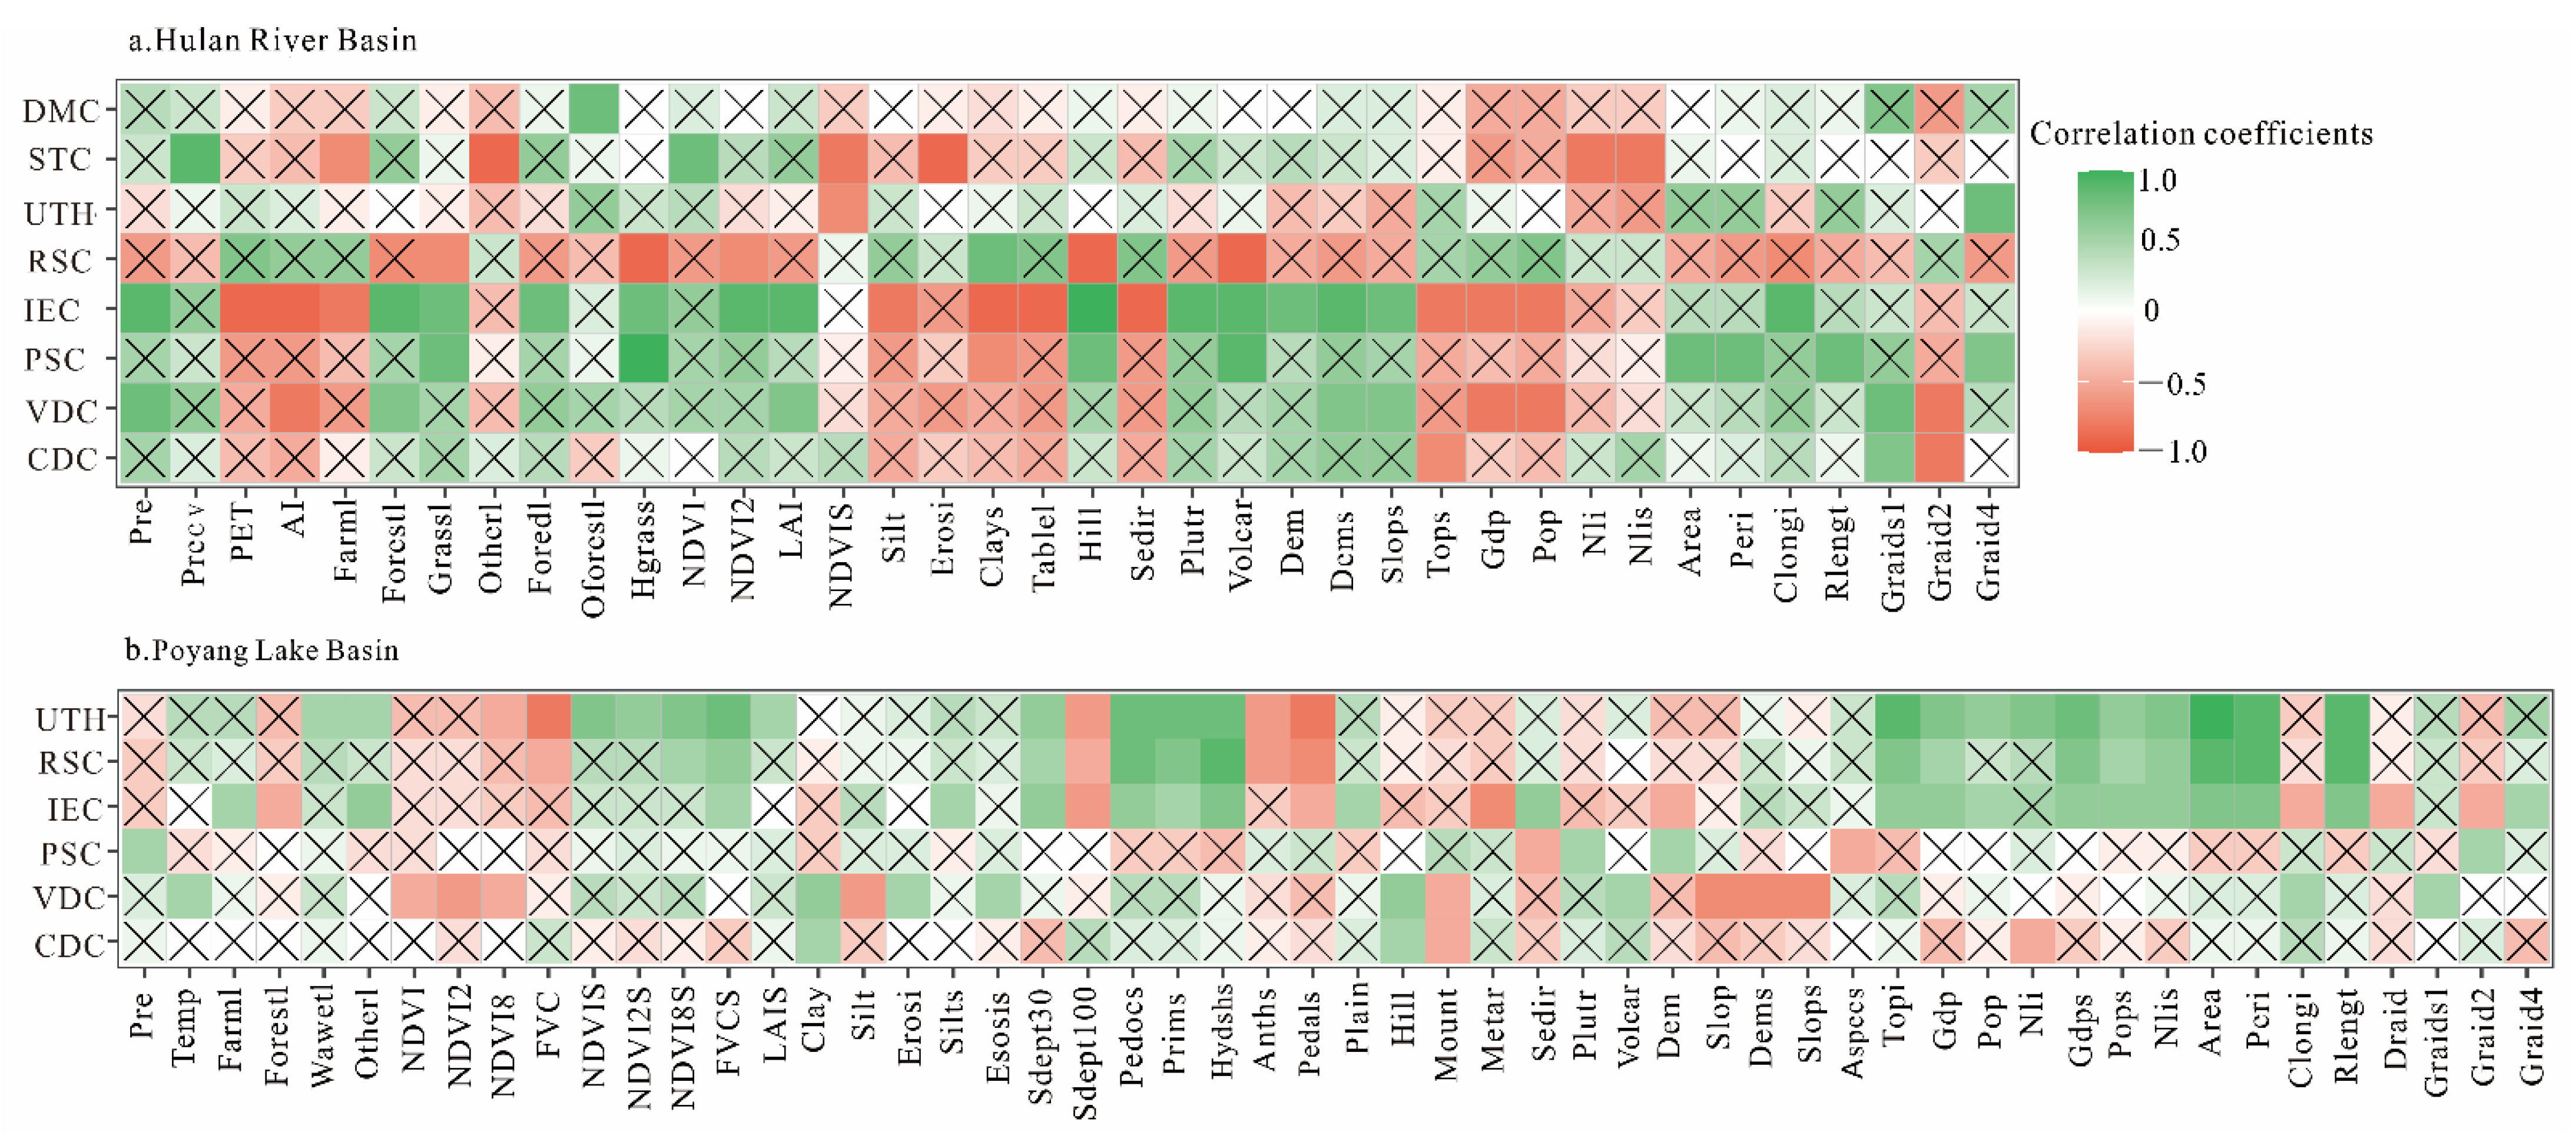
The calibration NSE for the Hulan River Basin was significantly related to the topographic index (Topi), proportion of level 1 of Strahler stream ordering of drainage density (Draid1), and proportion of level 2 of Strahler stream ordering of drainage density (Draid2), whereas that for the validation period was related to precipitation, AI, Forestl, LAI, Draid1, Draid2, GDP, and population (Pop) (Figure 7). The proportion of grassland (Grassl), the proportion of hilly land (Hill), the proportion of volcanic rock Volcar, and production store capacity (PSC) were significantly correlated to basin area (Area) and basin perimeter (Peri). The IEC was significantly correlated with most climate and underlying surface types. The RSC was significantly negatively correlated with the Grassl, monthly minimum NDVI (NDVI2), Hill, and Volcar. The UHT was significantly correlated with only NDVIS and Draid4. The STC was significantly positively correlated with Precv and NDVI and significantly negatively correlated with the standard deviation of spatial NDVI (NDVIS), soil erosion (Erosi), and night light intensity (Nli). The DMC was significantly correlated with only the proportion of the other forest land (Oforestl).
The factors that are significantly correlated to efficiency coefficients for both for calibration and validation periods in the Poyang Lake Basin were the percentage of clay (Clay), the proportion of hilly land (Hill), and the proportion of mountainous land (Mount). PSC showed a significant positive correlation with precipitation, the proportion of plutonic rock (Plutr), elevation, and Draid2, and a significant negative correlation with the proportion of sedimentary rock (Sedir). IEC was significantly correlated with mainly land use types, soil, landform and geology, human activities, and watershed morphology. RSC was significantly correlated with mainly vegetation, soil type, human activities, basin area, and river network length. UHT was significantly correlated with mainly vegetation and land use types, soil type, topographic index, human activities, watershed area, and river network length.
The results of the above analysis showed that from the above analysis, it can be seen that the environmental factors that affect runoff generation and confluence processes vary greatly under different climate and underlying surface conditions, making it difficult to identify climate and underlying surface factors that significantly affect the hydrological model parameters. Therefore, it was necessary to apply PCA to reduce the uncertainty caused by artificial selection of factors by reducing the dimensions of all factors in the calculation of hydrological similarity.
3.4. Hydrological Similarity and Parameter Regionalization
All environmental factors had one principal component to reduce the dimensionality of the climate and underlying surface of the Hulan River Basin, except for vegetation, land use, and human activities, which had two principal components. The first principal component and the second principal component of human activities, vegetation, and land use were weighted by the entropy method, following which the final principal component load was calculated (Table 3). The weights of principal component loading in Table 3 were determined by the entropy method. The weights of climate, land use vegetation, soil, landform geology, topography, human activities, and watershed morphology were 0.1216, 0.2200, 0.1005, 0.1177, 0.1368, 0.1643, and 0.1390, respectively. The SHulan, Yijimi, Eugen, Numin, Keyin, Tongken, and Zake river sub-basins were set as ungauged sub-basins, whereas the other river basins were set as reference basins. The physical similarity index (HSI) was calculated using leave-one-out cross-validation (Table 4). The HSI had a positive relationship with the similarity of two basins, and the basin with the greatest HSI was selected as the reference basin for each ungauged basin. The reference basins of the SHulan, Yijimi, Eugen, Numin, Keyin, Tongken, and Zake river sub-basins were the Yijimi, SHulan, Eugen, and Numin, Keyin, Tongken, and Zake river sub-basins, respectively. Spatial similarity was also used to select the reference basin, with the closest basin for each ungauged basin selected as the reference basin. The reference basins of the above basins were the Yijimi, Eugen, Numin, Zake, Zake, Zake, and Numin river sub-basins, respectively. The above analysis showed that the reference basins of ungauged basins selected by physical similarity were very different from those selected by spatial similarity.
PCA of the climate and underlying surface of 22 watersheds in the Poyang Lake Basin showed that the number of principal components of climate, land use vegetation, soil, geomorphology, topography, human activities, and watershed morphology were 2, 2, 3, 3, 2, 1, and 1, respectively. The entropy method was used to obtain the final principal component loading for the environmental types with multiple principal components (Table S2). On this basis, the entropy method was further used to determine the weight of each environmental type. The results showed that the weights of climate, land use vegetation, soil, geomorphology, topography, human activities, and watershed morphology were 0.0942, 0.1166, 0.1098, 0.0717, 0.1957, 0.0890, and 0.3230, respectively. The Xiushui, Xinjiang, and Ganjiang river sub-basins (Xiajiang Station) which had observed runoff were set as ungauged basins and the reference basins were selected using leave-one-out cross-validation. Physical similarity showed that the ungauged basin of the Xiushui, Xinjiang, and Ganjiang river sub-basins (Xiajiang Station) were the Xinjiang, Xiushui, and Ganjiang (Jian Station) sub-basins, respectively, with HSI values of 1.36, 1.33, and 9.56, respectively (Table S3). However, the reference basins for the above-mentioned sub-basins obtained through application of spatial similarity were the Ganjiang (Gaoan Station), Ganjiang (Xintian Station), and Ganjiang (Jian Station) river sub-basins, respectively.
The spatial proximity method was used to transfer the parameters of the sub-basins of the Hulan River. The results showed that, besides for improved parameter transfer in the SHulan River and Eugen River, parameter transfer for other basins was not ideal (Table 5). The efficiency of parameter transfer for the Yijimi River sub-basin ranked 3rd among all parameter transfer options, whereas those of the Zake River sub-basin ranked 5th, and those of the Keyin, Tongken, and Zak river sub-basins ranked 6th. The effect of parameter transfer for the physical similarity method was significantly improved. The SHulan, Yijimi, Eugen, Numin, Keyin, and Tongken river sub-basins were ranked first among all transfer options. The efficiency of parameter transfer for the Zake River sub-basin was relatively poor, ranking 4th. This result could be attributed to the hydrological model of the Zak River having a low simulation performance. In addition, the area of the Zake River sub-basin was quite different from that of the other sub-basins. However, the parameter transfer efficiency obtained through physical similarity showed some improvement compared to that under spatial proximity. Similarly, the results of spatial proximity for the Poyang Lake basin showed that the Xiushui, Xinjiang, and Ganjiang (Xiajiang Station) river sub-basins were ranked 6th, 5th, and 1st for all transfer options, respectively, whereas those for physical similarity were ranked 1st (Table 6). This shows that under different climate and underlying surface conditions, the physical similarity index constructed by combining the principal component and entropy method identified the most similar sub-basins for ungauged sub-basins.
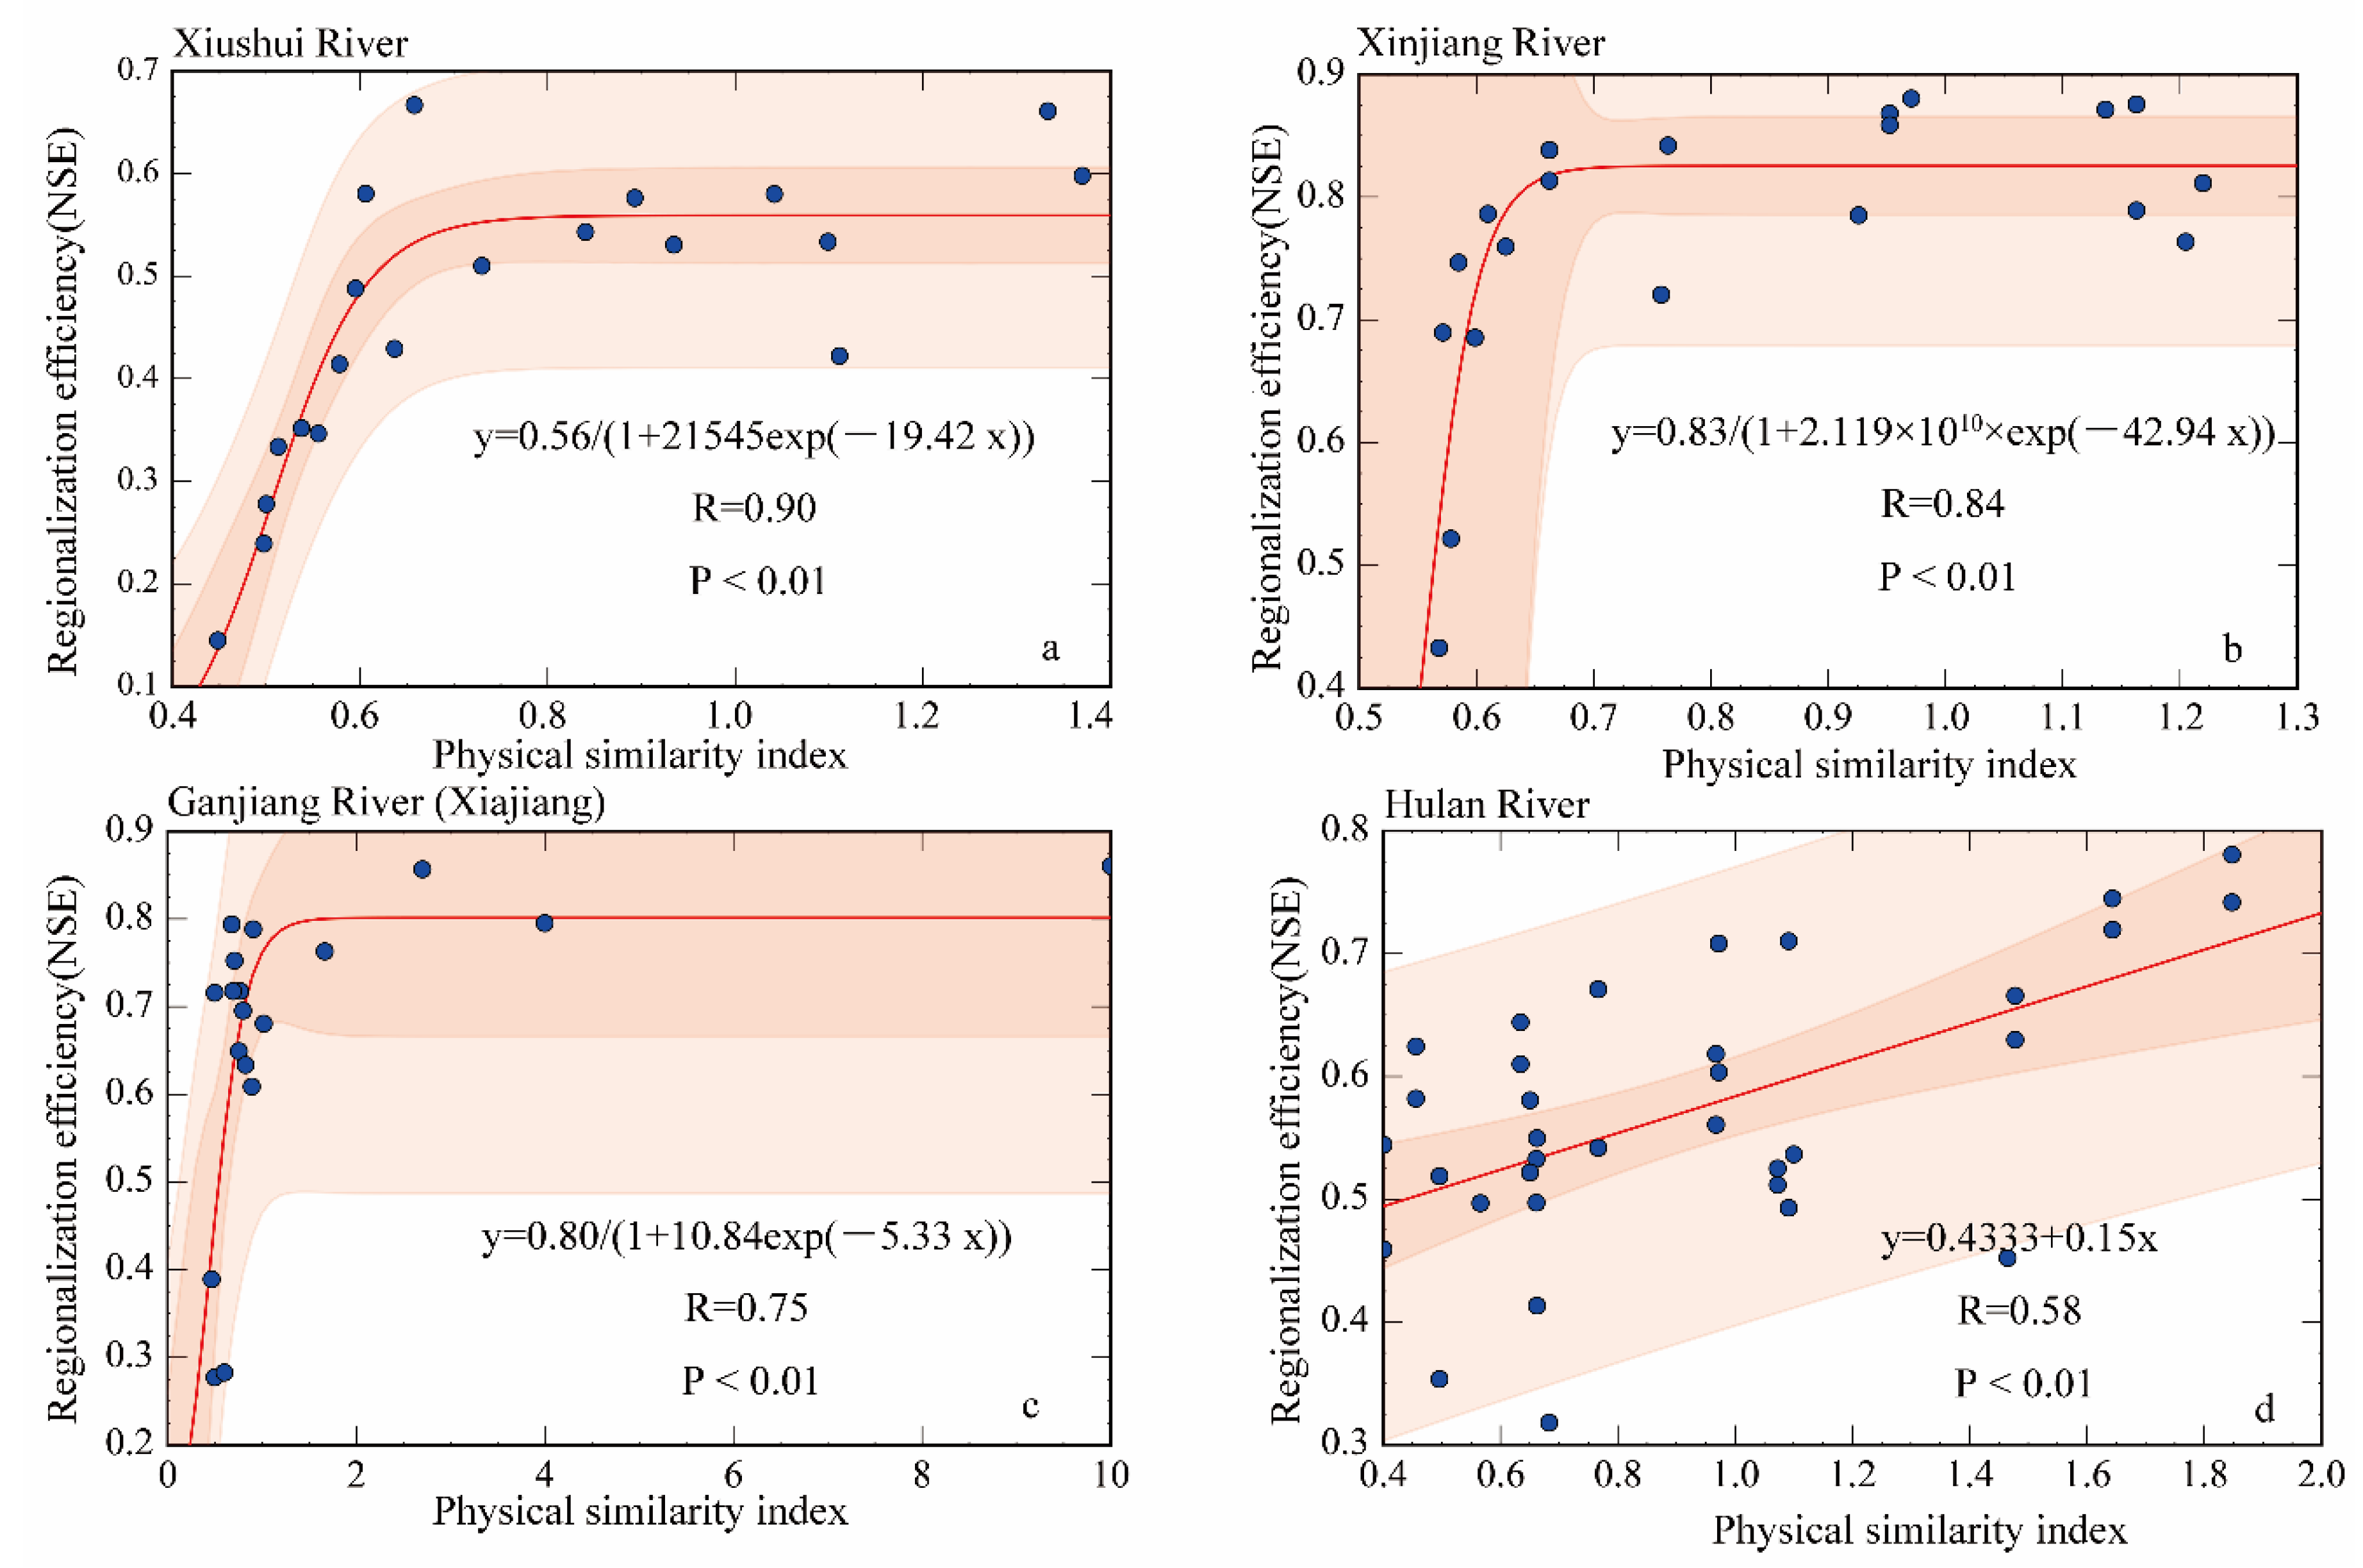
Regression analysis was performed between the HSI and the NSE of parameter transfer (Figure 8). The Poyang Lake basin could be described using a logistic equation, whereas the Hulan River basin could be described using a linear regression equation. The efficiency of parameter transfer increased with increasing physical similarity in the Hulan River Basin. The regression equation indicated that an increase in physical similarity by 1 would result in the parameter transfer efficiency increasing by 0.15. The relationship between physical similarity and parameter transfer efficiency in the Poyang Lake basin could be roughly represented using logistic regression. Although the parameter transfer efficiency increased with increasing physical similarity, the parameter transfer efficiency stabilized after the physical similarity reached a certain threshold (range of 0.7–1.1).
4. Discussion
The GR4J model performed well in simulating the changes to runoff in the Poyang Lake Basin. However, although the CemaNeige GR4J model considers the impact of snow cover on runoff, the performance of this model in simulating spring runoff for the Hulan River Basin was not ideal. This result could be related to the low spatial resolution of meteorological raster data and the failure of the CemaNeige model to accurately describe physical processes such as snow melt. Simulations of runoff in ungauged basin are mainly based on hydrological models, and most recent studies have applied lumped hydrological models [8]. Past studies have indicated that the efficiency of regionalization is not strongly dependent on the complexity of the hydrological model [8,39]. However, distributed hydrological models are physical mechanistic, and the regional relationships between model parameters and the climate and underlying surface are more obvious, thereby providing a better physical basis for parameter transfer of hydrological models. Therefore, subsequent studies should strengthen the application of distributed hydrological models in parameter regionalization.
The efficiency of regionalization is dependent on the regionalization method, basin area, and number of basins. Although the physical similarity approach shows higher performance than other methods, the spatial proximity method has the optimal performance basins with a high density of gauges [8]. Other studies have similarly found that the efficiency of regionalization is related to basin area, with the performance of regionalization increasing significantly with increasing basin area. The increase in the basin area results in the averaging of some hydrological variability, thereby improving hydrological simulation [40,41]. In addition, regionalization performance tends to increase with an increasing number of sub-basins, and larger basins tend to have smaller variances in estimated rainfall [42]. Due to difficulties in data collection, the present study collected limited daily runoff data. It was not possible to analyze the underlying mechanism of parameter regionalization efficiency due to the limited scale of the watershed. Future studies should establish a large-scale watershed dataset containing climate, hydrological, and underlying surface data.
The present study constructed a large index system to reduce the influence of the selection of climate and underlying surface factors on the calculation of hydrological similarity. However, this resulted in multicollinearity between the indices. The present study combined PCA and the entropy method to reduce the influence of multicollinearity and the subjectivity of weight determination within regionalization by physical hydrological similarity. The application of this approach to the Hulan River Basin and the Poyang Lake Basin showed that the regionalization based on hydrological similarity can rapidly identify the most similar reference basins for ungauged basins, thereby greatly reducing the time and workload required for the selection of the reference basins. However, since this approach was only applied to two basins, a certain degree of uncertainty remains in the results, and future research should verify the approach by applying it to more basins.
5. Conclusions
The present study constructed a comprehensive climate and underlying surface index system, selected two typical watersheds, and systematically analyzed the relationship between changes to runoff and climate as well as the runoff generation relationship with confluence factors and environmental factors. The present study proposed a physical hydrological similarity index based on the combination of PCA and the entropy method, and the efficiency of parameter transfer was assessed. The reference sub-basins selected for ungauged sub-basins were very different between the physical similarity and spatial similarity approaches. Parameter transfer using spatial similarity was not ideal in the Hulan River Basin, except for the SHulan and Eugen river sub-basins. The effect of parameter transfer using the constructed physical similarity was significantly improved. The SHulan, Yijimi, Eugen, Numin, Keyin, and Tongken river sub-basins ranked first among all schemes. Similarly, parameter transfer efficiency for the Xiushui, Xinjiang, and Ganjiang (Xiajiang Station) river sub-basins ranked 6th, 5th, and 1st under spatial similarity, respectively, whereas parameter transfer for all sub-basins in the Poyang Lake Basin ranked 1st under physical similarity. This result indicated that under different climate and underlying surface conditions, physical similarity constructed by combining PCA and the entropy method was able to identify the most similar reference sub-basins. In addition, the relationship between physical similarity and parameter transfer efficiency satisfied logistic regression in the Poyang Lake basin. An increase in physical similarity by 1 in the Hulan River Basin resulted in the parameter transfer efficiency increasing by 0.15. Our results demonstrated that physical similarity was more efficient and might be more suitable under data scarce conditions. The developed HSI was a feasible tool for parameter transfer in ungauged basin, which can be easily replicated with great advantages for hydrological parameter transplantation. Moreover, the physical hydrological similarity index was easily constructed due to the conveniently accessed climate and underlying surface data, without the necessity of in-depth understanding of the whole hydrological system. This is particularly meaningful in poorly gauged locations.
From a new perspective, this paper has provided a new physical similarity index to achieve parameter transfer to ungauged basins. Yet, due to the complexity of hydro-climatic system coupled with the particularity of the geographical environment, it is difficult to thoroughly understand the nature of hydro-climatic process in China. In fact, the proposed physical hydrological similarity index is a statistical analysis method, lacing the underlying physical mechanism investigation. Therefore, we still hope that better research methods and results could be proposed to complement insufficient understating of the parameter regionalization under different climate and underlying surfaces in ungauged basins. The completeness of the hydrological model structure and parameters is an important basis for the regionalization of parameters in ungauged basin. Multi-source remote sensing data including land use, precipitation, evaporation, soil moisture, and other information would greatly improve the hydrological simulation effect and could also be used directly to calibrate model parameters in ungauged catchments, which will reduce the dependence of observed runoff data, and these will be the focus of future research.
Supplementary Materials
The following are available online at https://www.mdpi.com/article/10.3390/w13182508/s1, Table S1. Correlation coefficients between climate factors and the underlying surfaces of the Hulan River Basin and Poyang Lake Basin. Table S2. Weights of climate factors and underlying surface factors for regionalization of hydrological parameters through physical similarity in the Poyang Lake Basin. Table S3. Physical similarity and spatial similarity of the Poyang Lake Basin based on leave-one-out cross validation. Figure S1. Results of hydrological modelling for the calibration period using data of the Eugenhe Station in the Eugen River sub-basin in the CemaNeigeGR4J model.
Author Contributions
H.W. and L.C. contributed to the conception of the study. H.W. performed the data analyses. R.F. wrote the manuscript. All authors have read and agreed to the published version of the manuscript.
Funding
This research was supported by National Key Research and Development Program of China (2018YFC1508101).
Institutional Review Board Statement
Not applicable.
Informed Consent Statement
Not applicable.
Data Availability Statement
Whenever data is used, a reference is cited.
Acknowledgments
The authors thank Yuqing Zhang for providing the runoff data of the Poyang Lake Basin. The authors thank the National Climate Center, China Meteorological Administration, for providing the meteorological data for this study. The authors would like to thank all the reviewers who participated in the review.
Conflicts of Interest
The authors declare no conflict of interest.
References
- Jiang, L.L.; Wu, H.A.; Lorenzo, A. Review of regionalization and remote sensing based method for hydrological model parameters calibration in ungauged basins. Acta Sci. Nat. Univ. Pekin. 2020, 56, 1152–1164. (In Chinese) [Google Scholar]
- Kiran, K.G.; Srinivas, V.V. Fuzzy ensemble clustering approach to address regionalization uncertainties in flood frequency analysis. Water Resour. Res. 2021, 57, e2020WR028412. [Google Scholar] [CrossRef]
- De Souza, G.R.; Merwade, V.; Coutinho de Oliveira, L.F.; Viola, M.R.; Farias, M.d.S. Regional flood frequency analysis and uncertainties: Maximum streamflow estimates in ungauged basins in the region of Lavras, MG, Brazil. Catena 2021, 197, 104970. [Google Scholar] [CrossRef]
- Dobler, C.C.; Hagemann, S.; Wilby, R.L.; Stotter, J. Quantifying different sources of uncertainty in hydrological projections in an Alpine watershed. Hydrol. Earth Syst. Sci. 2012, 16, 4343–4360. [Google Scholar] [CrossRef] [Green Version]
- Hrachowitz, M.; Savenije, H.; Bloschl, G.; Mcdonnell, J.; Sivapalan, M.; Pomeroy, J.; Arheimer, B.; Blume, T.; Clark, M.; Ehret, U.; et al. A decade of Predictions in Ungauged Basins (PUB)—A review. Hydrol. Sci. J. 2013, 58, 1198–1255. [Google Scholar] [CrossRef]
- Jafarzadegan, K.; Moradkhani, H. Regionalization of stage-discharge rating curves for hydrodynamic modeling in ungauged basins. J. Hydrol. 2020, 589, 125165. [Google Scholar] [CrossRef]
- Wagener, T.; Montanari, A. Convergence of approaches toward reducing uncertainty in predictions in ungauged basins. Water Resour. Res. 2011, 47. [Google Scholar] [CrossRef] [Green Version]
- Parajka, J.; Viglione, A.; Rogger, M.; Salinas, J.L.; Sivapalan, M.; Blöschl, G. Comparative assessment of predictions in ungauged basins—Part 1: Runoff-hydrograph studies. Hydrol. Earth Syst. Sci. 2013, 17, 1783–1795. [Google Scholar] [CrossRef] [Green Version]
- Yang, X.; Magnusson, J.; Rizzi, J.; Xu, C.-Y. Runoff prediction in ungauged catchments in Norway: Comparison of regionalization approaches. Hydrol. Res. 2017, 49, 487–505. [Google Scholar] [CrossRef]
- Oudin, L.; Kay, A.; Andréassian, V.; Perrin, C. Are seemingly physically similar catchments truly hydrologically similar? Water Resour. Res. 2010, 46, 11558. [Google Scholar] [CrossRef]
- Samuel, J.; Coulibaly, P.; Metcalfe, R.A. Estimation of continuous streamflow in Ontario Ungauged Basins: Comparison of regionalization methods. J. Hydrol. Eng. 2011, 16, 447–459. [Google Scholar] [CrossRef]
- Yang, X.; Magnusson, J.; Xu, C.-Y. Transferability of regionalization methods under changing climate. J. Hydrol. 2018, 568, 67–81. [Google Scholar] [CrossRef]
- Tegegne, G.; Kim, Y.-O. Modelling ungauged catchments using the catchment runoff response similarity. J. Hydrol. 2018, 564, 452–466. [Google Scholar] [CrossRef]
- Parajka, J.; Merz, R.; Blöschl, G. A comparison of regionalisation methods for catchment model parameters. Hydrol. Earth Syst. Sci. 2005, 9, 157–171. [Google Scholar] [CrossRef] [Green Version]
- Yadav, M.; Wagener, T.; Gupta, H. Regionalization of constraints on expected watershed response behavior for improved predictions in ungauged basins. Adv. Water Resour. 2007, 30, 1756–1774. [Google Scholar] [CrossRef]
- Oudin, L.; Andréassian, V.; Perrin, C.; Michel, C.; le Moine, N. Spatial proximity, physical similarity, regression and ungaged catchments: A comparison of regionalization approaches based on 913 French catchments. Water Resour. Res. 2008, 44, 03413. [Google Scholar] [CrossRef]
- Razavi, T.; Coulibaly, P. Streamflow prediction in ungauged basins: Review of regionalization methods. J. Hydrol. Eng. 2013, 18, 958–975. [Google Scholar] [CrossRef]
- Grimaldi, S.; Petroselli, A.; Salvadori, G.; de Michele, C. Catchment compatibility via copulas: A non-parametric study of the dependence structures of hydrological responses. Adv. Water Resour. 2016, 90, 116–133. [Google Scholar] [CrossRef]
- Betterle, A.; Schirmer, M.; Botter, G. Flow dynamics at the continental scale: Streamflow correlation and hydrological similarity. Hydrol. Process. 2019, 33, 627–646. [Google Scholar] [CrossRef] [Green Version]
- Loritz, R.; Gupta, H.; Jackisch, C.; Westhoff, M.; Kleidon, A.; Ehret, U.; Zehe, E. On the dynamic nature of hydrological similarity. Hydrol. Earth Syst. Sci. 2018, 22, 3663–3684. [Google Scholar] [CrossRef] [Green Version]
- Guo, Y.; Zhang, Y.; Zhang, L.; Wang, Z. Regionalization of hydrological modeling for predicting streamflow in ungauged catchments: A comprehensive review. Wiley Interdiscip. Rev. Water 2021, 8, 1487. [Google Scholar] [CrossRef]
- Rianna, M.; Ridolfi, E.; Napolitano, F. Comparison of different hydrological similarity measures to estimate flow quantiles. In Proceedings of the International Conference of Numerical Analysis and Applied Mathematics (ICNAAM 2016), Rhodes, Greece, 19–25 September 2016; AIP Publishing: College Park, MD, USA, 2017; Volume 1863. [Google Scholar]
- Yang, X.; Magnusson, J.; Huang, S.; Beldring, S.; Xu, C.-Y. Dependence of regionalization methods on the complexity of hydrological models in multiple climatic regions. J. Hydrol. 2020, 582, 124357. [Google Scholar] [CrossRef]
- Ragettli, S.; Zhou, J.; Wang, H. Modeling flash floods in ungauged mountain catchments of China: A decision tree learning approach for parameter regionalization. J. Hydrol. 2017, 555, 330–346. [Google Scholar] [CrossRef]
- Zhou, G.T. Study on the intra-annual runoff distribution characteristics in Hulan River Basin. Int. J. Hydroelectr. Energy 2018, 36, 39–43. (In Chinese) [Google Scholar]
- Wang, R.; Li, X.H.; Xue, C.Y.; Zhang, D. Spatio-temporal variations of the drought-flood abrupt alternation events in the Lake Poyang Basin from 1960 to 2012. J. Lake Sci. 2020, 32, 209–224. (In Chinese) [Google Scholar]
- Yang, W.J.; Liu, T.H.; Luan, H.L.; Cheng, D.B.; XU, X.F. Key techniques and demonstration of comprehensive control of ecological water conservancy in the Poyang Lake region and its five major tributaries. J. Sichuan Univ. Eng. Sci. Ed. 2019, 51, 1–12. (In Chinese) [Google Scholar]
- Zhang, L.; Meng, X.; Wang, H.; Yang, M.; Cai, S. Investigate the applicability of CMADS and CFSR reanalysis in Northeast China. Water 2020, 12, 996. [Google Scholar] [CrossRef] [Green Version]
- Meng, X.; Zhang, X.; Yang, M.; Wang, H.; Chen, J.; Pan, Z.; Wu, Y. Application and evaluation of the China meteorological assimilation driving datasets for the SWAT model (CMADS) in poorly gauged regions in western China. Water 2019, 11, 2171. [Google Scholar] [CrossRef] [Green Version]
- Deng, P.X.; Wang, Y.T.; Hu, Q.F. Application of GR4J in daily runoff simulation for Ganjiang River Basin. J. China Hydrol. 2014, 34, 60–65. (In Chinese) [Google Scholar]
- Deng, P.X.; Hu, Q.F.; Wang, Y.T. Comparison of GR model, Xin’anjiang model, and WBM-DP model in rainfall-runoff simulation in Gangjiang River Basin. J. Hohai Univ. Nat. Sci. 2014, 42, 382–387. (In Chinese) [Google Scholar]
- Wang, H.J.; Zhang, J.Y.; Wang, G.Q. Relationships between runoff yield and flow concentration processes and climate and underlying surface in China’s middle and small river. Sci. Geogr. Sin. 2021, 41, 1–12. (In Chinese) [Google Scholar]
- Coron, L.; Thirel, G.; Delaigue, O.; Perrin, C.; Andréassian, V. The suite of lumped GR hydrological models in an R package. Environ. Model. Softw. 2017, 94, 166–171. [Google Scholar] [CrossRef]
- Valéry, A.; Andréassian, V.; Perrin, C. ‘As simple as possible but not simpler’: What is useful in a temperature-based snow-accounting routine? Part 1—Comparison of six snow accounting routines on 380 catchments. J. Hydrol. 2014, 517, 1166–1175. [Google Scholar] [CrossRef]
- Sauquet, E.; Richard, B.; Devers, A.; Prudhomme, C. Water restrictions under climate change: A Rhone–Mediterranean perspective combining bottom-up and top-down approaches. Hydrol. Earth Syst. Sci. 2019, 23, 3683–3710. [Google Scholar] [CrossRef] [Green Version]
- Burn, D.H.; Boorman, D.B. Estimation of hydrological parameters at ungauged catchments. J. Hydrol. 1993, 143, 429–454. [Google Scholar] [CrossRef]
- Kay, A.L.; Jones, D.A.; Crooks, S.M.; Kjeldsen, T.R.; Fung, C.F. An investigation of site-similarity approaches to generalisation of a rainfall–runoff model. Hydrol. Earth Syst. Sci. 2007, 11, 500–515. [Google Scholar] [CrossRef] [Green Version]
- He, Y.; Bárdossy, A.; Zehe, E. A review of regionalisation for continuous streamflow simulation. Hydrol. Earth Syst. Sci. 2011, 15, 3539–3553. [Google Scholar] [CrossRef] [Green Version]
- Petheram, C.; Rustomji, P.; Chiew, F.; Vleeshouwer, J. Rainfall–runoff modelling in northern Australia: A guide to modelling strategies in the tropics. J. Hydrol. 2012, 462–463, 28–41. [Google Scholar] [CrossRef]
- Merz, R.; Parajka, J.; Bloschl, G. Scale effects in conceptual hydrological modeling. Water Resour. Res. 2009, 45, 09405. [Google Scholar] [CrossRef]
- Nester, T.; Kirnbauer, R.; Gutknecht, D.; Blöschl, G. Climate and catchment controls on the performance of regional flood simulations. J. Hydrol. 2011, 402, 340–356. [Google Scholar] [CrossRef]
- Salinas, J.L.; Laaha, G.; Rogger, M.; Parajka, J.; Viglione, A.; Sivapalan, M.; Bloschl, G. Comparative assessment of predictions in ungauged basins—Part 2: Flood and low flow studies. Hydrol. Earth Syst. Sci. 2013, 17, 2637–2652. [Google Scholar] [CrossRef] [Green Version]
Figure 1.
Distribution of hydrological stations and meteorological stations in the Hulan River Basin, central Heilongjiang Province, China and the Poyang Lake Basin, northern Jiangxi Province, China.
Figure 1.
Distribution of hydrological stations and meteorological stations in the Hulan River Basin, central Heilongjiang Province, China and the Poyang Lake Basin, northern Jiangxi Province, China.

Figure 2.
Monthly variation in precipitation, temperature, potential evapotranspiration, and runoff in the Hulan River Basin ((a) monthly precipitation; (b) monthly temperature; (c) monthly potential evapotranspiration; (d) monthly runoff).
Figure 2.
Monthly variation in precipitation, temperature, potential evapotranspiration, and runoff in the Hulan River Basin ((a) monthly precipitation; (b) monthly temperature; (c) monthly potential evapotranspiration; (d) monthly runoff).

Figure 3.
Correlation coefficients between runoff and climate factors in the Hulan River Basin and Poyang Lake Basin.
Figure 3.
Correlation coefficients between runoff and climate factors in the Hulan River Basin and Poyang Lake Basin.

Figure 4.
Monthly variations in precipitation, temperature, potential evapotranspiration, and runoff in the Poyang Lake Basin ((a) monthly precipitation; (b) monthly temperature; (c) monthly potential evapotranspiration; (d) monthly runoff).
Figure 4.
Monthly variations in precipitation, temperature, potential evapotranspiration, and runoff in the Poyang Lake Basin ((a) monthly precipitation; (b) monthly temperature; (c) monthly potential evapotranspiration; (d) monthly runoff).

Figure 5.
Spatial distributions of the hydrological model applied to the Hulan River Basin and Poyang Lake Basin ((a) calibration period for Hulan River Basin; (b) validation period for Hulan River Basin; (c) calibration period for Poyang Lake Basin; (d) validation period for Poyang Lake Basin).
Figure 5.
Spatial distributions of the hydrological model applied to the Hulan River Basin and Poyang Lake Basin ((a) calibration period for Hulan River Basin; (b) validation period for Hulan River Basin; (c) calibration period for Poyang Lake Basin; (d) validation period for Poyang Lake Basin).

Figure 6.
Results of the GR4J hydrological model applied to the Meigan Station of the Xin River for the calibration period.
Figure 6.
Results of the GR4J hydrological model applied to the Meigan Station of the Xin River for the calibration period.

Figure 7.
Correlation coefficients of model simulation efficiency (CDC for calibration period, VDC for validation period), hydrological model parameters, and indices of climate and underlying surface for the Hulan River Basin (a) and Poyang Lake Basin (b).
Figure 7.
Correlation coefficients of model simulation efficiency (CDC for calibration period, VDC for validation period), hydrological model parameters, and indices of climate and underlying surface for the Hulan River Basin (a) and Poyang Lake Basin (b).

Figure 8.
Correlation diagram of physical similarity and parameter transfer efficiency in the Hulan River Basin and the Poyang Lake Basin ((a) Xiushui River; (b)Xinjiang River; (c) Gangjiang River (Xiajiang station); (d) Hulan River).
Figure 8.
Correlation diagram of physical similarity and parameter transfer efficiency in the Hulan River Basin and the Poyang Lake Basin ((a) Xiushui River; (b)Xinjiang River; (c) Gangjiang River (Xiajiang station); (d) Hulan River).


Table 1.
Information on the Hulan River Basin and Poyang Lake Basin and their hydrological station.
| River | Hydrological Station | Abbreviate of Hydrological Station | Latitude | Longitude | |
|---|---|---|---|---|---|
| Hulan River Basin | Small Hulan River (SHulan River) | Tieli | TL | 128.0197 | 46.97139 |
| Yijimi River | Beiguan | BG | 128.2441 | 47.12867 | |
| Eugen River | Eugen River | EGH | 127.44 | 47.01839 | |
| Numin River | Sifangtai | SFT | 126.9511 | 46.87278 | |
| Keyin River | Suileng | SL | 127.0503 | 47.24528 | |
| Tongken River | Haibei | HB | 126.8137 | 47.7403 | |
| Zake River | Chenjiadian | CJD | 127.2367 | 47.67111 | |
| Poyang Lake Basin | Xiushui River | Wanjiabu | WJF | 115.6479 | 28.85572 |
| Xinjiang River | Maygang | MG | 116.8175 | 28.43833 | |
| Ganjiang River | Xiajiang | XJ | 115.1512 | 27.54625 | |
| Ganjiang River | Shicheng | SC | 116.3567 | 26.37833 | |
| Ganjiang River | Ningdu | ND | 116.0233 | 26.48667 | |
| Ganjiang River | Mazhou | MZ | 115.7833 | 25.515 | |
| Ganjiang River | Hanlinqiao | HLQ | 115.2044 | 26.04876 | |
| Ganjiang River | Julongtan | JLT | 115.1175 | 25.82709 | |
| Ganjiang River | Bashang | BAS | 114.9554 | 25.82062 | |
| Ganjiang River | Linkeng | LK | 114.6022 | 26.66611 | |
| Ganjiang River | Shangshalan | SSL | 114.7925 | 26.93833 | |
| Ganjiang River | Saitang | ST | 114.7633 | 27.18183 | |
| Ganjiang River | Baisha | BS | 115.4333 | 26.95 | |
| Ganjiang River | Xintian | XT | 115.2856 | 27.20222 | |
| Ganjiang River | Gaoan | GA | 115.371 | 28.41717 | |
| Ganjiang River | Fenkeng | FK | 115.667 | 26.12772 | |
| Ganjiang River | Waizhou | WZ | 115.8404 | 28.63267 | |
| Ganjiang River | Xiashan | XS | 115.2117 | 25.91667 | |
| Ganjiang River | Dongbei | DB | 114.6921 | 26.56842 | |
| Ganjiang River | Jian | JA | 114.9862 | 27.09176 | |
| Ganjiang River | Zhangshu | ZS | 115.533 | 28.067 |
Table 2.
Indices of climate and underlying surface for regionalization of hydrological model parameters.
Table 2.
Indices of climate and underlying surface for regionalization of hydrological model parameters.
| Types | Indices |
|---|---|
| Climate | Annual average precipitation (Pre), coefficient of variation in average precipitation (Precv), annual mean potential evapotranspiration (Evap), coefficient of variation in annual potential evapotranspiration (Evapcv), aridity index(AI), temperature (Temp) |
| Vegetation and land use | Proportion of farmland (Farml), proportion of forest (Forestl), proportion of grassland (Grassl), proportion of water and wetland (Wawetl), proportion of other land uses (Otherl), proportion of forested land (Foredl), proportion of shrub (Shrub), proportion of other forest land (Oforestl), proportion of high-coverage grassland (Hgrass), proportion of medium-coverage grassland (Mgrass), proportion of low-coverage grassland (Lgrass), mean Normalized Difference Vegetation Index (NDVI), monthly minimum NDVI (NDVI2), monthly maximum NDVI (NDVI8), vegetation coverage (FVC), leaf area index (LAI), standard deviation of spatial NDVI (NDVIS), standard deviation of spatial minimum NDVI (NDVI2S), standard deviation of spatial maximum NDVI (NDVI8S), standard deviation of spatial vegetation coverage (FVCS), standard deviation of spatial leaf area index (LAIS) |
| Soil | Percentage of sand (Sand), percentage of silt (Silt), percentage of clay (Clay), soil erosion (Erosi), standard deviation of spatial sand (Sands), standard deviation of spatial silt (Silts), standard deviation of spatial clay (Clays), standard deviation of spatial soil erosion (Erosis), proportion of soil reference depth (30 cm) (Sdept30), proportion of soil reference depth (100 cm) (Sdept100), proportion of soil available water content (>100 mm/m) (Awc1), proportion of soil available water content (<100 mm/m) (Awc2), proportion of luvisol and semi-luvisols (lusimlus), proportion of pedocal (Pedocs), proportion of arid soil and desert soil (Aridests), proportion of primitive soil (Prims), proportion of hydromorphic soil and semi-hydromorphic soil (Hydshs), proportion of anthropic soils (Anths), proportion of alpine soil (Alpis), proportion of pedalfer (Pedals) |
| Landform and geology | Proportion of plain (Plain), proportion of tableland (Tablel), proportion of hilly land (Hill), proportion of mountainous land (Mount), proportion of metamorphic rock (Metar), proportion of sedimentary rock (Sedir), proportion of plutonic rock (Plutr), proportion of volcanic rock (Volcar) |
| Terrain | Elevation (Dem), slope (Slop), aspect (Aspec), standard deviation of spatial elevation (Dems), standard deviation of spatial slope (Slops), standard deviation of spatial aspect (Aspecs), topographic index (Topi), wetness index (Weti) |
| Human activity | Annual mean Gross Domestic Product (GDP), Annual mean population (Pop), Annual mean night light intensity (Nli), standard deviation of spatial GPD (GDPs), standard deviation of spatial population (Pops), standard deviation of night light intensity (Nlis) |
| Watershed morphology | Basin area (Area), basin perimeter (Peri), centroid longitude (Clongi), centroid latitude (Clati), river length (Rlengt), coefficient of basin shape (Bshac), drainage density (Draid), proportion of level 1 of Strahler stream ordering of drainage density (Draid1), proportion of level 2 of Strahler stream ordering of drainage density (Draid2), proportion of level 3 of Strahler stream ordering of drainage density (Draid3), proportion of level 4 of Strahler stream ordering of drainage density (Draid4) |
Table 3.
Weight of climate and underlying surface factors for physical similarity in the Hulan River Basin.
Table 3.
Weight of climate and underlying surface factors for physical similarity in the Hulan River Basin.
| Basin | Climate | Vegetation and Land Use | Soil | Landform and Geology | Terrain | Human Activity | Watershed Morphology |
|---|---|---|---|---|---|---|---|
| SHulan River | −1.9039 | −2.6856 | −2.7654 | −2.3337 | −3.9161 | −0.7298 | −0.4336 |
| Yijimi River | −3.1684 | −2.9296 | −5.3405 | −3.8697 | −3.3713 | −2.3611 | 0.9909 |
| Eugen River | −0.4310 | −0.2504 | 1.6002 | −0.0845 | 0.4899 | −1.8270 | −2.1255 |
| Numin River | −0.0444 | −1.9447 | 0.6299 | −0.5110 | 0.6204 | 1.4776 | −3.2721 |
| Keyin River | 2.9795 | 4.7161 | 3.5410 | 2.7547 | 1.9544 | 2.9993 | 1.0706 |
| Tongken River | 1.7442 | 2.1156 | 1.5983 | 2.2794 | 2.0931 | 1.0289 | −0.4684 |
| Zake River | 0.8240 | 0.9787 | 0.7365 | 1.7649 | 2.1295 | −0.5877 | 4.2381 |
| Weight | 0.1216 | 0.2200 | 0.1005 | 0.1177 | 0.1368 | 0.1643 | 0.1390 |
Table 4.
Physical similarity and spatial similarity of the Hulan River Basin based on leave-one-out cross validation (the bold value indicated the best reference basin).
Table 4.
Physical similarity and spatial similarity of the Hulan River Basin based on leave-one-out cross validation (the bold value indicated the best reference basin).
| Hulan River | Yijimi River | Eugen River | Numin River | Keyin River | Tongken River | Zake River | ||
|---|---|---|---|---|---|---|---|---|
| Physical similarity | SHulan River | - | 1.85 | 0.77 | 0.66 | 0.40 | 0.50 | 0.57 |
| Yijimi River | 1.85 | - | 0.97 | 1.64 | 0.63 | 1.09 | 1.10 | |
| Eugen River | 0.97 | 0.77 | - | 0.97 | 0.66 | 1.07 | 0.86 | |
| Numin River | 0.97 | 0.66 | 1.64 | - | 0.46 | 1.48 | 0.88 | |
| Keyin River | 0.46 | 0.40 | 0.63 | 0.66 | - | 0.65 | 1.53 | |
| Tongken River | 0.65 | 0.50 | 1.09 | 1.07 | 1.48 | - | 0.68 | |
| Zake River | 0.68 | 0.57 | 1.10 | 0.86 | 0.88 | 1.53 | - | |
| Spatial similarity/m | SHulan River | - | 44,658 | 62,456 | 93,509 | 10,6676 | 13,9106 | 11,5220 |
| Yijimi River | 44,658 | - | 37,722 | 58,260 | 85,381 | 10,8254 | 82,863 | |
| Eugen River | 62,456 | 37,722 | - | 32,950 | 48,265 | 76,759 | 52,808 | |
| Numin River | 93,509 | 58,260 | 32,950 | - | 40,125 | 50,379 | 24,972 | |
| Keyin River | 10,6676 | 85,381 | 48,265 | 40,125 | - | 40,083 | 30,291 | |
| Tongken River | 13,9106 | 10,8254 | 76,759 | 50,379 | 40,083 | - | 25,440 | |
| Zake River | 11,5220 | 82,863 | 52,808 | 24,972 | 30,291 | 25,440 | - |
Table 5.
Parameter transfer efficiency of the Hulan River Basin based on physical similarity and spatial similarity.
Table 5.
Parameter transfer efficiency of the Hulan River Basin based on physical similarity and spatial similarity.
| Calibration Period | Validation Period | Reference Basin | Similarity Index | Rank | ||
|---|---|---|---|---|---|---|
| Spatial similarity | SHulan River | 0.76 | 0.79 | Yijimi River | 44,658.44 | 1/6 |
| Yijimi River | 0.57 | 0.53 | Eugen River | 37,721.69 | 3/6 | |
| Eugen River | 0.75 | 0.74 | Numin River | 32,950.20 | 1/6 | |
| Numin River | 0.10 | 0.29 | Zake River | 24,972.11 | 6/6 | |
| Keyin River | 0.02 | 0.23 | Zake River | 30,290.81 | 6/6 | |
| Tongken River | 0.28 | 0.51 | Zake River | 25,440.49 | 6/6 | |
| Zake River | 0.42 | 0.34 | Eugen River | 24,972.11 | 5/6 | |
| physical similarity | SHulan River | 0.76 | 0.79 | Yijimi River | 1.85 | 1/6 |
| Yijimi River | 0.79 | 0.73 | Hulan River | 1.85 | 1/6 | |
| Eugen River | 0.75 | 0.74 | Numin River | 1.64 | 1/6 | |
| Numin River | 0.75 | 0.71 | Eugen River | 1.64 | 1/6 | |
| Keyin River | 0.73 | 0.64 | Tongken River | 1.48 | 1/6 | |
| Tongken River | 0.73 | 0.60 | Keyin River | 1.53 | 1/6 | |
| Zake River | 0.46 | 0.40 | Tongken River | 1.53 | 4/6 |
Table 6.
Parameter transfer efficiency of the Poyang Lake Basin based on physical similarity and spatial similarity.
Table 6.
Parameter transfer efficiency of the Poyang Lake Basin based on physical similarity and spatial similarity.
| Ungauged Basin | Calibration Period | Validation Period | Reference Basin | Similarity Index | Rank | |
|---|---|---|---|---|---|---|
| Physical similarity | Xiushui River | 0.51 | 0.56 | Ganjiang River (Gaoan) | 75,879.00 | 6/20 |
| Xinjiang River | 0.87 | 0.85 | Ganjiang River (Xintian) | 147,975.00 | 5/20 | |
| Ganjiang River (Xiajiang) | 0.86 | 0.86 | Ganjiang River (Jian) | 13,824.00 | 1/20 | |
| physical similarity | Xiushui River | 0.64 | 0.68 | Xinjiang River | 1.36 | 1/20 |
| Xinjiang River | 0.88 | 0.87 | Ganjiang River (Saitang) | 1.33 | 1/20 | |
| Ganjiang River (Xiajiang) | 0.86 | 0.86 | Ganjiang River (Jian) | 9.56 | 1/20 |
Publisher’s Note: MDPI stays neutral with regard to jurisdictional claims in published maps and institutional affiliations. |
© 2021 by the authors. Licensee MDPI, Basel, Switzerland. This article is an open access article distributed under the terms and conditions of the Creative Commons Attribution (CC BY) license (https://creativecommons.org/licenses/by/4.0/).
Share and Cite
MDPI and ACS Style
Wang, H.; Cao, L.; Feng, R. Hydrological Similarity-Based Parameter Regionalization under Different Climate and Underlying Surfaces in Ungauged Basins. Water 2021, 13, 2508. https://doi.org/10.3390/w13182508
AMA Style
Wang H, Cao L, Feng R. Hydrological Similarity-Based Parameter Regionalization under Different Climate and Underlying Surfaces in Ungauged Basins. Water. 2021; 13(18):2508. https://doi.org/10.3390/w13182508
Chicago/Turabian StyleWang, Huaijun, Lei Cao, and Ru Feng. 2021. "Hydrological Similarity-Based Parameter Regionalization under Different Climate and Underlying Surfaces in Ungauged Basins" Water 13, no. 18: 2508. https://doi.org/10.3390/w13182508
Note that from the first issue of 2016, this journal uses article numbers instead of page numbers. See further details here.