
Retrofitting of Pressurized Sand Traps in Hydropower Plants
by
 , , and
Wolfgang Richter
1,*, 
Kaspar Vereide
2,
Gašper Mauko
1,
Ola H. Havrevoll
2,
Josef Schneider
1 and
Gerald Zenz
1 1
Institute of Hydraulic Engineering and Water Resources Management, Graz University of Technology (TU Graz), Stremayrgasse 10, 8010 Graz, Austria
2
Department of Civil and Environmental Engineering, Norwegian University of Science and Technology (NTNU), S. P. Andersens veg 5, 7031 Trondheim, Norway
*
Author to whom correspondence should be addressed.
Water 2021, 13(18), 2515; https://doi.org/10.3390/w13182515
Submission received: 30 July 2021
/
Revised: 4 September 2021
/
Accepted: 9 September 2021
/
Published: 14 September 2021
(This article belongs to the Special Issue Advances and Challenges in Hydropower)
Abstract
:Unlined pressure tunnels in sound rock, combined with pressurized sand traps at the downstream end, allow for low-cost construction of hydropower tunnel systems. This design concept is utilized in hydropower plants across the world. Currently, many such power plants are being upgraded with higher installed capacity, which may result in challenges with the sand trap efficiency. A physical scale model test, accompanied by 3D CFD simulations of a case study pressurized sand trap, has been studied for economic retrofitting. The geometric model scale is 1:36.67 while the velocity scale and sediment scale are 1:1 (same average flow velocity and sediment size in model and prototype). This is currently an uncommon scaling approach but with several advantages, as presented in this paper. Various options for retrofitting were investigated. A combined structure of ramp and ribs was found to significantly improve the sediment trap efficiency. The main novelties from this work are the proposed design of the combined ramp and rib structure. Secondary results include an efficient setup for physical scale models of pressurized sand traps and a methodology that combines the benefits of 3D CFD simulations with physical scale models testing for sand trap engineering and design.
1. Introduction
Pressurized sand traps in unlined water tunnels allow for low-cost construction of hydropower tunnel systems. This design is utilized in various hydropower plants (HPPs) across the world [1,2,3] and is possible in regions with appropriate rock conditions. The sand traps are placed downstream of the headrace tunnel or upstream of the tailrace pressure tunnels in case of pumped storage plants, protecting the hydraulic machines from damages [4,5,6]. The design is also possible for concrete lined tunnels where reservoir water level fluctuations, or other factors, render sand traps placed at the intake unfeasible. In contrast to sand traps placed at the intake that have free surface flow, the pressurized sand traps have pressurized flow, resulting in different hydraulic conditions. A benefit of the pressurized sand trap is that it can trap sediments from several different sources, such as sediments from the main intake, sediments from one or more secondary brook intakes, particles coming of the unlined rock walls due to operation, and sediment material from the invert fill, left from construction. Pressure tunnel excavation is usually on the critical timeline of high-head hydropower construction. Thus, the possibility to leave rock material on the invert after excavation allows for time reduction until the start of power production, which can be important for the overall project economy.
An alternative to pressurized sand traps in unlined tunnels is a complete cleaning of the blasted rock material, or partial removing of blasted rock combined with asphalt—or concrete—lining of the invert [7]. Asphalt lining has been realized in several unlined pressure tunnels, and a combined hydraulic roughness formula for this case is given in [7]. However, such strategies do not protect against new sediments entering from external sources, such as the main or secondary intakes. The design of existing HPPs with pressurized sand traps allows sediment to move through the tunnel and requires regular emptying of the sand traps, which are filled over time. Alternatively, in regions with very limited sediment inflow, it is also possible to construct a one-time use sand trap, large enough to capture all the inflowing sediments over the operational lifetime. Over many years, the amount of rock material originating from the construction period is reduced, and the emptying intervals increase. However, if existing HPPs are upgraded to reach a higher installed capacity and a more flexible operation, the sediments are again mobilized due to higher velocity, and this may also result in transport of even larger sediment grain sizes than were transported previously. Currently, global warming intensifies weather extremes, and thus, flooding events with higher sediment inflow to hydropower intakes. For this reason, it may become necessary to retrofit pressurized sand traps in existing HPPs. In a recent study, power plants, accounting of a total installed capacity of almost 8000 MW, amounting to over 25% of the total installed capacity in Norway, are reported to have experienced sediment related problems [8]. Several of these HPPs have sand traps that are not functioning and require retrofitting.
This article presents methods and results from developing and testing cost-efficient solutions for retrofitting existing pressurized sand traps in HPPs. Two different methods have been utilized; (i) physical scale modeling at scale 1:36.67, together with (ii) transient 3D CFD, both with and without particle tracking modelling. The work has been performed for the case study of the 960 MW Tonstad HPP located in southern Norway. Damages to the turbines caused by sediments have been reported and associated to an upgrade of the installed capacity in the power plant [9]. The sand trap no. 3, as illustrated in Figure 1, has been subject to previous research studies and was, for a period, equipped with ADCP velocity profilers to evaluate the flow conditions with 3D CFD [10,11]. This sand trap has also been the case study for a physical scale model test of geometrical scale 1:20 and Froude similitude at NTNU, as reported in [12].
Figure 1 presents the Tonstad HPP, which has two main intakes and eight secondary brook intakes, an unlined pressure tunnel system with three pressurized sand traps. The total tunnel system is comprised of over 30 km of unlined tunnels where rock material, used as a construction road, was left inside the tunnel after commissioning. The figure illustrates the schematic geometry of the three surge tanks, of the two chamber types, which were constructed in conjunction with the three pressurized sand traps downstream. The original power plant was completed with four turbine units (M1-M4), with a total of 640 MW, in 1972. In 1988, an upgrade of the power plant, with an additional unit (M5) with 320 MW, was commissioned. An additional surge tank and pressurized sand trap was added during the upgrade. Thus, machine no. 5 controls the discharge through pressurized sand trap No. 3, which is the case study for this work. A separate sketch in Figure 1 visualizes the design of the original sand trap and includes the proposed retrofitting, with ribs and ramp, in the green color.
As can be seen from Figure 1, there are several benefits of pressurized sand traps at the downstream end for the Tonstad HPP. This design avoids the need for smaller sand traps at each of the two main intakes and at the eight secondary intakes, in addition to the need to manually clean the invert, of the over 30 km of unlined tunnels. The three pressurized sand traps (one for each pressure shaft) are also easier to operate and maintain, as they are located together in close vicinity of the power station and available infrastructure. Each sand trap is equipped with a gate that allows individual dewatering instead of having to dewater the entire tunnel system.
Scope of Work
The main scope of work has been to develop and test different solutions for the retrofitting of existing operating pressurized sand traps. A secondary scope has also been to develop and test new methods for the design and engineering of pressurized sand traps.
The success criteria for retrofitting are described in the following. The main criterion is to increase trap efficiency as much as possible with limited costs. For retrofitting in operational hydropower plants, minimizing the necessary time to take the power plant out of operation (outage) is a crucial aspect concerning costs. Thus, the retrofitting demands for a short installation time that can be planned to a convenient time period with expected low power prices and/or runoff. Another success criterion is that the retrofitting should be adaptable to the existing geometry without the need for expanding the excavation volume. Rock blasting for deepening, or expanding, the sand trap exhibits a certain risk to existing structures. Finally, the retrofitting should also allow for installation of modern automated flushing systems to reduce operation and maintenance costs, as well as allowing increased flexible operation.
2. Methods and Materials
2.1. General Description of the Methodology
The case study of the pressurized sand trap in the Tonstad HPP has been investigated with field measurement in the prototype, 3D CFD simulations and physical scale model tests. These methods have different strengths and weaknesses, and the combination has been necessary to obtain credible results. Field measurements give insights into the real-world behavior of the pressurized sand trap but are expensive and require complex measurement approaches. Thus, can only provide a relatively limited amount of information. Pressurized sand traps are difficult to monitor owing to limited access and the large dimensions. The following field data has been used to validate the 3D CFD and physical scale models flow field and how well they recreate the deposition pattern for sediments inside the sand trap; (i) samples of the deposited sediments obtained during dewatering, (ii) a 3D scan of the unlined rock geometry of the sand trap and velocity profiles from three acoustic Doppler current profilers (ADCPs), presented in [10] and [11], (ii) finally, time series with operational data with turbine discharge from a five-year period, provided by the power plant owner. The geometry for the 3D CFD and the physical scale models are simplified to reduce the necessary simulation and construction time and to make the results more generally valid. For this reason, the geometries are based on the plan drawings for the excavation of the original sand trap. It is noted that the concrete lined sections are modelled accurately (construction drawing and 3D scan are similar) and that the main error is the missing overbreak and roughness of the unlined sections.
A versatile method, 3D CFD simulations, can generate information on various aspects of the pressurized flow, such as for sand trap hydraulics. The selected simulation tool, Ansys CFX, has been applied successfully to several hydraulic structures with pressurized flow [13,14]. An unlined rough walled hydropower tunnel is studied in terms of RANS CFD simulation in [15]. In this study, 3D CFD has been used to study the transient flow patterns, shear velocities along the invert, and via particle tracking simulations discrete sediment paths of a large range of grain sizes during the transient flow. Owing to the limited information from field measurements, it is challenging to sufficiently verify a 3D CFD model. In this work, 3D CFD has, primarily, been used to generate indirect information such as flow velocities, shear stress, and particle movement that can be interpreted to quantify the effect of different retrofitting solutions. Additionally, 3D CFD was used before constructing the physical scale model to assess several retrofitting solutions and select only some of the for physical scale modelling. Owing to the large prototype scale of the sand trap and the demand for transient simulations, the mesh sizes have been tuned to meet an acceptable balance of calculation time to also address an economic engineering of such structures with the utilized methods.
It is pointed out that the 3D CFD simulations conducted in this work are based on RANS turbulence modelling and with a simplified geometry based on the construction plans to reduce the computational costs. This approach was chosen since a large number of simulations were to be conducted and since the 3D CFD has been used as a descriptive method to study the flow and transient bottom shear stress, as well as intermediate method to screen various retrofitting options that are thereafter forwarded for physical model testing.
Finally, physical scale modelling has been used to more directly assess the trap efficiency of some selected retrofitting solutions. In general, physical scale modelling is regarded as more credible as 3D CFD owing to real world physics and less potential error sources. Based on the physical scale modelling, the effect of the tested retrofitting options on the trap efficiency has been quantified.
Physical scale modelling of pressurized sand traps requires correct scaling of both the hydraulics and the sediment movement. Historically, Froude scaling, combined with Shields scaling, has been the preferred scaling method. In this work, a 1:1 flow velocity and 1:1 sediment size scaling has been attempted. This scaling method has been reported as successful for a previous study of a pressurized sand trap [16]. In addition, it has been attempted to reduce cost and time effort of the physical scale modelling by constructing the model within a standard experimental flume with an internal width of 30 cm. The physical scale model geometry was additionally simplified compared with the 3D CFD for practical purposes and to refer the geometry to the construction drawings and to make the results more generally applicable.
Figure 2 presents the geometry of the case study and compares (i) the geometry from the construction drawings that was used for 3D CFD simulations, (ii) the 3D scan of the as-build structure, and (iii) the geometry of the physical model test.
The prototype unlined pressurized sand trap has been excavated with the drill and blast method, resulting in rough wall surfaces. Therefore, rough walls were considered with a rough wall model in the 3D CFD simulations. The roughness of the unlined walls was not considered in the physical scale model, built partly with glass (the existing flume walls) and acrylic glass inlays (the crown). The invert of the prototype sand trap is concreted and thus accurately modelled with the roughness of the red plastic.
The inlet section, the invert, and the outlet section of the prototype are concrete lined. The inlet section holds gate slots, where a 4 × 7 m roller gate, designed for 81 m hydrostatic head is used when draining the sand trap for inspection and manual removing of the sediments. The design of the integrated gate in the surge tank, separating the headrace tunnel and sand trap, also enables for separate inspections of the steel lined pressure shaft. This allows different inspection and distinguished maintenance intervals for the various water way sections and is typical in the Norwegian high-head design philosophy. The sand trap can be entered via an access tunnel and a gated plug, with a 4 m diameter steel gate. The main chamber has a length of 160 m and a design flow section area of about 119 m2. The design discharge is about 80 m3/s, resulting in a theoretical average flow velocity of 0.67 m/s in the main chamber in the middle of the sand trap. However, the inlet section has a flow section area of only 28 m2 owing to the gate, creating an average jet flow velocity of 2.86 m/s at the inlet to the sand trap, resulting to a significant flow velocity ratio of about 4.3 (-) between the inlet jet and the main sand trap chamber flow. The presence of the jet has significant influence on the sand trap behavior and its efficiency. However, the integration of the gate allows for quick and convenient access to the sand trap. The placing of the sand trap downstream of the surge tank avoids the exposure to mass oscillation and thus, avoiding more adverse flow conditions. The unlined rock roughness of 300 mm equivalent sand grain roughness compares to Strickler value of 32 m1/3/s, Manning 0.03125 s/m1/3, respectively, Darcy friction factor 0.052 (-).
Table 1 compares the key parameters of the different methods. The key parameters for the physical scale model test are the geometric size and the discharge. The 1:1 prototype dimension were kept for flow velocity and sediment size. The numerical simulations were conducted in prototype geometrical scale.
2.2. Prototype Observations
The prototype pressurized sand trap is manually emptied with excavators and trucks once a year. The observations from inside the sand trap, after dewatering and before emptying of sediments, show that the sediments are separated in grain size and accumulate at mainly two places; (i) a gravel deposition at the upstream end, directly downstream the diffusor and (ii) a sand deposition at the downstream end in front of the weir. Furthermore, sediments were found downstream the sand trap and on the top of the pressure shaft, indicating that sand is transported through the sand trap and into the turbines [18].
The design discharge of the sand trap is 80 m3/s, while 65 m3/s and 55 m3/s are observed as average and lower discharge from operational data from the power plant. One may note due to high flow rates that Tonstad hydropower plant is operated nearly as run of river power plant. Some opportunities for peaking operation in the low flow season owing to the capacity of the upper reservoir compared with inflow are utilized. The prototype was previously equipped with three ADCP velocity placed horizontally at three different sections, and the measurements are presented in [10].
2.3. Numerical Simulations with 3D CFD
The numerical simulations were conducted with Ansys CFX 2019 R3 as transient RANS simulations. The geometry was simplified and based on the construction drawings with plan surfaces. The roughness was accounted for with a wall roughness model and ks of 300 mm. 3D CFD simulations with simplified rough walls have been applied by the Authors previously [19] and found good comparison with the ADCP field measurements from the prototype [10]. This gives confidence in the chosen modelling approaches and assumptions in the present paper despite the simplifications.
The simulations were made in full geometry to capture 3D effects and study the influence of the diffusor and the access tunnel. A separate 3D CFD simulation with upstream geometry was generated to provide the inflow conditions. This was necessary to capture the complex inlet geometry, the upstream geometry of the pressure tunnel with bifurcation and the surge tank geometry, and at the same time reduce the necessary model domain for the large number of simulations. The inlet boundary for the main simulations is the concreted inlet to the gate section.
The 3D CFD simulations were used to study the existing situation, and thereafter for initial testing and screening of several different retrofitting solutions. The sediment settling conditions have been analyzed through three methods; (i) comparing the flow characteristics, (ii) comparing the wall shear stress along the invert, and (iii) particle tracking simulations.
The flow characteristics have been quantified through isosurfaces of selected characteristic velocities, such as 1 m/s that visualize the transient flow complexity. In this way, it is possible to quantify how far into the sand trap the high velocities from the inlet reach before dissipated, and the sand trap flow becomes uniform. Due to short diffusor length of 31.5 m, and the uneven velocity distribution from upstream approach flow, the jet was expected to have a significant predominance in the upstream section of the sand trap and reduce the trap efficiency.
The wall shear stress on the sand trap invert has been used to evaluate the potential for sediment transport. The applied calculation of wall shear stress is defined in the user manual for Ansys CFX [20]. Transient simulations with time steps of 0.2 s were applied. The results have been compared with literature values for sediment transport for different wall shear stress values [21].
Finally, particle tracking simulations, with grain density of 2650 kg/m3 and the drag modelling after Schiller [22], have been applied with RANS turbulence modeling [20]. Simulations with both one-way coupling (no collision of particles) and two-way coupling (with collision of particles) have been tested. A range of sand particles from 0.3 mm to 1.0 mm were added to the domain at a section in the crown at the gate. This inlet location was selected to be conservative compared with the prototype, where some of the sediments may be assumed to enter as bed load. This input section differs from the input of sediments in the physical scale model owing to the chronological order of the work and the purpose of finding engineering solutions. The simulation time was chosen to allow a full passing of the sand trap during the transient flow simulations. A relative flow through factor has been introduced; 1.0 [–] means one-time flow through the main sand trap main chamber (160 m length/average flow velocity). Collision of particles (two-way coupling) as well as accumulation effects were not accounted for in the main simulations.
Before simulations with the prototype geometry, the settling of particles in the simulations has been tested with simulations of a simplified ideal box geometry to compare simulation results with literature values [23]. It was found good agreement with settling velocity and settling gradient between literature values of quartz spheres [24] and the 3D CFD.
Figure 3 presents the approach flow geometry of the prototype that was simulated to obtain the inflow boundary conditions for the main simulations. It was chosen to simulate this separately to limit the computational domain and computation time in the large number of simulations. The inlet boundary of the main simulations was the gate section and the outlet boundary was the start of the steel pipes in the pressure shaft. The most characteristic flow sections and the associated flow velocities in model and prototype are also presented. The gate constriction is located directly under the surge tank shaft to allow the combined utilization of a gate shaft and surge shaft.
2.4. Physical Scale Model Test
The physical model test is in geometrical scale 1:36.67, based on the dimensions of the available flume and the width of the construction drawings of the sand trap. The construction drawings were used as a basis for practical purposes and to make the results more generally applicable. For the same reasons, the physical model test geometry also includes additional simplifications, such as eliminating the access tunnel and the section transition to the rectangular flow section at the downstream with the trash racks entering the pressure shaft. The rough walls of the prototype deviates from the model construction, except for the concrete invert. The simplifications of the geometry were checked by comparing with 3D CFD simulations with and without the access tunnel and the correct downstream geometry and found to be have neglectable effects. The simplifications allowed more straightforward focus on the most significant hydraulic effects of the sand trap behavior and a more economic and time-effective physical modeling. Finally, the simplifications made the geometry more general resulting in more generally applicable results.
The model test was constructed in an experimental flume at Graz University of Technology. The flume walls were used directly as the walls of the pressurized sand trap, whereas the crown is made as a suspended acrylic glass cover that can be lifted conveniently for modifications. Pressurized flow is ensured by separation of the upstream with a high wall and the full submergence of the sand trap chamber. Hence, the model setup is analog to a culvert with outflow control. This aspect has several advantages for the construction and operation of the model test with high safety against breaking, which is a common threat for acrylic glass models. The suspended crown elements can be quickly removed for modifications and trapping efficiency measurements, as well as enhancing the deaeration at filling. Above the crown, designed as submerged acrylic glass elements a constant water level provides constant pressure boundary conditions. The bottom of the model test with red plastic makes sand particle movement more visible. The outlet of the flume is realized by adjustable vertical lamellas, providing a constant loss to ensure a suitable outflow velocity profile and steady state flow conditions of the experiments. The filling process is a transient procedure with deaeration and adjusting the flow to the design discharges. This model test setup allows to adapt quickly to new boundary conditions.
Since no gravity waves or free surface flow are present in a pressurized sand trap, no Froude scaling is demanded. Therefore, Euler, in addition to Reynolds number, is regarded as the most relevant dimensionless numbers for the hydraulics. Euler similitude gives a correct scaling of pressure forces and pressure loss, which is a direct effect of velocities and turbulence. Furthermore, the inertia is a driving force for sediment transport. Reynolds similitude gives correct scaling of the viscous forces in relation to the inertia forces. Only one previous publication [16] has been found with previous experience for sand traps with the scaling method applied in this work, and additional work for further validation. However, the results presented are promising.
The chosen 1:1 velocity scaling and 1:36.67 geometry scaling results in Euler similarity. The Euler number is calculated with a characteristic pressure, in this case, the head loss. According to the calculation of the Euler number shown in Equation (2), similarity is achieved if the head loss of the model and prototype is equal, since water density and water velocity is 1:1. As the local loss parameter (-) is geometry dependent and therefore equal for prototype and model test, the local head loss becomes equal with 1:1 velocity scaling. In addition, the friction losses are scaled correctly when the relative roughness (roughness height / diameter) is equal in model and prototype. This is, approximately, the case for acrylic glass and concrete for the selected geometry scaling factor of 1:36.67, resulting in approximately equal friction losses in model and prototype. The main deviation from an ideal Euler scaling is the unlined tunnel shape and friction of the wall and crown of the tunnel (only the invert is concrete lined). However, as the main head loss results from the singular loss at the inlet, and the roughness of the invert where the particles are transported is correct, this deviation is expected to have limited influence. Characteristic numbers for the model scaling are present in Table 2.
where ζ is the singular loss factor, hs is the singular head loss and ΔP is the total head pressure loss through the sand trap (Equations (1) and (2)). The jet flow through the inlet is a decisive component of the flow and sedimentation behavior of the sand trap. The scaling of singular losses is dependent on the Reynolds number (Re). The model test flows were Re > 105 (-), allowing us to assume independence from Reynolds number [25]. As the singular loss zeta value is geometry dependent, the 1:1 velocity scaling is equal in model and prototype.
It can be seen, from Table 3 that the friction factor for concrete and acrylic glass is also scaled correctly. However, the friction of the unlined rock surfaces on the walls and in the crown of the sand trap, are not scaled correctly as this was not prioritized in the present study. It is assumed that this has a minor effect on the sediment trapping compared with the inflow jet and the invert roughness. For Q = 80 m3/s the friction loss of the unlined walls was estimated to about 0.018 m, which is regarded as insignificant compared with the total head loss of 0.12 m for the entire model.
Table 3 lists the investigated model test properties compared to the prototype. The dimensionless Euler number, Shields number, and particle Reynolds number are equal in model and prototype. This indicates that the 1:1 velocity and sediment scaling is representative. Note that the friction factors are based on the concrete invert, and that the unlined tunnel walls and crown results in a minor scaling error, as discussed in the previous paragraph. The sediments are in prototype size, with a selected range of 0.3–1.0 mm for the main investigations. This range was selected as the design limit diameter lies within. Smaller sediments were unnecessary as they all directly escape by suspended flow, and larger sediments are unnecessary as the settle quickly.
A separate test with gravel size particles was conducted to study if this material, which would settle during normal operation, would move and be transported during a drawdown of the water level and free surface flow. This test is not reported in detail in this paper as it is out of scope, but a minor summary is given in the results chapter.
Equations (3)–(6) describe the calculation of the Shields parameters. One must note that the Shields diagram is only valid for a fully developed turbulent velocity profile with free surface flow. Vertical velocity components increase significantly the sediment resuspension capacity [26], and this is observed in the model tests. The inlet jet flow creates a disturbed velocity profile persistent over the full length of the sand trap, both in model and prototype. However, the Shields number is a non-dimensional expression of the main parameters influencing sediment transport, and hence, the comparison of Shields numbers in model and the prototype gives an indication of the model accuracy.
Since the Shields number, particle Reynolds number, and Euler number are equal in model and prototype for the 1:1 velocity and sediment scaling, the authors argue that this approach may be more accurate compared with the more usual Froude scaling approach, where these dimensionless numbers are not similar in model and prototype without additional scaling techniques, such as lightweight sediment material, that introduce additional scaling errors. The 1:1 sediment scaling also mitigates the problem of cohesion is natural material is used [27].
The 1:1 velocity and sediment scaling approach appears to be less known than the use of Froude scaling of velocity and sediments, but previous similar experiments have been reported to be successfully conducted and applied [16]. The settling of particles in still water is also well understood [24], and the 1:1 scaling method adheres to the requirement of 1:1 water velocity to fall velocity according to the design criterion by Camp [28]. Another benefit of the 1:1 velocity is less scaling error in terms of viscosity to inertia forces (Reynolds number and particle Reynolds number) compared to the velocity obtained with Froude scaling as settling of sediments is significantly influenced by the viscosity.
Figure 4 presents the model setup in the flume with 30 cm internal width and the complementary representation in the prototype. Sand was injected through a probe at the inlet and is transported, in suspended flow, through the inlet of the model. Sand was put into the system via 0.5 l cups of sand with grain size 0.3 to 1.0 mm. This was chosen to be conservative compared with the prototype, where much of the sediments may be expected to enter as bed load. The sediment injection differs to the 3D CFD simulations. The physical scale model was constructed after the 3D CFD simulations were initiated, and it was then found not practically possible to make it similar in detail. The results from the two methods are therefore not directly comparable. However, the main outcomes, such as the effect of the jet are comparable. Future work is recommended to make direct comparisons with model scale 3D CFD.
The results from the physical scale model tests were quantified with the trap efficiency. Since the inflow volume of sediments (Vin) arriving through the inlet is known, only the outflow volume (Vout) passing the outflow weir needs to be measured. The trapped material is collected and measured as a control of the volume balance. The measurements from the model tests were volume based, and the trap efficiency η (-) is calculated as η = (Vin − Vout)/Vin. An advantage of the 1:1 velocity scale model is the equal local loss between physical scale model and prototype, since the geometric hydraulic loss parameter hs is independent of scale, but of relation with the velocity (Equation (1)), measured as water level difference upstream the inlet and the still water level at steady state condition (Figure 4).
2.5. Tested Retrofitting Options
The following options for retrofitting have been tested in the physical scale model: (1) Modifications of the diffusor geometry downstream the inlet gate assumed to potentially reduce the negative impact of the inflow jet. (2) Flow calming structures to improve the diffusor flow and the negative impact of the inflow jet. The flow calming structure has been placed downstream of the diffusor. A special aspect of the design is that it shall be passable for machinery and personnel during inspection and maintenance of the sand trap. Figure 5 presents the design tested in the physical model and the placement. (3) Weir heightening by doubling and tripling the weir height in the downstream end of the sand trap at the transition to the steel lined pressure shaft. This was chosen to test if a larger weir would make it more difficult for sediments to pass into the pressure shaft. (4) Ribs with 1 m width and a gap of 1 m between them to separate the settled sediments from the water flow to avoid resuspension. (5) Ribs combined with a ramp.
Several options had the entire length of the sand trap covered with ribs, and only a minor section with ribs was tested in CFD and physical model tests. For the option with only a minor section with ribs, alternatives with and without an upstream ramp were tested (Figure 5). Pictures of some of the alternatives are presented in later chapters.
3. Results
The results from the different methods are presented in the following subchapters: starting with 3D CFD of flow characteristics, followed by 3D CFD for wall shear stress, 3D CFD with particle tracking modelling, and finally, the results from the physical scale modeling. Results from analytic calculations with the Shields diagram are also presented in relation to the wall shear stress section.
3.1. 3D CFD Simulations of the Flow and Wall Shear Stress
Transient flow simulations are applied to assess the effect of the jet flow created by the gate constriction. The jet results in higher velocities that extends significantly into the pressurized sand trap and results in higher turbulence over the entire length. The impact of turbulence creates transient wall shear peaks that have the capacity of transporting the particles all the way through the sand trap. A snapshot of an isosurface with 1 m/s velocity (Figure 6a) visualizes the transient behavior of the jet and its flow complexity. Due to the short diffusor length of 31.5 m, and the uneven velocity distribution from upstream approach flow (Figure 6b) the jet shows a significant predominance in the upper half of the main cross section. This creates a backflow zone in the lower half and a highly turbulent, transient diffusion of the jet.
Another design feature in the existing sand trap that is negative on the settling conditions is the transitions from the concrete lined section to unlined part. This transition zone is, in this case, too abrupt and results in a sudden expansion for the hydraulics (Figure 6b). The approach flow condition influencing the jet has been previously simulated and applied as a boundary condition for the main simulation (Figure 6b).
Based on the simulated flow, the wall shear stress on the invert has been calculated in Ansys CFX. The transient 3D CFD simulation shows a highly transient behavior of the shear stress. The peak shear stress is found to be more than 3 N/m2, which can move even fine gravel particles as bed load according to [21] (Figure 7). This shows that the transient nature of the dissolving jet, from the inlet constriction, can sweep particles on the bottom all along the sand trap length. The inlet jet depends also on the upstream approach flow as indicated in Figure 7. In addition, the local effects of the access tunnel create flow vortices with locally increased bottom wall shear stress.
The effect of the jet flow is evident over the entire length of the sand trap, dissipating gradually (Figure 8a). The dissolving jet flow is directly impacting the capacity of sediment transport on the sand trap invert. For the transient simulations, significantly higher wall shear stresses can be seen compared with the mean shear stresses (Figure 8a,b). Maximum shear stresses of >2.4 * average shear stresses result in a much higher sediment transport and resuspension capacity compared with calculations done with average values. The peak wall shear stress spots are moving with the flow in a transient manner along the bottom. Thus, for pressurized sand trap designs with gates, the effect of a flow constriction is significantly decreasing the trap efficiency.
The results of the 3D CFD, in Figure 8, with the empty sand trap, can be used to qualitatively predict the bed load sediment transport and the transient flow behavior. It can be deduced that the impact of the jet is significantly influencing the flow and, therefore, the trap efficiency.
Following the assessment of the prototype jet flow situation, 3D CFD was applied to test different retrofitting solutions. Several options for structural modification of the inlet section, including modification of the existing diffusor and introduction of flow calming structures, were tested with the goal to evenly distribute and dissipate the jet to improve sediment settling. The tests found only minor improvements for retrofitting of the existing diffusor, and this option was therefore not put forward for physical model testing. The most promising solution to mitigate the jet flow was flow calmers, and this was put forward for physical scale model testing, presented in the physical modeling chapter.
3.2. 3D CFD Simulations with Particle Tracking Modelling
The 3D CFD simulations, with particle tracking modelling for each grain, were conducted for the construction drawings of the pressurized sand trap. The injection of particles is placed at the gate section, as shown in Figure 6b. This input section differs from the input from the in model test. However, it represents an unfavorable section to meet uncertainties in the prototype by applying a safety assumption on the boundary condition. As expected, larger grains of up to 1.0 mm sink faster compared with the smaller particles of 0.3 mm (Figure 9). Smaller grains are found to pass the sand trap without settling. The settling gradients vary in angle depending on the particle diameter and the encountered flow. The complexity of the particle movement can be seen.
In the field measurement from the prototype, gravel size sediments were found directly downstream from the turbulent backflow zone after the inlet diffusor section. The middle section of the invert of the sand trap was mostly free of sediments, indicating that the sediments here are continuously transported. At the downstream end, sand size sediments were found.
From the numerical simulations with particle tracking modelling, the pressurized sand trap was found to have a trap efficiency of 100% for 1.0 mm for the simulated timespan. The particles started as suspended load, transferring to bed load, until they finally settled on the invert, relatively evenly distributed compared with the prototype. After settling, the particles were not resuspended, which is regarded as a severe modelling limitation when compared with the physical model test observations. Most of the sediments with diameter 0.3 mm escaped directly as suspended sediments in the simulation (Figure 9).
A vortex flow with a drag effect can be seen in the area around the downstream weir. Figure 9 shows the result of the transient flow simulation, with particle tracking modelling of a grain size distribution of 0.3 mm to 1.0 mm after 300 s, representing a flow through factor of 1.26 [–]. Larger particles above about 0.7 mm reach the bottom upstream of the weir. The inlet jet and diffuser can be seen to create a complex 3D flow field, significantly impacting the settling efficiency of the sand trap.
As can be seen in the next chapter, the physical model tests indicate a trap efficiency of 0% for 1.0 mm grains in the prototype. This is in contrast to the observed 3D CFD simulations results and highlights that particle tracking models for sand traps need to be applied very carefully, adding interpretation of accumulation and evaluation of the bed load transport accordingly. Significantly longer simulation times are advisable. Bed load transport can be calibrated, but resuspension of particles seems to be not modelled correctly with the applied turbulence and particle tracking modelling. However, the particle tracking modelling tools, in combination with qualitative assessments, such as bottom shear stress, can predict the behavior of suspended flow and the impact of inflow conditions and/or other geometric obstacles. If trapping zones without the possibility of resuspension are studied, the particle tracking modelling can predict the limit grain size that is able to settle, as well as the trap efficiency.
The 3D CFD with particle tracking modelling was thereafter used to test some of the retrofitting options. The simulations showed, similar to the simulations of flow and wall shear stress, that modifications of the inlet diffusor did not have a significant positive effect. The simulations suggested that calmers in the inlet section should have positive effects on the jet flow dissipation. Several other retrofitting options, including lowering the entire invert to increase the flow area, baffles on the invert, to guide the flow velocities close to the invert, were also tested [8,29]. These were found to have a moderate positive effect, but not sufficient enoughly to be investigated further in the physical model test.
3.3. Physical Scale Model Tests
The physical model tests reveal that the particle transport in the sand trap is influenced by several mechanisms in addition to the aforementioned jet and sudden expansion between concrete and unlined rock, resulting in a turbulent backflow zone and lifting the particles back into the main jet. Further downstream, particles are settling to the invert and are transported as bed load until local turbulent vortices possibly lift particles back into suspension (resuspension). Directly upstream, in front of the weir, particles accumulate before they are transported over it after a retention time and dune developing. Finally, transient vortices generated in the corners between the weir and sidewalls lift particles at high rates over the weir (Figure 10).
Model test parameters are presented in model scale, with prototype scale in brackets. Model tests of the prototype geometry show that 100% of the 0.5 L (24.65 m3) particles are transported over the weir after 180 s (1.8 h) at the design discharge of 59.6 L (80 m3/s), resulting in 0% trap efficiency. This is in strong contrast to the 3D CFD results.
A test was also conducted with gravel size particles (5–30 mm). These particles were found to accumulate immediately downstream the diffusor (Figure 11a), where such material is also found in the prototype. In the model, the gravel escapes the recirculation zone over time by transient flow effects and is transported further downstream towards the weir (Figure 11b).
Following the results from the four (1–5) retrofitting options presented above: (1) the geometry modifications of the diffusor were not tested in the physical scale model, since the 3D CFD indicated that it would not have any significant effect. (2) To mitigate the impact of the inlet jet, a flow calming structure was tested, both in 3D CFD and physical modeling (Figure 5). The design considers a seamless construction from the invert up to the crown. The pressurized sand trap was found to have a limited head loss of 0.12 m in prototype scale, which was measured in the model test by water level difference between inlet and free water surface of the submerged section. The flow calming structure in the physical test was found to have a limited addition to the local loss but more important adverse effects on the sediment transport; (i) the passable approach, with separated positioning, shifted the sand transport to one predominant side of the bottom, and (ii) a reduction in sand trap effectiveness could be observed. It is believed that the flow calming structure creates additional turbulences downstream by increasing the local and transient resuspension vortices. Thus, it can be concluded that the investigated design is not favorable to improve the sediment behavior. The adverse effect on the trap efficiency was also found in [30] with a different flow calming structure design.
(3) Weir heightening, with double and triple height, was studied. However, 100% of the particles were still transported over the weir, primarily by the strong vortices generated in the corner between the weir and the sidewall (Figure 12).
Finally, an effective improvement of the trap efficiency of sediments upstream of the weir was found. First, a rib installation (4) with open end towards the flow showed some increased retention time of the particles, but still, 100% of sediment were flushed (Figure 12). However, the final design consisted of a structure of combined ramp and ribs (5) (Figure 13). The ramp has an inclination of 4.5° (8%). The ribs are sharp edged with a width of 1.0 m and open gap of 1.0 m. Only a short section in the downstream end of the sand trap was found necessary, allowing quick and effective retrofitting of an existing sand trap that can be adjusted to various geometries. Equipping the system, additionally, with a slotted pipe sediment sluicing system [31] allows inclusion of automated flushing in combination and is foreseen in further investigations.
With this design, the trap efficiency increased from 0% to 87% in the model tests. The trap efficiency was not found to increase further when adding more than four ribs. However, the sediment storage capacity will increase with additional ribs and will reduce the necessary time intervals between emptying the trap. By including a flushing system, the necessary size of the trap can be reduced to a minimum, since emptying can be done even during normal operation of the power plant.
The design with ribs and ramp was also tested with gravel size particles and a drawdown of the water level, resulting in free surface flow. Such conditions are known to have occurred in the prototype, resulting in severe gravel transport and damages to the turbine [9]. With the ribs and ramp structure, the gravel was also safely trapped before being transported over the weir.
4. Discussion
4.1. Comparison with Shields Diagram
Calculations of the dimensionless shear stress (Shields parameter) and particle Reynolds number are done for selected flow situations for the existing prototype geometry to assess the results. As described in the methods chapter, the Shields diagram should be used with care, and it is developed for steady-state uniform free surface flow. However, it will give an indication on whether the results are within the expected limits. The calculations are first done with average theoretical values assuming a perfect uniform flow, and thereafter, the bottom wall shear stress from the 3D CFD simulations results. Figure 14 presents the Shields diagram with marked data points for selected flow conditions in the prototype. The first two values are for situations in prototype, with and without the inflow jet for comparison. The wall shear stress for the case with the inflow jet is taken from the 3D CFD, while the wall shear stress, without the inflow jet, is the ideal average value from calculation with Equation (3). The Shields parameters are plotted for a particle diameter of 1.0 mm. From Figure 8 it can be seen that the jet from the gate constriction creates increased local velocity peaks with up, and above, around 1.5 Pa, compared to 0.62 Pa without the inflow jet, for theoretical average flow velocity. The 1.5 Pa bottom shear stress occurs transiently over time, throughout the entire length of the sand trap, excluding a very short section upstream the weir, seen to correspond to the area of accumulated sand in the prototype. The third value shows that the increased bottom shear stress, caused by the inflow jet, renders particles of 2.0 mm diameter to be slightly above the Shields curve, indicating that this is approximately close to the limit particle size for transportation and local resuspension. Two data points, representing the upper bound for prototype bottom roughness ( = 2.0 mm) and the lower bound of the model bottom roughness (= 0.015 mm), indicate the maximum theoretical range of the Shields parameter. The results show the significant impact of the jet from the gate constriction on the sediment transportation capacity. The observed average discharge of 65 m3/s and minimum discharge of 55 m3/s in the prototype are shown and indicate a transportation of the 1.0 mm grain, fitting to the observation of significantly clear areas at the invert of the sand trap and upstream from the accumulation zones. Finally, the lower and the average value of discharge are plotted, indicating that the 1.0 mm sand grain is transported by the jet influence. This fits well to the observation in the prototype, due to the absence of sand accumulation between the weir and the diffusor.
New research with sand particle movement related to the Shields curve suggests that inception is likely to occur even within a range below the curve [36].
4.2. 3D CFD Simulations
3D CFD simulations should be further developed and tested as a design and engineering tool for hydropower sand traps. The main limitation encountered in this work is the resuspension, as observed in the physical model test. To accurately model the resuspension, significant efforts in turbulence modeling and increased special invert resolution or higher turbulence modelling techniques may be necessary to resolve local large eddies and vortices that can lift particles. The particle model must also allow for such resuspension. It can be concluded that, for 1:1 scaled simulation, sufficiently long time spans are necessary. The observed flushing in 1.8 h prototype time would have demanded 6480 s in 1:1 3D CFD simulation with particle tracking. Thus, scaled 3D CFD, with particle tracking, appear meaningful and are suggested for further investigations as presented in [19].
Simplifications such as the rough wall modelling on the smooth plan design geometry for the roughness of the unlined rock, RANS turbulence modelling, and a relatively coarse mesh have been applied. The mesh resolution has been selected based on previous calibration and focused on acceptable computational time. It is highlighted that the 3D CFD has been used as a complementary method in combination ahead of the physical scale modelling, and the 3D CFD accuracy has, therefore, been regarded as acceptable in relation to the computational efforts. However, comparison to prototype measurements [29] and ADCP measurements, presented in [10], show a reasonable accuracy, as well as the computed transient bed shear stress could explain well the prototype observations of the sand particle transport.
The simulations were found very useful to assess the effect of the inflow jet on the sediment transport through the wall shear stress along the invert of the sand trap. Transient 3D CFD RANS simulations can predict transient wall shear quantities, allowing realistic understanding of sediment bedload transport potential. Resuspension could not be directly simulated, but the particle movement on the invert in the simulations may potentially be calibrated with empiric parameters. The shear stress values can also be interpreted with the Shields diagram to predict the sediment sizes that will be transported and respectively resuspended through the pressurized sand trap.
The 3D CFD shows that, in the present case study, the inlet jet is creating significant turbulences, activating resuspension of particles over, potentially, the entire length of the sand trap. The jet resulted in significantly higher wall shear stress peaks along the invert of the sand trap, compared to a situation without the inflow jet. This effect explains the absence of sand deposited along significant length in the prototype. Gate constrictions that generate significant jet flow situations should be avoided in future sand trap design.
The 3D CFD results was used to test several different retrofitting solutions, and was used for screening and selection of a few solutions for physical model testing. In general, it was found that the 3D CFD was too positive, as it indicated that the improvement suggestion of flow calmers would have a significant positive effect, while the later physical model tests disproved this. These simulations were run without particle tracking modelling. It was not observed that the opposite of the 3D CFD was too negative, but this was also not part of the scope of work.
4.3. Physical Model Tests
The 1:1 velocity and sediment size scaling approach, for multiphase physical model tests of pressurized sand traps, was found to give realistic results compared to prototype observations. Furthermore, the approach gives valuable insights of the sand trap settling behavior. Specifically, the effect of the inflow jet, and the visible resuspension of sediments, is regarded as vital information of how sediments are remobilized after initial settling.
The 1:1 scaling shall, in theory, give an accurate representation of the inlet jet, owing to a sufficiently high Reynolds number of > 105 (-) [25]. The 1:1 velocity and sediment scaling also results in Euler and approximate Shields similitude when combined with appropriate geometrical scaling of the surface roughness.
The main error of the model setup is incorrect profile geometry and roughness for the unlined rock surface of the wall and crown of the prototype. However, since the main head loss is generated by the inlet jet, and the most important particle interaction is at the concrete invert and in the inlet jet, the neglected effects are evaluated to be minor. It is seen as vital to investigate a convenient modelling method for unlined tunnels based on plan design, since realistic rock surface is complex and costly to both measure and model accordingly.
Some other potential error sources for the model setup are water leakages between the water above and below the modelled tunnel crown, but were found to be minor. For sediment testing, it was found to be important to properly seal any gaps of the invert to avoid sand particles that may disappear. The round shaped plate representing the tunnel crown was not completely sealed for practical purposes and to allow easy removal. The minor water leakage is mitigated and made neglectable by additional downstream separation of the free surface, ensuring steady state flow in the pressurized sand trap and still water above the crown.
The physical model test results gave comparable sediment deposition patterns at the weir and along the invert compared with observations from the prototype (Figure 15). The actual sediment transport occurring inside the prototype is unknown, since field measurements of sediment transport, in such large pressurized sand traps, is challenging and has not been conducted. The geometry upstream of the inlet in the prototype was not modelled, as well as the access tunnel and stairs on the weir, which are special features of the investigated sand trap. Thus, it was not the goal to create identical sedimentation patterns, but sufficiently comparable results. As for the prototype, a dune was established in the model test indicating similar particle transport mechanisms. The physical model test shows significant bed load transport of sand particles in good agreement with the results from 3D CFD simulations. For the existing prototype geometry, all particles between 0.3 and 1.0 mm were observed to be lifted over the weir in the physical model tests, indicating that this range of particle sizes is continuously transported through the turbines. It indicates that only the particles retained for a short time period in front of the weir are found inside the prototype during dewatering. This conclusion is supported by the fact that sand was found downstream and on top of the weir in the prototype. The deposition pattern of sand upstream from the concrete weir was remarkably similar in the model and the prototype.
A physical model test with Froude scaling of flow and sediments has also been conducted at NTNU in 1:20 geometrical scale [12], and the results are very different. With the Froude scaling, the sediments deposited evenly throughout the entire length of the sand trap and the trap efficiency was significantly higher compared with the herein presented 1:1 velocity and sediment size scaled model test. Based on the comparison with the sediment deposition found inside the prototype, the 1:1 scaling method of velocity and sediment grain size is seen to provide more accurate results. It should be noted that the scaling factor and boundary conditions for the two models are not completely similar, and more work is necessary to accurately compare the two scaling methods.
It is pointed out that the main reason for why the 1:1 velocity and sediment grain size scaling produces more accurate results compared with the Froude scaling is presently not fully clear. It may be the Shields similitude, the Euler similitude, the higher Reynolds numbers, or other reasons. More research is necessary to further validate and understand the 1:1 scaling method. Based on the herein presented results, the 1:1 scaling is recommended since it both produces more accurate results and is conservative compared with the Froude scaling.
4.4. Retrofitting Solutions
Several retrofitting solutions were tested, but only one was found to have a significant effect. Improvements of the inlet diffusor geometry and flow calmers were seen in 3D CFD to have positive effects on jet dissipation, but was thus disproved in the physical scale model. This can be explained by a limited effect due to the available length of diffusor adaption in relation to the high jet impact, causing obviously complex multiscale turbulences, as resolved in the 3D CFD. A flow calming structure has also been studied by [30], who also concluded that the flow calmer had an adverse effect on the trap efficiency.
Other measures at the invert, such as lowering the invert to expand the flow area and reduce velocities, as well as baffles to lower velocities close to the invert, were found to have a positive effect but were not prioritized for physical model testing, owing to the relatively large construction works and related costs.
The only retrofitting solution that appears both cost and time effective, in addition to resulting in a significant improvement of the trap efficiency, was found to be a ramp combined with ribs. This solution provides flow separation with a protected volume under the ribs to trap the sediments and prevent resuspension. Sand particles were found mainly to be moved as bedload in the downstream end of the sand trap and were continuously resuspended. By introducing the ramp and ribs, the sediments were finally trapped below the ribs and could not be resuspended. The ribs and ramp structure were also seen to ensure a safe trapping of gravel during water level drawdown and free surface flow condition in the sand trap. Thus, a ramp and rib construction can provide additional safety to avoid the flushing of large particles through the turbines.
The usual engineering practice for sand trap design is not believed to take fully into account the transient effects of the hydraulics and the resulting sediment transport. For future sand traps constructed with gates, the impact of the jet on the sediment transport and the potential for resuspension of settled particles is suggested to be considered.
5. Conclusions
A combination of 3D CFD simulations and physical scale model testing has been conducted to study cost and time efficient retrofitting solutions for pressurized sand traps. There were 3D CFD simulations used to quantify the sediment transport potential indirectly through analysis of transient velocities and wall shear stress along the invert of the sand trap. The gate constriction at the inlet of the sand trap was found to have a severe effect on the sediment transport capacity, as a jet flow increases the velocities and invert wall shear stress over the entire length of the sand trap. Thereafter, 3D CFD particle tracking simulations were used to screen several different retrofitting solutions.
Additionally, 3D CFD simulations with particle tracking modelling were utilized to compare sediment settling behavior in the prototype design. The method was found to be effective at assessing the effect on suspended load. However, the bed load transport and resuspension of particles were not found to be accurately modelled with the applied turbulence, sediment models, and resolution.
The physical model tests were conducted with both 1:1 flow velocity and sediment size scaling. This allowed for Euler and an approximate Shields similitude, as well as significantly higher Reynolds numbers compared with Froude scaling. This scaling method has only been presented in one previous publication, but the achieved results of sediment transportation are in good agreement with prototype observations. This contrasts with a recent parallel physical scale model with Froude scaling in 1:20 geometry scale that yielded results with low agreement with the prototype sedimentation observations. The 1:1 velocity and sediment size scaling allows the use of prototype particles, which improves the practicability of model test investigations and avoids issues with particle cohesion effects and scaling errors associated with lightweight material. In effect, this allows for a smaller geometrical scale, further improving the practical aspects and reducing the costs and time efforts for sand trap physical scale models.
The physical scale model tests of the existing prototype geometry showed a significant bed load and resuspension of sediment after initial settling. Tests were conducted with both sand and gravel size particles. The trap efficiency of the existing sand trap was found to be 0% for particles in the range 0.3–1.0 mm. This finding is supported by observations of sand on top of the weir and in the downstream pressure shaft.
Various different retrofitting options were tested in the physical scale model. Diffusor optimization, with gradual opening angles, could not improve the trap efficiency. A flow calming structure to mitigate the jet from the inlet could not improve the sand trap efficiency and, in fact, had an adverse effect which is also confirmed by other recent studies with a different flow calmer design. Heightening of the weir (double and triple height) at the downstream end also did not improve the trap efficiency. Finally, a combination of an 8% inclined ramp, together with ribs in a short section at the downstream end of the sand trap, was found to significantly improve the trap efficiency from 0% to 87%. This setup can be combined with automatic flushing arrangements for efficient sediment removal. This solution allows for flexible retrofitting of pressurized sand traps with various geometries and is currently planned for installation in the prototype Tonstad HPP.
Author Contributions
Conceptualization, W.R. and K.V.; methodology, W.R.; investigation, W.R. and G.M.; writing—original draft preparation, W.R.; writing—review and editing, W.R., K.V.; review O.H.H., G.M., J.S., G.Z.; visualizations, W.R.; photos, W.R., K.V.; supervision, K.V.; project administration, W.R., K.V.; funding acquisition, K.V. All authors have read and agreed to the published version of the manuscript.
Funding
The work was conducted as a part of the Flexible Sandtrap project and financed by RFF Agder, project number 269062 and Sira-Kvina kraftselskap.
Acknowledgments
Open Access Funding by the Graz University of Technology.
Conflicts of Interest
The authors declare no conflict of interest influencing the outcome of the research.
Abbreviations
| sand grain particle diameter (mm) | |
| FQd | Factor of design discharge (-), (80 m3/s = 1.0) |
| f | Darcy-Weisbach friction factor (-) |
| Local head loss (m) | |
| HPP | Hydropower plant |
| Equivalent sand grain roughness (mm) | |
| M | Machine for hydraulic energy generation (turbine) |
| Q | discharge (m3/s) |
| Qd | Design discharge = 80 (m3/s) |
| P | Pressure (Pa) |
| Particle Reynolds Number (-) | |
| Velocity (m/s) | |
| Shear velocity (m/s) | |
| Volume sediment (m3, l) | |
| SCF | Scale factor (-) |
| ηtrap | Trap efficiency |
| Kinematic viscosity (m2/s) | |
| Density (kg/m3) | |
| Boundary shear stress (Pa) | |
| Critical Shields shear stress (-) | |
| Dimensionless shear stress respectively Shields parameter (-) | |
| ζ | Local hydraulic loss factor (-) |
| Indices | |
| M | Model test |
| P | Prototype |
References
- Brekke, T.L.; Rippley, B.D. Design Guidelines for Pressure Tunnels and Shafts; Final Report No. 1745-17; EPRI—Electric Power Research Institute, University of California at Berkley: Palo Alto, CA, USA, 1987. [Google Scholar]
- Brox, D. Practical Guide to Rock Tunneling; CRC Press/Balkema: EH Leiden, The Netherlands, 2017; ISBN 978-1-315-21011-7. [Google Scholar]
- Huval, C.J. Hydraulic Design of Unlined Rock Tunnels. J. Hydraul. Eng. ASCE 1969, 4, 1235–1246. [Google Scholar] [CrossRef]
- Lysne, D.K. Sand transport and Sand Traps in Hydro Power Tunnels, in International Conference on Pumped Storage Development and Its Environmental Effects; University of Wisconsin: Milwaukee, WI, USA, 1971. [Google Scholar]
- Mattimoe, J.J.; Tinney, E.R.; Wolcott, W.W. Rock Trap Experience in Unlined Tunnels. ASCE Power J. 1964, 90, 29–45. [Google Scholar]
- Brox, D. DIC, Design and Functional Requirements for Rock Traps for Hydropower Pressure Tunnels. Int. J. Hydropower Dams 2016, 23, 4386–4396. [Google Scholar]
- Solvik, Ø.; Tesaker, E. Floor Paving in Unlined Hydropower Tunnels. In Hydropower’97; A. A. Balkema: Rotterdam, The Netherlands, 1997; ISBN 9054108886. [Google Scholar]
- Vereide, K.; Richter, W.; Havrevoll, O.H.; Betete, K.; Shrestha, U.; Navaratnam, U.; Mauko, G.; Lia, L. Flexible Sand Traps; HydroCen Report 20; Norwegian Research Centre for Hydropower Technology: Trondheim, Norway, 2021. [Google Scholar]
- Vereide, K.; Bjørnar, S.; Rolv, G. Case Study: Damaging Effects of Increasing the Installed Capacity in an Existing Hydropower Plant; BHR Pressure Surges: Dublin, Ireland, 2015. [Google Scholar]
- Bråtveit, K.; Olsen, N.R. Calibration of Horizontal Acoustic Doppler Current profilers by three dimensional CFD simulations. Eng. Appl. Comput. Fluid Mech. 2015, 9, 41–45. [Google Scholar] [CrossRef] [Green Version]
- Almeland, S.K.; Olsen, N.R.B.; Bråveit, K.; Aryal, P.R. Multiple solutions of the Navier-Stokes equations computing water flow in sand traps. Eng. Appl. Comput. Fluid Mech. 2019, 13, 199–219. [Google Scholar] [CrossRef]
- Belete, K.; Shrestha, U.; Vereide, K. Physical Model Study of Tonstad Sand Trap III, Report; NTNU: Trondheim, Norway, 2020; ISBN 978-82-8289-018-2(e). [Google Scholar]
- Gabl, R.; Gems, B.; Birkner, F.; Hofer, B.; Aufleger, M. Adaptation of an Existing Intake Structure Caused by Increased Sediment Level. Water 2018, 10, 1066. [Google Scholar] [CrossRef] [Green Version]
- Seyfeddine, M.; Vorlet, S.; Adam, N.; De Cesare, G. Holistic Design Approach of a Throttled Surge Tank: The Case of Refurbishment of Gondo High-Head Power Plant in Switzerland. Water 2020, 12, 3440. [Google Scholar] [CrossRef]
- Andersson, L.R.; Hellström, J.G.I.; Andreasson, P.; Lundström, T.S. Numerical Investigation of a Hydropower Tunnel: Estimating Localised Head-Loss Using the Manning Equation. Water 2019, 11, 1562. [Google Scholar] [CrossRef] [Green Version]
- de Jong, R.; Perdijk, H.; Develay, D.; Gautier, J.; Binquet, J. Hydraulic Model Studies of Desilting Basins of a Hydro-electric Project. In Proceedings of the 5th International Symposium on River Sedimentation, Karlsruhe, Germany, 6–10 April 1992. [Google Scholar]
- Brevik, O. 3D Numerisk Modellering av Deler av Vassvegen til Tonstad Kraftverk. Master’s Thesis, NTNU, Trondheim, Norway, 2013. [Google Scholar]
- Havrevoll, O.H.; Vereide, K.; Lia, L. Efficiency of Pressurized Rock Traps for Unlined Hydropower Tunnels. Energies 2021, 14, 4344. [Google Scholar] [CrossRef]
- Richter, W.; Vereide, K.; Zenz, G. Upgrading of a Norwegian pressurized sand trap combined with an open air surge tank. Geomech. Tunn. 2017, 10, 620–624. [Google Scholar] [CrossRef]
- Ansys, CFX 2019 R3 Documentation; Ansys Inc.: Canonsburg, PA, USA, 2021.
- U.S. Geological Survey. Scientific Investigations Report 2008–5093, 10 January 2013. Available online: https://pubs.usgs.gov/sir/2008/5093/table7.html (accessed on 21 August 2019).
- Schiller, L.; Naumann, A. Über die Grundlegenden Berechnungen bei der Schwerkraftaufbereitung. In Zeitschrift des Vereines Deutscher Ingenieure; Z. Vereines Deutscher Inge: Leipzig, Germany, 1933. [Google Scholar]
- Richter, W.; Zenz, G. Hydraulic Investigations, Numerical Simulations, Flexible Sand Trap 1.0; Technical Report; Graz University of Technology: Graz, Austria, 2020. [Google Scholar]
- Richter, W.; Mauko, G.; Zenz, G. Hydraulic Investigation, Numerical and Physical Model Test, Flexible sand trap 2.0; Technical Report; Graz University of Technology: Graz, Austria, 2020. [Google Scholar]
- Vanoni, V.A. Sedimentation Engineering; ASCE Manuals and Reports on Engineering Practice No. 54; American Society of Civil Engineers: Reston, VA, USA, 1977. [Google Scholar]
- Idel’cik, I.E. Handbook of Hydraulic Resistance, 3rd ed.; CRC Press: Boca Raton, FL, USA, 1994. [Google Scholar]
- Alfadhli, I.; Yang, S.-Q.; Sivakumar, M. Influence of Vertical Motion on Initiation of Sediment Movement. J. Water Resour. Prot. 2014, 6, 1666–1681. [Google Scholar] [CrossRef] [Green Version]
- Pugh, C.A. Sediment Transport Scaling for Physical Models, in Appendix C. In Sedimentation Engineering: Processes, Measurements, Modeling, and Practice; No. 110; ASCE: New York, NY, USA, 2008. [Google Scholar]
- Camp, T.R. Sedimentation and the Design of Settling Tanks. Trans. Am. Soc. Civ. Eng. 1946, 111, 146. [Google Scholar] [CrossRef]
- Ivarson, M.M.; Trivedi, C.; Vereide, K. Investigations of Rake and Rib Structures in Sand Traps to Prevent Sediment Transport in Hydropower Plants. Energies 2021, 14, 3882. [Google Scholar] [CrossRef]
- Jacobsen, T. Sediment Problems in Reservoirs: Control of Sediment Deposits. Ph.D. Thesis, Norwegian Technical University, Trondheim, Norway, 1997. [Google Scholar]
- Beheshti, A.A.; Ataie-Ashtiani, B. Analysis of threshold and incipient conditions for sediment movement. Coast. Eng. 2008, 55, 423–430. [Google Scholar] [CrossRef]
- Shields, A. Anwendung der Aehnlichkeitsmechanik und der Turbulenzforschung auf die Geschiebebewegung. Doctoral Dissertation, Mitteilungen der Preussischen Versuchsanstalt für Wasserbau und Schiffbau, Berlin, Germany, 1936. [Google Scholar]
- Chanson, H. Hydraulics of Open Channel Flow; Elsevier Ltd.: Amsterdam, The Netherlands, 2004; ISBN 978-0-7506-5978-9. [Google Scholar] [CrossRef]
- Ching, E.; Christian, J.; Ho, C. Shields Diagram Calculator for Determining the Onset of Particle Movement at the Bottom of a Fluid-Filled Tank; Sandia National Laboratories: Albuquerque, NM, USA, 2013. [Google Scholar]
- Shahmohammadi, R.; Afzalimehr, H.; Sui, J. Assessment of Critical Shear Stress and Threshold Velocity in Shallow Flow with and Particles. Water 2021, 13, 994. [Google Scholar] [CrossRef]
Figure 1.
Tonstad hydropower plant and the pressurized sand trap retrofitted with the ribs and ramp design. The total tunnel system exceeds 30 km of unlined tunnels. The figure shows the existing hydropower plant, except the green lines, indicating the proposed retrofitting with the Ribs and Ramp solution. Blue lines indicate water flow, and brown lines indicate sediment flow.

Figure 2.
Geometry of the pressurized sand trap no. 3; (a) design from construction drawings used in 3D CFD simulations; (b) 3D scan of the as-built structure [17]; (c) model test geometry placed in the flume, with plastic in the red color and acrylic glass material in the transparent color, the missing sidewalls are the glass walls of the flume with 30 cm internal width. The placement position of two of the tested retrofitting options, calming rakes and ramp and ribs, are indicated.

Figure 3.
Definitions of flow velocities of characteristic flow sections for prototype and model scale. Subscript P denotes prototype scale, and subscript M denotes model scale.
Figure 3.
Definitions of flow velocities of characteristic flow sections for prototype and model scale. Subscript P denotes prototype scale, and subscript M denotes model scale.

Figure 4.
The physical scale model test with 1:36.67 geometrical scale, 1:1 velocity, and sediment scaling in the 30 cm wide flume of the hydraulic laboratory.
Figure 4.
The physical scale model test with 1:36.67 geometrical scale, 1:1 velocity, and sediment scaling in the 30 cm wide flume of the hydraulic laboratory.

Figure 5.
Passable flow calming rake design attempt to mitigate jet effect, downstream diffusor, passable double rake design. (a) Side view at 60 l/s discharge and 0.3–1.0 mm sand. (b) Top view of inlay rakes in the model with prototype dimensions of rakes.
Figure 5.
Passable flow calming rake design attempt to mitigate jet effect, downstream diffusor, passable double rake design. (a) Side view at 60 l/s discharge and 0.3–1.0 mm sand. (b) Top view of inlay rakes in the model with prototype dimensions of rakes.

Figure 6.
Transient simulation of the pressurized sand trap with focus on the inlet jet. The inlet flow boundary condition is from a separate approach flow simulation presented earlier. (a) Bottom shear stress and isosurface of 1 m/s (1.49 * average sand trap velocity) for inlet discharge 80 m3/s. (b) Inlet boundary flow conditions, illustrating the transition from the concrete lined section to unlined section, resulting in a sudden expansion. This figure also shows the input section of particles (next chapter).

Figure 7.
Geometry scale 1:1 with 80 m3/s discharge, velocity vectors in center plane and bottom wall shear stress, time step 189 s (flow through factor 0.79 [–]), and values of critical bed shear stress from [21].
Figure 7.
Geometry scale 1:1 with 80 m3/s discharge, velocity vectors in center plane and bottom wall shear stress, time step 189 s (flow through factor 0.79 [–]), and values of critical bed shear stress from [21].

Figure 8.
Geometry scale 1:1, 80 m3/s discharge, time 372 s (flow through factor 1.56 [–]). (a) Isosurface for 0.81 m/s equivalent to 1.2 * average sand trap velocity, and (b) resulting bottom shear stress.
Figure 8.
Geometry scale 1:1, 80 m3/s discharge, time 372 s (flow through factor 1.56 [–]). (a) Isosurface for 0.81 m/s equivalent to 1.2 * average sand trap velocity, and (b) resulting bottom shear stress.

Figure 9.
Snapshot from time-step 300 s (flow through factor 1.26 [–]) of simulation with 0.3–1.0 mm sand particles with one-way coupling (no collision of particles), scale 1:1, 80 m3/s discharge inflow velocity with upstream influence, 4000 particle tracks, side view.
Figure 9.
Snapshot from time-step 300 s (flow through factor 1.26 [–]) of simulation with 0.3–1.0 mm sand particles with one-way coupling (no collision of particles), scale 1:1, 80 m3/s discharge inflow velocity with upstream influence, 4000 particle tracks, side view.

Figure 10.
Visualized summary of particle transport mechanisms in case study pressurized sand trap.

Figure 11.
Gravel particles (diameter 5–30 mm) in the model test at the bottom of the diffusor; (a) early after input, and (b) after a retention time.
Figure 11.
Gravel particles (diameter 5–30 mm) in the model test at the bottom of the diffusor; (a) early after input, and (b) after a retention time.

Figure 12.
(a) Weir heightening (triple height), particle transport modes; (1) bedload transport, (2) dune creation and transport, (3) resuspension at dune tip with lifting over weir, (4) vortex creation with particle lifting. (b) Particle transport under ribs and over weir, showing insufficient trapping capacity without the ramp.

Figure 13.
Ramp and ribs solution for safely trapping sediments as a retrofitting proposal. Physical model test with 1:1 sediment and 1:1 velocity scaling ribs and ramp solution at weir. (a) Sand as a bedload on 8% inclined ramp and 5 ribs/4 gaps; (b) trapped under, by ribs and ramp structure of 7 ribs/7 gaps, and protected by flow separation underneath ribs.

Figure 14.
Shields curve with points for characteristic sediment diameters, calculations based on [32,33,34]. The values are given in prototype scale and the Shields curve (data from [35]).

Figure 15.
Sand accumulation at the downstream weir of the pressurized sand trap. (a,c) Prototype, original design, sand accumulation, and dune observed upstream from the weir after dewatering; (b) Physical scale model test, original design, showing a comparable deposition pattern, and continuous particle transport over the weir; (d) Prototype weir, inlet rake to pressure shaft, and access tunnel after manual sediment removal.


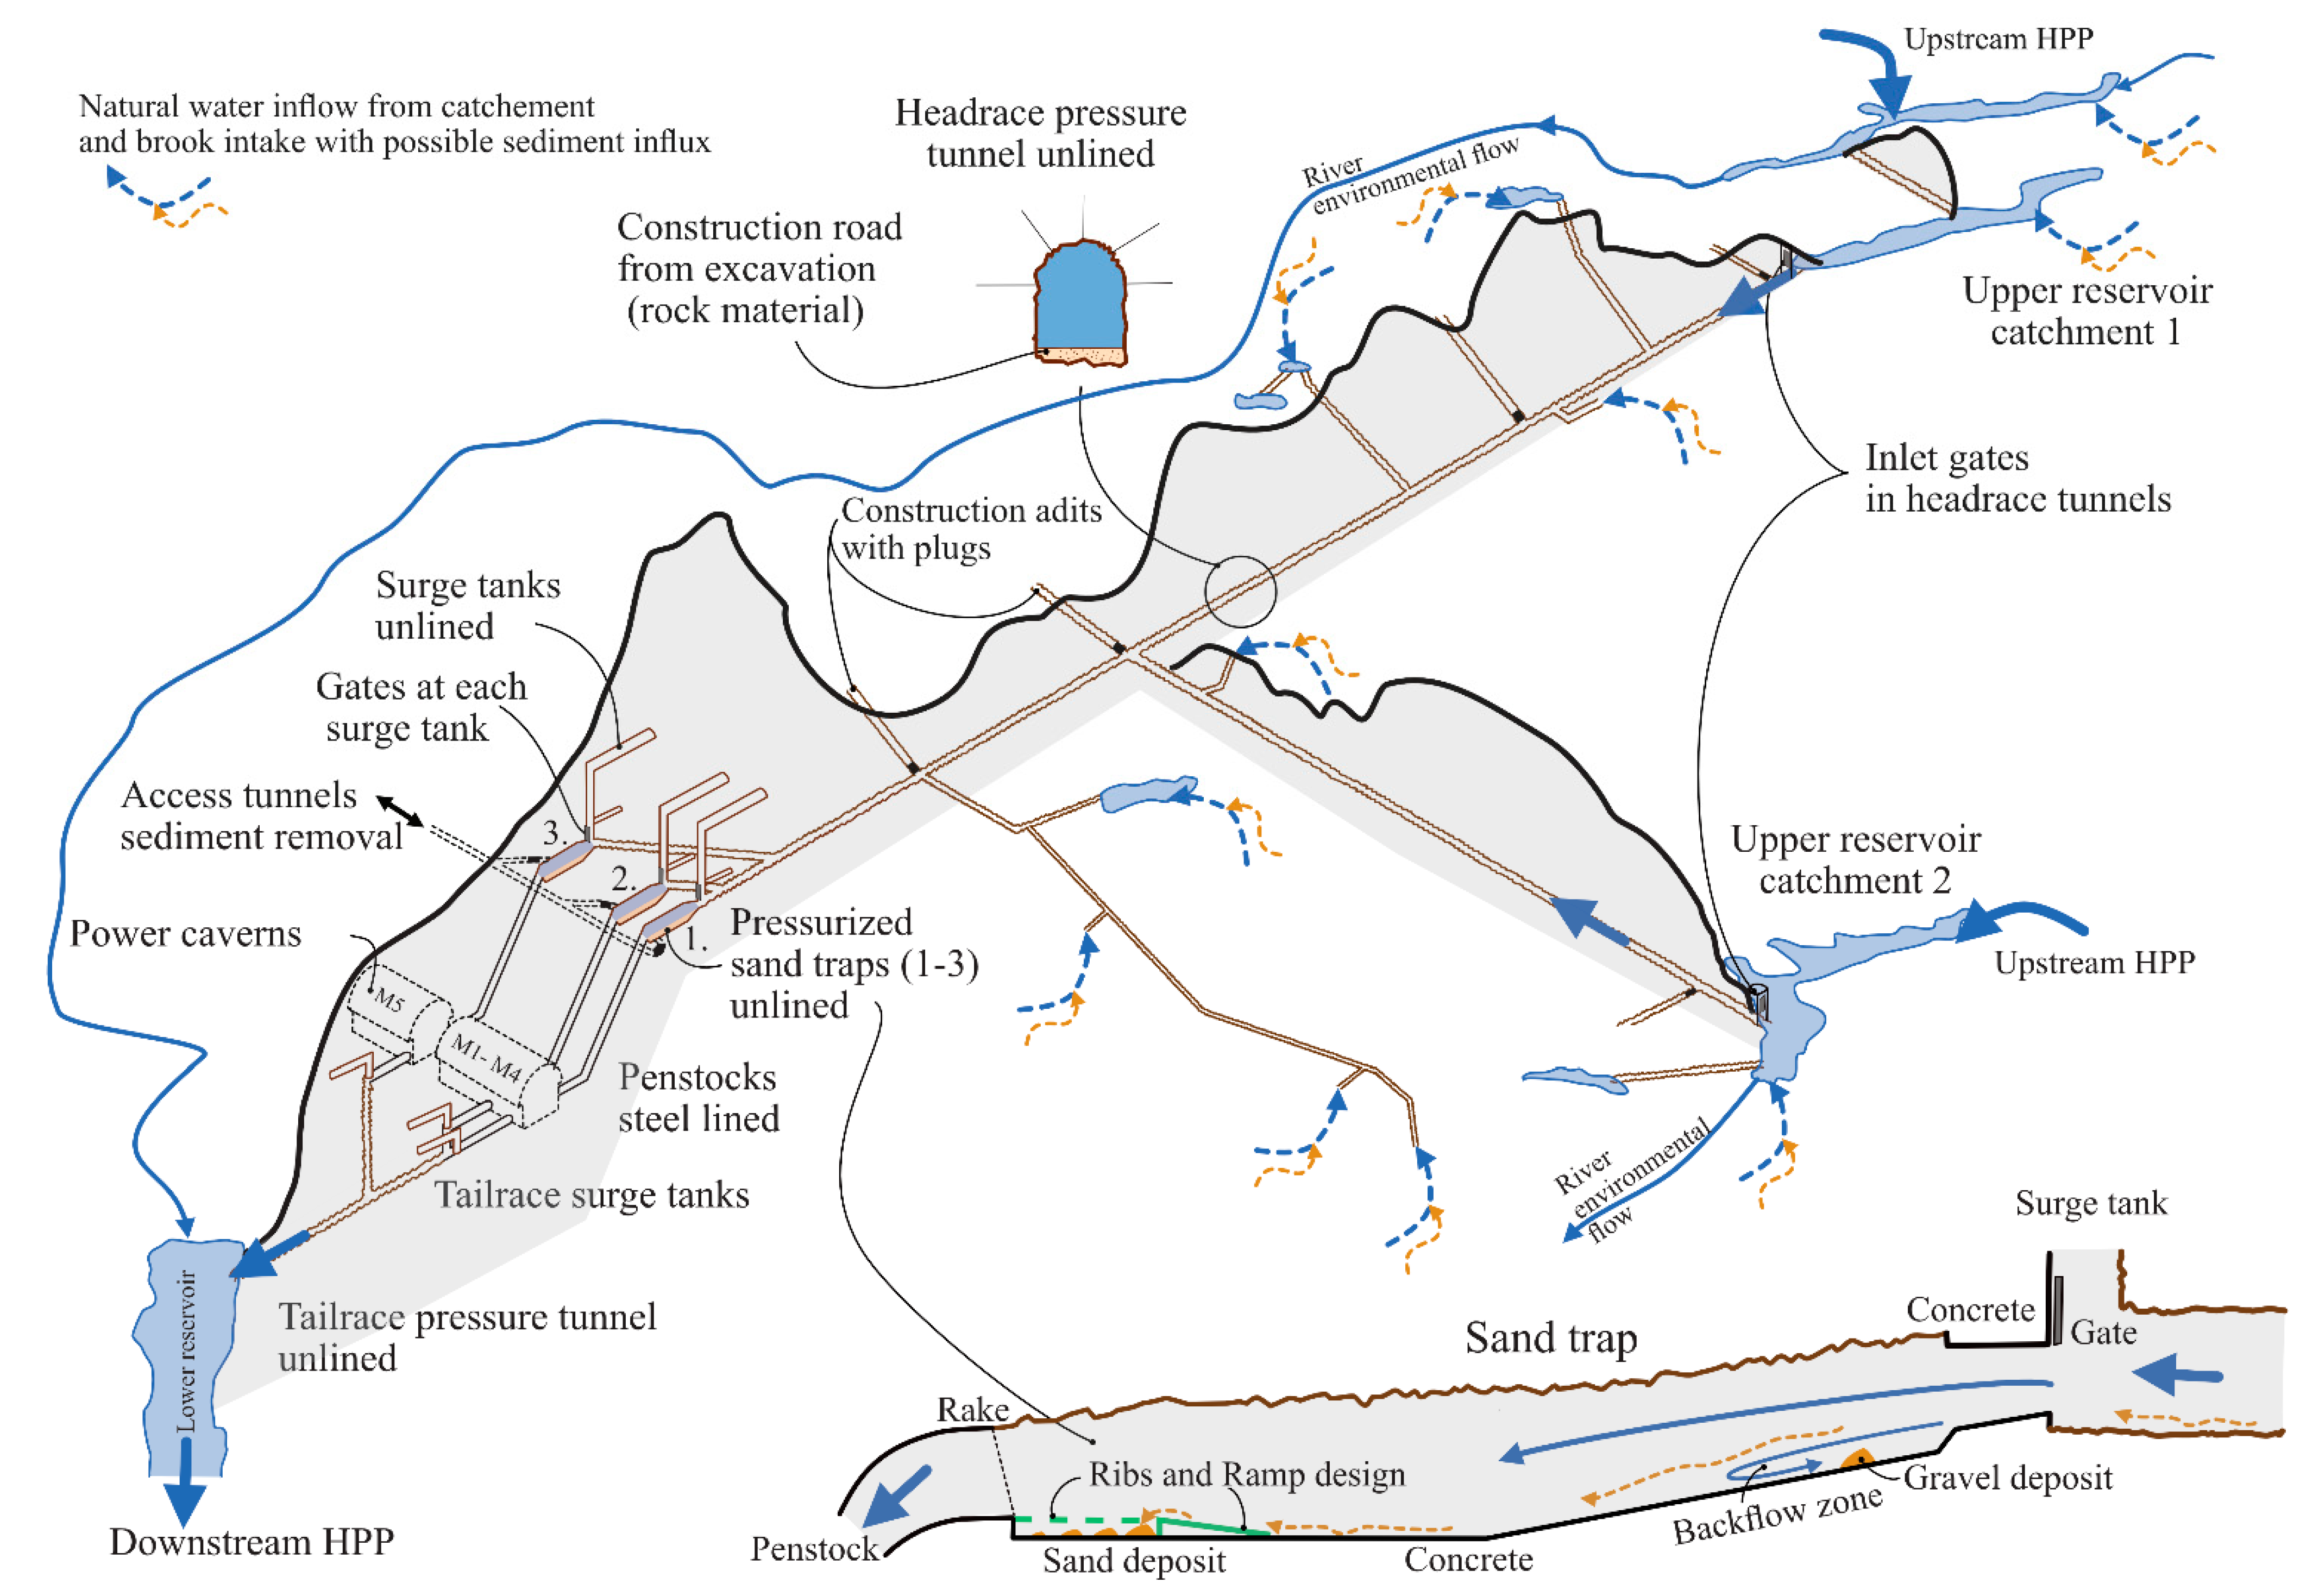
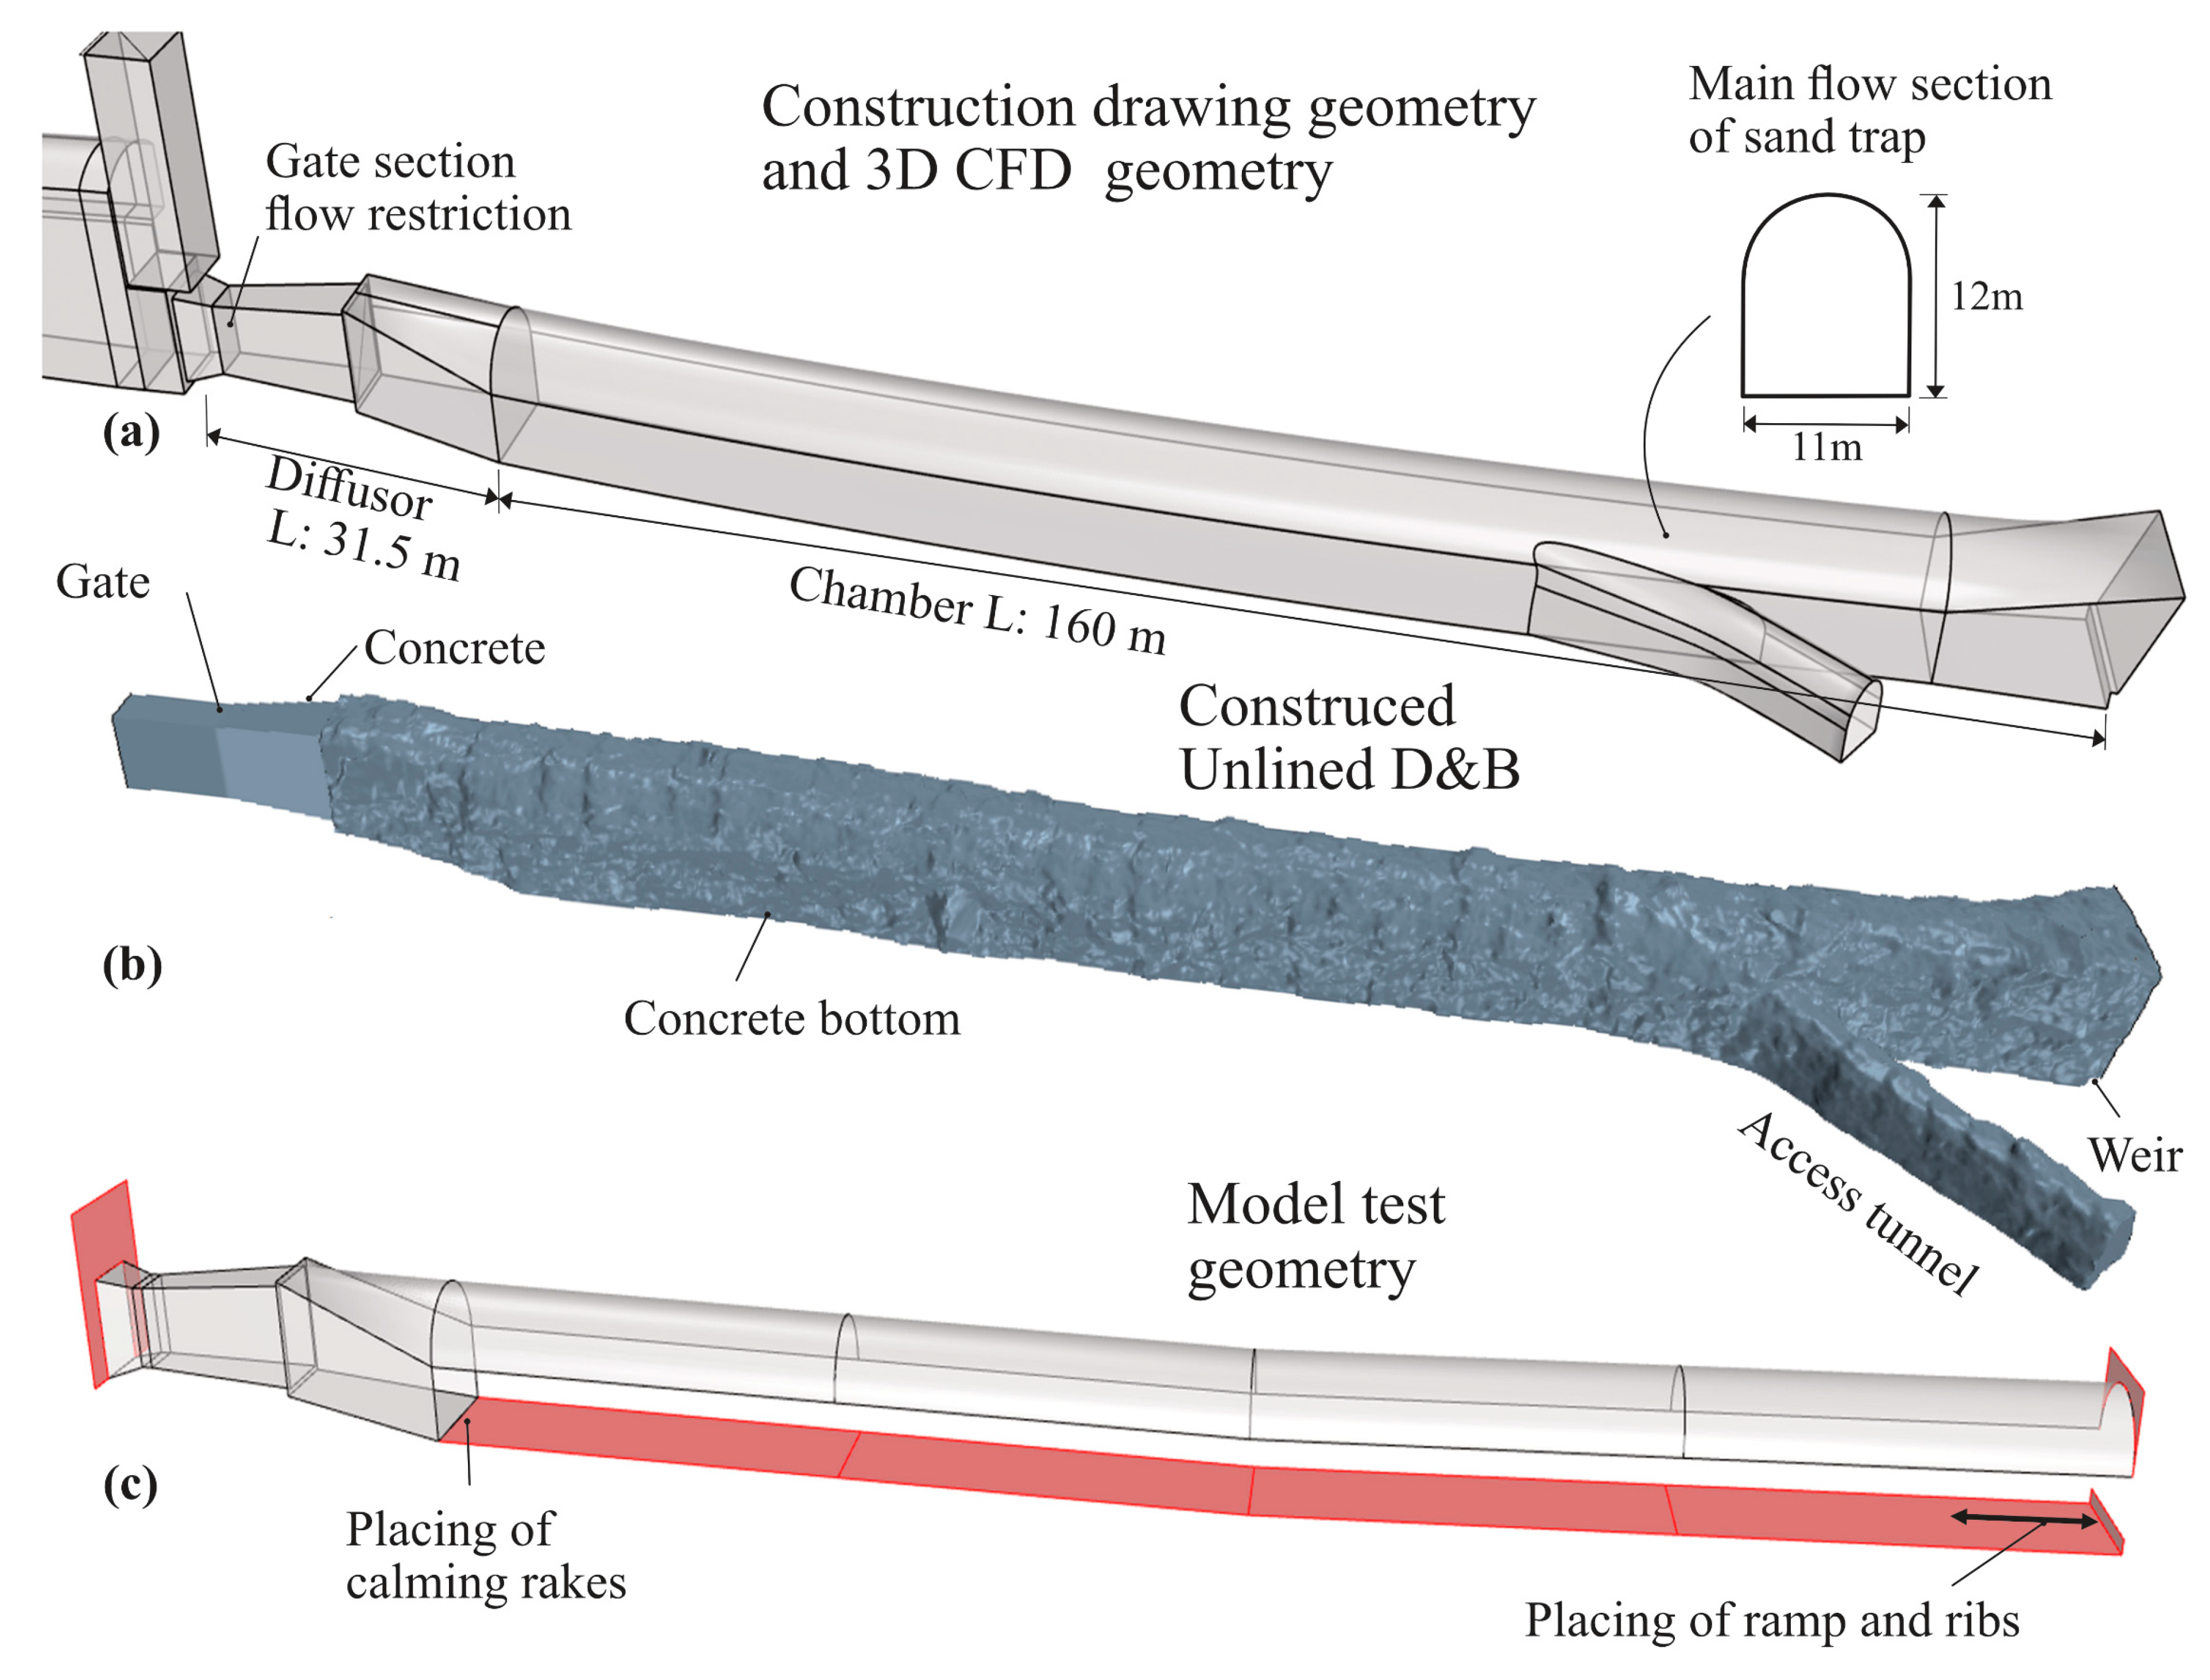
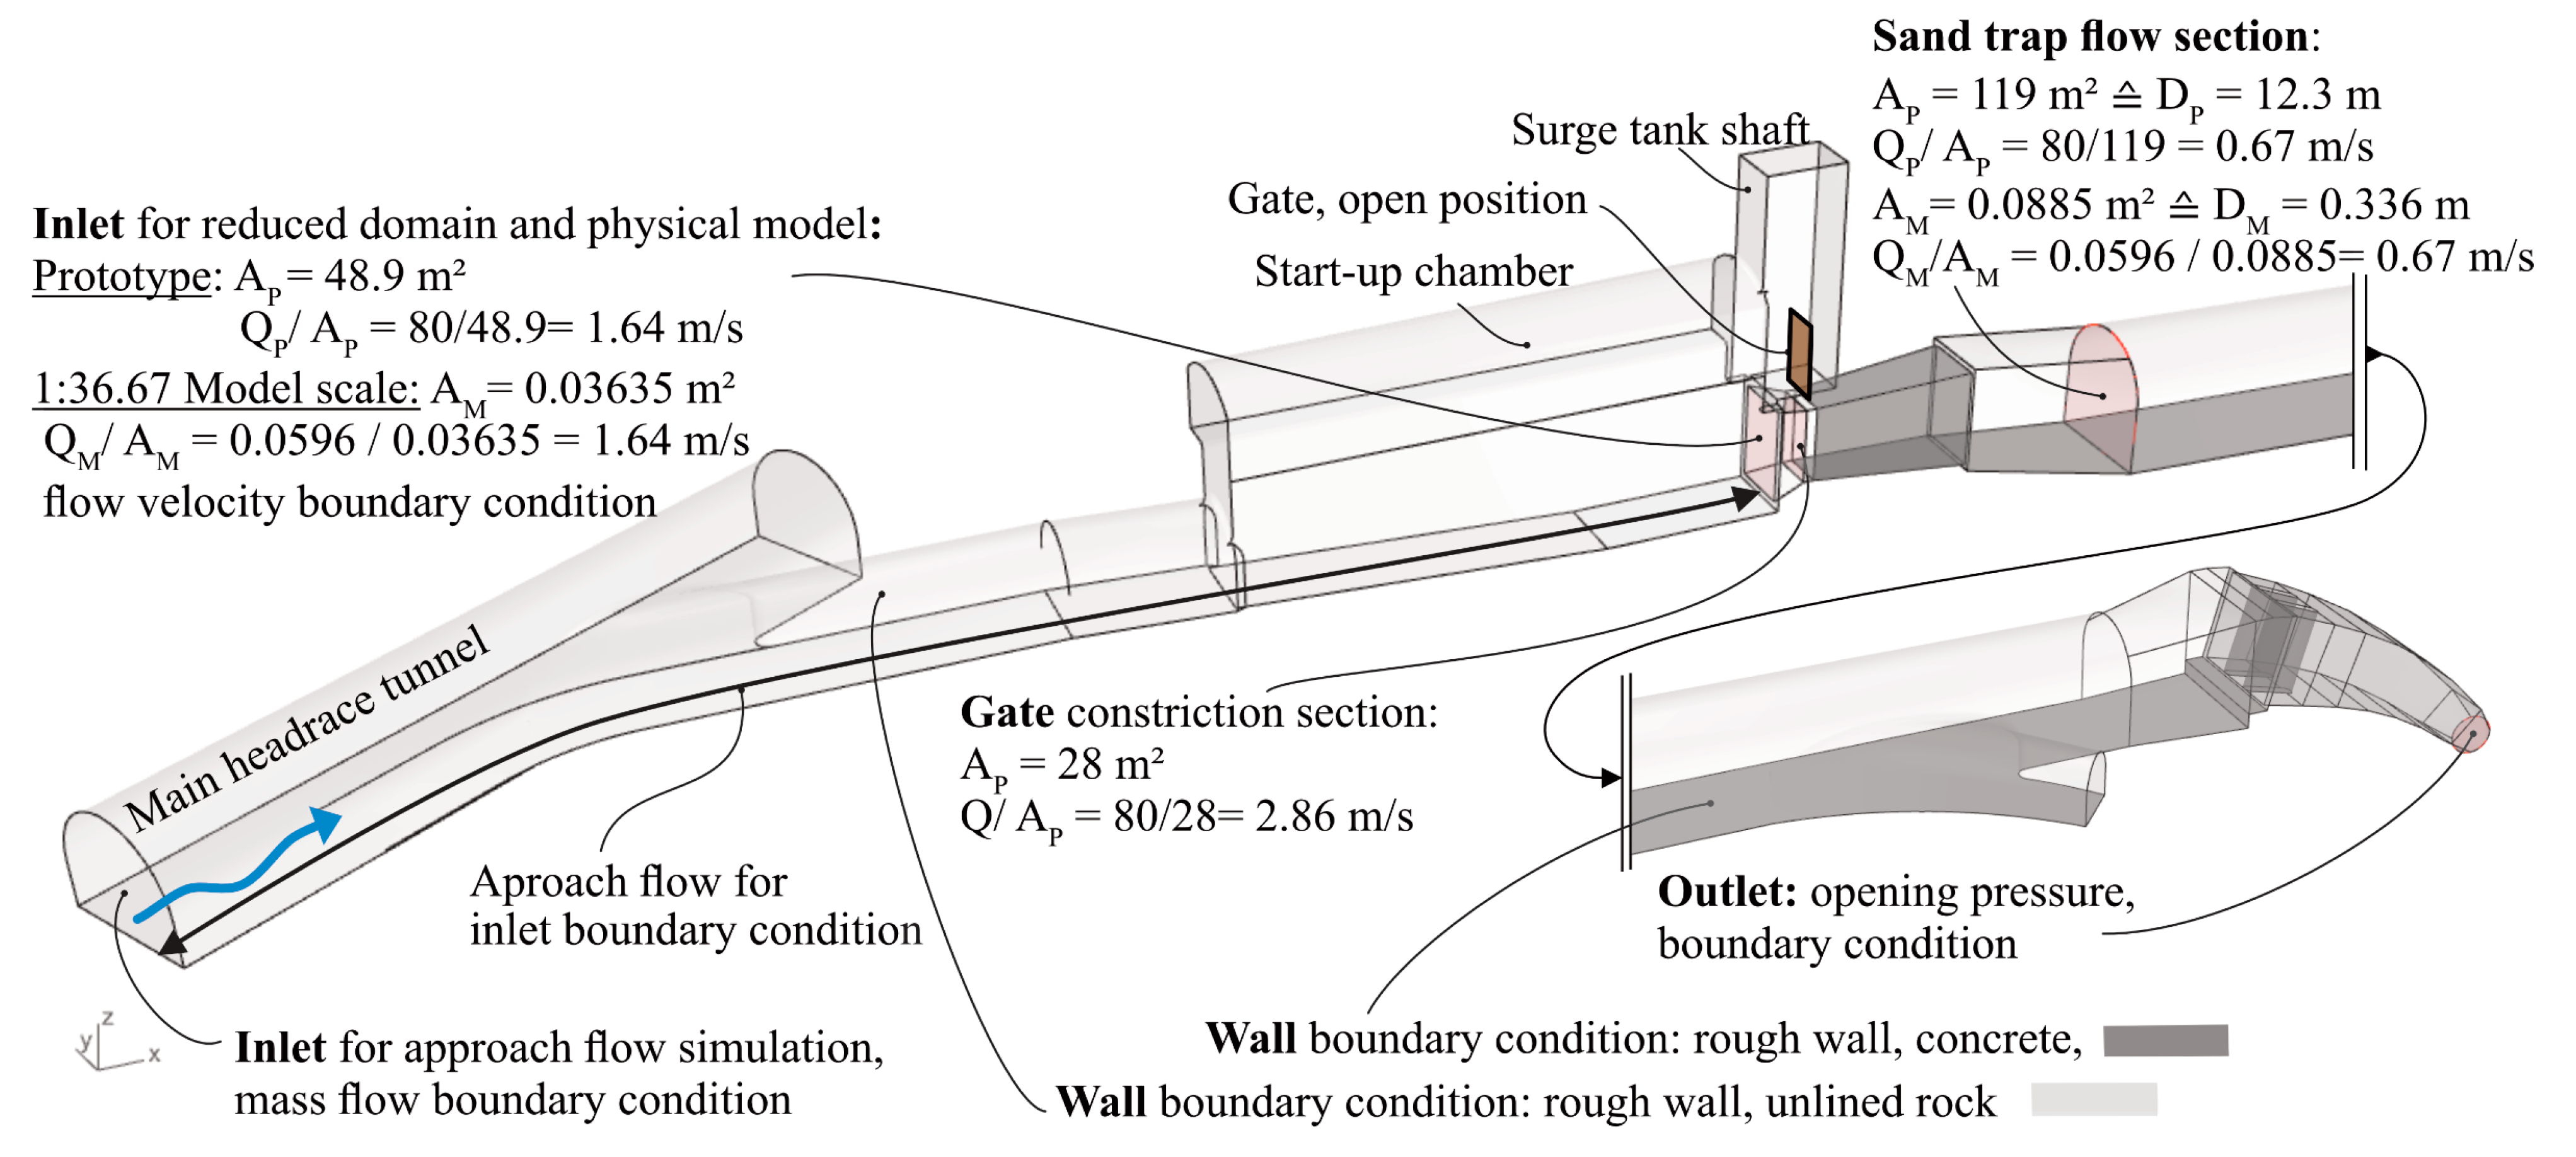
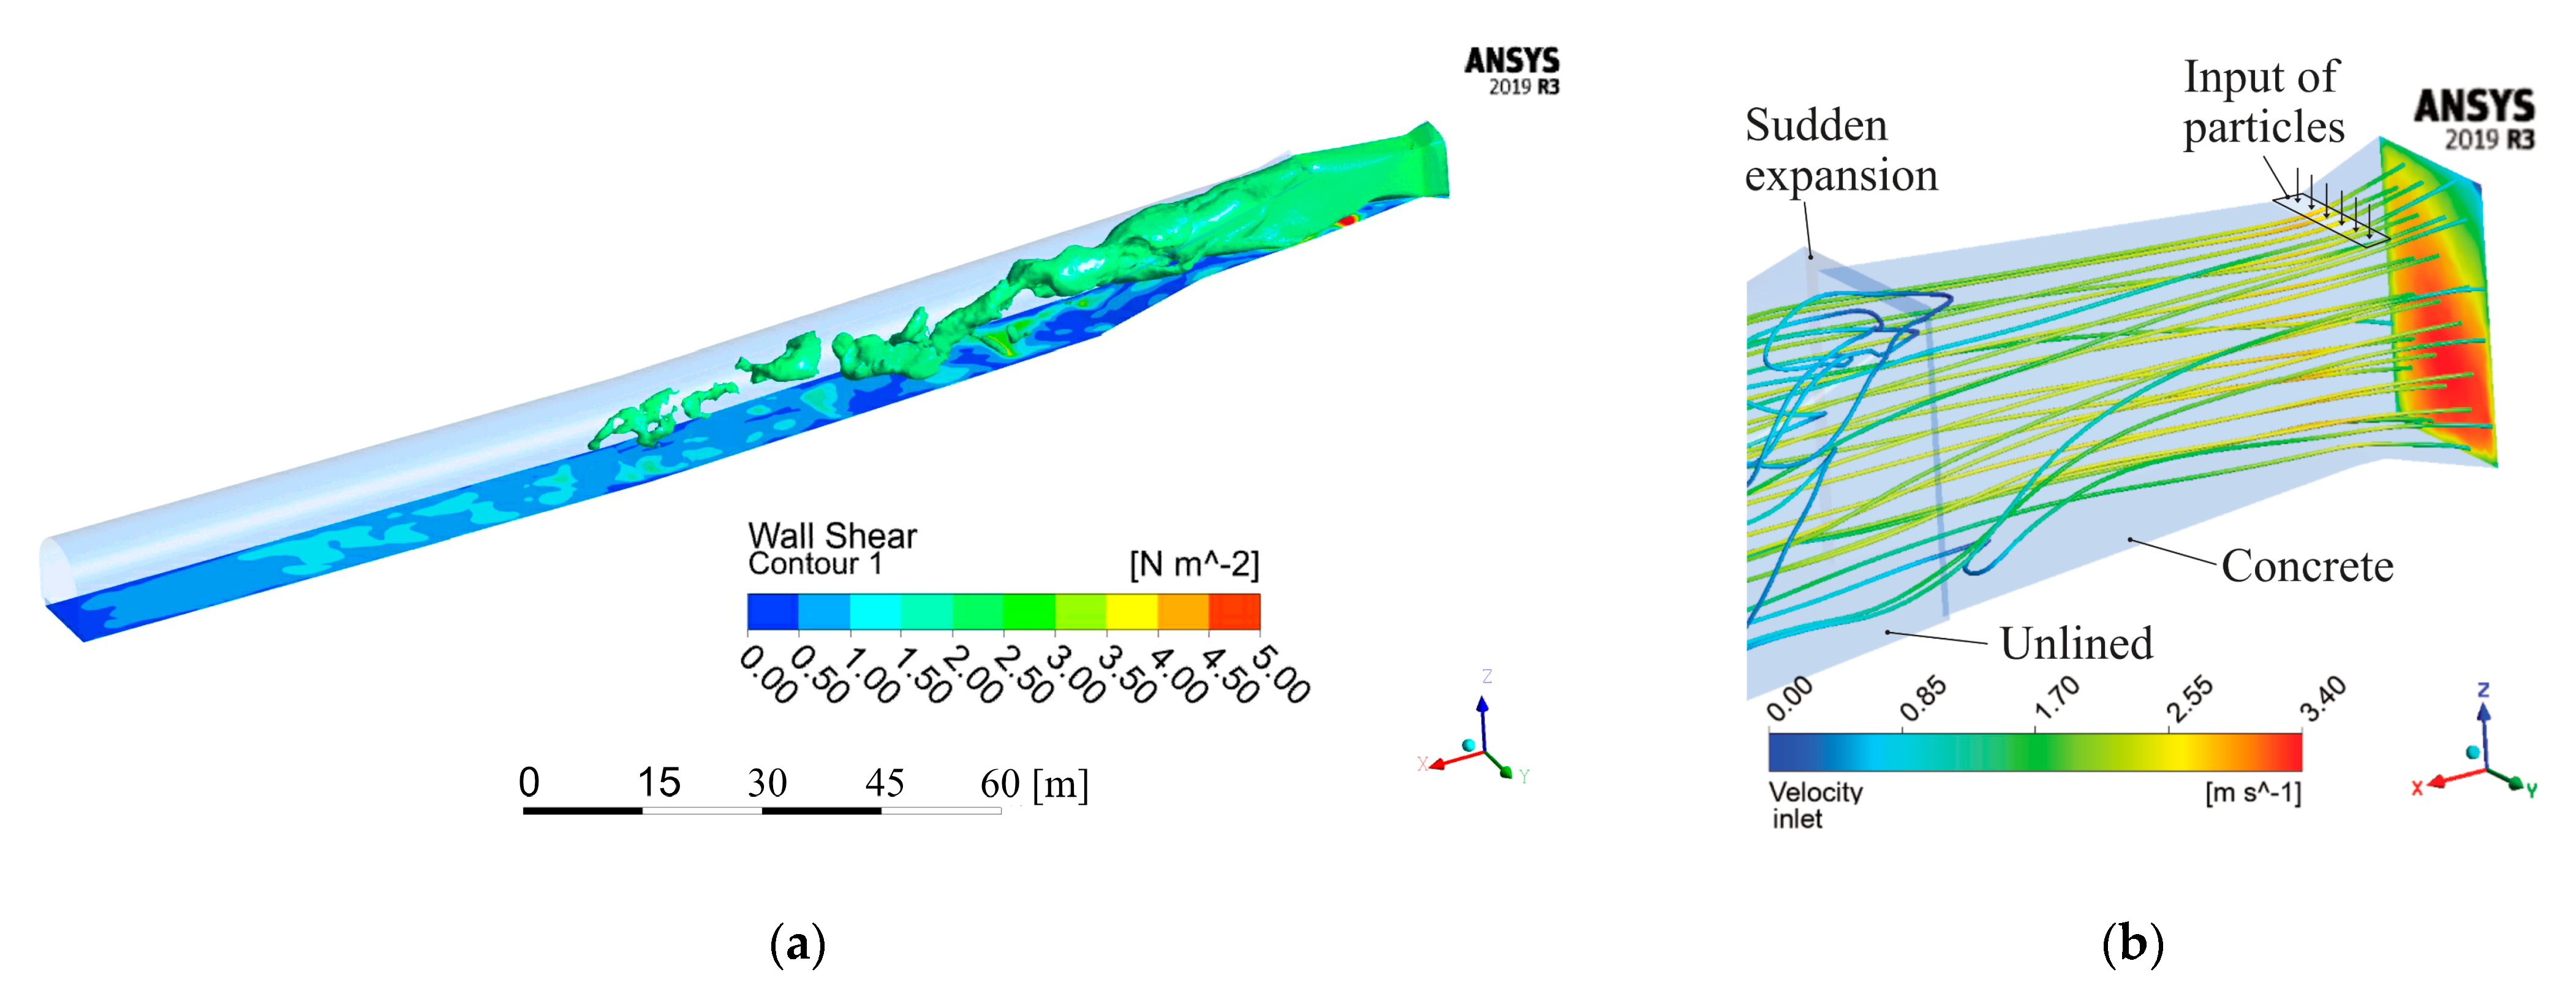
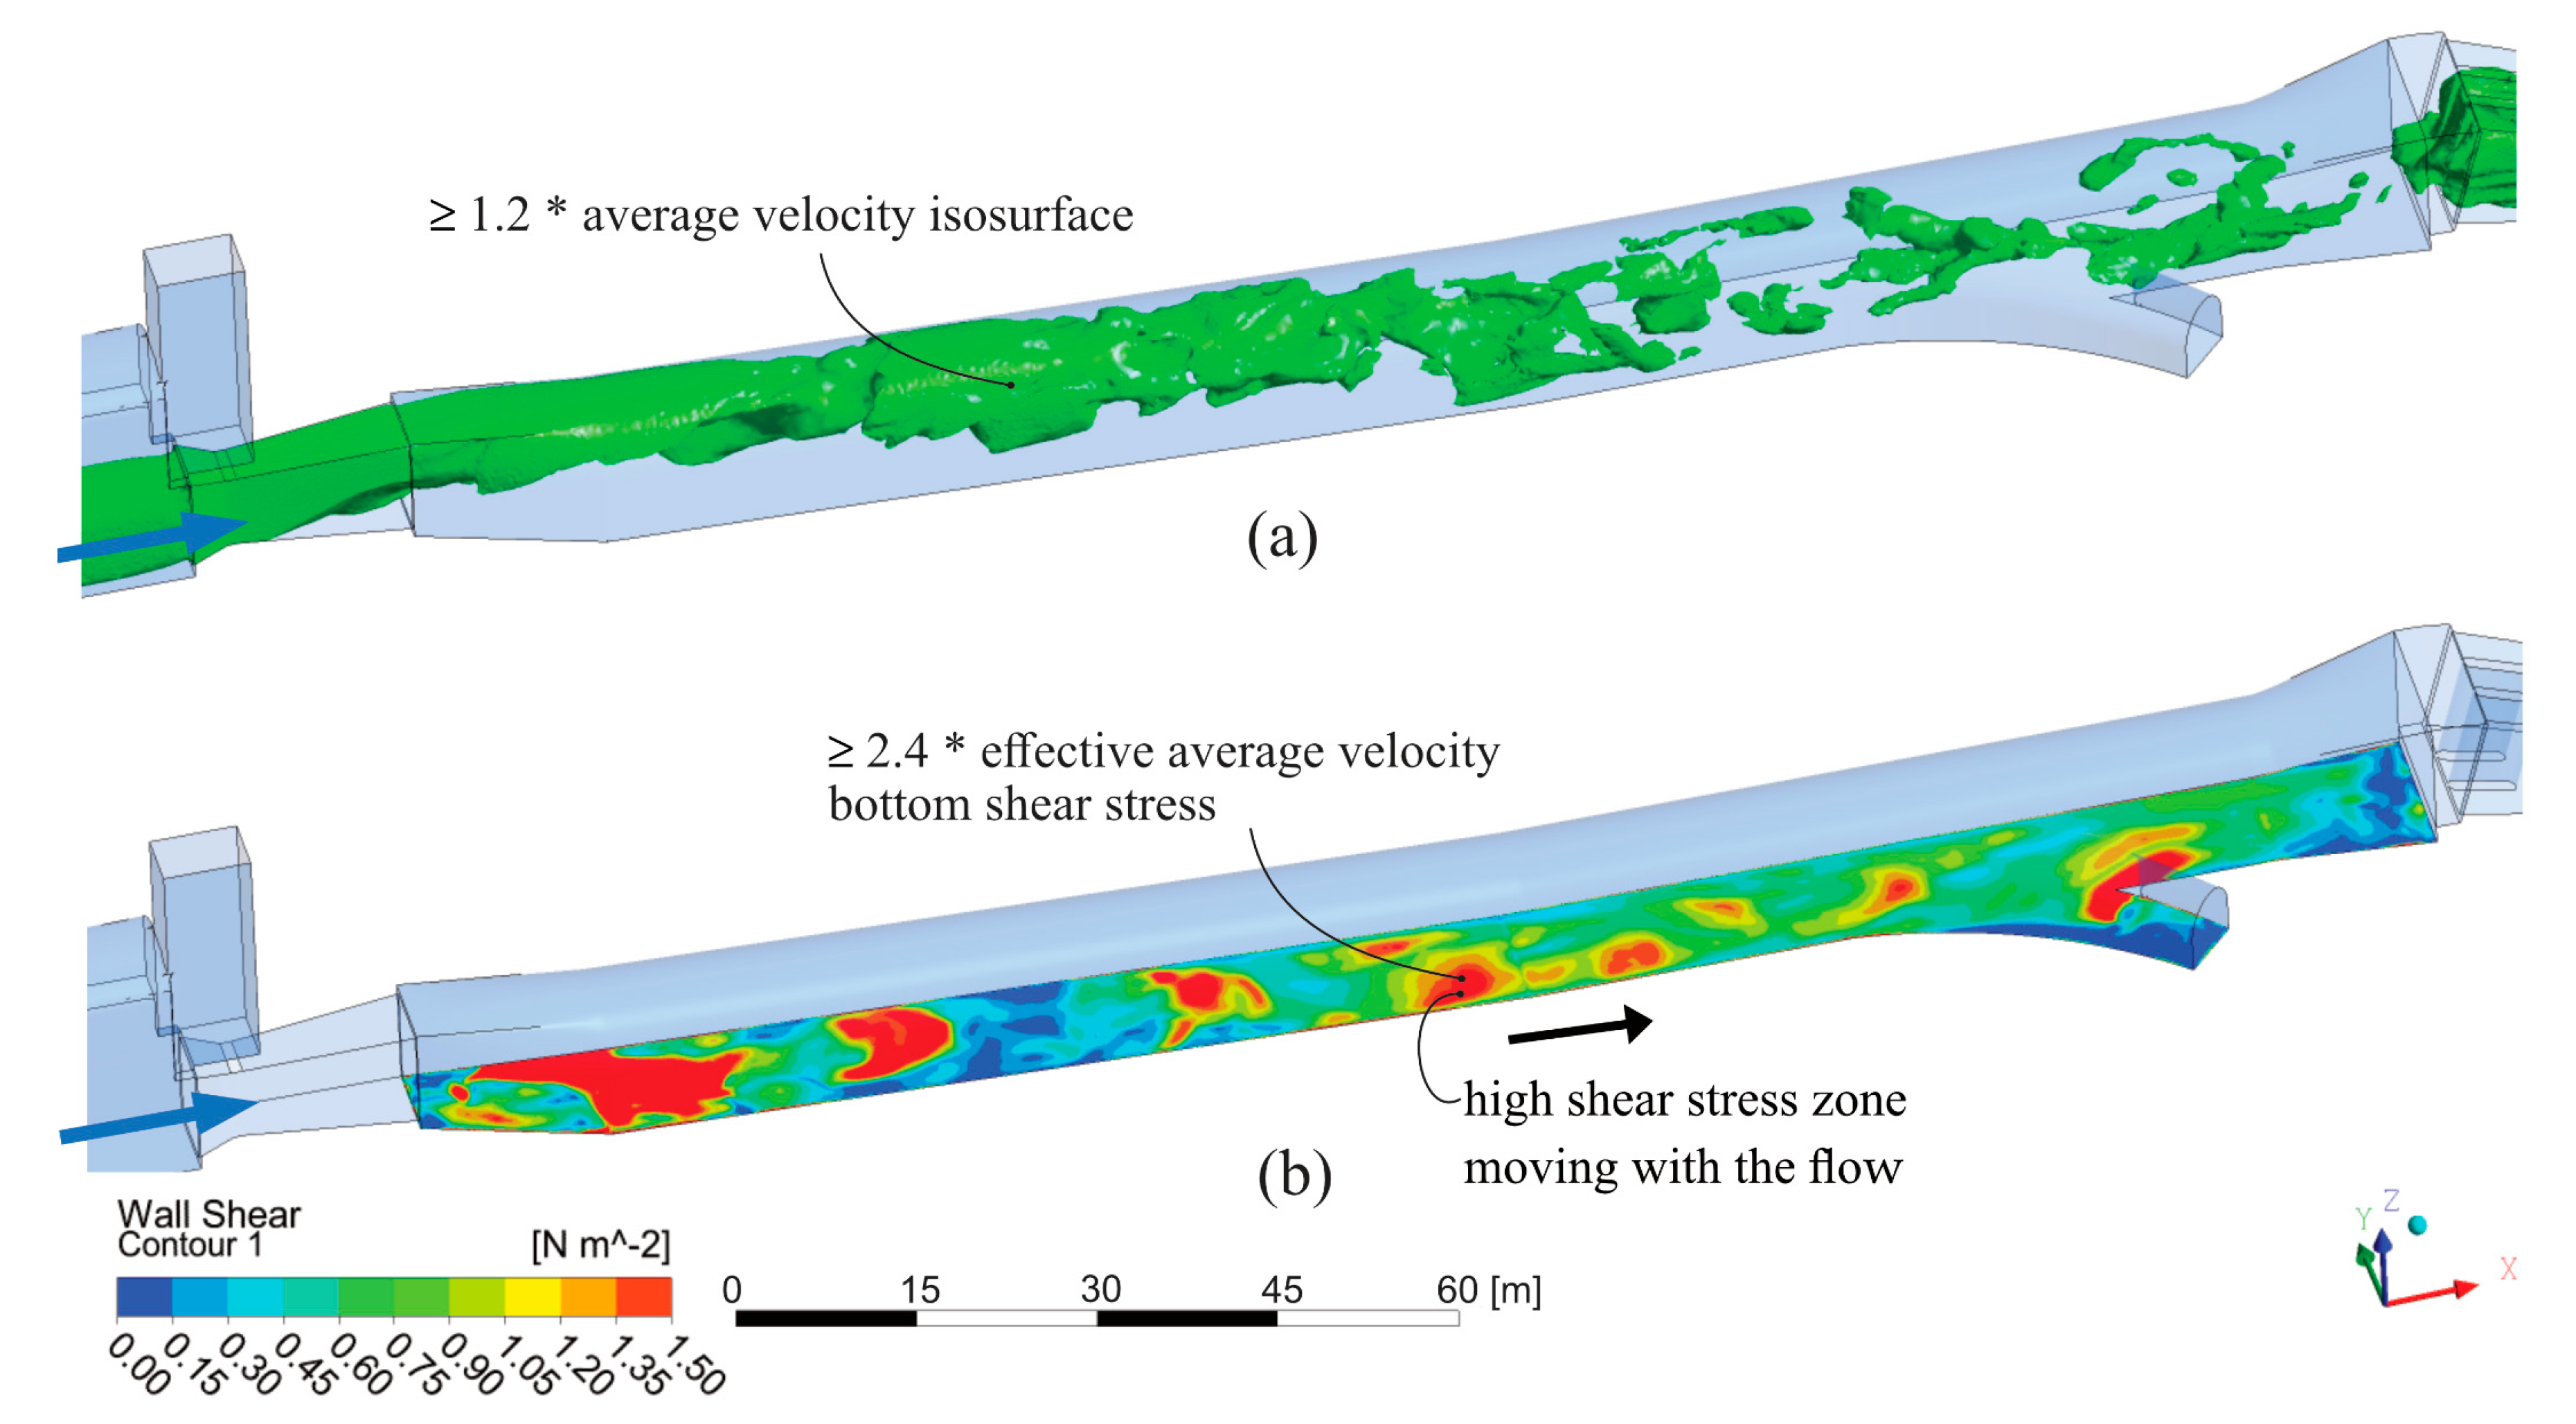
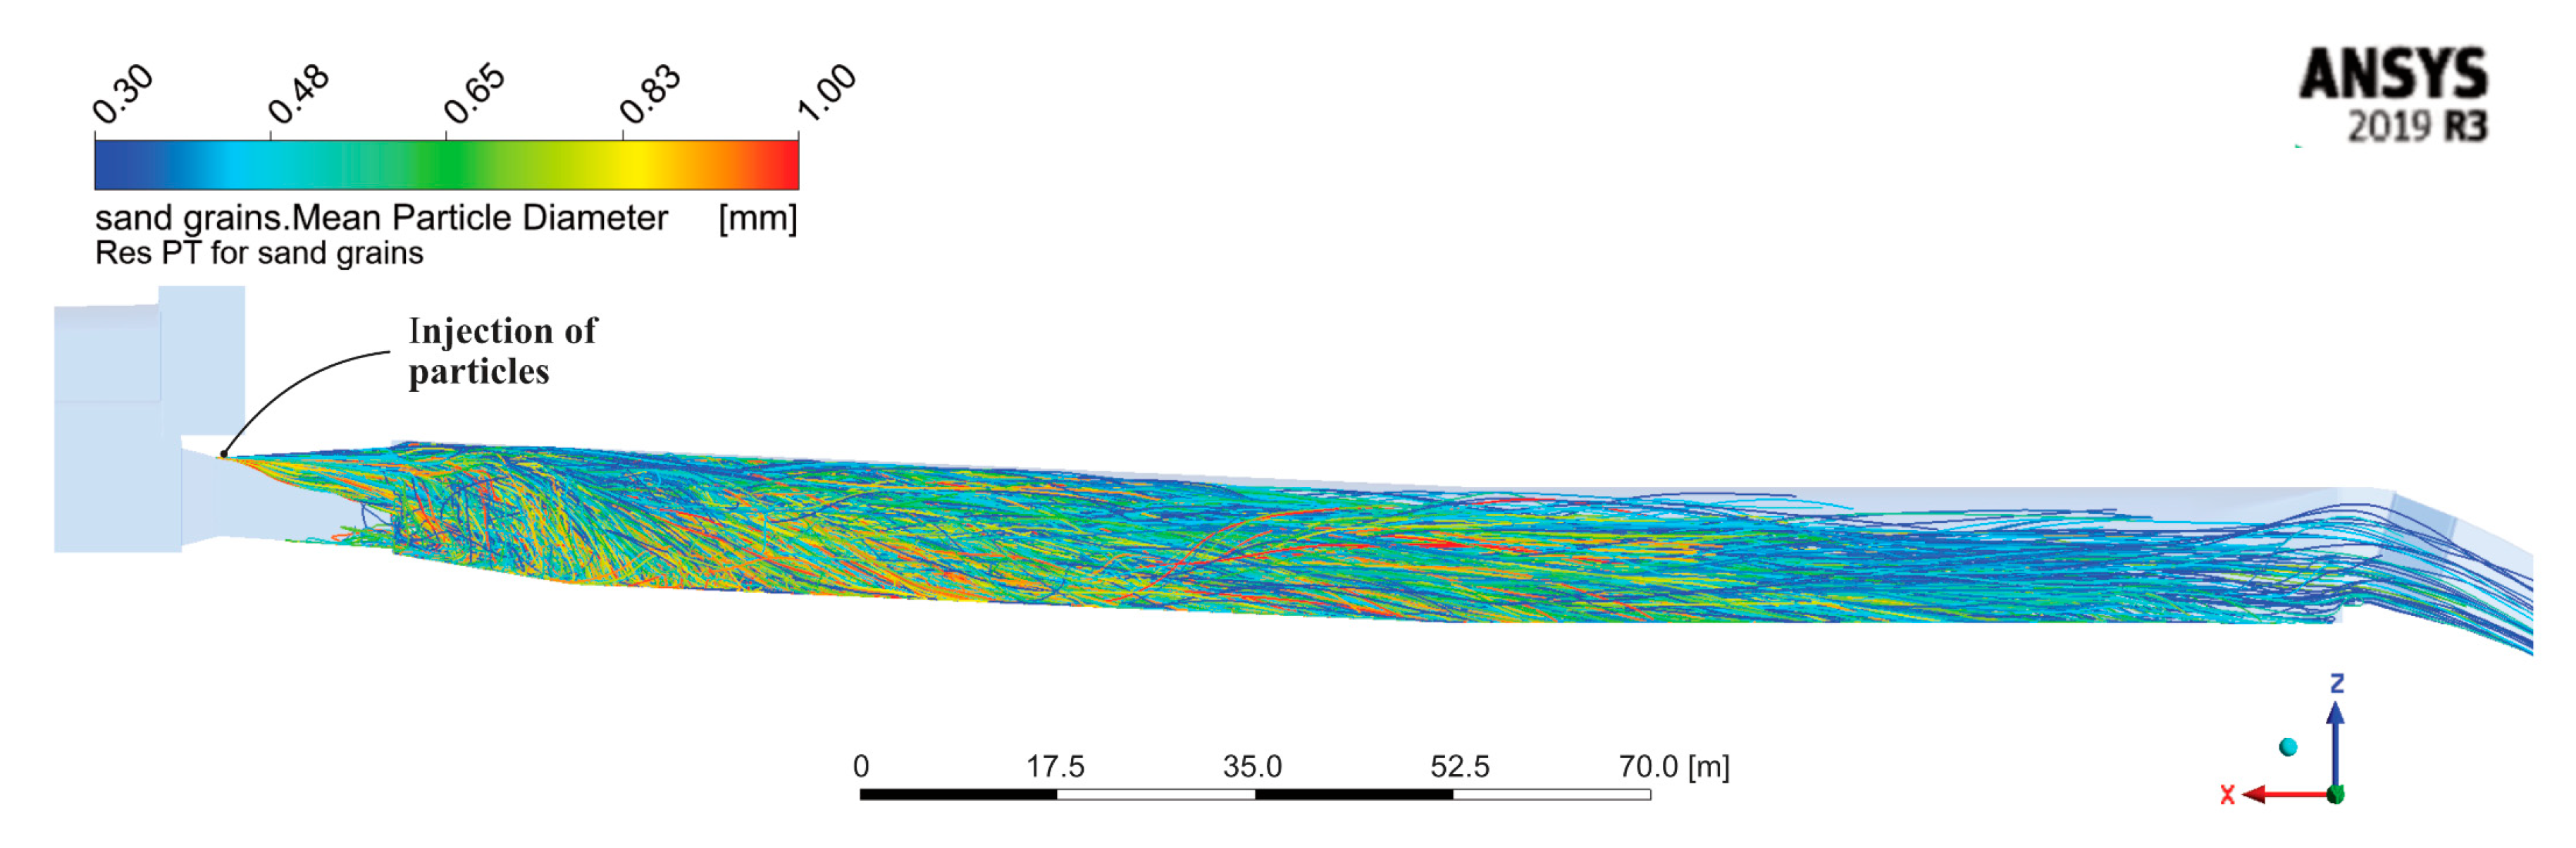
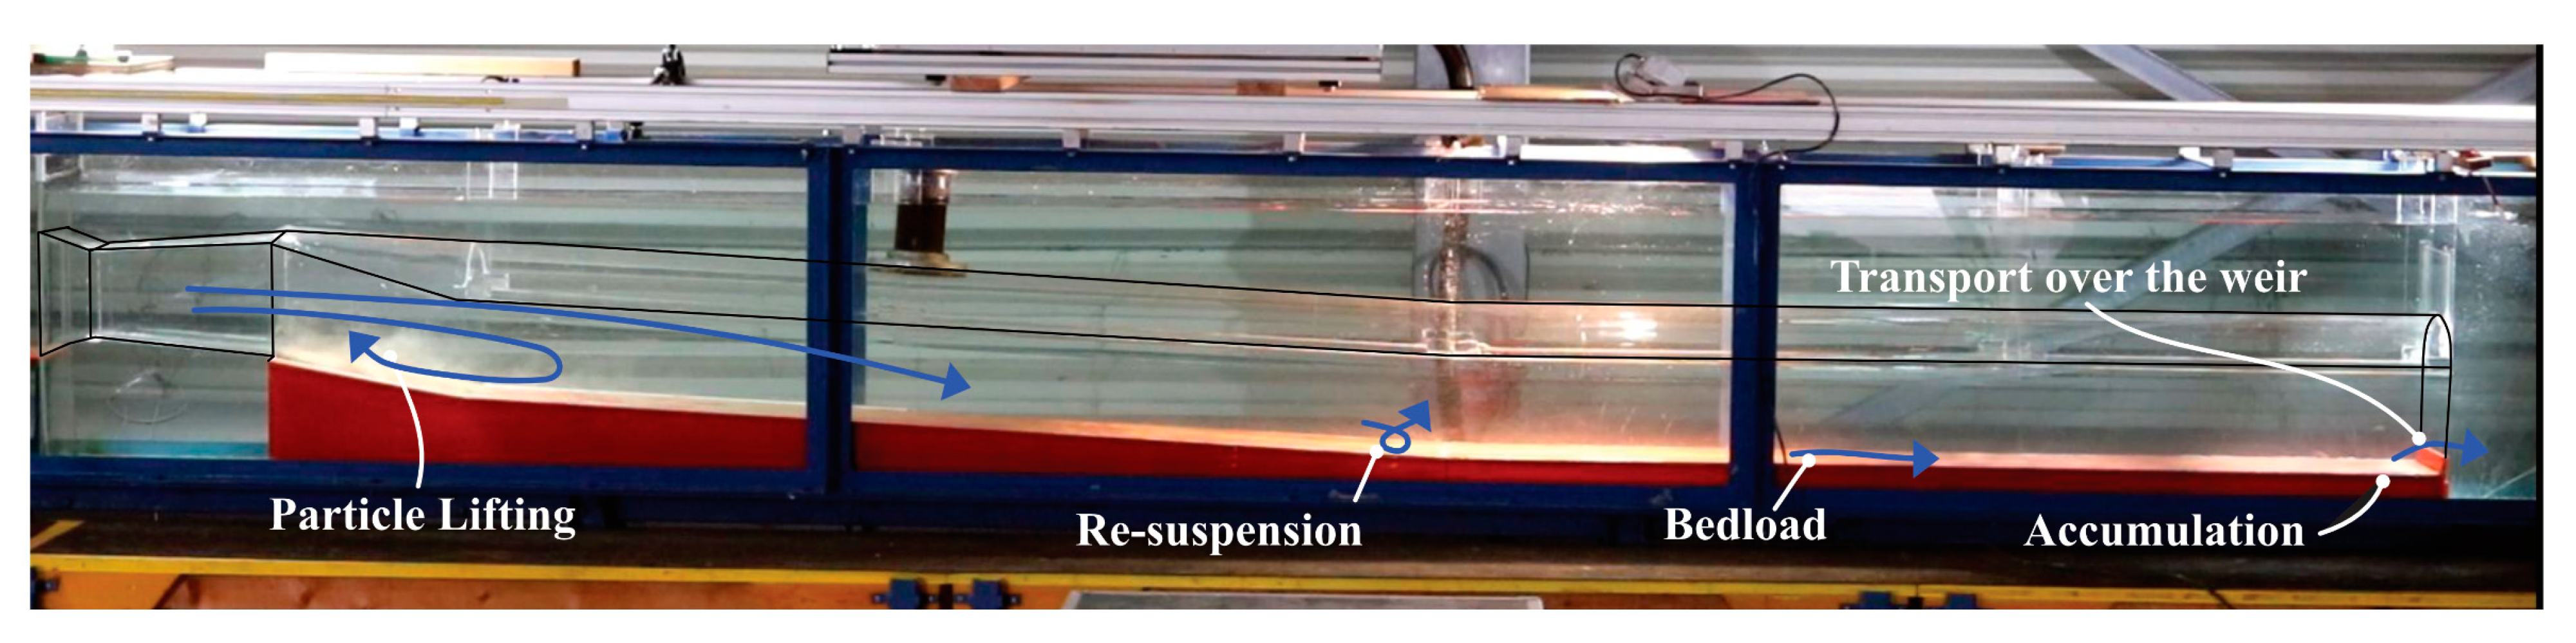
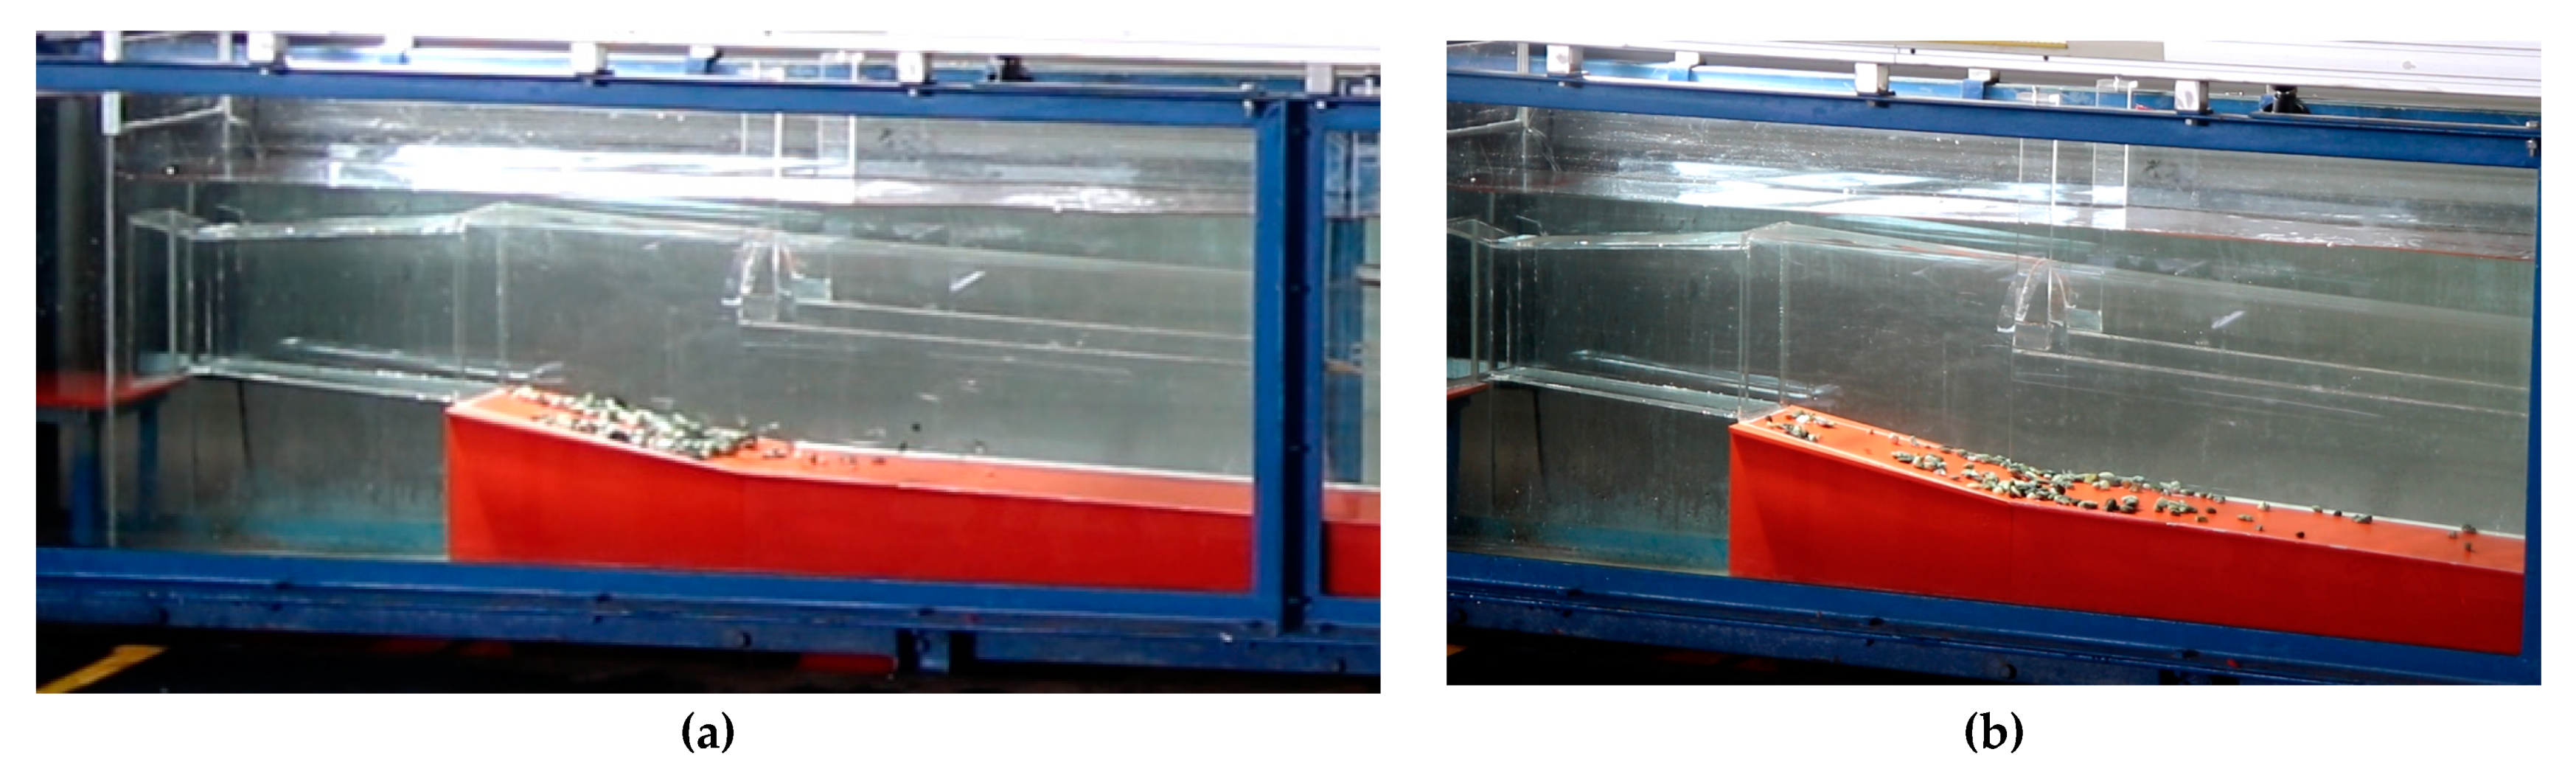
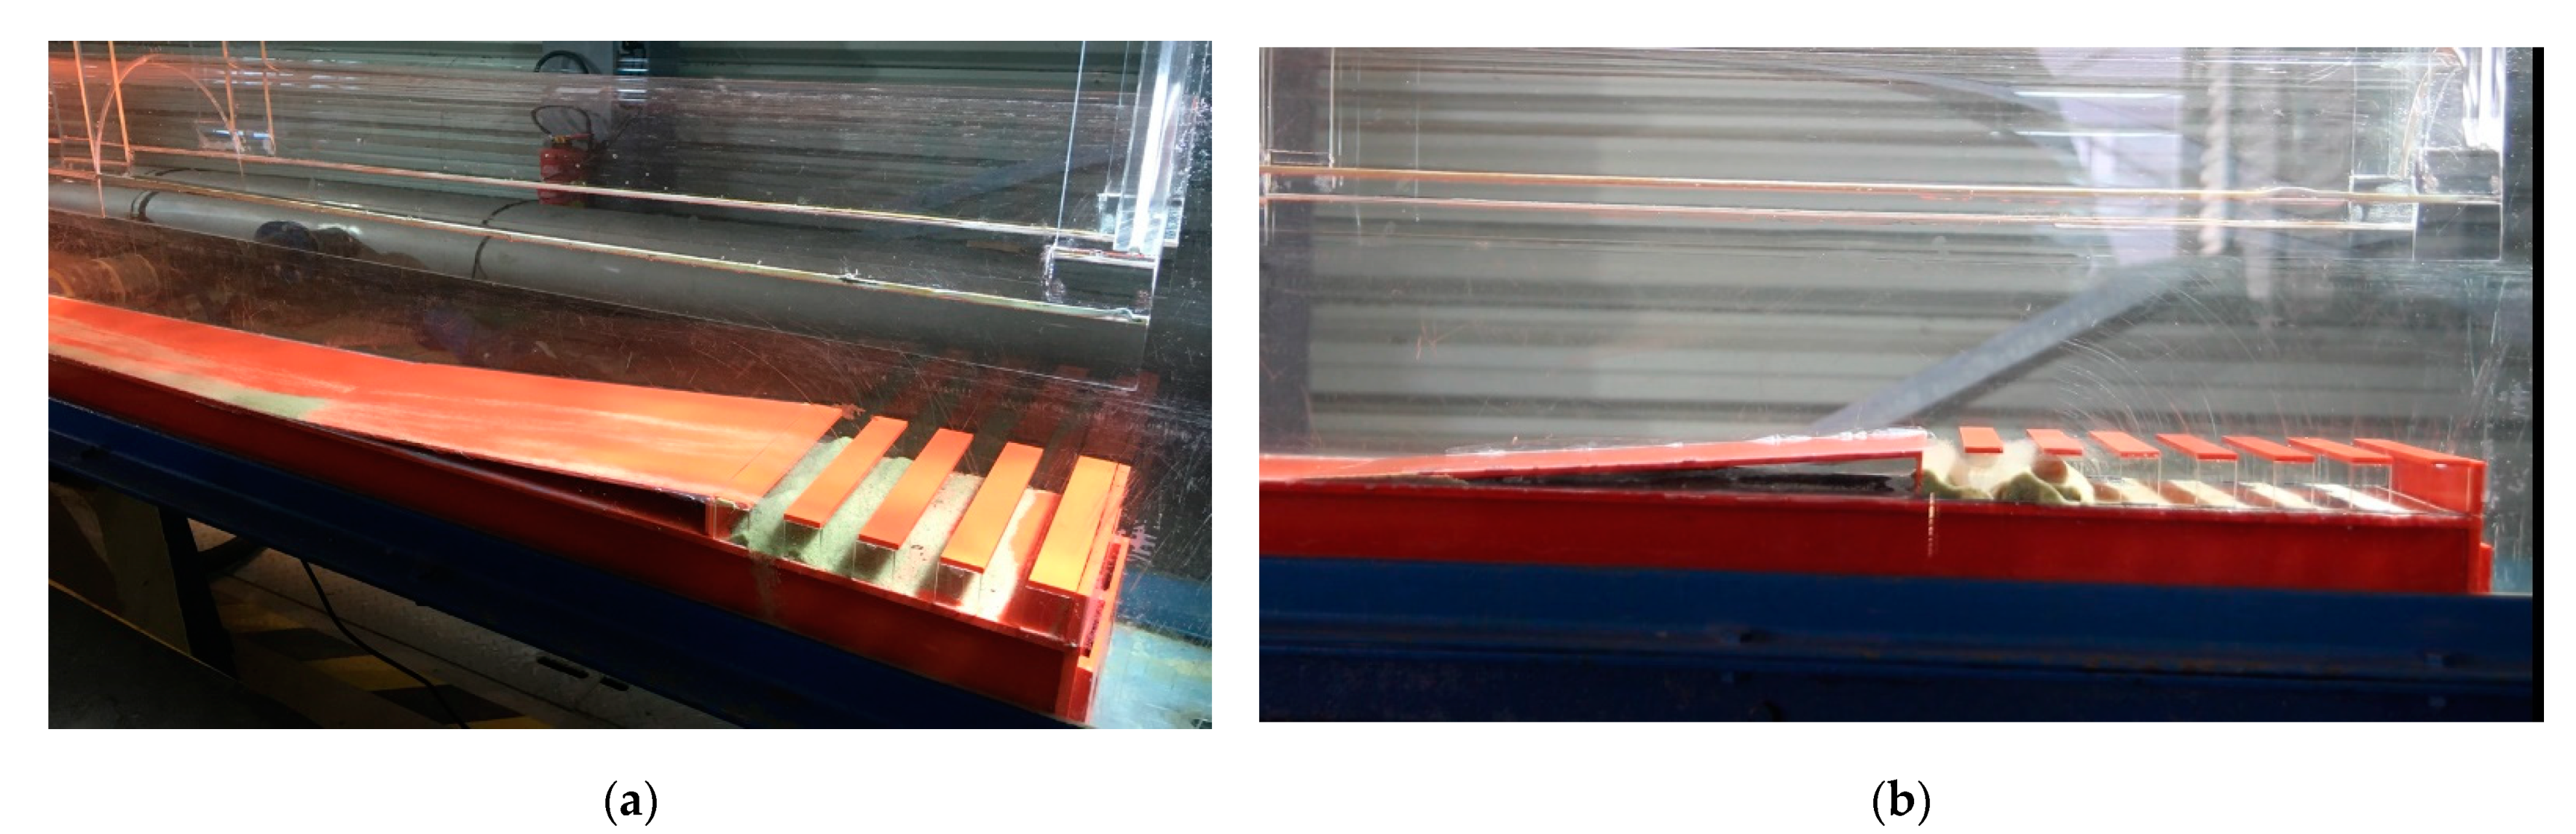
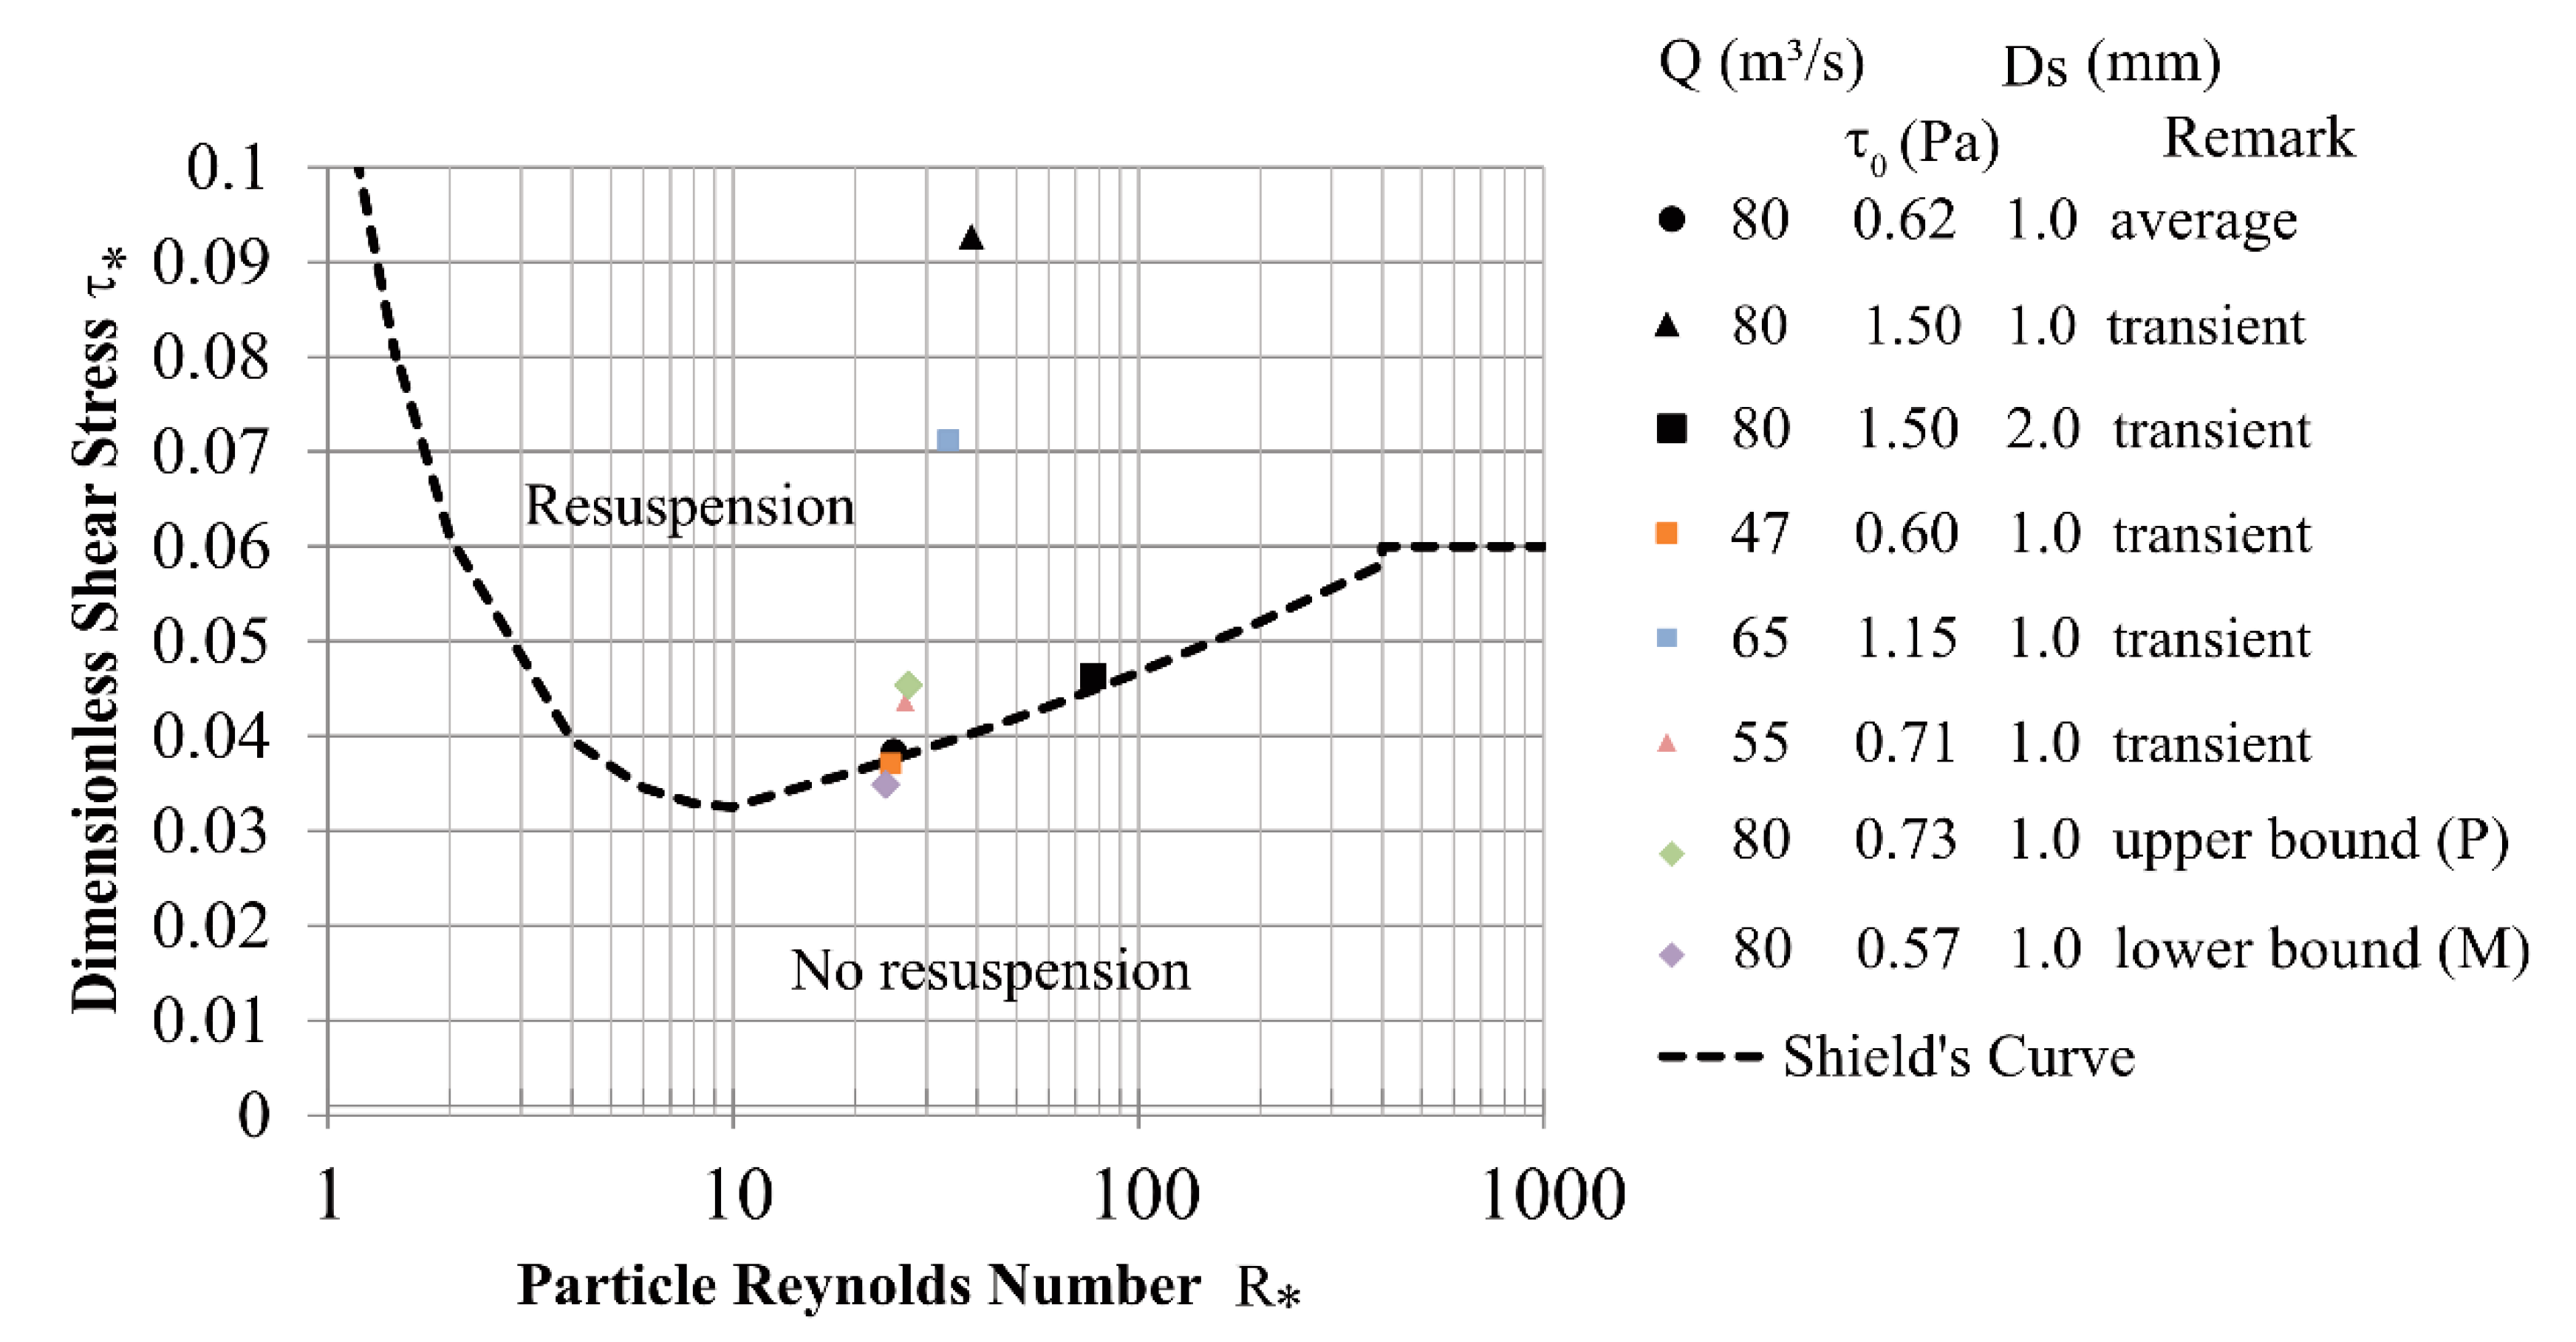
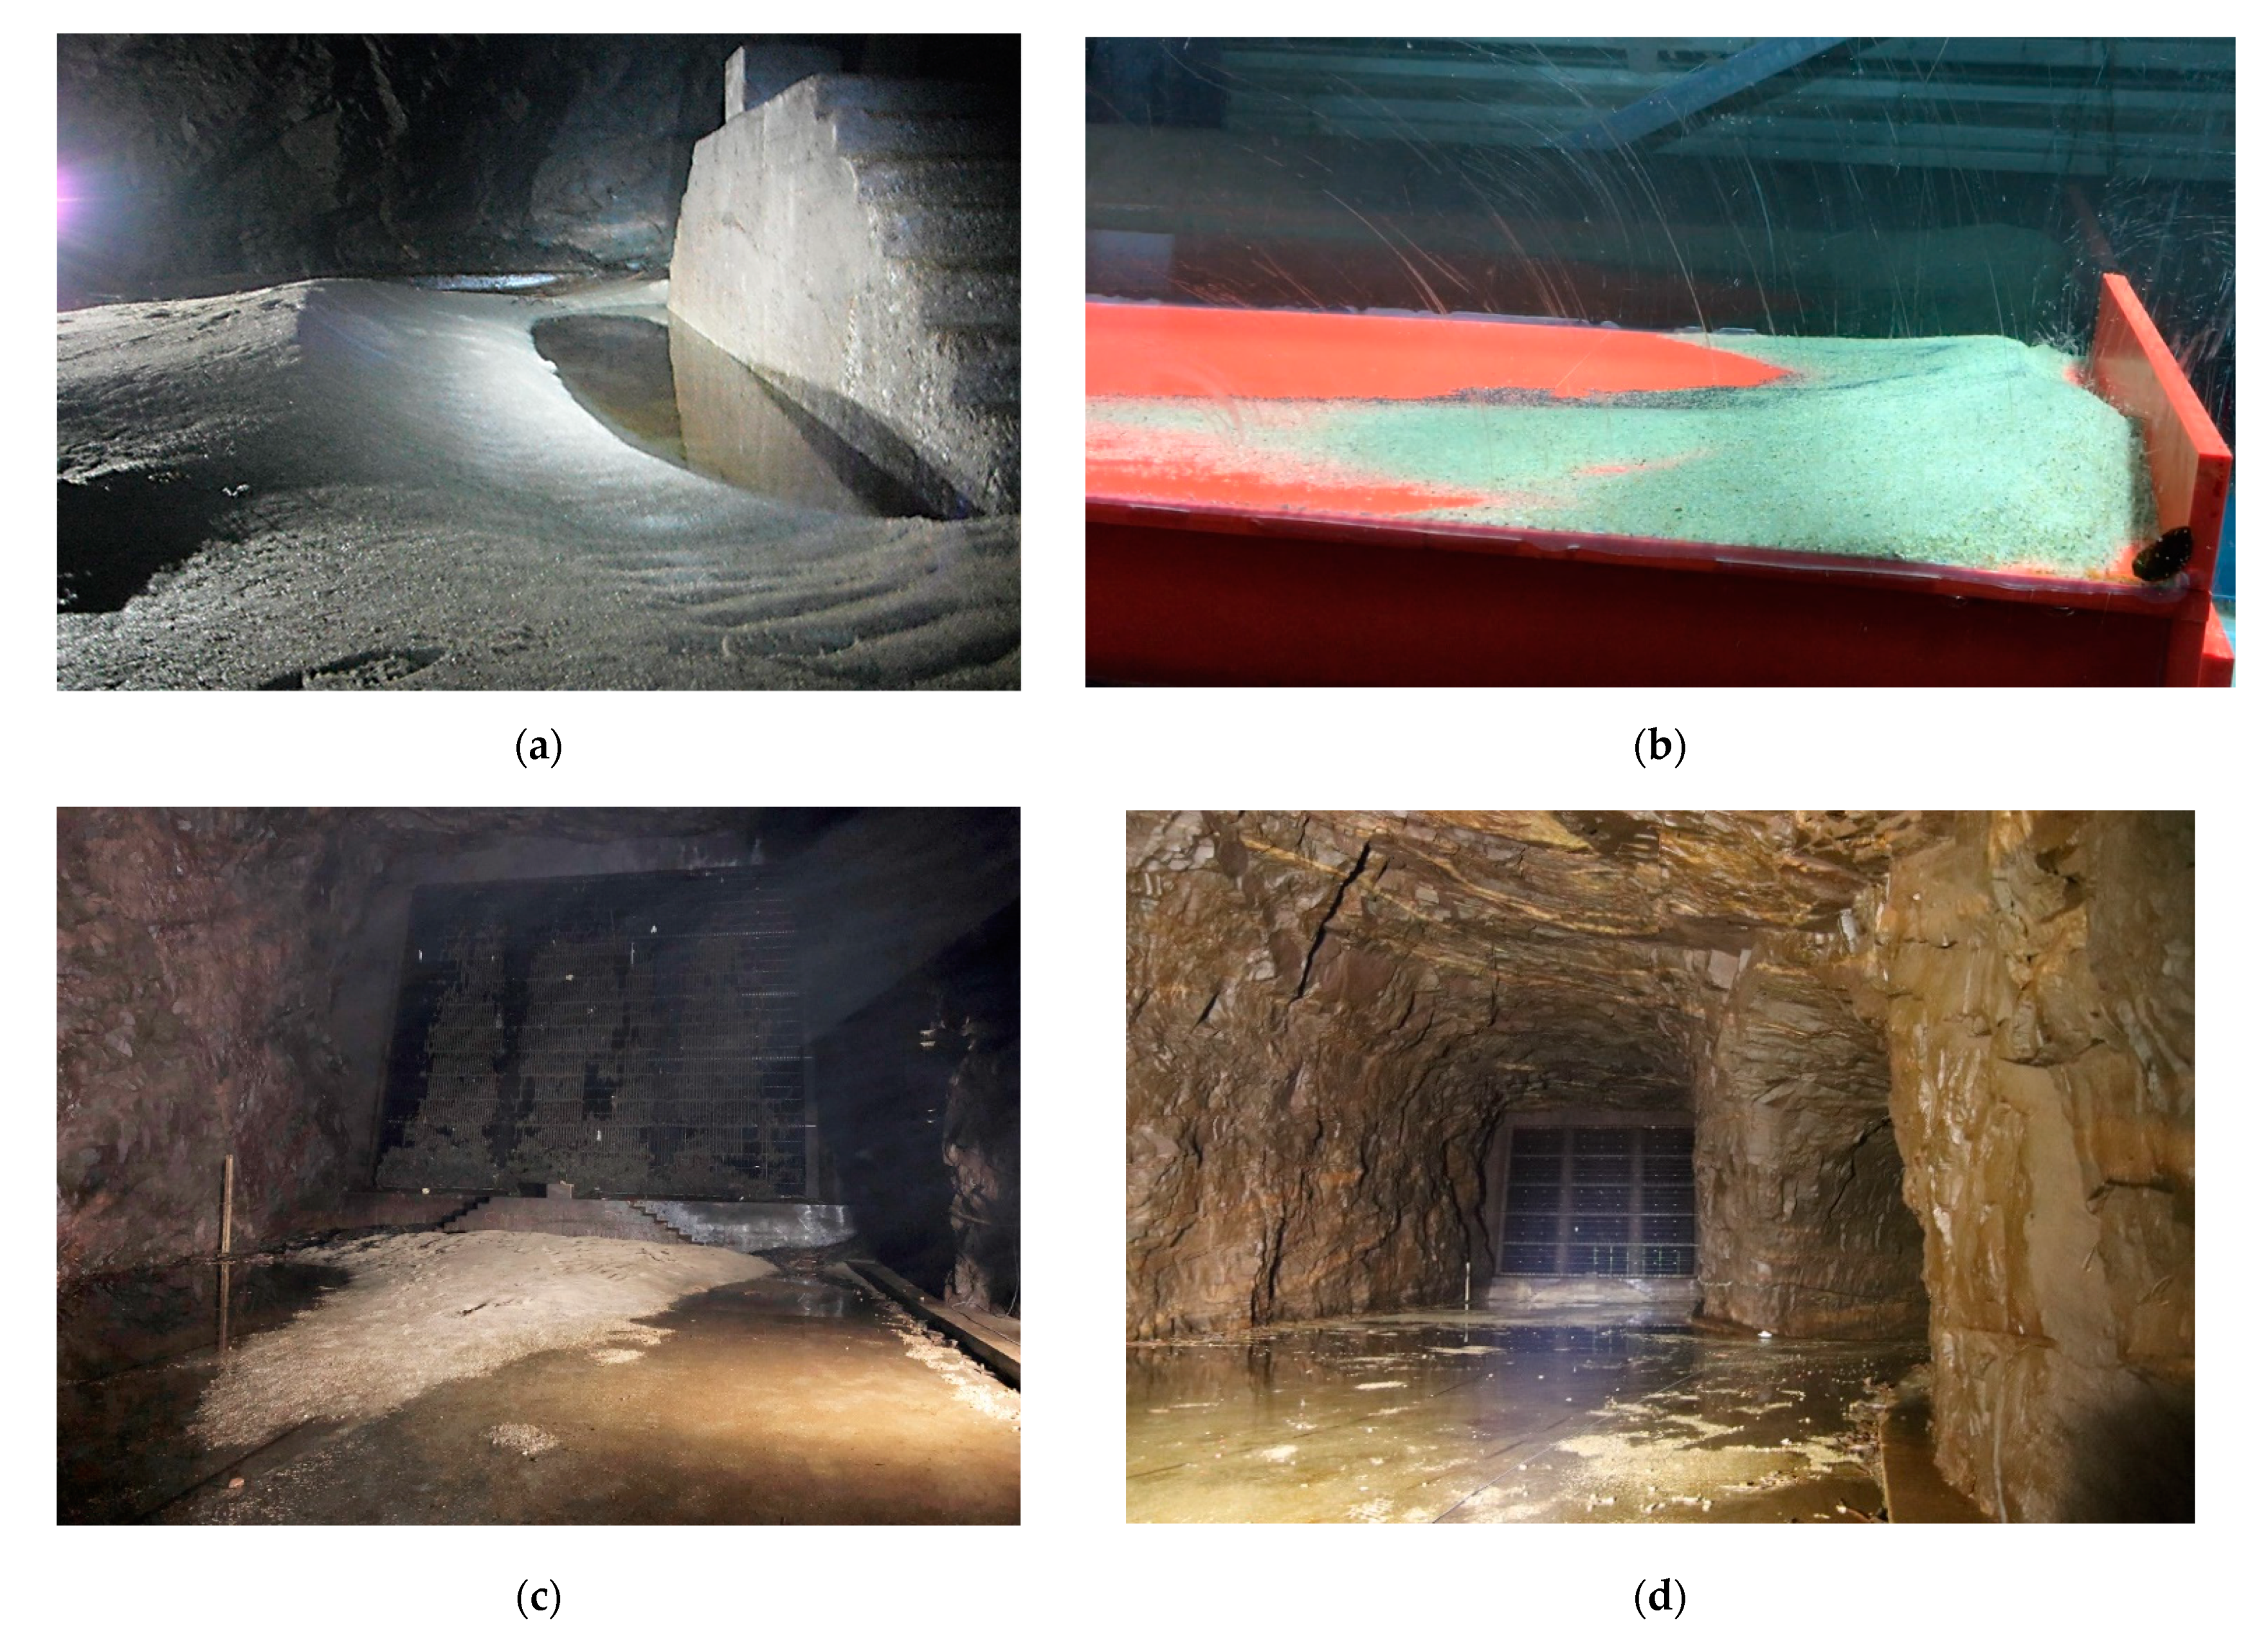
Table 1.
Modelling parameters.
| 3D CFD | Physical Scale Model | Prototype | |
|---|---|---|---|
| Geometry scale | 1:1 | 1:36.67 | |
| Water Velocity scale | 1:1 | 1:1 | |
| Discharge scale | 1:1 | 1:36.672 | |
| Sediment size scale | 1:1 | 1:1 | |
| Time scale (-) | 1:1 | 1 × 36.67 | |
| Sediment sizescale (-) | 1:1 | 1:1 | |
| Sediment volume scale (-) | - | 1:36.673 | |
| Re (-) | 8.2 × 10⁶ | 2.2 × 10⁵ | 8.2 × 10⁶ |
| Particle diameters (mm) | 0.3–1.0 | 0.3–1.0/5–30 | 0.01–100 1 |
| Density of particles kg/m3 | 2650 | 2650 | 2650 |
| Wall roughness, rock, ks concrete, ks (mm) | 300 1 | 0.1 0.1 | 300 0.76 |
| Materials/software | Ansys CFX, 2019 R3 | 30 cm wide flume in glass, acrylic glass crown | Real structure |
| Fluid | Water—RANS | Water | Water |
| Modelling strength | Transient flow conditions, bottom wall shear, hydrodynamic & particle settling | Transient particle transportation, settling- and resuspension processes, utilization of the flume | Observations |
1 Based on samples from the prototype [18].
Table 2.
Characteristic parameters for 3D CFD with particle tracking simulations.
| Parameter | Value | Parameter | Value |
|---|---|---|---|
| Scale | 1:1 | Geometry | Prototype |
| Particles diameter | 0.3–1.0 mm | Particle injection | Gate crown surface |
| Simulation time, Discharge | 240–300 s 80 m3/s | Roughness unlined wall, concrete | 300 mm, f: 0.052 1 mm |
| Timestep | 0.2 s | Particle roughness | No |
| Particle coupling | One-way | ||
| Particles injection | 1.0 kg/s 0.1 m/s 150 1/s | Restitution coefficient of particles on wall; perp., parallel | 0.9 (-), 0.9 (-) |
| Particles density | 2650 kg/m3 | Bottom roughness | 1.0 mm |
| Particle roughness | no | Material | Unlined Rock |
| Particle drag | sphere | Mesh | 0.35 cm, no inflation, refinements concrete |
| Turbulence modelling | RANS SAS-SST | Water temperature | 10 °C |
| Mesh size | >4 mill. elements | Wall boundary | Rough wall |
| Inlet boundary | Mass flow rate, resp. normal flow velocity | Outlet boundary | Opening pressure, 0 Pa |
Table 3.
Model test properties.
| Prototype | Model Test | |
| Inlet flow area (m2) | 48.9 | 0.036 |
| Gate flow area (m2) | 28 | 0.02 |
| Sand trap flow area (m2) | 119 | 0.089 |
| Discharge, Inlet flow velocity | 80 m3/s, 1.64 m/s | 59.6 l/s, 1.64 m/s |
| Discharge, average velocity | 80 m3/s, 0.67 m/s 65 m3/s, 0.55 m/s 55 m3/s, 0.46 m/s | 59.6 l/s, 0.67 m/s 48 l/s, 0.55 m/s 41 l/s, 0.46 m/s |
| Sand particles diameter | 0.01–100 mm | 0.3–1.0 mm |
| Gravel particles diameter | 5–30 mm | |
| Reynolds number (-) for Q = 80/65/55) in sand trap | 8.27/6.72/5.68 × 106 | 2.25/1.83/1.55 × 105 |
| Euler number (-) for Q = 80/65/55) in sand trap | 7.78/6.47/5.4 × 10−2 | 7.78/6.47/5.4 × 10−2 |
| Froude number (-) for Q = 80/65/55) in sand trap | 3.37/2.51/1.75 × 10−3 | 1.36/9.1/6.4 × 10−2 |
| Roughness of rock ks (mm) | 300 | 0.1 |
| Roughness of invert ks (mm) | 0.76 | 0.015 |
| Friction of invert f (-) | 0.011 | 0.011 |
| at Q = 80 m3/s | 0.038 | 0.038 |
| at Q = 80 m3/s | 24.93 | 24.93 |
Publisher’s Note: MDPI stays neutral with regard to jurisdictional claims in published maps and institutional affiliations. |
© 2021 by the authors. Licensee MDPI, Basel, Switzerland. This article is an open access article distributed under the terms and conditions of the Creative Commons Attribution (CC BY) license (https://creativecommons.org/licenses/by/4.0/).
Share and Cite
MDPI and ACS Style
Richter, W.; Vereide, K.; Mauko, G.; Havrevoll, O.H.; Schneider, J.; Zenz, G. Retrofitting of Pressurized Sand Traps in Hydropower Plants. Water 2021, 13, 2515. https://doi.org/10.3390/w13182515
AMA Style
Richter W, Vereide K, Mauko G, Havrevoll OH, Schneider J, Zenz G. Retrofitting of Pressurized Sand Traps in Hydropower Plants. Water. 2021; 13(18):2515. https://doi.org/10.3390/w13182515
Chicago/Turabian StyleRichter, Wolfgang, Kaspar Vereide, Gašper Mauko, Ola H. Havrevoll, Josef Schneider, and Gerald Zenz. 2021. "Retrofitting of Pressurized Sand Traps in Hydropower Plants" Water 13, no. 18: 2515. https://doi.org/10.3390/w13182515
Note that from the first issue of 2016, this journal uses article numbers instead of page numbers. See further details here.