Article

Is Drought Caused by Fate? Analysis of Farmers’ Perception and Its Influencing Factors in the Irrigation Areas of GAP-Şanlıurfa, Turkey

1
Department of Agricultural Economics, Faculty of Agriculture, Harran University, Şanlıurfa 63050, Turkey
2
Department of Social Science Vocational School, Harran University, Şanlıurfa 63200, Turkey
3
Department of Bozova Vocational School, Harran University, Şanlıurfa 63850, Turkey
4
Department of Soil Science and Plant Nutrition, Faculty of Agriculture, Harran University, Şanlıurfa 63050, Turkey
5
Department of Civil Engineering, Faculty of Engineering and Architecture, Kastamonu University, Kastamonu 37150, Turkey
6
Department of Economic Policy, Faculty of Economics and Administrative Sciences, Harran University, Şanlıurfa 63050, Turkey
7
Department of Agricultural Economics, Faculty of Agriculture, Isparta University of Applied Sciences, Isparta 32200, Turkey
8
Department of Sociology, Faculty of Arts and Sciences, Harran University, Şanlıurfa 63050, Turkey
9
Şanlıurfa Technology Development Zone, Harran University, Şanlıurfa 63050, Turkey
10
GAP Agricultural Research Institute and Agricultural Education Center, Republic of Turkey Ministry of Agriculture and Forestry, Şanlıurfa 63330, Turkey
11
Southeastern Anatolia Project (GAP) Regional Development Administration, Republic of Turkey Ministry of Industry and Technology, Şanlıurfa 63330, Turkey
*
Author to whom correspondence should be addressed.
Water 2021, 13(18), 2519; https://doi.org/10.3390/w13182519
Submission received: 20 July 2021 / Revised: 10 September 2021 / Accepted: 13 September 2021 / Published: 14 September 2021

Abstract

:
This research aims to determine the belief-based drought perceptions and attitudes of farmers in Şanlıurfa, which is in a semi-arid climate regime, and the factors affecting them. The surveys were conducted through face-to-face interviews with farmers selected by a simple random sampling method in 2020. Analyses were performed with ordinal logit regression in STATA. According to the results, while the effects of settlement location, land size, age, and the size of the household were statistically significant to farmers seeing drought, which is the dependent variable, as caused by fate, the effects of income, experience, and education level were insignificant. For the probability of predicting drought for each independent variable in the sequence analysis, the highest probabilities were found among farmers in the Harran Plain, with 21–30 years of experience, from a household of one to four people, with the land area between 5.1 and 10.0 hectares, aged 61 and above, who were primary school graduates, and who had an annual income of less than 25,000 TL ($3561). The subject of drought should be given more place in religious education in the entire research area by prioritizing these groups. It would also be beneficial to organize workshops for the farmers by agricultural consultants, where Islamic scholars would be present to support science and knowledge in terms of faith. This study is the first in this context in Turkey and provides useful data to policymakers for drought-mitigation policies.

1. Introduction

People’s religion and belief influence their perceptions, attitudes, and lives at different levels. Religion is a set of teachings that encompass life; it has certain rules, orders, and prohibitions, gives various directives, offers a lifestyle whose borders are sometimes flexible and sometimes rigidly drawn, a life cycle that is sometimes static and sometimes dynamic, and predicts behavioral patterns in different life areas [1]. Although there is no definition of religion that everyone agrees on, religion, in general, is a set of beliefs and worships based on the idea of God; it often utilizes supernatural, sacred, and moral elements, entails various rites, practices, values, and institutions, and makes up a socio-cultural system of rules that affects the attitudes and behaviors of individuals [2,3]. On the other hand, every system that is decisive in the world of thought and life cycle of human beings can be accepted as a religion, whether it includes the idea of god or not, whether it has metaphysical values or not [1]. Religion is both a cultural tradition and personal choice, and an important part of the cultural heritage emerges based on attitudes and behaviors related to religious traditions. Religion is also part of the inner individual sphere that influences personal values and behavioral habits. However, the influence of religion on personal habits depends on the degree of belief of each individual [4].
Belief emerges based on religion, and sometimes, both are used interchangeably. The concept of religion has different forms in different cultures, communities, and individuals, and it has been redesigned, for a given religion, by the members according to the geography and cultural values in every age [2]. According to the Qur’an, the holy book of Muslims, religion is a system that determines people’s mental functions, beliefs, thoughts, attitudes, behaviors, worship, social structures, and organizations [1,3]. The understanding of destiny exists in many beliefs and is based on the belief that most of what will happen to people is not in their own hands. Destiny, which is a concept in many different religions, is the eternal power believed to have pre-ordained all events [5,6].
Every society lives in a natural, economic, and socio-cultural environment. Perceptions, attitudes, and behaviors of individuals both affect and are affected by these environments [7]. Most of the problems related to the natural resources and environment are based on the activities of human beings, which cause sustainability problems [8,9,10,11]. Globally, climate change, which is a complex issue with multidimensional causes and effects, is one of the most important problems of our time; much research has been done on issues related to climate change such as high temperatures, more frequent droughts, and changing precipitation patterns [12,13,14,15,16,17,18,19,20]. Turkey has unique climatic zones and microclimate areas due to its geographical location and structure. Climate, especially precipitation, which has the greatest impact on production, shows great temporal and spatial changes [21]. Drought is a period when abnormally low rainfall, substantially lower than long-term averages, persists for a long time [22]. Drought has meteorological, hydrological, agricultural, and socio-economic effects [12].
Agricultural drought is closely related to various features of meteorological drought, depending on climate change. It is defined as the lack of water in the soil to meet the needs of the plant and occurs when there is moisture loss and a scarcity of water resources [21]. The first effects of drought, which is a slowly developing natural disaster, are seen in the agricultural sector [23], which is crucial in every country to ensure food security, the provision of raw materials to other sectors, employment, and rural development [24,25,26]. Due to the nature of drought, even if it occurs in one region, its effects can creep into other areas and be long-lasting, and it is quite complex to manage due to the uncertainty of the start and end dates [21,23,27,28]. The start and end dates depend not only on the duration, severity, and geographic extent of the particular dry period but also on the demands of human activities on water resources. When considered together with its wide-ranging effects, it is difficult, although not impossible, to determine and measure the effects of drought on society, the economy, and the environment [23].
Different studies on natural resources and the environment have tried to determine variables that support or thwart individual attitudes toward public policies. In one of the first studies to determine individual attitudes and concerns for the environment, age, education, and political ideologies were found to be effective factors [29]. In another pioneering study, the effect of religious belief on environmental problems was investigated [30]. Later, different authors investigated the role of religious beliefs in the conservation of natural resources and the environment [31,32,33,34,35,36]. In a recent study, 18 variables were determined to be effective in individual attitudes and concerns for the environment, with the belief among these variables [37]. In this study, it was demonstrated that some relationship existed between religious beliefs and the variables. In principle, religion and belief are expected to have an impact on individual attitudes and concerns, as they provide a cosmological view of how humans should relate to other living things and their environment [38]. More importantly, religious practices and beliefs offer a moderate life that restricts individuals and, therefore, consumers [4].
In a study to determine the willingness to pay to avoid the effects of water-use restrictions in case of drought in the UK, it was found that the severity and frequency of drought and the costs of avoiding drought were effective factors in the decisions of individuals [39]. In a study on the behavioral psychology of farmers in the fight against drought in China, behavioral rationality was determined to be an effective factor [40]. In a study conducted to find ways to combat drought in Ghana, it was determined that age, education, income, land ownership, and awareness were among the effective factors [41]. In a study on drought and emotional interaction with farmers in the Netherlands, farm income, experience, and perceived control measures were found to be important explanatory variables [42]. In a study on farmers and drought risk perception in the semi-arid region of Tanzania, it was determined that perception increased through education [43]. A study conducted in Ethiopia concluded that the perceived climate change and drought were not sufficient in the fight against them [44]. In a study on drought risk perception among local people of different faith groups in Africa, the effect and importance of social network was emphasized due to the low level of education among the influential factors [45]. In a study on drought risk perception in the USA, no consensus was reached among community members on who should manage it and how, even if there was a perception because drought is complex and sometimes contradictory [46]. In a study conducted in England, it was determined that climate change increased the perception of drought risk [47]. In a study on cognitive risk perception and its effective factors among Polish farmers, it was determined that subjective factors were much more effective than objective factors [48]. In a study conducted to determine the willingness of farmers to pay for participation in drought adaptation policies in the GAP (The Southeast Anatolia Project) Region in Turkey, it was suggested that farmers’ perception of drought and fate should be investigated [20].
Knowing the factors that affect individual attitudes and concerns for natural re-sources, the environment, and disasters is of critical importance in determining and implementing more efficient policies and obtaining the desired results. For all these reasons, the importance of drought should not be detached from its social context. Different factors that shape individual risk perceptions have been pointed out in some studies, and while economic theory deals with objective risk variables, psychology and sociology focus on subjective risk variables [42]. Today, drought management is inefficient because the feedback between drought and people are not fully understood, and the concept needs to be rearranged to include human attitude, role, and influence in combating drought [15]. This research aims to determine the belief-based drought perceptions and attitudes of farmers in the Harran plain and Yaylak irrigation areas in GAP-Şanlıurfa and the factors affecting them.

2. Materials and Methods
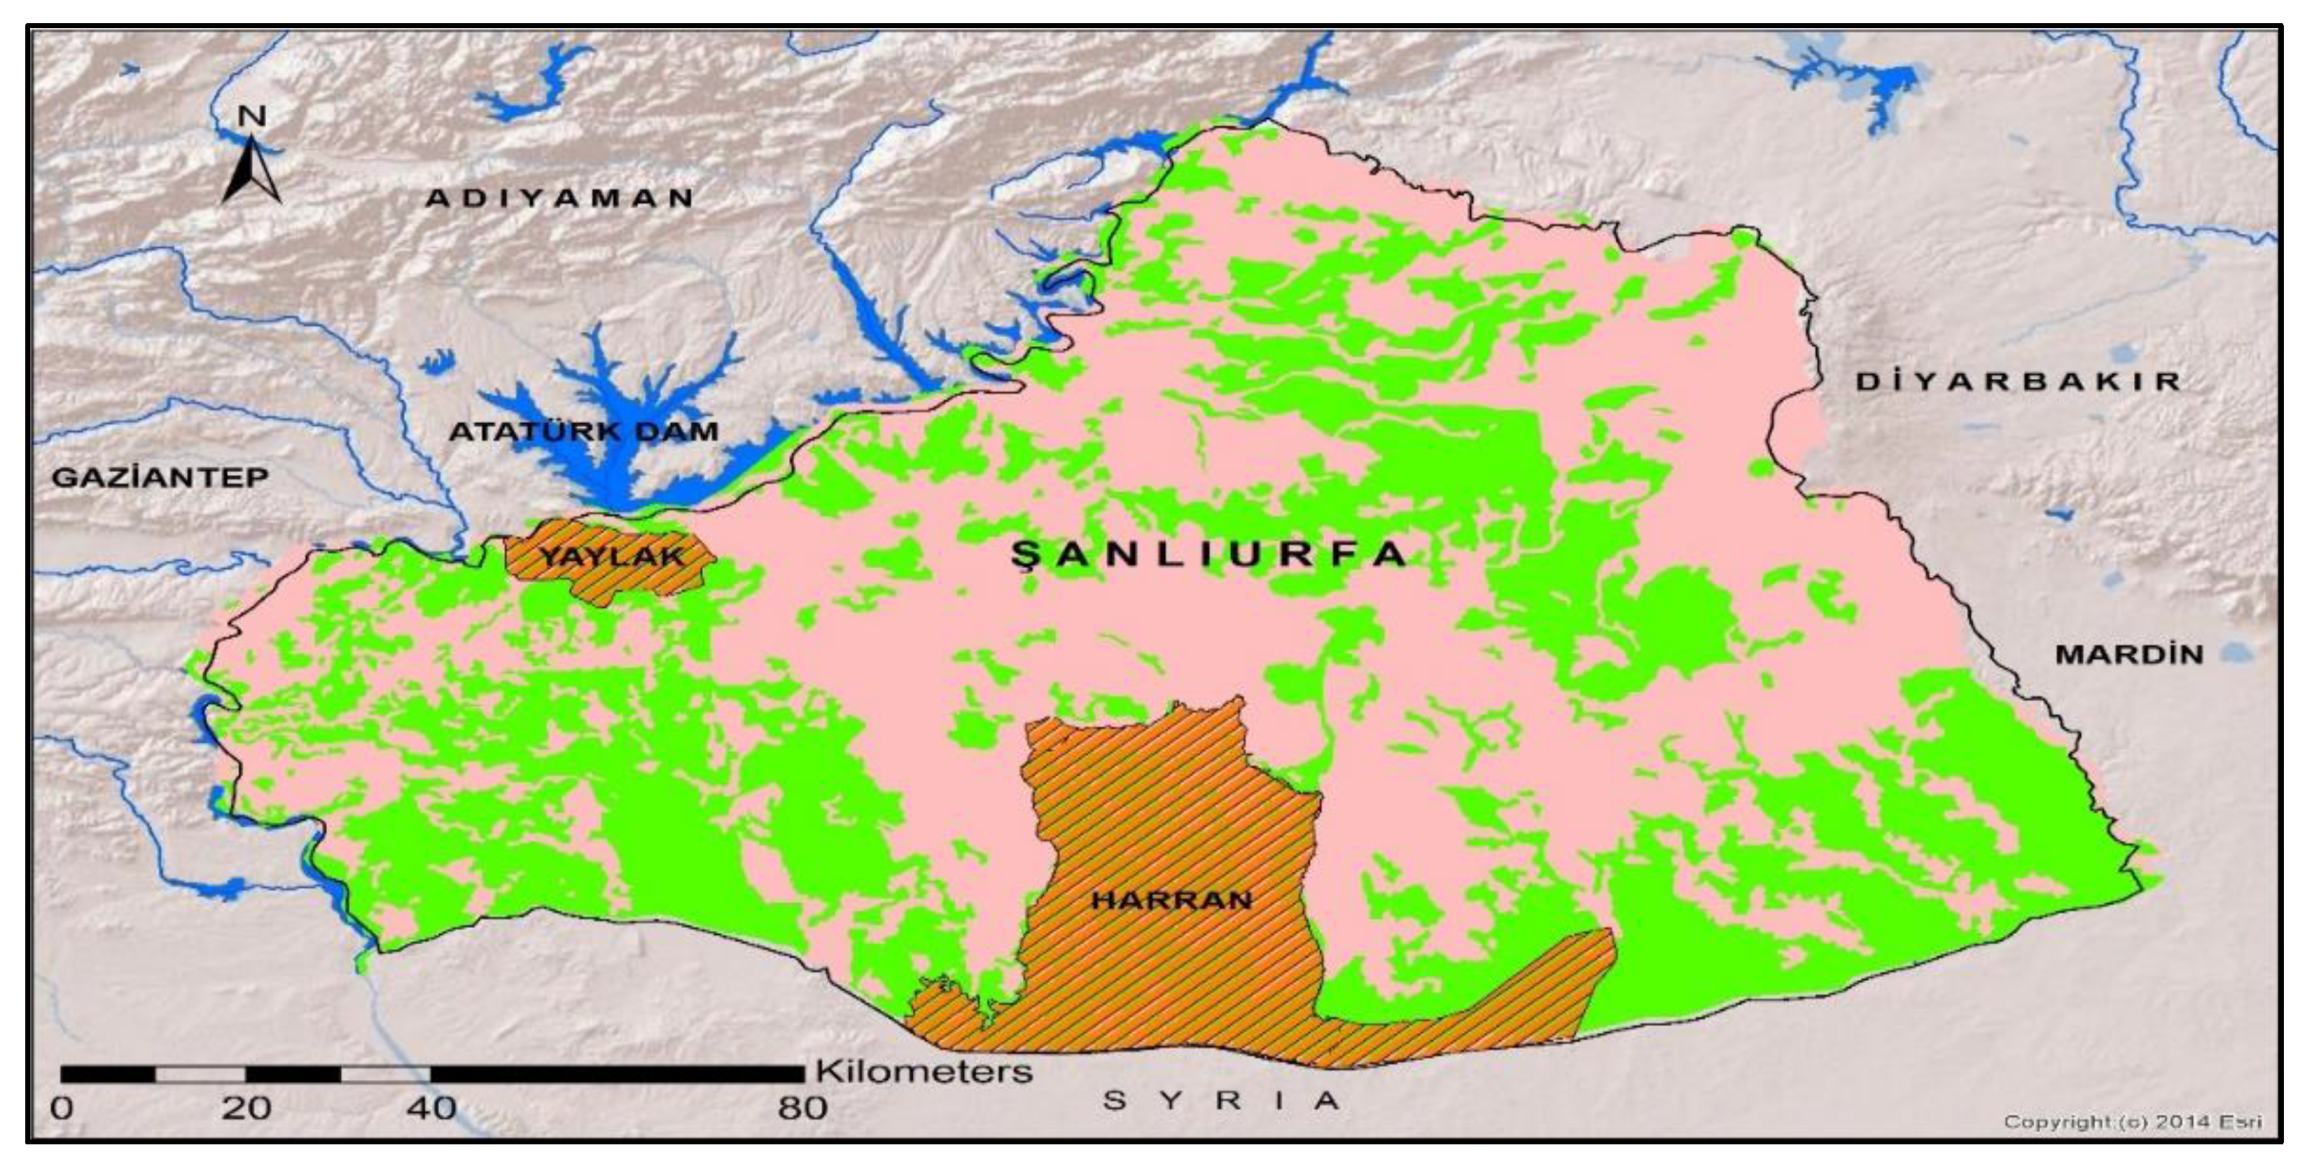
2.1. Study Area

In a study on the basic elements of rural social structure in Turkey, it was determined that low income, poor connection with the outside world, social inactivity, low education level, and a belief-based culture are dominant [49]. Generally, individuals living in rural areas of Turkey are not open to change and education, exhibit conservative attitudes, and use religious elements in all areas of life. For this reason, they are cautious about their development, sometimes even prejudiced, and they reject development without examining and questioning [50,51,52]. GAP and Şanlıurfa generally have a patriarchal structure, strong tribal ties, generally depend on the tribal norm and culture of the region in decision making, do not fully participate in democratically organized structures, and are not very open to change [6,53,54].
Although the average annual precipitation in Turkey is around 640 mm, water shortage and drought are experienced in many regions due to the irregularity of precipitation distribution [21]. Turkey is among the countries in the second-highest category in terms of water shortages in the context of the possible effects of global warming in the Mediterranean region [55,56], droughts are expected to increase, especially in summer, due to increased temperatures [22]. The most severe and widespread drought events in Turkey occurred in 1971–1974, 1977, 1982–1984, 1989–1990, 1994, 1996, 2001, 2007–2008, 2013–2014, and 2020 [21,27,57,58,59]. The Central Anatolia and Southeast Anatolia region (GAP in Turkish acronym) of Turkey often experiences droughts [60]. The GAP region is located in the Euphrates sub-basin, where 128 months of moderate to severe drought have occurred between 1984 and 2015 [61]. Şanlıurfa is located in the GAP region, which is Turkey’s second least developed region [11]. Şanlıurfa, with a population of 2.155 million, is the eighth-most populous city in Turkey [62]. The locations of the GAP region and the province of Şanlıurfa in Turkey are given in Figure 1.
Between the years 1929 and 2019 in Şanlıurfa, the average annual amount of precipitation was 463.6 mm, the average annual number of rainy days was 73.5, and the average annual temperature was 18.4 °C [63]. Between the years 2000 and 2020 (21 years), the GAP region received less rainfall than its annual average for 12 years, and Şanlıurfa has received 13% less rainfall than the average of the GAP region [63,64]. Between 2008 and 2017, Şanlıurfa experienced exceptional drought conditions twice, extreme drought twice, severe drought once, moderate drought once, and abnormal drought four times [65]. According to the projection analysis performed by the Ministry of Agriculture and Forestry on the Atatürk Dam in GAP-Şanlıurfa, which is the GAP region’s source of hydro energy, drinking water, and irrigation water, the amount of surface water is expected to decrease by 23.3%—and from 67.2% to 55.1% for the south—between 2018 and 2100 [20].
Turkey’s sectoral share of agriculture was 6.2% of the gross domestic product in 2018 [25,66], with 17.7% of Turkey’s total employment in agriculture [25,67]. The main livelihood in Şanlıurfa is agriculture and agriculture-based industry. Şanlıurfa, with an area of 1.06 million hectares (ha), ranks first in the GAP region and third in Turkey in terms of agricultural areas, where the irrigable area is 941,000 ha and the economically irrigable area is 764,800 ha [68]. By the end of 2019, irrigated agriculture had been conducted on an area of 481,800 ha [66], which was 45.5% of the total land. There is about 2.5 million livestock in Şanlıurfa, with average annual milk production of 426,000 tons [69].
The first irrigations in Şanlıurfa started in 1994 with an area of 30,000 ha in the Harran plain [70]. The irrigation areas expanded with time, and today, it has reached an area of 166,000 ha with the irrigation of Upper Harran. Irrigation systems of gravity 85% and pressure 15% are applied in the irrigation of the Harran plain located in the south of Şanlıurfa. The crop pattern in the Harran plain in 2019 consisted of 98.7% field crops (90% of which were cotton, 6% wheat, 3% corn, and 1% other produce) and 1.3% vegetables, fruits, and other produce. The Yaylak irrigation area located in the northwest of Şanlıurfa began operations in 2006, with pressurized irrigation conducted on an area of approximately 22,000 ha. The crop pattern in this area in 2019 was 47.7% field crops (79.4% of which were cotton, 7% wheat, 12.2% barley, and 1.4% other produce), 48.3% fruit trees (96.7% of which were pistachio, 2% almonds, 1.3% grapes), and 4% vegetables, ornamental plants, and forest produce. In both irrigation areas, water shortage problems are experienced from time to time [69,71,72]. The locations of Şanlıurfa-Harran Plain and Yaylak irrigation areas are given in Figure 2.

2.2. Data Sources and Survey Design

The main material of the research was the primary data obtained from farmers in the Harran plain and Yaylak irrigation areas. Primary data are often collected in at least one of three ways, viz.: surveys, observation, and interviews [73,74]. The data in this study were obtained through face-to-face surveys with farmers selected by simple random sampling in 2020. The number of farmers registered in the farmer registration system in Şanlıurfa in 2019 was 59,862, of which 15,824 were in the Harran plain and 3180 were in the Yaylak irrigation area. Thus, the number of registered farmers in the research area was 19,004.

2.3. Statistical Methods

The sampling volume was found at the 95% confidence limit, with a 5% margin of error, using the Formula (1) [75] given below.
n = N × p × q ( N 1 ) × σ p 2 + p × q
where n is the sampling volume; N is the number of samples in the population, i.e., 19,004; p is the rate at which the farmers accepted the survey and were included in the sample, which was taken as 0.5 to reach the maximum number of surveys; q is the rate at which the farmers declined to participate in the survey (1 − p = 0.5); and σ p 2 is the variance ratio, which is given by Formula (2) below.
σ p 2 = ( r Z 2 ) 2
In Formula (2), Z 2 is the z-scale value, which is 1.96, and r is the margin of error, i.e., 5%. When these values were substituted in the formula, σ p 2 = 6.51 × 10⁻⁴ was obtained. When σ p 2 and the other values were substituted in Formula (1), n was found to be 377. To be on the safe side, the sampling volume was increased by 15%, and 432 surveys were conducted, of which 308 were conducted on the Harran plain and 124 were conducted in the Yaylak irrigation area. Five questionnaires were incomplete and inaccurate, so only 427 questionnaires were used in the analyses. The obtained data were processed using Excel, depending on the specific code plan, and then ordinal logit regression analysis was performed on STATA.
Ordinal logit regression is a type of analysis used when the dependent variable is a sortable qualitative variable whose level is above 2. There is a hierarchy among the dependent variable levels in an ordinal logit regression model. Levels can be ordered from negative to positive, from the least to the highest [76]. In addition, the independent variables in this method can be of any type. The assumptions need to be tested after the model has been estimated and 3 assumptions need to be checked. There are no multicollinearity problems between independent variables, no model specification error, and no parallel regression assumption. Parallel regression assumption is the assumption that the probability of transition from one level of the dependent variable to another level is equal. In other words, the same parameters must be responsible for the transition from one level of the dependent variable to another level [77].
Odds ratios for variables can also be calculated in ordinal logit regression. Accordingly, if the odds ratio is greater than 1, it means that the probability of being on the next level of the dependent variable is high, and if it is less than 1, it means that it is low. In addition, the calculation of the marginal effects of the variables in the ordinal logit regression makes it easier to understand the effects of the change in the independent variable on the dependent variable. The general representation of ordinal logit regression is given by Formula (3) below [76,78].
Ordinal   logit   regression = [ P ( γ j \ x ) 1 P ( γ j \ x ) ] = μ j k = 1 K β k X k ,   j = 1 ,   2 ,   . j 1
Here, γ j jth is the cumulative probability value for the category, μ j jth is the threshold value of the category, β1…βk are the regression coefficients, x1,…, xk are the explanatory variables, and k represents the number of explanatory variables.
In the categorical independent variable, the marginal effects should be evaluated by taking the difference of the probability values of the variable. For this purpose, the estimated probability of change for the variable x k with the starting value x k start and the ending value x k end can be obtained by Formula (4), which is given below [79].
Δ Pr ( y = m | x ) Δ x k   ( x k start x k end ) = Pr   ( y = m   |   x ,   x k = x k end ) Pr   ( y = m   |   x ,   x k = x k start )
Odds values in ordinal logistic regression can be modeled with Formula (5) given below [80].
Odds   ( Y j ) = P   ( Y j ) 1 P   ( Y j )
The odds ratio is the ratio of the odds value of two different events. This is estimated by exp (B).

2.4. Uncertainties and Shortcomings

The factors affecting the attitudes and perceptions of individuals are very diverse. Individuals can react differently to the same event depending on time, place, media, and mood. Religious beliefs and the degree of loyalty to them depend on the socio-cultural structure of the research area and are not fully tangible and measurable. Although forms of worship are based on certain rituals, concepts such as conscience and faith cannot be fully materialized. Although it is expected that the answers to be given will vary depending on the degree of belief and loyalty, the question “how much do you adhere to Islam, how often do you practice your beliefs and worship” could not be asked because it creates sensitivity and is not welcome in individuals. Another limitation of the research is that this study has never been done in Turkey, and there are almost no studies directly on this subject in the world. Therefore, there have been inadequacies in comparing and discussing the obtained results with the other studies.

3. Results and Discussion

3.1. Analysis of the Farm Holdings

Only male farmers participated in the surveys due to the socio-cultural structure of the research region. The average age of the farmers was 48.92 years, 99.5% of them were married, and the average size of their households was 8.64 people. The average farming experience of the participants was 31.84 years, the average size of farmland was 13.11 ha, and the average annual household income was 73,957.87 Turkish lira (TL) ($10,535.31). The average exchange rate for 2020 is $1 = 7.02 TL [81]. The descriptive statistics of the farmers are given in Table 1.

3.2. Is Drought a Fate?

About 57.7% of the participants had concerns about climate change, 9.7% were partially concerned, and 32.6% had no such concerns. About 68.3% of the participants felt that drought was caused by fate, 9.5% thought it was only partly caused by fate, and 22.2% believed that it had nothing to do with fate. A study conducted in the Netherlands concluded that farmers’ perceptions of risk were shaped by both rational and emotional factors [42]. In the current study, the question of whether drought is caused by fate was taken as the dependent variable, and the location of the irrigation area, size of land, income, farming experience, age, education level, and size of the household were taken as the independent variables. The effects of these independent variables on the dependent variable and the possibility of seeing drought as caused by fate were investigated. In this context, Table 2 shows the results of the ordinal logit analysis.
The likelihood ratio chi-square (LR chi-square) statistic was calculated as 45.65, with p = 0.001. According to this result, it is possible to say that the model was significant at the error level of 0.01. Pseudo R2 was calculated as 0.070. In ordinal logit regression, after model estimation, there should be no multicollinearity problem between independent variables and no model specification error, and parallel regression assumptions should be tested. Since there was no continuous independent variable in the model, testing for multicollinearity was not performed. In testing for the other two assumptions, the link test was used for the model specification, and the likelihood ratio test was applied to the parallel regression assumption. As a result of the link test applied to the model specification, it was determined that the coefficient of the hatsq variable in the output was statistically insignificant (coefficient = 0.206, p = 0.194). According to this result, it is possible to say that there was no model specification error. From the results of the likelihood ratio test applied to the parallel regression assumption, the test statistic was calculated as 27.97, with p = 0.217. This result proved the parallel regression assumption [76,77,78,79,82].
The coefficient of Yaylak irrigation in the irrigation area variable was calculated as −0.996 (see Table 2), which was statistically significant (p < 0.01). The marginal effect of Yaylak irrigation was calculated as −0.219, which was statistically significant (p < 0.01). According to this result, the probability of seeing drought as caused by fate by farmers in the Yaylak irrigation was 0.219 units less than the probability of seeing drought as caused by fate by farmers in the Harran plain, which was taken as the baseline level. Only land size of at least 30.1 ha was statistically significant (p = 0.023). The coefficient of this variable was calculated as −1.150. The marginal effect of the variable was calculated as −0.266, and it was statistically significant (p = 0.026). According to this result, the probability of seeing drought as caused by fate by farmers who owned 30.1 ha lands or more was 0.266 units less than the probability of same by farmers who had 5.0 ha lands or less, which was the baseline level. In a study conducted to combat drought in Ghana, land size was found to be an effective factor [41]. In the current study, it was determined that income and farming experience were statistically insignificant in perceiving drought as caused by fate (p > 0.10). On the other hand, in the studies conducted in Ghana and the Netherlands, it was determined that income and experience were effective factors [41,42].
For the age variable, the coefficient for the 36–43 years’ age range was calculated as 1.164, which was statistically significant (p = 0.037). The marginal effect of this group was found to be 0.283 (p = 0.025). The coefficient for the 44–52 years’ age range was calculated as 1.446, which was statistically significant (p = 0.017). The marginal effect of this group was found to be 0.346 (p = 0.011). The coefficient for the 53–60 years’ age range was calculated as 1.808, which was statistically significant (p = 0.008). The marginal effect of this group was found to be 0.417 (p = 0.004). For the 61 years and older age group, the coefficient was calculated as 2.643, which was statistically significant (p = 0.002). The marginal effect of this group was found to be 0.535 (p = 0.000). According to these results, it is possible to say that the probability of perceiving drought as caused by fate increased as age increased when the age group 35 years and below, which was the baseline level, was compared with other age groups. In the study conducted in Ghana, age was determined as an effective factor [41].
It was determined that the level of education was statistically insignificant in perceiving drought as caused by fate (p > 0.10). On the other hand, education was determined as an effective factor in studies conducted in Ghana and Tanzania [41,43]. The coefficient for households of between five and nine people was calculated as −1.026, which was statistically significant (p = 0.099). The marginal effect of this group was calculated as −0.153 (p = 0.025). The coefficient for households of 10 or more people was calculated as −1.471, which was statistically significant (p = 0.028). The marginal effect of this group was found to be −0.249 (p = 0.003). According to these results, the probability of perceiving drought as caused by fate by households with five to nine people was 15.3% less than that by households with one to four people, which was the baseline level. This probability for households with 10 or more people was 24.9% less than the baseline.

3.3. Probability of Perceiving Drought as Fate

The probabilities of perceiving drought as caused by fate for each independent variable used in the ordinal analysis are given in Table 3, where “yes” is for the dependent variable. According to the results of Table 3, the highest probability of perceiving drought as caused by fate for the irrigation area variable was found for the Harran plain. Farmers in the Harran plain are more conservative, so this result is consistent with pre-research expectations. For the farming experience variable, the highest probability was found among farmers between 21 and 30 years of experience. When this variable group was evaluated as a whole, it can be said that as the farming experience increased, the probability of perceiving drought as caused by fate decreased. Experience is important in tackling problems, and in this sense, the result is reasonable. For the household variable, the highest probability was found in farmers from households with one to four people. When this variable group was evaluated as a whole, the probability of perceiving drought as caused by fate decreased as the household size increased. This result is not consistent with pre-research expectations. Since large families in rural areas work in agriculture, numerical majority and the power to stay safe against other people in the tribal structure, and almost no birth control, are a necessity of conservative life. This result can be explained by the fact that crowded households can also be employed in non-agricultural sectors. In other words, the possible loss of income and welfare as a result of agricultural drought can be compensated for by working in non-agricultural sectors, and this affects perception.
For the land size variable, the highest probability was found among farmers who cultivated lands of the area between 5.1 and 10.0 ha. When this variable group was evaluated as a whole, the probability of perceiving drought as caused by fate decreased as the size of land increased. As the size of land increases, the perception of drought differs, measures are taken to avoid loss of welfare. The use of a variety of drought-resistant products and water-saving systems are among the measures taken in this context in the research area. The highest probability for the age variable was found among farmers aged 61 years old and older. When this variable group was evaluated as a whole, the probability of perceiving drought as caused by fate increased with increasing age. For the variable of education level, the highest probability was found among farmers who were primary school graduates. When this variable group was evaluated as a whole, although there was a slightly increasing and decreasing situation, it can be said that the probability of perceiving drought as caused by fate decreased as the education level increased. When age and education level were evaluated together, as the age of the farmers increased, the education level decreased, and the conservative structure increased. In this sense, the results are consistent with pre-research expectations.
For the income variable, the highest probability was found among farmers whose annual income was below 25,000 TL. This group was the most meaningless in terms of subgroups for the probability of perceiving drought as caused by fate. In other words, it is the independent variable that had the least correlation with the dependent variable. In the pre-research expectations, it was expected that the probability of perceiving drought as caused by fate would decrease as income increased, and this result can only be explained by the conservative structure of the research area.

4. Conclusions

The risk and effects of drought are expected to increase due to the increasing need for crop production and climate change. The adaptive capacity of the agricultural sector in arid and semi-arid regions is largely dependent on farmers’ perceptions of drought risk. Understanding farmers’ perceptions of drought risk is a necessary prerequisite for designing effective and efficient public drought risk management strategies. These perceptions can be determined based on objective and subjective criteria. Subjective criteria are often more decisive and effective than objective criteria in the behavior of individuals. On the other hand, it is very difficult to embody and measure the subjective criteria precisely due to differing results depending on the socio-cultural structure, time, place, and mood. In the GAP area, which has a semi-arid climate, the socio-economic structure plays a great role in reducing the effects of drought on crop production and more effective use of existing water resources.
According to the results obtained, while settlement location, land size, age, and size of the household were statistically significant to farmers seeing drought as caused by fate, income, experience, and education level were found to be insignificant. In terms of the probability of predicting drought for each independent variable in the ordinal analysis, the highest probabilities were found among farmers in the Harran Plain, with 21–30 years of experience, from a household of one to four people, who owned lands of the area between 5.1 and 10.0 ha, aged 61 and above, who were primary school graduates, and who earned an annual income of less than 25,000 TL which are the groups that policymakers, researchers, and stakeholders should focus on for further work. The subject of drought and precautions should be given more attention in religious education in the research area by giving priority to these groups. The research area is mostly populated by Muslims and has a conservative structure. Islam, which is the religion of Muslims, promotes the protection of natural resources and the environment and takes precautions against disasters. The holy day of Muslims is Friday, when people gather in mosques for the noon prayer. More frequent treatment of drought, waste due to mismanagement of the environment and natural resources, and possible precautions against drought and other natural disasters in Friday sermons. The organization of workshops for farmers by agricultural consultants and the participation of Islamic scholars to support science and knowledge in terms of faith will yield effective results. Individuals do not know what their fate is. Islamic scholars distinguish fate as absolute fate and conditional fate. Therefore, it is up to individuals to make an effort to perform their duties in the best possible way within their God-given abilities. These duties include conserving resources and taking precautions against possible disasters. In addition, special attention should be paid to mothers and children in these matters. Due to the nature of the research area, children mostly spend their time with their mothers and are affected by them. On the other hand, more education programs on these subjects should be given in kindergartens and primary schools.
Since the research subject is sensitive as well as difficult to measure and analyze, it has not been studied much (almost at all). This study is the first in this context in Turkey and one of the few in the world. It is hoped that the results will provide important data to decisionmakers and policymakers in the environment, natural resources, and drought adaptation in Turkey and countries with similar socio-cultural characteristics.

Author Contributions

Conceptualization, M.H.A., M.C., M.R.S., M.A.Ç., K.Y. and N.K.; methodology, M.H.A., M.C., M.R.S. and N.K.; software, M.H.A., M.C. and M.R.S.; validation, M.H.A., M.A.Ç., K.Y., N.K. and B.K.; formal analysis, M.H.A., M.C. and M.R.S.; investigation, M.H.A., M.A.Ç., K.Y., B.K., Ş.Ö., U.B., H.P.D. and Z.Ş.; resources, M.H.A., M.C., M.R.S., H.P.D. and Z.Ş.; data curation, M.H.A., M.C., M.R.S. and N.K.; writing—original draft preparation, M.H.A., M.C. and M.R.S.; writing—review and editing, M.H.A., M.C., M.R.S., K.Y., B.K. and Ş.Ö.; visualization, M.H.A., M.C. and M.R.S.; supervision, M.H.A., K.Y. and N.K.; project administration, M.H.A., K.Y. and N.K.; funding acquisition, N.M., C.K., A.Y. (Ayla Yenikale) and A.Y. (Akif Yenikale). All authors have read and agreed to the published version of the manuscript.

Funding

This research was funded by “Republic of Turkey Ministry of Industry and Technology, Southeastern Anatolia Project (GAP) Regional Development Administration”, grant number “27 September 2019/2033” together with Harran University.

Institutional Review Board Statement

Not applicable.

Informed Consent Statement

Not applicable.

Data Availability Statement

Not applicable.

Conflicts of Interest

The authors declare no conflict of interest.

References

  1. Bilgin, A. Religion, religious, religiousness: A self-critical evaluation. ANEMON Muş Alparslan Üniversitesi Sos. Bilimler Derg. 2014, 2, 75–84. [Google Scholar]
  2. Wikipedia. Religion. Available online: https://tr.wikipedia.org/w/index.php?title=Din&oldid=25704722 (accessed on 4 June 2021).
  3. Tümer, G. Religion. Available online: https://islamansiklopedisi.org.tr/din#1-genel-olarak-din (accessed on 4 June 2021).
  4. Chuvieco, E.; Burgui, M.; Gallego-Álvarez, I. Impacts of religious beliefs on environmental indicators: Is christianity more aggressive than other religions? Worldviews Glob. Relig. Cult. Ecol. 2016, 20, 251–271. [Google Scholar] [CrossRef]
  5. Wikipedia. Destiny. Available online: https://tr.wikipedia.org/wiki/Kader (accessed on 4 June 2021).
  6. Sevinç, M.R.; Aydoğdu, M.H.; Palabıçak, M.A.; Cançelik, M. Those who are not born with their sustenance, child laborers. İnsan ve Toplum Bilimleri Araştırmaları Derg. 2020, 9, 2430–2447. [Google Scholar] [CrossRef]
  7. Başol, K.; Durman, K.; Önder, H. Doğal Kaynakların ve Çevrenin Ekonomik Analizi; Alfa Akademi: Bursa, Turkey, 2007; ISBN 978-975-253-111-6. [Google Scholar]
  8. Aydoğdu, M.H.; Bilgiç, A. An evaluation of farmers’ willingness to pay for efficient irrigation for sustainable usage of resources: The GAP-Harran Plain case, Turkey. J. Integr. Environ. Sci. 2016, 13, 175–186. [Google Scholar] [CrossRef] [Green Version]
  9. Aydoğdu, M.H. Farmer’s risk perception and willingness to pay for environment: Case study of GAP-Sanliurfa, Turkey. Fresenius Environ. Bull. 2016, 25, 5449–5455. [Google Scholar]
  10. Aydoğdu, M.H. Farmers’ attitudes to the pricing of natural resources for sustainability: GAP-Şanlıurfa sampling of Turkey. Water 2019, 11, 1772. [Google Scholar] [CrossRef] [Green Version]
  11. Doğan, H.P.; Aydoğdu, M.H.; Sevinç, M.R.; Cançelik, M. Farmers’ willingness to pay for services to ensure sustainable agricultural income in the GAP-Harran Plain, Şanlıurfa, Turkey. Agriculture 2020, 10, 152. [Google Scholar] [CrossRef]
  12. Wilhite, D.A.; Glantz, M.H. Understanding: The drought phenomenon: The role of definitions. Water Int. 1985, 10, 111–120. [Google Scholar] [CrossRef] [Green Version]
  13. Dunlap, R.E.; Jorgenson, A.K. Environmental problems. In The Wiley-Blackwell Encyclopedia of Globalization; Ritzer, G., Ed.; Blackwell Publishing: New Jersey, NJ, USA, 2012; pp. 1–8. ISBN 978-0-470-67059-0. [Google Scholar]
  14. Dunlap, R.E. Environmental problems. In The Blackwell Encyclopedia of Sociology; Ritzer, G., Ed.; Blackwell Publishing: New Jersey, NJ, USA, 2016; pp. 1–4. ISBN 978-1-4051-6551-8. [Google Scholar]
  15. Van Loon, A.F.; Gleeson, T.; Clark, J.; Van Dijk, A.I.J.M.; Stahl, K.; Hannaford, J.; Di Baldassarre, G.; Teuling, A.J.; Tallaksen, L.M.; Uijlenhoet, R.; et al. Drought in the anthropocene. Nat. Geosci. 2016, 9, 89–91. [Google Scholar] [CrossRef] [Green Version]
  16. Aydoğdu, M.H.; Yenigün, K. Farmers’ risk perception towards climate change: A case of the GAP-Şanlıurfa region, Turkey. Sustainability 2016, 8, 806. [Google Scholar] [CrossRef] [Green Version]
  17. Tol, R.S.J. The economic impacts of climate change. Rev. Environ. Econ. Policy 2018, 12, 4–25. [Google Scholar] [CrossRef] [Green Version]
  18. Gracia, A.; Barreiro-Hurlé, J.; Pérez y Pérez, L. Assessing the benefits of sustainability certification of biofuels: How much are consumers willing to pay? New Medit 2020, 19, 3–18. [Google Scholar] [CrossRef]
  19. European Environment Agency. Trends and Projections in Europe 2020 Tracking Progress Towards Europe’s Climate and Energy Targets; 1st ed.; Publications Office of the European Union: Luxembourg, 2020; ISBN 978-92-9480-287-3.
  20. Aydoğdu, M.H.; Sevinç, M.R.; Cançelik, M. Determination of farmers’ willingness to pay for drought adaptation policies in şanliurfa, Turkey. Weather. Clim. Soc. 2021, 13, 677–686. [Google Scholar] [CrossRef]
  21. Kapluhan, E. Drought and drought in Turkey effect of agriculture. Marmara Coğrafya Derg. 2013, 27, 487–510. [Google Scholar]
  22. Bağçaci, S.Ç.; Yucel, I.; Duzenli, E.; Yilmaz, M.T. Intercomparison of the expected change in the temperature and the precipitation retrieved from CMIP6 and CMIP5 climate projections: A mediterranean hot spot case, Turkey. Atmos. Res. 2021, 256, 105576. [Google Scholar] [CrossRef]
  23. Akbaş, A. Important drought years over Turkey. Coğrafi Bilimler Derg. 2014, 12, 101–118. [Google Scholar] [CrossRef]
  24. Ali, I.; Khan, I.; Ali, H.; Baz, K.; Zhang, Q.; Khan, A.; Huo, X. The impact of agriculture trade and exchange rate on economic growth of Pakistan: An NARDL and asymmetric analysis approach. Cienc. Rural 2020, 50, e20190005. [Google Scholar] [CrossRef]
  25. Sevinç, G.; Aydoğdu, M.H.; Cançelik, M.; Sevinç, M.R. Farmers’ attitudes toward public support policy for sustainable agriculture in GAP-Şanlıurfa, Turkey. Sustainability 2019, 11, 6617. [Google Scholar] [CrossRef]
  26. Mulazzani, L.; Manrique, R.; Stancu, C.; Malorgio, G. Food security and migration in Africa: A validation of theoretical links using case studies from literature. New Medit 2020, 19, 19–36. [Google Scholar] [CrossRef]
  27. Türkes, M. Observed and projected climate change, drought and desertification in Turkey. Ank. Üniversitesi Çevrebilimleri Derg. 2012, 4, 1–32. [Google Scholar] [CrossRef] [Green Version]
  28. Partïgöç, N.S.; Soğancı, S. An inevitable consequence of global climate change: Drought. Resilience 2019, 3, 287–299. [Google Scholar] [CrossRef] [Green Version]
  29. Van Liere, K.D.; Dunlap, R.E. The social bases of environmental concern: A rerview of hypotheses, explanations and empirical evidence. Public Opin. Q. 1980, 44, 181–197. [Google Scholar] [CrossRef]
  30. White, L. The historical roots of our ecological crisis. Science 1967, 155, 1203–1207. [Google Scholar] [CrossRef] [PubMed] [Green Version]
  31. Hand, C.M.; Van Liere, K.D. Religion, mastery-over-nature, and environmental concern. Soc. Forces 1984, 63, 555–570. [Google Scholar] [CrossRef]
  32. Woodrum, E.; Hoban, T. Theology and religiosity effects on environmentalism. Rev. Relig. Res. 1994, 35, 193–206. [Google Scholar] [CrossRef]
  33. Hayes, B.G.; Marangudakis, M. Religion and attitudes towards nature in Britain. Br. J. Sociol. 2001, 52, 139–155. [Google Scholar] [CrossRef]
  34. Hagevi, M. Religion and the environmental opinion in 22 countries: A comparative study. Int. Rev. Sociol. 2014, 24, 91–109. [Google Scholar] [CrossRef]
  35. Minton, E.A.; Kahle, L.R.; Kim, C.-H. Religion and motives for sustainable behaviors: A cross-cultural comparison and contrast. J. Bus. Res. 2015, 68, 1937–1944. [Google Scholar] [CrossRef]
  36. Morrison, M.; Duncan, R.; Parton, K. Religion does matter for climate change attitudes and behavior. PLoS ONE 2015, 10, e0134868. [Google Scholar] [CrossRef]
  37. Gifford, R.; Nilsson, A. Personal and social factors that influence pro-environmental concern and behaviour: A review. Int. J. Psychol. 2014, 49, 141–157. [Google Scholar] [CrossRef]
  38. Tucker, M.E.; Grim, J. The nature of the environmental crisis. In Islam and Ecology: A Bestowed Trust; Foltz, R.C., Denny, F.M., Baharuddin, A., Eds.; Oğlak Yayınları: İstanbul, Turkey, 2007; pp. 17–30. ISBN 978-975-329-592-5. [Google Scholar]
  39. Metcalfe, P.; Baker, W. Willingness to Pay to Avoid Drought Water Use Restrictions. Available online: https://www.researchgate.net/publication/299532651_Willingness_to_Pay_to_Avoid_Drought_Water_Use_Restrictions/link/56fd5ccd08ae1408e15b2d93/download (accessed on 20 May 2021).
  40. Dong, X.; Liu, Y.; Li, Q. Psychoanalysis of farmers’ irrational drought-control behaviors. Rev. Argent. Clínica Psicológica 2020, 29, 194–198. [Google Scholar] [CrossRef] [Green Version]
  41. Abugri, A.S. Maize Farmers’ Willingness to Participate in Drought-Index Insurance for Crops in Northern Region of Ghana. Master’s Thesis, University For Development Studies, Tamale, Ghana, 2016. [Google Scholar]
  42. Van Duinen, R.; Filatova, T.; Geurts, P.; van der Veen, A. Empirical analysis of farmers’ drought risk perception: Objective factors, personal circumstances, and social influence. Risk Anal. 2015, 35, 741–755. [Google Scholar] [CrossRef]
  43. Slegers, M.F.W. “If only it would rain”: Farmers’ perceptions of rainfall and drought in semi-arid central Tanzania. J. Arid. Environ. 2008, 72, 2106–2123. [Google Scholar] [CrossRef]
  44. Melka, Y.; Kassa, H.; Ketema, M.; Abebaw, D.; Schmiedel, U. The effect of drought risk perception on local people coping decisions in the Central Rift Valley of Ethiopia. J. Dev. Agric. 2015, 7, 292–302. [Google Scholar] [CrossRef]
  45. Bahta, Y.T.; Jordaan, A.; Muyambo, F. Communal farmers’ perception of drought in South Africa: Policy implication for drought risk reduction. Int. J. Disaster Risk Reduct. 2016, 20, 39–50. [Google Scholar] [CrossRef]
  46. Lazrus, H. “Drought is a relative term:” Drought risk perceptions and water management preferences among diverse community members in Oklahoma, USA. Hum. Ecol. 2016, 44, 595–605. [Google Scholar] [CrossRef]
  47. Weitkamp, E.; McEwen, L.; Ramirez, P. Communicating the hidden: Toward a framework for drought risk communication in maritime climates. Clim. Chang. 2020, 163, 831–850. [Google Scholar] [CrossRef]
  48. Kaczała, M. Drought risk and its perception by farmers. In Proceedings of the 5th International Conference—ERAZ 2019—Knowledge Based Sustainable Development, Association of Economists and Managers of the Balkans—Belgrade, Budapest, Hungary, 23 May 2019; Volume 1, pp. 69–85. [Google Scholar]
  49. Türkdoğan, O. Osmanlı’dan Günümüze Türk Toplum Yapısı, 1st ed.; Çizgi Pub.: Konya, Turkey, 2015; ISBN 978-605-9108-12-6. [Google Scholar]
  50. Davran, M.K.; Sevinç, M.R.; Cançelik, M. Demographic and socio-economic status of the elderly in the villages of Şanlıurfa province and perceptions of poverty and old age. Elektron. Sos. Bilimler Derg. 2020, 19, 1–17. [Google Scholar] [CrossRef] [Green Version]
  51. Sevinç, M.R.; Davran, M.K.; Sevinç, G. The educational policies performed in the rural areas from the Ottoman Empire up to now. Elektron. Sos. Bilimler Derg. 2016, 15, 253–272. [Google Scholar] [CrossRef] [Green Version]
  52. Paksoy, M.; Palabıçak, M.A. Investigation of local fig variety production with some socio-economic indicators: The case of Abbas fig. Derim 2017, 24, 142–146. [Google Scholar] [CrossRef] [Green Version]
  53. Aydoğdu, M.H.; Sevinç, M.R.; Cançelik, M. A research on the perceptions of cotton producers to form a producers’ union in Şanlıurfa-Turkey. J. Ekon. 2021, 3, 5–8. [Google Scholar]
  54. Sevinç, M.R. Farmers’ perception of agricultural cooperatives: The case of Şanlıurfa, Turkey. Cienc. Rural 2021, 51, e20200445. [Google Scholar] [CrossRef]
  55. Aksoy, U.; Can, H.Z. Expected effects of climate change on organic agriculture in Turkey. New Medit 2012, 11, 3–10. [Google Scholar]
  56. Hofste, R.W.; Reig, P.; Schleifer, L. 17 Countries, Home to One-Quarter of the World’s Population, Face Extremely High Water Stress. Available online: https://www.wri.org/blog/2019/08/17-countries-home-one-quarter-world-population-face-extremely-high-water-stress (accessed on 10 June 2021).
  57. Türkeş, M. Spatial and temporal variations in precipitation and aridity index series of Turkey. In Regional Climate Studies; Bolle, H.-J., Ed.; Springer: Berlin/Heidelberg, Germany, 2003; pp. 181–213. ISBN 978-3-642-55657-9. [Google Scholar]
  58. Kurnaz, L. Kuraklık ve Türkiye. Available online: https://www.researchgate.net/publication/316190379_Kuraklik_ve_Turkiye/link/58f5e0ff0f7e9b6f82e9727b/download (accessed on 6 June 2021).
  59. Çiçek, İ. Distribution and duration of drought period in Turkey (According to Thornthwaite Method). Available online: http://tucaum.ankara.edu.tr/wp-content/uploads/sites/280/2015/08/tucaum4_4.pdf (accessed on 6 June 2021).
  60. Öztürk, K. Global climatic changes and their probable effect upon Turkey. G.Ü. Gazi Eğitim Fakültesi Derg. 2002, 22, 47–65. [Google Scholar]
  61. Republic of Turkey Ministry of Agriculture and Forestry, General Directorate of Water Management, Flood and Drought Management Department. Euphrates Sub-Basin Drought Management Plan Report. Available online: https://www.tarimorman.gov.tr/SYGM/Haber/648/Firat-Dicle-Havzasi-Kuraklik-Yonetim-Plani-Hazirlandi (accessed on 10 June 2021).
  62. TURKSTAT Basic Statistics, Population of Turkey. Available online: https://data.tuik.gov.tr/Bulten/Index?p=Adrese-Dayali-Nufus-Kayit-Sistemi-Sonuclari-2020-37210 (accessed on 11 June 2021).
  63. Republic of Turkey Ministry of Agriculture and Forestry, General Directorate of Meteorology. Climate Data of GAP-Şanlıurfa Province. Available online: https://mgm.gov.tr/veridegerlendirme/il-ve-ilceler-istatistik.aspx?k=A&m=SANLIURFA (accessed on 11 June 2021).
  64. Çağlak, S.; Özlü, T.; Gündüz, S. Analysis of climatic properties of Şanlıurfa province with interpolation techniques. Uluslararası Sos. Araştırmalar Derg. 2016, 9, 360–372. [Google Scholar]
  65. Republic of Turkey Ministry of Agriculture and Forestry, General Directorate of Meteorology. Areal Precipitation Distributions. Available online: https://www.mgm.gov.tr/veridegerlendirme/yillik-toplam-yagis-verileri.aspx (accessed on 10 June 2021).
  66. Republic of Turkey Ministry of Agriculture and Forestry. Şanlıurfa’s Irrigated Areas in 2019. Available online: https://www.tarimorman.gov.tr/Haber/4145/2019-Sulama-Sezonunda-Sanliurfada-481-Bin-810-Dekar-Arazi-Sulandi (accessed on 14 March 2021).
  67. TURKSTAT. Labor Statistics, January 2018. Available online: https://data.tuik.gov.tr/Bulten/Index?p=Isgucu-Istatistikleri-Ocak-2018-27693 (accessed on 10 January 2021).
  68. Karacadağ Development Agency-Investment Support Office. General Land Distribution and Irrigation Status. Available online: https://www.investsanliurfa.com/sektorler/genel-arazi-dagilimi-ve-sulama-durumu--71 (accessed on 15 March 2021).
  69. Republic of Turkey Ministry of Industry and Technology, Southeastern Anatolia Project (GAP) Regional Development Administration. Şanlıurfa City Profile. Available online: http://www.gap.gov.tr/upload/dosyalar/pdfler/icerik/IL_profilleri/SANLIURFA.pdf (accessed on 15 May 2021).
  70. Aydoğdu, M.H.; Yenigun, K.; Aydoğdu, M. Factors affecting farmers’ satisfaction from water users association in the Harran Plain-GAP Region, Turkey. J. Agric. Sci. Technol. 2015, 17, 1669–1684. [Google Scholar]
  71. TURKSTAT. Agriculture Data. Available online: https://data.tuik.gov.tr/Kategori/GetKategori?p=tarim-111&dil=1 (accessed on 15 May 2021).
  72. General Directorate of State Hydraulic Works. Annual Report for 2020. Available online: https://cdniys.tarimorman.gov.tr/api/File/GetFile/425/KonuIcerik/759/1107/DosyaGaleri/DS%C4%B0%202020-yili-faaliyet-raporu.pdf#page=51 (accessed on 15 May 2021).
  73. Bayram, N. Sosyal Bilimlerde SPSS Ile Ileri Veri Analizi, 2nd ed.; Ezgi Pub.: Ankara, Turkey, 2017; ISBN 978-975-8606-43-6. [Google Scholar]
  74. Lorcu, F. Örneklerle Veri Analizi SPSS Uygulamalı, 1st ed.; Detay Pub.: Ankara, Turkey, 2015; ISBN 978-605-4940-89-9. [Google Scholar]
  75. Anderson, D.R.; Sweeney, D.J.; Williams, T.A.; Camm, J.D.; Coochran, J.J. Statistics for Business and Economics, 15th ed.; Cengage Learning: Stamford, CT, USA, 2014; ISBN 978-1-285-64632-3. [Google Scholar]
  76. Liao, T.F. Interpreting Probability Models, 1st ed.; Sage Publications, Inc.: California, CA, USA, 1994; ISBN 0-8039-4999-5. [Google Scholar]
  77. Mert, M. Yatay Kesit Veri Analizi Bilgisayar Uygulamaları, 1st ed.; Detay Pub.: Ankara, Turkey, 2016; ISBN 978-605-9189-92-7. [Google Scholar]
  78. Kleinbaum, D.G.; Klein, M. Logistic Regression: A Self-Learning Text, 3rd ed.; Springer Pub.: New York, NY, USA, 2010; ISBN 978-1-4419-1741-6. [Google Scholar]
  79. Long, J.S.; Freese, J. Regression Models for Categorical Dependent Variables Using Stata, 3rd ed.; STATA Press: Texas, TX, USA, 2014; ISBN 978-1-59718-111-2. [Google Scholar]
  80. Liu, X. Applied Ordinal Logistic Regression Using Stata: From Single-Level to Multilevel Modeling, 1st ed.; Sage Publications, Inc.: California, CA, USA, 2015; ISBN 978-1-4833-1975-9. [Google Scholar]
  81. Central Bank of The Turkish Republic Average Exchange Rate. Available online: https://www.doviz724.com/yillara-gore-ortalama-amerikan-dolari-kuru.html (accessed on 7 June 2021).
  82. STATA Corp. STATA Base Reference Manual Release 17, 17th ed.; STATA Corp. LLC: Texas, TX, USA, 2021; ISBN 978-1-59718-345-1. [Google Scholar]
Figure 1. The locations of the GAP region and province of Şanlıurfa in Turkey.
Water 13 02519 g001
Figure 2. Şanlıurfa-Harran Plain and Yaylak irrigation areas.
Water 13 02519 g002
Table 1. Descriptive statistics of the surveyed farmers.
VariableDefinitionMeanStandard Deviation
Irrigation Area1 = Harran (71.0%); 2 = Yaylak (29.0%)1.290.021
Land (ha)1 = 5.0 ha and below (22.7%); 2 = 5.1–10.0 ha (32.3%); 3 = 10.1–20.0 ha (30.4%);
4 = 20.1–30.0 ha (8.4%); 5 = 30.1 ha and above (6.1%)
2.420.053
Income (TL/year)1 = below 25,000 TL ($3561) (4.7%); 2 = 25,000–49,999 TL ($7122) (23.9%);
3 = 50,000–74,999 TL ($10,684) (34.0%); 4 = 75,000–99,999 TL ($14,244) (19.7%);
5 = 100,000 TL($14,245) and above (17.8%)
3.220.055
Experience (Year)1 = 20 years and below (14.8%); 2 = 21–30 years (35.1%); 3 = 31–40 years (34.0%);
4 = 41 years and above (16.2%)
2.510.045
Age (Year)1 = 35 and below (4.5%); 2 = 36–43 (23.4%); 3 = 44–52 (35.1%); 53–60 (25.6%);
4 = 61 and above (10.6%);
3.130.050
Level of Education1 = illiterate (4.7%); 2 = literate (15.5%), 3 = primary school (46.1%);
4 = secondary school (15.0%), 5 = high school (14.8%), 6 = University (4.0%)
3.310.056
Household (person)1 = 1–4 person (4.5%); 2 = 5–9 person (63.2%);
3 = 10 persons and more (32.3%)
2.270.026
Table 2. Is drought a fate? Ordinal logit model results.
Dependent Variable: Is Drought a Fate? (1. No, 2. Partially, 3. Yes)
Independent VariablesCoefficient (St.Err)Odds Ratio (St.Err)Marginal Effect (St.Err)
Irrigation area
Yaylak−0.996 *** (0.263)0.369 *** (0.097)−0.219 *** (0.060)
Land Amount (ha)
51–1000.183 (0.312)1.201 (0.374)0.034 (0.058)
101–200−0.373 (0.319)0.689 (0.220)−0.078 (0.066)
201–300−0.220 (0.469)0.802 (0.376)−0.045 (0.097)
301 and above−1.150 ** (0.507)0.317 ** (0.160)−0.266 ** (0.120)
Income (TL/year)
25,000–49,999−0.776 (0.610)0.460 (0.281)−0.152 (0.106)
50,000–74,999−0.717 (0.594)0.488 (0.290)−0.139 (0.100)
75,000–99,999−0.052 (0.617)0.949 (0.585)−0.009 (0.100)
100,000 and above−0.244 (0.623)0.783 (0.488)−0.042 (0.103)
Experience (year)
21–300.438 (0.357)1.550 (0.553)0.080 (0.069)
31–40−0.284 (0.404)0.753 (0.305)−0.061 (0.085)
41 and above−0.496 (0.546)0.609 (0.333)−0.111 (0.122)
Age (year)
36–431.164 ** (0.557)3.203 ** (1.783)0.283 ** (0.127)
44–521.446 ** (0.608)4.247 ** (2.583)0.346 ** (0.137)
53–601.808 *** (0.680)6.100 *** (4.148)0.417 *** (0.147)
61 and above2.643 *** (0.839)14.052 *** (11.793)0.535 *** (0.148)
Education Level
Literate0.224 (0.683)1.251 (0.855)0.047 (0.147)
Primary School0.275 (0.673)1.316 (0.886)0.057 (0.146)
Secondary School−0.018 (0.732)0.982 (0.719)−0.004 (0.160)
High School0.024 (0.748)1.024 (0.766)0.005 (0.163)
University−0.148 (0.867)0.863 (0.748)−0.033 (0.194)
Household Number
5–9−1.026 * (0.622)0.359 * (0.223)−0.153 ** (0.068)
10 and above−1.471 ** (0.668)0.230 ** (0.153)−0.249 *** (0.084)
  • N = 427, LR Chi-square = 48.65 (p = 0.001), Pseudo R2 = 0.070
  • The calculated p values of the variables: *: 0.10, **: 0.05, ***: and 0.01 are statistically significant.
  • The baseline level for the irrigation area variable is “Harran Plain”, for the land variable the baseline level is “5.0 ha and below”, the base level for the income variable is “below 25,000 TL/year” for the experience variable the baseline is “20 years and below” the basic level is “between 18–35”, the basic level is “illiterate” for the education level variable, and the basic level is “1–4 people” for the household variable.
  • Marginal effects were calculated for the “yes” level of the dependent variable.
  • According to Link test for model specification error, hatsq = 0.206, p = 0.194
  • For the parallel regression assumption, chi-square 27.97 according to the likelihood ratio test, p = 0.217
Table 3. Probability of perceiving drought as fate for each independent variable in the ordinal analysis.
VariableProbabilityVariableProbabilityVariableProbability
Irrigation Area%Land Amount (ha)%Education Level%
Harran Plain76.65.0 and below73.8Illiterate67.7
Yaylak Irrigation54.75.1–10.077.2Literate72.4
Experience (year)%10.1–20.066.0Primary School73.4
20 and below71.420.1–30.069.4Secondary School67.3
21–3079.530.1 and above47.2High School68.2
31–4065.3Age (year)%University64.4
41 and above60.435 and below34.6Income (TL/year)%
Household (person)%36–4362.9Below 25,00079.8
1–488.344–5269.225,000–49,99964.6
5–973.053–6076.450,000–74,99965.9
10 and above63.461 and above88.275,000–99,99979.0
100,000 and above75.6
Publisher’s Note: MDPI stays neutral with regard to jurisdictional claims in published maps and institutional affiliations.

